Abstract
The Moxi area in the Sichuan Basin hosts abundant deep geothermal resources, but their thermal regime and accumulation mechanisms remain poorly understood. Using 2D/3D seismic data, drilling records, and temperature measurements (DST), we analyze deep thermal fields, reservoir–caprock systems, and structural features. The following are our key findings: (1) Heat transfer is conduction-dominated, with thermal anomalies in Late Permian–Early Cambrian strata. Four mudstone/shale caprocks and three carbonate reservoirs occur, with the Longtan Formation as the key seal. Reservoir geothermal gradients (25.05–32.55 °C/km) exceed basin averages. (2) Transtensional strike-slip faults form E-W/NE/NW networks; most terminate at the Permian Longtan Formation, with few extending into the Lower Triassic while penetrating the Archean–Lower Proterozoic basement. (3) Structural highs positively correlate with higher geothermal gradients. (4) The deep geothermal reservoirs and thermal accumulation mechanisms in the Moxi area are jointly controlled by crustal thinning, basement uplift, and structural architecture. Mantle-derived heat converges at basement uplift cores, generating localized thermal anomalies. Fault networks connect these deep heat sources, facilitating upward fluid migration. Thick Longtan Formation shale seals these rising thermal fluids, causing anomalous heating in underlying strata and concentrated thermal accumulation in reservoirs—enhanced by thermal focusing effects from uplift structures. This study establishes a theoretical framework for target selection and industrial-scale geothermal exploitation in sedimentary basins, highlighting the potential for repurposing oil/gas infrastructure.
1. Introduction
United Nations Sustainable Development Goals (SDGs) emphasize the imperative to ensure an affordable, reliable, sustainable, and modern energy supply globally [1]. Geothermal energies, due to the cleanliness and stability [2,3], have become a critical pathway for achieving SDGs. Among geothermal systems, those in sedimentary basins—characterized by extensive distribution and substantial resource potential [4]—are internationally recognized as a priority for development. While industrial-scale exploitation has been successfully implemented in exemplary basins such as the North German Sedimentary Basin and the Upper Rhine Graben [5], the distribution of high-quality deep geothermal resources exhibits pronounced heterogeneity [6,7]. Consequently, the thermal accumulation mechanisms have become a pivotal factor constraining the industrial-scale exploitation of deep geothermal resources.
As a typical multi-cycle superimposed basin, the Sichuan Basin hosts abundant conventional hydrocarbon and geothermal resources [8,9]. Previous studies have revealed the thermal regime of the basin: (1) moderate-to-low heat flow (35.4 × 68.8 mW/m2) [10]; (2) a “cold crust, hot mantle” lithospheric structure with 140–190 km thermal thickness [9]; (3) geothermal field distribution primarily controlled by sedimentary thickness and crustal heterogeneity [11]; and (4) total reserves estimated at 4.26 × 10¹³ GJ [12].
However, (1) current investigations into thermal accumulation mechanisms predominantly address macro-scale thermal effects in lithospheric thermal structures, deep-seated faults, and uplifted structures, while lacking detailed characterization of heat accumulation processes associated with deep-seated tectonic structures and fault systems [13,14]; (2) insufficient integration of deep multi-source data, compounded by sparse temperature measurements below 4000 m and the absence of an integrated geothermal–petroleum data fusion framework. This study will innovatively integrate petroleum exploration datasets to advance geothermal research.
The Moxi area exhibits geothermal anomalies and possesses existing oil and gas infrastructure, which can provide technical support for geothermal development. Therefore, this study selects the Moxi area in the Sichuan Basin as the research area. By using 2D/3D seismic data, drilling records and DST (drilling stem test) temperature data, this study characterizes the deep temperature field, deep structural features, and structural evolution process, discussing the controlling factors of the deep geothermal field and on this basis revealing the thermal accumulation mechanisms in deep reservoirs. The research provides guidance for efficient exploration and target selection of deep geothermal resources in sedimentary basins.
2. Geothermal Geological Overview
2.1. Tectonic Evolution
The Sichuan Basin is located on the northwest margin of the Yangtze Craton (Figure 1a), with an area of approximately 1.8 × 10⁵ km2 [15,16]. The structural evolution of the Sichuan Basin has involved multiple tectonic events. Following the formation of the Presinian basement, the basin experienced superimposition and transformation by the Chengjiang, Tongwan, Caledonian, Yunnan, Dongwu, Indochinese, Yanshanian, and Himalayan movements [17,18] (Figure 1c,d). These events resulted in multiple intra-basin unconformities. Intense structural activity during the Late Permian is evidenced by the Emeishan Mountain basalt eruption [19,20,21,22,23]. The basin margins were strongly modified by later orogenic deformation, resulting in a complex internal structure and basin–mountain system. The Late Triassic marked a pivotal transition phase for the Yangtze Craton, during which the Sichuan Basin evolved from a marine cratonic basin to a continental system [24]. After being comprehensively lifted and transformed by the Himalayan movement, the current structural appearance was formed [25]. According to structural–sedimentary differences, the basin is divided into five secondary structural units: the Western Depression, Northern Gentle Structural Zone, Central Uplift, Eastern Steep Structural Zone, and Southeastern Gentle Structural Zone (Figure 1b).
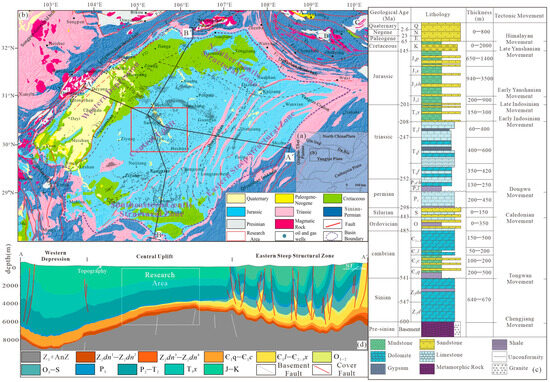
Figure 1.
Geological setting of Moxi area, Sichuan Basin. (a) Structural setting of Sichuan Basin (data from Li et al. [26]). (b) Geomorphic and geological map of Sichuan Basin and adjacent areas (data from Li et al. [26]). (c) Schematic diagram of strata and structural movements in the Sichuan Basin (data from Qiu et al. [27]). (d) Structural profile (drawing based on structural interpretation results of seismic profile AA′). AnZ = Presinian; Z1 = Lower Sinian; Z2d = Upper Sinian Doushantuo Formation; Z2dn = Upper Sinian Dengying Formation; Є1q = Lower Cambrian Qiongzhusi Formation; Є1c = Lower Cambrian Canglangpu Formation; Є1l = Lower Cambrian Longwangmiao Formation; Є2–3c = Middle-Upper Cambrian Canglangpu Formation; O1–2 = Lower-Middle Ordovician; O3 = Upper Ordovician; S = Silurian; P1 = Lower Permian; P2l = Upper Permian Longtan Formation; P2ch = Upper Permian Changxing Formation; T1f = Lower Triassic Feixianguan Formation; T1j = Lower Triassic Jialingjiang Formation; T2l = Middle Triassic Leikoupo Formation; T3x = Upper Triassic Xujiahe Formation; J1z = Lower Jurassic Ziliujing Formation; J2sh = Middle Jurassic Shaximiao Formation; J2s = Middle Jurassic Suining Formation; J3p = Upper Jurassic Penglai Formation; K = Cretaceous; E = Paleogene; N = Neogene; Q = Quaternary. Dome Structures: A = Fenghuangshan-Manpoling Dome; B = Pingli Dome; C = Pingli Dome. The solid lines AA′ and BB′ represent 2D seismic profiles crossing the study area.
2.2. Stratigraphy and Thermal Reservoir
The Moxi area is situated in the central area of the Central Uplift of the Sichuan Basin. The exposed strata on the surface of the Moxi area are the Penglaizhen Formation and Suining Formation of the Upper Jurassic and the Upper Shaximiao Formation of the Middle Jurassic (Figure 1b). Affected by the differential uplift movement during the Caledonian period, the Devonian and Carboniferous strata are absent in the study area, and the Silurian and part of the Middle and Upper Ordovician are severely eroded [25] (Figure 1d). The basement is a crystalline basement of the Archean–Lower Proterozoic, and above the basement are eight potential geothermal reservoirs, namely the Dengying Formation of Sinian (corresponding to Ediacaran, 600–541 Ma), the Longwangmiao Formation of the Lower Cambrian, the Qixia–Maokou Formation of the Lower Permian, the Feixianguan Formation of the Lower Triassic, the Jialingjiang Formation of the Lower Triassic, the Leikoupo Formation of the Middle Triassic, the Xujiahe Formation of the Upper Triassic, and the Jurassic. According to geothermal resource classification based on reservoir depth, deep geothermal resources generally refer to those located at depths greater than 3 km [28]; the Dengying Formation of the Upper Sinian, the Longwangmiao Formation of the Lower Cambrian, and the Qixia–Maokou Formation of the Lower Permian are deep geothermal resources.
2.3. Heat Flow Background
Based on extensive temperature measurements and rock thermophysical tests [10,29,30,31,32,33,34], the Compilation of Terrestrial Heat Flow Data in Continental China (5th edition) [35] lists 146 heat flow data points for the Sichuan Basin and adjacent areas. These comprise 50 Class A, 62 Class B, 22 Class C, and 12 Class D values, where A stands for high quality, which means that the geothermal temperature curve belongs to the steady-state heat conduction type. The rock thermal conductivity data either comes from the test results of core samples in the temperature measurement section or are determined by the comprehensive thermophysical property bar chart of the measurement area [36]. In this study, 50 Class A heat flow data points were selected to draw the terrestrial heat flow contour map of the Sichuan Basin (Figure 2a). While the exclusion of lower-class data may introduce limitations, the existing Class A heat flow data coverage across the basin and adjacent regions sufficiently characterizes the overall geothermal regime of the Sichuan Basin. The terrestrial heat flow value of the Sichuan Basin ranges from 32.80 to 72.00 mW/m2, with an average value of 54.96 ± 8.50 mW/m2. The overall area was a medium–low heat flow background zone. The current geothermal gradient in the Sichuan Basin is 14.10–33.30 °C/km, with an average of 20.80 ± 3.72 °C/km [37], and the overall area is a medium–low geothermal gradient zone (Figure 2b). Compared with the most typical “cold basin” Tarim Basin (average heat flow value 42.50 mW/m2) and the “hot basin” Bohai Bay Basin (average heat flow value 66.70 mW/m2), the Sichuan Basin (average heat flow value 54.96 mW/m2) is a “warm basin” [28]. In the Moxi area, the geothermal gradient ranges from 18.00 to 32.00 °C/km, and terrestrial heat flow ranges from 62.00 to 72.00 mW/m2. These values represent relatively high anomalies within the Sichuan Basin (Figure 2).
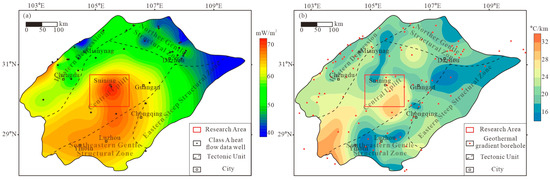
Figure 2.
Heat flow background of Moxi area, Sichuan Basin. (a) The heat flow contour map of the Sichuan Basin. (b) The geothermal gradient contour map of the Sichuan Basin. Class A heat flow data are sourced from Wang et al. [35], while geothermal gradient data derive from Sun et al. [37]. Class A heat flow stands for high quality, which means that the geothermal temperature curve belongs to the steady-state heat conduction type. The rock thermal conductivity data either comes from the test results of core samples in the temperature measurement section or are determined by the comprehensive thermophysical property bar chart of the measurement area.
3. Data and Methods
3.1. Data
The data used in this study were all sourced from PetroChina Southwest Oil & Gas Field Company (Sichuan, China) and primarily comprise the following: drilling data, including formation development and thickness data revealed by drilling; seismic data, including 11,139.29 km2 of 3D seismic data and two 2D seismic profiles with a length of 71.55 km; and temperature data. The temperature data adopted in this study is the DST temperature, which was collected from wells after a minimum two-week shut-in period prior to production, in order to obtain as many geothermal data and gradients as possible that are representative of the realities of the sedimentary stratigraphy.
3.2. Calculation of Geothermal Gradient
This study employs two distinct geothermal gradient calculation approaches. One approach estimates the average geothermal gradient (Gr) for the deep thermal reservoir in a given well by dividing the DST temperature at a specific measurement point by its depth (T/Z). This provides a representative average value for the reservoir interval in that well. Another one is the geothermal gradient calculated by Equation (2) (Figure 3) [38], which is used to represent the variation characteristics of the ground temperature gradient in the vertical direction of the well.
where T (°C) is the measured temperature at the point within the thermal reservoir, Z (km) is the corresponding burial depth, and Gr (°C/km) represents the geothermal gradient for the thermal reservoir in that well.
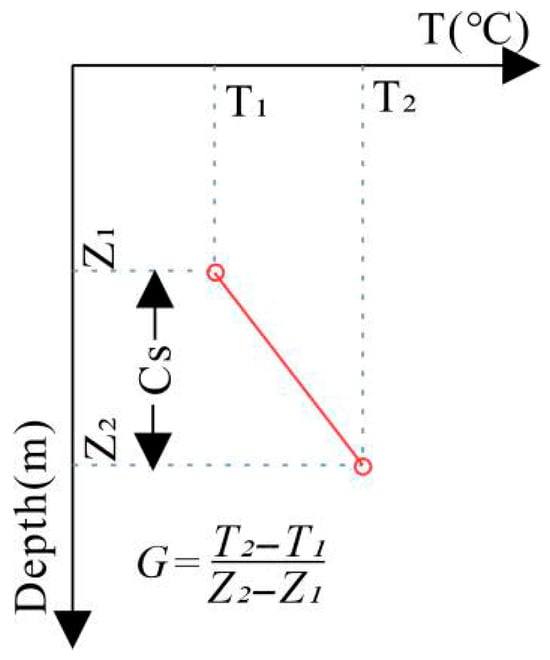
Figure 3.
Calculation model of geothermal gradient. Cs = Compaction section; G = geothermal gradient in compacted section, °C/km; T1 and T2 (°C) are the DST temperatures corresponding to the burial depths Z1 and Z2 (km), respectively [38].
3.3. Calculation of Coherence Attribute
Coherence, a geometric attribute for fault identification, detects lateral stratigraphic discontinuities to map fault locations [39]. It calculates local waveform similarity along seismic lines, yielding high coefficients in continuous strata and low coefficients where discontinuous. This generates a 3D coherence volume pinpointing faults [39].
Coherence algorithms have evolved: first generation (C1, cross-correlation) [40], second generation (C2, semblance-based) [41], and third generation (C3, eigenstructure-based) [42], each with distinct strengths and weaknesses. This study implemented the C2 algorithm using GeoEast 4.0.
The following is the specific algorithm process [43]. First, we define an oval or rectangular analysis window, taking the analyzed point as the center. This analysis window includes many traces, such as J traces, in the 3D plane. If we take the analyzed point as the center of the local coordinate axes (x, y), the coherence coefficient C(τ, p, q) is the following:
where p and q represent the apparent dip angles in the x and y directions, respectively (unit: ms/m), and (τ, p, q) defines the local planar phase axis at time τ. The superscript H denotes the Hilbert transform on actual seismic traces. Algorithm C2 can be regarded as the t-p transform U(τ, p, q) of the 3D seismic signal U(t, x, y), Equation (4), and it is closely related to the 3D dip filter technique and the least squares Radon transform.
In fault interpretation applications, low average coherence values (C) typically indicate zones of stratigraphic discontinuity. We can define the average coherence coefficient as coherence value C, as below:
where Δt is the sampling time interval. Since x = 0, y = 0 is always taken as the center of the analysis window, the intercept time τ may be equal to 0. High values of the maximum coherence metric (C_max) correspond to the dominant direction of waveform similarity, which helps identify principal fault orientations. This metric is mathematically expressed as the following:
3.4. Structural Interpretation of Seismic Data
The seismic interpretation work of this study mainly used the GeoEast software. The structural interpretation mainly includes two aspects: first, stratigraphic interpretation, where key seismic sections are selected, and stratigraphic reflection interfaces are identified and calibrated by comparing existing drilling data with the reflection characteristics of seismic data (e.g., waveforms, phases, and amplitudes). Secondly, fault interpretation; this paper adopts a combination of automatic fault detection technology and manual correction. First, the fault network in the study area is extracted by coherent attributes to identify the distribution of potential fault surfaces. Then, the automatically detected faults are manually corrected to ensure the accuracy of the fault plane position and dip [44]. While manual correction significantly improves the fault geometry accuracy, it inherently introduces some subjectivity, particularly in areas of complex faulting or low data quality. To mitigate this, our workflow combined coherence attributes, multi-planar seismic validation, and consistency checks across adjacent sections.
3.5. Structural Evolution Analysis
This study is mainly based on the seismic data covering the study area, and typical seismic profiles are selected for structural analysis. Following detailed structural interpretation, fault system analysis, identification of key unconformities, and analysis of structural styles, the preliminary restoration of key evolutionary stages was conducted, including decompaction correction (a key technology for restoring the original thickness of rock layers) for buried strata. After combining the relevant regional evolution data to see if it is consistent with the theoretical basis, the representative sections are inverted and recovered with the help of Layer Flattening Function in GeoEast 4.0 (a tool for basin evolution and fault analysis) and equilibrium section recovery technology, so as to form a complete set of geologic section evolution processes [45,46,47,48].
4. Result
4.1. Characteristics of Deep Geothermal Field
4.1.1. Temperature and Geothermal Gradient
A total of 204 DST static temperatures (Table A1) (static temperature: equilibrium formation temperature post shut-in) were obtained from 18 wells in this study. The variation relationship of temperature with depth is shown (Figure 4a), and the temperature is generally linearly correlated with depth, indicating that the heat transfer mode in the Moxi area is mainly heat conduction. However, the average temperatures at different depths (the purple dashed line) show that there is a significant temperature bulge around 4000 m to 4800 m in depth, roughly corresponding to the Late Permian to Early Cambrian. It is hypothesized that the observed thermal anomaly may result from disturbances by deep thermal fluids, local enrichment of radiogenic heat-producing bodies, or abrupt vertical changes in rock thermal conductivity, and further exploration is needed (Figure 4a).
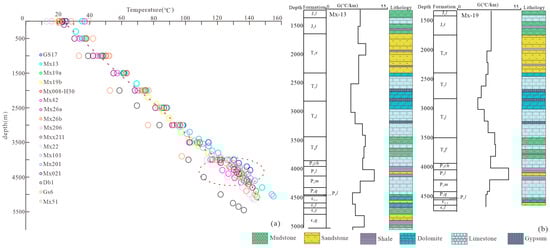
Figure 4.
(a) Characteristics of the measured borehole ground temperature and depth distribution (Mx19a and Mx19b represent that the same well has undergone two temperature tests). (b) G distribution in Wells Mx13 and Mx19. Specific well locations are shown in Figure 5b.
Taking the G distribution of Wells Mx13 and Mx19 as examples, the vertical distribution of G is notably heterogeneous (Figure 4b), which is related to the lithology and thermal conductivity changes of the strata [49,50,51,52]. G of mudstone and shale strata is relatively large, that of dolomite strata is relatively small, and the variation range of G of limestone and sandstone strata is relatively large. This is mainly because of the following: the thermal conductivity of mudstone and shale is relatively low, their heat transfer performance is poor, and G is relatively large. The thermal conductivity of dolomite is relatively high, its heat transfer performance is good, and G is relatively small. The thermal conductivity of limestone decreases with increasing clay content, consequently elevating G as clay content rises. Sandstone exhibits significant porosity variations due to its compositional and textural heterogeneity, resulting in dispersed thermal conductivity values. Consequently, G will vary accordingly [53,54,55,56].
4.1.2. The Combined Characteristics of Deep Reservoirs and Deep Caprock
Based on the formation thickness and lithology data obtained from drilling and logging, combined with G characteristics, it was identified that there are four sets of caprock and three sets of thermal reservoirs developed in the deep layer of the Moxi area (Figure 5a). The four sets of caprock are Longtan Formation, Liangshan Formation, Meitan Formation (locally developed), and Qiongzhusi Formation, and the lithology is mainly mudstone and shale. Among them, the Longtan Formation has a stable and relatively thick stratum deposition thickness in the area, and G exhibits a distinct right-convex pattern (Figure 4b) and is the most important regional caprock. The three thermal reservoirs are the fourth section of the Dengying Formation, the Longwangmiao Formation, and the Qixia–Maokou Formation. The lithology is mainly dolomite and limestone, and they belong to the karst thermal reservoirs of carbonate rocks. Taking the thermal reservoirs of the Qixia–Maokou Formation as an example, they are stably distributed in the area, with gentle thickness changes. The stratum thickness ranges from 282 to 419 m (Figure 5b).
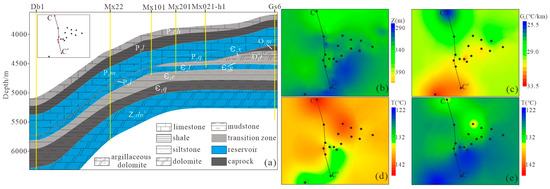
Figure 5.
(a) Cross-section CC′: Configuration of deep thermal reservoirs and caprock. (b) Stratum thickness of the Qixia–Maokou Formation; (c) Gr in the Qixia–Maokou Formation. (d) Bottom surface temperature of the Qixia–Maokou Formation. (e) Top surface temperature of the Qixia–Maokou Formation. Solid black dots indicate well locations, and CC′ denotes the cross-section passing through the wells.
4.1.3. Temperature Characteristics of Thermal Reservoirs
It should be noted that the geothermal parameters for the Longwangmiao and Dengying reservoirs remain systematically unacquired due to current borehole data limitations. Consequently, the present analysis is confined to the Qixia–Maokou formations. Future work will advance multi-reservoir geothermal modeling through continuous downhole Distributed Temperature Sensing logging and rock thermophysical property testing. The characteristics of Gr were analyzed exclusively using the Qixia–Maokou Formation as a representative example. The planar map of Gr calculated with Equation (1) reveals a range of 25.05 to 32.55 °C/km and a distinct southward-increasing trend (Figure 5c).
Based on burial depths of the Qixia–Maokou Formation top and bottom, temperature distributions calculated using G indicate ranges of 121.12–134.88 °C at the top surface and 130.74–144.13 °C at the bottom surface (Figure 5d,e). Both surfaces exhibit consistent spatial variation trends. According to geothermal resource classification standards [57], the Moxi area’s Qixia–Maokou Formation qualifies as a medium-temperature geothermal resource.
4.2. Deep Structural Characteristics
4.2.1. Characteristics of Fault System
Based on the fault interpretation results of seismic profiles, four typical strike-slip structural styles have been identified in the Moxi area: high-angle vertical faults, “Y”-shaped structures, negative flower structures, and pull-apart grabens. High-angle vertical faults are the main structural style developed in the area, showing the characteristics of a single-faulted half-graben. The dip angle of the faults is greater than 80° (Figure 6c,f). The “Y”-shaped and inverted “Y”-shaped structures present a graben structure composed of a main fault and branch faults with opposite dips on the profile. The throw of the main fault is generally greater than that of the branch faults (Figure 6b,d,e). Flower structures are often used as an important basis for judging the existence of strike-slip faults in the deep. This type of structure is also relatively well developed in the Moxi area. The strata at the top of the flower structure are concave, showing an overall negative flower structure (Figure 6a). Pull-apart grabens are geometrically distinct structures formed within strike-slip systems where overlapping or intersecting faults with differing slip vectors create local extensional zones, leading to graben development (Figure 6g). Judging from cross-sectional fault characteristics, it reflects that the study area is in a transtensional structural environment.
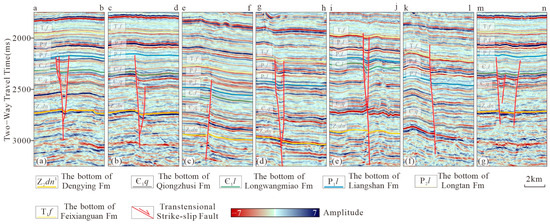
Figure 6.
The structural characteristics of the fault profile in the study area. (a–g) Fault characteristics across different profiles (the profile location is shown in Figure 7b).
High-precision coherence slices at the base of the Cambrian and the base of the Permian Longtan Formation characterize the planar fault distribution within the study area (Figure 7). At the bottom boundary of the Cambrian, there are mainly three groups of strike-slip faults trending nearly east–west, northeast, and northwest, and the faults are linearly distributed. The nearly east–west-trending faults are characterized by large scale, long extension distance, large quantity, and divergence from west to east. The northeast-trending faults have a relatively large scale, long extension distance, and small quantity. The northwest-trending faults are secondary faults with small scale, short extension distance, and large quantity (Figure 7a,b). At the base of the Permian Longtan Formation, faults show limited inheritance, consistent with the cross-sectional characteristics. Most of them terminate below the bottom boundary of the Longtan Formation or Liangshan Formation (Figure 7c,d).
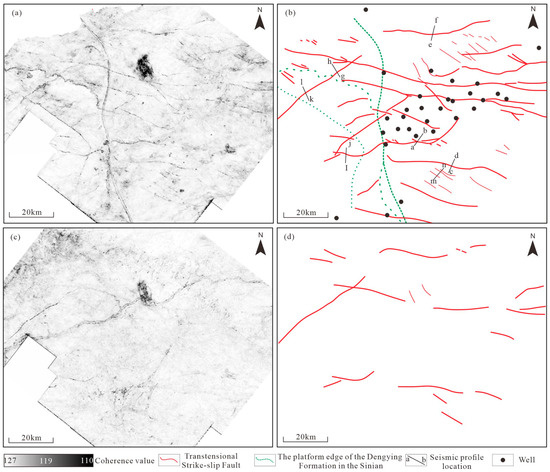
Figure 7.
(a) High-precision coherent slices of the bottom of Cambrian in the study area and (b) Planar distribution map of faults. (c) High-precision coherent slices of the bottom of the Longtan Formation of the Permian. (d) Planar distribution map of faults.
Analysis of the above fault characteristics indicates that transtensional strike-slip faults develop in the Moxi area. The fault network is composed of three groups of faults trending nearly east–west, northeast, and northwest. Overall, the fault network exhibits that faults generally terminate upward at the Permian Longtan Formation, with only a few extending into the Lower Triassic, while downward they penetrate into the Sinian and extend down to the Archean–Lower Proterozoic basement.
4.2.2. Planar Structural Characteristics of Thermal Reservoirs
Based on detailed 3D seismic interpretation, structure contour maps of the top and bottom boundaries of the Qixia–Maokou Formation were constructed for the Moxi area. The bottom boundary structure of the Qixia–Maokou Formation in the study area is distributed in a northeast and northeast–east direction. The north is a slope, the south is a structural high point, and local strip-shaped depressions are developed in the middle and east. Overall, the structural undulation is relatively gentle (Figure 8a). The top boundary structure of the Qixia–Maokou Formation in the study area is similar to the bottom boundary structure of the Qixia–Maokou Formation, which is an inherited development. Generally, it is distributed in a northeast and northeast–east direction. The north is a slope, the south is a structural high point, and local strip-shaped depressions are still developed in the middle and east. Due to the uplift and erosion caused by the Dongwu Movement, the top boundary karst cavities developed densely, presenting a distinct uneven shape (Figure 8b). This process has significantly enhanced the petrophysical properties of carbonate reservoirs, establishing highly efficient geothermal reservoirs characterized by karst fracture–cavity systems.
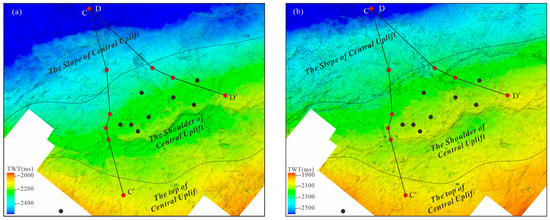
Figure 8.
Thermal reservoir structure map of the study area. (a) Bottom structure map of the Qixia–Maokou Formation. (b) Top structure map of the Qixia–Maokou Formation. Solid red and black dots denote well locations, with CC′ and DD′ representing cross-sections traversing the wells; dashed black lines indicate structural domain boundaries.
4.2.3. Structural Evolution Characteristics of the Moxi Area
A representative seismic profile AA′ (Figure 9k), traversing the study area, was selected for balanced section restoration. The resulting structural evolution history is summarized below:
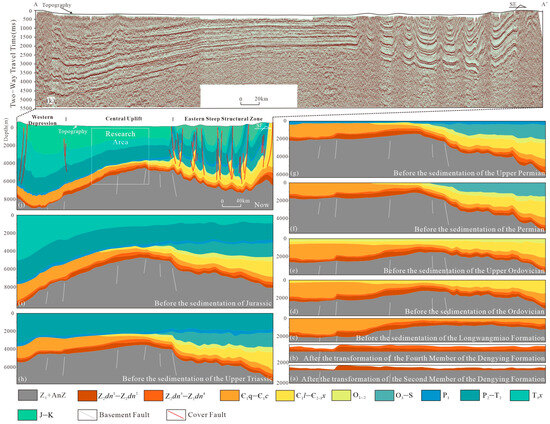
Figure 9.
AA′ Structural Evolution Profile. (a–j) reconstruct structural evolution through key geological stages. (k) AA′ Seismic Profile.
Before the sedimentation of the Qiongzhusi Formation (Figure 9a,b), the Dengying Formation was deposited on a large scale within the basin. Affected by the differential uplift of the Tongwan movement, the Dengying Formation suffered varying degrees of erosion. Within the study area, the Dengying Formation thinned from northwest to southeast.
Before the sedimentation of the Longwangmiao Formation (Figure 9c), the Qiongzhusi Formation was unconsolidated and deposited on the lower Dengying Formation. The central Sichuan region is mainly characterized by slow uplift. At this time, the Central Uplift has taken on a basic form, and the stratum thickness in the study area is relatively thin.
Before the Ordovician sedimentation (Figure 9d), the inherited uplift of the Central Uplift continued to develop. Strata from the Longwangmiao Formation to the Middle–Upper Cambrian exhibit synsedimentary uplift characteristics, with a thinner thickness within the study area.
Prior to Permian sedimentation (Figure 9e,f), Ordovician–Silurian strata were deposited extensively across the region. Reduced thickness in central Sichuan reflects the continued synsedimentary uplift of the Central Uplift. Differential crustal uplift during the Late Silurian Caledonian Movement caused severe erosion of Silurian, Ordovician, and Cambrian strata basin-wide. Within the study area, these strata were also variably eroded. During the Devonian–Carboniferous, the Upper Yangtze Region was in a state of uplift–erosion. At this time, the Central Uplift had emerged above sea level, and no Devonian–Carboniferous strata developed along the entire seismic profile.
During the sedimentary period from the Permian to the Jurassic, stable Permian, Middle and Lower Triassic, Feixianguan Formation, Jialingjiang Formation, and Leikoupo Formation were formed above the Central Uplift. Subsequently, due to the influence of the Indochinese movement, the Sichuan Basin rose as a whole, and a faulting wedge-shaped deposit composed of the first section of the Xujiahe Formation to the third section of the Xujiahe Formation was formed in the western part of Sichuan. Following this, the entire basin received the sediments from the fourth section to the sixth section of the Xujiahe Formation and then received the stable Jurassic sediments (Figure 9h–j).
From the Late Jurassic to Early Cretaceous, compressive stress in eastern Sichuan produced Jurassic-aged, mountain-like folds. Since the Early Cretaceous, most areas of the Sichuan Basin have been in a state of uplift and erosion, and the Central Uplift has lost the Cretaceous. The Himalaya movement since the Cenozoic era has adjusted and transformed the Central Uplift, eventually shaping it into its current state (Figure 9j).
5. Discussion
5.1. The Influence of Structural Characteristics on the Geothermal Field
Based on the structural interpretation of the BB′ seismic profile and planar characteristics of the Qixia–Maokou reservoir, the Central Uplift deep geothermal system was subdivided into secondary structural units: uplift top, shoulder, and slope belt (Figure 5c, Figure 8 and Figure 10a). Gr exhibits hierarchical zonation across structural units, with the uplift core registering 31.79–32.55 °C/km, the uplift shoulder ranging from 28.62 to 31.46 °C/km, and the slope belt maintaining 25.05–28.25 °C/km. The profile characteristics show (Figure 10b,c) that the structural position of the Archean–Lower Proterozoic basement and deep thermal reservoir shows a significant positive correlation with Gr, that is, the higher the structural position, the higher Gr. The reason for this phenomenon is the thermal accumulation effect of the uplift structure caused by the lateral change of thermal conductivity. During upward heat transfer, variations in rock thermal conductivity cause heat accumulation beneath low-conductivity caprocks. Consequently, thermal flow diverts and accumulates toward uplifted zones through pathways of higher conductivity and lower thermal resistance, primarily within crystalline basements and deep geothermal reservoirs [14].
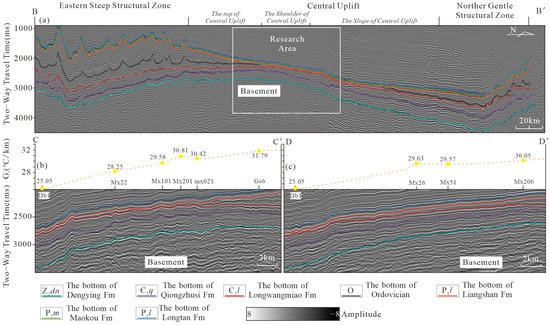
Figure 10.
Comparison of Gr and structural characteristics of the Qixia–Maokou Formation thermal reservoir. (a) BB′ structural profile. (b) CC′ comparison between structural and Gr profiles. (c) DD′ comparison between structural and Gr profiles. The position of the BB′ profile is shown in Figure 1b, and the positions of the CC′ and DD′ profile are shown in Figure 8. Db1 refers to the well name; solid yellow dots denote corresponding reservoir geothermal gradient (Gr) values at individual wells.
5.2. Deep Thermal Reservoir Accumulation Mechanism
From the structural evolution characteristic, it can be known that during the Caledonian and Hercynian periods, the Moxi area was in a differential uplift–erosion state within the extensional structural system, and the high points of the uplift always remained within the study area. At the same time, thermal evolution research also shows that the lithosphere was in a state of tension and thinning in the Early Permian–Middle Triassic [58,59,60]. Therefore, before the Middle Triassic, the Moxi area was in a stage of lithospheric tension and thinning. Subsequently, the Sichuan Basin was compressed and transformed during the Indosinian, Yanshanian, and Himalayan periods, and crustal thickening began to appear in the Western Depression and Eastern Steep Structural Zone [61,62,63,64].
However, the Moxi area was not significantly affected, and only showed a slight shift of the high point of the uplift to the southeast. In summary, the Moxi area has always been in a relatively thinning zone of the crust within the basin, which causes the deep mantle-derived heat flow to produce a component that shifts toward the crust thinning zone when it is vertically transmitted upward [65], resulting in lateral thermal accumulation, compression of isotherms around the basement uplift core, and local high-temperature thermal anomaly.
Based on the research results of the fault characteristics in the Moxi area, a network of transtensional strike-slip faults trending nearly east–west, northeast, and northwest has developed in the Moxi area. Transtensional strike-slip faults have been proven to be excellent conduits for heat and fluid conduction [66,67]. The strike-slip faults in the study area can extend downward to the Archean–Lower Proterozoic basement, connecting with abnormal heat sources. Deep thermal fluids are transferred upward along the fault network. However, these faults generally terminate upward at the Longtan Formation of the Permian. Due to the sealing effect of the thick-layer shale in the Longtan Formation, it is difficult for the thermal fluids to continue moving upward, and the strata below the Longtan Formation are abnormally heated (Figure 11). This also explains why there is an abnormal thermal disturbance in the temperature from the deep Late Permian to the Early Cambrian in the study area.
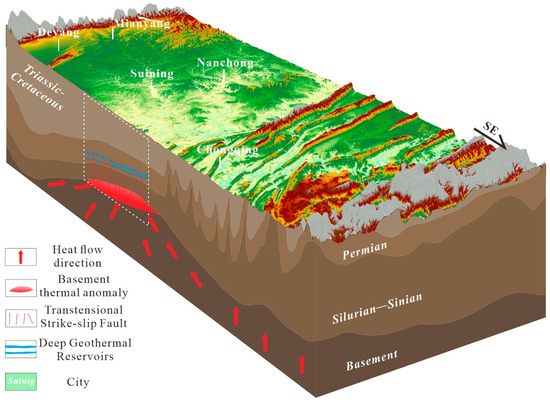
Figure 11.
Thermal accumulation mechanism model in Moxi region.
5.3. Enlightenment on Geothermal Development of Oil and Gas Fields
Research in the Moxi area of the Sichuan Basin has revealed significant synergies between deep geothermal resources and oil and gas resources in terms of structural background, reservoir characteristics, and development technology, providing important inspiration for the industrial-scale development of geothermal resources in oil and gas fields.
The massive geological data accumulated from oil and gas exploration in the Sichuan Basin, nearly 10,000 oil and gas wells, and mature drilling and completion technologies have laid a solid foundation for deep geothermal development. Some abandoned wells can be directly used for geothermal exploitation through transformation, and production wells can achieve comprehensive resource utilization through the “oil, gas, and geothermal collaborative development” model, greatly reducing exploration costs and development risks. For instance, China’s first geothermal power generation project utilizing associated resources in gas fields was constructed and put into operation in the study area in 2022. This project extracts heat from formation water in the Longwangmiao Formation, employing Organic Rankine Cycle (ORC) technology for geothermal power conversion, with an installed capacity of 80 kW and annual electricity output of 460,000 kWh.
In the field of geothermal development, three-dimensional seismic interpretation, reservoir fracturing reconstruction, and high-temperature drilling technologies can be directly transferred to geothermal development. For example, the transtensional strike-slip fault network identified based on seismic coherence attributes (Figure 7) can serve as conduits for the upward flow of deep thermal fluids, guiding the target selections of geothermal areas. Moreover, the fracturing technology for geothermal reservoirs can draw on the experience of oil and gas reservoir reconstruction to enhance the permeability of geothermal reservoirs and improve the efficiency of heat extraction.
To promote the in-depth integration of “oil and gas + geothermal energy”, equal emphasis should be placed on policy guidance and technological innovation. It is recommended to formulate subsidy policies for geothermal development and preferential policies for the reuse of abandoned wells and to establish a cross-industry data-sharing platform to promote the integration of geological data and engineering technologies. Additionally, advancing geothermal energy requires enhanced cooperation between oil/gas companies and geothermal research institutions to explore diversified utilization models (e.g., power generation, industrial heating), ultimately contributing to achieving the SDGs. Advancing the integration of ‘oil & gas + geothermal’ systems currently confronts multifaceted challenges, spanning from technical hurdles–such as wellbore integrity assessment (addressing corrosion risks in retrofitted wells) and reservoir stimulation complexities (particularly fracturing difficulties in granitic basement rocks)–to regulatory barriers including mineral rights overlap (conflicting extraction entitlements between sectors) and the absence of standardized environmental evaluation frameworks (exemplified by lacking permitting criteria for reinjection in repurposed wells).
6. Conclusions
This paper studies the deep geothermal field characteristics and deep structural characteristics of the Moxi area in the Sichuan Basin and draws the following conclusions:
(1) In general, the DST temperatures in the Moxi area exhibit an overall linear correlation with depth, indicating that heat conduction dominates the thermal transfer mechanism. Figure 4a (characteristics of measured borehole temperature–depth distribution) reveals a distinct thermal anomaly zone between 4000 and 4800 m depth, corresponding to the Late Permian to Early Cambrian. In the deep layer of the Moxi area, there are four sets of mudstone and shale caprocks, namely the Longtan Formation, the Liangshan Formation, the Meitan Formation (locally developed), and the Qiongzhusi Formation. Among them, the Longtan Formation serves as the most critical regional seal. The three carbonate geothermal reservoirs—namely Member 4 of the Dengying Formation, the Longwangmiao Formation, and the Qixia–Maokou formations—exhibit favorable reservoir connectivity and storage properties. Gr in the Qixia–Maokou reservoir ranges from 25.05 to 32.55 °C/km, exceeding the Sichuan Basin average (20.80 ± 3.72 °C/km) by 30–56%. The temperature at the top surface of the Qixia–Maokou Formation ranges from 121.12 to 134.88 °C, and the temperature at the bottom surface ranges from 130.74 to 144.13 °C.
(2) Seismic interpretation reveals that transtensional strike-slip faults developed in the Moxi area, which serve as preferential pathways for geothermal fluid migration. A fault network is formed by three groups of faults trending nearly east–west, northeast, and northwest. Generally, these faults terminate upward at the Longtan Formation of the Permian, and only a few faults penetrate through to the Lower Triassic. Downward, they can penetrate through the Sinian and reach the Archean–Lower Proterozoic basement. The planar structures of the bottom and top boundaries of the Qixia–Maokou Formation geothermal reservoir are similar, indicating an inherited development pattern. Overall, they are distributed in a northeast and east–northeast direction. The northern part is a slope, the southern part is a structural high point, and there are local strip-shaped depressions in the central and eastern parts with relatively gentle structural relief.
(3) Structural features have a significant controlling effect on the geothermal field, which is mainly manifested in the structural position of the Archean–Lower Proterozoic basement and deep geothermal reservoirs, which shows a significant positive correlation with Gr, that is, the higher the structural position, the higher Gr (Figure 10b,c). The reason for this phenomenon is the thermal accumulation effect of the uplift structure caused by the lateral change of thermal conductivity. When heat is conducted upward, it is affected by the difference in thermal conductivity of rocks and deflected and accumulated in the uplift area of the Archean–Lower Proterozoic basement and deep geothermal reservoir with high thermal conductivity and low thermal resistance.
(4) The thermal accumulation mechanism of deep geothermal reservoirs in the Moxi area is jointly controlled by crustal thinning, basement uplift, and deep structural features. When the deep mantle-derived heat flow transfers vertically upward, it generates a deflection component toward the thinning area. The heat flow superimposes and converges at the top of the Central Uplift, forming a local thermal anomaly. The fault network connects the abnormal heat source, allowing deep thermal fluids to migrate upward along the fault network. These fluids are sealed by the thick-bedded shale of the Longtan Formation, leading to the abnormal heating of the strata below the Longtan Formation. Meanwhile, thermal focusing associated with the uplift structures concentrates heat accumulation within the geothermal reservoirs.
Author Contributions
Conceptualization, W.Y. and Z.L.; methodology, W.Y. and S.Y. (Simian Yang); software, W.Y. and W.L.; writing—original draft, W.Y.; validation, W.L. and S.Y. (Simian Yang); visualization, W.L. and S.Y. (Simian Yang); data curation, W.Z. and L.Z.; funding acquisition, F.L. and Z.L.; supervision, F.L. and Z.L.; project administration, S.Y. (Shuang Yang) and Z.L. All authors have read and agreed to the published version of the manuscript.
Funding
This study was financially supported by the Sichuan Provincial Science and Technology Program Project (No. 2023YFG0092-5 and No. 2024NSFSC0096).
Data Availability Statement
Data will be made available upon request.
Acknowledgments
The authors thank the reviewers and editor for their constructive comments and suggestions.
Conflicts of Interest
Authors Wei Zheng and Luquan Zhang were employed by the company PetroChina Southwest Oil & Gasfield Company. The remaining authors declare that the research was conducted in the absence of any commercial or financial relationships that could be construed as a potential conflict of interest.
Abbreviations
The following abbreviations are used in this manuscript:
| SDGs | Sustainable Development Goals |
| DST | drilling stem test |
Appendix A

Table A1.
A total of 204 DST static temperatures.
Table A1.
A total of 204 DST static temperatures.
| Name | Depth (m) | Temperature (°C) | Name | Depth (m) | Temperature (°C) | Name | Depth (m) | Temperature (°C) |
|---|---|---|---|---|---|---|---|---|
| Gs17 | 5.42 | 25.392 | Mx008-H30 | 3000 | 96.67 | Mx201 | 4540 | 140.687 |
| Gs17 | 20 | 22.854 | Mx008-H30 | 3500 | 108.97 | Mx021 | 0 | 23.003 |
| Gs17 | 499.99 | 35.192 | Mx008-H30 | 4000 | 122.59 | Mx021 | 100 | 24.014 |
| Gs17 | 999.98 | 47.88 | Mx008-H30 | 4200 | 130.06 | Mx021 | 500 | 30.495 |
| Gs17 | 1499.98 | 61.331 | Mx008-H30 | 4300 | 132.81 | Mx021 | 1000 | 42.086 |
| Gs17 | 1999.97 | 74.848 | Mx008-H30 | 4400 | 134.99 | Mx021 | 1500 | 54.931 |
| Gs17 | 2499.94 | 86.526 | Mx42 | 6.05 | 36.872 | Mx021 | 2000 | 68.284 |
| Gs17 | 2999.92 | 98.454 | Mx42 | 500 | 33.737 | Mx021 | 2500 | 81.16 |
| Gs17 | 3499.64 | 114.374 | Mx42 | 1000 | 45.283 | Mx021 | 3000 | 91.649 |
| Gs17 | 3999.17 | 130.165 | Mx42 | 1500 | 57.156 | Mx021 | 3495.29 | 102.68 |
| Gs17 | 4099.14 | 133.384 | Mx42 | 2000 | 70.134 | Mx021 | 3992.37 | 116.933 |
| Gs17 | 4199.11 | 138.349 | Mx42 | 2500 | 82.501 | Mx021 | 4084.72 | 122.048 |
| Gs17 | 4299.09 | 140.472 | Mx42 | 3000 | 92.726 | Mx021 | 4198.28 | 127.629 |
| Mx13 | 0 | 35.315 | Mx42 | 3500 | 102.381 | Mx021 | 4286.4 | 130.311 |
| Mx13 | 300 | 31.327 | Mx42 | 4000 | 115.653 | Mx021 | 4346.49 | 131.94 |
| Mx13 | 500 | 36.139 | Mx42 | 4300 | 123.058 | Mx021 | 4407.43 | 133.499 |
| Mx13 | 1000 | 48.45 | Mx42 | 4400 | 126.89 | Db1 | 0 | 20.869 |
| Mx13 | 1500 | 61.824 | Mx42 | 4525 | 130.746 | Db1 | 1000 | 39.046 |
| Mx13 | 1800 | 69.377 | Mx42 | 4649.78 | 134.747 | Db1 | 2000 | 58.658 |
| Mx13 | 2000 | 75.615 | Mx26a | 4600 | 136.483 | Db1 | 2437 | 69.603539 |
| Mx13 | 2500 | 88.423 | Mx26a | 4700 | 139.261 | Db1 | 3000 | 83.705 |
| Mx13 | 3000 | 98.097 | Mx26a | 4800 | 141.93 | Db1 | 4000 | 101.833 |
| Mx13 | 3200 | 102.622 | Mx26b | 4500 | 134.266 | Db1 | 4500 | 111.387 |
| Mx13 | 3400 | 108.319 | Mx26b | 4600 | 136.879 | Db1 | 5000 | 121.966 |
| Mx13 | 3600 | 114.485 | Mx26b | 4700 | 139.512 | Db1 | 5250 | 129.682 |
| Mx13 | 3800 | 120.452 | Mx206 | 2.7 | 16.267 | Db1 | 5350 | 133.192 |
| Mx13 | 4000 | 126.25 | Mx206 | 1000 | 43.736 | Db1 | 5450 | 136.508 |
| Mx13 | 4200 | 133.871 | Mx206 | 2000 | 70.95 | Gs6a | 5.92 | 22.325 |
| Mx13 | 4400 | 139.222 | Mx206 | 3000 | 92.988 | Gs6a | 500 | 42.137 |
| Mx13 | 4600 | 143.357 | Mx206 | 4000 | 119.264 | Gs6a | 1000 | 51.714 |
| Mx13 | 4800 | 147.954 | Mx206 | 4500 | 135.24 | Gs6a | 1500 | 62.322 |
| Mx13 | 5000 | 153.955 | Mx206 | 4600 | 138.121 | Gs6a | 2000 | 73.194 |
| Mx13 | 5050 | 154.999 | Mx206 | 4700 | 139.951 | Gs6a | 2500 | 83.747 |
| Mx19a | 7.6 | 22.511 | Mxx211 | 0 | 24.6 | Gs6a | 3000 | 92.063 |
| Mx19a | 500 | 37.237 | Mxx211 | 1000 | 47.1 | Gs6a | 3500 | 103.778 |
| Mx19a | 1000 | 48.481 | Mxx211 | 2000 | 73.4 | Gs6a | 4000 | 116.772 |
| Mx19a | 1500 | 60.981 | Mxx211 | 4000 | 121.6 | Gs6a | 4500 | 130.452 |
| Mx19a | 2000 | 74.217 | Mxx211 | 4585.31 | 138.5 | Gs6a | 4900 | 138.189 |
| Mx19a | 2500 | 85.195 | Mxx211 | 4633.95 | 139.6 | Gs6a | 5000 | 143.653 |
| Mx19a | 3000 | 94.733 | Mx22 | 5.5 | 12.991 | Gs6a | 5060 | 144.467 |
| Mx19a | 3500 | 107.365 | Mx22 | 500 | 34.994 | Gs6a | 5080 | 144.904 |
| Mx19a | 4000 | 121.311 | Mx22 | 1000 | 46.044 | Gs6b | 5.61 | 20.679 |
| Mx19a | 4500 | 135.795 | Mx22 | 1500 | 58.238 | Gs6b | 50 | 20.679 |
| Mx19a | 4700 | 139.724 | Mx22 | 2000 | 69.611 | Gs6b | 1000 | 33.278 |
| Mx19a | 4800 | 141.821 | Mx22 | 2500 | 82.515 | Gs6b | 2000 | 52.694 |
| Mx19a | 4900 | 144.102 | Mx22 | 3000 | 93.335 | Gs6b | 3000 | 76.57 |
| Mx19b | 0 | 20.35 | Mx22 | 3500 | 101.568 | Gs6b | 3900 | 97.684 |
| Mx19b | 1000 | 45.28 | Mx22 | 4000 | 113.355 | Gs6b | 4000 | 122.185 |
| Mx19b | 2000 | 71.96 | Mx22 | 4500 | 126.156 | Gs6b | 4100 | 125.172 |
| Mx19b | 2200 | 76.65 | Mx22 | 4800 | 135.598 | Gs6b | 4200 | 127.511 |
| Mx19b | 2400 | 81.49 | Mx22 | 4900 | 137.984 | Gs6c | 5.22 | 28.475 |
| Mx19b | 2600 | 86.03 | Mx22 | 5000 | 139.911 | Gs6c | 1000 | 52.309 |
| Mx19b | 2800 | 89.82 | Mx22 | 5100 | 141.842 | Gs6c | 2000 | 76.902 |
| Mx19b | 3000 | 93.1 | Mx22 | 5150 | 142.906 | Gs6c | 3000 | 98.758 |
| Mx19b | 3200 | 97.36 | Mx101 | 4450 | 131.632 | Gs6c | 4000 | 127.692 |
| Mx19b | 3400 | 102.23 | Mx101 | 4250 | 128.381 | Gs6c | 4100 | 130.334 |
| Mx19b | 3600 | 108.14 | Mx101 | 4050 | 121.404 | Gs6c | 4200 | 132.811 |
| Mx19b | 3800 | 114.16 | Mx101 | 3850 | 116.294 | Gs6c | 4300 | 137.014 |
| Mx19b | 4000 | 119.4 | Mx101 | 3650 | 110.978 | Gs6c | 4350 | 138.397 |
| Mx19b | 4200 | 127.47 | Mx101 | 3450 | 105.441 | Mx51 | 4 | 39.31 |
| Mx19b | 4400 | 132.6 | Mx101 | 3250 | 100.783 | Mx51 | 1000 | 46.441 |
| Mx19b | 4450 | 133.79 | Mx101 | 3050 | 96.446 | Mx51 | 2000 | 73.432 |
| Mx008-H30 | 0 | 22.97 | Mx201 | 3540 | 110.917 | Mx51 | 3000 | 95.345 |
| Mx008-H30 | 500 | 37.89 | Mx201 | 3740 | 116.791 | Mx51 | 4000 | 118.82 |
| Mx008-H30 | 1000 | 50.13 | Mx201 | 3940 | 121.848 | Mx51 | 4500 | 134.052 |
| Mx008-H30 | 1500 | 63.12 | Mx201 | 4140 | 128.821 | Mx51 | 4600 | 136.668 |
| Mx008-H30 | 2000 | 74.92 | Mx201 | 4340 | 134.2 | Mx51 | 4700 | 138.988 |
| Mx008-H30 | 2500 | 88.01 | Mx201 | 4440 | 136.801 | Mx51 | 4750 | 140.469 |
References
- United Nations. A/RES/70/1–Transforming Our World: The 2030 Agenda for Sustainable Development; United Nations: New York, NY, USA, 2015; Available online: https://sdgs.un.org/2030agenda (accessed on 5 January 2025).
- Lund, J.W.; Freeston, D.H.; Boyd, T.L. Direct utilization of geothermal energy 2010 worldwide review. Geothermics 2011, 40, 159–180. [Google Scholar] [CrossRef]
- Bertani, R. Geothermal power generation in the world 2010–2014 update report. Geothermics 2016, 60, 31–43. [Google Scholar] [CrossRef]
- Limberger, J.; Boxem, T.; Pluymaekers, M.; Bruhn, D.; Manzella, A.; Calcagno, P.; Beekman, F.; Cloetingh, S.; Wees, J.D. Geothermal energy in deep aquifers: A global assessment of the resource base for direct heat utilization. Renew. Sustain. Energy Rev. 2018, 82, 961–975. [Google Scholar] [CrossRef]
- Birdsell, D.T.; Adams, B.M.; Deb, P.; Ogland-Hand, J.D.; Bielicki, J.M.; Fleming, M.R.; Saar, M.O. Analytical solutions to evaluate the geothermal energy generation potential from sedimentary-basin reservoirs. Geothermics 2024, 116, 102843. [Google Scholar] [CrossRef]
- Jiang, G.Z.; Wang, Y.; Shi, Y.Z.; Zhang, C.; Tang, X.Y.; Hu, S.B. Estimate of Hot Dry Rock Geothermal Resource in Daqing Oilfield, Northeast China. Energies 2016, 9, 731. [Google Scholar] [CrossRef]
- Zeng, Y.; Zhang, Y. Deep bedrock geothermal resources in the Maichen Sag, Beibuwan Basin and their potential for exploitation and utilization. Energy Geosci. 2023, 4, 100223. [Google Scholar] [CrossRef]
- Wang, S.; Yan, J.; Li, F.; Hu, J.; Li, K. Exploitation and Utilization of Oilfield Geothermal Resources in China. Energies 2016, 9, 798. [Google Scholar] [CrossRef]
- Zhu, C.Q.; Xu, T.; Qiu, N.S.; Chen, T.G.; Xu, M.; Ding, R. Distribution Characteristics of the Deep Geothermal Field in the Sichuan Basin and Its Main Controlling Factors. Front. Earth Sci. 2022, 10, 824056. [Google Scholar] [CrossRef]
- Xu, M.; Zhu, C.Q.; Tian, Y.T.; Rao, S.; Hu, S.B. Borehole Temperature Logging and Characteristics of Subsurface Temperature in the Sichuan Basin. Chin. J. Geophys.-Chin. Ed. 2011, 54, 224–233. [Google Scholar] [CrossRef]
- Zhu, C.Q.; Qiu, N.S.; Chen, T.G.; Xu, M.; Ding, R.; Yang, Y.B. Thermal Lithospheric Thickness of the Sichuan Basin and Its Geological Implications. Acta Geol. Sin.-Engl. Ed. 2022, 96, 1323–1330. [Google Scholar] [CrossRef]
- Zuo, Y.H.; Sun, Y.G.; Zhang, L.Q.; Zhang, C.; Wang, Y.C.; Jiang, G.Z.; Wang, X.G.; Zhang, T.; Cui, L.Q. Geothermal resource evaluation in the Sichuan Basin and suggestions for the development and utilization of abandoned oil and gas wells. Renew. Energy 2024, 225, 120362. [Google Scholar] [CrossRef]
- Wang, G.L.; Liu, Y.G.; Duan, H.X.; Liu, Z.Y.; Hu, J.; Bian, K.; Xing, L.X. Crust-mantle differentiation and thermal accumulation mechanisms in the north China plain. Renew. Energy 2023, 213, 63–74. [Google Scholar] [CrossRef]
- Zhang, B.J.; Wang, S.Q.; Kang, F.X.; Wu, Y.Q.; Li, Y.Y.; Gao, J.; Yuan, W.Z.; Xing, Y.F. Heat Accumulation Mechanism of the Gaoyang Carbonatite Geothermal Field, Hebei Province, North China. Front. Earth Sci. 2022, 10, 858814. Available online: https://www.frontiersin.org/journals/earth-science/articles/10.3389/feart.2022.858814 (accessed on 20 December 2024). [CrossRef]
- Meng, Q.R.; Wang, E.; Hu, J.M. Mesozoic Sedimentary Evolution of the Northwest Sichuan Basin: Implication for Continued Clockwise Rotation of the South China Block. Geol. Soc. Am. Bull. 2005, 117, 396–410. [Google Scholar] [CrossRef]
- Wang, Z.C.; Zhao, W.Z.; Hu, S.Y.; Xu, A.N.; Jiang, Q.C.; Jiang, H.; Huang, S.P.; Li, Q.F. Control of tectonic differentiation on the formation of large oil and gas fields in craton basins: A case study of Sinian–Triassic of the Sichuan Basin. Nat. Gas Ind. B 2017, 4, 141–155. [Google Scholar] [CrossRef]
- Zhu, C.Q.; Hu, S.B.; Qiu, N.S.; Rao, S.; Yuan, Y. The thermal history of the Sichuan Basin, SW China: Evidence from the deep boreholes. Sci. China-Earth Sci. 2016, 59, 70–82. [Google Scholar] [CrossRef]
- Zheng, Z.Y.; Zuo, Y.H.; Wen, H.G.; Zhang, J.Z.; Zhou, G.; Xu, L.; Sun, H.F.; Yang, M.H.; Yan, K.N.; Zeng, J.C. Natural gas characteristics and gas-source comparisons of the lower Triassic Jialingjiang Formation, eastern Sichuan Basin. Geoenergy Sci. Eng. 2023, 221, 111165. [Google Scholar] [CrossRef]
- Song, X.Y.; Zhou, M.F.; Cao, Z.M. Late Permian rifting of the South China Craton caused by the Emeishan mantle plume. J. Geol. Soc. 2004, 161, 773–781. [Google Scholar] [CrossRef]
- Xu, Y.G.; He, B.; Chung, S.L.; Menzies, M.A.; Frey, F.A. Geologic, geochemical, and geophysical consequences of plume involvement in the Emeishan flood-basalt province. Geology 2004, 32, 917–920. [Google Scholar] [CrossRef]
- Xu, W.L.; Wang, Q.H.; Wang, D.Y.; Pei, F.P.; Gao, S. Processes and mechanism of Mesozoic lithospheric thinning in eastern North China Craton: Evidence from Mesozoic igneous rocks and deep-seated xenoliths. Earth Sci. Front. 2004, 11, 309–317, (In Chinese with English Abstract). [Google Scholar] [CrossRef]
- Ali, J.R.; Fitton, J.G.; Herzberg, C. Emeishan large igneous province (SW China) and the mantle-plume up-doming hypothesis. J. Geol. Soc. 2010, 167, 953–959. [Google Scholar] [CrossRef]
- Shellnutt, J.G. The Emeishan large igneous province: A synthesis. Geosci. Front. 2014, 5, 369–394. [Google Scholar] [CrossRef]
- Wang, M.M.; Hubbard, J.; Plesch, A.; Shaw, J.H.; Wang, L.N. Three-dimensional seismic velocity structure in the Sichuan Basin, China. J. Geophys. Res.-Solid Earth 2016, 121, 1007–1022. [Google Scholar] [CrossRef]
- Liu, S.G.; Deng, B.; Zhong, Y.; Wen, L.; Sun, W.; Li, Z.W.; Jansa, L.; Li, J.X.; Song, J.M.; Zhang, X.H.; et al. Tectonic evolution of the Sichuan Basin, southwest China. Earth-Sci. Rev. 2021, 213, 103470. [Google Scholar] [CrossRef]
- Li, H.K.; Li, Z.Q.; Long, W.; Wan, S.S.; Ding, X.; Wang, S.Z.; Wang, Q.Z. Vertical configuration of Sichuan Basin and its superimposed characteristics of the prototype basin. J. Chengdu Univ. Technol. 2019, 46, 257–267, (In Chinese with English Abstract). [Google Scholar] [CrossRef]
- Qiu, N.S.; Chang, J.; Zhu, C.Q.; Liu, W.; Zuo, Y.H.; Xu, W.; Li, D. Thermal regime of sedimentary basins in the Tarim, Upper Yangtze and North China Cratons, China. Earth-Sci. Rev. 2022, 224, 103884. [Google Scholar] [CrossRef]
- Ma, Y.S. Deep geothermal resources in China: Potential, distribution, exploitation, and utilization. Energy Geosci. 2023, 4, 100209. [Google Scholar] [CrossRef]
- Han, Y.H.; Wu, C.S. Geothermal Gradient and Heat Flow Values of Some Deep wells in Sichuan Basin. Oil Gas Geol. 1993, 14, 80–84, (In Chinese with English abstract). [Google Scholar]
- Wang, L.S.; Li, C.; Shi, Y.S.; Wang, Y.H. Distributions of Geotemperature and Terrestrial Heat Flow Density in Lower Yangtze Area. Chin. J. Geophys.-Chin. Ed. 1995, 38, 469–476. (In Chinese) [Google Scholar]
- Li, C.R.; Rao, S.; Hu, S.B.; Wang, J.Y.; Wei, Z.H.; Huang, Q.Q.; Hu, D.F.; GUO, X.S. Present-day Geothermal Field of the Jiaoshiba Shale Gas Area in Southeast of the Sichuan Basin, SW China. Chin. J. Geophys.-Chin. Ed. 2017, 60, 617–627. (In Chinese) [Google Scholar]
- Tang, B.N.; Zhu, C.Q.; Xu, M.; Chen, T.G.; Hu, S.B. Thermal Conductivity of Sedimentary Rocks in the Sichuan Basin, Southwest China. Energy Explor. Exploit. 2019, 37, 691–720. [Google Scholar] [CrossRef]
- Li, X.L.; Liu, S.W.; Xu, M.; Li, X.D.; Hao, C.Y. Estimation of Subsurface Formation Temperature and Its Implications for Hydrocarbon Generation and Preservation in the Upper Yangtze Area, south China. Acta Geol. Sin.-Engl. Ed. 2020, 94, 1896–1910. [Google Scholar] [CrossRef]
- Sun, Y.G.; Zuo, Y.H.; Zhang, L.Q.; Zhang, C.; Wang, Y.C.; Zhang, T.; Li, X.; Yang, M.H.; Yan, K.N.; Cui, L.Q. Geothermal resource evaluation of the Middle Permian Qixia–Maokou Formation in the southern Sichuan Basin, China. Geothermics 2024, 122, 103073. [Google Scholar] [CrossRef]
- Wang, Y.B.; Liu, S.W.; Chen, C.Q.; Jiang, G.Z.; Wu, J.H.; Guo, L.Y.; Wang, Y.Q.; Zhang, H.H.; Wang, Z.T.; Jiang, X.X.; et al. Compilation of terrestrial heat flow data in continental China (5th edition). Chin. J. Geophys.-Chin. Ed. 2024, 67, 4233–4265. (In Chinese) [Google Scholar]
- Wang, J.Y.; Huang, S.P. Compilation of heat flow data in the China continental area (Second edition). Seismol. Geol. 1990, 12, 351–366. (In Chinese) [Google Scholar]
- Sun, D.; Li, J.X.; Cao, N.; Li, Z.W.; Zhang, Z.P.; Xie, X.G.; Yuan, M.Y.; Cai, H.Y. A preliminary study of the geothermal geological characteristics an d exploration potential of the Sichuan Basin. Hydrogeol. Eng. Geol. 2023, 50, 193–206. (In Chinese) [Google Scholar]
- Zuo, Y.H.; Jiang, S.; Wu, S.H.; Xu, W.; Zhang, J.; Feng, R.P.; Yang, M.H.; Zhou, Y.S.; Santosh, M. Terrestrial heat flow and lithospheric thermal structure in the Chagan Depression of the Yingen-Ejinaqi Basin, north central China. Basin Res. 2020, 32, 1328–1346. [Google Scholar] [CrossRef]
- Albesher, Z.; Kellogg, J.; Hafiza, I.; Saeid, E. MultiAttribute Analysis Using Coherency and Ant-Tracking Techniques for Fault and Fracture Detection in La Florida Anticline, Llanos Foothills, Colombia. Geosciences 2020, 10, 154. [Google Scholar] [CrossRef]
- Bahorich, M.; Farmer, S. 3-D seismic discontinuity for faults and stratigraphic features: The coherence cube. Lead. Edge 1995, 14, 1053–1058. [Google Scholar] [CrossRef]
- Marfurt, K.J.; Kirlin, R.L.; Farmer, S.L.; Bahorich, M.S. 3-D seismic attributes using a semblance-based coherency algorithm. Geophysics 1998, 63, 1150–1165. [Google Scholar] [CrossRef]
- Gersztenkorn, A.; Marfurt, K.J. Eigenstructure-based coherence computations as an aid to 3-D structural and stratigraphic mapping. Geophysics 1999, 64, 1468–1479. [Google Scholar] [CrossRef]
- Li, M.; Zhao, Y.M. Geophysical Exploration Technology. In Seismic Coherence Technique; Li, M., Zhao, Y.M., Eds.; Elsevier: Amsterdam, The Netherlands, 2014; pp. 63–74. [Google Scholar] [CrossRef]
- Brown, A.R. Interpretation of Three-Dimensional Seismic Data; American Association of Petroleum Geologists: Tulsa, OK, USA, 2011. [Google Scholar] [CrossRef]
- Ramsay, J.G. Tectonics of the Helvetic nappes. Geol. Soc. Lond. Spec. Publ. 1981, 9, 293–309. [Google Scholar] [CrossRef]
- Suppe, J. Geometry and kinematics of fault-bend folding. Am. J. Sci. 1983, 283, 684–721. [Google Scholar] [CrossRef]
- Elliott, D. The construction of balanced cross-sections. J. Struct. Geol. 1983, 5, 101–103. [Google Scholar] [CrossRef]
- Chen, J.J.; He, D.F.; John Suppe, J.; Tian, F.L. Geometry and Kinematics of Bump-Type. Am. J. Sci. 2025, 325, 5. [Google Scholar] [CrossRef]
- Visser, P.W.; Kooi, H.; Stuyfzand, P.J. The thermal impact of aquifer thermal energy storage (ATES) systems: A case study in the Netherlands, combining monitoring and modeling. Hydrogeol. J. 2015, 23, 507–532. [Google Scholar] [CrossRef]
- Ejiga, E.G.; Yusoff, I.; Ismail, N.E.; Kumar, R. Geothermal energy assessment through the Curie point depth, geothermal gradient, and heat flow around the Akiri hot spring region in Central Nigeria. Environ. Earth Sci. 2022, 81, 115. [Google Scholar] [CrossRef]
- Gong, Z.Q.; Xu, W.; Tang, X.Y.; Zhu, G.G.; Yang, Y.L.; Guo, T.Q.; Wang, S. Terrestrial Heat Flow and Lithospheric Thermal Structure of the Hubao Basin, North Central China. Water 2024, 16, 1980. [Google Scholar] [CrossRef]
- Wang, J.J.; Deng, J.T.; Zheng, J.G.; Yu, Y.T.; Zhu, J.M.; Huang, X. A segmented analytical solution heat transfer model of U-tube ground heat exchanger based on finite solid cylindrical heat source method. Geothermics 2025, 125, 103170. [Google Scholar] [CrossRef]
- Song, X.Q.; Jiang, M.; Xiong, P.W. Analysis of the Thermophysical Properties and Influencing Factors of Various Rock Types from Guizhou Province. E3S Web Conf. 2018, 53, 03059. [Google Scholar] [CrossRef]
- Li, X.L.; Liu, S.W.; Feng, C.G. Thermal properties of sedimentary rocks in the Tarim Basin, northwestern China. AAPG Bull. 2019, 103, 1605–1624. [Google Scholar] [CrossRef]
- Xiong, J.; Lin, H.Y.; Ding, H.S.; Pei, H.C.; Rong, C.G.; Liao, W.H. Investigation on thermal property parameters characteristics of rocks and its influence factors. Nat. Gas Ind. B 2020, 7, 298–308. [Google Scholar] [CrossRef]
- Zhang, J.Q.; Zhu, C.Q. Analysis of thermal properties of main sedimentary rocks in the Beijing area. Unconv. Resour. 2024, 4, 100104. [Google Scholar] [CrossRef]
- Wang, J.Y. Geothermal and Its Application; Science Press: Beijing, China, 2015. [Google Scholar]
- He, L.J.; Xu, H.H.; Wang, J.Y. Thermal evolution and dynamic mechanism of the Sichuan Basin during the Early Permian-Middle Triassic. Sci. China-Earth Sci. 2011, 54, 1948–1954. [Google Scholar] [CrossRef]
- Xie, F.Q.; Sun, Y.H.; Wu, J.Z.; Jia, W.J. Nature and formation of evaporites in the passive continental margin period of the Sichuan Basin, China: A review. Arab. J. Geosci. 2021, 14, 1328. [Google Scholar] [CrossRef]
- He, L.J. Emeishan mantle plume and its potential impact on the Sichuan Basin: Insights from numerical modeling. Phys. Earth Planet. Inter. 2022, 323, 106841. [Google Scholar] [CrossRef]
- He, B.Z.; Zheng, M.L. Structural Characteristics and Formation Dynamics: A Review of the Main Sedimentary Basins in the Continent of China. Acta Geol. Sin.-Engl. Ed. 2016, 90, 1156–1194. [Google Scholar] [CrossRef]
- Zhang, L.; He, D.F.; Yi, Z.J.; Li, D. Tectonic relationship between the Kelameili range and the Dajing depression: Insights into the Carboniferous tectonic-sedimentary framework. Petrol. Explor. Dev. 2020, 47, 30–45. [Google Scholar] [CrossRef]
- He, Z.L.; Li, S.J.; Li, Y.Q. Multi-Directional and Multiphase Tectonic Modification, and Hydrocarbon Differential Enrichment in the Middle-Upper Yangtze Region. J. Earth Sci.-China 2022, 33, 1246–1259. [Google Scholar] [CrossRef]
- Liu, J.D.; Wang, S.H.; Pan, K.; Ren, C.G.; Zhang, Q.H.; Xu, J.T. Identification of denudation periods and thickness in petroliferous basins and their geological significance: A case study of the central Sichuan Basin. Energy Geosci. 2025, 6, 100390. [Google Scholar] [CrossRef]
- McKenzie, D. Some remarks on the development of sedimentary basins. Earth Planet. Sci. Lett. 1978, 40, 25–32. [Google Scholar] [CrossRef]
- Liang, S.Z.; Li, Z.; Zhang, W.; Gao, Y. The characteristics of strike-slip faults and their control on hydrocarbon distribution in deep carbonate reservoirs of the central Sichuan Basin. Front. Earth Sci. 2023, 11, 1064835. [Google Scholar] [CrossRef]
- Yuan, H.W.; Dai, K.; Zhang, C.; Liu, L.B.; Jing, T.T.; Li, J.Y.; Zhao, W.T.; Chen, F. Cenozoic sedimentary archives of a strike-slip fault zone in the Tanhai Region, Bohai Bay Basin, Northeastern China. J. Struct. Geol. 2024, 186, 105203. [Google Scholar] [CrossRef]
Disclaimer/Publisher’s Note: The statements, opinions and data contained in all publications are solely those of the individual author(s) and contributor(s) and not of MDPI and/or the editor(s). MDPI and/or the editor(s) disclaim responsibility for any injury to people or property resulting from any ideas, methods, instructions or products referred to in the content. |
© 2025 by the authors. Licensee MDPI, Basel, Switzerland. This article is an open access article distributed under the terms and conditions of the Creative Commons Attribution (CC BY) license (https://creativecommons.org/licenses/by/4.0/).