Article

Retabit: A Data-Driven Platform for Urban Renewal and Sustainable Building Renovation

1
ARC Engineering and Architecture La Salle, Ramon Llull University, Sant Joan de la Salle 42, 08022 Barcelona, Spain
2
Catalonia Institute for Energy Research (IREC), Thermal Energy and Building Performance Group, Jardins de les Dones de Negre, 1, 2a, Sant Adrià de Besòs, 08930 Barcelona, Spain
*
Authors to whom correspondence should be addressed.
Energies 2025, 18(15), 3895; https://doi.org/10.3390/en18153895
Submission received: 25 June 2025 / Revised: 16 July 2025 / Accepted: 18 July 2025 / Published: 22 July 2025
(This article belongs to the Special Issue Performance Analysis of Building Energy Efficiency)

Abstract

The Retabit platform is a data-driven tool designed to bridge the gap between building rehabilitation and urban regeneration by integrating energy, economic, and social dimensions into a single framework. Leveraging multiple public data sources, the platform provides actionable insights to local and national authorities, public housing agencies, urban planners, energy service providers, and research institutions, helping to align renovation initiatives with broader urban transformation goals and climate action objectives. The platform consists of two main components: Analyse, for examining building conditions through multidimensional indicators, and Plan, for designing and simulating renovation projects. Retabit contributes to more transparent and informed decision-making, encourages collaboration across sectors, and addresses long-term sustainability by incorporating participatory planning and impact evaluation. Its scalable structure makes it applicable across diverse geographic areas, policy contexts, and domains linked to sustainable urban development.

1. Introduction

The European Union’s Green Deal establishes a landmark objective: achieving climate neutrality by 2050 [1]. In 2020, as part of this overarching goal and within the broader Fit for 55 package, the Renovation Wave strategy [2] introduced a set of 12 legislative proposals aimed at reducing the EU’s net greenhouse gas emissions by at least 55% by 2030 compared to 1990 levels. This initiative would be a key component for the success of the European Green Deal [3].
According to an analysis of the EU Building Stock Observatory, there are approximately 131 million buildings across the European Union, the vast majority of them being residential [4]. As reported by the European Environment Agency [5], in 2020, energy use in buildings accounted for 42% of the EU’s total energy consumption, 35% of energy-related greenhouse gas emissions, and a significant share of air pollutant emissions. However, the quality of the residential building stock remains a concern: around 15.5% of Europeans live in dwellings with structural problems, such as leaking roofs, damp walls, floors, or foundations, and rot in window frames or flooring [5].
A study conducted to assess building renovation in 28 EU countries during the period from 2012 to 2016 found that the weighted energy renovation rate, which measures the annual reduction in primary energy consumption—covering heating, ventilation, domestic hot water, lighting (for non-residential buildings), and auxiliary energy—was estimated at around 1%, ranging from 0.4% to 1.2% depending on the Member State [6]. As concluded by the Report on the evolution of the European regulatory framework for buildings efficiency, “To achieve an interim 2030 climate target of reducing GHG emissions by at least 55% compared to 1990, and climate neutrality by 2050, the EU must significantly increase its rate and depth of renovation, reduce GHG emissions from buildings by 60% compared to 2015, and by 2030 increase the deep renovation rate to 3% annually, up from the current 0.2%” [7].
As stated in the Renovation Wave strategy, “Renovation can open up numerous possibilities and generate far-reaching social, environmental and economic benefits. With the same intervention, buildings can be made healthier, greener, interconnected within a neighbourhood district, more accessible, resilient to extreme natural events, and equipped with recharging points for e-mobility and bike parking” [2]. The aim is to significantly boost the energy renovation of both residential and non-residential buildings by 2030, specifically, to at least double the current annual renovation rate and promote extensive energy upgrades. Achieving this goal through coordinated efforts across all sectors is expected to lead to the renovation of 35 million building units by 2030 [2].
Embedded within the Renovation Wave is the recognition that decarbonising the building sector requires an integrated approach to building renovation that considers social equity, environmental performance, economic viability, and public health. This strategy directly contributes to the European Union’s broader climate agenda under the Green Deal and aligns with the Sustainable Development Goals [8].
The scale and complexity of the EU’s building renovation objectives demand more than policy ambition; they require robust, practical tools that can translate strategic goals into actionable interventions. Despite the adoption of frameworks like the Renovation Wave strategy and the EPBD recast, many public authorities, housing agencies, and stakeholders still lack the capacity to identify renovation priorities, coordinate actions, and evaluate long-term impacts across diverse building typologies and urban contexts. Fragmented and disconnected data systems, limited technical capacity, and a lack of integration across social, environmental, and economic dimensions continue to hinder effective implementation of building renovation in a comprehensive manner.
To bridge this gap between strategic ambition and operational capacity, practical, data-driven tools are essential for translating policy into action. The goal of Retabit is to equip stakeholders with the insights needed to plan and prioritise renovations more effectively. Rather than serving as a prescriptive tool, it provides a flexible decision-support environment that allows users to explore renovation pathways, assess trade-offs, simulate scenarios, and monitor progress. In doing so, Retabit addresses the critical gap between high-level policy and local operational capacity, enabling a shift from reactive, building-by-building interventions to strategic, district-level renovations aligned with the EU’s climate, social equity, and economic goals.
The paper is structured as follows. Section 2 outlines the current European policy landscape that motivates the research. Section 3 reviews related work on urban building energy modelling and identifies existing gaps. Section 4 introduces the Retabit platform, explaining its data foundations, key indicators, and operational workflow. Section 5 summarises stakeholder feedback and illustrates platform use through a neighbourhood-scale case study. Section 6 discusses wider applicability and future development paths. Section 7 provides concluding remarks and key takeaways.

2. Towards Systemic Building Renovation: Integrating Policy, Data, and Sustainability

The renovation of Europe’s building stock is no longer regarded as a narrow technical exercise focused solely on energy efficiency. It has evolved into a multidimensional policy priority that intersects with climate action, social equity, economic resilience, and digital transformation. The recast Energy Performance of Buildings Directive (EPBD), adopted in 2024 as part of the EU’s Fit for 55 package, reflects this shift by framing building renovation as a systemic process aligned with sustainable urban development. This integrated vision is grounded in three key dimensions: the policy reframing introduced by the EPBD; the adoption of systemic, multi-scale implementation strategies; and the pivotal role of data availability and integration in enabling informed, targeted, and scalable renovation efforts. Together, these elements underscore the need to move beyond fragmented, building-level interventions toward coordinated, inclusive, and evidence-based approaches that address the complex challenges of the built environment across Europe.

2.1. Reframing Building Renovation: The EPBD’s Integrated Vision

The recast Energy Performance of Buildings Directive (EPBD), part of the Fit for 55 package, came into force in 2024 and is a key component of the EU’s strategy to achieve carbon neutrality in the building sector by 2050 [9].
Initially introduced in 2002, the EPBD [10] established a system for issuing Energy Performance Certificates (EPCs), originally conceived as one-time informational labels indicating a building’s energy consumption. Since then, the directive has undergone several revisions, evolving into a broader framework for the continuous assessment and improvement of building energy performance. Over time, EPCs have shifted from static indicators to instruments that also identify renovation needs and support decarbonisation efforts across the building sector. In its most recent iteration, the EPBD considers EPCs strategic tools integrated into digital building registries, national renovation strategies, and financial support mechanisms. These enhanced certificates now play a key role in steering and tracking energy performance improvements at both national and EU levels [11].
The latest EPBD marks a broader conceptual shift: building renovation is no longer regarded solely as an energy efficiency measure, but as a multifaceted process that addresses social, economic, and environmental challenges within the broader context of sustainable urban development. The focus has expanded from reducing energy use in individual buildings to pursuing carbon neutrality across the entire building sector. Renovation strategies now encompass goals such as enhancing occupant well-being, comfort, and long-term sustainability. This integrated approach aligns renovation efforts with overarching sustainability objectives while also addressing critical issues such as social equity and inclusion.
The social dimension of building renovation addresses energy poverty, supports vulnerable households, and promotes inclusive renovation efforts. As stated in the EPBD, “Inefficient buildings are often linked to energy poverty and social problems. Vulnerable households are particularly exposed to increasing energy prices as they spend a larger proportion of their budget on energy products” [9]. Renovation programmes can contribute to improve living conditions and promote social inclusion, ensuring that the transition to a climate-neutral economy does not exacerbate existing social inequalities. In this regard, the EPBD acknowledges the importance of local authorities, energy agencies, and citizen-led initiatives in implementing renovation projects. However, it also recognises the financial, administrative, and organisational barriers these entities often face, which can hinder their ability to effectively deliver building renovations and ensure that vulnerable populations benefit from the transition.
The economic dimension of building renovation emphasises the role of investment, job creation, and economic resilience. It underscores the importance of innovative financial mechanisms and industrial solutions as drivers of a green economy. To enable large-scale renovations, financial support and novel funding mechanisms are essential. According to the directive, “they should be used for providing appropriate and innovative means of financing to catalyse investment in the energy performance of buildings” [9]. The economic potential of building renovation extends beyond investment to include the adoption of innovative technologies and the industrialisation of construction. In this regard, the EPBD highlights that “supporting renovations at district-level, including through industrial or serial type renovations, offers benefits by stimulating the volume and depth of building renovations and will lead to a quicker and cheaper decarbonisation of the building stock” [9]. Specifically, implementing industrial solutions and serial renovations can generate economies of scale, thus reducing costs and making deep renovation strategies more feasible and efficient.
The environmental dimension concerns carbon emissions reduction, circularity in materials use, and overall resource efficiency. A key issue is adopting a building whole-life perspective, which accounts not only for operational energy use but also for embodied carbon in construction materials and their end-of-life disposal. Using low-carbon, sustainable materials helps lower a building’s environmental footprint over its lifespan, contributing to a circular economy and improving both energy and resource efficiency. Additionally, the industrialisation of the building sector can accelerate decarbonisation while reducing costs through economies of scale.
Lastly, the EPBD promotes a systemic view of buildings—encompassing their production, construction, renovation, and decommissioning—while considering their social, economic, and environmental impacts. However, as the European Environment Agency (EEA) notes, “There is no holistic policy approach to buildings to handle them as a unified system across their entire life cycle, and to integrate both environmental and climate issues” [12]. Fully realising this systemic shift requires expanding the focus from individual buildings to the urban scale, linking renovation efforts with wider urban regeneration strategies, and anchoring these actions within the broader framework of the Sustainable Development Goals.

2.2. Implementing Building Renovation with a Systemic Perspective

A fundamental prerequisite for an effective renovation strategy is to accurately identify which buildings require intervention, determine where efforts should be focused, and establish clear criteria for setting priorities. As the report Addressing the environmental and climate footprint of buildings by the EEA points out, “Understanding the current state of the buildings system in Europe is the first step towards developing principles to ensure that future buildings are sustainable. This involves highlighting hotspots in different life cycle stages, from socio-economic and environmental perspectives, as well as assessing current environmental and climate policies, emerging political trends and various factors (socio-economic, environmental and technological) which influence and drive the sector” [10]. Such a comprehensive assessment combines technical assessments, socio-economic analyses, and environmental considerations.
Setting priorities is essential for implementing effective building renovation programmes within the broader goals of sustainable urban development. While renovation strategies often target the worst-performing buildings, focusing solely on energy data can be limiting. A more holistic approach, aligned with diverse sustainability objectives, should also take into account factors such as the social needs of local communities, integration with urban regeneration initiatives, climate adaptability, risks of gentrification, and access to essential infrastructure.
As discussed in Lessons learned to inform integrated approaches for the renovation and modernisation of the built environment [13], renovation strategies must recognise that true transformation requires integrating energy efficiency, renewable energy, digitalisation, and urban development into coherent, multi-scale plans. District-level renovation, in particular, offers a unique opportunity to maximise benefits. However, the lack of a common operational definition and insufficient integration mechanisms between stakeholders remain major barriers. Without clearly structured frameworks and strong coordination, the potential gains in cost efficiency, environmental performance, and citizen wellbeing may not be fully realised. To address these challenges, the report suggests adopting comprehensive approaches that combine overarching visions with concrete actions, for example, providing financial support or mandating minimum bike parking spots at new or renovated buildings. Additionally, fostering cooperation across all governance levels (i.e., European, national, regional, and local) is essential for developing effective renovation strategies.

2.3. Enhancing Data Availability for Effective Building Renovation Strategies

Data availability across the multiple domains involved in building renovation spanning scales, stakeholders, domains, and decision-making levels is crucial for adopting comprehensive renovation strategies. As acknowledged in the Comprehensive Study of Building Energy Renovation report, “there is an increasing amount of data on building energy use and building occupants’ energy consumption patterns” [6] which would facilitate policymaking, drive the creation of innovative energy services and business models, and enable the aggregation of renovation projects to better identify and focus on priority districts.
EPCs are a key data source for building renovation. However, many European countries face concerns about their quality, reliability, and accessibility, issues that the latest revision of the EPBD aims to resolve. The EPBD also mandates the progressive development of a Digital Building Logbook, a standardised digital repository that compiles relevant building data—including energy performance, renovation history, ownership records, and material composition—throughout a building’s lifecycle. Its goal is to improve transparency, support building owners, and assist professionals in making informed renovation decisions. Closely related to the logbook, the Building Renovation Passport is another instrument introduced in the directive. It provides a step-by-step roadmap for individual buildings to reach a high level of energy performance or zero-emission status over time. Based on in situ audits and tailored recommendations, the passport guides owners through sequential renovation actions—helping avoid lock-in effects, align investments with long-term goals, and prioritise the most impactful upgrades. Together, these tools form the backbone of a more integrated, transparent, and data-driven renovation ecosystem, in line with the EU’s climate neutrality objectives.
To enable more targeted and effective renovation strategies, EPCs should be combined with other key data sources—such as property and land registries, actual energy consumption, socioeconomic data, and renovation passports. This integration would significantly improve the accuracy and completeness of information on the building stock, allowing for better assessment of building performance throughout its lifecycle [11].
To achieve these objectives, the EPBD requires the establishment of a national database that collects EPC data and links it with other datasets: “Each Member State shall set up a national database for the energy performance of buildings which allows data to be gathered on the energy performance of individual buildings and on the overall energy performance of the national building stock” [9]. These national-level databases can consist of interoperable systems and should contribute data to the European Building Stock Observatory, thereby supporting EU-wide renovation monitoring and policy-making.
However, as stated in the EPBD, persistent challenges remain: “the lack of data is a persisting challenge across all strategic areas. Existing databases, such as building registries and cadastres, EPC databases, material passports and the European Building Stock Observatory, differ in collection methodology, data specification and thus comparability, comprehensiveness and availability,” making it difficult for public authorities “to utilise the existing data for compliance checking… or to use in the development of new policies and measures” [13]. Therefore, “better and more comprehensive data is needed to understand the performance and the overall condition of the EU building stock, which to a large extent is still lacking” [13].
Therefore, ensuring data availability across the multiple domains involved in building renovation—spanning scales, stakeholders, and decision-making levels—is essential for designing, implementing, and monitoring effective, integrated renovation strategies that align with EU climate, energy, and social objectives.

3. From Building Energy Models to Urban Building Energy Models

Building Energy Models (BEMs) evaluate the energy performance of individual buildings by analysing how elements such as insulation, heating and cooling systems, lighting, and occupancy patterns influence energy use. They help optimise energy efficiency, reduce costs, and improve building design by simulating different energy scenarios. Urban Building Energy Models (UBEMs) apply similar methods at the scale of entire districts or cities, accounting for multiple buildings, their interactions, shared infrastructure, and energy systems.
As explained by Hong et al., “Urban building energy modelling refers to the computational modelling and simulation of the performance of a group of buildings in the urban context, to account for not only the dynamics of individual buildings but more importantly, the inter-building effects and urban microclimate” [14]. UBEMs provide valuable insights into energy consumption patterns at the city or district level, enabling planners and policymakers to make better informed decisions regarding energy efficiency, sustainability, and broader urban development strategies. They use physical models of heat and mass flows in and around buildings to predict energy consumption and environmental conditions, both indoors and outdoors, across a group of buildings. These models help simulate energy usage under different conditions, making them valuable for urban planning, energy policy, and infrastructure development [15].
An UBEM can adopt either a top-down approach, typically implemented through data-driven methods such as statistical analysis, regression modelling, and economic models to assess energy policies and scenarios; or a bottom-up approach, which involves modelling individual buildings or subsectors through detailed dynamic simulations (white-box), reduced-order models (grey-box), or purely data-driven methods (black-box) [14]. The bottom-up method requires detailed data on individual buildings and substantial computational resources. To make the process more manageable, building archetypes are often used, grouping buildings by shared characteristics based on national or cultural construction practices. While this method sacrifices some building-specific detail, it preserves key differences between building types, making it suitable for use in UBEMs. In Europe, archetypes based on outputs of the Tabula project [16] have been applied to characterise building archetypes adapted to specific projects in various countries [17].
According to Hao and Hong [18], as urban planning increasingly shifts toward performance-based strategies, the integration of suitable UBEM tools throughout the planning process is becoming increasingly important. In the preparatory phase, UBEMs facilitate the assessment of current energy consumption, enable energy benchmarking, and help define strategic energy visions. During the master planning phase, they assist energy system planning and policy optimisation, while at the zoning and urban design stage, they assist with district energy system planning, performance-based zoning, and developing building regulations. In the implementation phase, they can be used in the design of building-scale energy systems and in evaluating retrofit options. Finally, during the operational phase, UBEMs play a key role in energy resiliency analysis, operational optimisation, and dynamic energy management.
When integrated with the powerful visualisation capabilities of Geographic Information System (GIS) tools, UBEMs can significantly enhance communication and collaboration among a diverse range of stakeholders. These tools transform complex energy data into accessible visual formats, such as interactive maps, 3D models, or spatial analyses, enabling both technical experts (e.g., engineers, energy modelers, and urban planners) and nonexperts (e.g., policymakers, community leaders, and the general public) to engage meaningfully in the planning process [19].

Existing Limitations on Current UBEMs

Despite their growing capabilities, current UBEM tools exhibit several limitations that constrain their broader applicability. A key shortcoming is the lack of interdisciplinary integration: most UBEM studies focus primarily on building energy metrics, neglecting potential synergies with environmental, social, or economic dimensions [20,21]. For example, while a UBEM may estimate energy savings from specific retrofit strategies, it usually does not assess effects on housing affordability, local air quality, or neighbourhood resilience. Without strong cross-domain modelling, these tools risk oversimplifying the complex socio-technical nature of built environments, reducing their usefulness for policymakers tasked with meeting multidimensional sustainability objectives.
Existing UBEMs also face several limitations that reduce their effectiveness in delivering comprehensive analysis. Two key challenges are their limited multiscale capabilities, which prevent effective linking of building-level dynamics with broader urban interactions, and the lack of genuine two-way engagement with end users. These shortcomings are significant obstacles to achieving decarbonisation goals and advancing holistic urban planning, where understanding the intricate relationships between buildings, urban areas, sectors, and stakeholders is essential.
Data availability and interoperability also remain persistent challenges. Urban-scale modelling requires data on building characteristics, occupancy patterns, construction details, and local weather conditions [22]. These datasets often come from multiple sources and vary in format, making it difficult to compile and compare data efficiently. As a result, most UBEMs operate offline—running what-if scenarios or long-term forecasts—instead of dynamically updating based on real-time conditions. This limits their usefulness not only for decision-making throughout a building’s lifecycle but also for responding to the evolving conditions of the complex urban systems of which these buildings are part.
Another limitation concerns user customisation and transparency. Many UBEM tools were initially developed for research purposes and can be difficult for non-experts to use. Default archetypes, occupant schedules, and HVAC specifications may not reflect local conditions, yet customising these parameters often requires expert knowledge of the tool’s underlying code. Without clear documentation explaining the model’s assumptions, data sources, and calculation methods, municipal planners, developers, and investors may doubt the accuracy and relevance of the model results [23]. Moreover, most existing UBEM tools are proprietary, limiting third-party customisation and reducing their adaptability to diverse local, cultural, and regulatory contexts.
A state-of-the-art review by Ferrando et al. [24] highlighted that UBEM platforms vary significantly in their input requirements, workflow complexity, and intended users, revealing a lack of standardisation in user interfaces and features. Indeed, selecting the right UBEM tool often demands expert knowledge to balance complexity, accuracy, and usability for specific applications. The absence of common validation benchmarks makes it difficult to assess the reliability of different tools without transparent comparison standards. This underscores the need for more user-centric development of UBEM tools, including clearer documentation of model assumptions, options for users to override default settings, and community-driven validation efforts to enhance trust in their accuracy and adaptability.
Finally, research into UBEMs has recognised socio-economic indicators as important for improving model accuracy and representation, but their integration remains notably underdeveloped. These indicators are generally included only in statistical models, while incorporating them into physics-based models continues to be a complex challenge [25].

4. Retabit Platform

Over the past fifteen years, we have pursued a line of research focused on integrating data from multiple sources to support building renovation at the urban scale. In the SEÍS (2009–2012) [26] and SEMANCO (2011–2014) [27] research projects, we applied semantic technologies to integrate data across diverse sources and domains, developing tools and methods to analyse the energy performance of the building stock. With the ENERHAT/ENERPAT tools [28], we combined EPC data with cadastre information and simulation tools, providing both experts and non-experts with actionable insights to support building upgrades. In the OpenSantCugat platform [29], we integrated data generated by municipal departments with data provided by public institutions, facilitating improved data management across city departments and offering citizens and businesses streamlined access to relevant public information. Retabit represents the latest step in this ongoing research trajectory.
Retabit is a data-centric platform that facilitates the integration of building renovation into broader urban regeneration strategies by combining energy, economic, and social indicators within a unified system [30]. Drawing from public data sources, it provides actionable insights to local and national authorities, public housing agencies, urban planners, energy service providers, and research institutions—helping to align renovation initiatives with broader urban transformation goals and climate action objectives.
The platform emerges as a response to the increasing regulatory requirements, at the national and European levels, aimed at decarbonising the building sector within the context of sustainable development. With many European regulations expected to be mandatory for Member States, regions, and municipalities, having tools that integrate relevant data and indicators across multiple levels of decision making and territorial scales is essential to align local planning with European objectives. In this regard, the Retabit platform can play a crucial role within public policy frameworks by facilitating coordination among different levels of government and promoting a cohesive response to sustainability and energy transition guidelines.
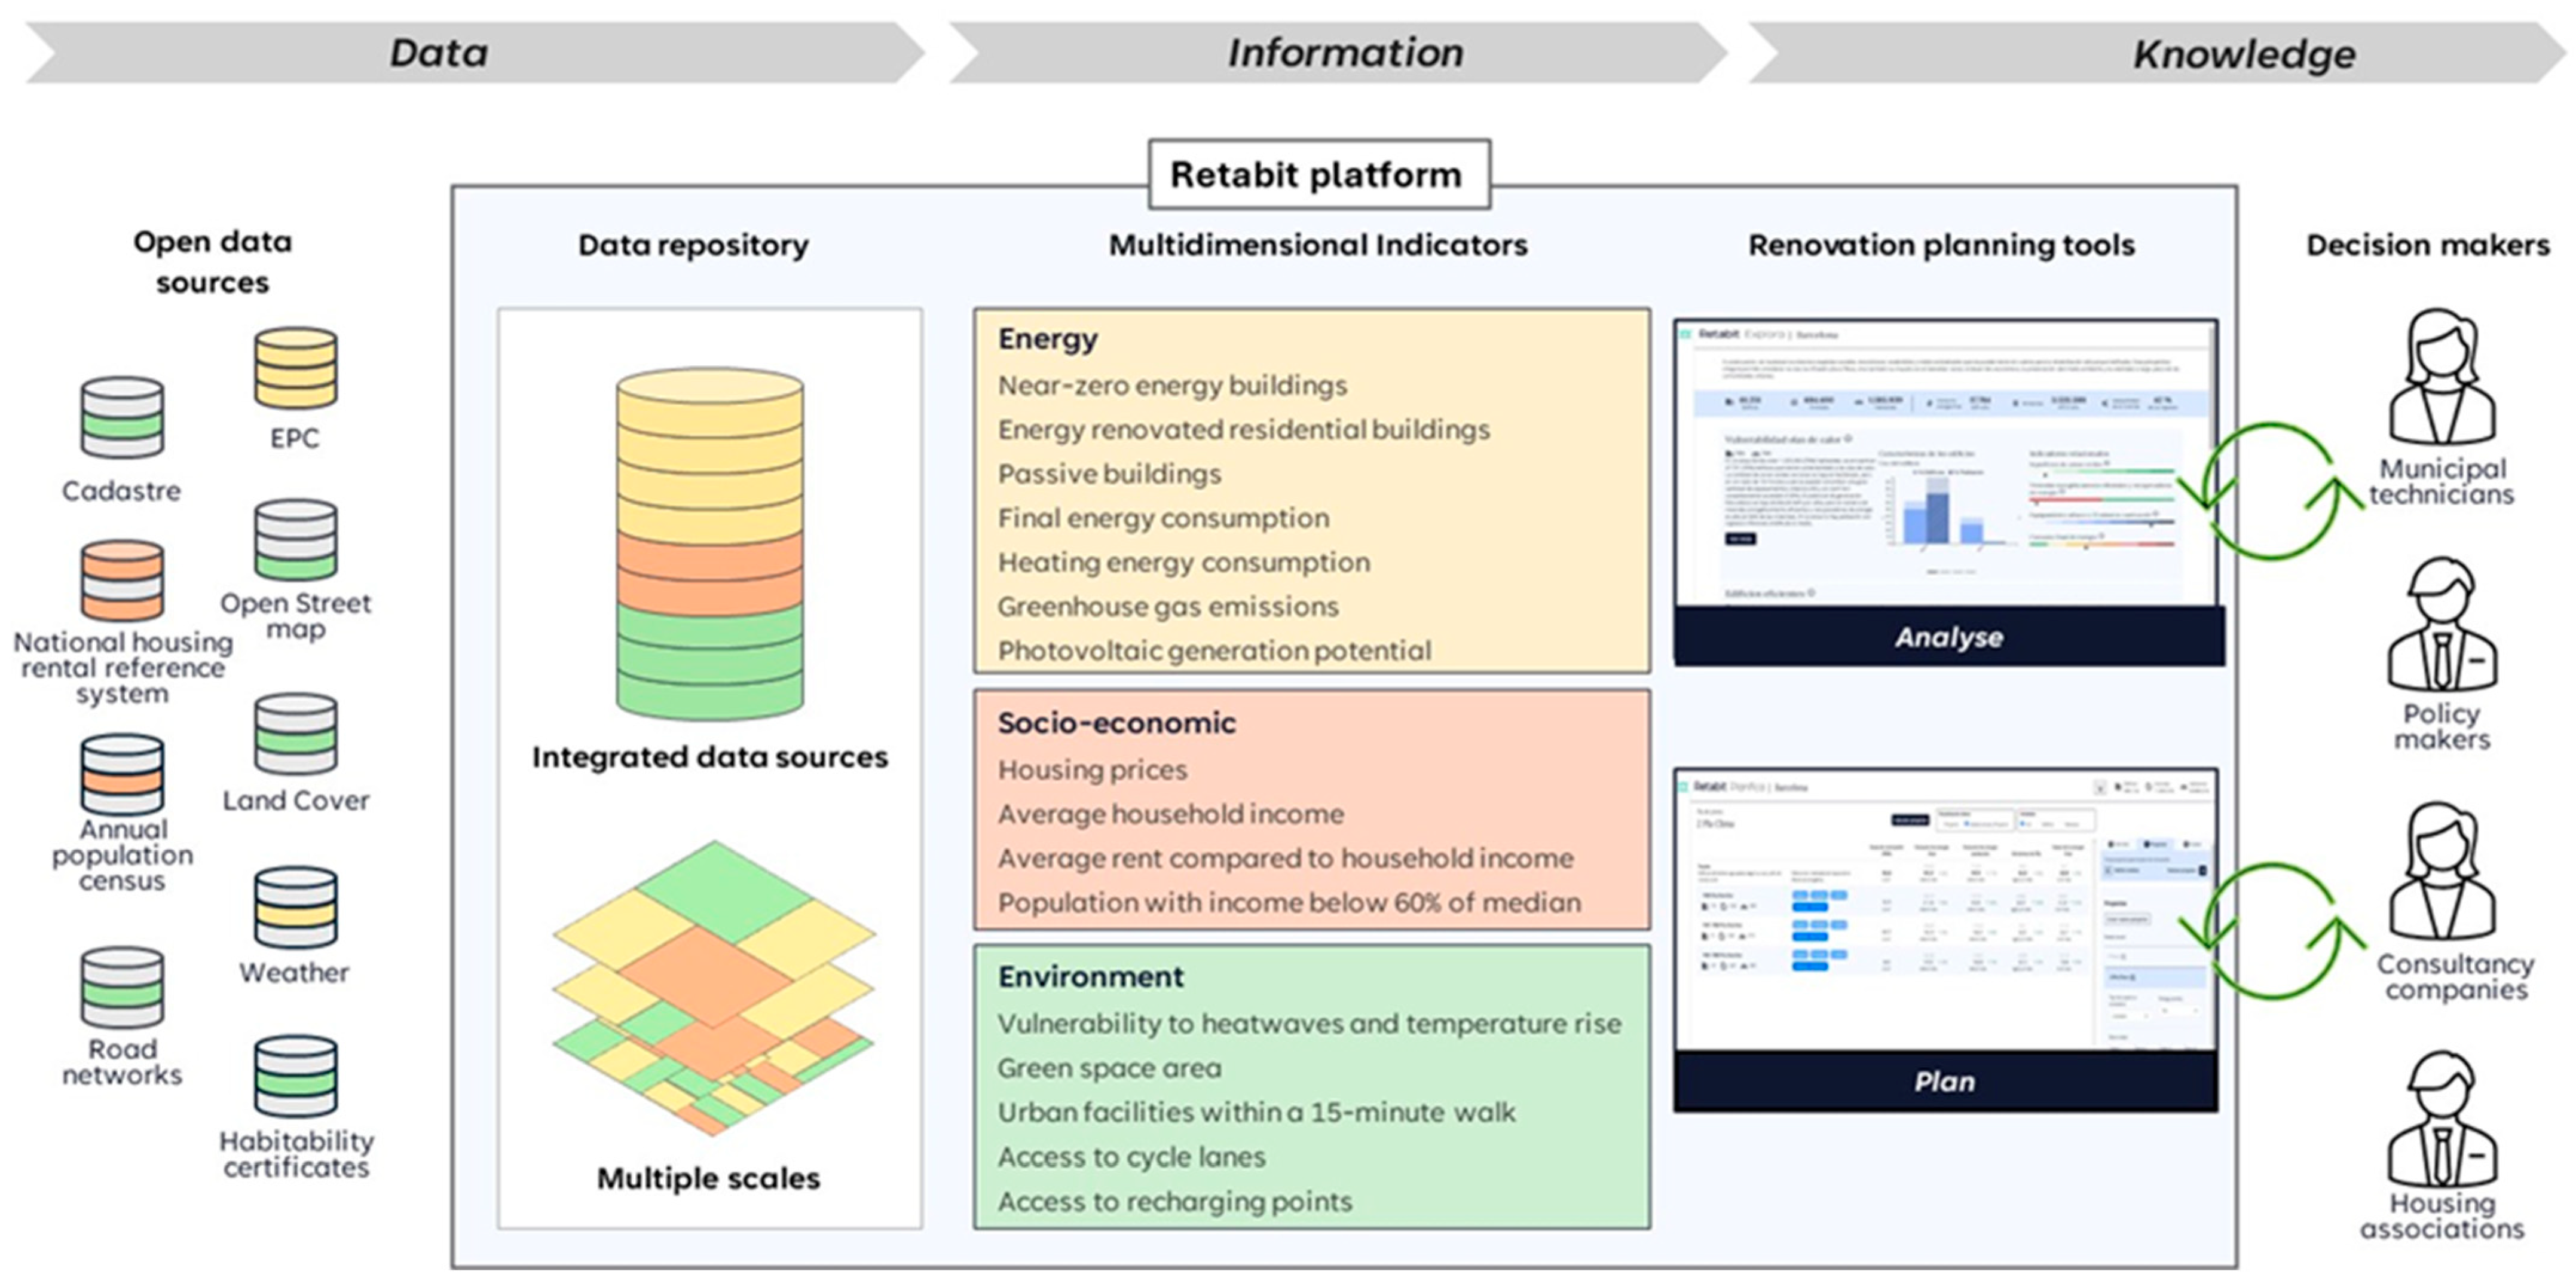
The data from various public sources in Catalonia, spanning multiple domains such as cadastres, censuses, energy performance, and geospatial data, are integrated in the platform (Figure 1). This dataset serves as the foundation for a series of indicators that capture building characteristics within the broader context of their urban environment, social dynamics, and economic conditions. The indicators not only support the multidimensional analysis of the building stock but also enable the development of intervention scenarios, the prioritisation of actions, and the design of evidence-based refurbishment policies. Decision-makers can identify the most effective strategies to improve building energy performance and promote urban sustainability, ensuring that social equity, energy efficiency, and environmental goals are fully integrated into the urban planning process.
The Retabit platform transforms raw data into actionable information that, when paired with the expertise of decision-makers, becomes valuable knowledge. This shared understanding fosters evidence-based strategies for building renovation and urban sustainability, enabling experts to turn insights into meaningful policy and action.
The key limitations of the current UBEMs and how they are addressed by the Retabit platform are summarised in Table 1.

4.1. Data Integration

The Retabit platform employs data-driven processes to enhance and support informed decision-making. Data are regularly collected and updated from multiple reliable sources to ensure accuracy and relevance over time. Table 2 summarises the eleven core datasets currently integrated. Together they comprise more than 15 million individual records that encompass the building stock, infrastructure, energy performance, environmental layers, and socio-economic metrics.
All source datasets are ingested through a reproducible extract–transform–load (ETL) pipeline developed in Java 11 and Python 3.10, which periodically harvests open-data endpoints compliant with the INSPIRE directive (e.g., cadastre) together with thematic portals that publish energy, habitability, and socio-economic statistics. During the transform stage, the Data Build Tool [31] is used to orchestrate a sequence of data-profiling, cleansing, and harmonisation tasks: attribute names are normalised, units are converted to SI, records are de-duplicated with fuzzy keys, and spatial references are re-projected to the ETRS89-UTM31N system to guarantee topological consistency across layers. Relational integrity is enforced in a PostgreSQL/PostGIS repository, where geometry types, spatial indexes, and domain constraints prevent invalid or orphan features. GeoServer exposes the curated layers via WFS/WMS/WMTS services, ensuring FAIR-compliant interoperability with external GIS and BIM tools. Completeness is further enhanced by Python micro-services that enrich each building footprint with derived geometric descriptors (e.g., compactness ratio) and use XGBoost models to impute missing attributes—specifically, useful floor area, maximum occupancy (i.e., habitability certificates), and energy-rating labels—achieving cross-validation R2 values above 0.85. The entire workflow, which relies exclusively on open-source components, is version-controlled and can be re-executed end-to-end, providing full provenance and auditability for every record delivered through the Retabit platform.

4.2. Multidimensional Indicators

The identification of indicators was based on a methodology described in Ibañez Iralde et al. [32]. The study began by conducting a comprehensive review of scientific and grey literature to identify local and regional indicator frameworks aligned with the Sustainable Development Goals (SDGs) and Sustainable Energy and Climate Action Plans (SECAPs). Using a five-step methodology, the study gathered over 185 documents and platforms from international databases, institutional reports, and professional networks. Subsequently, eight representative case studies were then selected based on their granularity and coverage at the local and regional level (e.g., Barcelona, Los Angeles). Ultimately, this process yielded a total of 745 indicators, capturing a wide array of approaches to localising and monitoring sustainable development. To narrow down the initial set of 745 indicators to a refined list of 114 a multi-stage methodology was applied. The initial indicators were then filtered based on five key criteria: (1) inclusion in more than one source, (2) relevance to multiple SDG targets, (3) alignment with SECAP indicators, (4) availability from open data sources at the lowest possible scale (i.e., dwelling, building, census tract, or district), and (5) exclusion of indicators based solely on locally developed surveys. After merging duplicates and consolidating redundant indicators, a list of 114 unique indicators was consolidated.
The 114 indicators were then used as a starting point to identify the final list of indicators relevant to the project. As a first step, due to the project’s scope, only indicators directly or indirectly related to residential buildings and retrofitting were retained. Then, two filtering stages were applied. The first was based on data availability and its potential for regular updating, and the second on the expected granularity of the KPIs at the building and district level. After applying these filters, 36 KPIs remained (Figure 2).
A preliminary set of 36 KPIs was initially developed and subsequently refined through a selection process. The methodology for calculating these indicators varies depending on data granularity: when data are available at the building level, indicators are calculated directly; when only broader spatial data (e.g., census tracts) are available, a downscaling procedure is applied. Expressing all indicators uniformly at the building scale enables consistent aggregation to higher spatial levels—census tract, district, municipal, or regional—supporting accurate and flexible analysis of the building stock.
This refinement process evaluated the applicability of each KPI across spatial scales, their aggregation/disaggregation potential, data availability, and unit standardization. It also ensured methodological soundness by verifying calculation methods through literature review. Ultimately, only 16 KPIs met the necessary standards.
Based on this analysis, a harmonized set of 16 indicators were proposed (Table 3), aligned with criteria from SDGs, SECAPs, and relevant case studies. These indicators are designed to be calculable at the building level using open urban data sources, enabling a holistic approach to building renovation. Detailed descriptions of the indicators across energy, environmental, and socio-economic domains are provided in the following sub-sections.

4.2.1. Energy Domain

Near-zero energy buildings: This indicator identifies buildings classified as near-zero energy buildings (nZEB) in Spain’s Building Technical Code (Código Técnico de la Edificación, CTE) and aligned with EU Directive 2010/31/EU. Specifically, nZEBs are characterised by very low non-renewable primary energy consumption, primarily achieved through energy-efficient construction features and building systems for heating, cooling, ventilation, and domestic hot water. The CTE criteria, updated in 2019 (Royal Decree 732/2019), set clear limits for energy performance, combining standards for building envelope design with thresholds for total primary energy use calculated according to the UNE-EN ISO 52000-1:2019 standard [33], and stipulate that most of the consumed energy must originate from renewable sources. This indicator specifically adopts the NRPEC (non-renewable primary energy consumption) metric as its reference. Consequently, for buildings in Catalonia, nZEB classification depends on compliance with established NRPEC thresholds, differentiated by climatic zones (B, C, D, and E), as defined in the CTE DB-HE (Table 4).
Buildings whose calculated NRPEC values from the EPC databases fall below these limits are classified as near-zero energy buildings. This indicator thus serves as a critical benchmark for evaluating urban sustainability, energy performance, and the transition toward high efficiency building standards.
Energy-renovated residential buildings: This energy indicator identifies existing residential buildings that, after undergoing refurbishment, achieve a non-renewable primary energy consumption (NRPEC) low enough to be deemed efficient under the CTE. Such buildings promote a rational use of energy for heating, domestic hot water, cooling, and ventilation, keeping consumption within sustainable limits even though they do not reach the nearly zero-energy building benchmark. By pinpointing these upgraded structures, the indicator supports assessments of progress toward climate-mitigation goals and guides policy incentives for energy retrofits in the existing housing stock.
The reference framework is the 2019 revision of the CTE, which transposed Directive 2010/31/EU and tightened requirements on total primary energy use—calculated with UNE-EN ISO 52000-1:2019 [33]—together with minimum envelope performance standards. For refurbished or change-of-use buildings, the CTE sets differentiated NRPEC limits by climatic zone. Table 5 shows the relevant ceilings for Catalonia as defined in the CTB DB-HE0.
The indicator is derived by retrieving each building’s non-renewable primary energy demand from the official Energy Performance Certificate (EPC) database managed by the Catalan Institute for Energy (ICAEN) and comparing it with the climatic zone thresholds established in CTE DB-HE0. Buildings whose NRPEC does not exceed the relevant threshold (55–80 kWh/m2·year, depending on zone B–E) are classified as energy-renovated. The result may be reported as a binary attribute at the building scale or, when aggregated, as the proportion of energy-renovated dwellings within a given spatial unit, providing a concise yet robust measure of refurbishment-driven energy efficiency across the residential stock.
Passive buildings: This energy indicator identifies residential buildings whose calculated annual space-heating demand and space-cooling demand are each ≤15 kWh/m2·year. The limit adopts the Passivhaus standard adapted to temperate climates, a benchmark that closely aligns with the 2019 CTE and with the EU EPBD EU/2024/1275, which charts a transition from nearly-zero-energy buildings (nZEB) to zero-emission buildings (ZEB). The indicator is relevant because many existing buildings cannot feasibly reach the ZEB target; identifying stock that already operates at Passivhaus-level demand helps planners prioritise deep-renovation resources elsewhere and supports policies that scale up renewable on-site generation for ultra-low-demand buildings.
The indicator is derived by retrieving each building’s certified heating and cooling demand from ICAEN’s EPC database. The indicator can be reported either as a binary attribute per building or aggregated (e.g., share of passive buildings per census section).
Final energy consumption: This energy indicator quantifies the total final energy (kWh/m2·year) consumed by a building and not produced by on-site renewable sources. It encompasses the energy demand for space heating, domestic hot-water production, space cooling, and mechanical ventilation in each dwelling. By focusing on final energy rather than primary energy, the metric reflects the amount billed to occupants at the point of supply, facilitating direct comparison with utility invoices and enabling combined analyses with economic indicators. The indicator is derived from the building’s EPC, which provides standardised simulations of energy performance under normalised operating and occupancy conditions. Because large-scale in-situ metering is seldom feasible, the EPC serves as the most widely available information source for estimating a building’s final energy demand.
Where available, the EPC database for Catalonia provides pre-computed final energy indicator extracted from individual EPC records. Retabit adopts this value directly when a valid certificate exists for the building or dwelling. When an EPC is absent, the indicator is estimated through a regression model based on the XGBoost algorithm that forms part of the platform’s data-ingestion workflow. The model was trained on a curated data set of approximately one million EPC certificates and employs year of construction, conditioned floor area, principal building use, and climatic zone as predictors. The same machine-learning pipeline is applied to other key performance indicators that depend on EPC variables (e.g., heating energy consumption and operational carbon intensity) thereby guaranteeing a consistent, building-level set of metrics across the urban stock.
Heating energy consumption: This energy indicator quantifies the total non-renewable primary energy consumption devoted exclusively to space-heating systems in a building, expressed in kilowatt-hours per square metre of conditioned floor area and year (kWh/m2·year). By isolating the portion of energy that is neither generated in situ nor sourced from renewables, the metric reveals the effectiveness of the building’s heating systems and its ability to ensure thermal comfort during winter without relying on fossil-based resources. Assessing heating-related NRPEC is pivotal for diagnosing the environmental performance of the building stock and for prioritising retrofit actions that reduce carbon intensity, improve occupant well-being, and facilitate the integration of on-site renewable heat production. High values highlight opportunities for envelope improvements, system upgrades, or the substitution of conventional boilers with low-emission technologies (e.g., heat pumps, biomass, or district heating sourced from renewables).
The indicator is derived directly from the EPC database following the same methodology as the Final energy consumption indicator.
CO2 emissions: This energy indicator quantifies the operational carbon footprint of a building, expressed as kilograms of CO2 emitted per square metre of conditioned floor area per year (kg CO2/m2·year). It captures carbon emissions attributable to the building’s energy use under standard operating and occupancy conditions, thereby providing a direct measure of environmental impact during the use phase.
Monitoring in-use emissions is critical for benchmarking progress towards the decarbonisation targets set by European and national legislation—most notably the latest EPBD recast, which requires the progressive transformation of the stock into zero-emission buildings. In conjunction with non-renewable primary energy demand, carbon intensity is a core performance metric for evaluating whether existing buildings comply with, or fall short of, the forthcoming regulatory standards.
The indicator is derived from the EPC, where annual CO2 emissions are reported as a principal output alongside NRPEC. For buildings holding a valid certificate, the certified value, previously normalised by floor area, is directly adopted as indicator. For buildings lacking an official EPC, CO2 emissions are estimated using a machine learning workflow that infers missing values based on building typology, construction period, climatic zone, and system characteristics.
This indicator is extracted directly from the EPC database, applying the methodology used for the Final energy consumption indicator.
Photovoltaic generation potential: This energy indicator estimates the annual electrical output a building could generate from a photovoltaic (PV) system installed on its roof, expressed in kilowatt-hours per square metre of roof area per year (kWh/m2·year). The indicator reveals the relative suitability of individual buildings for solar energy capture, informs cost benefit assessments of retrofits, and supports urban planning for distributed renewable capacity.
The estimate is produced with the Photovoltaic Geographical Information System (PVGIS) of the Joint Research Centre of the European Commission [34]. The PVGIS combines satellite-derived irradiance data with a validated PV performance model to give location specific generation values. For each roof, the process begins by extracting its footprint from cadastral data. This footprint, defined as the polygon above the uppermost inhabited storey, is overlaid with a two-metre square grid representing the space needed for each PV module plus a service corridor. A conservative nominal module power of 450 W is used to avoid overestimating the installed peak power. This value was selected following a market survey, which showed that most silicon monocrystalline products targeted at the residential and micro-PV segments fell within the 430–450 W range.
A roof-specific horizon profile is generated to refine the shading input supplied by the PVGIS. First, a local digital elevation model and three-dimensional building envelopes are constructed by extruding cadastral footprints with a constant storey height and the reported number of floors. For each roof centroid, a ray is cast at one-degree intervals through 360° in the horizontal plane. Along every azimuth, the algorithm records the first intersection with the terrain or with an extruded building surface; the corresponding elevation angle from the roof plane to the top of that obstacle is then computed. The resulting 360 values—one for each degree of azimuth—are exported as a comma-separated horizon file, replacing the default PVGIS horizon, which has a resolution of 90 m and cannot account for near-field obstructions such as neighbouring buildings. In this way the PV performance simulation accounts for site-specific shading conditions, yielding a more accurate estimate of the photovoltaic generation potential.
Because detailed information on roof slope is unavailable at large scale, all roofs are treated as essentially flat, with a maximum pitch of 5° as permitted by national building regulations. Panels are modelled as lying in the plane of the roof and oriented to the south, which maximises annual yield under local climatic conditions. Row spacing follows the IDAE (Instituto para la Diversificación y Ahorro de la Energía, which is the Institute for the Diversification and Saving of Energy in Spain) guideline:
d = h/tan(61° − Φ)
where d is the row spacing, h is the panel height, and Φ is the site latitude. Applying this relation to the southern and northern limits of Catalonia (40.5° N and 42.8° N) gives a minimum spacing of 0.31 m. Combining this distance with the horizontal projection of a standard 2.1 m × 1.15 m panel and a 0.5 m maintenance aisle results in an effective allocation of about 4 m2 for each module.
Additional PVGIS inputs include a fixed aggregate loss factor of 14 per cent, which accounts for cabling, inversion, degradation, and other system losses, and a shading profile constructed from a detailed digital model of building heights together with the PVGIS horizon data. The PVGIS provides the annual energy yield for the hypothetical PV array, and dividing this value by the roof area produces the indicator expressed in kWh/m2·year.

4.2.2. Socio-Economic Domain

Housing prices: This indicator captures the average rental price per square metre (€/m2) of dwellings within each residential building. It serves as a key metric for assessing housing affordability and economic pressure in urban areas, enabling the identification of zones with heightened market tension. Moreover, it facilitates the analysis of socio-economic segregation and gentrification patterns, contributing to the formulation of public policies aimed at regulating and planning the housing market.
The indicator is derived from the State Reference System for Rental Housing Prices (Sistema Estatal de Referencia de Precios del Alquiler de Vivienda, SERPAVI), managed by the Ministry of Housing and Urban Agenda of Spain [35]. This public dataset provides benchmark rental price indices aligned with the objectives of Law 12/2023, of 24 May, on the Right to Housing [36]. The law establishes that, in areas declared as having a strained housing market, rental prices—particularly those set by large property owners or for units not previously let in the last five years—must not exceed the maximum limit established by these reference indices.
SERPAVI provides price indices at the level of the census section, distinguishing between single-family and multi-family dwellings. For the calculation of this indicator, rental price values from SERPAVI are spatially joined to their corresponding georeferenced census sections throughout Catalonia. These values are classified into housing affordability categories using quantile-based intervals, enabling comparative assessment across the territory as follows:
≤10th percentile: 0–4.1 €/m2
10th–25th percentile: 4.1–5.5 €/m2
25th–50th percentile: 5.5–7 €/m2
50th–75th percentile: 7–12.3 €/m2
75th–90th percentile: 12.3–19.5 €/m2
≥90th percentile: 19.5–20 €/m2
Average household income: This indicator represents the average annual net income of all individuals residing within a household, expressed in euros (€), and is calculated for the aggregate of households located in a given building. It serves as a key metric for analysing income distribution in urban areas and contributes to the identification of zones at risk of social exclusion and economic segregation. Furthermore, it offers essential contextual information for studies on housing accessibility, gentrification, and inequalities in the distribution of financial resources.
The indicator is based on the average household income data provided by the INE (Instituto Nacional de Estadística, the Spanish National Statistics Institute), specifically derived from the Living Conditions Survey (Encuesta de Condiciones de Vida) [37]. According to the INE, average annual net household income is defined as “[…] the net annual income of household members after deducting income tax, wealth tax, and social security contributions, and including received transfers.” These incomes can include various sources such as “[…] employment earnings, net self-employment income, social benefits, private pension schemes unrelated to employment, capital and property income, inter-household transfers, income received by minors, and tax return outcomes.” [37].
The INE provides this data across several levels of territorial disaggregation, including municipalities, districts, and census sections by province. For the calculation of this indicator, the mean annual net income per household at the census section level is used. Through georeferencing techniques, these income values are assigned to the corresponding census sections and subsequently linked to each building based on its location. This enables a spatialised and building-level representation of household income distribution across an urban area, supporting detailed socio-economic analysis and policy development.
Average rent compared to household income: This economic indicator quantifies the percentage (%) of average household income that households within a given building would need to allocate towards rent payments. The calculation is based on an estimated rental price derived from the average dwelling area within the building, combined with reference rental values provided by the SERPAVI [35].
Comparative analysis of rental prices relative to household income highlights urban areas experiencing heightened economic stress, potentially leading to housing affordability problems. Such circumstances may result in the displacement of vulnerable populations towards lower-cost neighbourhoods, reinforcing socio-economic segregation and exacerbating issues such as overcrowding, diminished access to essential services, reduced employment opportunities, and overall lower quality of life. Additionally, allocating a substantial proportion of household income to housing may limit residents’ financial capacity to address other fundamental needs, including healthcare, further deteriorating living conditions.
The indicator is calculated by dividing two indicators: Housing prices and Average household income. Specifically, the process involves determining the average dwelling surface area for all residential units within the building, using cadastral data. This area is then multiplied by the building-specific rental price indicator to estimate the rental cost. The resulting estimated cost is then compared with the average household income, resulting in the indicator expressed as a percentage. This indicator provides valuable insight into economic vulnerability, housing affordability, and the potential socio-economic impacts associated with disproportionate rental expenditure.
Population with income below 60% of median: This indicator measures the proportion of residents within each building whose economic status places them at risk of poverty, defined by having household incomes below the established poverty threshold. Specifically, this threshold is set at 60% of the median annual net household income for Catalonia, reflecting a commonly accepted measure of relative poverty. Identifying populations at risk of poverty enables targeted interventions in socio-economic support, housing rehabilitation programmes, and the provision of social housing. Furthermore, it informs policy planning aimed at reducing social exclusion and alleviating the economic burden of housing for vulnerable households.
The indicator is calculated by comparing the average household income per building to the poverty threshold, based on official income statistics. Income data are obtained from the Living Conditions Survey, which provides geographically disaggregated figures at the levels of census sections, municipalities, districts, provinces, and regions (i.e., Comunidades Autónomas). For this indicator, census-section-level income data is used, georeferenced, and assigned to each building based on its location within the corresponding census section.
Additionally, regional-level data from the INE for Catalonia is used to determine the poverty threshold, defined as 60% of Catalonia’s median annual net household income. The indicator is calculated by comparing the average income of each georeferenced building against this poverty threshold, thereby identifying buildings whose average household income places their residents below the established poverty line.

4.2.3. Environmental Domain

Vulnerability to heatwaves and temperature rise: This indicator assesses the level of vulnerability of buildings to extreme heat events, such as heat waves and rising summer temperatures, expressed on a scale from 0 to 9. It reflects the combined impact of urban heat island effects, reduced thermal comfort, and increased health risks for residents, particularly in areas with limited green infrastructure and high population density. The indicator enables the identification of zones most exposed to thermal risk and least equipped to adapt, supporting urban planning strategies aimed at climate change mitigation and resilience. The indicator builds upon the methodology established by the Oficina Catalana del Canvi Climàtic [38] through the SAL02 index (‘Empitjorament del confort climatic’, deterioration of climate comfort) but adapts it to the census section scale using open-access data sources available at this level of granularity. It integrates three sub-indicators: Projected summer temperature increase, Urban population density, and Proportion of urban green space.
-
Projected summer temperature increase: This sub-indicator estimates the expected rise in average summer temperatures for each census section, based on historical climatological data from the Spanish Meteorological Agency (AEMET) and adjusted using a climate adaptation factor: 1.8 for coastal areas and 1.9 for inland and Pyrenean regions. The formula used is: Projected temperature increase = T + f, where T is the historical summer average and f is the climate zone factor. Based on the resulting value, a score of 1 (low), 2 (medium), or 3 (high) is assigned.
-
Urban population density: This sub-indicator is derived from the number of inhabitants per census section, divided by the built-up urban area (in m2), using data from the National Statistics Institute and cadastral records. The resulting population density is classified as follows:
  • Low density (≤2500 inhab./km2)
  • Medium density (urban core > 5000 inhabitants but not exceeding 20,000 at ≤5000 inhab./km2)
  • High density (urban core > 20,000 inhabitants and ≤5000 inhab./km2)
-
Proportion of urban green space: This component calculates the proportion of green space relative to the urban land area within each census section, using georeferenced urban planning data. The formula applied is green space ratio = Sv/A’ where Sv is the surface area of green zones and A’ is the total urban land area. The classification is as follows:
  • Low availability of green space (≤0.013)
  • Medium (between 0.013 and 0.106)
  • High (≥0.106)
To calculate the final vulnerability score, the three sub-indicators are combined using the formula defined by the Oficina Catalana del Canvi Climàtic [38]:
Vulnerability = (Temperature increase + Population density) − Green space availability
The result yields a vulnerability score between 0 (no vulnerability) and 9 (maximum vulnerability). This value provides a spatialised, quantitative assessment of thermal risk at the building level, enabling planners and policymakers to prioritise interventions in areas most in need of passive cooling measures and green infrastructure.
Green space area: This indicator quantifies the total area of green spaces, expressed in hectares, within a 400 m radius of a given building. It serves as a proxy for assessing the environmental quality social wellbeing, and public health benefits of the surrounding urban environment. The 400 m threshold aligns with internationally recognised standards, including those proposed by Atiqul Haq [39] and UN-Habitat [40], which identify this distance as the maximum acceptable for ensuring equitable, walkable access to public green spaces. A minimum of 1 hectare of green space within this radius is recommended to promote urban sustainability and enhance residents’ well-being.
The calculation of this indicator utilises high-resolution land cover data provided by the ICGC (Institut Cartogràfic i Geològic de Catalunya, Catalonia’s Cartographic and Geological Institute). This dataset, with a spatial resolution of 1 m and thematic resolution encompassing 41 land cover classes, is derived from orthophotos and other remote sensing sources. The classification system used aligns with the INSPIRE land cover classification system, facilitating harmonisation with European datasets.
For each building, a circular buffer with a radius of 400 m is generated from the centroid of its footprint. This buffer is then spatially intersected with the land cover dataset to isolate green space classes falling within the defined perimeter. These include urban green zones as well as various categories of natural vegetation such as dense and sparse forests, shrublands, and grasslands, as classified in the dataset. The resulting intersected areas are then calculated in hectares to determine the total amount of accessible green space per building.
Urban facilities within a 15 min walk: This indicator measures the number of different facilities located within a walking distance equivalent to 15 min from a given building. Facilities are categorised into five functional groups: care, education, provisioning, entertainment, and transport. The indicator captures spatial accessibility to everyday services and amenities, providing insight into the degree of social vulnerability and urban segregation. Its relevance lies in identifying disparities in access to key services and in supporting evidence-based strategies for inclusive urban planning and development. The definition and methodology are informed by the framework established by Ferrer-Ortiz et al. [41] which adapts the 15 min city concept to the context of Barcelona. Walking distances are derived from time thresholds assigned to each facility type and converted into metric units using an average walking speed of 72 m per minute. This speed, established by the meta-analysis conducted by Bohannon and Andrews [42], represents a population-weighted mean across age and gender groups. A tolerance margin of 100 m is added to each distance to account for spatial imprecision due to parcel geometry and building typologies. For example, a facility with a threshold of 10 walking minutes would correspond to a radius of 820 m (72 m/min × 10 min + 100 m). These calibrated distances are used to define accessibility buffers for each facility category (Table 6).
To calculate the indicator, a proximity-based spatial analysis is conducted to identify which facilities are located within the defined walking distance of each building. For each of the 24 facility categories, a distance threshold—derived from the conversion of walking time into metres—is applied using the centroid of the building footprint as the reference point. A facility is considered accessible if it is located within the corresponding distance radius.
Access to cycle lanes: This indicator measures the presence of cycling infrastructure within walking distance of residential buildings. It reflects the potential of the immediate urban environment to encourage active and sustainable modes of transport such as bicycles, scooters, or roller skates. This indicator highlights the degree to which urban design encourages non-motorised mobility, contributing to environmental sustainability, public health, and inclusive urban accessibility.
The methodological framework follows the spatial accessibility approach detailed in the previous indicator Urban facilities within a 15 min walk, using building centroids and distance-based buffers to assess proximity. Specifically for this indicator, a maximum walking time of 5 min to the nearest cycle lane is considered adequate, in line with the thresholds defined by Ferrer-Ortiz et al. [41]. This threshold is converted into a distance of 460 m using an average walking speed of 72 m per minute, with an additional 100 m margin to account for spatial deviations. A cycle lane is considered accessible if it lies within this distance from the building centroid.
Access to recharging points: This indicator evaluates the adequacy of electric vehicle (EV) recharging infrastructure in proximity to residential buildings. Rather than measuring only the presence or number of recharging points, the indicator assesses the ratio between supply (available charging outlets) and demand (estimated number of dwellings), thereby reflecting the capacity of the surrounding area to support a transition toward electric mobility. This measure is particularly relevant in dense urban areas, where private parking is limited and public infrastructure becomes essential for enabling widespread EV adoption. The methodological framework is consistent with the spatial accessibility model used in previous indicators such as Urban facilities within a 15 min walk and Access to cycle lanes. A maximum walking distance of 460 m is used, corresponding to a 5 min walk. Each building is represented by the centroid of its ground-floor footprint, derived from georeferenced cadastral data. Around each centroid, a 460 m accessibility buffer is created to identify nearby recharging points.
The indicator is calculated by aggregating the number of recharging outlets and the number of dwellings within each buffer zone. It expresses the result as a percentage of adequacy, based on a reference standard of one outlet per ten dwellings. The final value is obtained using the formula
100 × total dwellings/10 × total recharging outlets
where a result of 100 indicates full adequacy (i.e., one outlet per ten dwellings). Values above or below this threshold indicate an over- or under-provision of infrastructure relative to the estimated residential demand. This approach allows for a more nuanced interpretation of access, going beyond spatial proximity to consider actual capacity and potential usage pressure. The outlets considered are those included in the dataset provided by the Open Data Portal of Catalonia [43].

4.3. Platform Components

The Retabit platform is a two-tiered system consisting of the following components:
Analyse—Facilitates the exploration of building stock conditions within a municipality using integrated available data. It is designed for a broad audience interested in sustainable urban data and performance indicators, including local and national authorities, public housing agencies, urban planners, energy service providers, research institutions, and others.
Plan—Enables professionals and decision-makers to design targeted renovation projects and assess the impact of proposed measures using simulation tools. It is intended for specialised practitioners such as municipal technicians, energy consultants, and public-sector officials.

4.3.1. Analyse: Exploring the Building Stock Through Multidimensional Indicators

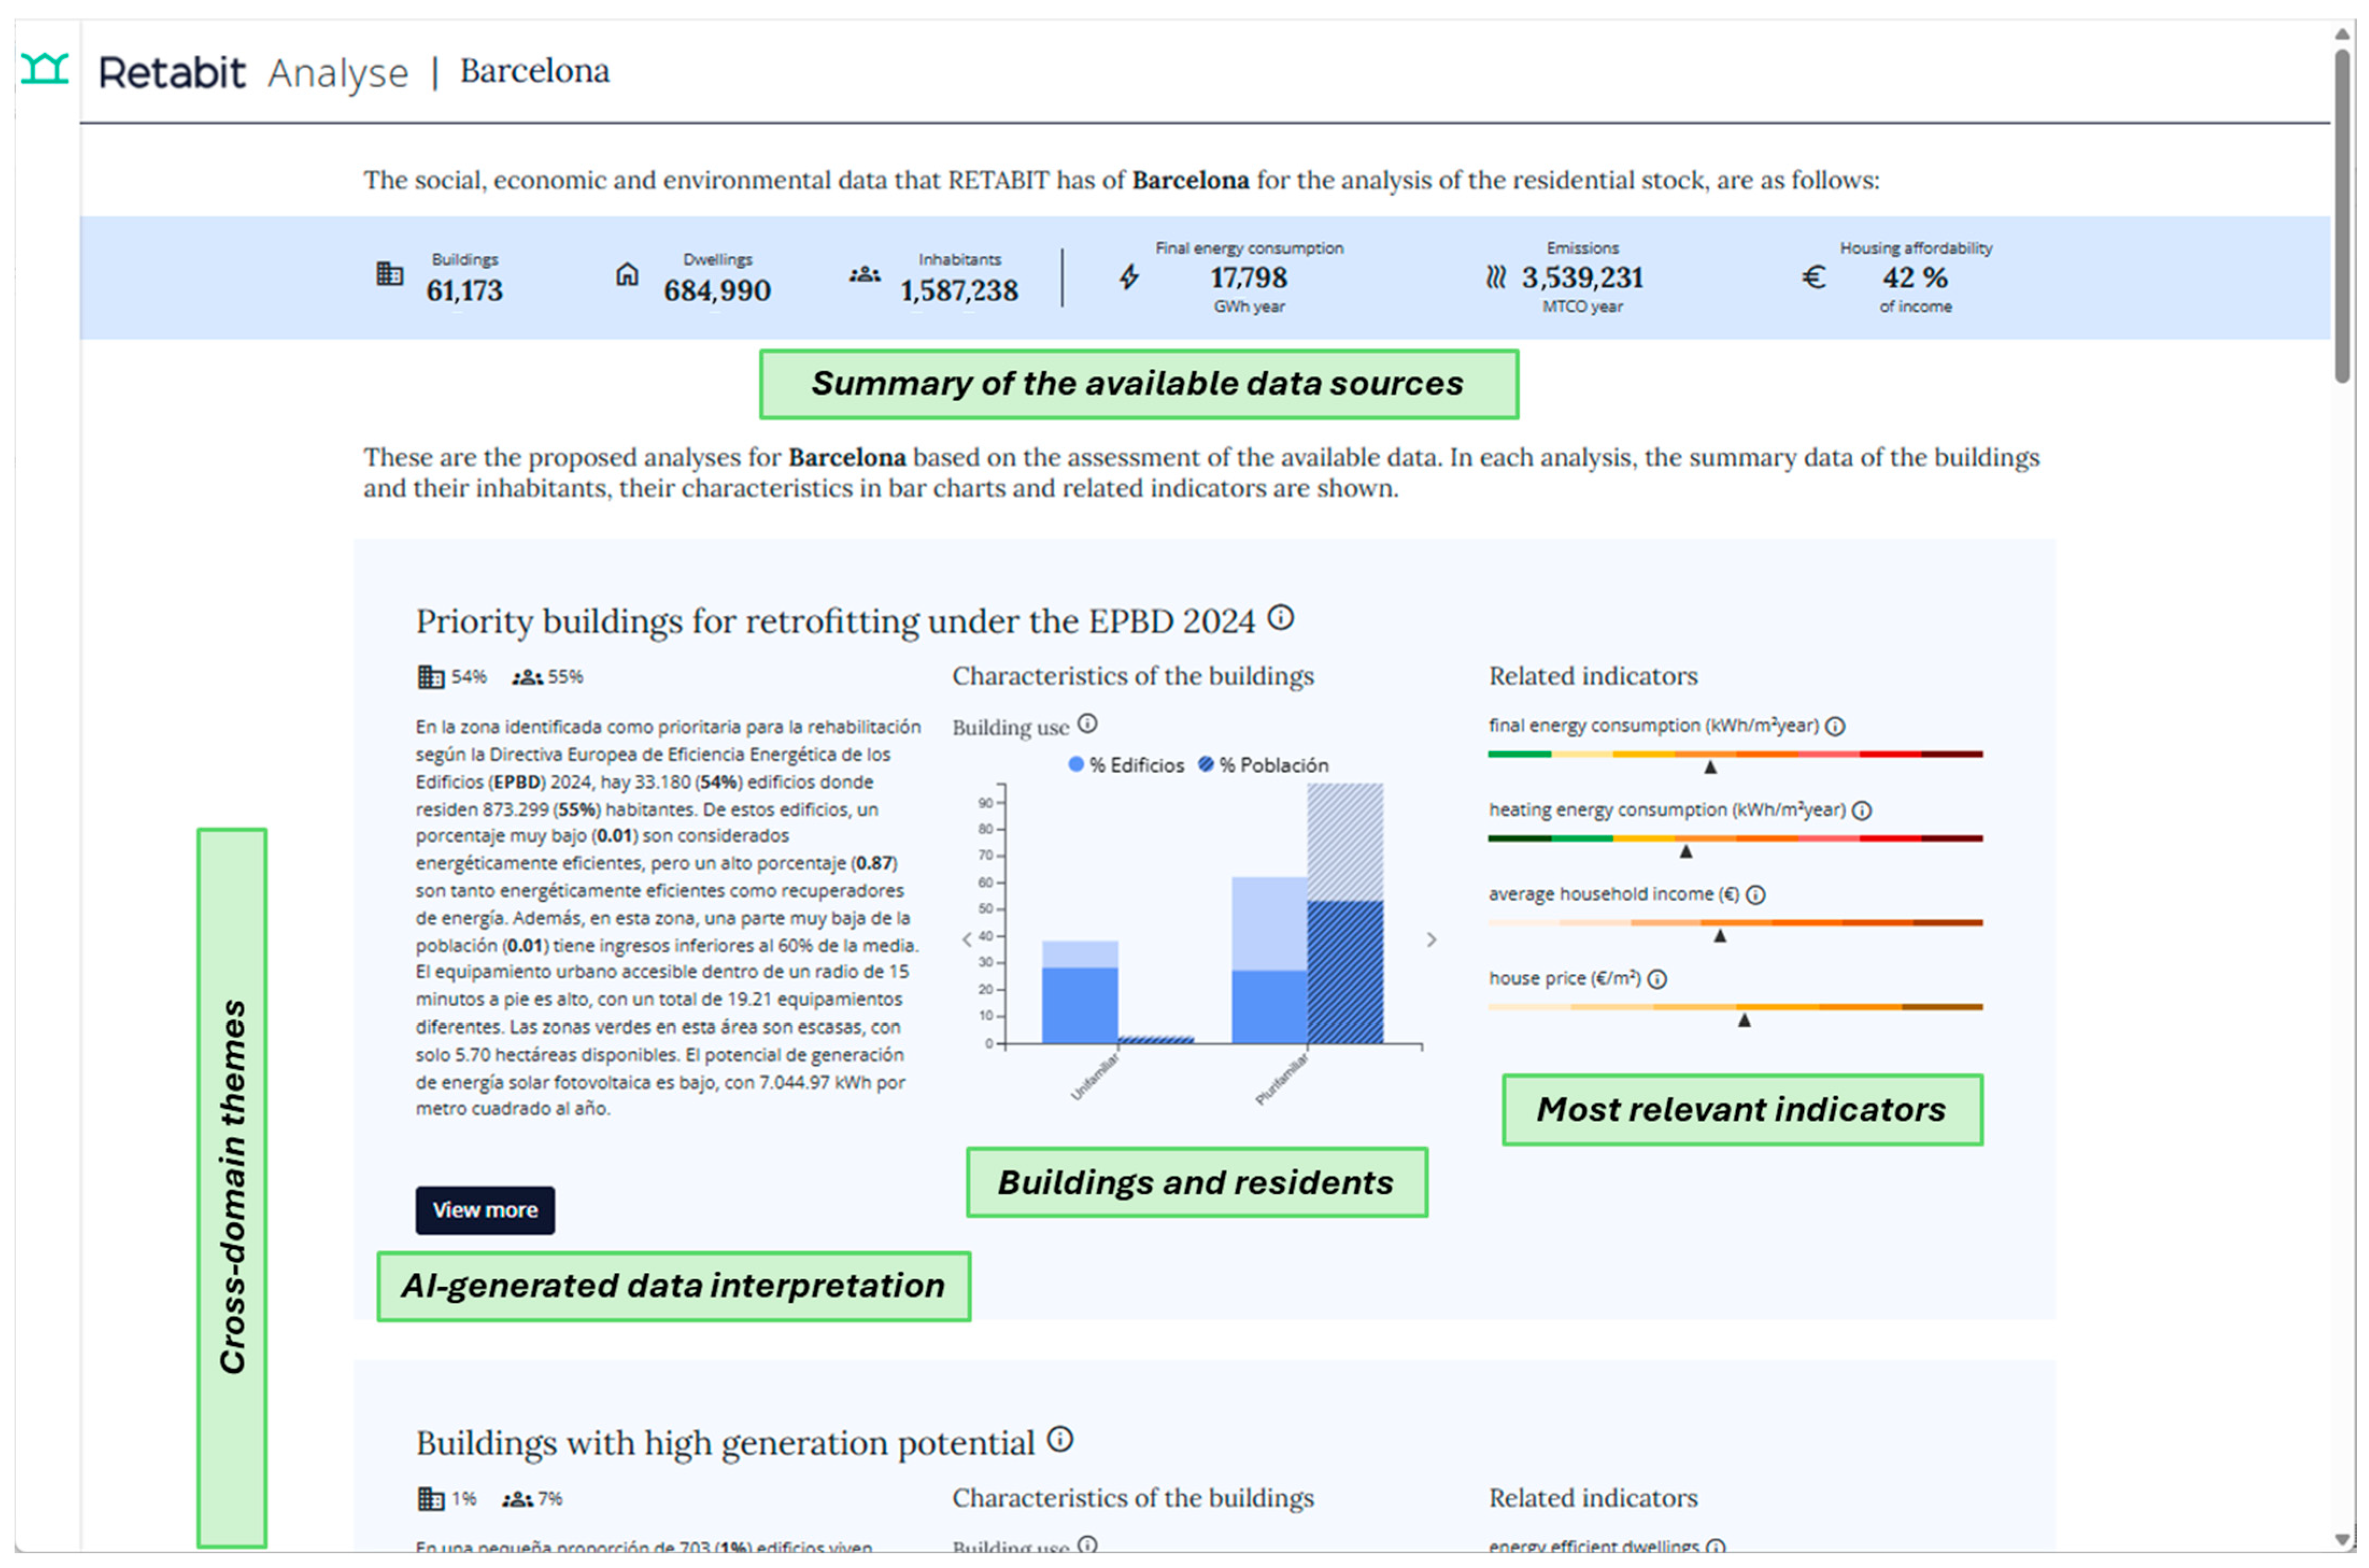
After selecting a municipality in Catalonia, the platform provides a summary of the available data sources, including the number of buildings and dwellings, residents, final energy consumption, carbon emissions, and housing affordability (Figure 3). In addition to the quantitative report, the platform presents a list of themes addressing various domains related to building rehabilitation from a holistic perspective (e.g., Economically vulnerable population and Unaffordable housing and lack of social equity). Each theme includes three types of information: an AI-generated interpretation of the data in natural language, a series of graphics illustrating the characteristics of buildings and residents, and a list with the three most relevant indicators, ordered according to their assigned importance.
On the overview dashboard, users can select a theme to explore all associated indicators (Figure 4). In this view, each indicator can be selected from the menu to examine its relevance to the building stock. The data are presented both on an interactive map and in a table format. Additionally, selecting a building on the map opens a secondary screen displaying a detailed summary of all available data compiled for that specific building (Figure 5).

4.3.2. Plan: Defining and Evaluating Building Renovation Projects

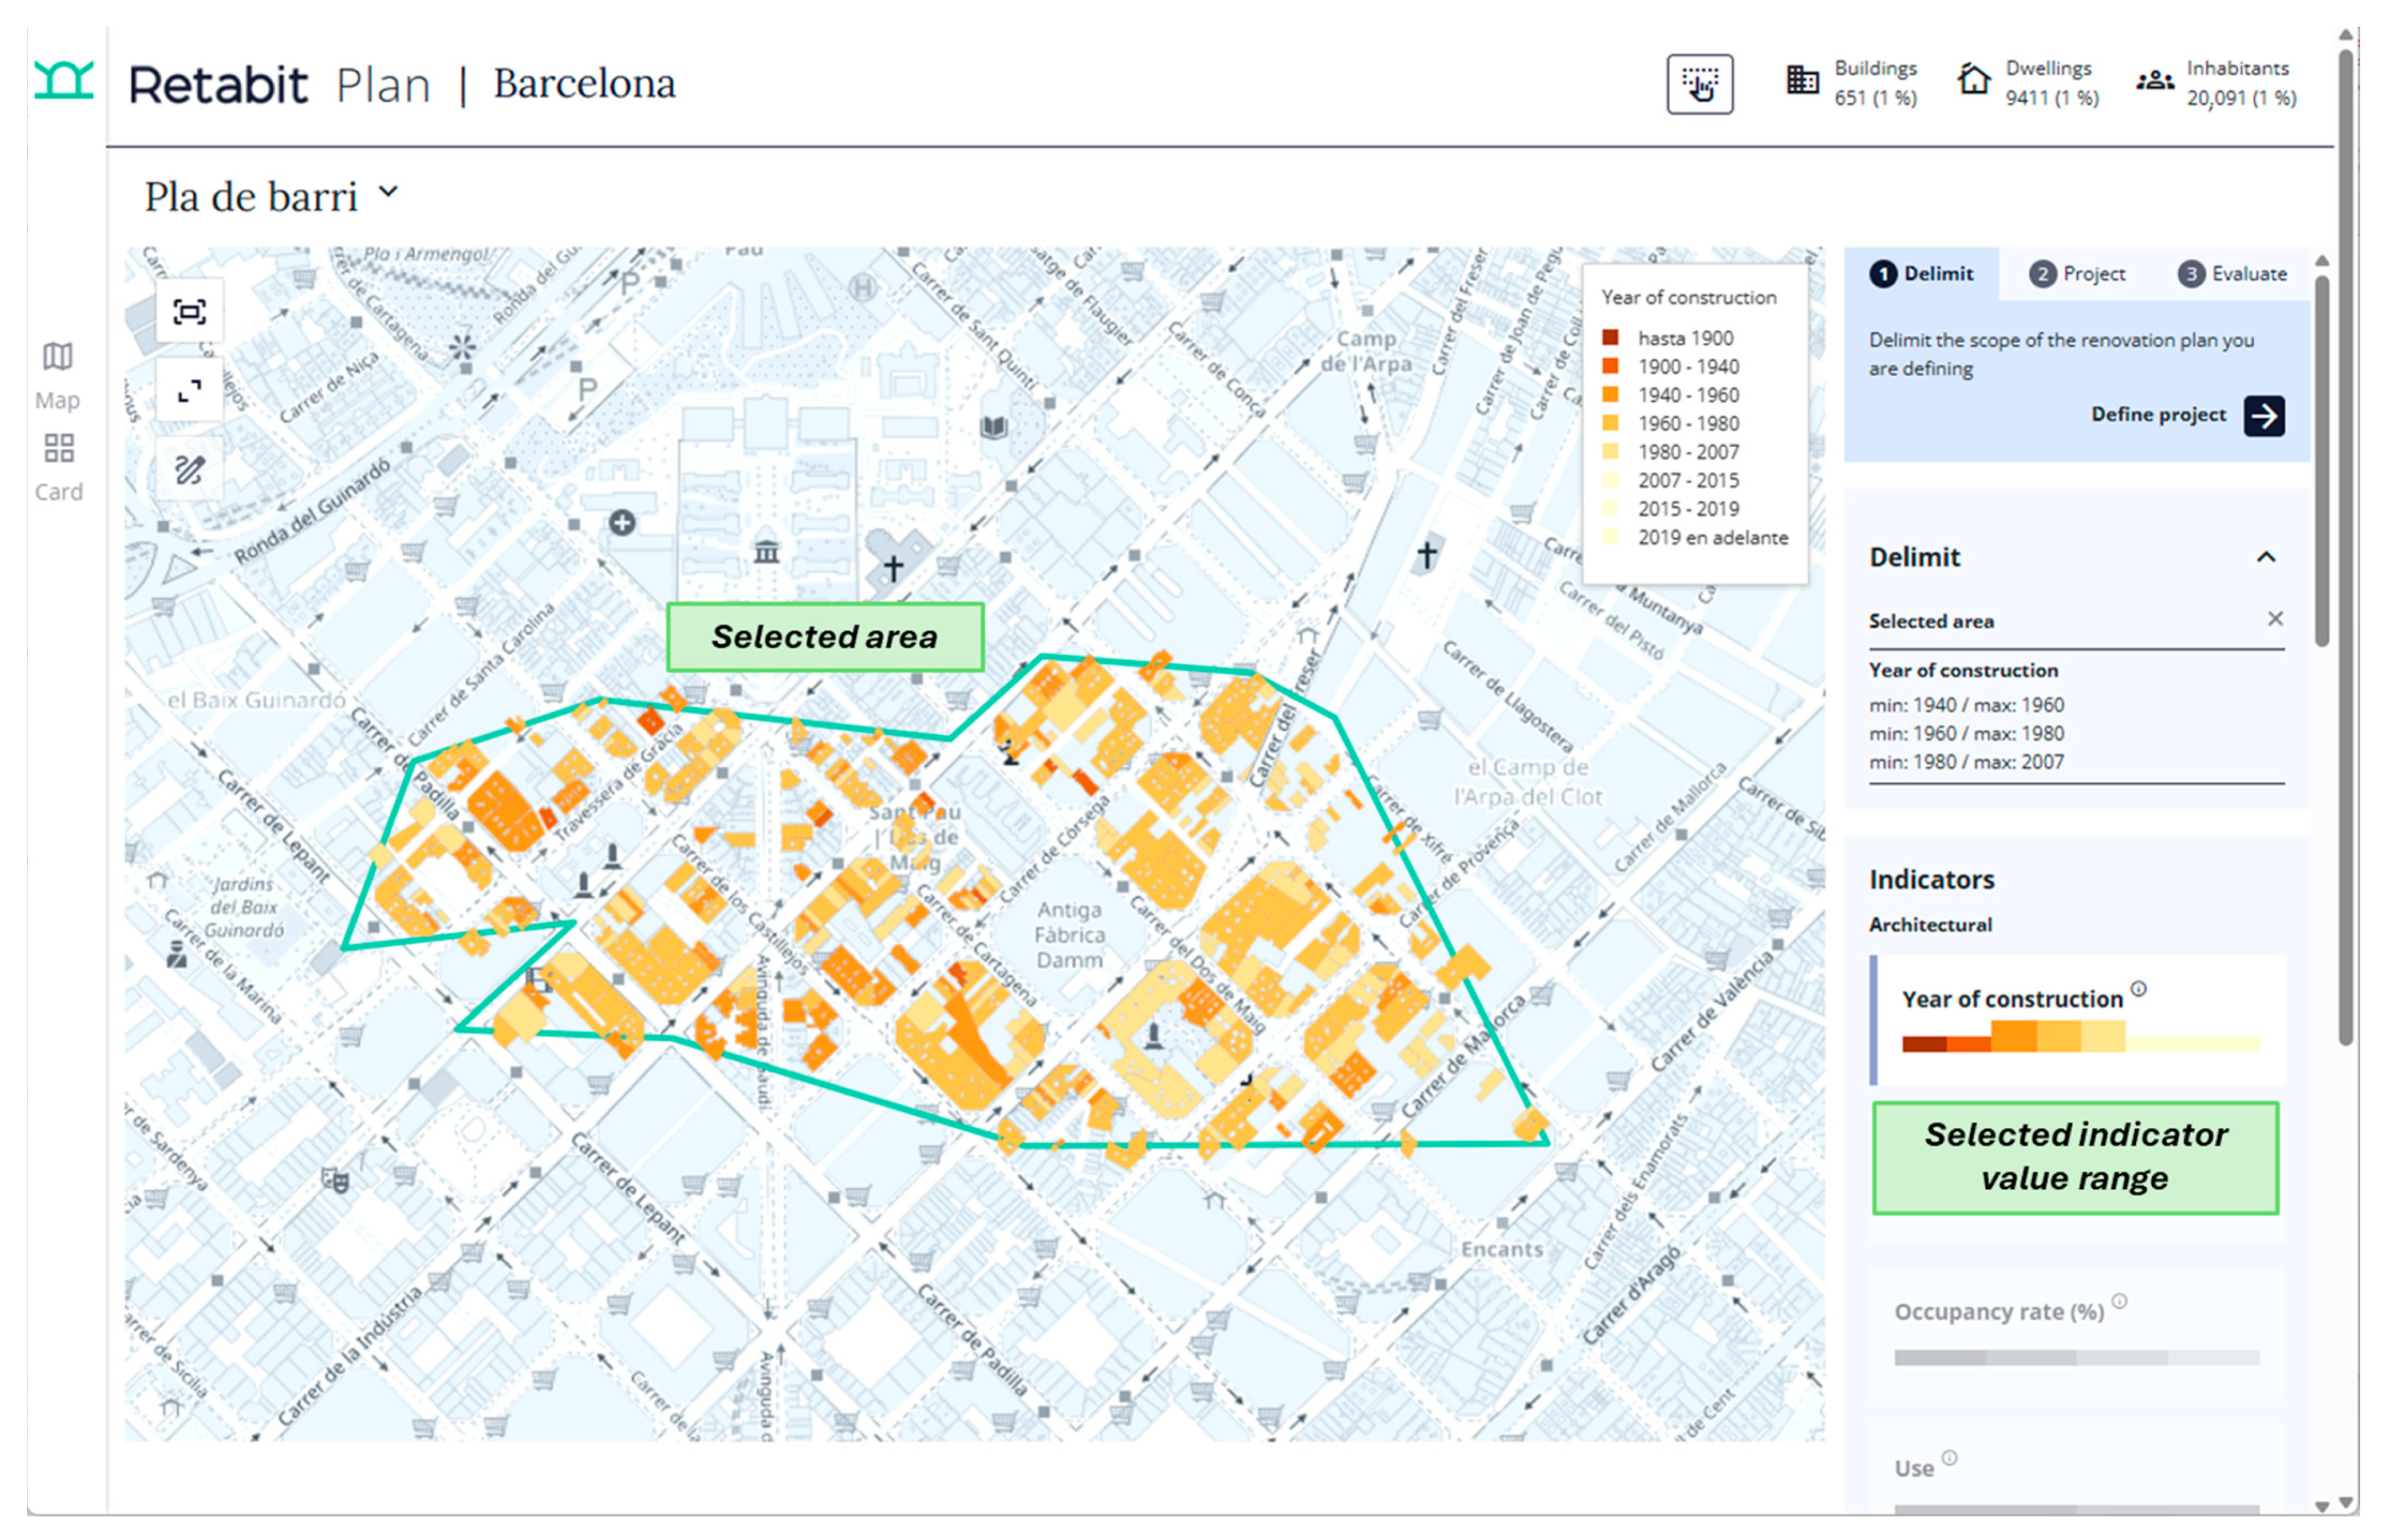
After registering on the platform to access Retabit Plan, users start by selecting a group of buildings to include in a renovation plan. This selection process is guided by a set of available indicators, which can be filtered using adjustable value ranges and, optionally, limited to a specific geographic area (see Figure 6). This allows users to tailor their selection based on criteria relevant to their specific objectives—for example, targeting buildings constructed within a certain period, located in areas with below-average rental prices, and exhibiting high potential for solar panel installation.
The selected buildings are grouped into archetypes, which are then used to simulate renovation measures (Figure 7). Based on these groupings, it is possible to assess final energy consumption, heating energy consumption, carbon emissions, and final energy costs for the buildings within each archetype, using the available data.
The archetypes were developed by the IREC research group through a harmonisation of existing national and local typology studies. Key reference sources included the Plan de Mejora Energética de la Ciudad de Barcelona (PMEB), at the local level [44]; the Comunitat Energètica project [45], the Catalan Housing Agency through the MARIE project [46], and studies by Ortiz et al. at the regional level [47] and Spain’s long-term renovation strategy (ERESEE) at the national level [48]. The definition process involved a comparative analysis of construction periods and building systems to ensure a standardised set of archetypes while accounting for temporal and regional variations. Ultimately, 12 archetypes were identified, based on three main criteria: year of construction, building use, and whether the building is detached or part of a block (Table 7).
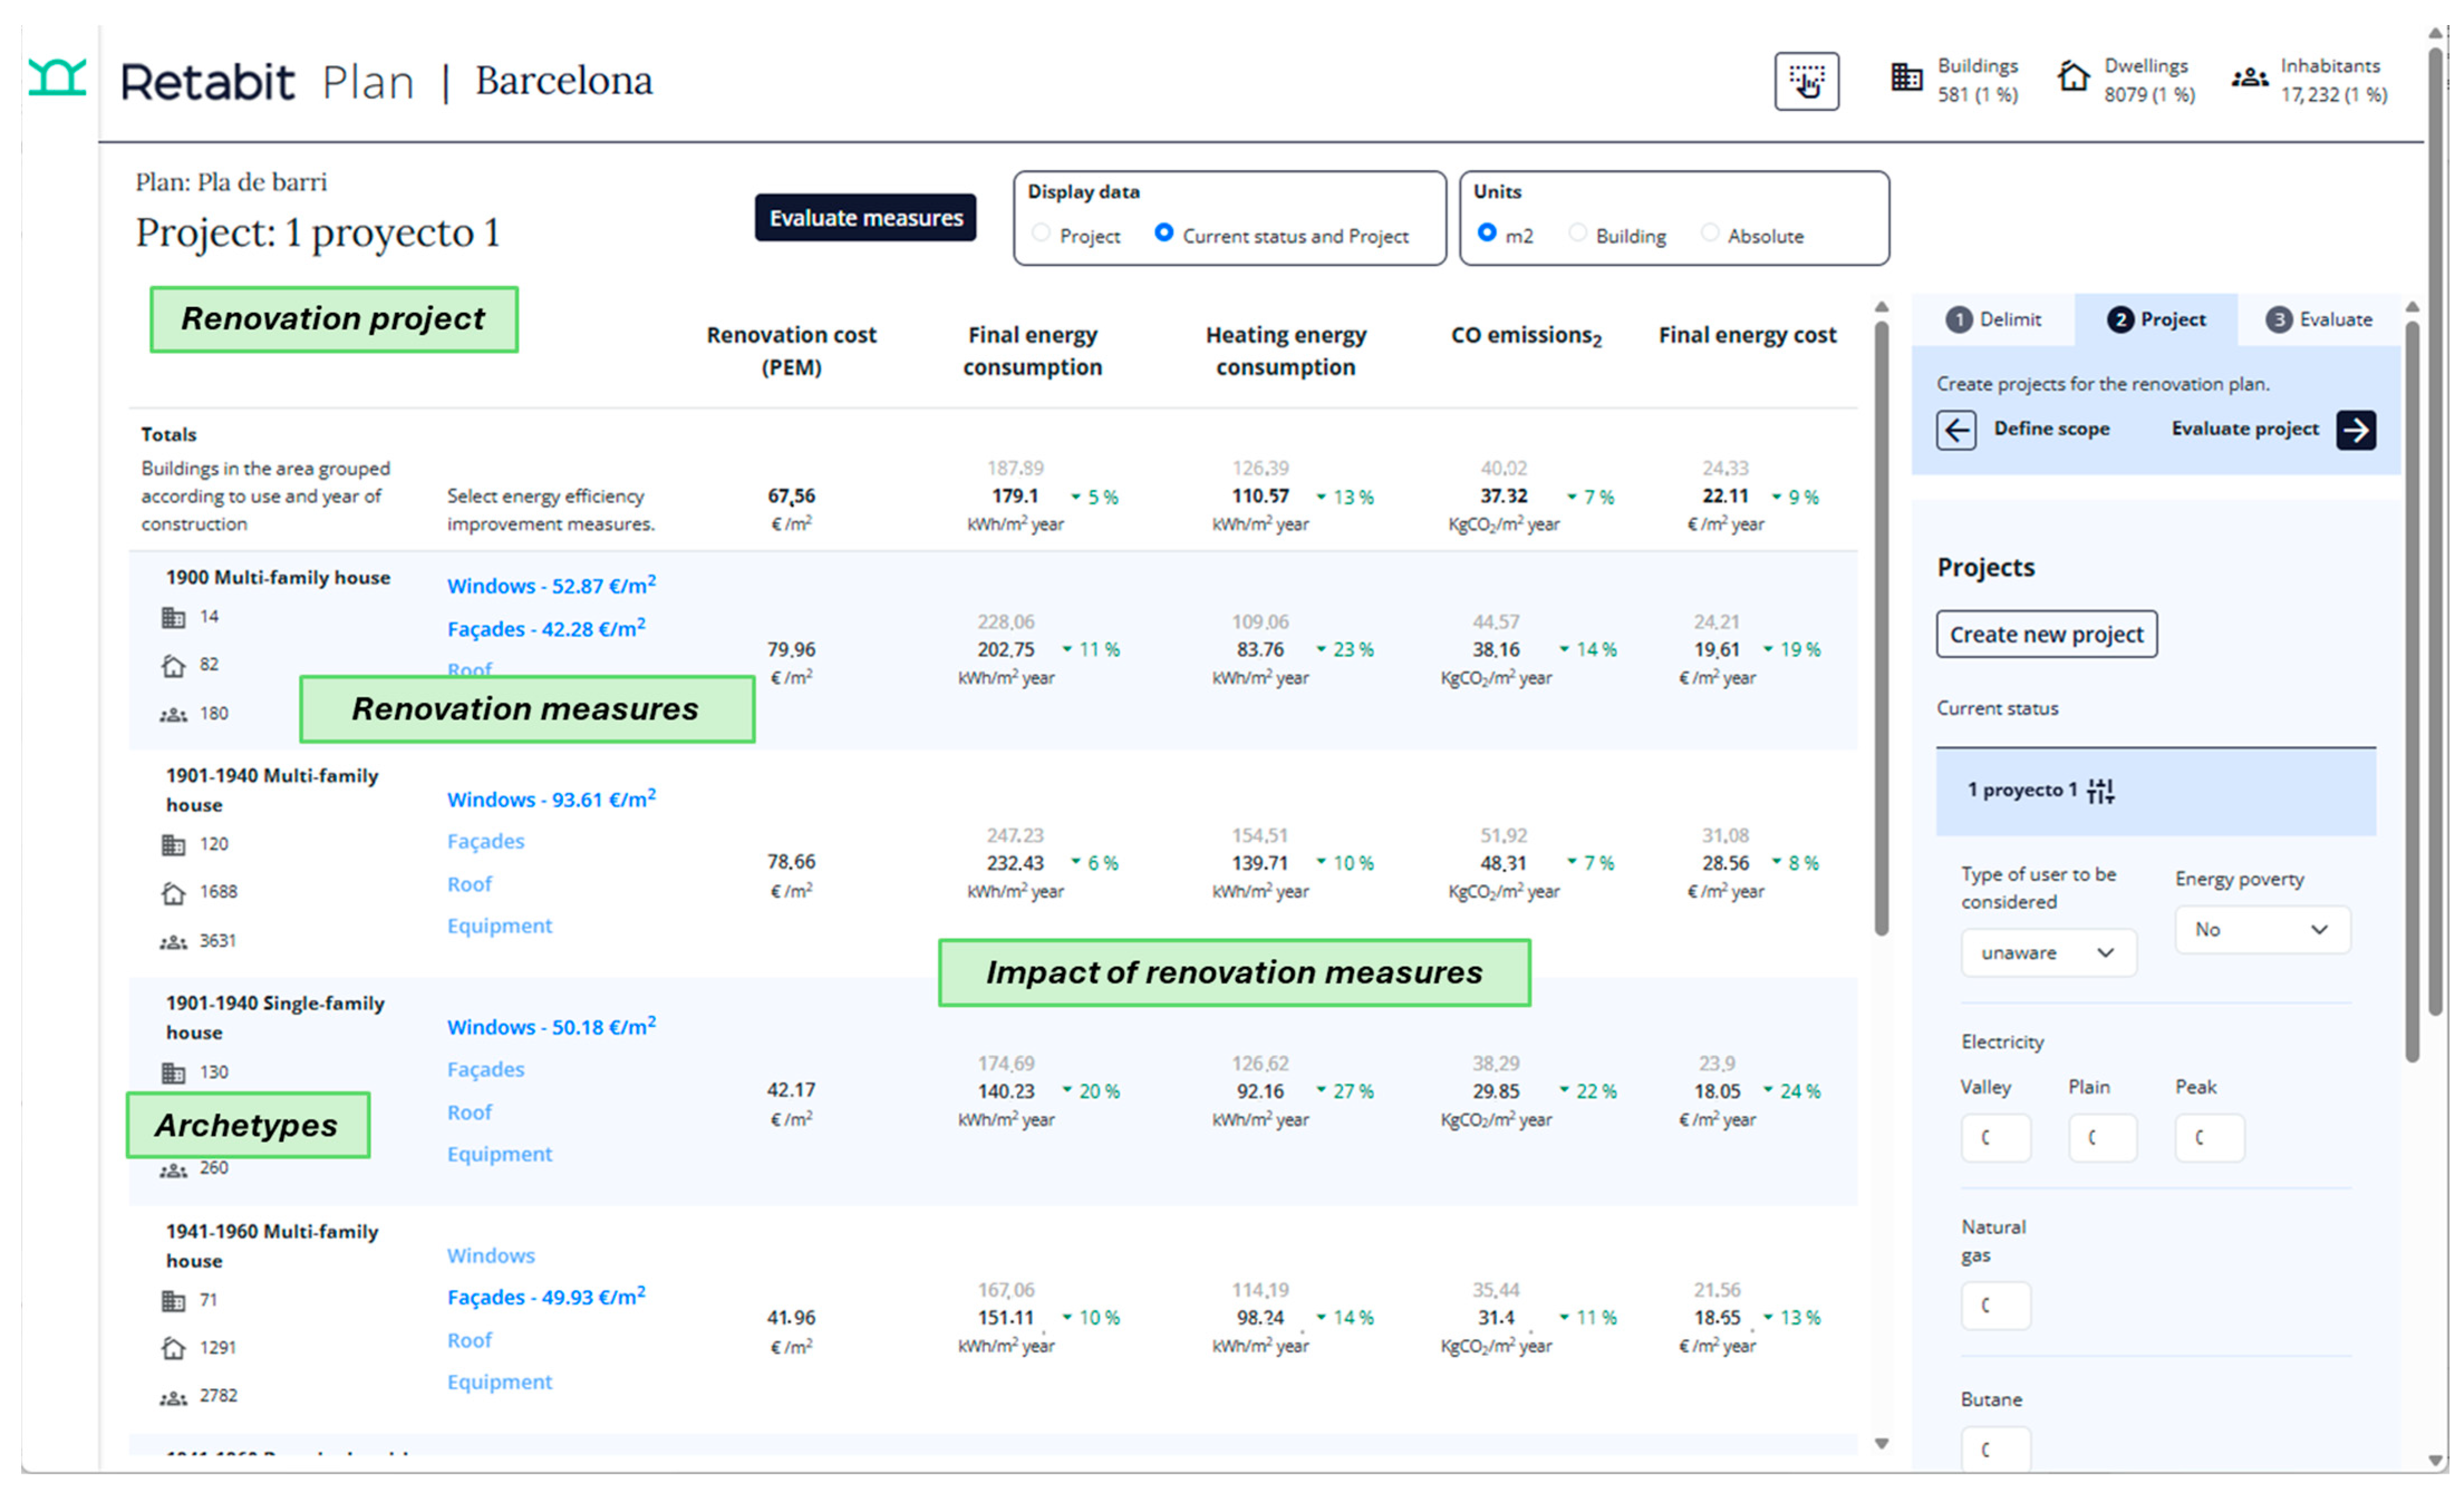
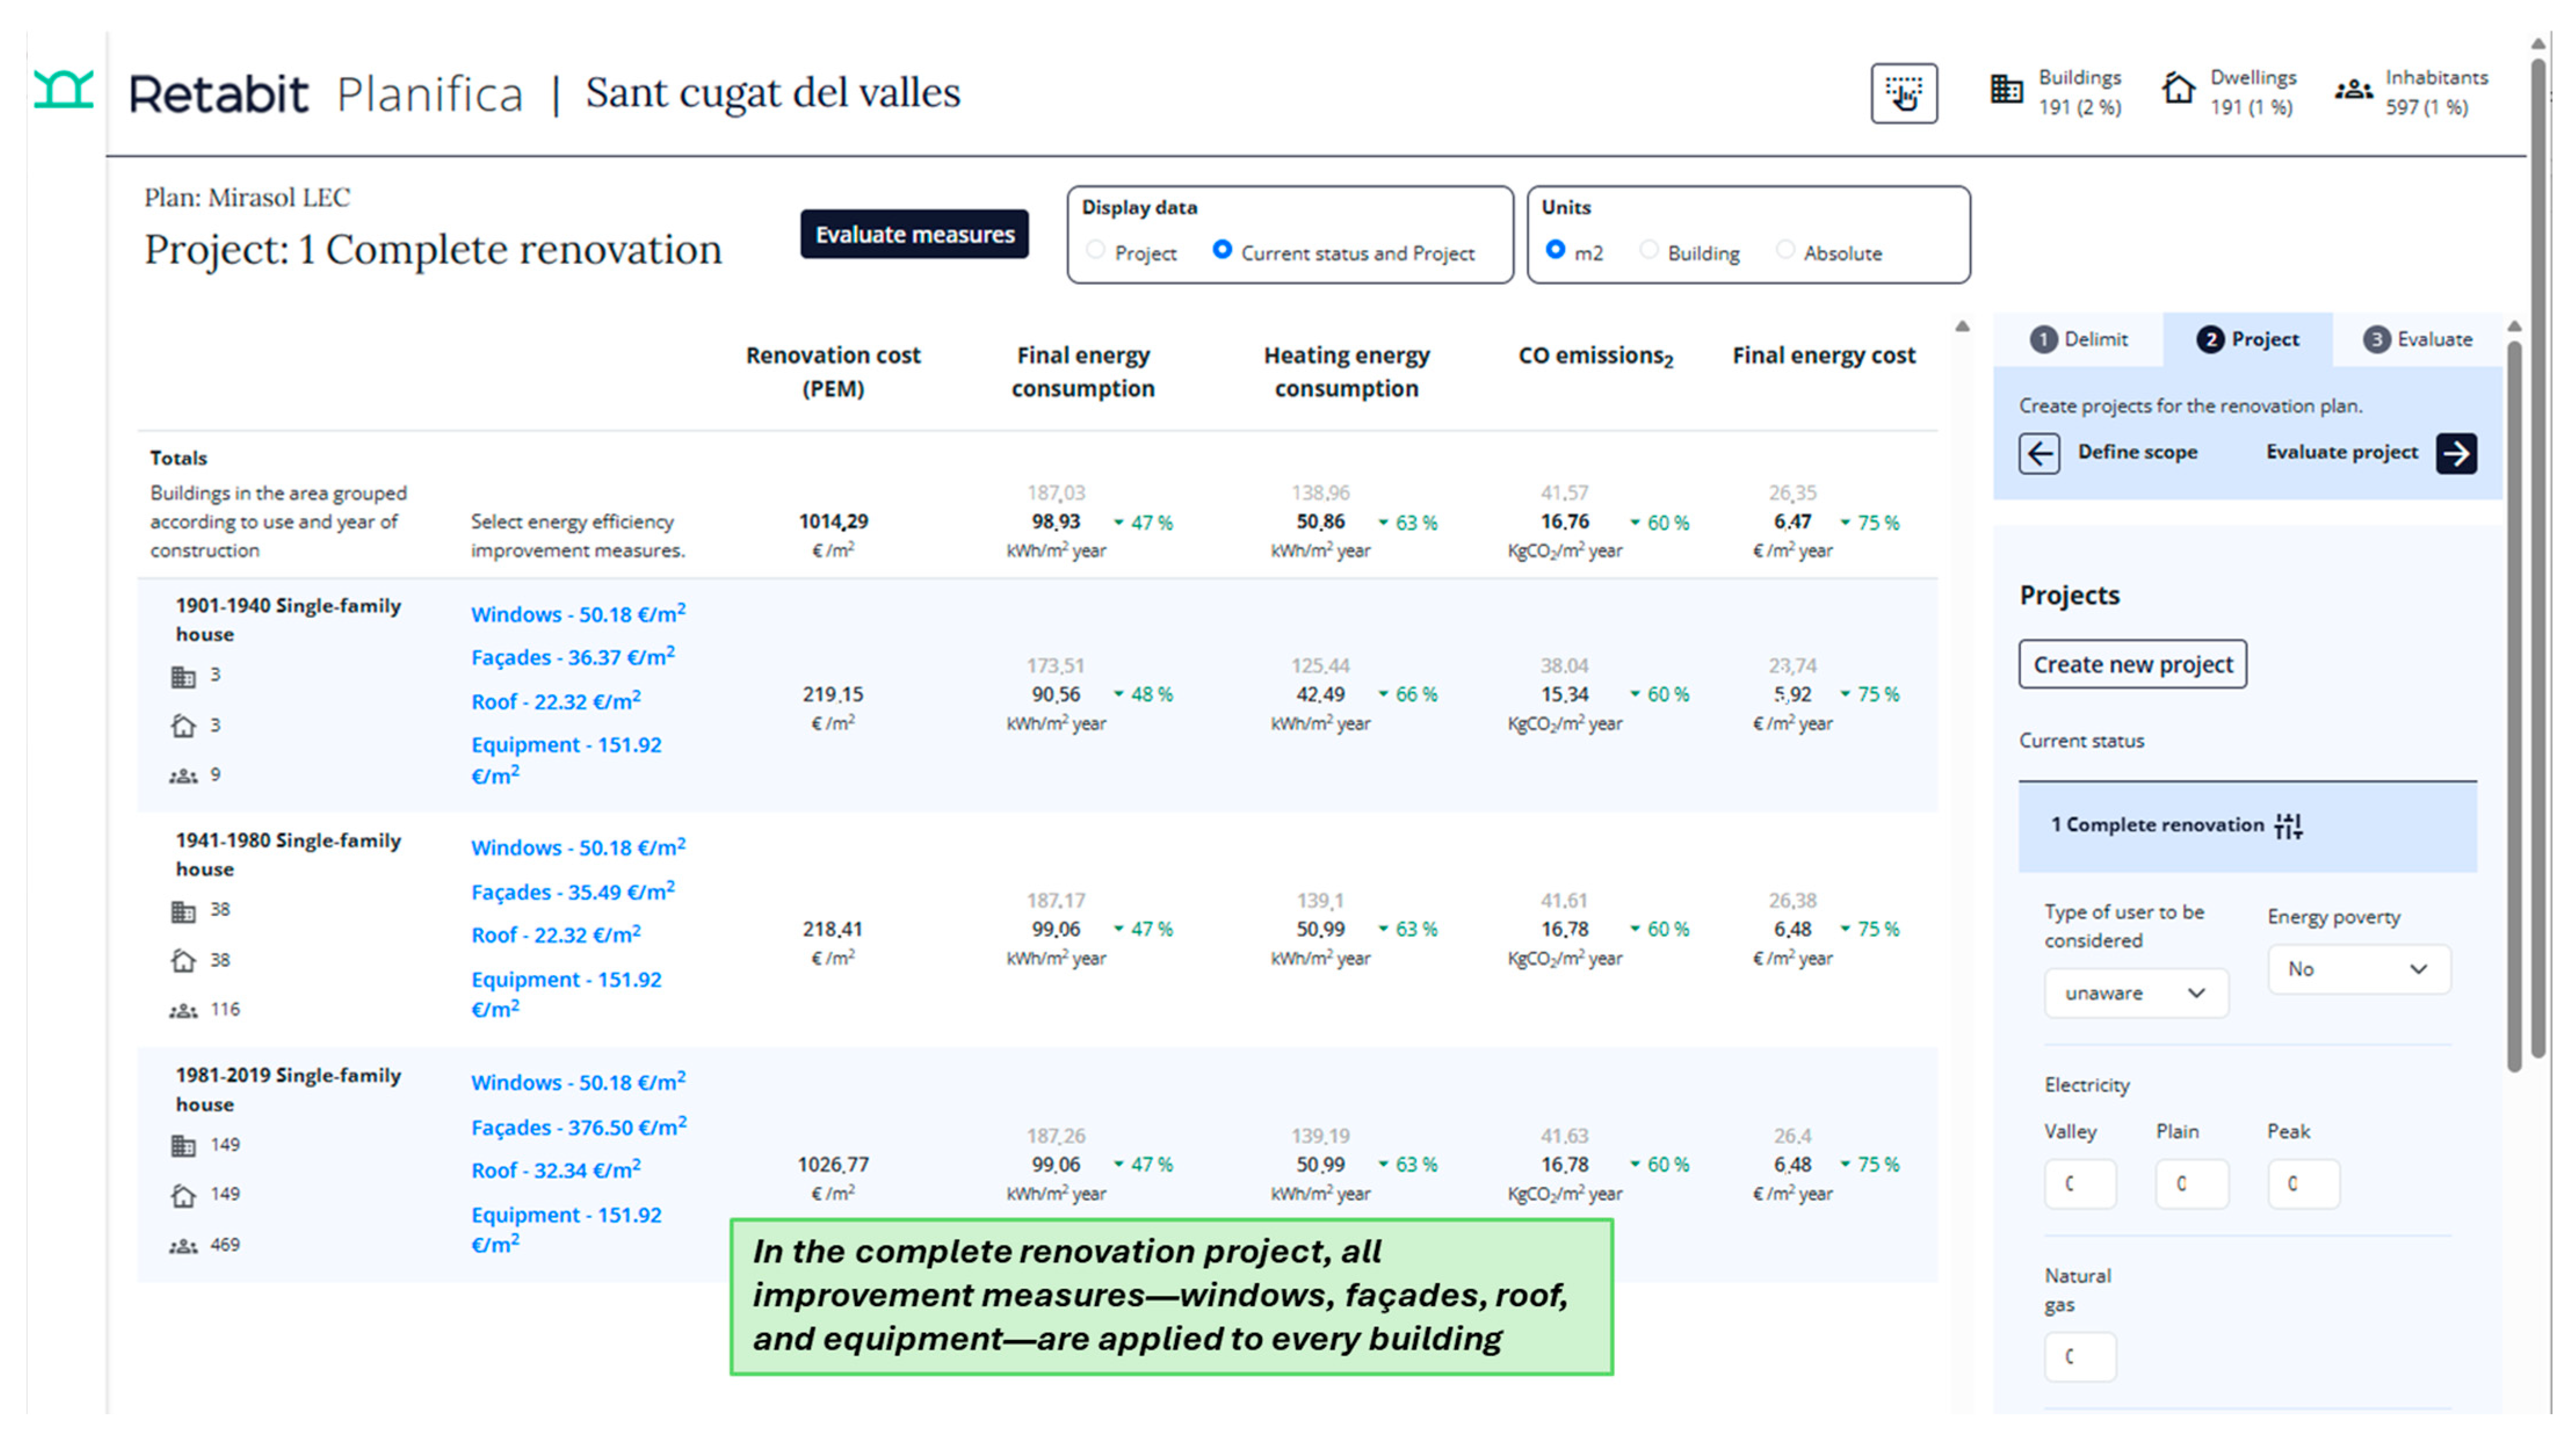
For each renovation plan, users can create and simulate multiple renovation projects (Figure 8). These projects apply predefined measures to specific building components, allowing users to assess the impact of different renovation strategies across the selected building group. A catalogue of 11 renovation measures is available, which can be applied to windows, façades, roofs, and technical systems. Each measure is automatically parameterised by the platform on the basis of the building archetype (Table 8). When a measure is selected, all associated attributes —such as insulation thickness, glazing build-up, or nominal plant capacity—are filled in using archetype-specific default values derived from regulatory and market data.
For each archetype, a detailed model was developed by IREC using two key tools: SketchUp Pro 2021, for creating 3D volumetric representations and conducting shadow analysis, and TRNSYS 18, for configuring the simulation framework and running the building performance simulations. A standardised building parameter template was applied to each archetype to ensure consistent input data. To ensure effective integration into the platform, the detailed models were transposed into simplified grey-box model versions. The workflow involves three main steps: first, calculating the theoretical R2C2 parameters of the grey-box model based on the building’s construction layers; second, identifying these parameters using results from the corresponding white-box model; and finally, generating building variations by adjusting the R2C2 parameters without altering the white-box model, modifying the 3D structure, or requiring recalibration (Mont et al., 2025) [49].
In sum, the Retabit platform integrates diverse data sources to offer a comprehensive, holistic understanding of the social, economic, and environmental dimensions of building rehabilitation. Instead of prescribing specific renovation actions, it provides valuable insights and guiding factors that stakeholders can use to develop well-informed, context-sensitive strategies aligned with their priorities, constraints, and long-term goals. Through its analysis and simulation tools, the platform enables envisioning and evaluating future scenarios, generating actionable outcomes that further support decision-making for targeted renovation projects.

5. Platform Development and Implementation: Insights from Users and Use Case Applications

During the three-year development of the platform, from 2021 to 2024, representatives from local administrations and organisations involved in building rehabilitation were actively involved to discuss its functionalities and test the prototype at various stages, including the municipality of Sant Cugat del Vallès, the municipality of Rubí, the Fundació Europace, the Agència de la Energia de Barcelona, and the Diputació de Barcelona.
At key stages in the process, the participating organisations were tasked with evaluating the platform’s features. In their feedback, they emphasised the need for context-adaptive visualisations, recommending that dashboards and explanatory texts dynamically adjust based on the user’s analytical focus to enhance clarity and relevance. Data credibility and transparency were also considered critical. Respondents called for detailed metadata accompanying each indicator—covering data sources, methodology, update frequency, spatial resolution, and granularity.
Several gaps and areas for refinement in the indicators were identified. Suggestions included incorporating solar energy potential, providing more detailed breakdowns of energy end-uses, and adjusting the income threshold for identifying vulnerability to better align with local standards.
Finally, the need for seamless integration with local data was underscored. It was recommended that Retabit support the export of open-source datasets in a structured Excel template, which municipalities could enrich with their own (non-public) records. This would enable automatic reconciliation between data sources and empower local technicians to continue their analyses using familiar tools—without ever exposing sensitive citizen information.

5.1. Enabling a Local Energy Community in the Mirasol Neighbourhood

To evaluate the capabilities of the final platform version—both in analysing the building stock using multidimensional indicators and in assessing potential renovation measures—a reform plan was developed in the municipality of Sant Cugat del Vallès. This plan focused on establishing a local energy community (LEC) in the Mirasol neighbourhood.
An LEC is a cooperative framework through which neighbours, businesses, and public bodies collectively generate, share, and manage renewable electricity, typically from rooftop solar, so that the financial savings and environmental benefits stay within the community itself. Members can further amplify these benefits by undertaking building-renovation measures that cut energy demand, because lower consumption lets a greater share of the locally produced power meet on-site needs while freeing up more surplus for vulnerable households. The LEC’s integrated approach to local renewable energy generation and sharing, combined with its renovation potential, offers a real-world context for Retabit to support energy efficiency, optimise self-consumption, and promote equitable energy access.
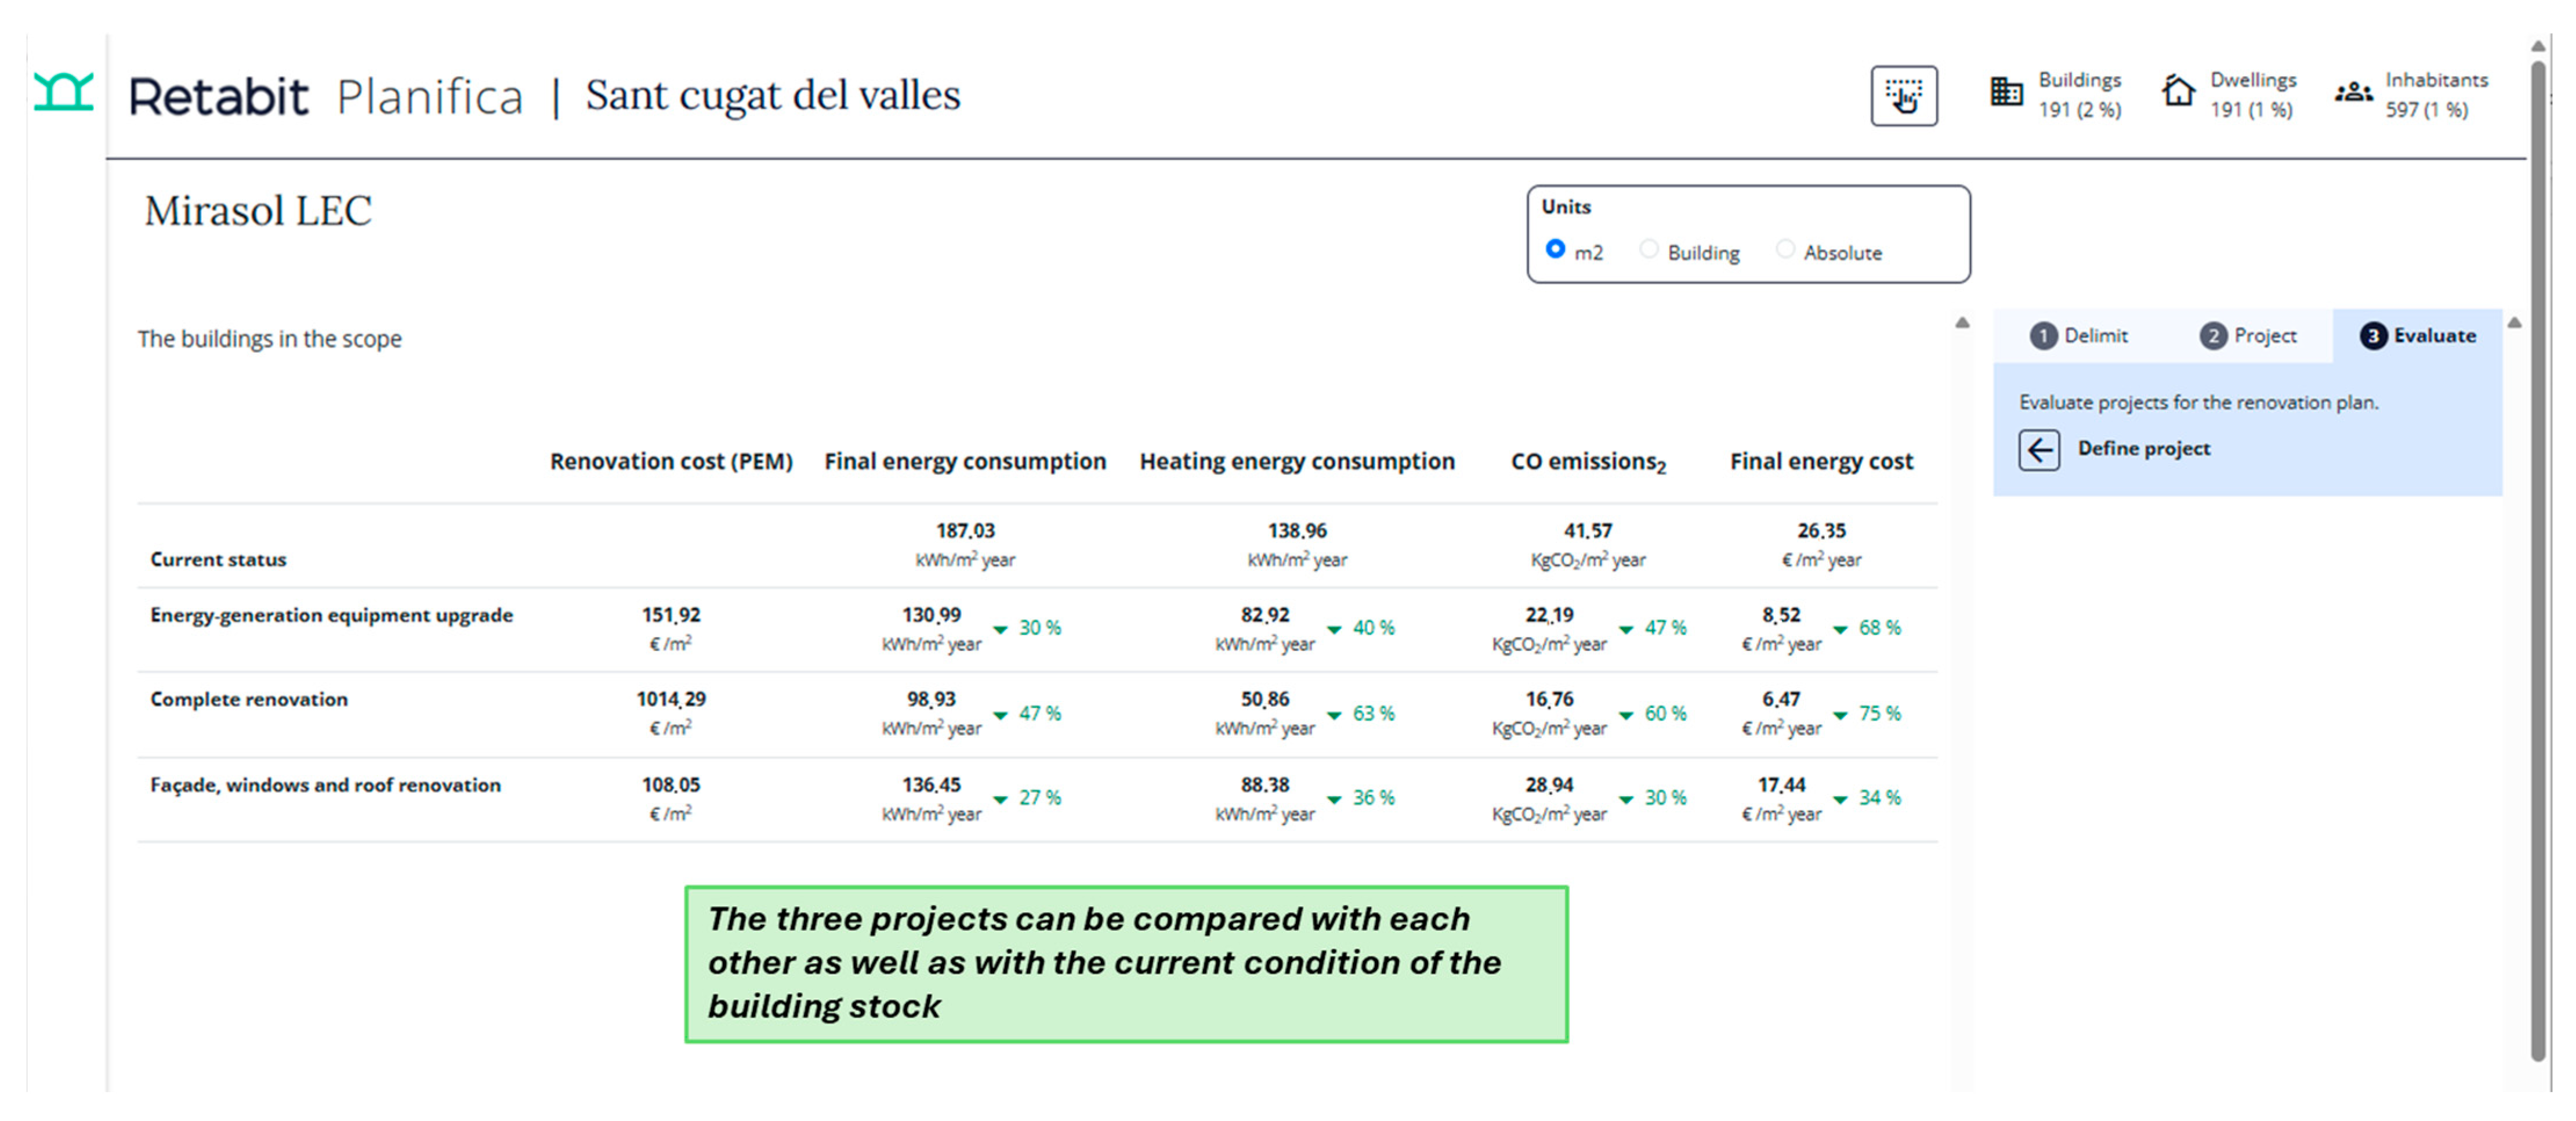
The first task was to use the Retabit Analyse to identify buildings within a two-kilometre radius of the neighbourhood civic centre that already had photovoltaic (PV) systems and could supply surplus electricity to the shared local energy network. The second step focused on identifying buildings that could benefit from this locally generated energy—particularly homes occupied by vulnerable households or buildings with limited potential for rooftop solar installations. At this stage the Retabit Plan module can also be invoked to quantify the renovation implications for these prospective consumer buildings, providing detailed estimates of investment cost, annual energy-bill savings, CO2-emission reductions, and expected pay-back times.
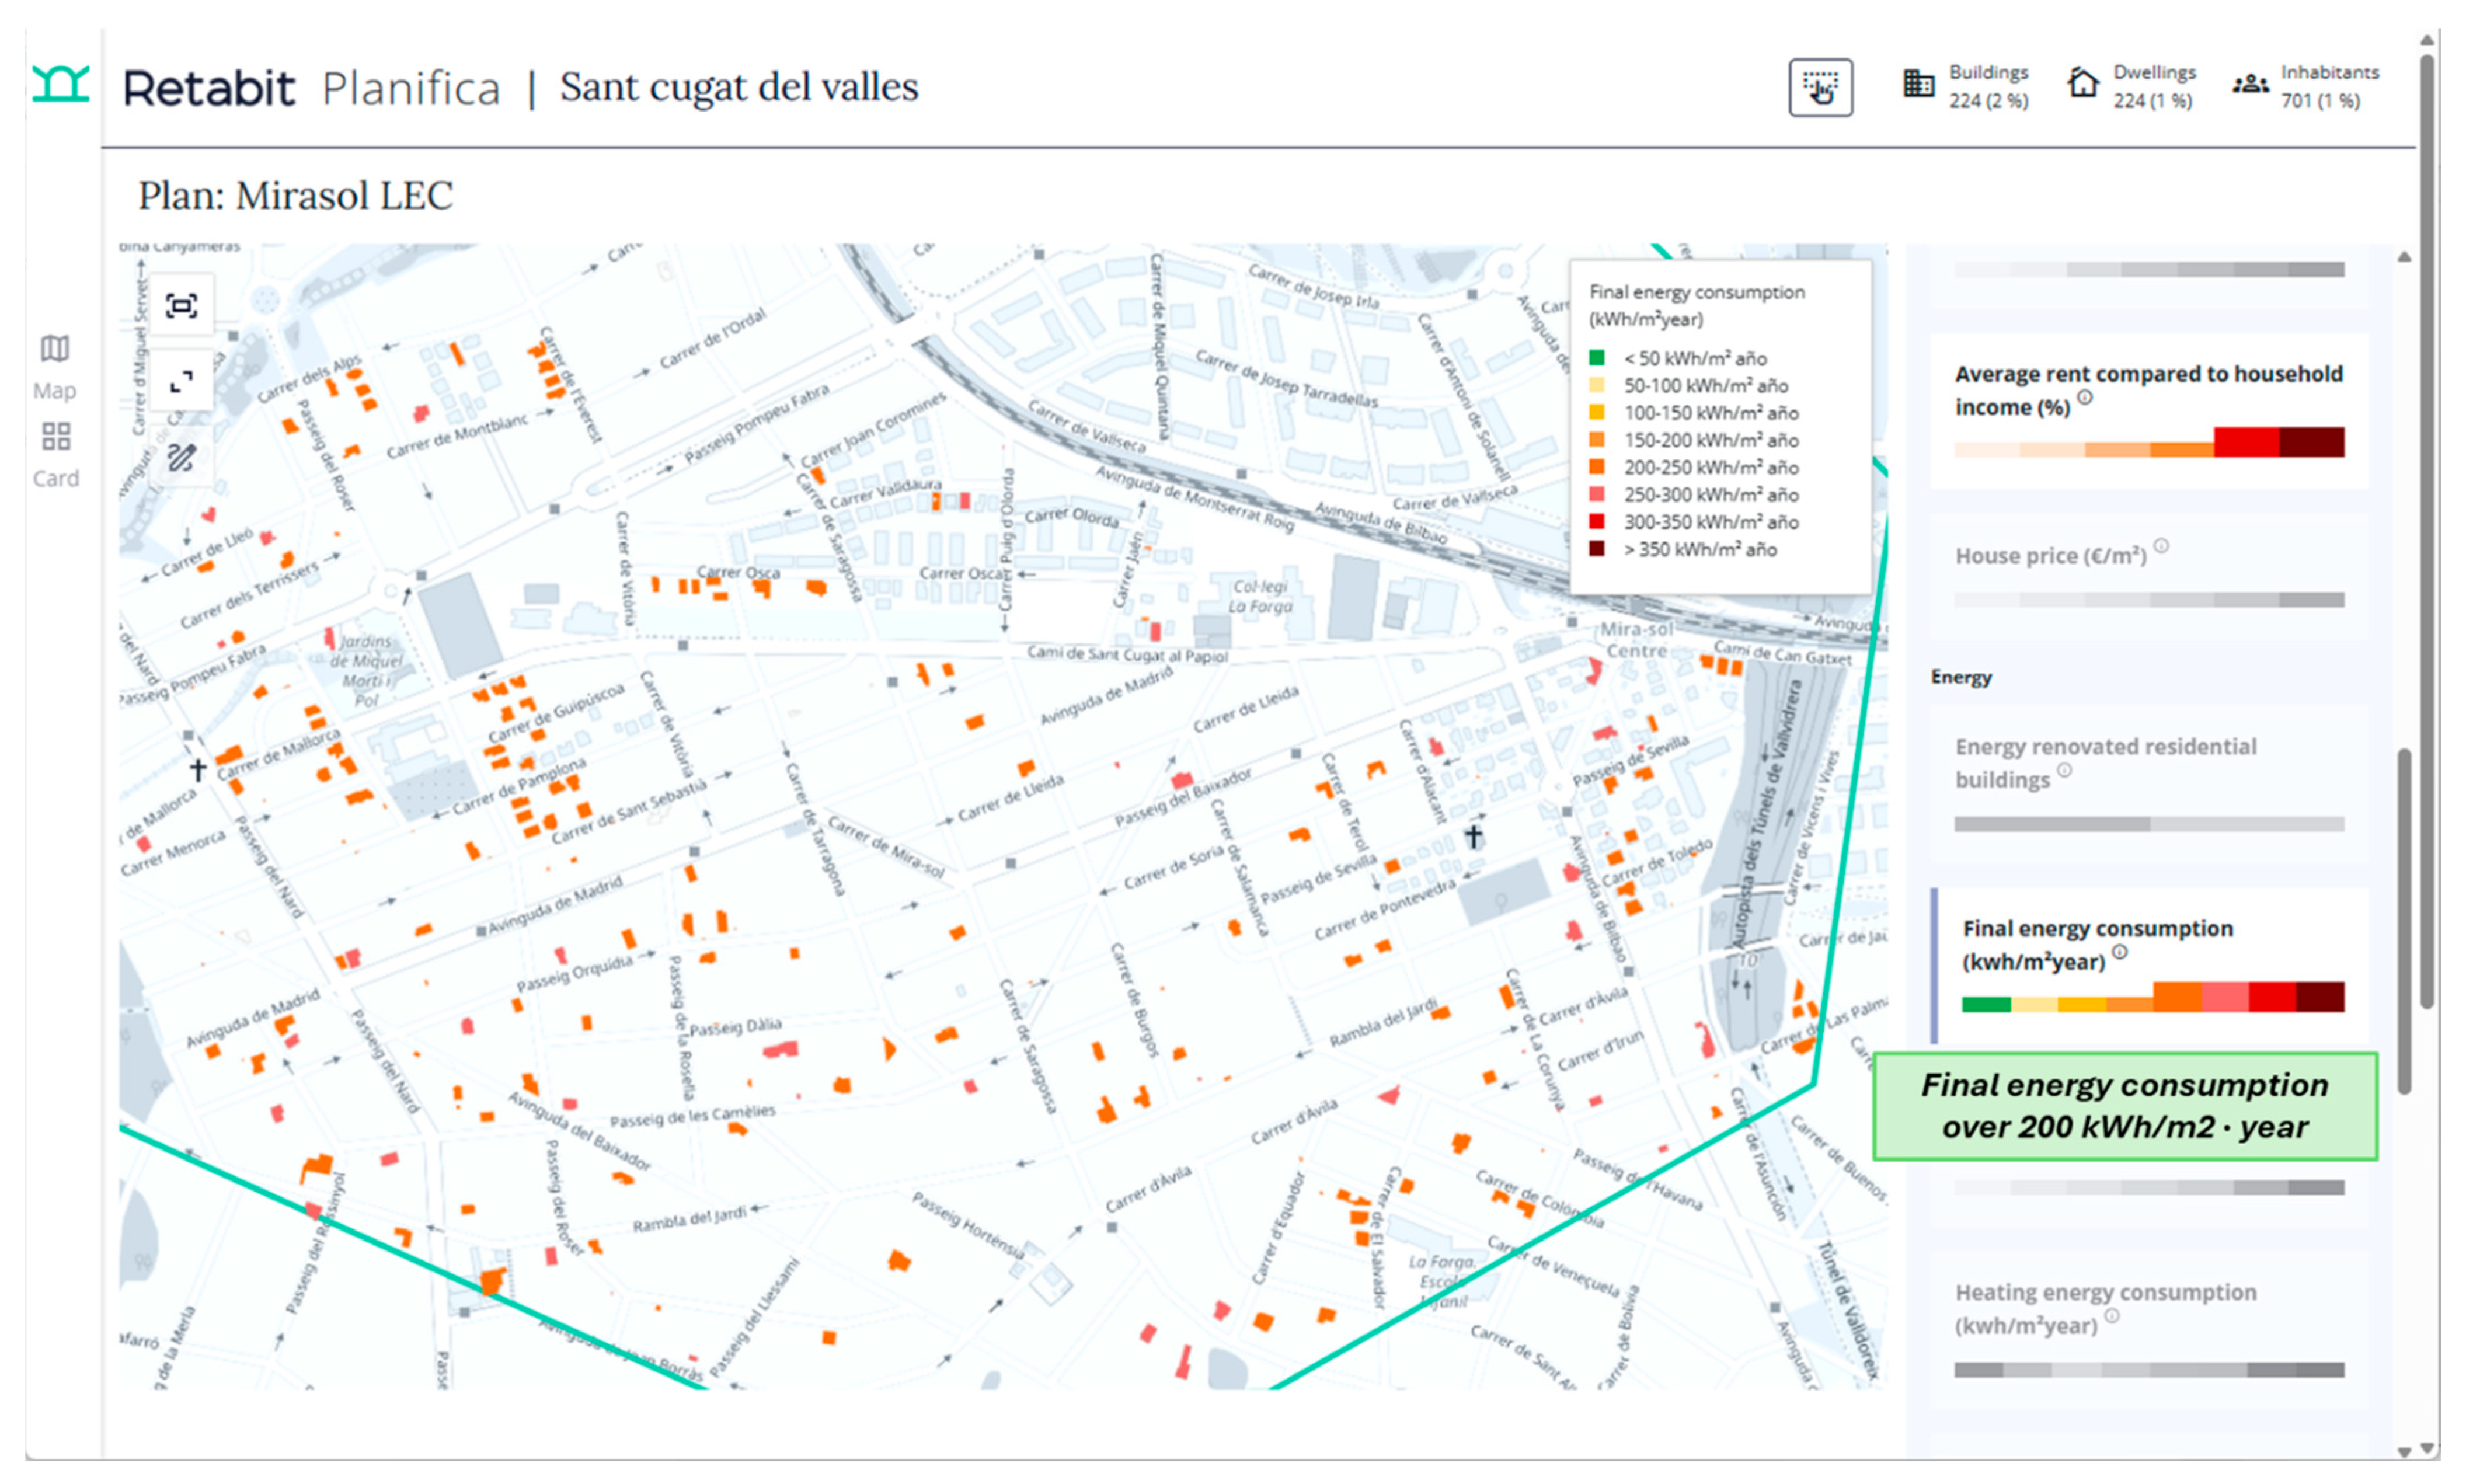
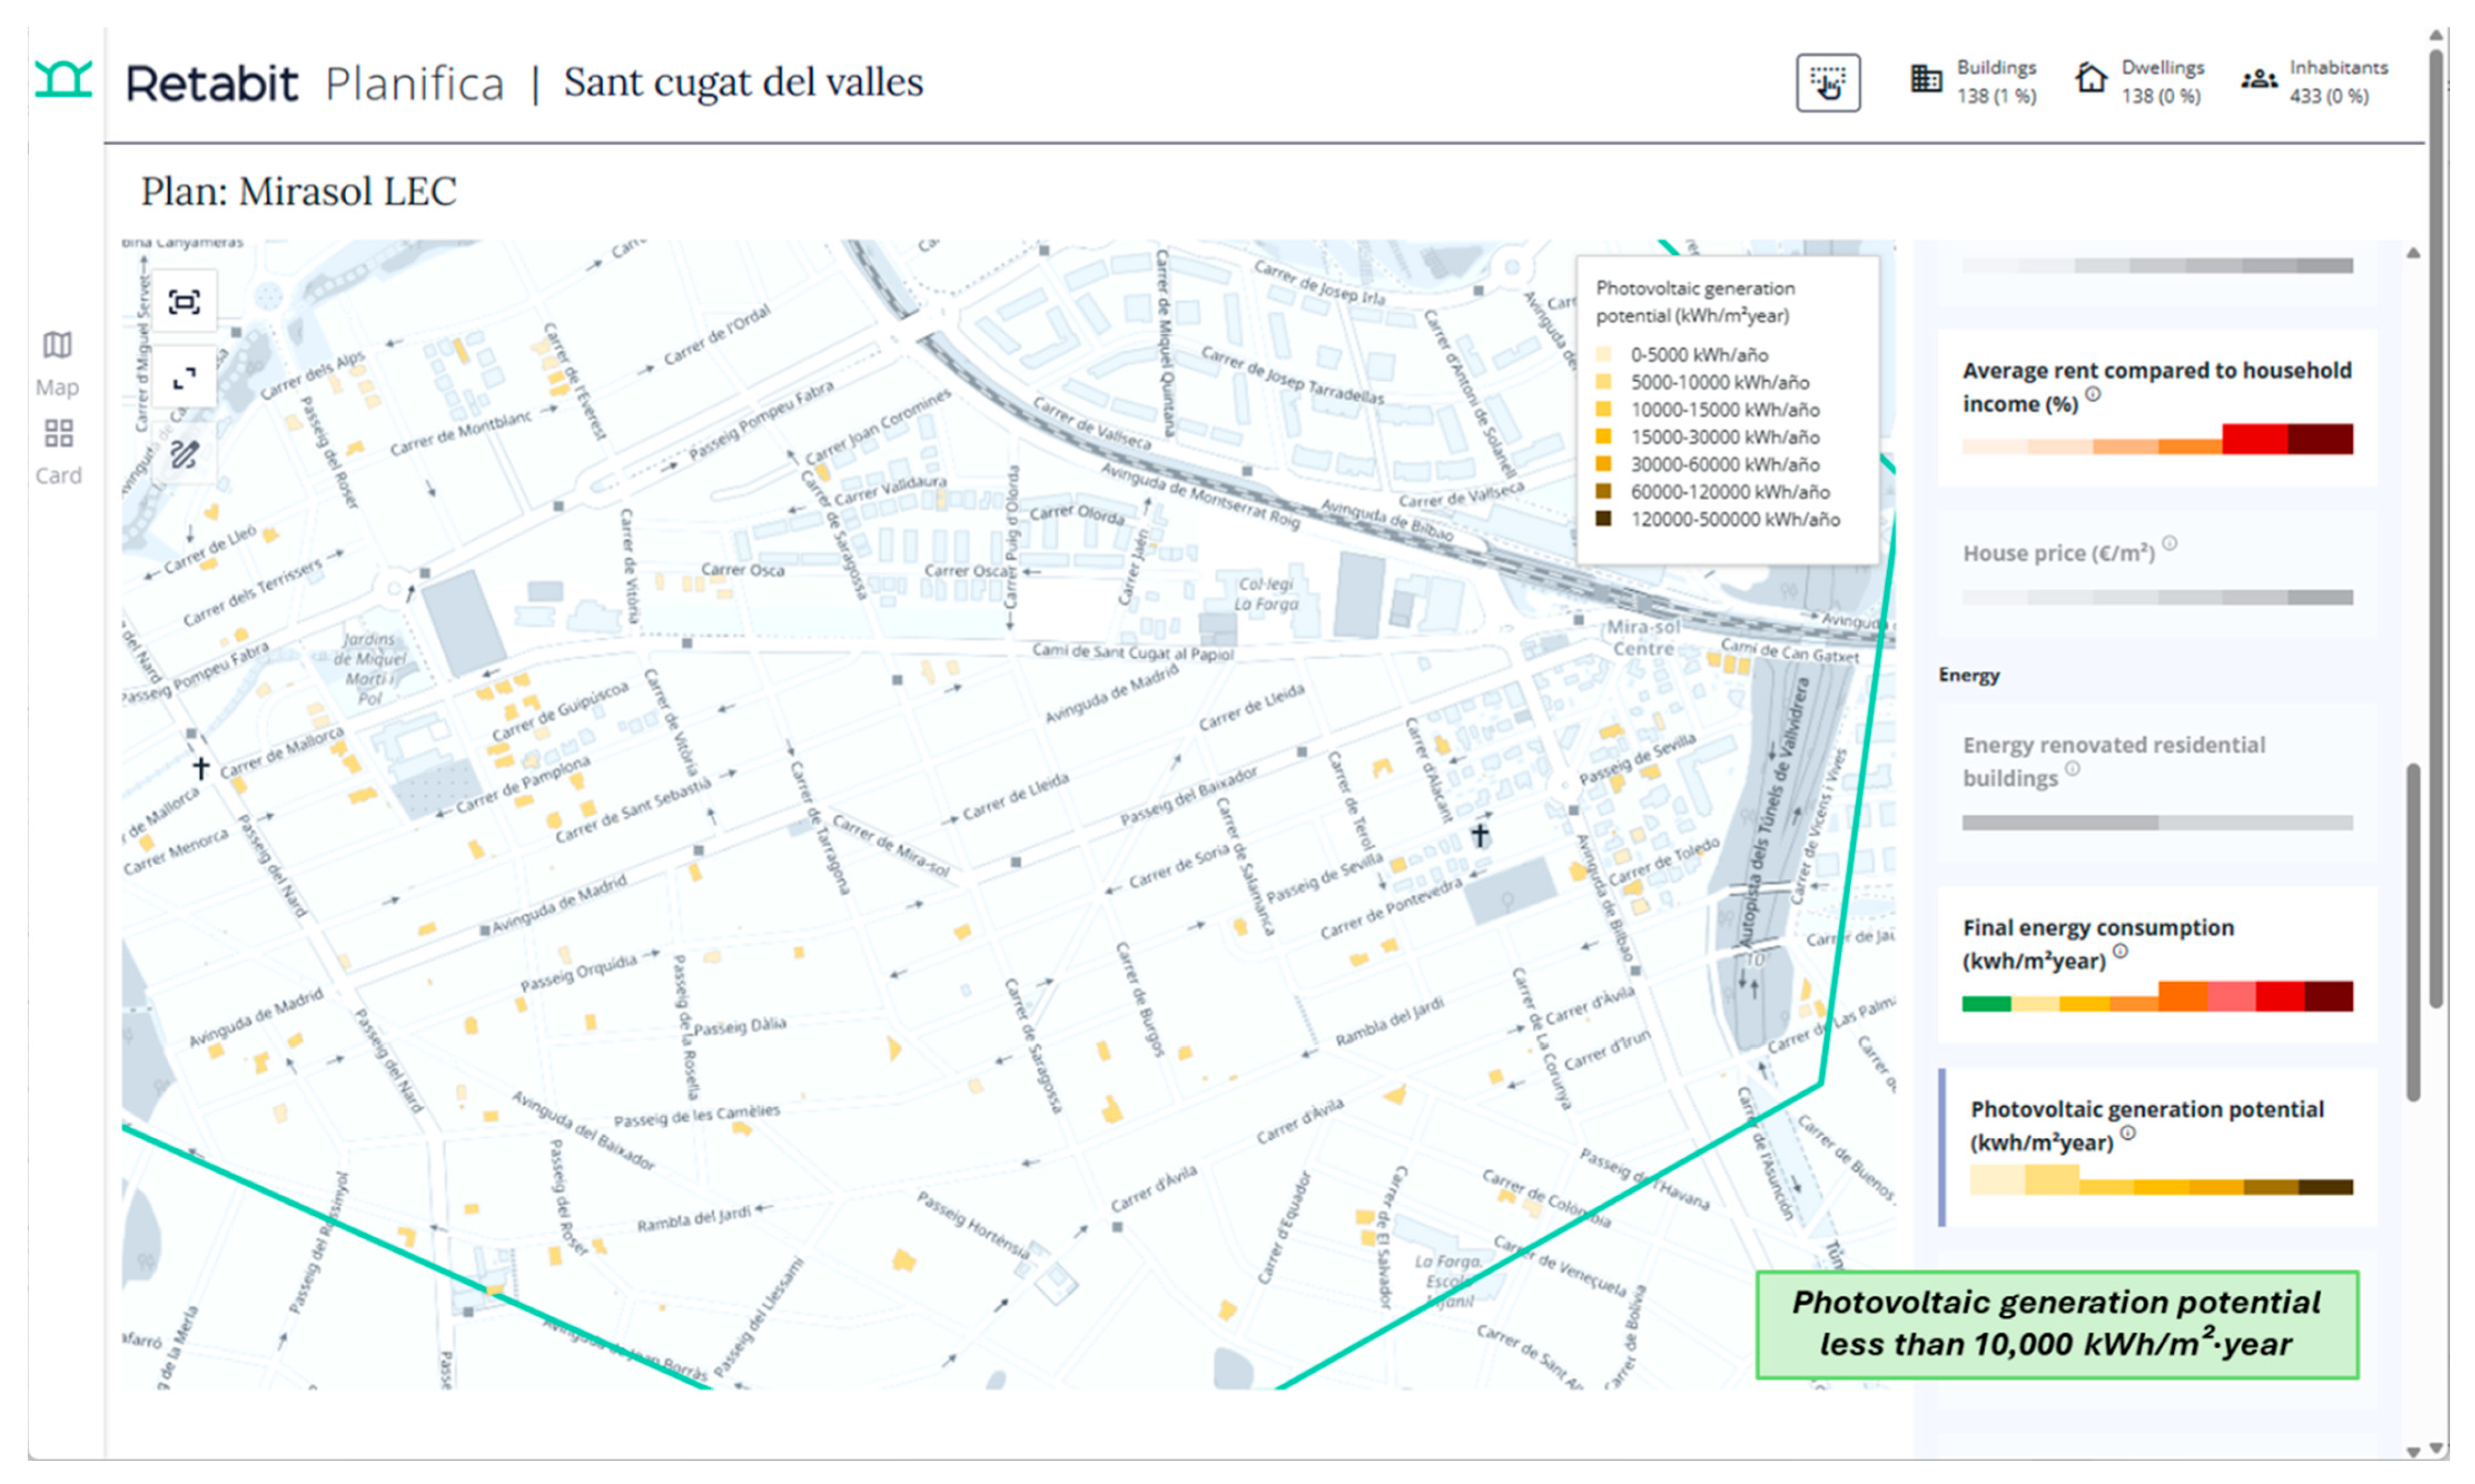
To define the study area, municipal technicians used the platform’s polygon-drawing tool to create a two-kilometre buffer around the civic centre, which highlighted a total of 2921 buildings within the target zone (Figure 9). After selecting the candidate consumer buildings, technicians could generate side-by-side dashboards that juxtapose baseline performance with the projected post-renovation metrics delivered by Retabit Plan, thereby informing both the technical and financial structuring of the LEC. To identify those most likely to benefit from the shared energy, the team applied a multi-criteria filter using the following indicators: Average rent compared to household income, Final energy consumption, and Photovoltaic generation potential.
For the Average rent compared to household income indicator (see Section 4.2.2), several affordability thresholds were tested by adjusting the indicator’s value range. The final selection of a 40% threshold was based on both practical experimentation within the platform and empirical research. Acolin and Reina [50] found that households spending more than 30% of their income on housing already experience reduced life satisfaction, with negative effects becoming more pronounced beyond 50%. Choosing a 40% threshold thus strikes a balance between inclusivity and the need to focus on households experiencing clear financial strain (Figure 10).
With respect to the Final energy consumption indicator, technicians examined the distribution of delivered-energy intensities across the buffered stock and opted to flag those in the upper half of the range. By setting the range at ≥200 kWh/m2·year, the selection targeted the highest-consumption buildings, ensuring that buildings with the greatest energy demand—and, consequently, the highest potential for savings—are prioritised for access to locally generated clean electricity and for complementary efficiency retrofits (Figure 11).
Finally, regarding Photovoltaic generation potential, technicians tested various thresholds and selected the lowest available bands (<10,000 kWh/m2·year). This threshold was chosen because buildings within this band, even if fully equipped with solar panels, would not be able to meet their own electricity needs. Therefore, these buildings are ideal candidates to act as consumers within the local energy community, benefiting from surplus electricity generated by higher-yield rooftops in the vicinity (Figure 12).
As a result of this exploration conducted within the platform, the technicians narrowed down the initial set of 2921 buildings within the two-kilometre buffer to a final selection of 218 residential buildings. These buildings were thereby designated as the primary consumers within the LEC, ensuring that the benefits of locally generated renewable energy reach the households most in need.
This use case demonstrates how systemic renovation planning can be achieved by integrating multidimensional data within a unified analysis framework. By combining technical diagnostics (such as energy use and PV yield), socio-economic indicators (like affordability stress), and spatial queries, the Retabit platform supports the identification of strategic intervention zones—or renovation hotspots—with high potential for social and environmental benefits.
European policies increasingly emphasise holistic renovation strategies that address environmental, social, and spatial dimensions simultaneously. The Mirasol LEC provides a concrete example of how these integrated principles can be put into practice through smart tools, local collaboration, and evidence-based prioritisation.

5.2. Renovation as a Cornerstone of the Mirasol Local Energy Community

Renovating the existing building stock is a cornerstone of the Mirasol LEC, enabling the community to simultaneously achieve its goals of affordability, resilience, and decarbonisation. Whether through deep retrofits or staged upgrades—used when budgets are limited—renovation significantly lowers baseline energy demand. This reduction increases the potential for locally generated solar power to meet a larger share of electricity needs and extends the period during which self-consumption is possible.
From an economic perspective, lower energy use shortens the payback period for community-owned distributed energy systems and reduces utility bills—especially for households vulnerable to energy poverty. These equity benefits can, in turn, reinforce community buy-in and long-term participation.
Renovation also unlocks synergies with evolving policy and funding frameworks. EU initiatives such as the Renovation Wave, the revised EPBD, and national support schemes are increasingly tying financial incentives for energy communities to demonstrated improvements in building performance.
In sum, when energy, economic, and policy dimensions are addressed together, upgrading the envelope, systems, and controls of Mirasol’s housing stock becomes not just a complementary measure, but a foundational investment—one that makes local renewable generation and equitable energy sharing both technically feasible and socially transformative.
To assess the implications of renovating the buildings, municipal technicians designed three distinct renovation projects for the 218 consumer buildings using Retabit Plan:
-
Complete Renovation. A one-shot renovation that tackles both the building shell and its mechanical systems.
-
Façade, Windows, and Roof Renovation. A fabric-first package that upgrades insulation on façades and roof and installs high-efficiency and airtight windows.
-
Energy-Generation Equipment Upgrade. Replacing legacy fossil-fuel boilers with high-efficiency mechanical systems.
The buildings were first assigned to the platform archetypes based on their construction period and usage type, reflecting common physical and functional characteristics:
-
Single family house 1901–1940: 4 buildings, 12 inhabitants.
-
Single family house 1941–1980: 43 buildings, 130 inhabitants.
Each archetype was then simulated using a range of renovation measures through Retabit’s built-in calculation engine [43] allowing for a comparative analysis of Final energy consumption, Heating energy consumption, CO2 emissions, and Final energy cost.
For the Complete Renovation project, the complete package of envelope and system interventions is executed simultaneously. The measures include the following:
  • High-performance window replacements, substituting existing units with pine-frame timber windows (U < 2 W/m2K, Class-4 airtightness) fitted with low-emissivity, solar-control double glazing (g = 0.40).
  • A full Exterior Thermal Insulation Composite System (ETICS) on street and courtyard façades, adding 60 mm of rock-wool insulation (λ = 0.035 W/mK) after partial cladding removal.
  • An alternative option of PVC-frame windows meeting the same thermal and airtightness specifications as the timber solution—offered to accommodate owner preferences and cost profiles.
  • Replacement of all individual fossil boilers with a mixed air-to-water heat-pump unit that delivers space-heating, cooling, and domestic hot water via an integrated storage tank.
Applied in unison, these measures deliver a comprehensive fabric upgrade, airtightness improvement, and full electrification of thermal services, positioning each dwelling for maximum self-consumption of locally generated PV and deep, durable carbon-reduction gains (Figure 13). The summary row at the top of the main table instantly recalculates the composite renovation cost (1014.29 €/m2), the projected cut in final energy use (47%), CO2 emissions (60%), and the annual energy bill (75%), so technicians can compare single-stage deep-renovation against the baseline.
In the Façade, Windows, and Roof Renovation project, technicians apply only the fabric-focused upgrades from the deep-renovation bundle—namely the high-performance timber (or optional PVC) windows and the 60 mm ETICS façade insulation. Although the measures implemented do not yet electrify heat production, the load curve it leaves behind is both lower and flatter, creating a solid platform for future integration of communal PV and battery assets. For owner-occupiers who must stagger investment, this pathway secures tangible comfort gains, a sizeable share of the lifetime energy-bill savings, and eligibility for many envelope-linked subsidies, all without committing to the up-front cost of new mechanical equipment.
Finally, the Energy-Generation Equipment Upgrade project completes the transition by replacing legacy fossil boilers with mixed air-to-water heat-pump units equipped for space heating, cooling, and domestic hot-water production. Implemented after the passive shell works, this € ≈ 150 m2 intervention electrifies the remaining thermal loads and equips dwellings with smart controls that can shift operation to periods of high solar output or low grid tariffs. While its stand-alone impact on delivered energy is smaller than that of the fabric measures, the active package delivers the decisive cut in onsite emissions, unlocks further bill savings through demand-side flexibility, and aligns each household’s consumption profile with the generation profile of the LEC. Taken together, the two staged projects allow residents to phase expenditure without losing sight of the end-state: fully renovated, grid-interactive homes that maximise self-consumption of Mirasol’s shared renewable power.
The evaluation step (Figure 14) makes clear that any of the three renovation pathways delivers a marked improvement on the baseline, but the depth and nature of those gains vary. The Façade, Windows, and Roof Renovation project cuts final energy demand by ≈27% and heating loads by ≈36%, trimming annual bills by one-third, all for an outlay of ≈€108 m2. The power generation equipment upgrade project, the investment amounts to ≈151 m2, but the savings are much higher: demand decreases by ≈30%, CO2 emissions are almost halved (47%), and the energy bill decreases by ≈68% thanks to the electrification of the heat pumps and tariff-sensitive controls. Executing the same envelope-and-system scope in a single-stage deep renovation achieves the greatest impact for the same aggregate cost—slashing final energy by 47%, heating demand by 63%, emissions by 60%, and household energy expenditure by 75%. In short, based on these estimates, municipality technicians can recommend a phased route where financing must be staggered, or a one-shot retrofit where capital is available, confident that both trajectories translate into substantial efficiency, carbon, and affordability dividends relative to the baseline stock while maximising the value of Mirasol’s shared renewable generation.
In the Mirasol local energy community, municipal technicians use Retabit to compare three renovation pathways—from fabric-first upgrades to full deep retrofits—assessing their impacts on energy use, emissions, costs, and payback times. This enables informed decision-making based on data analysis and simulation results, allowing them to balance budget constraints, maximise renewable energy integration, and align with relevant policy incentives.

6. Platform Applicability and Future Developments

At this stage, the Retabit platform is a prototype developed within a research project focused on municipalities in Catalonia. Its existing functionalities could be extended to other regions in Spain, which share national data sources such as the cadastre and the national statistics system, and follow common regulatory frameworks such as the ERESEE. Region-specific data sources could also be incorporated, provided the platform’s methodology is adapted to align with the available data. Additionally, the platform’s capabilities can be significantly enhanced through the integration of further datasets made available by municipalities interested in leveraging its potential for a holistic analysis of their building stock and for planning strategic renovation programs. For example, analyses like the one conducted in the Mirasol neighbourhood of Sant Cugat del Vallès could be made more comprehensive with access to municipal data—particularly on energy and water consumption, as well as dwelling occupancy.
In its present form, the Retabit platform offers versatile applications for a broad range of stakeholders involved in building renovation and urban regeneration. Table 9 provides an overview of key public, private, academic, financial, and civil society actors who can leverage the platform’s capabilities, their typical roles, and potential use cases where the platform adds value.
While the Retabit platform has already established a solid foundational framework, further developments will be crucial to address emerging challenges and expand its capabilities across several key areas. First, the integration of advanced data sources, such as satellite imagery, Lidar, and real-time energy consumption data, will enhance energy efficiency assessments and allow for more targeted interventions. The platform’s scope will also extend beyond municipal boundaries to include inter-urban, peri-urban, and rural areas, as well as climate change and wellbeing factors. Additionally, the development of AI-driven models will enable dynamic simulations and deep pattern analysis for more accurate evaluations of energy performance across various building types. The platform will also adopt an open-source approach, allowing users to download datasets, integrate third-party applications, and access high-resolution, dynamic data for enhanced analysis. Dedicated spaces for citizen participation, along with an architecture designed for third-party enhancements, will help ensure the platform’s adaptability, scalability, and long-term relevance.
In the future, platforms like Retabit may converge with urban digital twin technologies, enabling the virtual design, testing, and optimisation of urban buildings through urban information modelling, simulation, and augmented or virtual reality. Backed by real-time sensing, metering, and machine learning–based predictive controls, these digital twins will be instrumental in advancing energy efficiency, sustainability, and resilience in future urban environments.

7. Conclusions

The Retabit platform represents a forward-looking approach to extend the scope of UBEMs beyond energy assessments. The platform incorporates a broader range of indicators—spanning social, economic, and environmental dimensions—and enables more flexible, user-driven exploration of data. This integrated and interactive framework supports not only technical analysis but also strategic decision-making and stakeholder collaboration, pointing toward more holistic and adaptive urban renovation planning. By incorporating energy, economic, and social dimensions into one unified framework, the platform bridges the gap between building rehabilitation and urban regeneration. This integrated approach makes Retabit a powerful tool for cities aiming to achieve both climate goals and sustainable urban development, ensuring that building rehabilitation serves as a catalyst for holistic urban transformation. In this way, Retabit directly addresses the challenges identified in the EPBD and in the EEA reports, offering a robust platform for data-driven, multi-level renovation strategies at both building and district scales.
In particular, Retabit supports stakeholders involved in building rehabilitation by helping them navigate the complexity of the challenges through integrated data and a comprehensive set of multidimensional indicators. By presenting information across economic, social, and environmental dimensions in an integrated and manageable way, the platform encourages multidisciplinary teams to engage in informed discussions about the broader implications of rehabilitation plans within the context of sustainable urban development. Through the interaction between expert users and the platform, diverse renovation scenarios can be explored, and tailored strategies can be collaboratively developed.
A key challenge for platforms like Retabit—and UBEM platforms in general—is ensuring sustained use over time. Long-term engagement is essential not only to verify the effectiveness of implemented measures but also to continuously assess their impact and adjust renovation strategies accordingly. This requires ensuring a continuous flow of data and aligning indicators with data updates and renovation objectives. However, platforms developed within research projects often remain at the prototype stage and serve merely as proofs-of-concept. To realise their full potential and drive meaningful progress in building renovation, it is crucial to move beyond prototypes and establish mechanisms that support ongoing use and integration into real-world practices. In this context, initiatives such as Living-in.EU [51]—which promote interoperability, co-creation, and large-scale peer-to-peer deployment—can play a vital role in helping platforms like Retabit evolve into operational tools embedded in the digital governance of European cities and regions.
Data availability is a critical factor in determining the reliability and depth of analysis produced by the Retabit platform. While the platform incorporates publicly available data sources, its analytical capacity can be significantly enhanced through the integration of more detailed, case-specific datasets. For example, if a municipality supplies granular information about building residents and energy providers contribute data on consumption (e.g., gas, electricity, water), the platform’s analysis becomes more precise and context-specific. This enriched data environment also enables the creation of tailored indicators aligned with the municipality’s renovation goals.
An equally important aspect is the monitoring of renovation programme impacts over time. Retabit can support this need by enabling ongoing data integration. Once the platform has been used to analyse the building stock and develop intervention strategies, it can continue serving as a dynamic tool—updating with post-renovation data to track outcomes and inform future policy and investment decisions.
Further development of the approach initiated by Retabit is essential to establish such platforms as cross-cutting tools that support decision-making at all governance levels—from European to national, regional, and local. Strengthening Retabit’s framework in this way would facilitate coherent, data-driven planning and policy alignment across scales, promoting more integrated and effective responses to the complex challenges of building renovation and sustainable urban development. In particular, it would help interlink the diverse data sources referenced in the latest revision of the EPBD, while also providing robust evidence on the broader impacts of renovation efforts on urban sustainability.
An enduring challenge, however, for platforms like Retabit—and UBEM tools more broadly—is ensuring sustained use over time. Long-term engagement is crucial not only for verifying the effectiveness of implemented measures but also for continuously assessing their impact and adapting renovation strategies accordingly. However, platforms developed within research projects, such as Retabit, often remain at the prototype stage, serving primarily as proofs of concept. For digital tools like these to deliver real, long-term impact, their use must be consolidated beyond the project lifecycle. This requires maintaining a continuous flow of updated data, aligning performance indicators with renovation goals and data refresh cycles, and—critically—building and sustaining a pool of active users who rely on the platform in their day-to-day work. A committed user base is essential to keep the platform relevant, validated, and continuously improved over time.

Author Contributions

L.M. led the conceptual development of the platform, supervised the research process, and undertook the main writing responsibility. Á.S. designed and developed the data ingestion modules and integrated calculation modules in the platform. J.P. conceived the energy simulation mechanisms. E.M. and A.M. developed the detailed and grey-box simulation models. N.S.I.I. and A.C. defined the set of indicators and the characterisation of the building archetypes. All authors have read and agreed to the published version of the manuscript.

Funding

The work presented here was carried out as part of the Retabit project (PID2020-115936RB-C21-C22), funded by the Spanish Ministry of Science and Innovation, from October 2021 to December 2024.

Data Availability Statement

The original contributions presented in this study are included in the article. Further inquiries can be directed to the corresponding authors.

Acknowledgments

We would like to thank Camilo Huertas and Marta Salgado from the research group ARC Engineering and Architecture La Salle for their contributions to the programming of the interfaces. We are also grateful to the Ajuntament de Sant Cugat del Vallès, the Ajuntament de Rubí, Fundació Europace, the Agència de l’Energia de Barcelona, the Diputació de Barcelona, and the Institut Català d’Energia for their support in the testing and implementation of the platform throughout its development.

Conflicts of Interest

The project partners of the Retabit project include ARC La Salle Engineering and Architecture (coordinator) and the Catalonia Institute for Energy Research (IREC). The authors declare no conflicts of interest.

References

  1. European Commission. The European Green Deal. Available online: https://commission.europa.eu/strategy-and-policy/priorities-2019-2024/european-green-deal_en (accessed on 17 July 2025).
  2. European Commission. A Renovation Wave for Europe—Greening Our Buildings, Creating Jobs, Improving Lives. 2020. Available online: https://energy.ec.europa.eu/system/files/2020-10/eu_renovation_wave_strategy_0.pdf (accessed on 17 July 2025).
  3. European Commission. Delivering the European Green Deal. 2021. Available online: https://commission.europa.eu/publications/delivering-european-green-deal_en (accessed on 17 July 2025).
  4. Royal Institution of Chartered Surveyors (RICS). Energy Efficiency of the Building Stock in the EU. Available online: https://www.rics.org/news-insights/energy-efficiency-of-the-building-stock-in-the-eu (accessed on 17 July 2025).
  5. European Environment Agency (EEA). Accelerating the Energy Efficiency Renovation of Residential Buildings—A Behavioural Approach. EEA Report No 01/2023. Available online: https://www.eea.europa.eu/publications/accelerating-the-energy-efficiency (accessed on 17 July 2025).
  6. European Commission. Comprehensive Study of Building Energy Renovation Activities and the Uptake of Nearly Zero-Energy Buildings in the EU; Publications Office of the European Union: Luxembourg, 2023. [Google Scholar]
  7. Buildings Performance Institute Europe (BPIE). Report on the Evolution of the European Regulatory Framework for Buildings Efficiency. 2022. Available online: https://www.bpie.eu/wp-content/uploads/2022/02/rev6_SPIPA_EU.pdf (accessed on 17 July 2025).
  8. United Nations. Sustainable Development Goals; United Nations: New York, NY, USA, 2025; Available online: https://sdgs.un.org/goals (accessed on 17 July 2025).
  9. European Union. Directive (EU) 2024/1275 of the European Parliament and of the Council of 24 April 2024 on the energy performance of buildings (recast). Off. J. Eur. Union 2024, L123, 1–68. Available online: https://eur-lex.europa.eu/eli/dir/2024/1275/oj/eng (accessed on 17 July 2025).
  10. European Union. Directive 2002/91/EC of the European Parliament and of the Council of 16 December 2002 on the Energy Performance of Buildings. 2002. Available online: https://eur-lex.europa.eu/LexUriServ/LexUriServ.do?uri=OJ:L:2003:001:0065:0071:en:PDF (accessed on 17 July 2025).
  11. TIMEPAC. Towards Innovative Methods for Energy Performance Assessment and Certification. Available online: https://timepac.eu/ (accessed on 17 July 2025).
  12. European Environment Agency. Addressing the Environmental and Climate Footprint of Buildings. 2024. Available online: https://www.eea.europa.eu/en/analysis/publications/addressing-the-environmental-and-climate-footprint-of-buildings/addressing-the-environmental-and-climate-footprint-of-buildings (accessed on 17 July 2025).
  13. European Commission: Directorate-General for Energy; Buildings Performance Institute Europe; CLIMACT SA; Creara Consultores SL; Ecologic Institute; Steuwer, S.; Volt, J.; Dorizas, V.; Jossen, Q.; Pestiaux, J.; et al. Lessons Learned to Inform Integrated Approaches for the Renovation and Modernisation of the Built Environment—Final Report; Publications Office of the EU: Luxembourg, 2021; Available online: https://data.europa.eu/doi/10.2833/771121 (accessed on 17 July 2025).
  14. Hong, T.; Chen, Y.; Luo, X.; Luo, N.; Lee, S.H. Ten questions on urban building energy modeling. Build. Environ. 2020, 168, 106508. [Google Scholar] [CrossRef]
  15. Reinhart, C.F.; Cerezo Davila, C. Urban building energy modeling–A review of a nascent field. Build. Environ. 2016, 97, 196–202. [Google Scholar] [CrossRef]
  16. Loga, T.; Stein, B.; Diefenbach, N. TABULA building typologies in 20 European countries—Making energy-related features of residential building stocks comparable. Energy Build. 2016, 132, 4–12. [Google Scholar] [CrossRef]
  17. Buckley, N.; Mills, G.; Reinhart, C.; Berzolla, Z.M. Using urban building energy modelling (UBEM) to support the new European Union’s Green Deal: Case study of Dublin Ireland. Energy Build. 2021, 247, 111115. [Google Scholar] [CrossRef]
  18. Hao, S.; Hong, T. The application of urban building energy modeling in urban planning. In Rethinking Sustainability Towards a Regenerative Economy; Springer International Publishing: Cham, Switzerland, 2021; pp. 45–63. [Google Scholar]
  19. Krietemeyer, B.; El Kontar, R. A method for integrating an UBEM with GIS for spatiotemporal visualization and analysis. In Proceedings of the Symposium on Simulation for Architecture and Urban Design, Atlanta, GA, USA, 7–9 April 2019; pp. 87–94. [Google Scholar]
  20. Li, Y.; Feng, H. Integrating urban building energy modeling (UBEM) and urban-building environmental impact assessment (UB-EIA) for sustainable urban development: A comprehensive review. In Renewable and Sustainable Energy Reviews; Elsevier: Amsterdam, The Netherlands, 2025; Volume 213. [Google Scholar]
  21. Waly, N.M.; Hassan, H.; Murata, R.; Sailor, D.J.; Mahmoud, H. Correlating the urban microclimate and energy demands in hot climate Contexts: A hybrid review. Energy Build. 2023, 295, 113303. [Google Scholar] [CrossRef]
  22. Xi, H.; Zhang, Q.; Ren, Z.; Li, G.; Chen, Y. Urban Building Energy Modeling with Parameterized Geometry and Detailed Thermal Zones for Complex Building Types. Buildings 2023, 13, 2675. [Google Scholar] [CrossRef]
  23. Sokol, J.; Davila, C.C.; Reinhart, C.F. Validation of a Bayesian-based method for defining residential archetypes in urban building energy models. Energy Build. 2017, 134, 11–24. [Google Scholar] [CrossRef]
  24. Ferrando, M.; Causone, F.; Hong, T.; Chen, Y. Urban building energy modeling (UBEM) tools: A state-of-the-art review of bottom-up physics-based approaches. Sustain. Cities Soc. 2020, 62, 102408. [Google Scholar] [CrossRef]
  25. Dahlström, L. Archetype Identification in Urban Building Energy Modeling: Research Gaps and Method Development. Doctoral Dissertation, Uppsala Universitet, Uppsala, Sweden, 2023. [Google Scholar]
  26. Madrazo, L.; Massetti, M.; Sicilia, A.; Wadel, G.; Ianni, M. SEíS: Sistema basado en tecnologías semánticas para integrar la información energética de los edificios. Inf. De La Construcción 2015, 67, e060. [Google Scholar] [CrossRef]
  27. Madrazo, L.; Sicilia, A.; Gamboa, G. SEMANCO: Semantic tools for carbon reduction in urban planning. In Proceedings of the 9th European Conference on Product and Process Modelling, Reykjavik, Iceland, 25–27 July 2012. [Google Scholar]
  28. Madrazo, L.; Sicilia, A.; Massetti, M.; Plazas, F.L.; Ortet, E. Enhancing energy performance certificates with energy related data to support decision making for building retrofitting. Therm. Sci. 2018, 22 (Suppl. S3), 957–969. [Google Scholar] [CrossRef]
  29. Madrazo, L.; Sicilia, Á.; Ortet, E.; Calvo, A. OpenSantCugat: A platform for municipalities to provide access to building data. In ECPPM 2022-eWork and eBusiness in Architecture, Engineering and Construction 2022; CRC Press: Boca Raton, FL, USA, 2023; pp. 229–234. [Google Scholar]
  30. Available online: https://platform.retabit.es/en/ (accessed on 17 July 2025).
  31. Cyr, C.; Dorsey, D. Introduction to dbt. In Unlocking Dbt: Design and Deploy Transformations in Your Cloud Data Warehouse; Cyr, I.C., Dorsey, D., Eds.; Springer: Berlin/Heidelberg, Germany, 2023; pp. 1–40. [Google Scholar] [CrossRef]
  32. Ibañez Iralde, N.S.; Lecocq, E.M.; Pascual, J.; Martí Audí, N.; Salom, J. Harmonising Indicators to Report Sustainable Development Goals and Sustainable Energy and Climate Action Plan: Systemic Analysis of Existing Regional and City Indicators Sets. Sustainability 2024, 16, 7943. [Google Scholar] [CrossRef]
  33. UNE-EN ISO 52000-1:2019; Energy Performance of Buildings. Overarching EPB Assessment. Part 1: General Framework and Procedures (ISO 52000-1:2017). AENOR, Agencia Española de Normalización y Certifiación: Madrid, Spain, 2019.
  34. Šúri, M.; Huld, T.A.; Dunlop, E.D. PVGIS: A web-based solar radiation database for the calculation of PV potential in Europe. Int. J. Sustain. Energy 2005, 24, 55–67. [Google Scholar] [CrossRef]
  35. Ministry of Housing and Urban Agenda Sistema Estatal de Referencia de Precios del Alquiler de Vivienda. Available online: https://www.mivau.gob.es/vivienda/alquila-bien-es-tu-derecho/serpavi (accessed on 17 July 2025).
  36. Government of Spain. Ley 12/2023, de 24 de Mayo, por el Derecho a la Vivienda. 2023. Available online: https://www.boe.es/buscar/pdf/2023/BOE-A-2023-12203-consolidado.pdf (accessed on 17 July 2025).
  37. Instituto Nacional de Estadística. Living Conditions Survey. Available online: https://www.ine.es/ss/Satellite?param1=PYSDetalleFichaIndicador&c=INESeccion_C&param3=1259937499084&p=1254735110672&pagename=ProductosYServicios%2FPYSLayout&cid=1259944504067&L=0 (accessed on 17 July 2025).
  38. Oficina Catalana del Canvi Climatic. Anàlisi del Grau de Vulnerabilitat i Resiliència dels Municipis de Catalunya al Canvi Climàtic. Available online: https://www.gencat.cat/mediamb/publicacions/Estudis/Vulnerabilitat_canvi_climatic_municipis_Catalunya.pdf (accessed on 17 July 2025).
  39. Haq, S.M.A. Urban green spaces and an integrative approach to sustainable environment. J. Environ. Prot. 2011, 2, 601–608. Available online: https://www.scirp.org/html/5881.html (accessed on 17 July 2025). [CrossRef]
  40. UN-Habitat. Public Space Site-Specific Assessment Guidelines to Achieve Quality Public Spaces at Neighbourhood Level. 2020. Available online: https://unhabitat.org/sites/default/files/2020/07/final_pssa_v.1_reviewed_compressed.pdf (accessed on 17 July 2025).
  41. Ferrer-Ortiz, M.; Miralles-Guasch, J.M.; Piera, M.; Sánchez-Hernández, A.J.; Miralles-Guasch, C.; Baró, C. Barcelona under the 15-minute city lens: Mapping the accessibility and proximity potential based on pedestrian travel times. Urban Sci. 2025, 5, 10. Available online: https://www.mdpi.com/2624-6511/5/1/10 (accessed on 17 July 2025). [CrossRef]
  42. Bohannon, R.W.; Andrews, A.W. Normal walking speed: A descriptive meta-analysis. Physiotherapy 2011, 97, 182–189. [Google Scholar] [CrossRef] [PubMed]
  43. Open Data Portal of the Government of Catalonia. Estacions de Recàrrega per a Vehicle Elèctric a Catalunya. Available online: https://analisi.transparenciacatalunya.cat/en/Transport/Estacions-de-rec-rrega-per-a-vehicle-el-ctric-a-Ca/tb2m-m33b/about_data (accessed on 17 July 2025).
  44. Barcelona City Council. Municipal Plan for Gender Equity 2016–2020. Barcelona: Barcelona City Council. Retrieved. 2017. Available online: https://bcnroc.ajuntament.barcelona.cat/jspui/bitstream/11703/101739/1/PMEB_integre_cat.pdf (accessed on 17 July 2025).
  45. Comunitat Energètica de Catalunya. Available online: https://comunitatenergetica.cat/info (accessed on 17 July 2025).
  46. MARIE. Mediterranean Building Rethinking for Energy Efficiency Improvement, Programme MED, Call for Proposal: 3rd Call. 2010. Available online: https://www.marie-medstrategic.eu (accessed on 17 July 2025).
  47. Ortiz, J.; Fonseca, A.; Salom, J.; Garrido, N.; Fonseca, P.; Russo, V. Comfort and economic criteria for selecting passive measures for the energy refurbishment of residential buildings in Catalonia. Energy Build. 2016, 110, 195–210. [Google Scholar] [CrossRef]
  48. Ministry of Transport Mobility and Urban Agenda. Government of Spain. Update of the Long-Term Strategy for Energy Renovation in the Building Sector in Spain (ERESEE). 2020. Available online: https://cdn.mitma.gob.es/portal-web-drupal/planes_estartegicos/en_ltserb.pdf (accessed on 17 July 2025).
  49. Mont, E.; Pascual, J.; Salom, J. Development of physically coherent grey-box models for residential buildings using a simplified adjustment method. Energy Build. 2025, 328, 115215. [Google Scholar] [CrossRef]
  50. Acolin, A.; Reina, V. Housing cost burden and life satisfaction. J. Hous. Built Environ. 2022, 37, 1789–1815. Available online: https://pmc.ncbi.nlm.nih.gov/articles/PMC9914515/pdf/nihms-1769918.pdf (accessed on 17 July 2025). [CrossRef] [PubMed]
  51. Living-In. Living-In Project. Available online: https://living-in.eu/ (accessed on 17 July 2025).
Figure 1. Retabit platform framework.
Energies 18 03895 g001
Figure 2. Workflow for systematic identification and harmonisation of building renovation indicators.
Energies 18 03895 g002
Figure 3. Dashboard summarising data and indicators for the selected municipality.
Energies 18 03895 g003
Figure 4. Interactive interface to explore the building stock through multidimensional indicators.
Energies 18 03895 g004
Figure 5. Available data for a selected building.
Energies 18 03895 g005
Figure 6. Selection of buildings for renovation based on multidimensional indicators and within a defined area.
Energies 18 03895 g006
Figure 7. Renovation plan: characteristics of buildings to renovate categorised as archetypes.
Energies 18 03895 g007
Figure 8. Renovation project: measures applied and simulated impact.
Energies 18 03895 g008
Figure 9. Delimiting the area of the local energy community in the Mirasol neighbourhood.
Energies 18 03895 g009
Figure 10. Average rent compared to household income indicator set to more than 40%.
Energies 18 03895 g010
Figure 11. Final energy consumption indicator set to more than 200 kWh/m2·year.
Energies 18 03895 g011
Figure 12. Photovoltaic generation potential indicator set to more than 200 kWh/m2·year.
Energies 18 03895 g012
Figure 13. Complete renovation of the buildings in the Mirasol renovation plan.
Energies 18 03895 g013
Figure 14. Evaluation of the three projects created for the Mirasol renovation plan.
Energies 18 03895 g014
Table 1. Key limitations of UBEMs and corresponding solutions provided by the platform.
Key LimitationRetabit’s Solution
Interdisciplinary integrationEnergy, environmental, and socio-economic indicators are integrated into a single data model, enabling genuinely multidimensional appraisals of renovation scenarios.
Weak multiscale couplingA layered database and indicator engine aggregate data from individual buildings up to municipal dashboards, supporting multi-level renovation strategies and district-scale scenario testing.
Limited user participationInteractive dashboards and dedicated participation spaces are provided, allowing technicians and residents to explore data and co-design renovation plans.
Fragmented, non-interoperable dataA reproducible open-source ETL pipeline harmonises over 15 million public records and delivers them via FAIR-compliant OGC services, ensuring continuous refresh and interoperability.
Neglect of socio-economic indicatorsGranular socio-economic layers (e.g., rent-to-income ratios, poverty risk, and housing prices) are embedded alongside technical data, enabling equity-focused prioritisation.
Table 2. Main data sources of Retabit platform.
Data SourcesScaleDomainProviderNum. of Registers
Cadastre—buildingsBuildingOtherMinistry of Finance, Spain1,396,004
Cadastre—propertiesBuildingOtherSpanish Ministry of Finance, Spain6,742,293
Road networksUrbanOtherNational Geographic Institute, Spain1,147,000
Habitability certificatesDwellingOtherDepartment of Territory, Housing and Ecological Transition, Spain3,058,727
Energy Performance CertificatesBuildingEnergyICAEN, Government of Catalonia1,322,334
Climatic Atlas cartographyUrbanEnvironmentalDepartment of Agriculture, Livestock, Fisheries and Food, Government of Catalonia179
Open Street maps (equipment)BuildingEnvironmental©OpenStreetMap Contributors31,874
Land cover mapUrbanEnvironmentalCartographic and Geological Institute of Catalonia1,526,984
Digital elevation modelUrbanEnvironmentalCartographic and Geological Institute of Catalonia267
National housing rental reference systemCensus tractSocio-economicMinistry of Housing and Urban Agenda, Spain5081
Annual population census 2021–2024Census tractSocio-economicNational Institute of Statistics, Spain36,334
Table 3. Indicators integrated in the platform.
Energy Domain
Indicator Name (Value)PurposeAssessment Rule
Near-zero energy buildings (yes/no)Determines compliance with the near-zero-energy criterion codified in the Spanish Technical Building Code (CTE) and the Energy Performance of Buildings Directive (EPBD)NRPEC ≤ zone-specific limit (compliant)
Energy-renovated residential buildings (yes/no)Identifies retrofitted residential stock that attains marked energy efficiency yet remains below the nZEB thresholdNRPEC within range (compliant)
Passive buildings (yes/no)Recognises buildings whose thermal loads satisfy the Passivhaus performance benchmarkDemand ≤ 15 kWh/m2·year
Final energy consumption (kWh/m2·year) Quantifies delivered energy for space conditioning and domestic hot water as invoiced to occupantsLower values denote superior performance
Heating energy consumption (kWh/m2·year)Captures thermal demand met through fossil-derived carriers for space heatingLower values denote superior performance
CO2 emissions (kg CO2/m2·year)Expresses operational carbon intensity per unit floor areaLower values denote superior performance
Photovoltaic generation potential (kWh/m2·year)Estimates annual photovoltaic yield per unit of available roof surfaceHigher values denote superior performance
Socio-economic domain
Housing prices (€/m2)Serves as a proxy for rental-market pressure and housing affordabilityLower values enhance affordability
Average household income (€)Represents aggregate purchasing power and potential socio-economic vulnerabilityContext-dependent (no universal threshold)
Average rent compared to household income (%)Computes the proportion of disposable income allocated to rent payments<30% generally considered sustainable
Population with income below 60% of median (yes/no)Denotes the share of residents at risk of povertyLower values denote superior performance
Environmental domain
Vulnerability to heatwaves and temperature rise (0–9)Weights climatic exposure and scarcity of urban greenery into a composite indexLower values denote superior performance
Green space area (ha)Measures publicly accessible green areas within a 400 m radiusHigher counts denote superior performance
Urban facilities within a 15-min walk (1–25)Tallies essential service categories reachable on foot, reflecting walkabilityHigher counts denote superior performance
Access to cycle lanes (yes/no)Measures distance to the nearest dedicated cycling infrastructure to support active low-carbon mobilityPresence (yes) desirable
Table 4. Reference values for nZEB classification in Catalonia.
Climatic ZoneNRPEC Limit (kWh/m2·year)
B28
C32
D38
E43
Table 5. Reference ceilings for renovated residential buildings in Catalonia.
Climatic ZoneNRPEC Limit (kWh/m2·year)
B55
C65
D70
E80
Table 6. Accessibility thresholds for urban facilities by function and category.
FunctionCategoryMinutesMeters
CareHealth10820
CareSocial services151180
CareDay centres10820
EducationPreschool education5460
EducationPrimary education5460
EducationSecondary education10820
ProvisioningSupermarkets10820
ProvisioningMarkets10820
ProvisioningFresh food5460
ProvisioningDaily non-food5460
ProvisioningCatering5460
ProvisioningMiscellaneous services5460
EntertainmentShows10820
EntertainmentLibraries151180
EntertainmentCivic centres10820
EntertainmentChildren playgrounds5460
EntertainmentSports facilities10820
EntertainmentSquares and parks >1000 m25460
EntertainmentSquares and parks > 10,000 m25460
TransportMetro stations10820
TransportBus stations 5460
TransportTrams stations 10820
TransportTrains stations10820
TransportBike stations5460
Table 7. Building archetypes.
ArchetypeBuilding Characteristics
Multi-family house built before 1900Multi-family buildings between party walls with six stories (ground floor + five). Envelope composed of solid masonry walls, one-way slabs, and ceramic tile roofs. Windows are single-glazed with frames lacking thermal breaks. As these buildings predate energy regulations, no insulation is included.
Multi-family house built between 1901 and 1940Multi-family buildings between party walls with six stories (ground floor + five). Envelope composed of solid masonry walls, one-way slabs, and ceramic tile roofs. Windows are single-glazed with non-thermally broken frames. No insulation is considered due to the absence of energy regulations during this period.
Single-family house built between 1901 and 1940Single-family buildings between party walls with three stories, using the same envelope composition as multi-family buildings from the same period. No insulation is included, as the construction predates energy regulations.
Non-isolated multi-family house built between 1941 and 1960Multi-family buildings between party walls with eight stories (ground floor + seven). Envelope composed of double-layer masonry walls, one-way slabs, and ceramic tile roofs. Though built before formal energy regulations, air chambers were introduced in façades and roofs. Windows are modestly improved with double glazing and frames with partial thermal breaks.
Isolated multi-family house built between 1941 and 1960Isolated multi-family buildings with five stories (ground floor + four), sharing similar envelope characteristics with contemporaneous party-wall multi-family buildings.
Single-family house built between 1941 and 1980Single-family buildings between party walls with three stories, sharing the same envelope structure as the period’s multi-family buildings.
Non-isolated multi-family house built between 1961 and 1980Multi-family buildings between party walls with eight stories (ground floor + seven). Envelope composed of double-layered masonry walls, one-way slabs, and ceramic roofs. No insulation was initially included, as energy regulations were only introduced in 1979. However, air chambers were present between façade and roof layers. Windows are slightly improved with double glazing and partial thermal breaks.
Isolated multi-family house built between 1961 and 1980Isolated multi-family buildings with five stories (ground floor + four), sharing envelope features with party-wall counterparts.
Multi-family house built between 1981 and 2007Multi-family buildings between party walls with five stories (ground floor + four). Envelope composed of double-layered masonry walls, one-way slabs, and ceramic tile roofs. New legislation introduced insulation, typically as thin layers within wall air chambers and between slabs and roof finishes. Windows resemble those from the 1961–1980 period but with improved thermal performance.
Single-family house built between 1981 and 2019Single-family buildings between party walls with three stories, using the same envelope as contemporaneous multi-family buildings. These buildings include medium-level insulation in accordance with evolving energy efficiency standards.
Multi-family house built between 2008 and 2014Multi-family buildings between party walls with five stories (ground floor + four). Envelope composed of double-layered masonry walls, one-way slabs, ceramic tile roofs, and single-leaf wood-frame windows. These buildings comply with the 2007 Technical Building Code (CTE), including mandatory insulation in walls and roofs. Windows are double-glazed with aluminium frames featuring thermal breaks, in accordance with CTE requirements.
Multi-family house built between 2015 and 2019Similar in structure to the 2008–2014 archetype but designed to meet the stricter envelope requirements introduced in the 2013 update to the Technical Building Code.
Table 8. Renovation measures.
Building ComponentRenovation MeasureConfigurable Attributes Based on the Archetype
WindowsReplacement of exterior joinery with PVC framesFrame material, Frame thermal-transmittance class, Air-permeability class (UNE-EN 12207), Glazing configuration, Glazing thermal transmittance (U-value), Solar-control factor (g-value), Glazing build-up per opening type, Pre-frame inclusion, Shutter inclusion.
Replacement of exterior joinery with pine-wood frames
FaçadeExternal Thermal Insulation Composite System (ETICS)Insulation material, Insulation thickness, Insulation thermal-conductivity class, Partial cladding removal, Finishing layer type, Ventilated-cavity depth, Cladding panel format.
Ventilated façade (ceramic with staple substructure)
RoofInverted roof with external insulation tilesInsulation material, Insulation thickness, Insulation thermal-conductivity class, Removal of existing waterproofing layers, Vapour-barrier specification, Ceiling finish, Roof-slope category.
Internal roof insulation beneath false ceiling
Technical systemsBiomass boiler (centralised) for heating + DHWNominal thermal power, Equipment sizing method, Seasonal performance factor/efficiency class, Fuel-storage capacity (biomass), Fuel-feed system type, DHW-storage volume, Distribution temperature regime, Emitter type (radiators), Emitter replacement option.
Heat pump (individual) for heating + DHW
Heat pump (centralised) for heating + DHW
Heat pump (individual) for heating + DHW with low-temperature radiators
Heat pump (centralised) for heating + DHW with low-temperature radiators
Table 9. Potential users and applications of the Retabit platform.
Public Sector
StakeholderRoleApplication
MunicipalitiesPlatform users, data providersUrban renovation planning, citizen engagement
Regional GovernmentsStrategic oversight, fundingScaling across regions, aligning with regional plans
National Government Regulatory alignment, monitoringLinking to ERESEE or national renovation goals
Public Housing AgenciesPortfolio managersTargeted retrofitting, performance tracking
Energy/Climate AgenciesPolicy supportLong-term scenario modelling and monitoring
Private sector
Urban Planners/ArchitectsDesign consultantsUse platform data to inform urban development
ESCOs/Retrofit FirmsService providersIdentify buildings for intervention, model savings
Utilities/Energy ProvidersEnergy managersDemand forecasting, energy savings programs
Smart Building/PropTech FirmsTechnology integratorsConnect building-level data to urban insights
Academic and research
Universities/Research LabsModel developers, evaluatorsImprove platform algorithms, run simulations
Students/EducatorsUsers, testersProject-based learning, thesis work on UBEMs
Finance and insurance
Green Banks/FundsRenovation financiersTargeting investment-ready building clusters
Insurance CompaniesRisk assessorsModelling climate or energy-related risks
Civil society
Housing Cooperatives/HOAsCollective usersAssess common areas, plan joint renovations
Environmental NGOsAdvocatesCampaign for energy justice, access open data
Disclaimer/Publisher’s Note: The statements, opinions and data contained in all publications are solely those of the individual author(s) and contributor(s) and not of MDPI and/or the editor(s). MDPI and/or the editor(s) disclaim responsibility for any injury to people or property resulting from any ideas, methods, instructions or products referred to in the content.