Article

Intelligent Modelling Techniques for Enhanced Thermal Comfort and Energy Optimisation in Residential Buildings

by
Shamaila Iram
*,
Hafiz Muhammad Athar Farid
*,
Abduljelil Adeola Akande
and
Hafiz Muhammad Shakeel
Department of Computer Science, University of Huddersfield, Huddersfield HD1 3DH, UK
*
Authors to whom correspondence should be addressed.
Energies 2025, 18(14), 3878; https://doi.org/10.3390/en18143878
Submission received: 3 June 2025 / Revised: 5 July 2025 / Accepted: 18 July 2025 / Published: 21 July 2025

Abstract

This study examines the utilisation of sophisticated predictive methodologies to enhance the energy efficiency and comfort of residential structures. The ASHRAE Global Thermal Comfort Database II was employed to construct and evaluate machine learning models that were designed to predict thermal comfort levels while optimising energy consumption. Air temperature, garment insulation, metabolic rate, air velocity, and humidity were identified as critical comfort determinants. Numerous predictive models were assessed, and XGBoost demonstrated improved performance as a result of hyperparameter optimisation (R2 = 0.9394, MSE = 0.0224). The study underscores the ability of sophisticated algorithms to clarify the complex relationships between environmental factors and occupant comfort. This sophisticated modelling methodology provides a practical approach to enhancing the efficiency of residential energy consumption while simultaneously ensuring the comfort of the occupants, thereby promoting more sustainable and comfortable living environments.

1. Introduction

The demand for energy has reached historic levels due to the rising global population and accelerating urbanisation. This energy is utilised by the residential building industry, which encompasses houses, apartments, and all other living facilities. According to “International Energy Agency” (IEA), in rich countries, it consumes about 20–40% of the total energy consumption [1]. The main drivers for such high energy consumption are heating, ventilation, lighting, and appliances usage by its occupants [2]. Given the high percentage of structure energy consumption, raising energy efficiency without compromising comfort has become an important objective. In most regions of the world, fossil fuel remains the principal source of energy, and home energy consumption immensely contributes to greenhouse gas (GHG) emissions. Significant decreases in carbon dioxide (CO2) and GHG emissions can be achieved by lowering energy consumption in residential properties, thereby aiding global efforts to mitigate temperature rises and fulfil climate goals established in international accords such as the Paris Agreement [3].
Historically, energy management in residential structures depended predominantly on rudimentary, manual techniques. Homeowners would modify thermostats and control systems according to individual comfort preferences, often neglecting energy economy. The introduction of programmable thermostats in the late 20th century was a notable progression, enabling fundamental scheduling of heating and cooling systems. Nonetheless, these initial systems were constrained by their incapacity to adjust to real-time fluctuations in occupancy or environmental conditions. In recent years, the incorporation of intelligent technology and the Internet of Things (IoT) has resulted in significant progress in household energy management. Smart thermostats and home automation systems now provide enhanced control through the use of sensors, real-time data, and connectivity. Investigations into advanced control systems, particularly model predictive control (MPC), have demonstrated potential in dynamically modifying parameters based on predictive models [4]. Research incorporating machine learning methodologies with IoT data has shown enhanced energy management and user satisfaction by predicting requirements and modifying systems accordingly.
The objective is to attain these energy savings without sacrificing the convenience and quality of life for occupants, notwithstanding these innovations. Thermal conditions (temperature and humidity), indoor air quality, illumination, and noise levels are all determinants of comfort in residential buildings [5]. It is essential to maintain a balanced relationship between energy efficiency and occupant comfort. Conventional energy management systems often rely on generic solutions that do not consider the unique characteristics of each building, nor the specific needs and habits of individual residents [6]. Advanced energy prediction methodologies are employed in this context, facilitating the creation of energy management systems that are particularly customised to the distinct conditions and requirements of each residential property [7].
Climate change has significantly influenced energy use in residential structures. Clearly, rising global temperatures, altering weather patterns, and the increasing frequency and severity of extreme weather events significantly affect energy demand and consumption trends. The “intergovernmental panel on climate change” believes that the current increase in global temperatures is approximately 1.1 degrees Celsius above pre-industrial levels. If these patterns persist, additional increases can be anticipated [8]. Heightened heating requirements in colder parts and augmented ventilation needs in warmer areas are a primary mechanism via which climate change influences energy use. The demand for air conditioning and refrigeration systems in residential structures escalates with rising temperatures, resulting in heightened electricity usage. Conversely, regions with greater temperature variability are extending their heating demands, hence elevating energy requirements for heating systems [9]. This twofold effect exerts pressure on energy resources and infrastructure, hence amplifying the demand for effective energy management technologies.
Moreover, climate change is impacting both the quantity and reliability of energy supplies. Hydroelectric generation, reliant on water resources and precipitation, has become increasingly unstable owing to climate change. Alongside dependence on meteorological phenomena like storms, flooding, and heatwaves, energy supply networks and infrastructure are compromised, resulting in temporary shortages and elevated energy prices [10]. Consequently, greater emphasis is being placed on the utilisation of renewable energy sources and the improvement of energy efficiency in residential buildings. Consequently, renewable technologies like solar panels and wind turbines are being promoted to mitigate greenhouse gas emissions and diminish reliance on fossil fuels. Furthermore, the implementation of smart grid technology, along with energy-efficient appliances and thermal insulation in buildings, is essential for ensuring a sustainable energy supply in response to climate change [11]. Climate change significantly affects energy use in residential buildings; therefore, robust and adaptable energy management strategies are essential. Furthermore, residential structures can enhance sustainability through the utilisation of renewable energy sources, effective energy management, and the application of advanced forecasting methods to mitigate the impact of climate change on domestic energy consumption [12].
Despite advancements in building technology and energy management systems, numerous residential structures fail to provide efficient solutions for optimizing energy usage without sacrificing comfort. The energy management strategies of conventional systems are inadequate; for instance, manual adjustments of thermostats or lighting depend on compromises between comfort and energy conservation, rendering them ineffective in responding to variations in occupancy or weather conditions [13]. Attaining the optimal balance is a challenging endeavour since numerous factors affect the comfort level and energy usage inside a household. Weather conditions, people, and building attributes are all essential variables. Therefore, it is essential to develop models that can precisely predict the energy consumption and comfort levels of a residence, considering all of these elements [14,15]. Various approaches, such as data analytics and machine learning, must be employed to address this issue. These technologies enable more precise estimates of residential energy usage and comfort, facilitating required modifications. This work addresses the dual objectives of improving comfort and energy usage through innovative predictive methodologies, marking a significant leap in residential building management. This new component of research lies in the creation of a complete model that integrates a wider range of often-overlooked variables to enhance the accuracy of thermal comfort predictions.
The following portions of this article are organised as outlined below: Section 2 is a literature review that provides a thorough examination of the existing research on energy and forecasting methodologies. Section 3 consists of the factors defining comfort in residential building. Section 4 covers the data collection methods, predicting approaches, and evaluation criteria outlined in the experimental design and analysis. Section 5 delineates the advantages and obstacles of the approach, along with the interpretation of results and their implications. The findings and analysis are provided. Section 6 presents the conclusion, summarising the findings, contributions, and recommendations for further research.

2. Literature Review

The concept of comfort in residential structures is complex and encompasses several elements of the living environment designed to improve the emotional, psychological, and physical well-being of inhabitants. Figure 1 demonstrates that comfort is a multidimensional notion encompassing several essential components, such as thermal comfort, auditory comfort, visual comfort, and indoor air quality (IAQ). These aspects collectively foster an indoor environment that is both enjoyable and conducive. Optimal comfort levels for occupants are crucial for their productivity and well-being. Nonetheless, maintaining comfort often results in a substantial rise in energy consumption, as heating, cooling, and ventilation systems constitute a large fraction of a building’s overall energy usage [16]. This thesis primarily focusses on thermal comfort, defined as the psychological state indicating happiness with the thermal environment. Numerous elements, including architectural design, insulation, HVAC systems, appliances, and human behaviour, affect energy consumption in residential structures. The intricate interplay between building systems and tenant behaviour often causes conventional methods to fall short of optimal outcomes, even though they may yield modest enhancements in energy conservation [16]. The advent of advanced predictive methodologies offers a significant opportunity to enhance these efforts. These prediction algorithms are employed to forecast comfort levels and are examined about options for teaching stakeholders on these issues. The application of advanced predictive methods can substantially improve energy consumption management while preserving or enhancing comfort levels, especially thermal comfort. These technologies enable more accurate estimates of energy and comfort needs, therefore, promoting more intelligent and adaptable control of domestic energy systems.
Machine learning approaches have transformed the prediction of comfort due to their superior accuracy and agility in modeling. Boutahri et al. [4] conducted extensive evaluations on various machine learning models, including “support vector machine” (SVM), “artificial neural network” (ANN), “random forest” (RF), and XGBoost. This study illustrates the efficacy of the RF and XGBOOST algorithms, which consistently surpass numerous other algorithms in forecasting thermal comfort and optimising HVAC energy use. The efficacy of RF and XGBOOST in elucidating the intricate interactions within interior environments was emphasised by the elevated R2 values of 96.7% and 96.4%, respectively, in predicting PMV values. Conversely, the performance of SVM was significantly inferior, exhibiting a R2 of 81.1%, so indicating its limitations in tackling such a multifaceted context. Wu et al. [17] similarly suggested a multi-objective strategy that included “Bayesian optimization with extreme gradient boosting” (BOXGBoost). This methodology yielded markedly enhanced models in comparison to established models such as SVR and KNN, achieving a R2 value of 96%. The integration of predictive techniques with IoT and big data analytics is facilitating substantial progress in comfort forecasting. Big data analytics offers insights into tenant behaviour and building performance, while IoT devices facilitate real-time data collection and analysis [18]. Hybrid models, which amalgamate classical and machine learning approaches, are gaining prominence. Hybrid models can enhance the precision and dependability of predictions by integrating the flexibility of machine learning techniques with the advantages of deterministic models. The evaluation and comparison of several predictive strategies for forecasting comfort levels in residential structures indicate that advanced systems, such as neural networks, offer significant advantages in flexibility and precision. Conventional models and basic machine learning methods remain advantageous owing to their interpretability and lower demands for data and processing. Anticipated advancements in energy efficiency and comfort optimisation will arise from the continued integration of big data analytics and IoT with these predictive methodologies.

3. Factors Defining Comfort in Residential Buildings

In this section, we define the factors related to comfort in residential buildings.

3.1. Thermal Comfort

Thermal comfort significantly influences the well-being and happiness of residents, serving as a crucial element of total comfort in residential buildings [5]. Thermal comfort is defined as the mental state that conveys contentment with the thermal environment [19]. Similarly, the “international organisation for standardisation” (ISO) characterises thermal comfort in ISO 7730 as “the state of mind that reflects contentment with the thermal surroundings” [20]. In the 1970s, Fanger formulated the “predicted mean vote” (PMV) and “predicted percentage of dissatisfied” (PPD) indices, which are widely employed to assess and forecast thermal comfort in indoor settings. These indices are fundamental to these definitions. Included are the “thermal sensation vote” (TSVs), “thermal preference vote” (TPV), “standard effective temperature” (SET), “operative temperature” (OT), and various additional indices. The PMV index predicts the mean “thermal sensation votes” (TSV) of a substantial cohort of persons on a seven-point scale, spanning from −3 (freezing) to +3 (hot). The PMV is supplemented by the PPD index, which assesses the percentage of individuals likely to encounter thermal discontent under particular conditions. Air temperature, humidity, air velocity, and individual factors such as attire and metabolic rate collectively influence thermal comfort, as delineated by Fanger’s PMV model [21]. Recent research has expanded this model to include adaptive comfort models that consider behavioural adjustments [22].
  • Air Temperature: The key factor that affects thermal comfort. Discomfort can be elicited by both elevated and diminished temperatures. The ideal interior air temperature range is generally 20 °C to 24 °C in winter and 23 °C to 26 °C in summer, according to ASHRAE Standard 55 [19]. The thermal temperature range for tropical countries is established as 22 °C to 33.8 °C, whereas for subtropical countries, it is 15 °C to 32.23 °C [23].
  • Air Velocity: The rate of thermal exchange between the body and the environment is affected by air movement. In humid conditions, mild air circulation can enhance comfort by augmenting heat dissipation by convection and evaporation [24].
  • Humidity: Humidity levels can significantly affect the feeling of temperature. Elevated humidity can intensify the discomfort of high temperatures, and diminished humidity can amplify the chill of low temperatures. The ideal indoor humidity level is often between 30% and 50%.
  • Radiant Temperature: The comfort of an individual can be affected by the temperature of nearby surfaces, including walls, windows, and floors. For instance, pain may arise from increased radiant temperature radiating from a window on a humid day, despite the ambient air temperature being within a tolerable range. Maintaining a balance of radiant temperatures within a place is crucial for thermal comfort [25].
  • Clothing Insulation: The thermal comfort of inhabitants can be affected by the amount and type of clothing they wear. Apparel serves as an insulator, affecting the body’s thermal gain or loss. The thermal insulation of clothing is measured in clo units, with the typical indoor garment providing around 0.5 to 1.0 clo [26].
  • Metabolic Rate: This correlates with the activity level of the residents. The body generates additional heat due to elevated metabolic rates, such as those induced by physical exercise, which might affect thermal comfort. The metabolic rate is measured in met units, where one met denotes the energy production rate per unit surface area of an average human at rest [27].
Thermal comfort has been extensively studied across diverse living environments and climatic conditions. Studies indicate that thermal comfort preferences are significantly affected by seasonal variations and geographic location. Occupants in milder climates want elevated air velocities for enhanced cooling, while those in colder regions necessitate more insulation and greater mean radiant temperatures for comfort maintenance. Seasonal deviations considerably influence thermal comfort. To sustain indoor environments within the comfort zone, specific solutions for summer and winter circumstances are essential. Numerous research studies have demonstrated that during cold conditions, elevated humidity coupled with reduced air velocity is preferable, whereas in summer, diminished humidity alongside increased air velocity is beneficial. An effective technique for sustaining thermal comfort in residential structures must strike a balance between individual and environmental factors. Precise measurement and forecasting technologies are essential to optimise indoor conditions and ensure occupant comfort and well-being.

3.2. Indoor Air Quality

Interior Air Quality (IAQ) is a vital component of interior comfort that significantly influences the health and well-being of inhabitants [25]. Ozone (O3), volatile organic compounds (VOCs), carbon dioxide (CO2), nitrogen dioxide (NO2), and particulate matter (PM) constitute the principal pollutants. Recent research has emphasised the need of preserving indoor air quality, especially regarding extended indoor exposure [16]. Key factors influencing IAQ include the following:
  • Carbon Dioxide (CO2): Elevated CO2 levels, indicative of insufficient ventilation, may lead to drowsiness, headaches, and impaired cognitive function. It generally ranges from 350 to 2500 parts per million (ppm) [25].
  • Volatile Organic Compounds (VOCs): Various residential products, furnishings, and construction materials release these emissions. Irritation of the eyes, nostrils, and throat, headaches, and potential long-term health consequences may arise from increased concentrations of VOCs. Strategies for improving IAQ encompass the use of low-VOC materials and the implementation of adequate ventilation [28].
  • Particulate Matter (PM): PM2.5 and PM10 are particularly concerning because they can reach the lungs and permeate the circulation, leading to respiratory and cardiovascular problems [25].

3.3. Visual Comfort

The implementation of appropriate lighting design improves visual comfort and substantially reduces energy consumption. The “illuminating engineering society of north america” (IESNA) specifies optimal lighting techniques for residential structures, focussing on the incorporation of natural light [29]. The research conducted emphasises the psychological and physiological advantages of appropriate lighting settings [28]. Factors to consider include the following:
  • Illuminance: Proper illumination is essential for the effective and comfortable execution of visual tasks. The IESNA generally advises illuminance levels between 200 and 500 lux for indoor spaces, contingent upon the specific activity [30].
  • Colour Temperature: Warm light (2700–3000 K) is generally more soothing, whereas cooler light (4000–5000 K) can enhance alertness and productivity. The selection of a suitable colour temperature can enhance visual comfort and mood [31].
  • Glare: Excessive luminosity or contrast can compromise visual functioning and cause discomfort. Methods for diminishing sunlight encompass the use of diffusers, window coverings, and suitable lighting apparatuses [32].
  • Daylighting: Natural light can significantly enhance comfort and reduce reliance on artificial lights. Daylighting optimisation can be accomplished by employing reflective surfaces, light shelving, and appropriate window placement [32].

3.4. Acoustic Comfort

Acoustic comfort, often overlooked, is crucial for general well-being. The standard methodologies for acoustic evaluations in buildings, emphasizing measures such as reverberation time, sound insulation, and ambient noise levels [33]. Fang et al. [34] illustrate that inadequate acoustic environments can result in heightened stress and diminished productivity.
  • Background Noise: Distracting and stressful can be the result of persistent low-level commotion. To prevent adverse health effects, the WHO advises that residential noise levels should not exceed 35 dB during the day and 40 dB at night [35].
  • Sound Insulation: The living area is protected from external disturbances, and noise transmission between rooms is reduced by the use of efficient sound insulation. This can be achieved through the utilisation of construction methods, materials, and architectural design [36].
  • Reverberation Time: The time necessary for sound to disperse in a specific space. In residential environments, it is recommended to employ lower reverberation times, approximately 0.5 s, to facilitate clear verbal communication and minimise noise levels [33].
The comfort level of residential structures is influenced by the intricate interplay of thermal comfort, IAQ, lighting, acoustics, and general satisfaction. It is essential to understand and enhance these elements to increase energy efficiency and occupant well-being. Advanced predictive approaches, like AGI, can be employed to achieve substantial enhancements in sustainability and comfort as progressively intelligent and adaptable building systems are developed.

4. Experimental Design and Analysis

This section offers a thorough explanation of the data analysis method, explains the components that determine comfort, and outlines the numerous prediction models utilised to forecast comfort.

4.1. Data Collection

The “ASHRAE global thermal comfort database II” is the principal data source for this study. It encompasses extensive information about thermal comfort across many climates, seasons, continents, and building types worldwide. The extensive and high-quality data in this collection, obtained from field research conducted between 1995 and 2015, provides a solid foundation for the construction of prediction models [37].

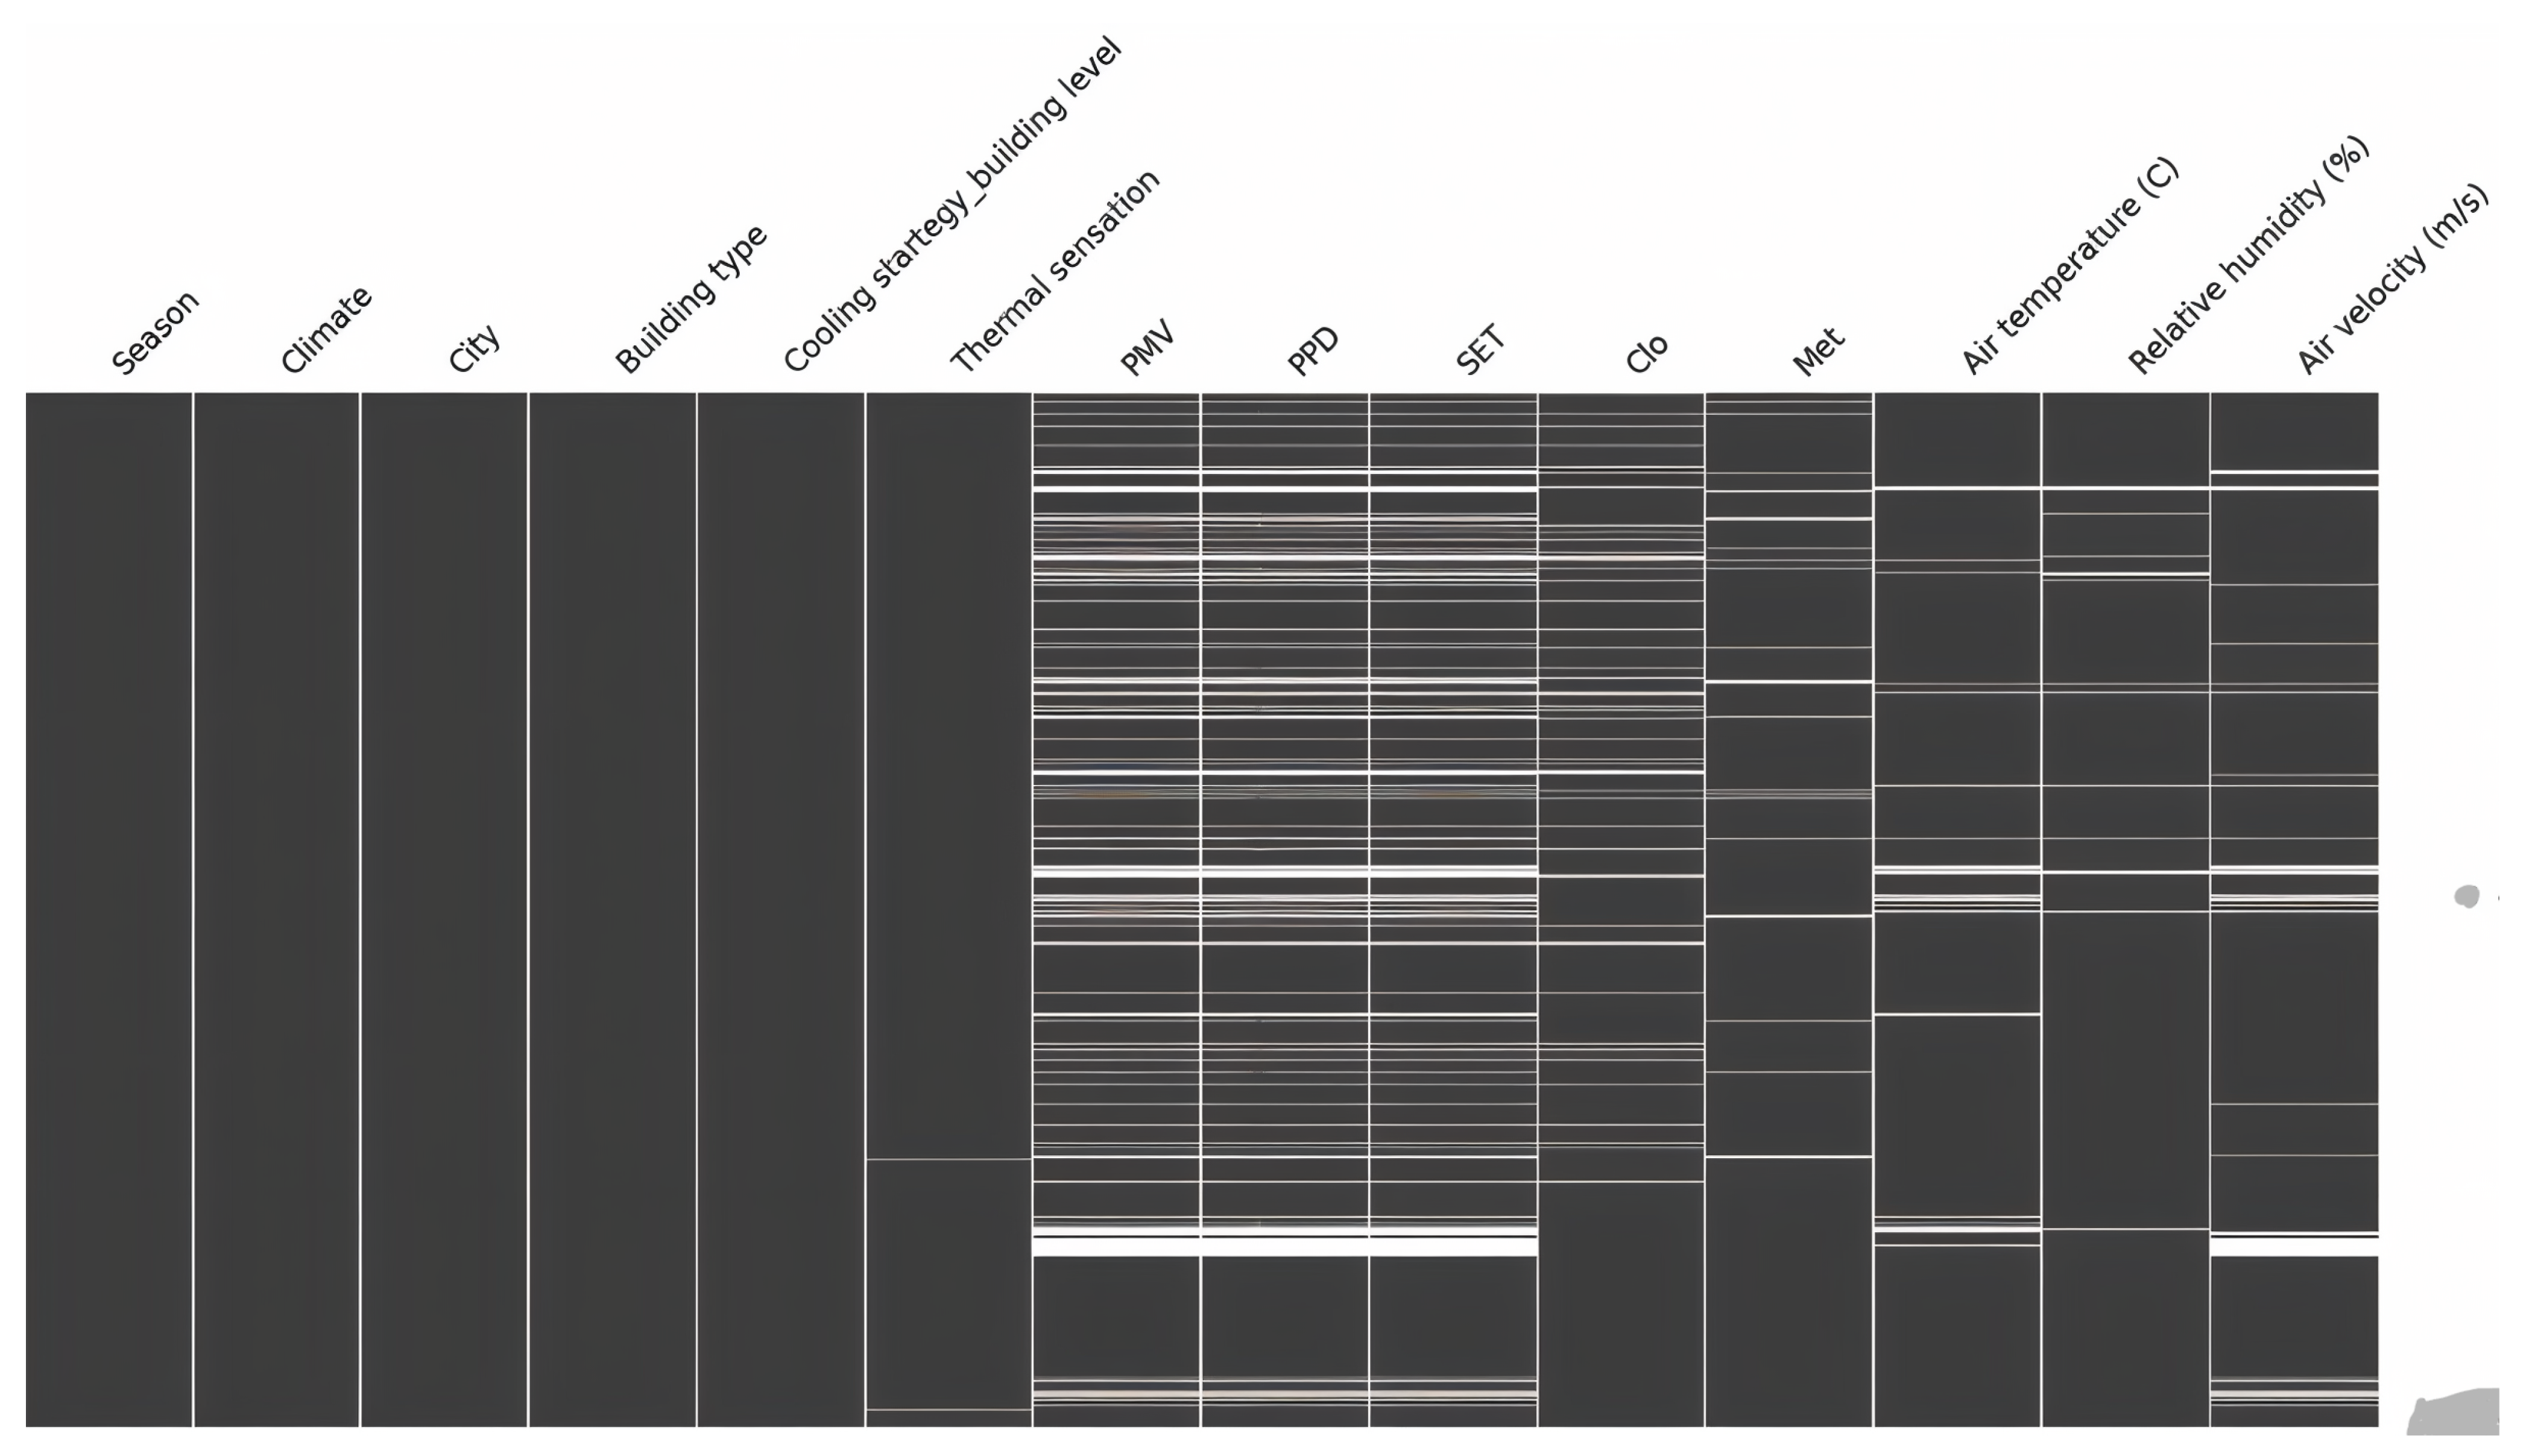
4.2. Data Description

The ASHRAE Global Thermal Comfort Database II consists of 107,583 entries and 70 variables, including the following:
  • Contextual Information: Occupancy patterns, building type, and geographic location.
  • Personal Parameters: Metabolic rate, clothing insulation, and occupant feedback on thermal comfort.
  • Environmental Parameters: Air velocity, radiant temperature, humidity, and air temperature.
  • Enviromental Control: Fan, window, door, blind, etc.
  • Thermal Comfort Indices: PMV, TSV, PPD, TPV, and SET.

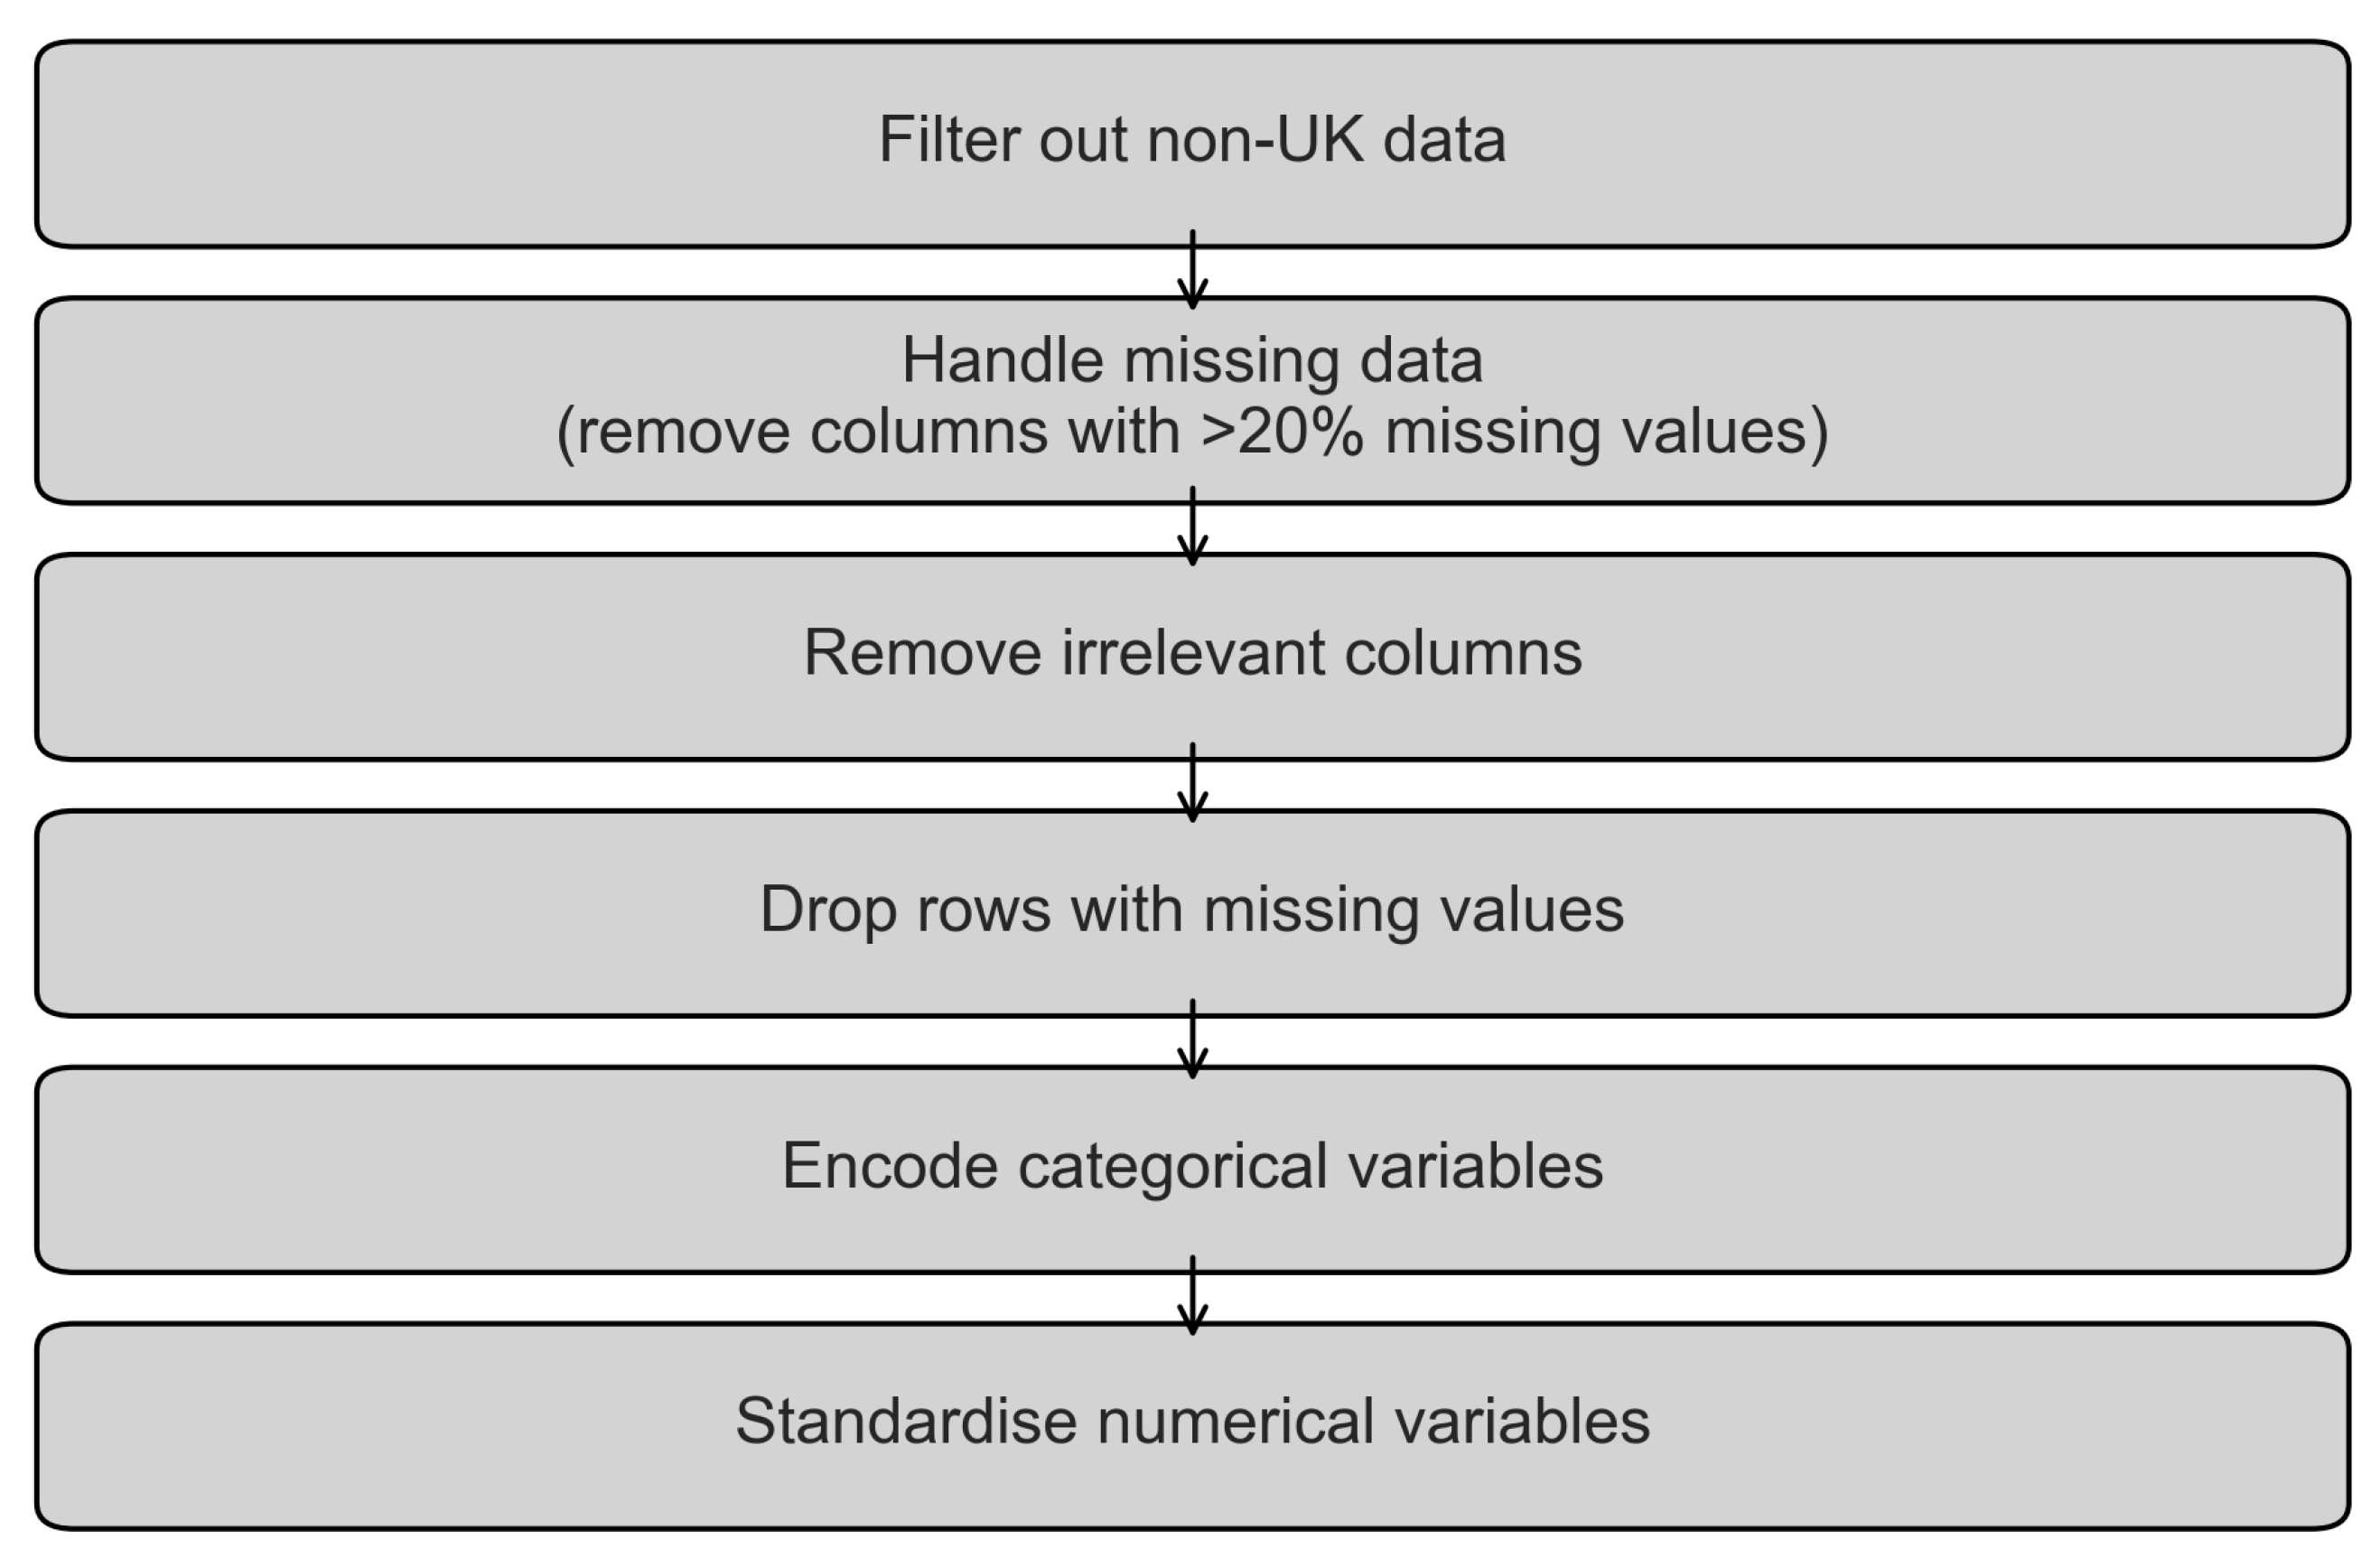
4.3. Data Preprocessing

The development of a high-performance and efficient machine learning model depends on the quality of the training data; hence, the data preparation stage is absolutely necessary. The preparation pipeline consists of several important processes that assure a clean, relevant dataset ready for analysis. Rich ecosystem of libraries including Pandas for data manipulation, Scikit-learn for machine learning, and Matplotlib for data visualisation helped the Python (version, 3.13) programming language be used for this process. The main steps are given in Figure 2.

4.4. Data Filtering

In order to focus the analysis on the dataset that is most relevant to the study, specifically the UK dataset, specific filtration criteria were implemented to exclude non-UK data. This necessitated the implementation of data manipulation techniques to create configurations that exclusively preserved documents associated with the United Kingdom. Boolean indexing was employed to achieve this. The geographic location column was validated by employing the unique() function. This was executed to ensure that the entries included solely information relevant to the United Kingdom. This method enhanced the dataset and guaranteed that the findings and recommendations were relevant to the context of the United Kingdom, resulting in a more precise and pertinent analysis.

4.5. Handling Missing Values

Missing data were effectively addressed to ensure the dataset’s integrity and usability. The “isnull().sum()” function in the pandas library of Python was utilised to detect missing values. A criterion was set for permissible missing data, necessitating the elimination of columns with over 20% missing values to ensure optimal model performance. Columns were eliminated to refine the dataset in alignment with this criteria, ensuring that the residual data was both comprehensive and reliable.

4.6. Removing Irrelevant Columns and Rows

The drop() function was utilised to delete extraneous columns, hence diminishing computing load and noise to exclude those that do not enhance the prediction model. This involved identifying and eliminating columns considered irrelevant or redundant, based on statistical analysis and subject expertise. The missingno library was utilised to display the absent rows to ascertain the distribution of missing values across the other columns. The most effective solution identified was the elimination of these rows with the dropna() method, as evidenced by the image. The detail overview is given in Figure 3.

4.7. Encoding Categorical Variables

Categorical variables were encoded to convert categorical data into a numerical format suitable for machine learning techniques. This approach is essential since most machine learning algorithms require numerical input. The variables underwent transformation through encoding techniques, such as label encoding. This phase was crucial for enhancing the performance of the predictive models and preserving the integrity of the dataset.

4.8. Standardising Numerical Variables
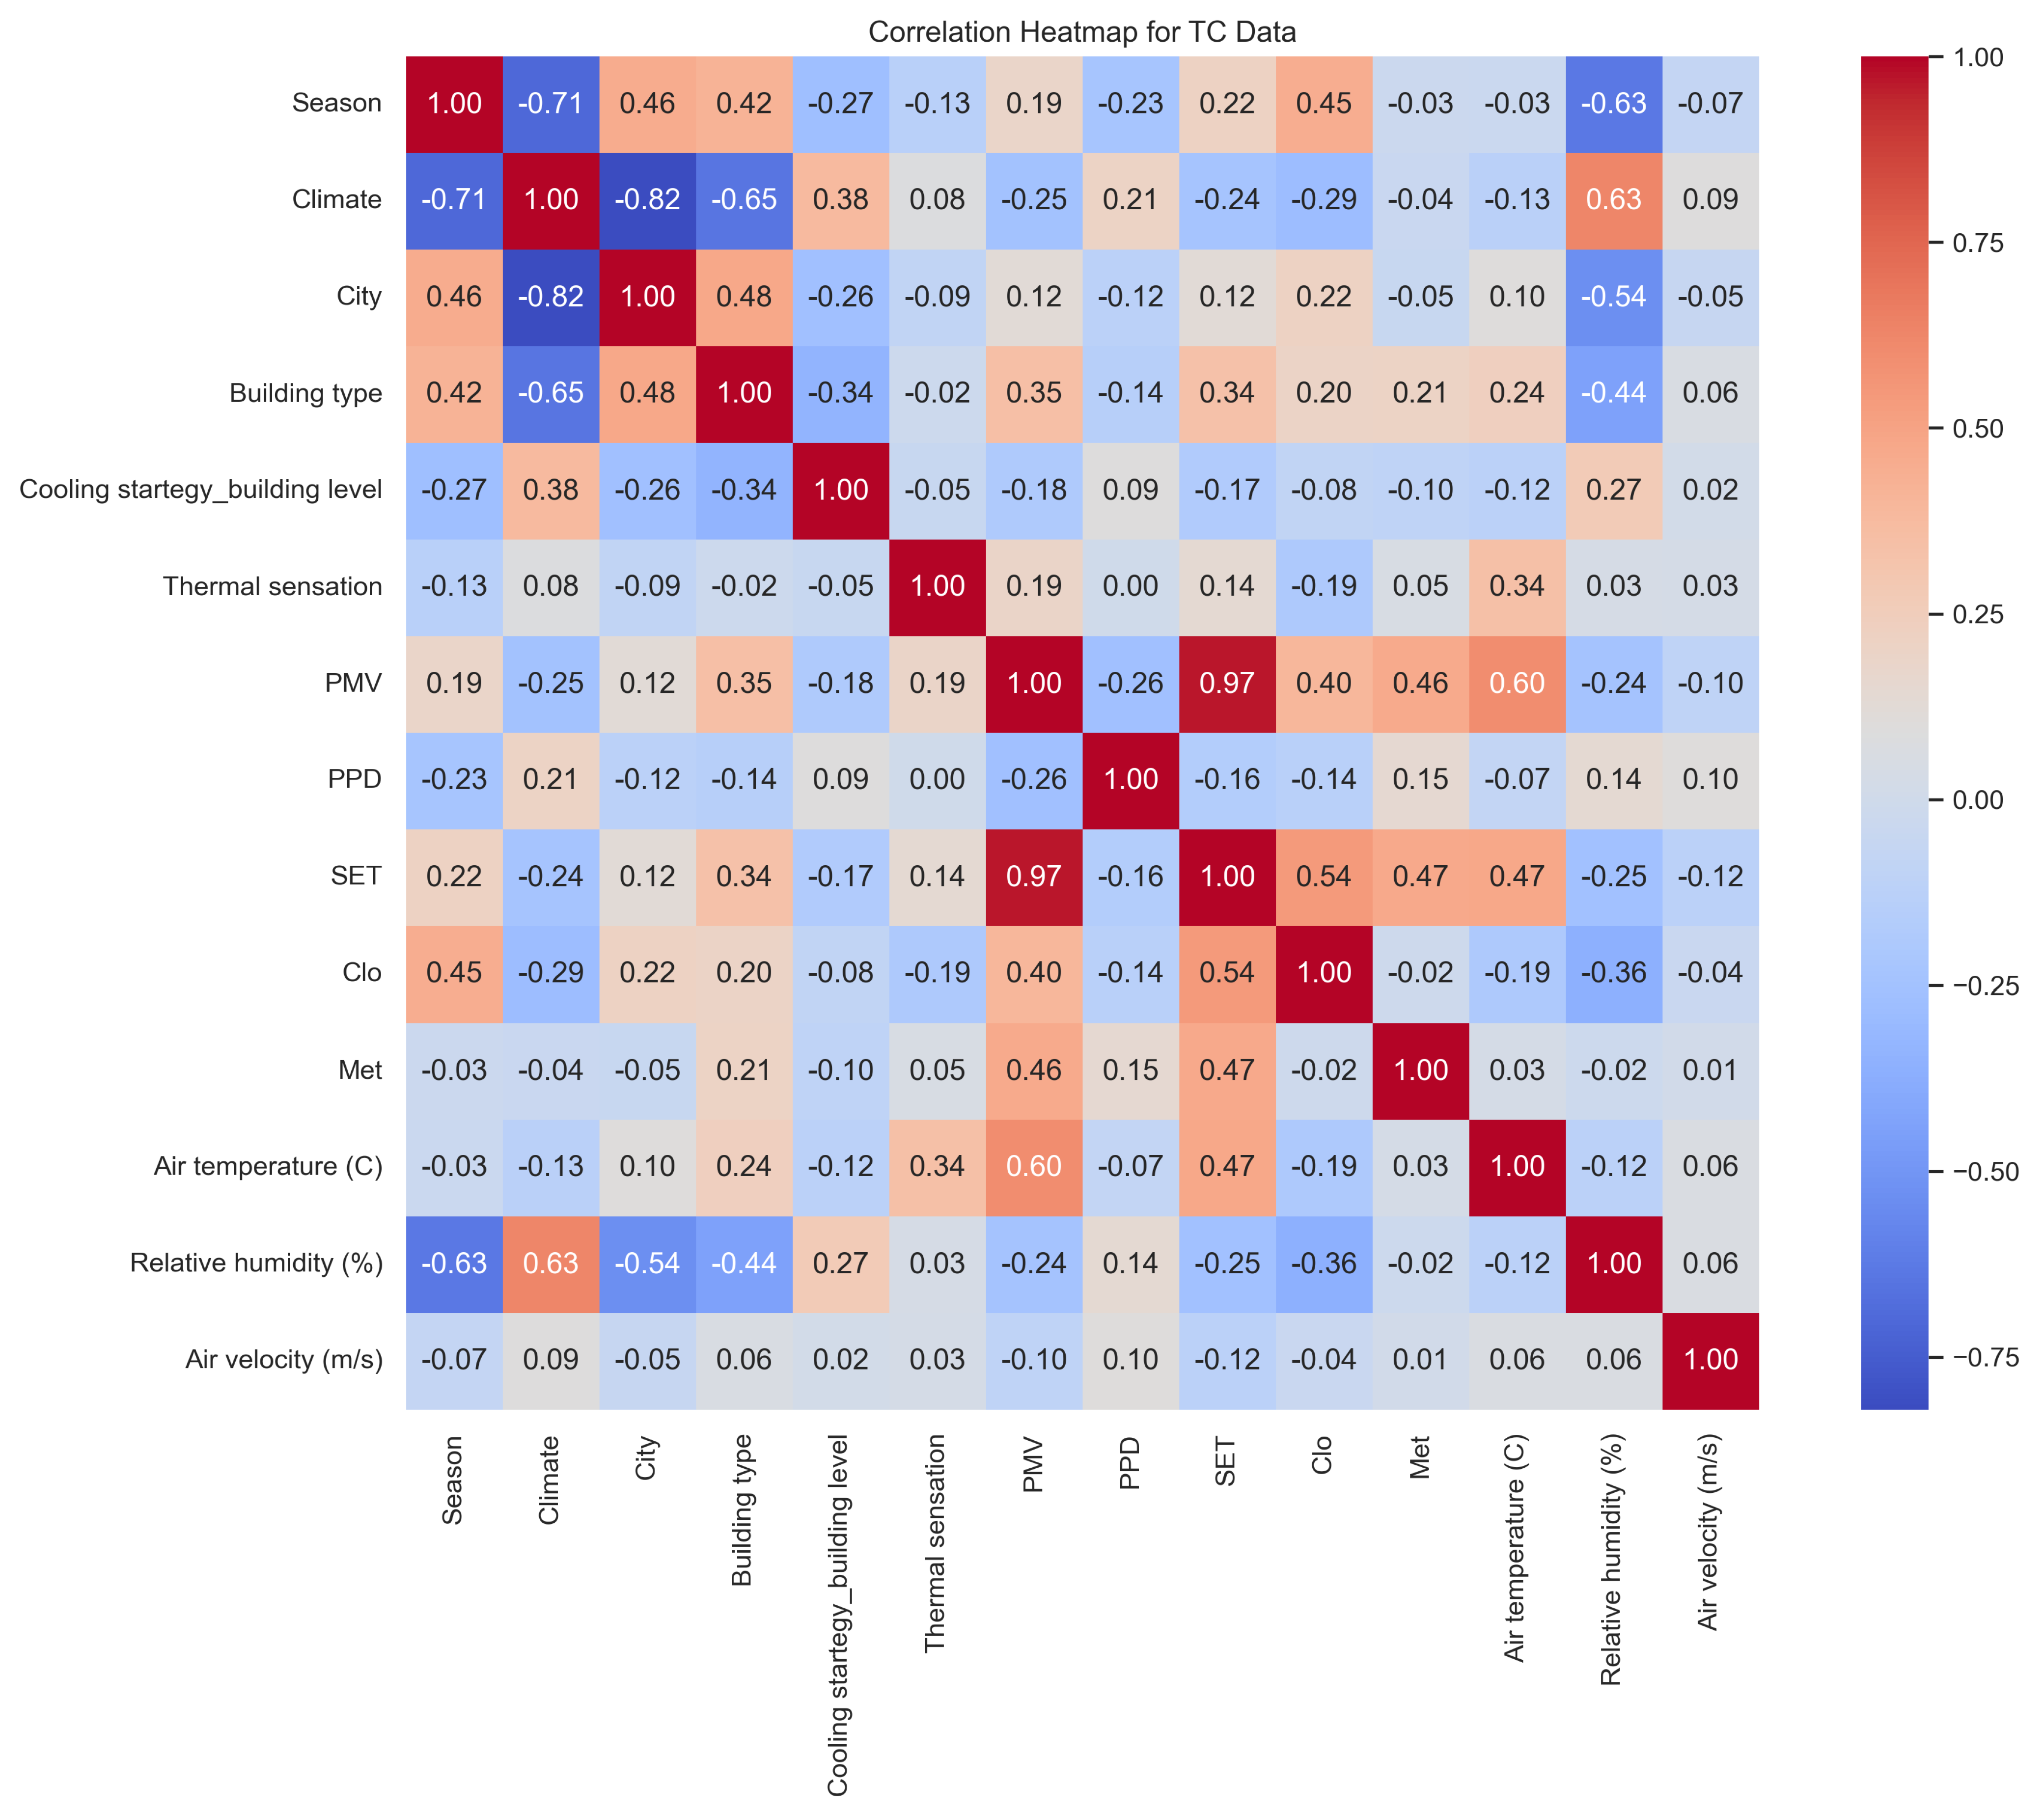
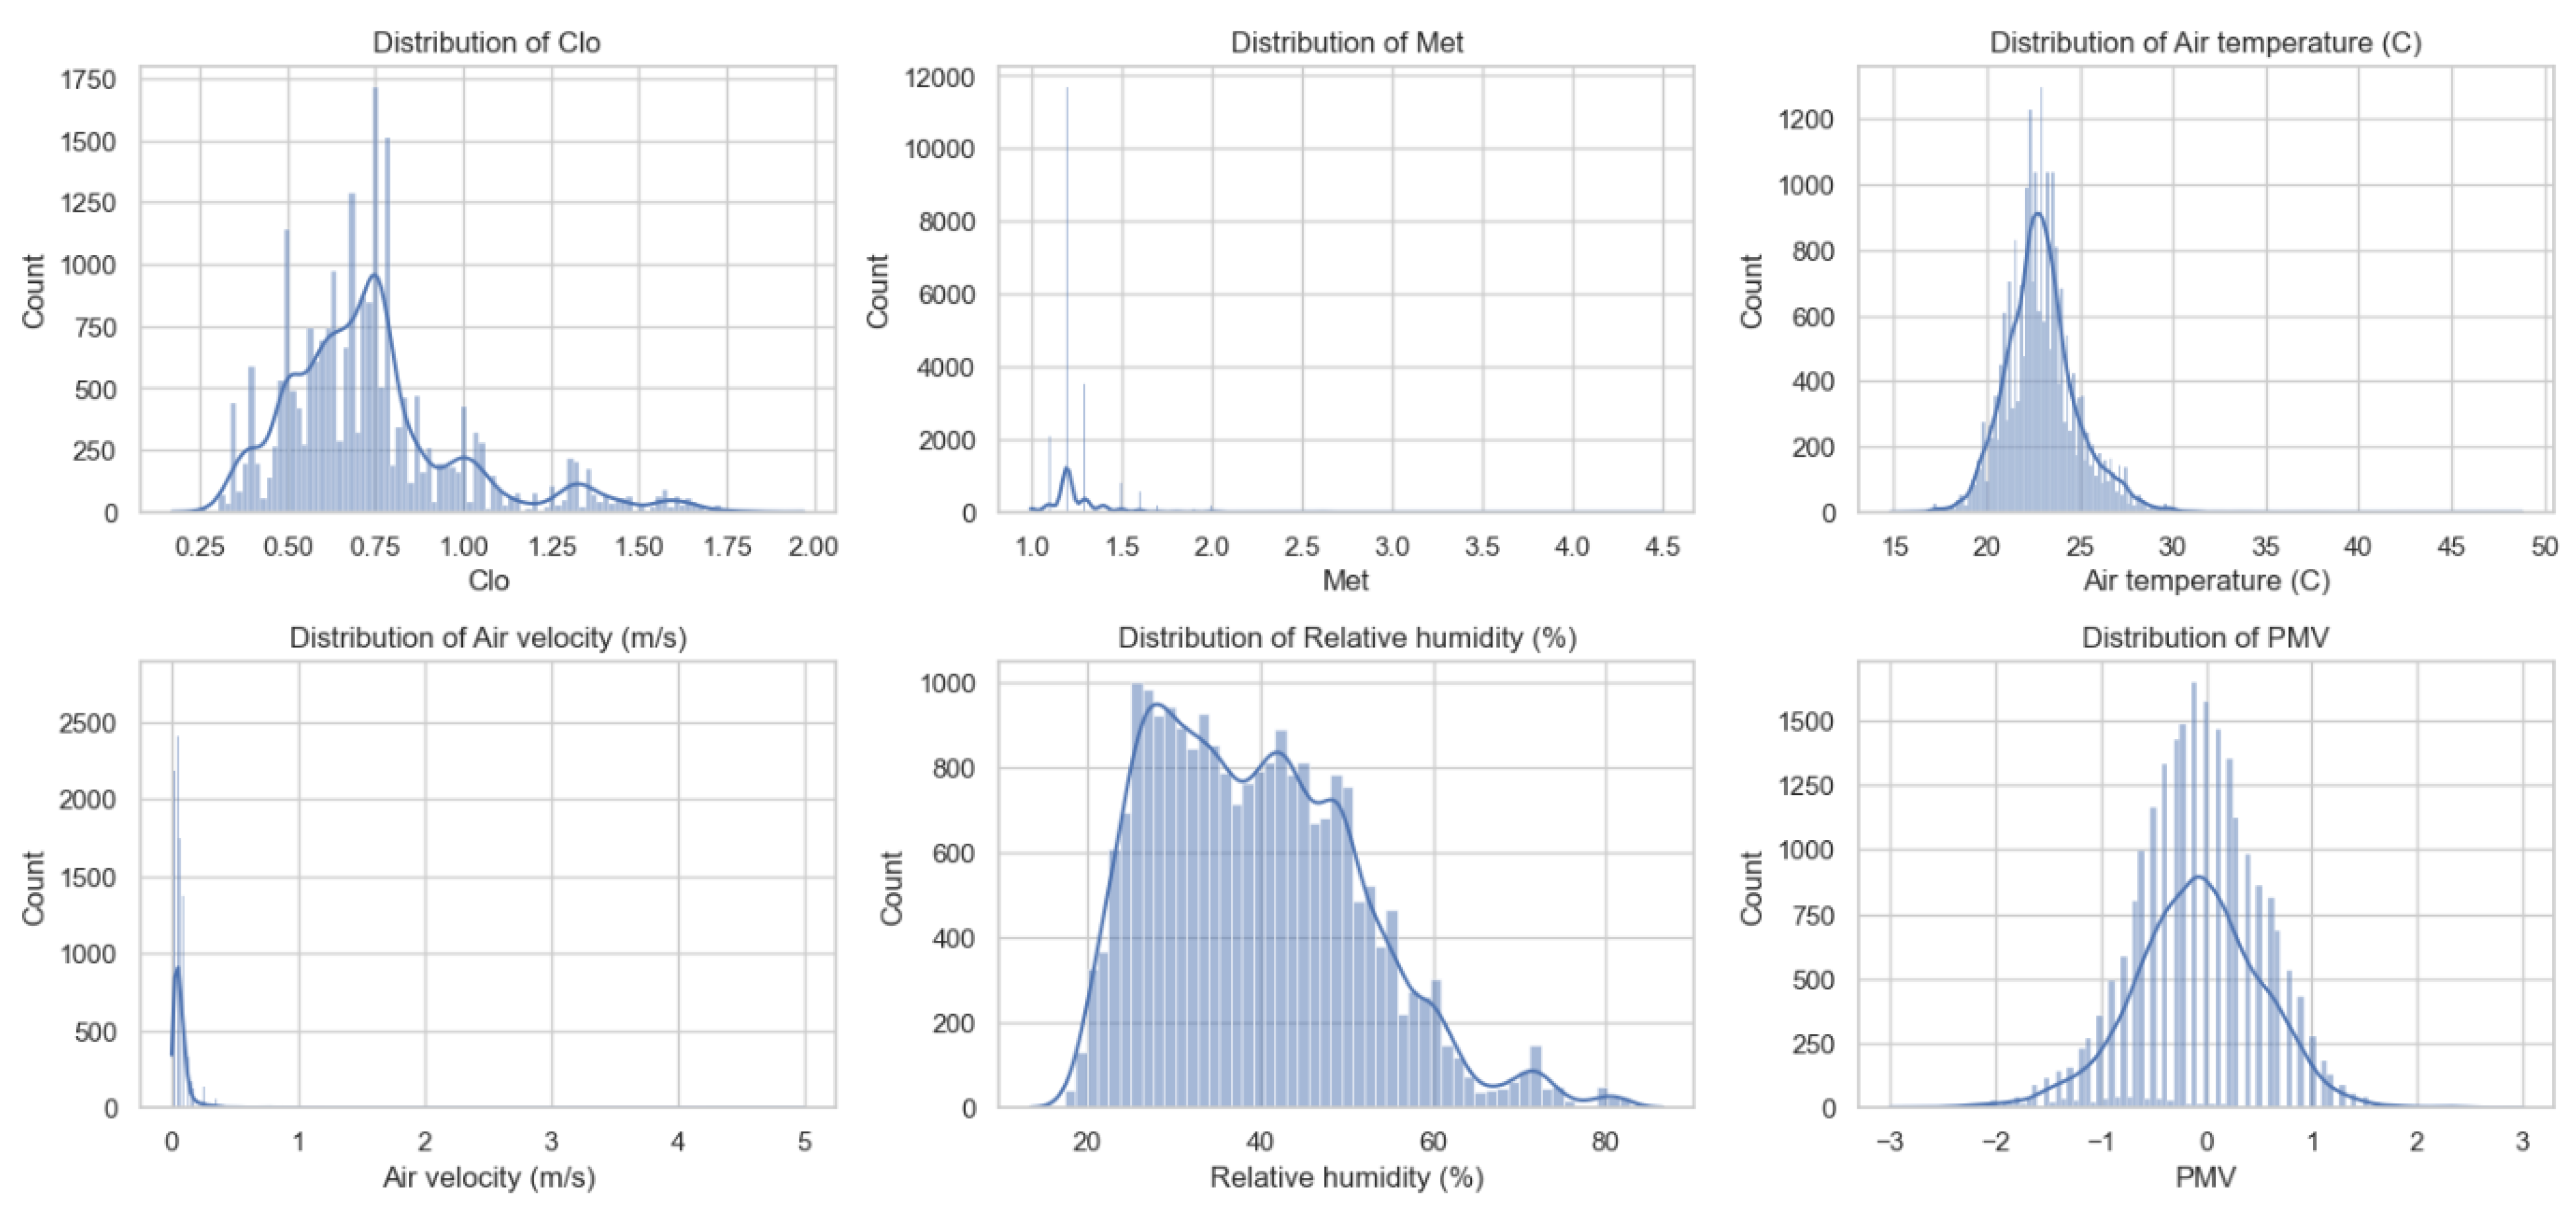
Numerical variables were normalised to improve the effectiveness of machine learning algorithms and to normalise the magnitude of all numerical features. The StandardScaler from scikit-learn was utilised to standardise the numerical variables. This transformation guarantees uniformity among characteristics and enhances the effectiveness of predictive models by normalising the data to a mean of 0 and a standard deviation of 1.

4.9. Analysis

The data analysis process is a series of procedures that are designed to prepare the dataset, conduct exploratory analysis, construct prediction models, and evaluate their effectiveness. The data are preprocessed to identify critical factors that could potentially affect thermal comfort. Consequently, a suitable model is selected, trained, and assessed for its reliability and accuracy.

Explorative Data Analysis

The preprocessed dataset was studied to discern patterns and distributions through visualisation approaches, including heatmaps and histograms. Figure 4 illustrates the correlation across variables, demonstrating a robust positive relationship between thermal comfort indices, specifically PMV and SET, and determinants such as air temperature, clothing, and metabolic rate.
The histograms in Figure 5 elucidate the distributions of essential variables that affect thermal comfort in indoor spaces. The clo values, indicative of clothing insulation, reach a maximum between 0.6 and 0.8, implying that modest interior clothing selections offer optimal insulation. The met values, indicative of metabolic rates, are markedly biassed towards 1.0, a trait associated with sedentary activities like desk work or sitting. The air temperature distribution is roughly normal, centred between 22 °C and 26 °C, aligning with the comfort range of most interior environments. The air velocity measurements are predominantly around 0 m/s, signifying a regulated environment with restricted draughts and minimum air circulation, which facilitates comfort maintenance.
The relative humidity distribution exhibits a “bimodal” pattern, with peaks at 30–40% and 50–60%, signifying that the fluctuations remain within the typical indoor comfort range. The PMV readings often converge around 0, indicating that the majority of conditions attain a neutral thermal comfort level. The majority of occupants attain thermal neutrality, with only modest variations towards sensations of warmth or coolness. The predominant PMV values reside within the interval of −1 to +1. The data suggest that these interior spaces are typically engineered to uphold circumstances conducive to human thermal comfort.
The relevance of features for the machine learning models was assessed using feature importance, a technique that assigns a score to input features based on their efficacy in predicting the target variable.

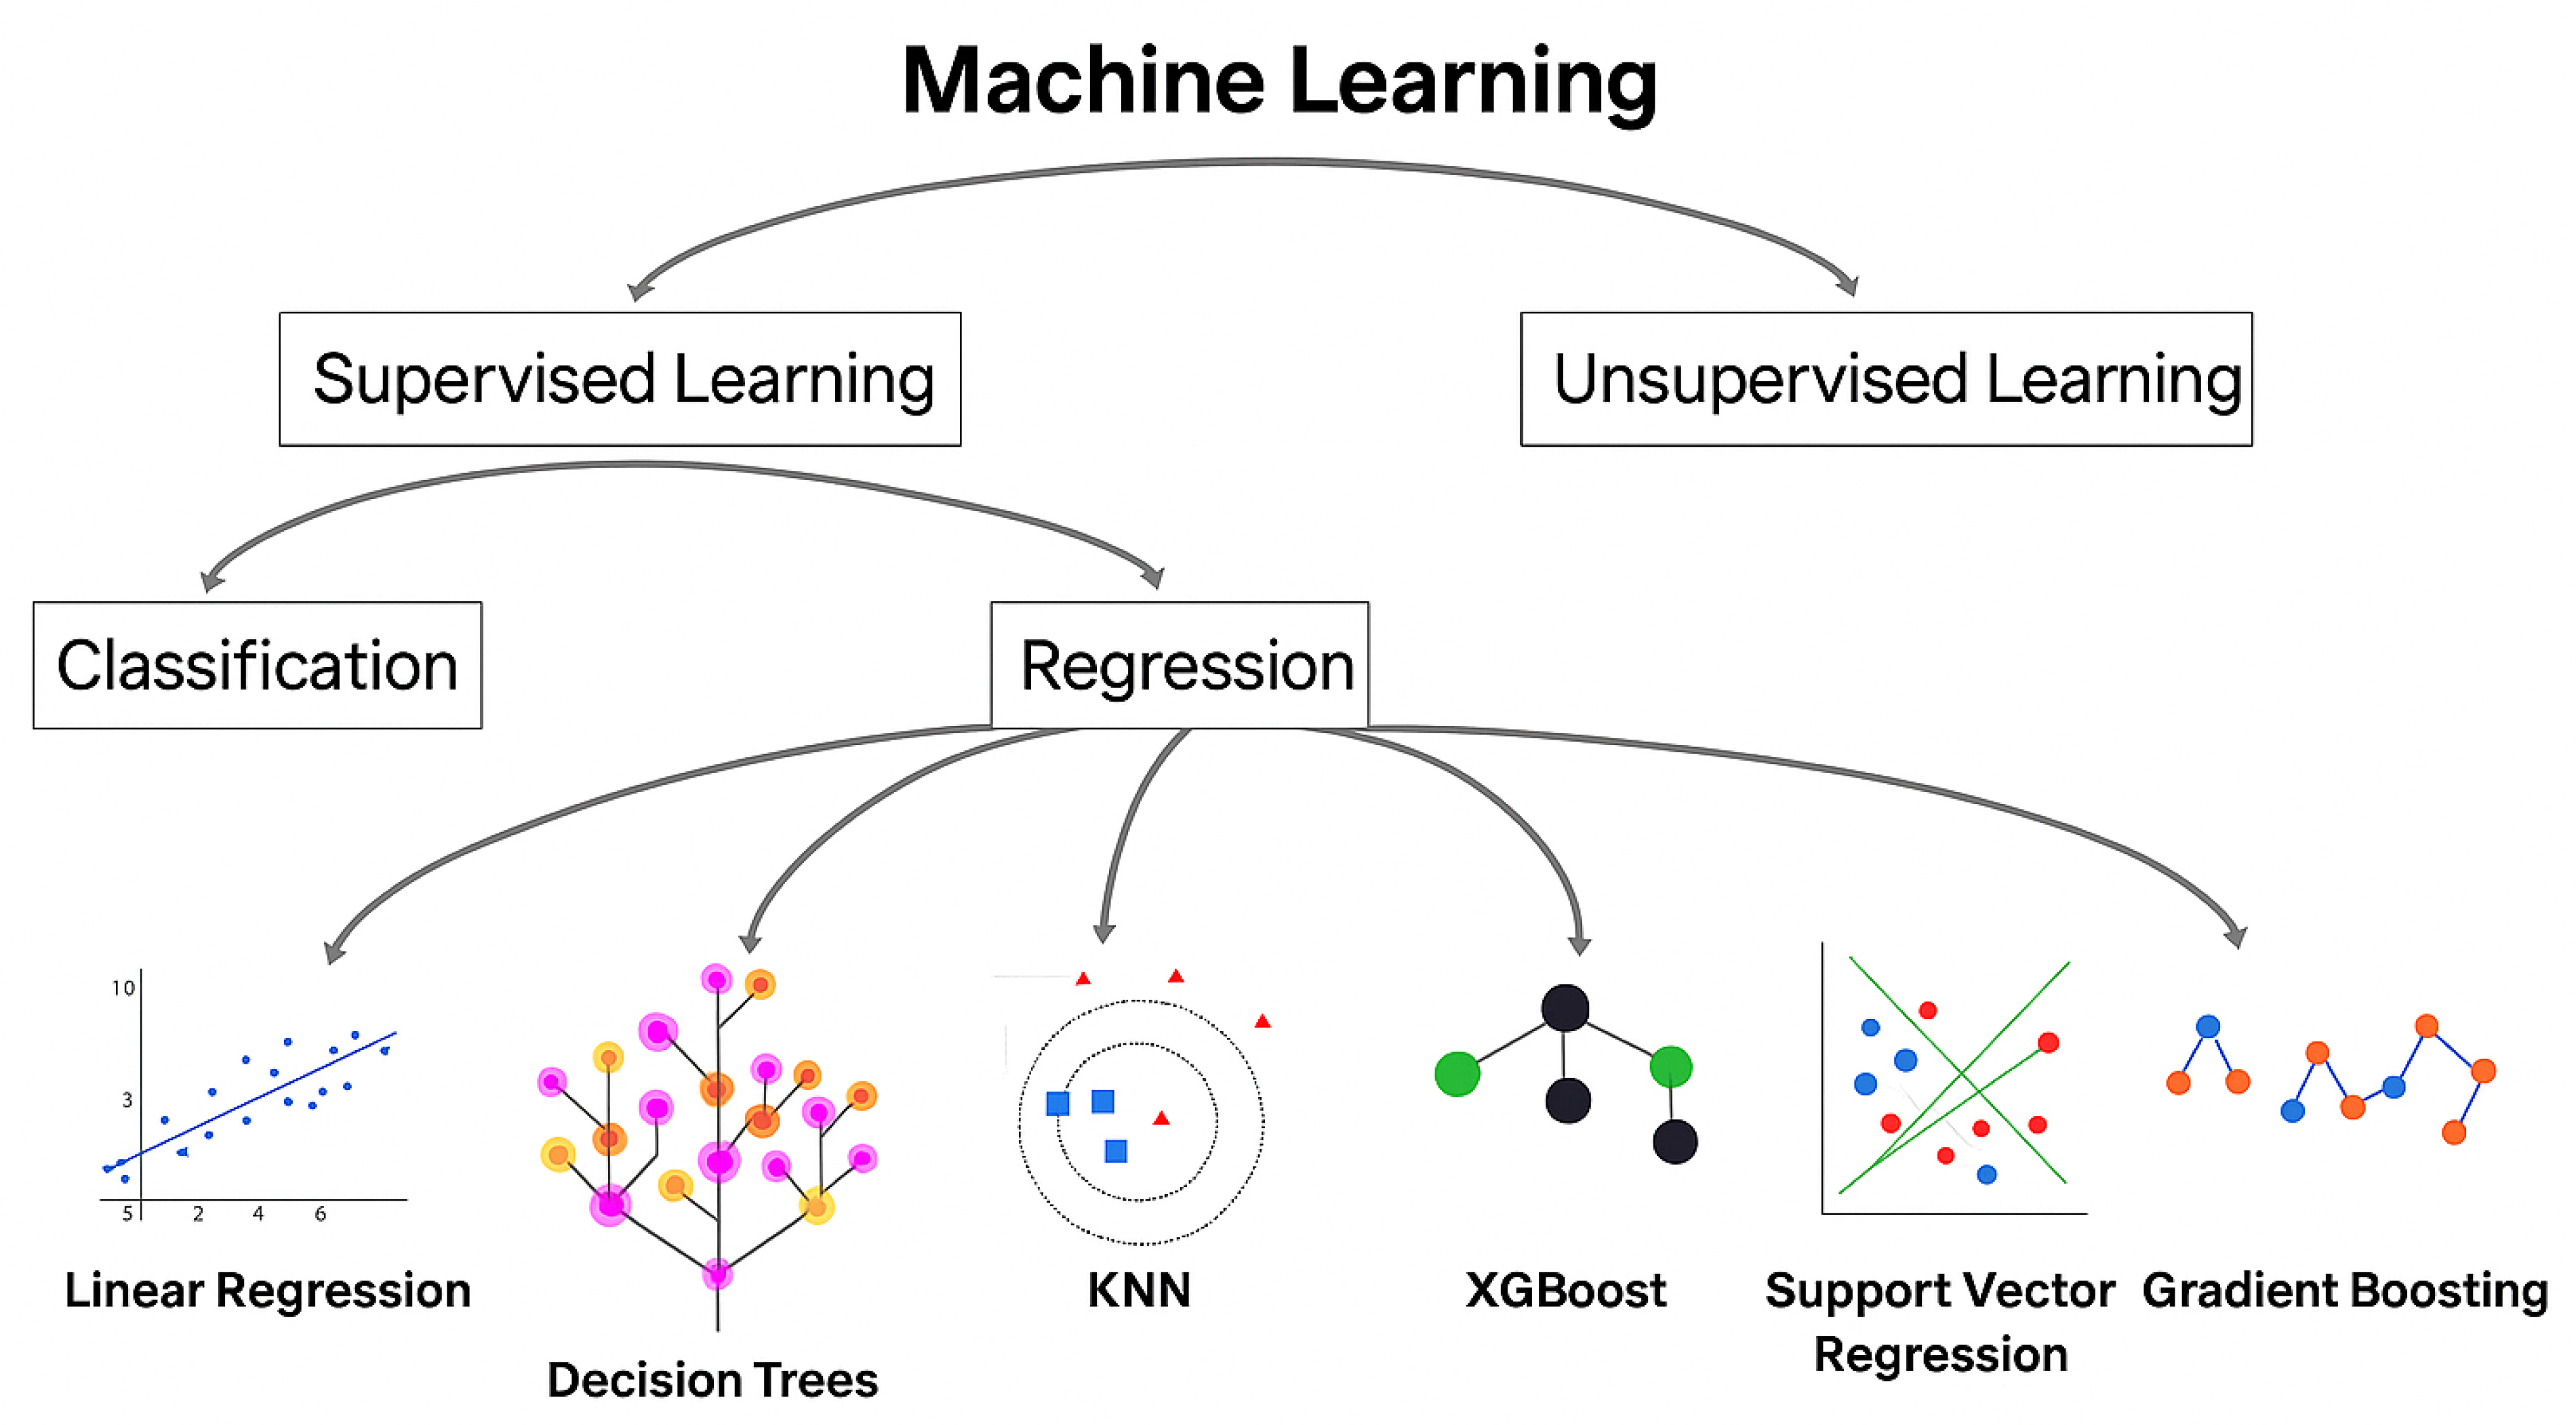
4.10. Development of Predictive Models

In order to guarantee reliability, the dataset was divided into 80% for training and 20% for testing, with a designated random state to ensure consistency. The ASHRAE Thermal Comfort Database was leveraged to forecast thermal comfort and improve energy efficiency in residential buildings using a variety of machine learning techniques. The established prediction models integrate both linear and non-linear methodologies, ensuring a precise representation of the complex relationships between environmental variables, energy consumption, and occupant comfort. These models were chosen for a variety of reasons, such as their interpretability and simplicity, their robustness against overfitting, and their ability to accommodate non-linear correlations and interactions between environmental factors and individual preferences. This publication provides a comprehensive analysis of each model, delineating the methodologies used for training and validation. Overview of different models given in Figure 6.
  • Linear Regression (LR): LR is a fundamental statistical technique that involves the formulation of the relationship between a dependent variable and one or more independent variables by fitting a linear equation to observed data. This model is selected due to its interpretability and simplicity, rendering it an appropriate baseline model. The ASHRAE dataset is used to forecast thermal comfort levels, which are influenced by environmental variables such as temperature, humidity, and relative humidity, using linear regression. The least squares method is employed to train the model, with the objective of minimising the sum of squared discrepancies between the predicted and observed values of the dependent variable.
  • Decision Tree (DT): DT is a non-linear model that produces a tree-like structure of decisions by partitioning the data into subsets according to the most influential variables. The decision tree is trained by iteratively partitioning the dataset according to the feature that yields the maximum information gain, or, correspondingly, the minimum Gini impurity or entropy.
  • Random Forest (RF): RF is an ensemble learning method that entails the creation and integration of several decision trees to yield more accurate and reliable predictions. This approach is very resilient to overfitting and provides measures for feature relevance. This study enhances comfort predictions by pooling the outputs of many decision trees through random forest. The model was developed by generating several decision trees, each trained on a random subset of the data (regarding features and samples), and subsequently averaging their predictions.
  • Gradient Boosting (GB): GB is a supplementary ensemble method that entails the successive development of models, where each consecutive model rectifies the mistakes of its predecessor. It is known for its capacity to handle complex data; however, it may overfit if not carefully tuned. Gradient boosting was employed to improve the model’s precision with each iteration, thus refining estimates of thermal comfort and energy usage. The primary focus of the model’s training was the residual errors of the previous models.
  • Support Vector Regressor (SVR): The objective of SVR is to identify the most effective hyperplane for accurately predicting the continuous value of the target variable with the greatest margin.
  • Extreme Gradient Boosting (XGBoost): XGBoost is an advanced implementation of gradient boosting that includes optimisations like regularisation to mitigate overfitting and effectively handle missing data. Models were developed using XGBoost to precisely predict thermal comfort. It is esteemed for its ability to handle complex relationships among variables and extensive datasets.
  • K-Nearest Neighbours (KNN): By utilizing the training instances that are situated in the feature space closest to the target variable, the KNN algorithm is an instance-based learning technique that forecasts the value of the target variable. Predictions are generated by either the majority vote or the average of the k-nearest neighbours to the input data point as KNN does not necessitate a formal training step. This is due to the fact that KNN does not necessitate any of these methods.

4.11. Model Evaluation

The coefficient of determination (R-squared), mean squared error (MSE), and root mean squared error (RMSE) was utilised to evaluate the regression models.
  • R2 (Coefficient of Determination): This statistic measures the degree to which the independent variables forecast the variance of the dependent variable. An R2 value approaching 1 indicates that the model possesses substantial explanatory power and accounts for a considerable percentage of the variance in thermal comfort and energy use.
    R 2 = 1 i = 1 n ( y i y ^ i ) 2 i = 1 n ( y i y ¯ ) 2
  • Mean Squared Error (MSE): The MSE is a metric that calculates the average of the squared deviations between the expected and actual values. A reduced MSE indicates that the model’s predictions are highly accurate in predicting energy consumption and thermal comfort as they closely align with the actual values.
    MSE = 1 n i = 1 n ( y i y ^ i ) 2
  • Root Mean Squared Error (RMSE): It signifies the standard deviation of the residuals (prediction errors). A reduced RMSE signifies enhanced model performance, akin to the MSE. It is advantageous for assessing the precision of different models or determining the degree to which a model aligns with the facts.
    RMSE = MSE = 1 n i = 1 n ( y i y ^ i ) 2

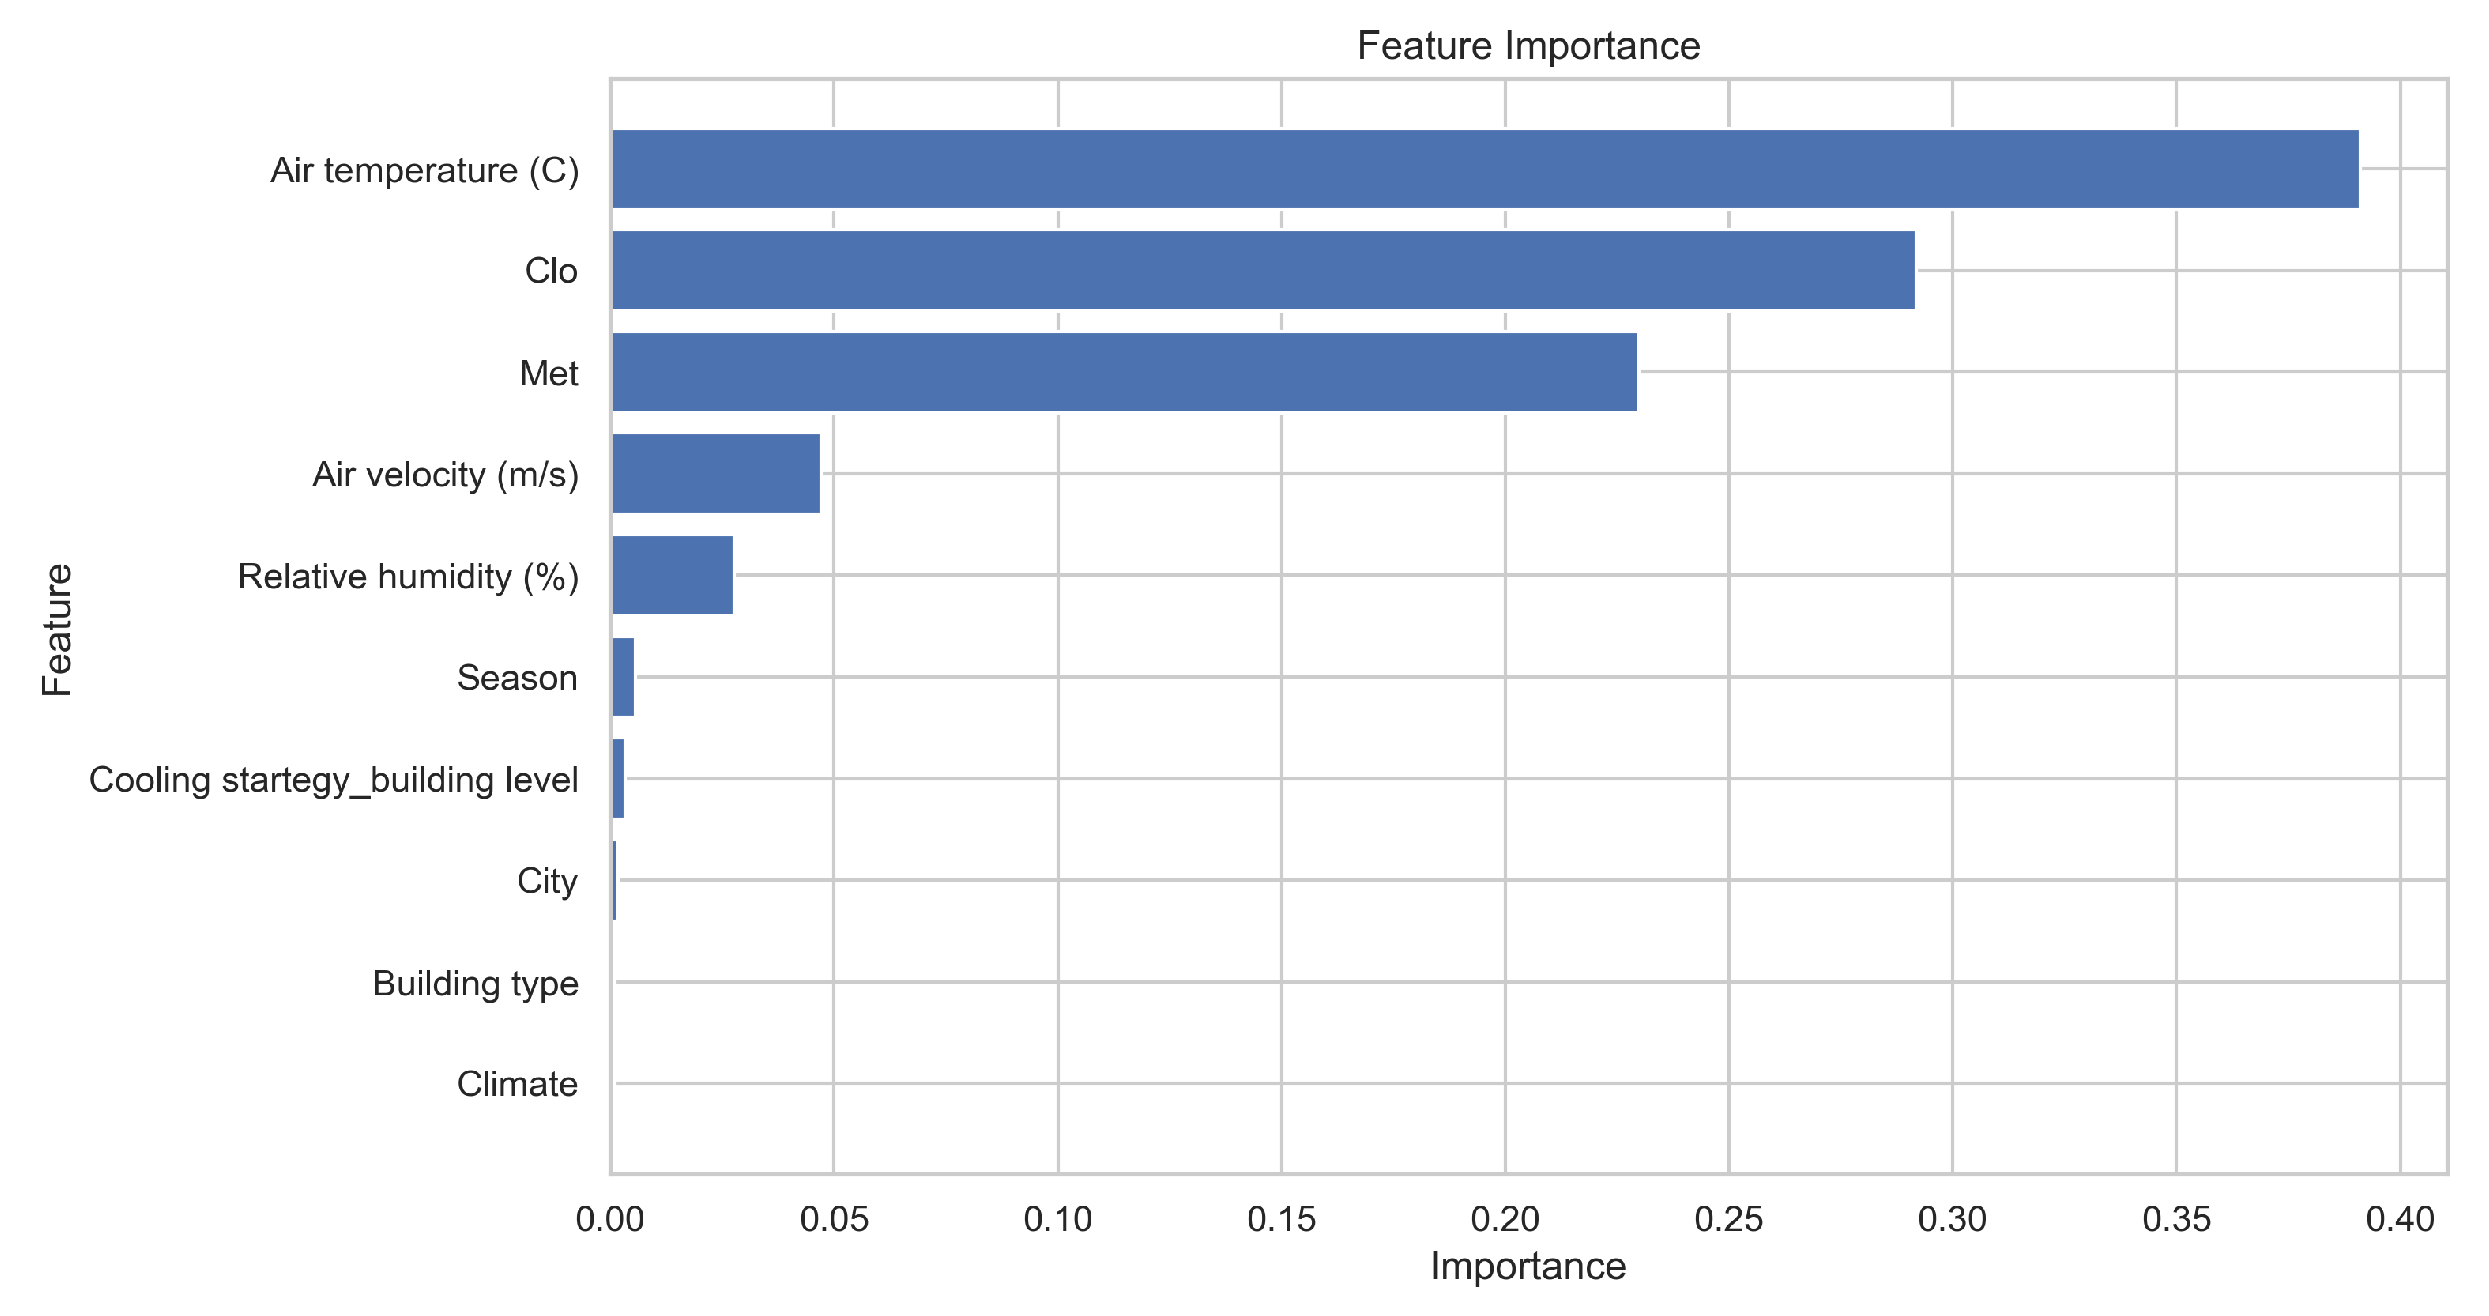
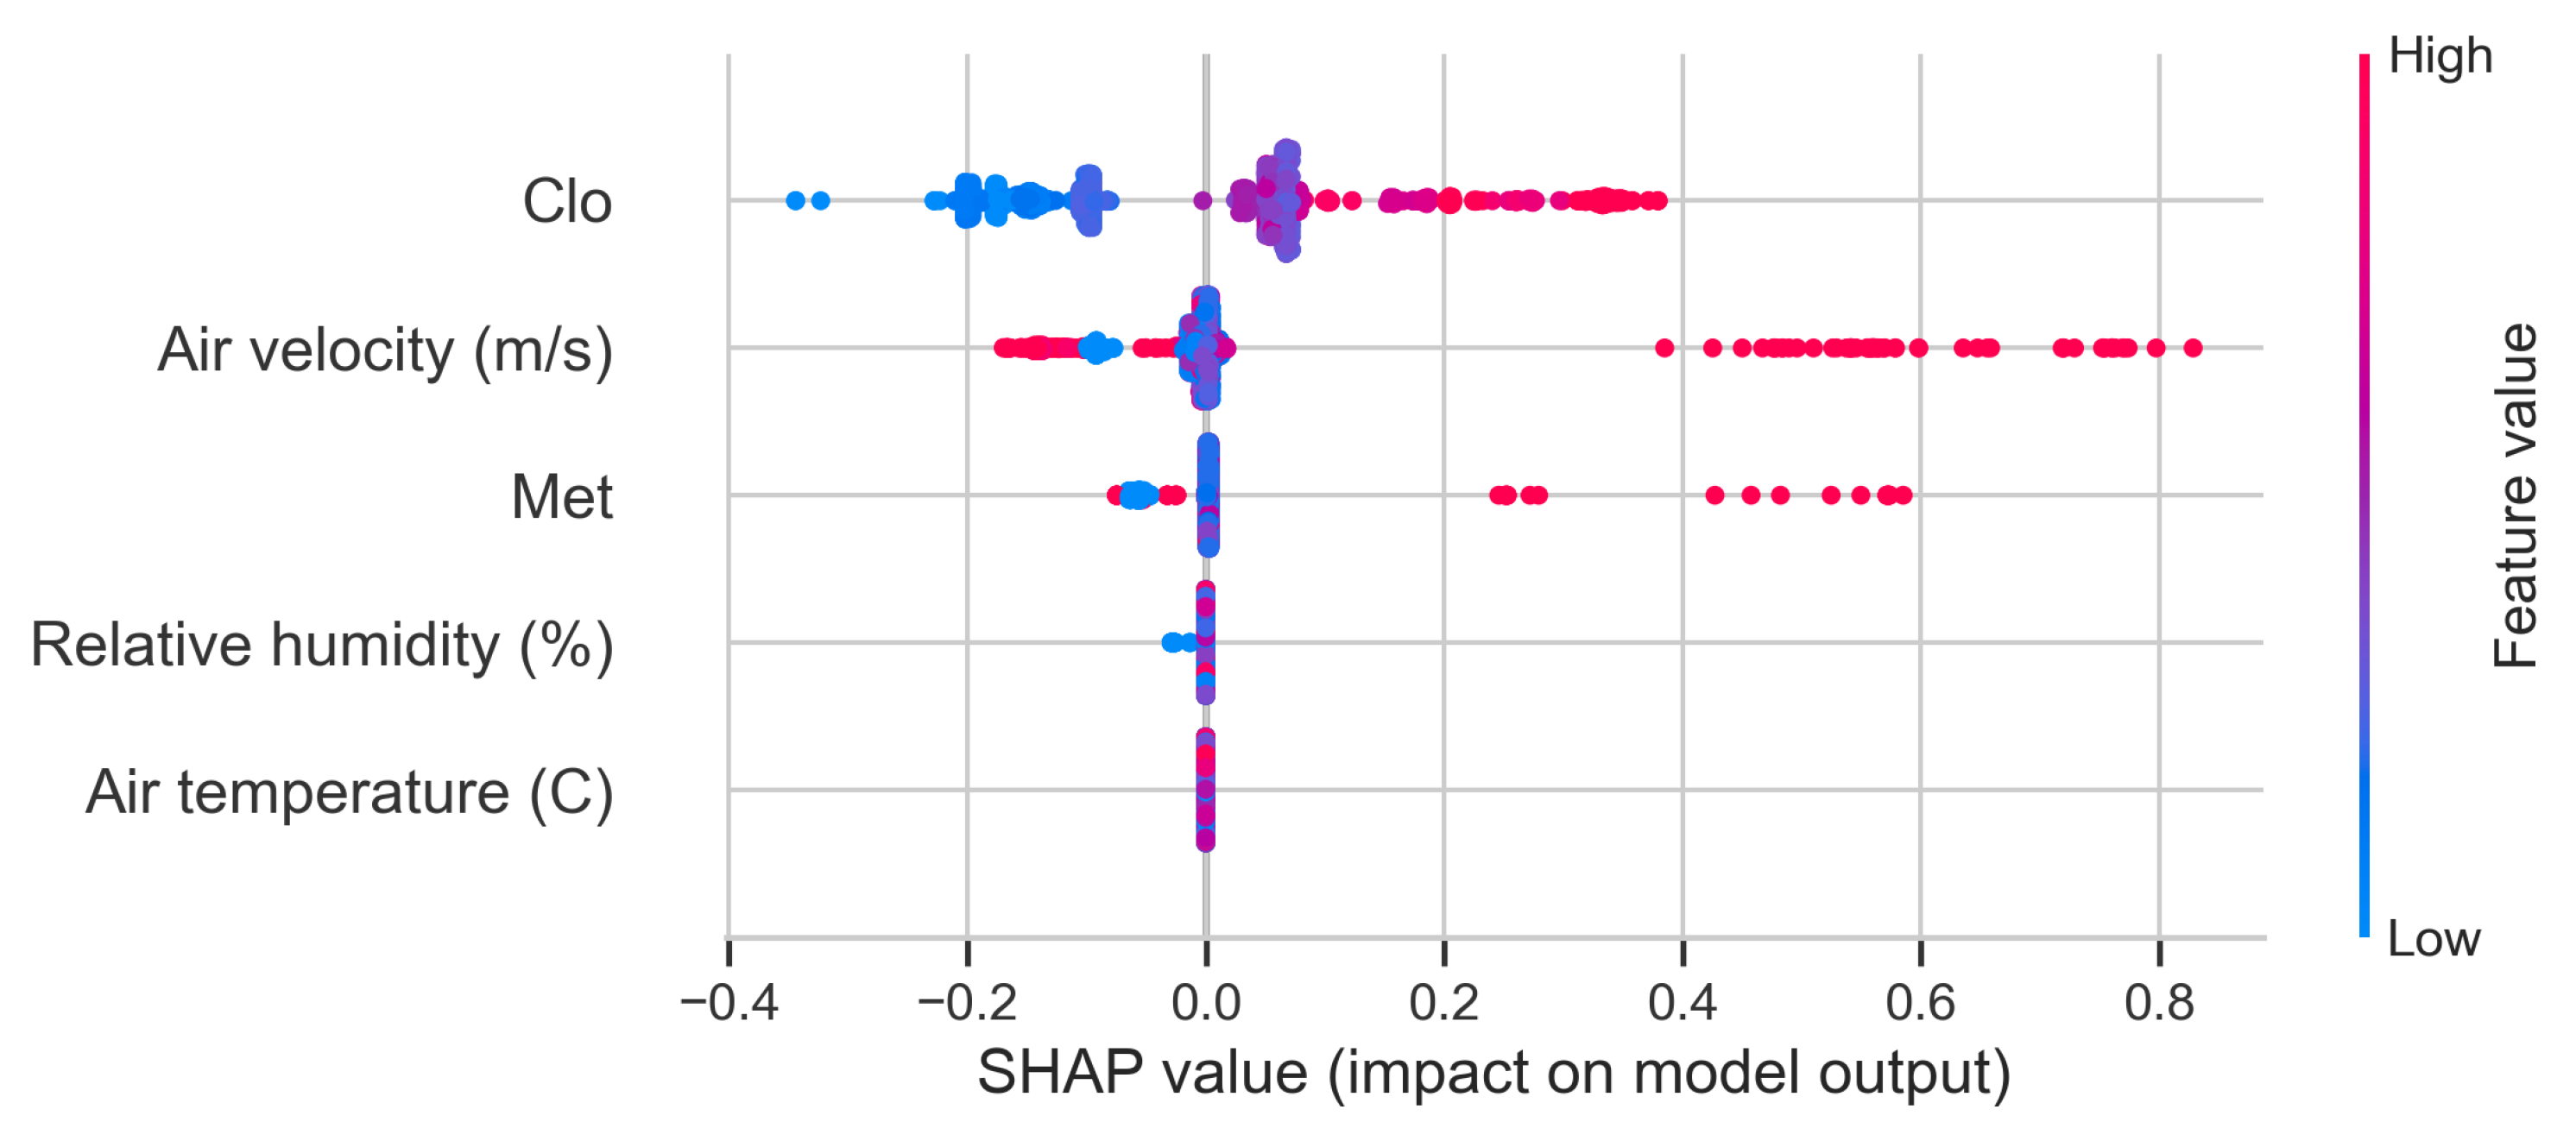
4.12. Key Factors Defining Comfort

Feature significance revealed several key elements crucial for assessing comfort levels in residential buildings. The major variables include temperature, humidity, metabolic rate, clothing, and air velocity. Figure 7 demonstrates the significant influence of each element on the total comfort level experienced by occupants.

4.12.1. Air Temperature

Air temperature is a pivotal component influencing the comfort of residential buildings. Air temperature is the paramount variable, as demonstrated by the feature importance chart, and it possesses the highest relevance score. Thermal comfort, a crucial component of overall comfort, is directly affected by temperature. Ensuring a constant and suitable interior climate is essential for the health and enjoyment of the occupants. Excessive heat or cold can lead to discomfort, health complications, and heightened energy consumption due to heating or cooling demands.

4.12.2. Clothing Insulation (Clo)

This is the second most significant component and indicates the thermal insulation properties of clothing. The thermal comfort of inhabitants is significantly influenced by the amount and type of clothing they don. Individuals can maintain their comfort levels without requiring significant modifications to their heating or cooling systems by utilising suitable clothing insulation.

4.12.3. Metabolic Rate (Met)

The metabolic rate, or met, quantifies the rate at which individuals generate heat from physical activity. This element is crucial since it directly affects the thermal balance of the internal environment. Reduced metabolic rates may require warmer temperatures, whereas elevated metabolic rates often want cooler environs for comfort.

4.12.4. Air Velocity

The rapidity of air movement within a space, or air velocity, also significantly influences comfort. It enhances the chilling effect and ensures a more consistent temperature distribution throughout the room. Adequate air circulation is capable of enhancing indoor air quality and preventing stagnant air.

4.12.5. Relative Humidity

Indoor air quality and comfort are significantly influenced by relative humidity levels. Respiratory issues, the proliferation of mold and mildew, and an oppressive and stifling environment can all be the result of increased humidity. In contrast, skin irritation, dehydration, and discomfort may arise as a consequence of low humidity. The ideal indoor humidity level is typically between 30% and 50%. The preservation of this range is advantageous for the health and welfare of tenants and fosters a living environment that is conducive.

4.12.6. Other Factors

Although not as critical as the aforementioned variables, the evaluation of comfort levels is influenced by a variety of factors, including the season, building-level ventilation strategy, city, building type, and climate. The effectiveness and efficacy of HVAC systems in maintaining optimal conditions are influenced by the entire environmental context, which is influenced by these factors.
The research aims to develop prediction models that can precisely forecast comfort levels by analysing these critical elements, as depicted in Figure 7. These models enhance the management of indoor environments, ensuring that residential buildings provide occupants with a comfortable and healthy living space while optimising energy consumption. It is essential to understand and address these aspects to improve the overall quality of life in residential settings.

4.13. Importance of Key Factors

The comparative significance of various parameters in predicting comfort levels was emphasised by the statistics. The most significant factor was temperature, followed by clo, met, and air velocity, in that order. Current research on thermal comfort supports these findings, emphasising the importance of meticulous regulation of these variables to maintain optimal interior conditions. The significance of these factors is further illustrated by the SHAP (SHapley Additive exPlanations) values plot given in Figure 8. The output of machine learning models is clarified by SHAP values, which quantify the contribution of each attribute to the prediction. The diagram suggests that the model’s predictions are significantly influenced by clo, air velocity, and met, with air temperature also being a critical factor. These parameters’ elevated SHAP values suggest that they have a substantial impact on the prediction of comfort. The formulation and execution of more efficient comfort enhancement strategies are guided by advanced predictive models and techniques, such as SHAP, which provide significant insights.

5. Results and Discussion

This research highlights the importance of advanced prediction methods and teaching strategies in enhancing energy efficiency and comfort in residential structures.

5.1. Performance Evaluation of Machine Learning Models

The evaluation demonstrated that more sophisticated, ensemble-based models, including RF, XGBoost, and SVM, considerably outperformed simpler models such as LR and decision tree. Despite its interpretability and simplicity, LR was unable to detect non-linear correlations within the data, resulting in reduced predictive accuracy. While decision tree models offered clear decision pathways, they exhibited a propensity to overfit the training data, leading to inadequate generalisation to new data. In contrast, RF and XGBoost exhibited improved performance owing to their ensemble nature, which reduces the risk of overfitting by integrating multiple model predictions to enhance accuracy and robustness. The RF model, which consolidates the predictions of many decision trees, attained an R2 score of 0.9247, a mean squared error (MSE) of 0.0270, and a root mean squared error (RMSE) of 0.1642. XGBoost, a sophisticated version of gradient boosting, progressively improved upon the errors of prior rounds, achieving optimal performance with an R2 score of 0.9394, an MSE of 0.0224, and an RMSE of 0.1495, given in Table 1.

5.2. Hyperparameter Tuning and Its Impact

In order to optimise these models, hyperparameter tuning has implemented. The meticulous parameter adjustment of the tailored XGBoost model has demonstrated significant potential for development. This is demonstrated by its outstanding R2 score of 0.9394, MSE of 0.0224, and RMSE of 0.1495. Parameters such as the learning rate, maximal tree depth, and number of estimators were calibrated to determine the optimal combination that improved prediction accuracy and significantly reduced error, given in Table 2. The model’s ability to generalise from training data to novel, unobserved data was significantly improved by an exhaustive examination of diverse hyperparameter combinations. This led to more precise predictions of the comfort levels of residential structures. This approach is indispensable for optimising predictive performance and realising the full potential of contemporary machine learning algorithms.

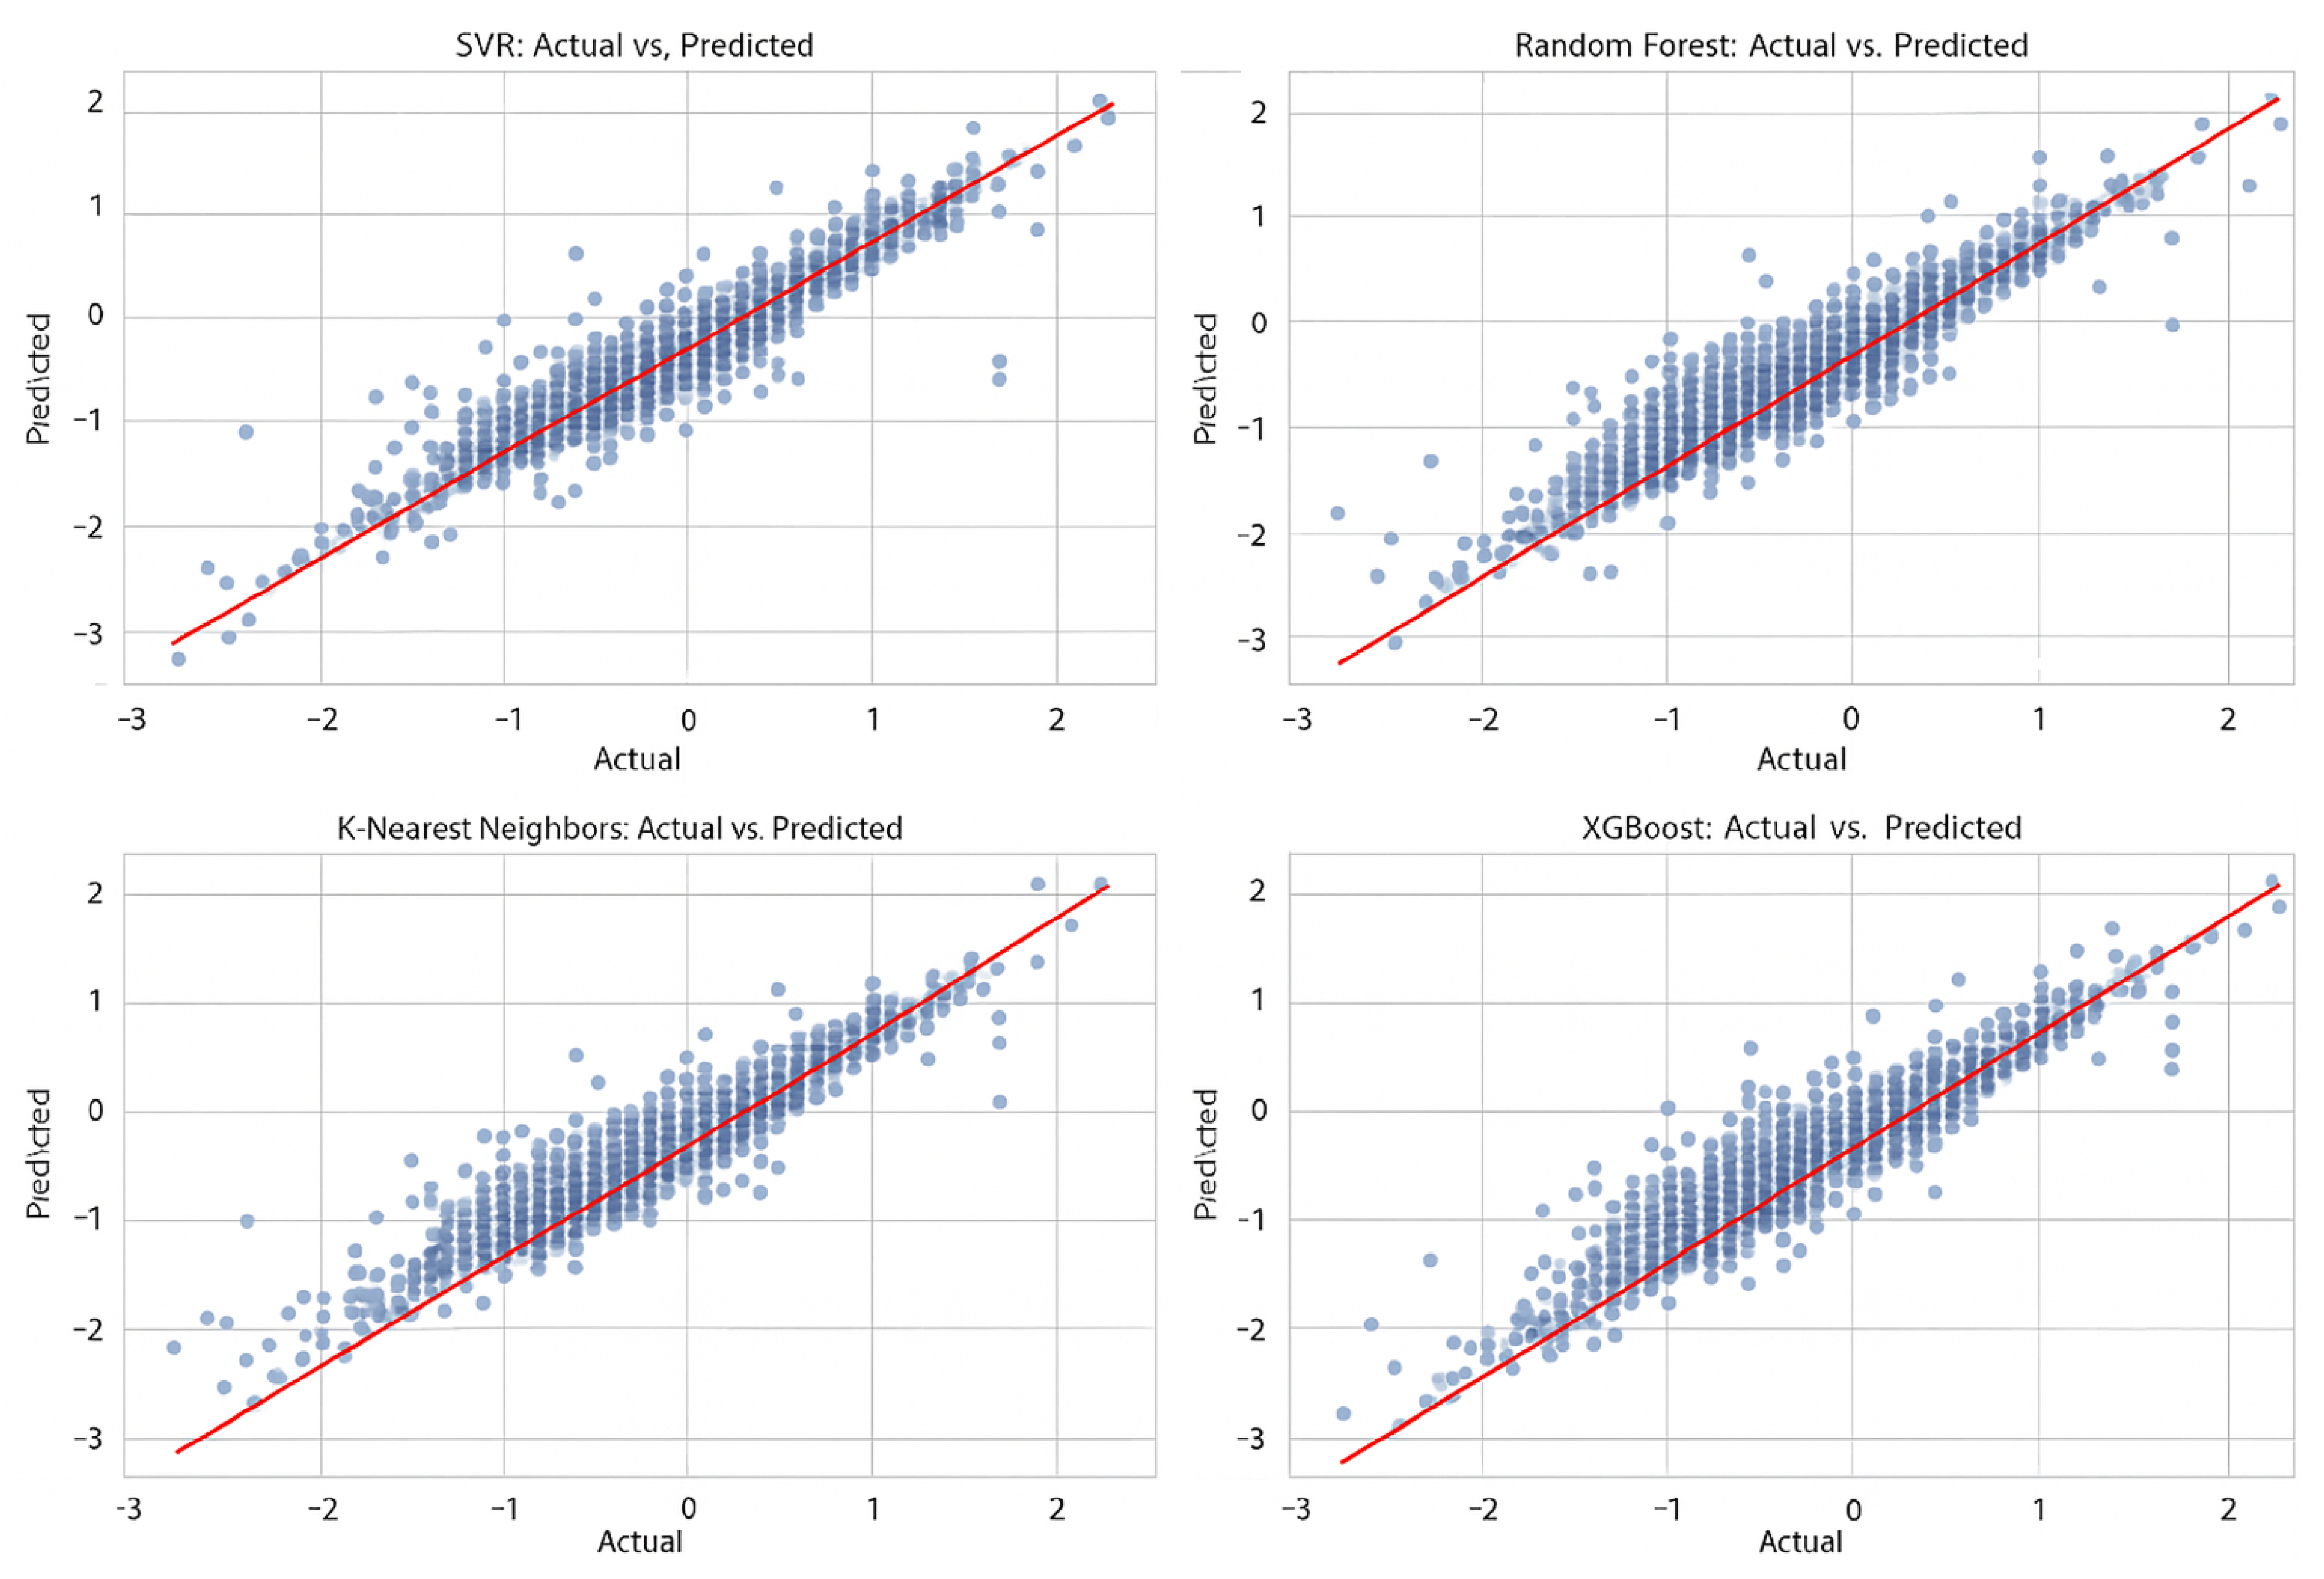
5.3. Actual vs. Predicted Plots

The real versus predicted graphs in Figure 9 further demonstrate the predictive accuracy of the optimised models (SVR, random forest, K-Nearest Neighbours, and XGBoost). The models’ accuracy and dependability are clearly demonstrated by the diagrams depicting the association between predicted and actual comfort levels. The XGBoost model’s enhanced accuracy is seen in the closeness of the data points to the diagonal line, indicating a robust correlation between the anticipated and actual values.

5.4. Comparative Analysis with Existing Literature

The random forest ensemble learning method is a highly successful approach to predictive modelling. The accuracy and robustness of the predictions are enhanced by the integration of predictions from multiple decision trees, each of which is trained on a unique random subset of the data. This method effectively addresses the issue of overfitting, which is common in individual decision trees, thereby allowing random forest models to generalise effectively to unknown data. Boutahri et al. [4] emphasised its exceptional effectiveness in predicting thermal comfort, particularly its ability to manage aberrant and fluctuating environmental data. Random forest’s feature importance metrics are an essential instrument in this domain as they provide critical insights into the influence of numerous elements on the outcome. XGBoost is an additional ensemble method that has demonstrated exceptional efficacy in the prediction of thermal comfort. XGBoost integrates innovations such as regularisation to reduce overfitting, enhance computational performance, and effectively manage missing data. Boutahri et al. [4] also suggested that XGBoost routinely outperforms simpler models in predicting comfort levels, which is in accordance with the findings of this study. It is a preferred choice for such forecasts due to its adaptability and ability to clarify complex interactions among variables. Support vector machines (SVMs) are recognised for their ability to manage high-dimensional data and are occasionally used to predict thermal comfort. Despite their ability to resist overfitting, SVMs have significant drawbacks, including increased computing costs and complexity, which are particularly significant when administering large datasets. SVMs are frequently impractical in these scenarios as a result of their limited ability to simulate non-linear interactions and the aforementioned requirements. Wu et al. [17] demonstrated inferior performance in comparison to ensemble methods such as random forest and XGBoost.

5.5. Cost–Benefit Analysis

The cost–benefit analysis of the implementation of advanced predictive methods for optimising energy consumption and comfort in residential buildings must be prioritised. Although considerable initial investments are required, the long-term benefits outweigh the costs as a result of the improved quality of life and substantial energy savings, given in Table 3.

5.5.1. Initial Costs

The principal costs related to the execution of these predictive methodologies are as follows:
  • Hardware: Implementation of sensors necessary for the monitoring of energy consumption, air velocity, humidity, and temperature. This undoubtedly necessitates the implementation of smart thermostats and other Internet of Things devices. A centralised control unit that is intended to aggregate data, process it, and execute prediction algorithms.
  • Software: Development or purchase of software able to run the advanced predictive models. etc.
  • Integration: Costs of integrating the new system with the existing building management systems.
  • Training: The costs associated with providing training to building managers and residents on how to operate the new system and interpret its output.
  • Maintenance: Costs to be incurred in ensuring the upkeep of the system, updating or replacing hardware components from time to time.

5.5.2. Benefits

The advantages arising from the application of such sophisticated predictive techniques are multifarious:
  • Energy Savings: The optimisation of using energy from predictive models leads to huge reductions in energy consumption by the building. It was noted that smart building technologies may save up to 30–50% annually [38].
  • Cost Reduction: Reduced energy usage will provide residents and building managers with lower utility bills.
  • Environmental Impact: Reduced energy consumption leads to lower carbon emissions, contributing to sustainability objectives.
  • Improved Comfort: Predictive models can maintain comfort conditions consistently at a level not yet achieved by previous systems. This may increase resident satisfaction and well-being.
  • Building Value: Energy-efficient buildings with advanced systems often command higher property values and can charge premium rents.
  • Predictive Maintenance: The foretold systems can also estimate when maintenance is necessary, thereby probably reducing repair costs and prolonging the life of HVAC and other building systems.
Even though the anticipated initial investment may be substantial, the long-term financial benefits can be substantial. For instance, if we examine a medium-sized apartment complex with 100 units, we can note the following:

5.5.3. Estimated Initial Investment:

These figures were obtained directly from several software websites. A contingency cushion of 10–15% should be incorporated to accommodate unforeseen expenses, such extra equipment, intricate installation difficulties, or system integration complications. The overall anticipated cost excludes the annual recurring operational expenses for software licenses and cloud storage, which may amount to GBP 10,000 per year.

5.5.4. Annual Benefits:

In this case, the building and its residents would continue to save money because the system would pay for itself in less than five years. This is in line with a recent review by the industry, which indicates that similar systems normally have a repayment duration of two to four years. The typical British household uses about 12,000 kWh of gas and 3600 kWh of electricity annually [39]. The block including one hundred units uses 1,200,000 kWh of gas annually and 360,000 kWh of electricity.

5.5.5. Non-Monetary Benefits:

It is of the utmost importance not to ignore that not all benefits can be readily quantified in monetary terms. For example, improved comfort increases resident satisfaction, with the capability of reduced turnover rates [4]. The environmental benefits from reduced energy consumption contribute to broader societal goals of sustainability and climate change mitigation [40]. While the predictive techniques that are most advanced do require a considerable upfront investment, the benefits of said upfront investment tend to pay back threefold over time: energy savings, increased comfort, and reduced environmental impact. Exactly how it all works out in terms of the cost–benefit ratio will depend upon a number of factors, including building size, current energy efficiency, and local energy costs. With technology costs continuing to decline while energy prices are likely increasing, the financial case for these systems will only continue to improve [41]. As such, comprehensive cost–benefit analyses specific to these properties should be pursued by building owners and managers, along with the potential return on investment and the broader added value that these systems bring to their residents and the environment.

6. Conclusions

This study successfully advanced the enhancement of thermal comfort and energy efficiency in residential structures through the application of sophisticated predictive methodologies and effective instructional strategies. Our comprehensive evaluation of various machine learning models, including linear regression, decision tree, gradient boosting, random forest, support vector regressor, XGBoost, and K-Nearest Neighbours, yielded significant insights into optimizing domestic living conditions. Notably, ensemble methods consistently demonstrated superior performance compared to simpler models. The XGBoost model, after rigorous hyperparameter tuning, achieved the highest accuracy, evidenced by an R2 score of 0.9394, a MSE of 0.0224, and a RMSE of 0.1495. These quantitative results underscore the marked proficiency of advanced models in discerning the intricate relationships between variables influencing comfort levels. Our research distinctly identified air temperature, clothing insulation (clo), metabolic rate (met), and air velocity as the principal determinants of thermal comfort. The SHAP values diagram further corroborated their significant influence on model predictions, highlighting their sensitivity and importance. The ability to maintain optimal interior conditions through the diligent regulation of these elements is crucial for greatly enhancing thermal comfort. The practical implications of these findings are substantial. The demonstrated efficacy of ensemble models like XGBoost in predicting comfort levels provides a robust framework for improving building energy efficiency and occupant comfort. Integrating these advanced predictive models into building management systems can enable real-time predictions and adjustments, leading to more targeted and effective comfort enhancement strategies. This allows for a proactive approach to managing indoor environments, emphasising critical factors such as temperature regulation to optimise occupant well-being and energy consumption simultaneously.
For future research, we recommend several directions to further refine and expand upon these findings. To create even more comprehensive predictive models, subsequent studies should investigate additional comfort-affecting factors, such as indoor air quality, lighting, and noise levels. Furthermore, integrating feedback mechanisms from occupants and broadening the scope of prediction models to encompass a wider array of environmental elements will foster continuous learning and model development, ultimately promoting more sustainable and comfortable living environments.

Author Contributions

Conceptualisation, S.I. and A.A.A.; methodology, A.A.A.; software, H.M.A.F. and A.A.A.; formal analysis, H.M.S.; investigation, S.I.; resources, S.I.; writing—original draft preparation, A.A.A.; writing—review and editing, H.M.A.F. All authors have read and agreed to the published version of the manuscript.

Funding

This research received no external funding.

Data Availability Statement

The raw data supporting the conclusions of this article will be made available by the authors on request.

Conflicts of Interest

The authors declare no conflicts of interest.

Nomenclature

To ensure clarity and provide a comprehensive understanding of the technical terms and parameters used throughout this manuscript, the following nomenclature lists the symbols, their respective units, and a brief description.
SymbolUnitDescription
ASHRAE-American Society of Heating, Refrigerating and Air-Conditioning Engineers
ANN-Artificial Neural Network
BOXGBoost-Bayesian Optimisation with Extreme Gradient Boosting
CO2ppmCarbon Dioxide
ClocloClothing Insulation (1 clo = 0.155 m 2 · K / W )
DT-Decision Tree
GB-Gradient Boosting
GHG-Greenhouse Gas
HVAC-Heating, Ventilation, and Air Conditioning
IAQ-Indoor Air Quality
IEA-International Energy Agency
IESNA-Illuminating Engineering Society of North America
IoT-Internet of Things
ISO-International Organization for Standardization
KNN-K-Nearest Neighbours
kWh-Kilowatt-hour
LIME-Local Interpretable Model-agnostic Explanations
LR-Linear Regression
MetmetMetabolic Rate (1 met = 58.2 W / m 2 )
MPC-Model Predictive Control
MSE-Mean Squared Error
NO2-Nitrogen Dioxide
O3-Ozone
OT°COperative Temperature
PM-Particulate Matter
PMV-Predicted Mean Vote (on a 7-point scale from −3 to +3)
ppm-Parts per million
PPD%Predicted Percentage of Dissatisfied
R2-Coefficient of Determination (R-squared)
RF-Random Forest
RMSE-Root Mean Squared Error
SET°CStandard Effective Temperature
SHAP-SHapley Additive exPlanations
SVR-Support Vector Regressor
SVM-Support Vector Machine
TPV-Thermal Preference Vote
TSV-Thermal Sensation Vote
VOCs-Volatile Organic Compounds
WHO-World Health Organization
XGBoost-Extreme Gradient Boosting

References

  1. Li, J.; Yang, L.; Long, H. Climatic impacts on energy consumption: Intensive and extensive margins. Energy Econ. 2018, 71, 332–343. [Google Scholar] [CrossRef]
  2. Molla, T.; Khan, B.; Singh, P. A comprehensive analysis of smart home energy management system optimization techniques. J. Auton. Intell. 2018, 1, 15–21. [Google Scholar] [CrossRef]
  3. Zhong, X.; Hu, M.; Deetman, S.; Steubing, B.; Lin, H.X.; Hernandez, G.A.; Harpprecht, C.; Zhang, C.; Tukker, A.; Behrens, P. Global greenhouse gas emissions from residential and commercial building materials and mitigation strategies to 2060. Nat. Commun. 2021, 12, 6126. [Google Scholar] [CrossRef] [PubMed]
  4. Boutahri, Y.; Tilioua, A. Machine learning-based predictive model for thermal comfort and energy optimization in smart buildings. Results Eng. 2024, 22, 102148. [Google Scholar] [CrossRef]
  5. Aqilah, N.; Rijal, H.B.; Zaki, S.A. A Review of Thermal Comfort in Residential Buildings: Comfort Threads and Energy Saving Potential. Energies 2022, 15, 9012. [Google Scholar] [CrossRef]
  6. Clausen, A.; Arendt, K.; Johansen, A.; Sangogboye, F.C.; Kjærgaard, M.B.; Veje, C.T.; Jørgensen, B.N. A digital twin framework for improving energy efficiency and occupant comfort in public and commercial buildings. Energy Inform. 2021, 4, 40. [Google Scholar] [CrossRef]
  7. Mousavi, S.; Gheibi, M.; Wacławek, S.; Smith, N.R.; Hajiaghaei-Keshteli, M.; Behzadian, K. Low-energy residential building optimisation for energy and comfort enhancement in semi-arid climate conditions. Energy Convers. Manag. 2023, 291, 117264. [Google Scholar] [CrossRef]
  8. National Oceanic and Atmospheric Administration (NOAA). Climate Change: Global Temperature. 2023. Available online: https://www.climate.gov/news-features/understanding-climate/climate-change-global-temperature (accessed on 15 April 2025).
  9. Santamouris, M.; Cartalis, C.; Synnefa, A.; Kolokotsa, D. On the impact of urban heat island and global warming on the power demand and electricity consumption of buildings—A review. Energy Build. 2015, 98, 119–124. [Google Scholar] [CrossRef]
  10. Dong, F.; Li, Z.; Huang, Z.; Liu, Y. Extreme weather, policy uncertainty, and risk spillovers between energy, financial, and carbon markets. Energy Econ. 2024, 137, 107761. [Google Scholar] [CrossRef]
  11. Al Mindeel, T.; Spentzou, E.; Eftekhari, M. Energy, thermal comfort, and indoor air quality: Multi-objective optimization review. Renew. Sustain. Energy Rev. 2024, 202, 114682. [Google Scholar] [CrossRef]
  12. Alghassab, M.A. Data-Driven Framework for Energy Optimizing Net-Zero Energy Buildings (NZEB): A Functional Assessment of Energy Efficiency and Thermal Comfort. Energy 2025, 330, 136834. [Google Scholar] [CrossRef]
  13. Shakeel, H.M.; Iram, S.; Hill, R.; Farid, H.M.A.; Sheikh-Akbari, A.; Saleem, F. A Machine Learning-Based Intelligent Framework for Predicting Energy Efficiency in Next-Generation Residential Buildings. Buildings 2025, 15, 1275. [Google Scholar] [CrossRef]
  14. Farid, H.M.A.; Iram, S.; Shakeel, H.M.; Hill, R. Enhancing stakeholder engagement in building energy performance assessment: A state-of-the-art literature survey. Energy Strategy Rev. 2024, 56, 101560. [Google Scholar] [CrossRef]
  15. Shakeel, H.M.; Iram, S.; Hill, R.; Farid, H.M.A.; Brown, P.; Rehman, H.U. An XAI-Driven Diagnostic Framework to Investigate the Predictive Power of Building Features to Enhance EPC Ratings in Detached Houses. Energy Build. 2025, 334, 116022. [Google Scholar] [CrossRef]
  16. Merabet, G.H.; Essaaidi, M.; Haddou, B.M.; Qolomany, B.; Qadir, J.; Anan, M.; Al-Fuqaha, A.; Abid, M.R.; Benhaddou, D. Intelligent building control systems for thermal comfort and energy-efficiency: A systematic review of artificial intelligence-assisted techniques. Renew. Sustain. Energy Rev. 2021, 144, 110969. [Google Scholar] [CrossRef]
  17. Wu, C.; Pan, H.; Luo, Z.; Liu, C.; Huang, H. Multi-objective optimization of residential building energy consumption, daylighting, and thermal comfort based on BO-XGBoost-NSGA-II. Build. Environ. 2024, 254, 111386. [Google Scholar] [CrossRef]
  18. Sun, Y.; Hao, W.; Chen, Y.; Liu, B. Data-driven occupant-behaviour analytics for residential buildings. Energy 2020, 206, 118100. [Google Scholar] [CrossRef]
  19. ANSI/ASHRAE Standard 55-2017; Thermal Environmental Conditions for Human Occupancy. ASHRAE: Atlanta, GA, USA, 2020. Available online: https://www.ashrae.org/file%20library/technical%20resources/standards%20and%20guidelines/standards%20addenda/55_2017_d_20200731.pdf (accessed on 15 April 2025).
  20. ISO 7730; Ergonomics of the Thermal Environment—Analytical Determination and Interpretation of Thermal Comfort Using Calculation of the PMV and PPD Indices and Local Thermal Comfort Criteria. ISO: Geneva, Switzerland, 2024. Available online: https://www.iso.org/obp/ui/en/#iso:std:iso:7730:dis:ed-4:v1:en (accessed on 15 February 2025).
  21. Broday, E.E.; Moreto, J.A.; de Paula Xavier, A.A.; Oliveira, R. The approximation between thermal sensation votes (TSV) and predicted mean vote (PMV): A comparative analysis. Int. J. Ind. Ergon. 2019, 69, 1–8. [Google Scholar] [CrossRef]
  22. Rawal, R.; Shukla, Y.; Vardhan, V.; Asrani, S.; Schweiker, M.; de Dear, R.; Garg, V.; Mathur, J.; Prakash, S.; Diddi, S.; et al. Adaptive thermal comfort model based on field studies in five climate zones across India. Build. Environ. 2022, 219, 109187. [Google Scholar] [CrossRef]
  23. Arsad, F.S.; Hod, R.; Ahmad, N.; Baharom, M.; Ja’afar, M.H. Assessment of indoor thermal comfort temperature and related behavioural adaptations: A systematic review. Environ. Sci. Pollut. Res. 2023, 30, 73137–73149. [Google Scholar] [CrossRef] [PubMed]
  24. Yu, J.; Kang, Y.; Zhai, Z. Advances in research for underground buildings: Energy, thermal comfort and indoor air quality. Energy Build. 2020, 215, 109916. [Google Scholar] [CrossRef]
  25. Ma, N.; Aviv, D.; Guo, H.; Braham, W.W. Measuring the right factors: A review of variables and models for thermal comfort and indoor air quality. Renew. Sustain. Energy Rev. 2021, 135, 110436. [Google Scholar] [CrossRef]
  26. d’Ambrosio Alfano, F.R.; Olesen, B.W.; Palella, B.I.; Riccio, G. Thermal comfort: Design and assessment for energy saving. Energy Build. 2014, 81, 326–336. [Google Scholar] [CrossRef]
  27. Healthline. What Are METs? 2024. Available online: https://www.healthline.com/health/what-are-mets (accessed on 22 April 2025).
  28. Ganesh, G.A.; Sinha, S.L.; Verma, T.N.; Dewangan, S.K. Investigation of indoor environment quality and factors affecting human comfort: A critical review. Build. Environ. 2021, 204, 108146. [Google Scholar] [CrossRef]
  29. American National Standards Institute (ANSI); Illuminating Engineering Society of North America (IESNA). ANSI/IESNA RP-11-17: Recommended Practice for Lighting for Exterior Environments. 2017. Available online: https://webstore.ansi.org/preview-pages/IESNA/preview_ANSI+IES+ALA+RP-11-17.pdf (accessed on 19 February 2025).
  30. Bashir, F.M.; Dodo, Y.A.; Mohamed, M.A.S.; Norwawi, N.M.; Shannan, N.M.; Afghan, A.A. Effects of natural light on improving the lighting and energy efficiency of buildings: Toward low energy consumption and CO2 emission. Int. J. Low-Carbon Technol. 2024, 19, 296–305. [Google Scholar] [CrossRef]
  31. Ayoub, M. 100 Years of daylighting: A chronological review of daylight prediction and calculation methods. Sol. Energy 2019, 194, 360–390. [Google Scholar] [CrossRef]
  32. Jakubiec, J.A.; Reinhart, C.F. The ’adaptive zone’—A concept for assessing discomfort glare throughout daylit spaces. Light. Res. Technol. 2012, 44, 149–170. [Google Scholar] [CrossRef]
  33. Christensen, H.K.; Rindel, C.A. The ISO 3382 Parameters: Can We Simulate Them? Can We Measure Them? 2013. Available online: https://www.odeon.dk/pdf/ISRA2013_Paper_The%20ISO%203382%20parameters_Can%20we%20simulate%20them_Can%20we%20measure%20them_24July2013.pdf (accessed on 8 February 2025).
  34. Fang, Y.; Luo, X.; Lu, J. A review of research on the impact of the classroom physical environment on schoolchildren’s health. J. Build. Eng. 2023, 65, 105430. [Google Scholar] [CrossRef]
  35. World Health Organization (WHO). Noise. 2010. Available online: https://www.who.int/europe/news-room/fact-sheets/item/noise (accessed on 25 January 2025).
  36. Arjunan, A.; Baroutaji, A.; Robinson, J.; Vance, A.; Arafat, A. Acoustic metamaterials for sound absorption and insulation in buildings. Build. Environ. 2024, 251, 111250. [Google Scholar] [CrossRef]
  37. Földváry Ličina, V.; Cheung, T.; Zhang, H.; de Dear, R.; Parkinson, T.; Arens, E.; Chun, C.; Schiavon, S.; Luo, M.; Brager, G.; et al. Development of the ASHRAE Global Thermal Comfort Database II. Build. Environ. 2018, 142, 502–512. [Google Scholar] [CrossRef]
  38. King, J.; Perry, C. Smart Buildings: Using Smart Technology to Save Energy in Existing Buildings; Amercian Council for an Energy-Efficient Economy: Washington, DC, USA, 2017; pp. 1–46. [Google Scholar]
  39. Zapata-Webborn, E.; Hanmer, C.; Oreszczyn, T.; Huebner, G.; McKenna, E.; Few, J.; Elam, S.; Pullinger, M.; Cheshire, C.; Friel, D.; et al. Winter demand falls as fuel bills rise: Understanding the energy impacts of the cost-of-living crisis on British households. Energy Build. 2024, 305, 113869. [Google Scholar] [CrossRef]
  40. Achuo, E.D.; Miamo, C.W.; Nchofoung, T.N. Energy consumption and environmental sustainability: What lessons for posterity? Energy Rep. 2022, 8, 12491–12502. [Google Scholar] [CrossRef]
  41. Li, R.; Leung, G.C.K. The relationship between energy prices, economic growth and renewable energy consumption: Evidence from Europe. Energy Rep. 2021, 7, 1712–1719. [Google Scholar] [CrossRef]
Figure 1. Key components of indoor comfort.
Energies 18 03878 g001
Figure 2. Data prepossessing steps.
Energies 18 03878 g002
Figure 3. Missing data visualisation using missingno library.
Energies 18 03878 g003
Figure 4. Correlation heatmap for thermal comfort data.
Energies 18 03878 g004
Figure 5. Histograms for different features of thermal comfort data.
Energies 18 03878 g005
Figure 6. Machine learning models used.
Energies 18 03878 g006
Figure 7. Key factors defining comfort.
Energies 18 03878 g007
Figure 8. SHAP values.
Energies 18 03878 g008
Figure 9. Comparison of actual vs. predicted values for different regression models.
Energies 18 03878 g009
Table 1. Initial model evaluation results.
ModelR2MSERMSE
XGBoost0.92900.02630.1625
Random Forest0.92310.02850.1690
Support Vector Regressor (SVR)0.92190.02900.1703
K-Nearest Neighbours (KNN)0.91470.03160.1779
Gradient Boosting0.88650.04210.2054
Decision Tree0.85030.05560.2358
Linear Regression0.84570.05730.2395
Table 2. Results after hyperparameter tuning.
ModelR2MSERMSE
XGBoost0.93940.02240.1495
Random Forest0.92470.02700.1642
K-Nearest Neighbours (KNN)0.92380.02820.1682
SVR0.92320.02850.1689
Table 3. Breakdown of estimated initial investment for 100 units.
CategoryDescriptionUnit CostTotal Cost
HardwareHumidity Sensors (100 units)GBP 40GBP 4000
HardwareTemperature Sensors (100 units)GBP 30GBP 3000
HardwareOccupancy Sensors (100 units)GBP 75GBP 7500
HardwareSmart Thermostats (100 units)GBP 200GBP 20,000
HardwareCentralised Hub (1 unit)GBP 1000GBP 1000
HardwareAir Quality Sensors (100 units)GBP 100GBP 10,000
SoftwarePredictive Software Licence (annual)GBP 5000GBP 5000
SoftwareCloud Storage and Computing (annual)GBP 2000GBP 2000
SoftwareData Analytics Software (annual)GBP 3000GBP 3000
TrainingInstallation and Setup-GBP 20,000
TrainingInitial Training Costs-GBP 10,000
Total Estimated CostGBP 85,500
Disclaimer/Publisher’s Note: The statements, opinions and data contained in all publications are solely those of the individual author(s) and contributor(s) and not of MDPI and/or the editor(s). MDPI and/or the editor(s) disclaim responsibility for any injury to people or property resulting from any ideas, methods, instructions or products referred to in the content.

