1. Introduction
Overhead transmission lines are critical components in power systems for long-distance and high-capacity electricity transmission. Their failures can result in large-scale blackouts, making the reliability of overhead transmission lines crucial for the secure and stable operation of the power grid [
1]. In recent years, the increasing frequency of extreme weather events has posed serious threats to the safe and reliable power supply of urban grids [
2]. Among these events, icing disasters have had a particularly severe impact on transmission line reliability. Furthermore, the geographical extent of freezing rain zones has been gradually expanding northward, enlarging the area affected by ice disasters [
3]. During icy weather conditions, overhead lines experience icing and galloping, which can lead to tower collapses, conductor breakages, and increased occurrences of regional power outages, resulting in significant economic losses [
4]. Consequently, power grid enterprises are placing greater emphasis on the scientific and effective implementation of anti-icing and disaster mitigation measures.
The icing risk of overhead transmission lines primarily manifests as faults occurring when the lines operate under icing conditions. Morgan et al. conducted research on the galloping amplitude of overhead transmission lines affected by icing and analyzed line fault mechanisms under different galloping amplitudes, providing a theoretical basis for determining the inter-phase spacing of transmission lines [
5]. However, early studies often used full-scale transmission lines as test objects, resulting in prohibitively high costs for building experimental platforms. The expansion of the scale of power grids has led to a rapid increase in testing costs, making cost control for testing essential. In recent years, Huang et al. and Xie et al. have adopted scaled-down transmission line models to simulate galloping and icing behaviors of full-size lines, effectively addressing the cost limitations of full-scale experiments [
6,
7,
8]. These approaches offer cost-effective experimental schemes for determining the span design of overhead transmission lines. With the development of computer technology, numerical simulation methods have been widely applied. Xiao et al. developed a probabilistic failure assessment framework for transmission towers under combined ice and wind loads, using numerical analysis to evaluate line reliability [
9]. These studies have thoroughly investigated the failure mechanisms of overhead transmission lines under icing conditions and proposed various simplified calculation formulas. Recently, machine learning techniques have also been introduced in this field due to their lower computational cost and higher predictive accuracy [
10]. For instance, Sun et al. proposed an improved extreme learning machine for icing thickness prediction based on the bat optimization algorithm [
11], while Wang et al. introduced a novel extreme learning machine model to predict damage to overhead lines caused by icing [
12]. However, due to the temporal discreteness, short duration, and limited availability of characteristic data during icing periods, machine learning methods—often reliant on large datasets—lack applicability for accurately predicting icing-related failure rates at this stage. Therefore, this paper employs an empirical approach based on the Nelson–Aalen estimator and metal deformation theory to calculate the failure rate of transmission lines during icing periods and subsequently derive the lifetime distribution function for overhead lines under icing conditions.
Risk assessment of overhead transmission lines typically involves the use of specific indicators to quantify the severity of risk, with each indicator tailored to suit particular research contexts. Yi W et al., in their study of discharging and mechanical failure risks associated with the de-icing of iced transmission lines, employed gap breakdown voltage and impact factor as risk indicators for icing and analyzed how various mitigation measures reduced icing-related risks [
13]. Lu J et al. proposed a spatiotemporal resilience evaluation framework for power systems to enhance recovery capability during ice disasters and used this framework to assess the risk imposed by ice disasters on power grids [
14]. Fan R et al. investigated the impact of various natural disasters on transmission line reliability by evaluating potential risks based on disaster occurrence probabilities and severity [
15]. In addition, some studies focused on the internal condition of equipment and adopted indicators such as the health index to characterize the line’s resilience to risk [
16,
17]. These studies have adopted different risk evaluation metrics tailored to their respective problems and, based on the assessment results, proposed corresponding risk mitigation strategies for transmission lines. However, these indicators fundamentally quantify line reliability and fail to realize a monetary quantification of icing-related risks. When it comes to comprehensively evaluating both the economic efficiency and reliability of anti-icing strategies, these approaches often fail to provide intuitive and actionable evaluation outcomes. Without effective integration of economic and reliability metrics, risk assessments of transmission lines cannot meaningfully guide the optimization of anti-icing strategies. To address this issue, this paper incorporates the value of lost load (VoLL) theory based on the failure rate of overhead transmission lines during the icing period and quantifies the icing risk as risk cost.
Overhead transmission lines are long-term operational assets, meaning that any investments in these systems inherently have temporal continuity. Therefore, time evolution must be explicitly considered [
18,
19]. The sum of the residual risk cost of anti-icing strategies considering time evolution and the implementation cost considering the time value of money is defined as the composite cost. Composite cost is used as the performance evaluation metric for anti-icing strategies. Accordingly, a performance evaluation model for overhead transmission line anti-icing strategies is proposed.
This model not only enables a scientific and intuitive assessment of strategy performance but also allows for comparative evaluation among different anti-icing strategies, thereby serving as a rational basis for strategy selection. To achieve strategy optimization, it is necessary to adopt appropriate optimization algorithms in a targeted manner [
20]. In different scenarios, employing distinct optimization algorithms can efficiently and effectively address practical problems [
21,
22]. To address the frequent icing issue in distribution lines, Zhang L et al. proposed a multi-period de-icing strategy optimization method for power distribution networks. The model was solved using an elitist-preservation genetic algorithm, and the effectiveness of the optimized model was demonstrated [
23]. To enhance power transmission grid resilience against ice disasters, NIU T et al. proposed a comprehensive resilience assessment metric and developed a two-stage robust resilience enhancement planning model [
24]. This model was subsequently applied to optimize investment decisions. However, the aforementioned studies failed to effectively integrate economic and reliability metrics. To address this gap in anti-icing strategy optimization, this paper proposes a comprehensive approach that simultaneously considers both economic and reliability indicators, implemented through a heuristic algorithm.
The literature review is summarized in
Table 1. Here, the third and fourth columns summarize the strengths and weaknesses of the existing literature, while reflections on addressing these limitations in this articles are presented in the fifth column.
The main contributions of this paper are summarized as follows:
A method for deriving the lifetime distribution function of transmission lines during the icing period is proposed, based on the Nelson–Aalen estimation method and metal deformation theory.
A quantitative risk model for overhead transmission lines under icing conditions is developed, integrating failure rate during the icing period, VoLL, and power outage energy loss, thereby providing a monetized risk indicator for icing events.
Based on the proposed risk quantification model, a performance evaluation method for anti-icing strategies is introduced. In this method, the implementation cost of a strategy is treated as risk control cost, and the sum of risk control cost and residual risk cost is defined as the composite cost, which serves as a comprehensive metric for evaluating and selecting the optimal anti-icing strategy.
The rest of this paper is organized as follows:
Section 2 introduces the method for deriving the transmission line lifetime distribution function during the icing period based on the Nelson–Aalen estimator and metal deformation theory.
Section 3 presents the risk quantification model for icing on transmission lines.
Section 4 proposes the anti-icing strategy performance evaluation method based on the risk model.
Section 5 conducts a case study using actual provincial power grid and climatic data to verify the feasibility of the proposed method. Finally,
Section 6 concludes the paper.
2. Estimation Method for the Lifetime Distribution Function of Transmission Lines During the Icing Period
The failure of transmission lines under icing conditions is primarily influenced by ice–wind loads, and their failure rate evolves with the progression of the icing process. The lifetime evolution behavior, therefore, differs significantly from that of conventional random failure patterns.
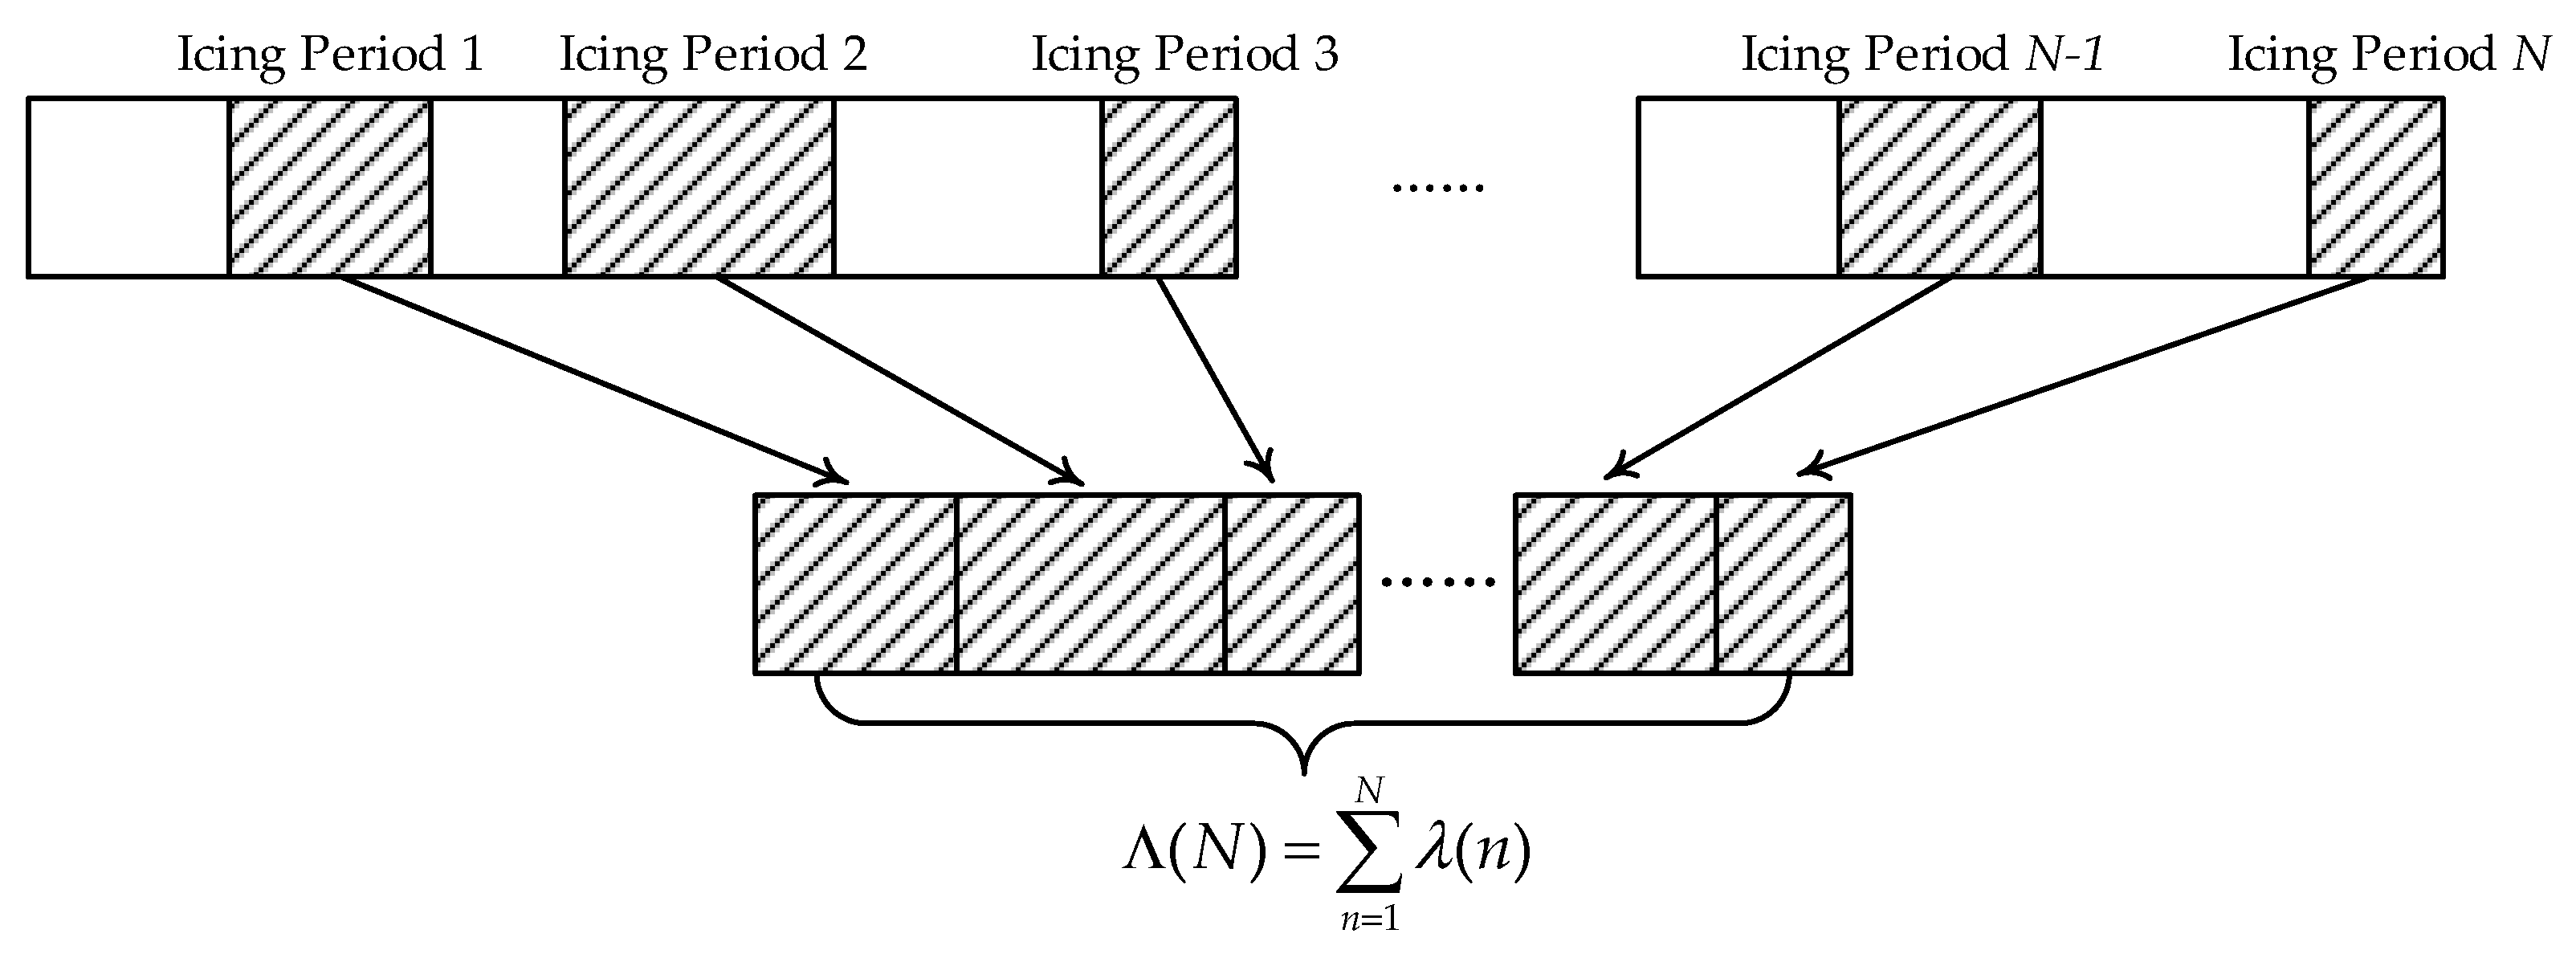
The Nelson–Aalen estimation method is a classical non-parametric approach for survival probability analysis, as illustrated in
Figure 1. It mainly consists of the following three steps:
First, define the instantaneous hazard function
λ(
t), the cumulative hazard function Λ(
T), and the lifetime distribution function
F(
T). These three functions are interrelated and satisfy the following relationship:
Next, a time discretization is applied to the above functions, yielding the discrete instantaneous hazard
λ(
n), the discrete cumulative hazard Λ(
N), and the discrete lifetime distribution function
F(
N). These three discrete forms maintain the following relationship:
Finally, the cumulative hazard function is estimated based on the observed event frequencies within the sample.
This study draws on the framework of hazard function and lifetime distribution function definitions and discretization as established in the Nelson–Aalen estimation method. In the context of icing-induced failures, the ice–wind load exerted on transmission line structures is primarily characterized by periodic icing periods, making the number of icing periods
n a natural discrete time scale for describing the risk accumulation process, as illustrated in
Figure 2. However, considering the short duration of a single icing period, the limited number of transmission lines within the same icing zone, and the sparse occurrence of observed failures in historical data, the empirical failure rates fail to adequately represent the true statistical characteristics of line failure during icing periods. Moreover, the failure mechanisms of transmission lines under icing conditions exhibit distinct material-dependent physical behavior. Therefore, this study does not adopt traditional non-parametric methods that estimate probability purely based on observed frequency. Instead, based on metal deformation theory, we constructed an empirical formula to calculate the hazard function values at each discrete time step, thereby providing a more reasonable representation of the accumulated damage process of conductors under ice load.
During the icing period n, the ice–wind load
acting on a transmission line is represented as a vector composed of ice load
and wind load
. The ice load results from the gravitational force of the accreted ice on the line and is always directed vertically downward. The wind load is caused by the wind acting on the line and is oriented horizontally. The relationship between the failure rate λ of transmission lines and the ice–wind load, as calculated using an empirical formula, is shown in
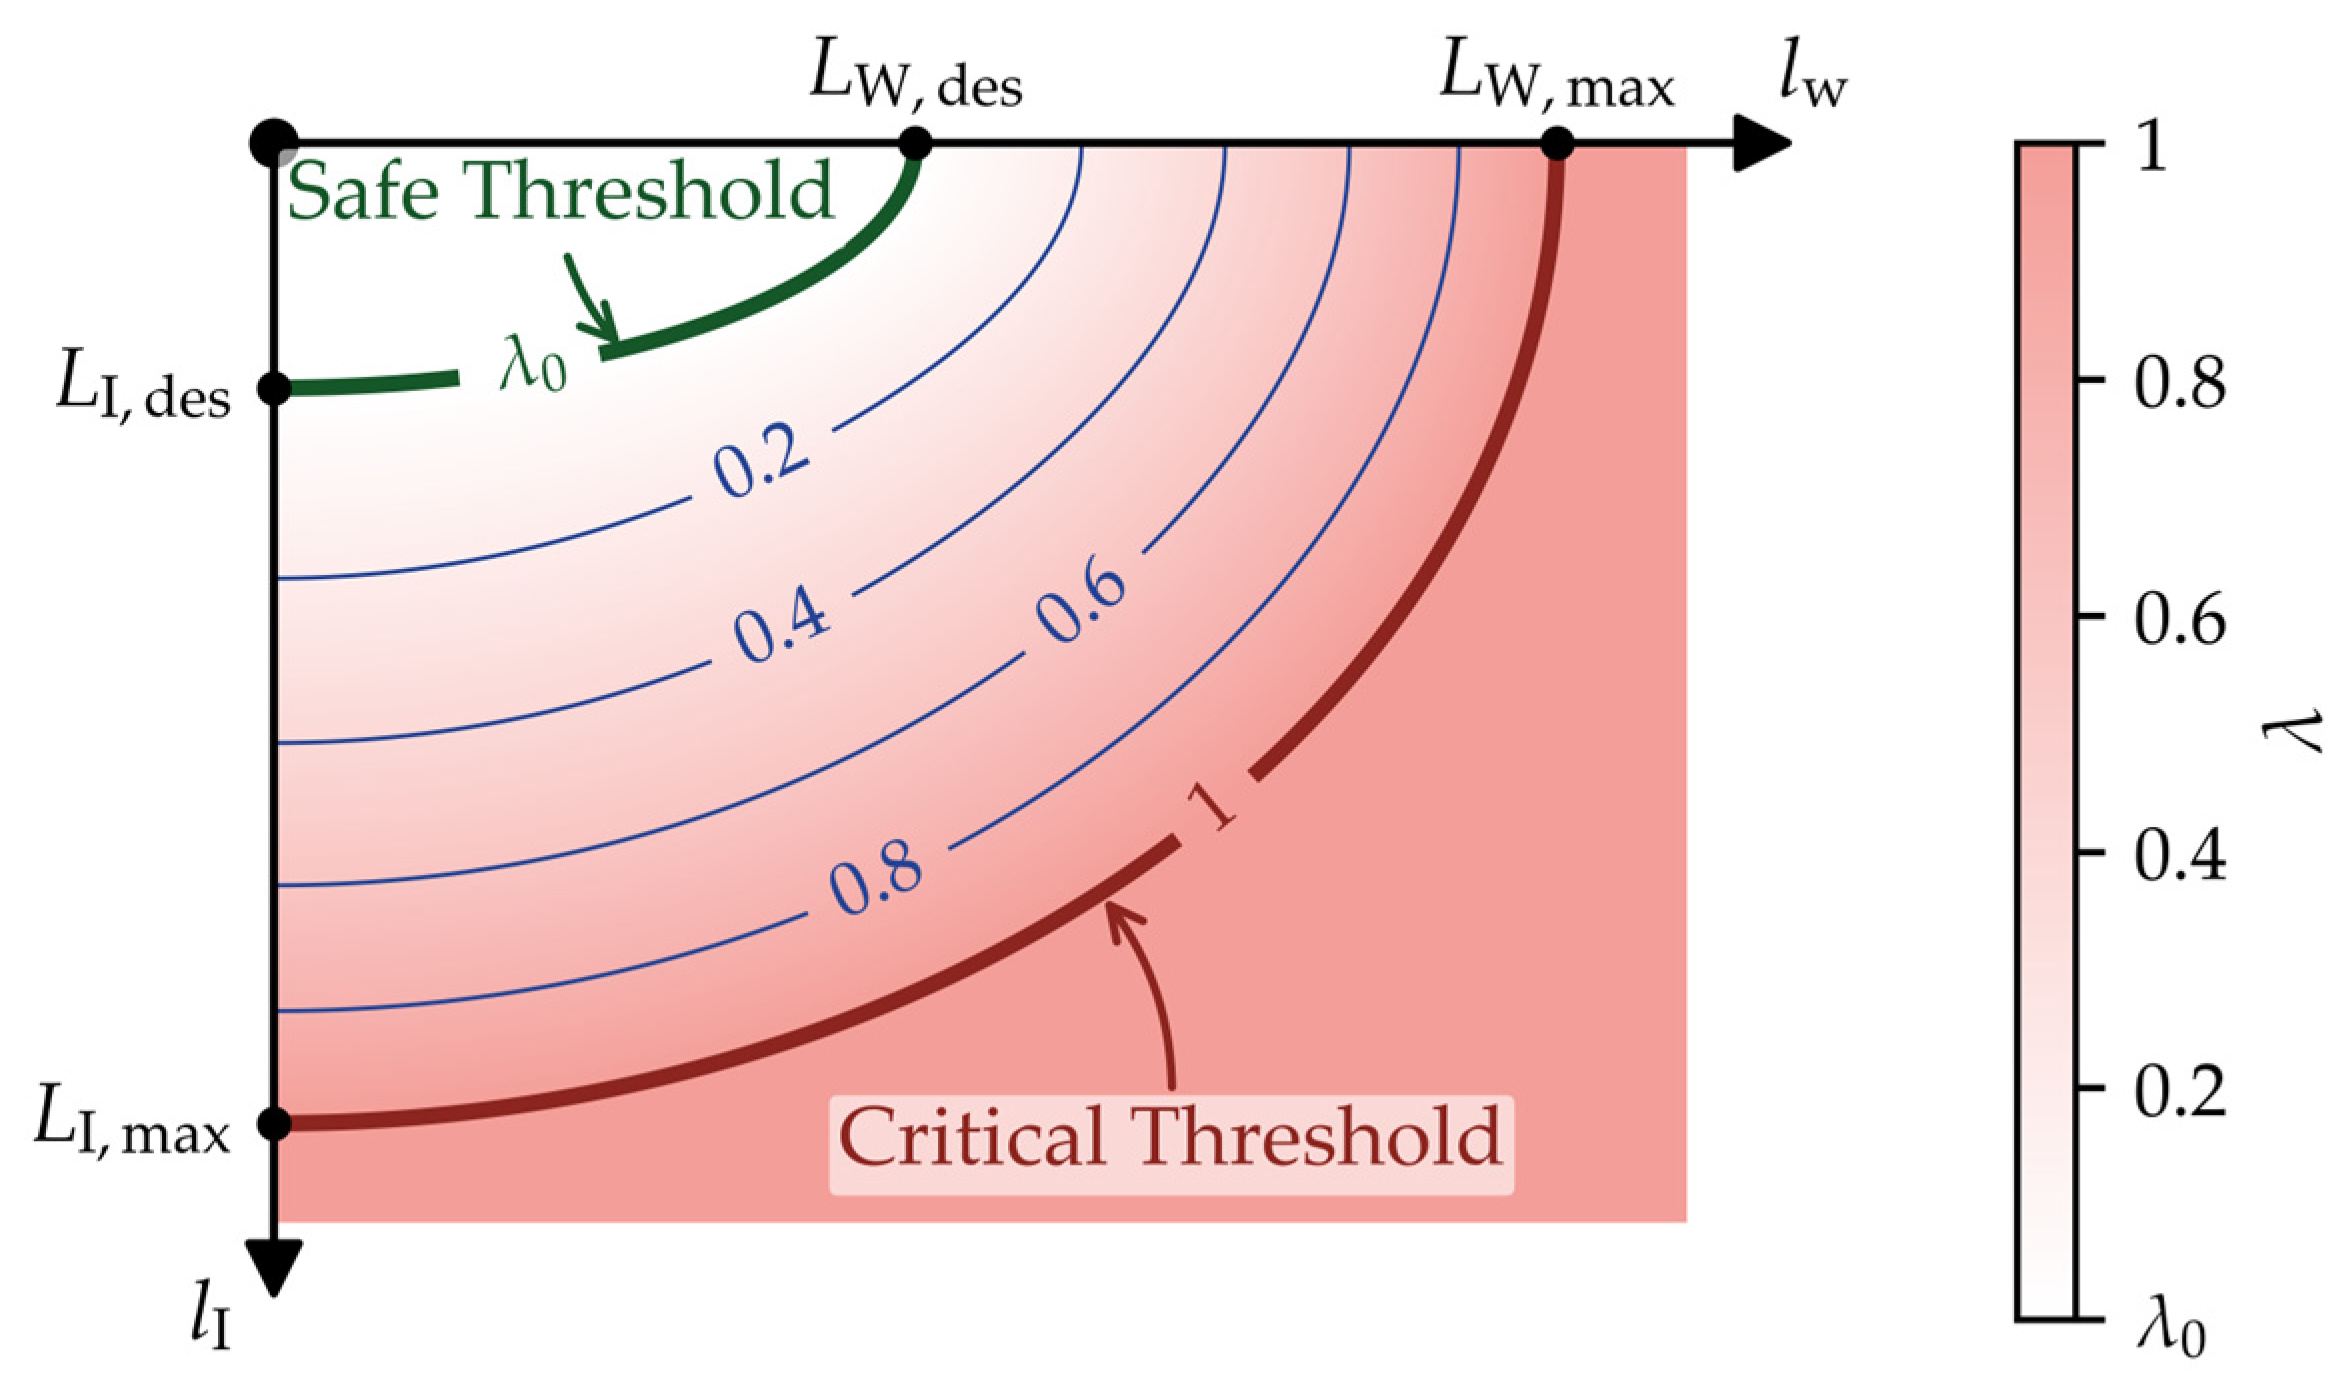
Figure 3.
In
Figure 3, the vertical axis and horizontal axis represent the ice load and wind load, respectively. Here,
and
denote the safe threshold and critical threshold of ice load that the overhead transmission line can withstand;
and
are the corresponding thresholds for wind load. The green curve in the figure represents the safe boundary of the ice–wind load, defined as an ellipse determined by
and
. When the ice–wind load vector falls within this ellipse, the failure rate of the line remains at a relatively low level, denoted by λ
0. The red curve denotes the limit boundary, also an ellipse, determined by
and
; if the ice–wind load falls outside this ellipse, the line is considered to fail with certainty [
25]. The thin blue lines in the figure are iso-failure-rate curves, while the red background gradient indicates the magnitude of the failure rate, with darker shades representing higher failure rates.
Let the ice–wind load of the transmission line during icing period
n be denoted as
, the safe threshold of ice–wind load as
, the critical threshold as
, and the failure rate as
. Then, the icing-induced operational failure rate
can be expressed as follows:
where
and
represent the magnitude and angle of the ice–wind load
, respectively, as illustrated in
Figure 4.
and
denote the safe threshold and critical threshold of the transmission line under the load angle
, respectively.
The calculation method for the magnitude and angle of the ice–wind load on the transmission line is as follows:
The design of overhead transmission lines must simultaneously comply with both wind load and ice load design standards. The Code for Design of 110 kV to 750 kV Overhead Transmission Lines (GB 50545-2010) in China specifies design standards for ice loads and wind loads on overhead transmission lines separately but does not provide design criteria for combined ice–wind load conditions. Since ice load and wind load act in perpendicular directions, the resulting combined load lies at an angle between the horizontal and vertical when both loads are applied simultaneously. Due to the direction-dependent load-bearing capacity of transmission lines, their safe thresholds and critical thresholds vary with different load directions [
26]. At a given angle
, the thresholds can be expressed as follows:
During the icing period, the ice load and wind load on transmission lines are determined by the ice thickness
d and the wind speed
v [
27]:
where
denotes the density of the ice, with a value of 0.9 g/cm
3 according to GB 50545-2010 in China (other regions may adopt localized standards);
D is the diameter of the conductor.
a represents the wind speed non-uniformity coefficient, with its value given as follows:
β is the shape coefficient of wind load, with its value given as follows:
According to [
28], when only the effect of icing is considered, the transmission line is unlikely to experience a fault or outage if the ice thickness
d is below the design ice thickness
ddes. However, if
d reaches 5
ddes, the line is very likely to experience conductor breakage and result in a fault-induced outage. Similarly, if the wind speed
v is below the design wind speed
vdes, the line is not expected to fail. However, if
v reaches 2
vdes, the probability of conductor breakage and fault-induced outage becomes very high.
Therefore, by substituting
ddes and
vdes into Equation (7), the design value of ice load
LI,des and the design value of wind load
LW,des can be obtained as follows:
Similarly, by substituting 5
ddes and 2
vdes into Equation (7), the critical value of ice load
LI,max and the critical value of wind load
LW,max can be obtained as follows:
3. Quantitative Risk Model for Icing of Overhead Transmission Lines
The purpose of evaluating the icing risk of overhead transmission lines is to formulate appropriate anti-icing strategies based on the severity of the risk. In previous studies, the severity of icing risk was often represented by indicators such as the health index or risk levels. Although these methods can quantify the effectiveness of anti-icing strategies after implementation, their outputs are non-monetary, making it impossible to directly compare them with the implementation costs of the strategies. As a result, it becomes difficult to conduct a comprehensive performance evaluation, which may lead to a significant mismatch between the cost and the effectiveness of anti-icing strategies. To address this issue, this paper proposes a quantitative risk model for overhead transmission lines under icing conditions, which is based on three core components during the icing period: the failure rate, the VoLL, and the amount of lost load.
The risk quantification model is illustrated in
Figure 5, where the model output is the icing risk cost
RI of the overhead transmission line, defined as
where
F represents the lifetime distribution function of the overhead transmission line under icing conditions, which can be calculated based on the failure rate
λ described in
Section 1;
VL denotes the VoLL due to fault-induced outages; and
Wout is the amount of lost load.
The VoLL VL for transmission lines is an indicator used to measure the economic loss caused by power supply interruption, reflecting the economic value per unit of electricity. In this study, the production function method is adopted to calculate the value of lost load.
The production function method, also known as the macroeconomic approach, views electricity as a production factor equivalent to capital and labor from a macroeconomic perspective, linking it directly to economic output. Power interruptions result in interruption losses. When viewed from an opportunity cost perspective, it can be represented by the output that electricity would have generated under normal supply conditions.
Since the primary contributors to economic output and electricity consumption are the industrial and service sectors, while households and public institutions contribute relatively little, this study focuses on the lost load cost associated with industrial and commercial electricity users.
The value of lost load
VL, representing the unit economic loss per kilowatt-hour of electricity not supplied in the industrial and service sectors, is calculated using the following formula [
29]:
where GVA represents the total value added of the observed region, which is equivalent to the regional GDP; ELC denotes the electricity consumption of the observed region.
The amount of lost load
Wout is obtained by multiplying the power loss
PL resulting from a transmission line failure by the outage duration
tout, as follows:
Among all types of transmission line failures, conductor breakage results in the greatest power loss. To enhance the reliability of the transmission line, more severe failure scenarios should be considered. Therefore, this study adopted the power loss caused by conductor breakage as the value of
PL. In the most critical conductor breakage scenarios, the power originally carried by the failed line cannot be rerouted through other lines, meaning the lost power equals the maximum transmission capacity
Pl of the line. To ensure maximum reliability, the amount of lost load
Wout is, therefore, determined according to Equation (15).
The outage duration tout refers to the time interval from the occurrence of a conductor breakage in an overhead transmission line to the completion of repair and restoration of power supply. Since icing-prone microtopographic and microclimatic areas are often located far from residential zones, line maintenance is typically hindered by poor accessibility and transportation difficulties. As a result, the repair duration tends to be relatively long. According to maintenance data surveys, the typical repair time ranges from 24 to 48 h. In this study, the average value of 36 h was adopted.
In summary, the icing risk cost RI of overhead transmission lines can be calculated using Equation (12).
4. Performance Evaluation of Transmission Line Anti-Icing Strategies Based on a Time Evolution Model
Anti-icing strategies for transmission lines are composed of a combination of anti-icing schemes applied across multiple lines. These schemes often differ significantly in terms of both investment cost and the sustainability of their effectiveness in mitigating the icing risk of overhead transmission lines. Therefore, evaluating the performance of anti-icing strategies solely based on their effectiveness in the year of implementation lacks scientific rigor. To address this limitation, this paper proposes a performance evaluation method for anti-icing strategies based on a time evolution model, which accounts for the dynamic risk control effect over multiple icing periods.
Let set S represent the candidate set of anti-icing schemes for a single transmission line, defined as S = {s1, s2,…, sy,…, sY}. Define a vector k = (k1, k2,…, km,…, kM) to represent a combination of anti-icing schemes across all lines, i.e., an anti-icing strategy. Here, M denotes the total number of transmission lines, and km denotes the anti-icing scheme selected for line m, with km ∈ S. For example, km = sy indicates that line m adopts the anti-icing scheme sy.
To comprehensively evaluate the performance of an anti-icing strategy by considering both the residual risk cost and the investment cost of transmission lines, the composite cost with time evolution for a given anti-icing strategy
k is defined as
E(
k).
where
Tmax denotes the evaluation period for the anti-icing strategy’s performance. Its value can be determined based on the maximum effective duration among all anti-icing schemes within the strategy, the least common multiple of their durations, the lifetime of the transmission line, or the enterprise planning horizon.
Cm(
km,
T) represents the present value of the investment cost in year
T for line
m when adopting anti-icing scheme
km;
RIm(
km,
T) denotes the present value of the residual risk cost in year
T for line
m under scheme
km. The residual risk cost refers to the quantified risk cost that remains over time even after an anti-icing scheme has been implemented.
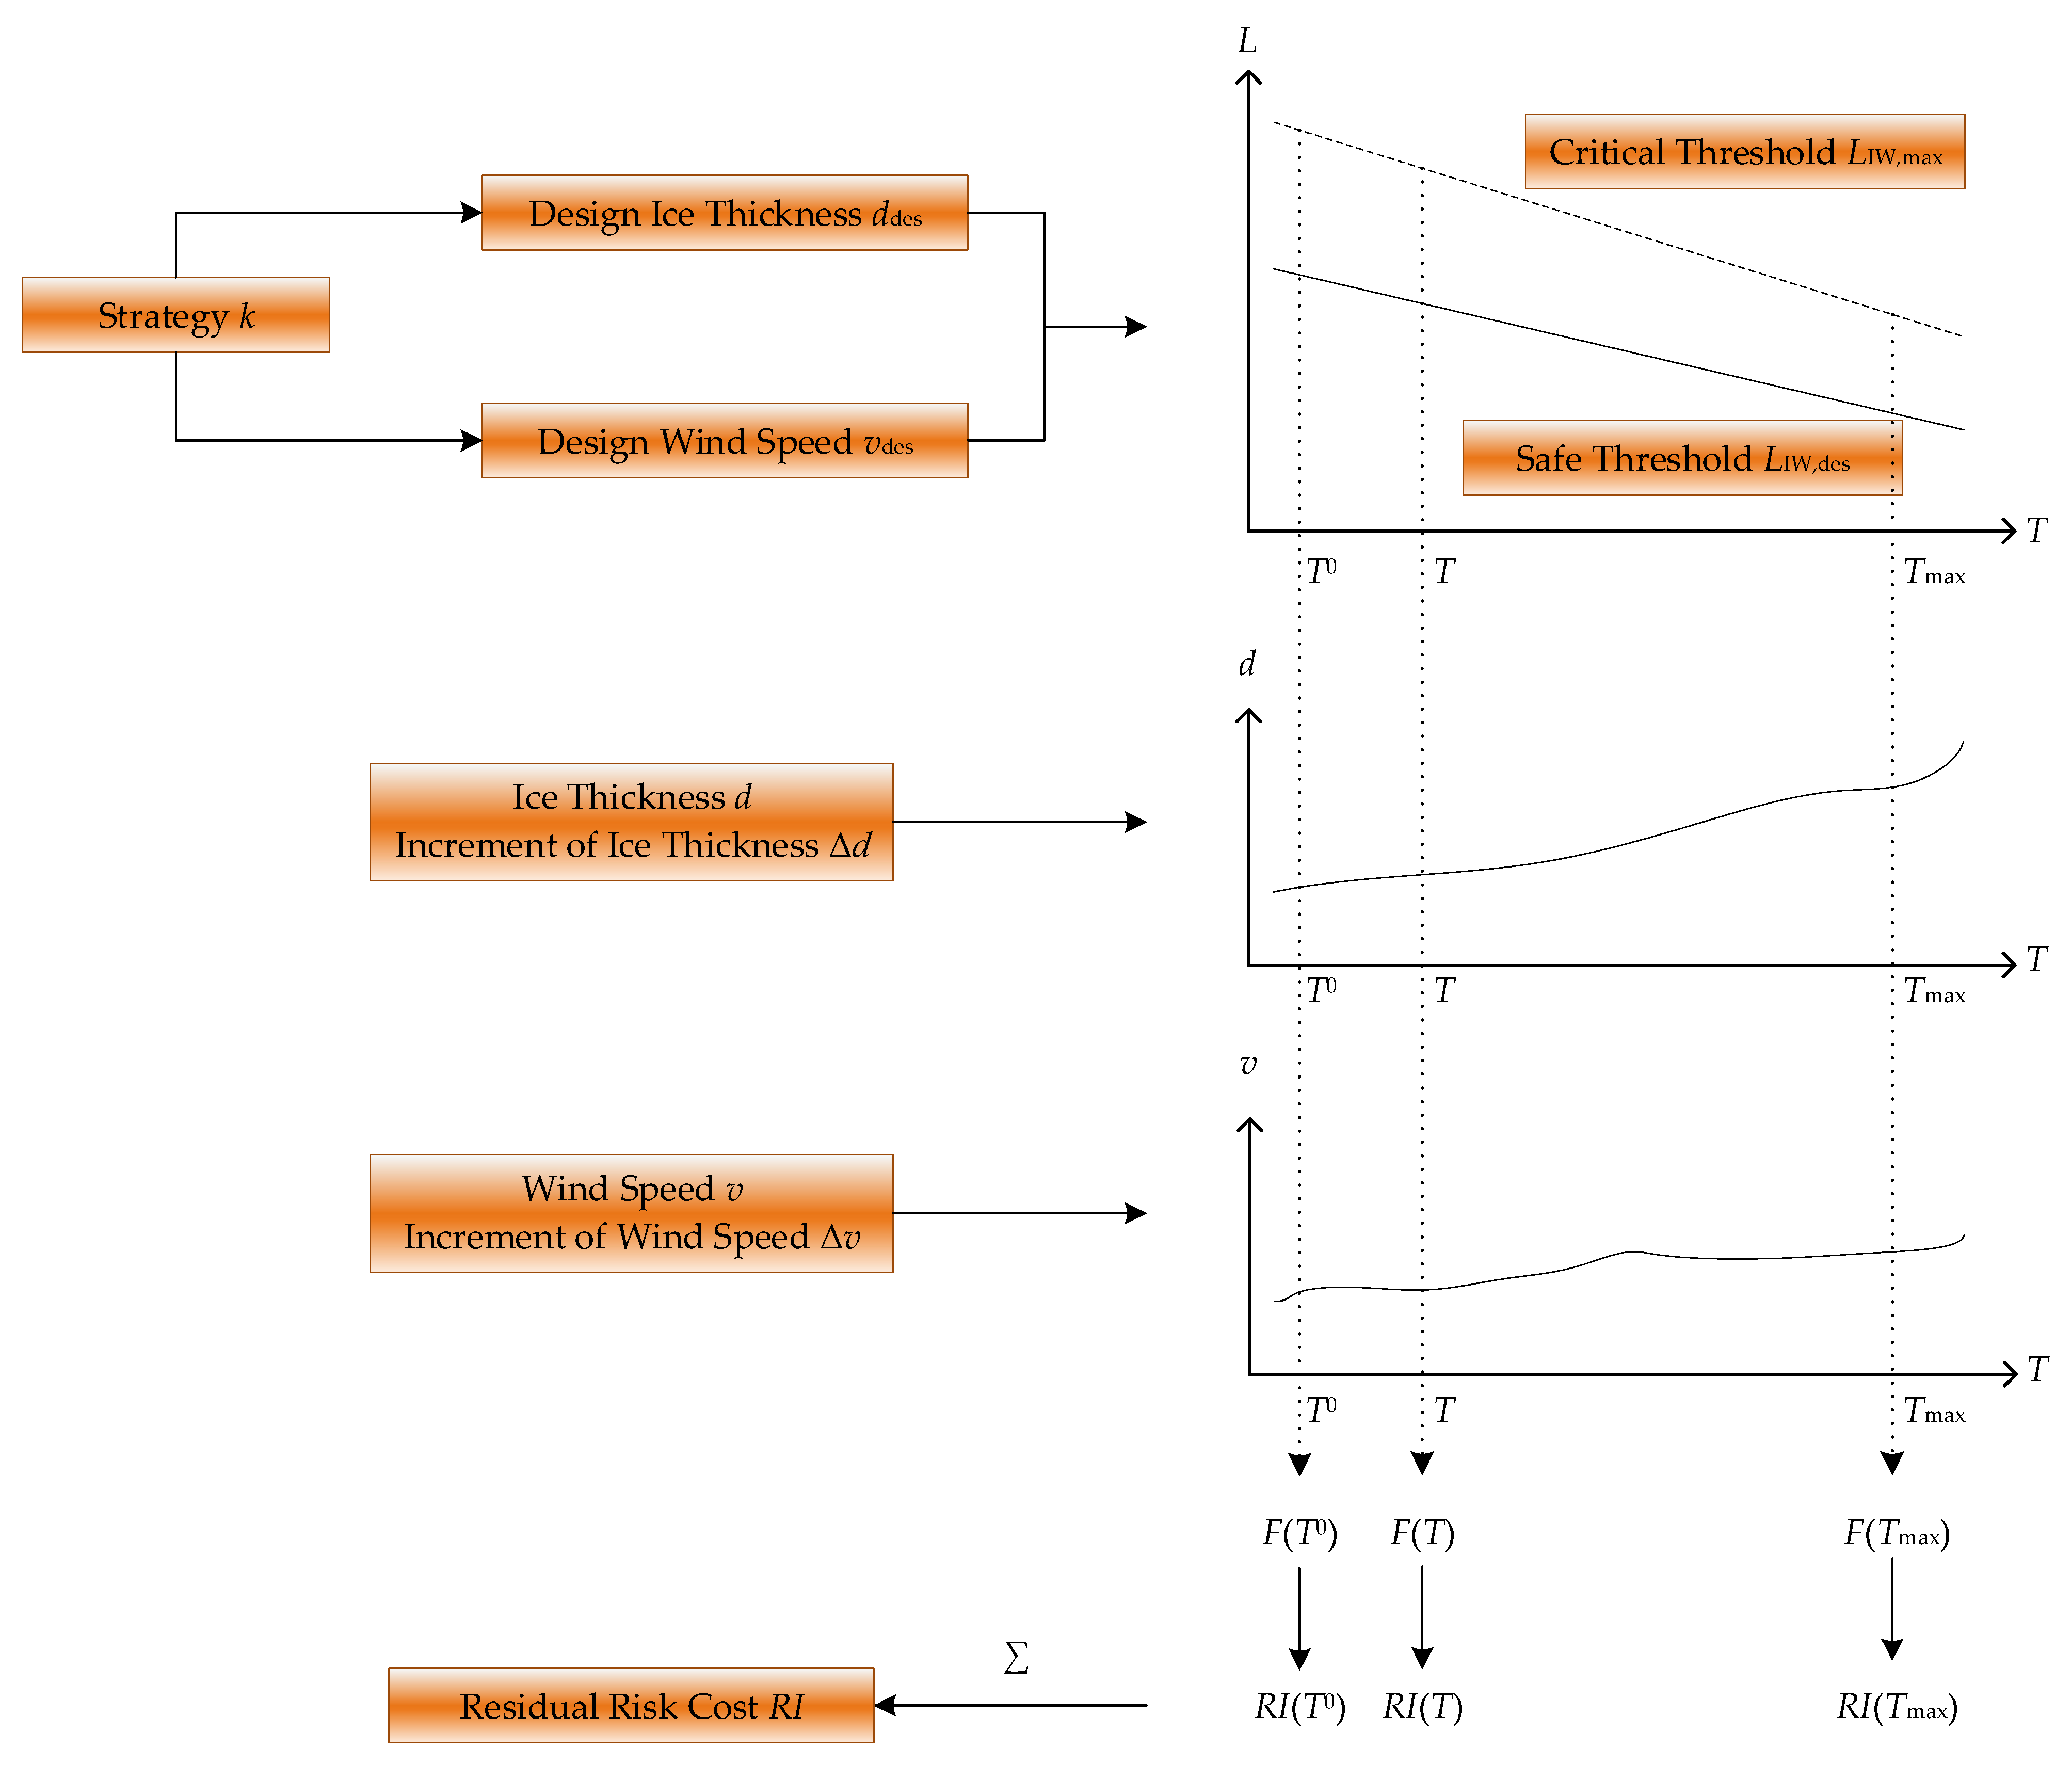
The calculation process of
RIm is illustrated in
Figure 6.
The performance evaluation results consist of two components:
Cm and
RIm, whose calculation methods are as follows:
where
cm(
km,
T) is the investment cost in year
T for line
m when adopting the anti-icing scheme
km, and
r is the discount rate. Capital exhibits time value—a given amount of money today is worth more than the same nominal amount in the future. Therefore, the investment cost in year
T cannot be directly compared to present-day costs. To enable temporal comparison, this study applies a discount rate
r to convert future values to present values.
where
Fm(
km,
T,
N) is the lifetime distribution function of line
m in year
T, given that
N icing periods occur after implementing anti-icing scheme
km;
VL,m is the VoLL for line
m;
Wout,m is the amount of lost load for line
m.
The investment cost of an anti-icing strategy is a key parameter for evaluating its economic performance. However, existing evaluation methods based on risk levels, health indices, and similar indicators cannot directly integrate the investment cost with the effectiveness metrics of anti-icing strategies. The method proposed in this paper addresses this issue by incorporating the impact of time evolution on the residual risk of transmission lines, as shown in Equation (18). It also accounts for the time value of money, converting future cash flows into their present values, which enables direct mathematical integration of the residual risk and the investment cost, as shown in Equation (16). As a result, the proposed method enables an objective and effective evaluation of the composite performance of anti-icing strategies.
In Equation (18),
where Λ
m(
km,
T,
N) is the cumulative hazard function of line
m in year
T, given that
N icing periods occur after the implementation of anti-icing scheme
km.
where
denotes the failure rate of line
m during the n-th icing period in year
T, after the implementation of anti-icing scheme
km. It is calculated based on Equation (3), using the line’s ice–wind load
during that icing period, the corresponding safe threshold
, and the critical threshold
of the ice–wind load.
The ice–wind load
of a transmission line is calculated by substituting the maximum ice thickness
dm(
T,
n) and the maximum wind speed
vm(
T,
n) of line
m during the icing period
n in year
T into Equation (7). The ice thickness and wind speed in year
T directly influence the lifetime distribution function, thereby affecting the risk cost. To mitigate this risk cost, it becomes necessary to select an anti-icing scheme with enhanced ice-resistant capabilities. Therefore, the time evolution model must account for future variations in ice thickness and wind speed. Due to inter-annual variability in climatic conditions, the characteristics of icing differ across years and exhibit a certain degree of randomness [
30]. Therefore, this study adopted a time evolution-based meteorological simulation method, in which the ice thickness and maximum wind speed in future years are modeled as the sum of the previous year’s values and a random variable with specific distribution characteristics, as shown in the following equation:
where
and
represent the maximum ice thickness and maximum wind speed during the icing period on line
m during the implementation year of the anti-icing strategy;
and
denote the annual increment of maximum ice thickness and maximum wind speed, respectively, following stochastic distributions
and
. The stochastic distributions should be derived from historical data of the study region.
This approach captures the uncertainty in meteorological conditions as they evolve over time.
After commissioning, overhead transmission lines undergo degradation due to wind and rain erosion, leading to a gradual reduction in load-bearing capacity over time [
31]. The safe threshold
and critical threshold
of the ice–wind load borne by line
m in year
T after implementing anti-icing scheme
km are influenced by both the anti-icing scheme itself and time evolution. The calculation method is as follows:
where
and
represent the initial safe threshold and initial critical threshold of the ice–wind load for line
m in the year of implementing anti-icing scheme
km, respectively;
and
denote the degradation of the safe threshold and critical threshold of the ice–wind load for line
m in year
t after the implementation of scheme
km, respectively. In the time evolution model of this study, the degradation of line load-bearing capacity is primarily characterized by an annual decline in both the safety threshold and the critical threshold. To capture this behavior, we assumed a 1% yearly reduction in both thresholds.
The optimization of anti-icing strategies by power grid enterprises should be based on the performance evaluation results of those strategies. However, due to the limited annual investment budget for anti-icing measures on transmission lines and the need to ensure that the residual risk remains within acceptable reliability thresholds, it is important to avoid an imbalance between economic efficiency and system reliability. To address this, the anti-icing strategy optimization model proposed in this paper, based on performance evaluation, is formulated as follows:
where
cth(
T) denotes the investment cost threshold for anti-icing measures set by the power grid enterprise in year
T;
Fm,th(
T,
N) represents the reliability requirement specified by the enterprise for line
m during
N icing periods in year
T.
The ice-resistant strategy optimization model (25) is a linear integer programming problem and constitutes an NP-hard problem, which could be solved by solvers like Gurobi or CPLEX. However, for optimization problems involving multiple lines, the solving difficulty may be significant.
On the other hand, it is noted that in the optimization model, the cost terms and lifetime distribution constraints are decoupled for different lines. The strategies for each line are only coupled through the total implementation cost. Therefore, heuristic methods can be employed to solve the ice-resistant strategy optimization model. First, the optimal solution is found without considering the implementation cost constraint, and then adjustments are made based on a greedy algorithm to obtain the optimal solution that satisfies the constraints.
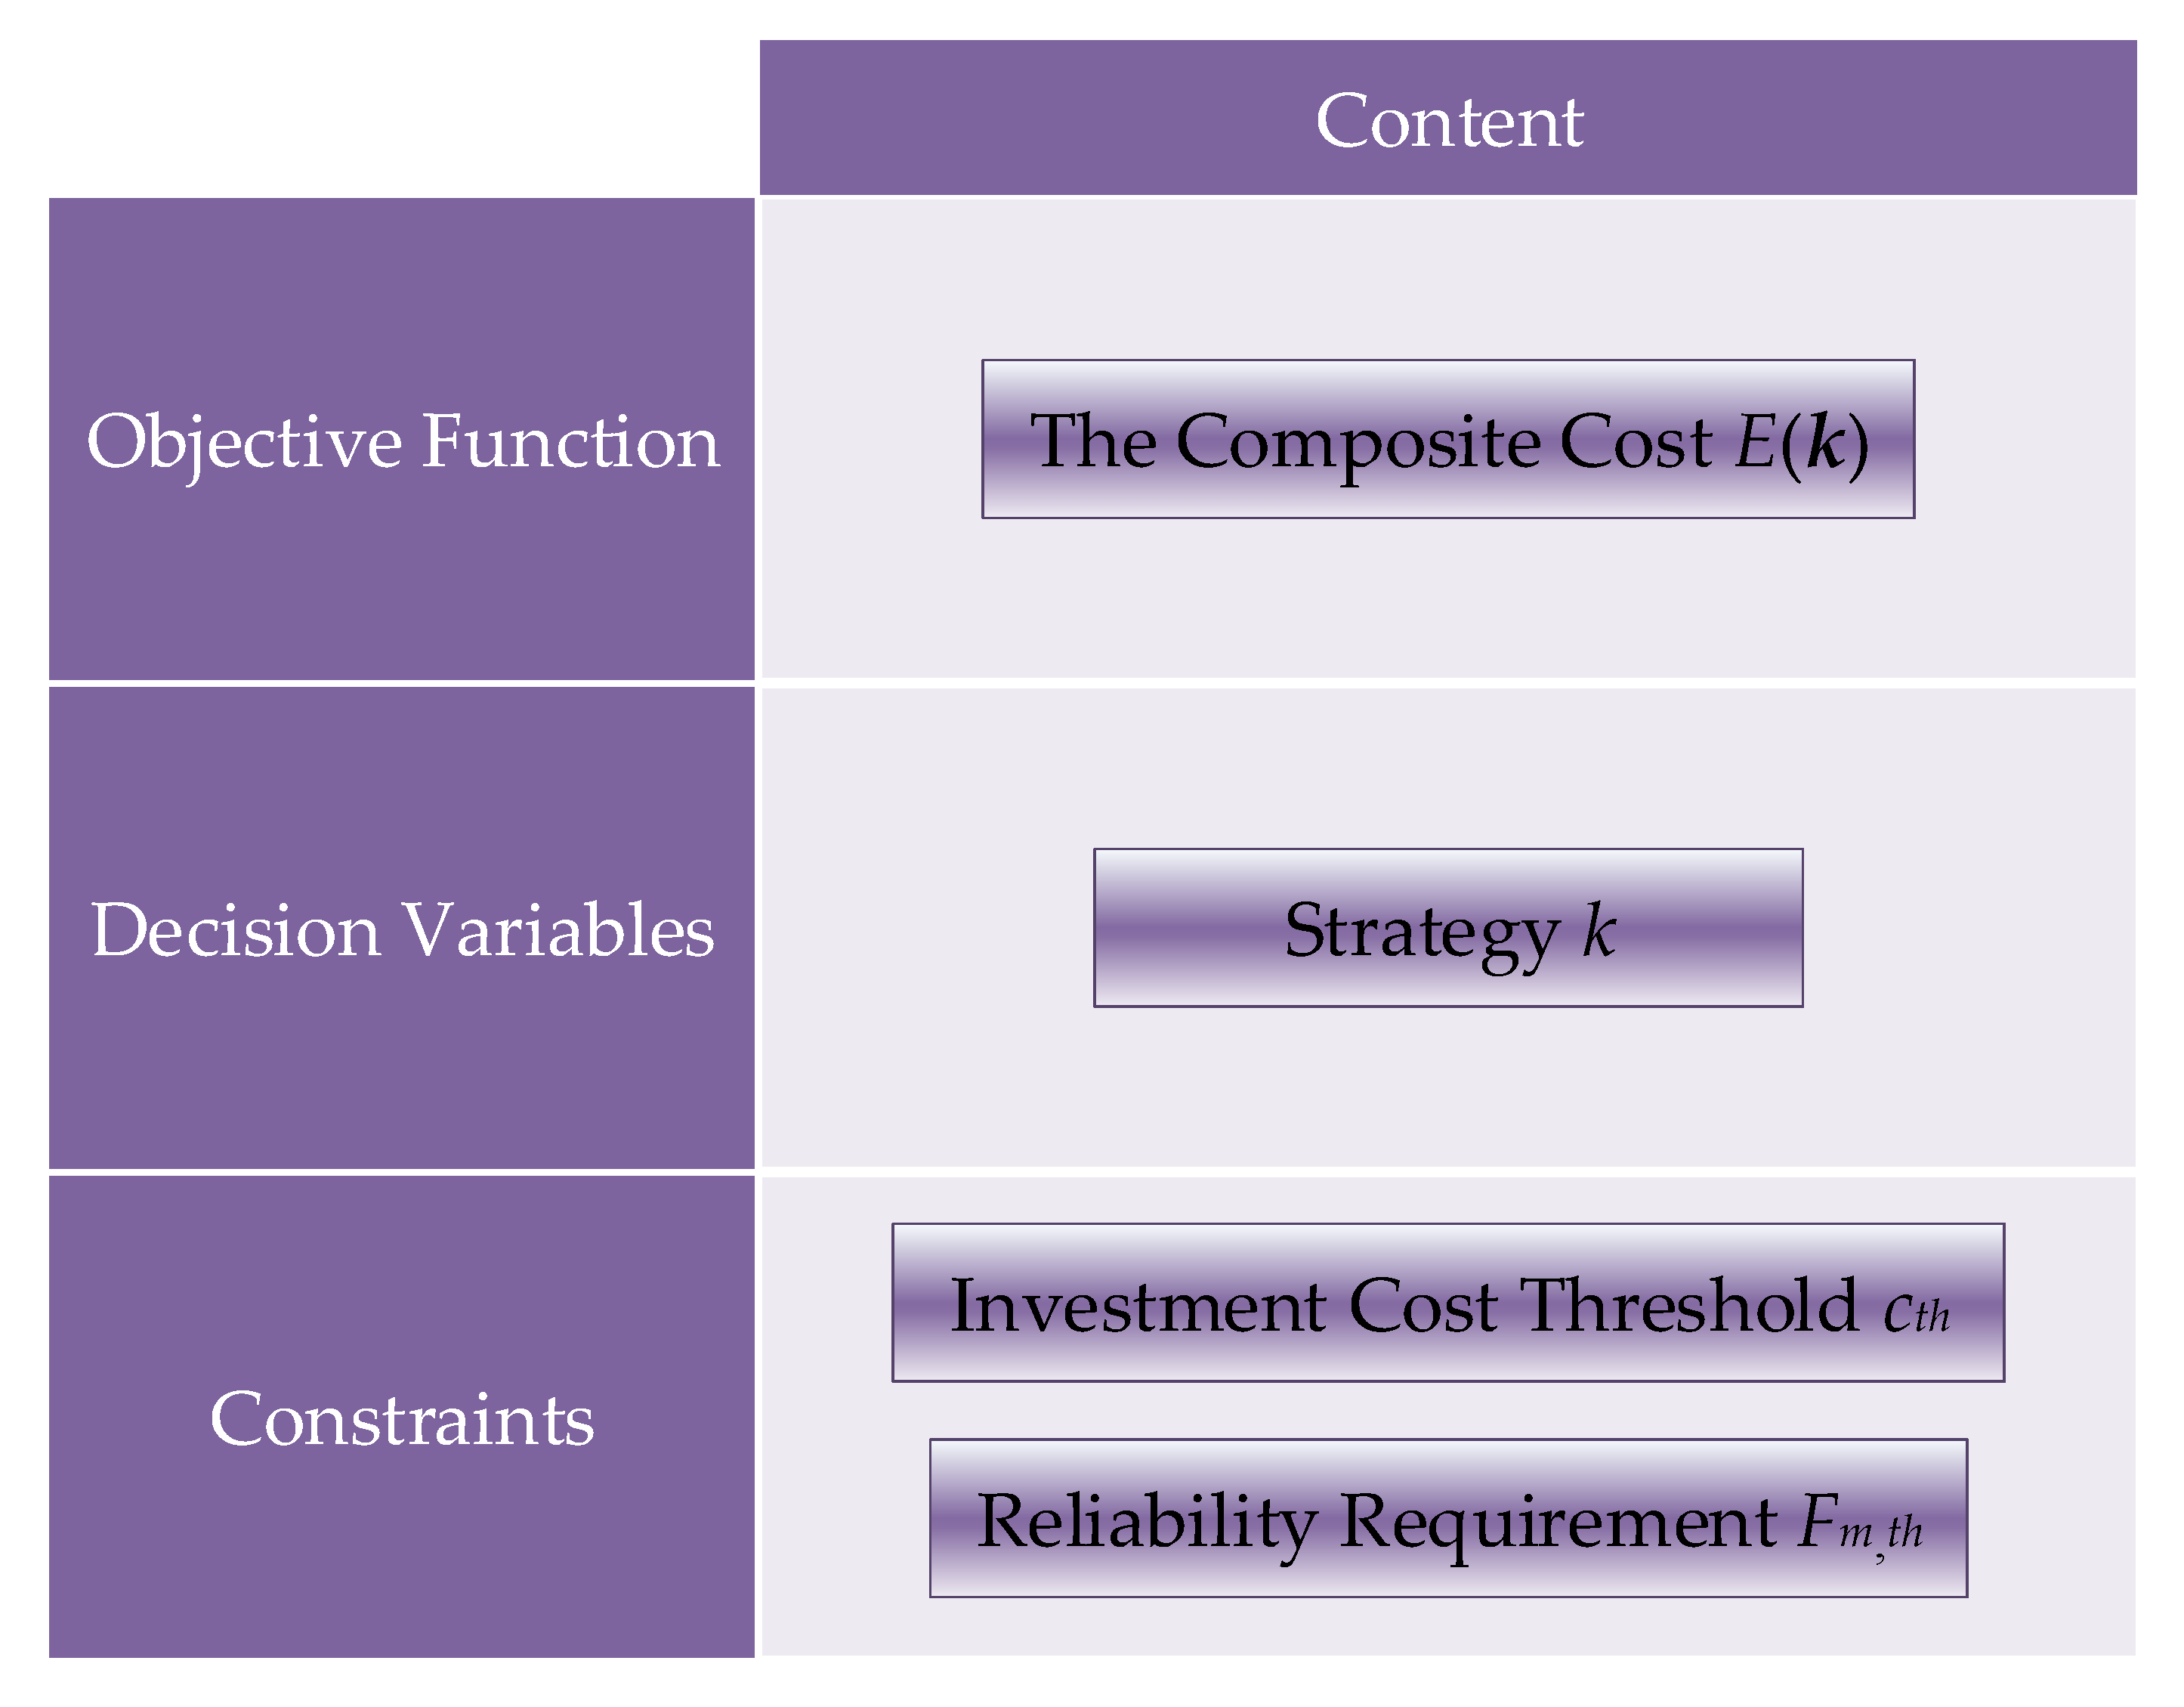
The structural framework of the optimization model is illustrated in
Figure 7. The pseudocode of the model-solving algorithm is shown in Algorithm 1. The algorithm consists of four steps. In Step 1, the implementation cost, residual risk cost, and lifetime distribution function are calculated for all strategies of all lines. In Step 2, feasible strategies for all lines are filtered based on lifetime distribution constraints. In Step 3, based on the feasible strategies from Step 2, the strategy with the lowest total cost is selected for each line. Finally, if the total implementation cost constraint is violated, Step 4 iteratively adjusts the ice-resistant strategies of the lines. Using the greedy algorithm, each adjustment selects the strategy with the lowest unit adjustment cost until the total implementation cost constraint is satisfied.
This model-solving algorithm leverages the near-decoupling characteristic of ice-resistant strategies across different lines, enabling faster determination of ice-resistant strategies. Additionally, methods like strategy adjustment backtracking can be incorporated to avoid local optima.
The anti-icing strategy optimization in this study constitutes an NP-hard linear integer programming problem. Although mathematically formulated as a linear integer programming model, the computational complexity is reduced due to the independence of strategies across different transmission lines. Consequently, a heuristic algorithm was employed for solution derivation, as shown in Algorithm 1.
| Algorithm 1: Heuristic Algorithm for Ice-Prevention Strategy Selection under Budget Constraints |
| 1: | Initiation. Let M be the number of transmission lines. Let S be the candidate set of anti-icing schemes for a single transmission line. Let T be the evaluation period for the anti-icing strategy’s performance. |
| Step 1: Calculate cost for all anti-icing schemes of all lines |
| 2: | For each line m∈{1, 2, …, M}: |
| 3: | For each scheme km∈S: |
| 4: | For each time T∈{1, 2, …, Tmax}: |
| 5: | Calculate the implementation cost Cm(km, T), the lifetime distribution function
F(N) and the residual risk cost RIm(km, T) through (17) and (18), respectively. |
| 6: | endfor |
| 7: |
endfor |
| 8: | endfor |
| Step 2: Feasible scheme reduction |
| 9: | For each line m∈{1, 2, …, M}: |
| 10 | Define the feasible scheme set of line m: |
| 11: | Sm←{sy|sy∈S and Fm(km, T, N) ≤ Fm, th(T, N), T ∈ {1, 2, …, Tmax}} |
| 12: | If Sm= ∅: |
| 13: | Terminate with infeasibility. |
| 14: |
endif |
| 15: | endfor |
| Step 3: Initial strategy selection |
| 16: | For each line m∈{1, 2, …, M}: |
| 17: | Select the optimal scheme: |
| 18: | km← |
| 19: | endfor |
| 20: | Define current strategy: |
| 21: | k←{km|m∈{1, 2, …, M}} |
| Step 4: Iterative strategy adjust |
| 22: | Check implementation cost constraint: |
| 23: | If : |
| 24: | Terminate and return current strategy k |
| 25: | endif |
| 26: | Define the violate constraints year set as TVC |
| 27: | TVC←{T|year T of violation of the implementation cost constraint} |
| 28: | For each line m ∈ {1, 2, …, M}: |
| 29: | For each feasible scheme sy ∈ Sm-{km}: |
| 30 | |
| 31: | Calculate Δcm(km, sy), the difference of the total implementation cost in the
years in TVC between scheme km and scheme sy |
| 32: | Calculate ΔEm(km, sy), the difference of the total composite cost in the years
in TVC between scheme km and scheme sy |
| 33: | Define unit adjustment cost of line m and scheme sy: |
| 34: | ρm(km, sy)←|ΔEm(km, sy)/Δcm(km, sy)| |
| 35: | endfor |
| 36: | endfor |
| 37: | While True |
| 38 | If ΔEm(km, sy) > 0 for all lines and schemes |
| 39: | Terminate with infeasibility. |
| 40: |
endif |
| 41: | Find the line m and scheme sy with the highest ρm(km, sy) and a negativeΔcm(km, sy) |
| 42: | km←sy |
| 43: | Update the violate constraints year set TVC |
| 44: | If TVC = ∅: |
| 45: | Terminate and return current strategy k |
| 46: |
endif |
| 47: | Update unit adjustment cost for line m |
| 48: | endwhile |
6. Conclusions
This paper proposes a time-evolution-based performance evaluation model for overhead transmission line anti-icing strategies, considering both reliability and economic performance. The model was employed to enhance ice mitigation strategies in operational transmission networks.
First, a transmission line icing failure rate model was established based on the Nelson–Aalen method and metal deformation theory. Combined with the VoLL and line load data, this model enables the quantification of icing risk costs under icing conditions, providing a monetized risk indicator.
Then, by taking into account risk control costs, implementation costs, and time effects, a method was proposed to compute the composite cost for evaluating the performance of anti-icing strategies. With minimization of the composite cost as the optimization objective, and subject to reliability and economic constraints, the proposed algorithm aimed to ensure both secure and stable power grid operation and cost control.
Finally, based on real-life power grid and meteorological data from a province in China, a case study was conducted to validate the effectiveness of the proposed risk quantification indicator and composite cost metric. The comparative analysis shows that the anti-icing strategy selection method proposed in this paper can effectively reduce the operational risks of overhead transmission lines under icing conditions while also controlling strategy implementation costs more efficiently than existing methods.
The proposed algorithm provides a scientific basis for power grid enterprises to develop anti-icing and disaster mitigation strategies and offers valuable guidance for risk control engineering and cost management in power transmission systems.
Future research should comprehensively account for heterogeneous ice accretion patterns and incorporate extreme weather events. The actual distribution of freezing rain and wind speed may involve nonlinear dynamics or extreme events, for which current research has not yet established clear patterns. Therefore, future work should prioritize this unresolved challenge. Additionally, investigating interdependencies among transmission lines in power grids presents another critical direction.

