Article

Impact of Farm Biogas Plant Auxiliary Equipment on Electrical Power Quality

1
Faculty of Electrical Engineering, Bialystok University of Technology, Wiejska 45, 15-351 Bialystok, Poland
2
Department of Agronomy, Modern Technology and Informatics, International Academy of Applied Sciences in Lomza, 18-400 Lomza, Poland
3
Department of Production Engineering, Logistics and Applied Computer Science, Faculty of Production and Power Engineering, University of Agriculture in Krakow, Balicka 116B, 30-149 Krakow, Poland
4
Institute of Technical Sciences, Eastern European State College of Higher Education in Przemysl, Ksiazat Lubomirskich 6, 37-700 Przemysl, Poland
*
Author to whom correspondence should be addressed.
Energies 2025, 18(14), 3849; https://doi.org/10.3390/en18143849 (registering DOI)
Submission received: 10 June 2025 / Revised: 10 July 2025 / Accepted: 17 July 2025 / Published: 19 July 2025

Abstract

Devices that meet the needs of agricultural biogas plants represent a significant share of the energy balance of the source. The digester mixer is a crucial component installed in the fermentation chamber. Energy consumption during mixing depends on the regime and intensity, as well as the rheological properties of the carrier liquid, the dry matter content, and the dimensions of the fibers. Bioreactor operators often oversize mixers and extend mixing duration to avoid disruptions in biogas production. This paper analyzed the influence of digester mixer operations on selected electrical power quality parameters. For this purpose, two agricultural biogas plants with a capacity of 40 kW, connected to the low-voltage grid, were studied (one located approximately 120 m from the transformer station and the second 430 m away). As shown by the correlations presented in the article, the connection point of the biogas plant significantly impacted the magnitude of the influence of mixer operations on the analyzed voltage parameters. In the second biogas plant, switching on the mixers (in the absence of generation) caused the grid voltage to drop to the lower value permitted by regulations. (Switching on the mixers caused a change in voltage by about 30 V.) The most disturbances were introduced into the grid when the power generated by the biogas plant was equal to the power consumed by its internal equipment. (THDI then reached as high as 63.2%, while in other cases, it did not exceed 17%.) Furthermore, the operation of the mixers alone resulted in a reduction of approximately 1 MWh of energy exported to the power grid per month.

1. Introduction

The rising global demand for energy has resulted in the depletion of natural resources and an increasing reliance on fossil fuels worldwide [1]. This trajectory is being offset by a stronger focus on low-carbon development and the growing significance of the circular economy [2]. Over the past decade, biomass has emerged as a significant energy source, exhibiting remarkable growth [3]. The International Energy Agency (IEA) projects that by 2060, biofuels will account for 17% of the world’s total final energy consumption [4,5]. Unlike other renewable energy sources, biomass energy offers significant benefits, including minimal environmental impact [6,7,8]. However, the scarcity of agricultural land gives rise to competition between food production and the cultivation of biofuel crops [9]. As a result, residual biomass—primarily agricultural waste—has emerged as a promising alternative for sustainable energy generation [10,11]. In agricultural biogas plants, biogas production is uneven, so storage is necessary [12,13]. A typical agricultural biogas plant is often used to produce electricity and heat [14]. The basis for a proper digester operation is a constant temperature inside the digester [15]. A decrease or excessive increase in temperature in the digester results in a decrease in methane production, which can also affect the stability of the energy system [16]. Agricultural biogas plants constructed worldwide rely on a well-managed digester start-up process, which is crucial for ensuring stable plant operation and consistent biogas production. Additionally, the effective operation of these plants relies on the proper selection and preparation of fermentation substrates, along with meticulous monitoring and control of key process parameters. Many authors suggest properly supplementing the fermentation process with appropriately selected micronutrients using methanogenic archaeons [16].
One of the essential pieces of equipment installed in the digester is the mixer, which operates in intermittent or continuous mode. The power and position of the mixers are determined by knowing the tendency to form dross or sludge [17]. The selection of an appropriate mixing technology is determined by factors such as the type of feedstock, hydraulic retention time, and digester capacity. In operational facilities, almost 44% of biogas plant failures are due to errors in the mixing process [18]. Improper mixing results in overheated and underheated areas, as well as uneven concentrations of metabolic products, and promotes dross formation on the sludge surface [19,20]. Power consumption depends on the hydraulic characteristics of the propellers, as well as their size and speed [21]. Large digesters are usually equipped with several mixers. Energy consumption during the mixing process is influenced by the mixing regime and intensity, as well as by the rheological characteristics of the carrier fluid, the dry matter content, and the dimensions of the fibers [22,23]. According to Caillet and Adelard [24], optimal energy efficiency in mixing is attained at higher temperatures, specifically within the mesophilic range.
Additionally, temporary temperature fluctuations can alter the physical characteristics of the digested material by modifying the viscosity of its primary component, water [25,26]. To avoid interruptions in biogas production, bioreactor operators often oversize mixers and extend mixing times. However, excessive mixing destroys the methanogenic centers and inhibits biochemical reactions [27].
In contrast, productivity improvements of up to 7% have been observed with intermittent mixing [28,29]. Understanding the rheological properties of the biosurfactant as they vary with temperature can help optimize the mixing process in relation to key factors such as temperature, the extent of effective mixing zones, and mixing duration. This, in turn, can lead to reduced internal energy consumption during production and improved control over the entire process [30]. To maximize the mixing effect, mixer settings are adjusted to achieve an optimal substrate flow [31]. Adequate mixing quality is challenging to define, so various criteria are used to assess it, such as accounting for the presence of dead zones in reactors [32,33], achieving minimum flows [34], or preventing particle stagnation [35].
To analyze the criteria for selecting the size and number of mixers for a given agricultural biogas plant, the authors proposed an additional criterion: limiting the changes in power generated by the biogas plant due to the operation of the mixing equipment. To this end, studies were conducted on the impact of the mixer operation on the parameters that describe the quality of energy generated in low-power agricultural biogas plants.

2. Materials and Methods

2.1. Description of the Agricultural Biogas Plants Studied

This research was carried out in two biogas installations fed with substrate from dairy cows. Slurry from the barn was pumped into the primary reactor, where fermentation occurred. Table 1 presents selected parameters characterizing the slurry used in the tested agricultural biogas plants. The average residence time of the feedstock in the digester was 2.5 weeks. Daily, part of the digested slurry was pumped out (using a bellows pump) to the external digestion tank. Slurry from the barn was pumped in place of the pumped digestate.
The biogas reactor was cylindrical, with a diameter of 15.58 m and a height of 2.47 m. (The total height, including the gas balloon, was 7.47 m.) The tank contained an average of 362 m3 of digester liquid. Two screw mixers, each powered by a 9 kW three-phase motor, were installed in the digester. Figure 1 shows a view of one of the agitators installed in the agricultural biogas plants studied. To ensure stable digestion conditions, the reactor was heated using water heated by the biogas combustion engine. The water circulation from the engine to the reactor wall heaters and the floor heating of the chamber was driven by a circulation pump. In case of engine failure, the water was heated in a boiler powered by an external energy source.
The biogas produced was collected in the digester dome and transported to a technical container. After passing through a system of filters (to remove mechanical impurities and hydrogen sulfide), the biogas was transported to the engine, where it was combusted after being mixed with air. Biogas was cleaned of solid particles in mechanical devices equipped with fabric filters that were resistant to moisture and chemicals. Carbon filters were used to remove toxic and highly corrosive hydrogen sulfide from biogas, in which the biogas flowed through a bed of activated carbon. Thanks to the adsorption phenomenon, the carbon bound pollutants on its surface [36].
The two agricultural biogas plants studied each had two cogeneration systems, the technical data of which are shown in Table 2. Both biogas plants were connected to a low-voltage line, with the first biogas plant located approximately 120 m from the transformer station, while the second biogas plant was situated as far as 430 m from the station.
A portable Sonel PQM-710 power quality analyzer (manufactured in Świdnica, Poland) was used to measure the impact of the mixer operation on voltage quality parameters. It was an analyzer equipped with advanced features that enabled comprehensive Class A measurements to be performed. It provided a comprehensive 4-quadrant analysis of all parameters that described load and power quality. Measurements were taken, with a one-minute average of the results obtained.

2.2. Analyzed Parameters of Electricity Quality

The following parameters describing power quality were analyzed in the study:
  • The frequency of the mains supply. The frequency deviation from the rated value should not exceed +/− 1% [37,38].
  • Voltage value. The voltage deviation from the rated value should not exceed +/− 10% [37,38].
  • The power factor (tg φ) should range from 0 to 0.4 and be inductive, calculated from the following relationship:
    t g φ = Q P
    where Q-reactive power is represented by [var], and P-active power is [W].
  • Voltage asymmetry. The inequality of voltage values between successive phase voltages is described by the voltage asymmetry factor (it should not exceed 2%) [39]:
    k U 2 = U _ 2 U _ 1 × 100 %
    where U1 is the composite value of the symmetrical components of the compatible voltage order [V], and U2 is the composite value of the symmetrical components of the opposite voltage order [V].
  • Voltage distortion of voltage and current waveforms, defined by the total harmonic distortion factor (THDU in low-voltage networks should not exceed 8%), is described as the percentage ratio of the rms value of the higher voltage harmonics to the rms value of the fundamental harmonic [40]:
    T H D U = h = 2 50 U h 2 U 1 × 100 %
    where Uh is the rms voltage for the h-th harmonic [V], U1 is the rms voltage for the first harmonic [V], and h is the harmonic order.
  • The distortion of the current waveform is defined by the total harmonic distortion factor (THDI in low-voltage networks is not normalized), which defines the percentage ratio of the rms value of the higher harmonics of the current to the rms value of the fundamental harmonic [40]:
    T H D I = h = 2 50 I h 2 I 1 × 100 %
    where Ih is the rms value of current for the h-th harmonic [A], I1 is the rms value of the current for the first harmonic [A], and h is the harmonic order.

3. Results and Discussion

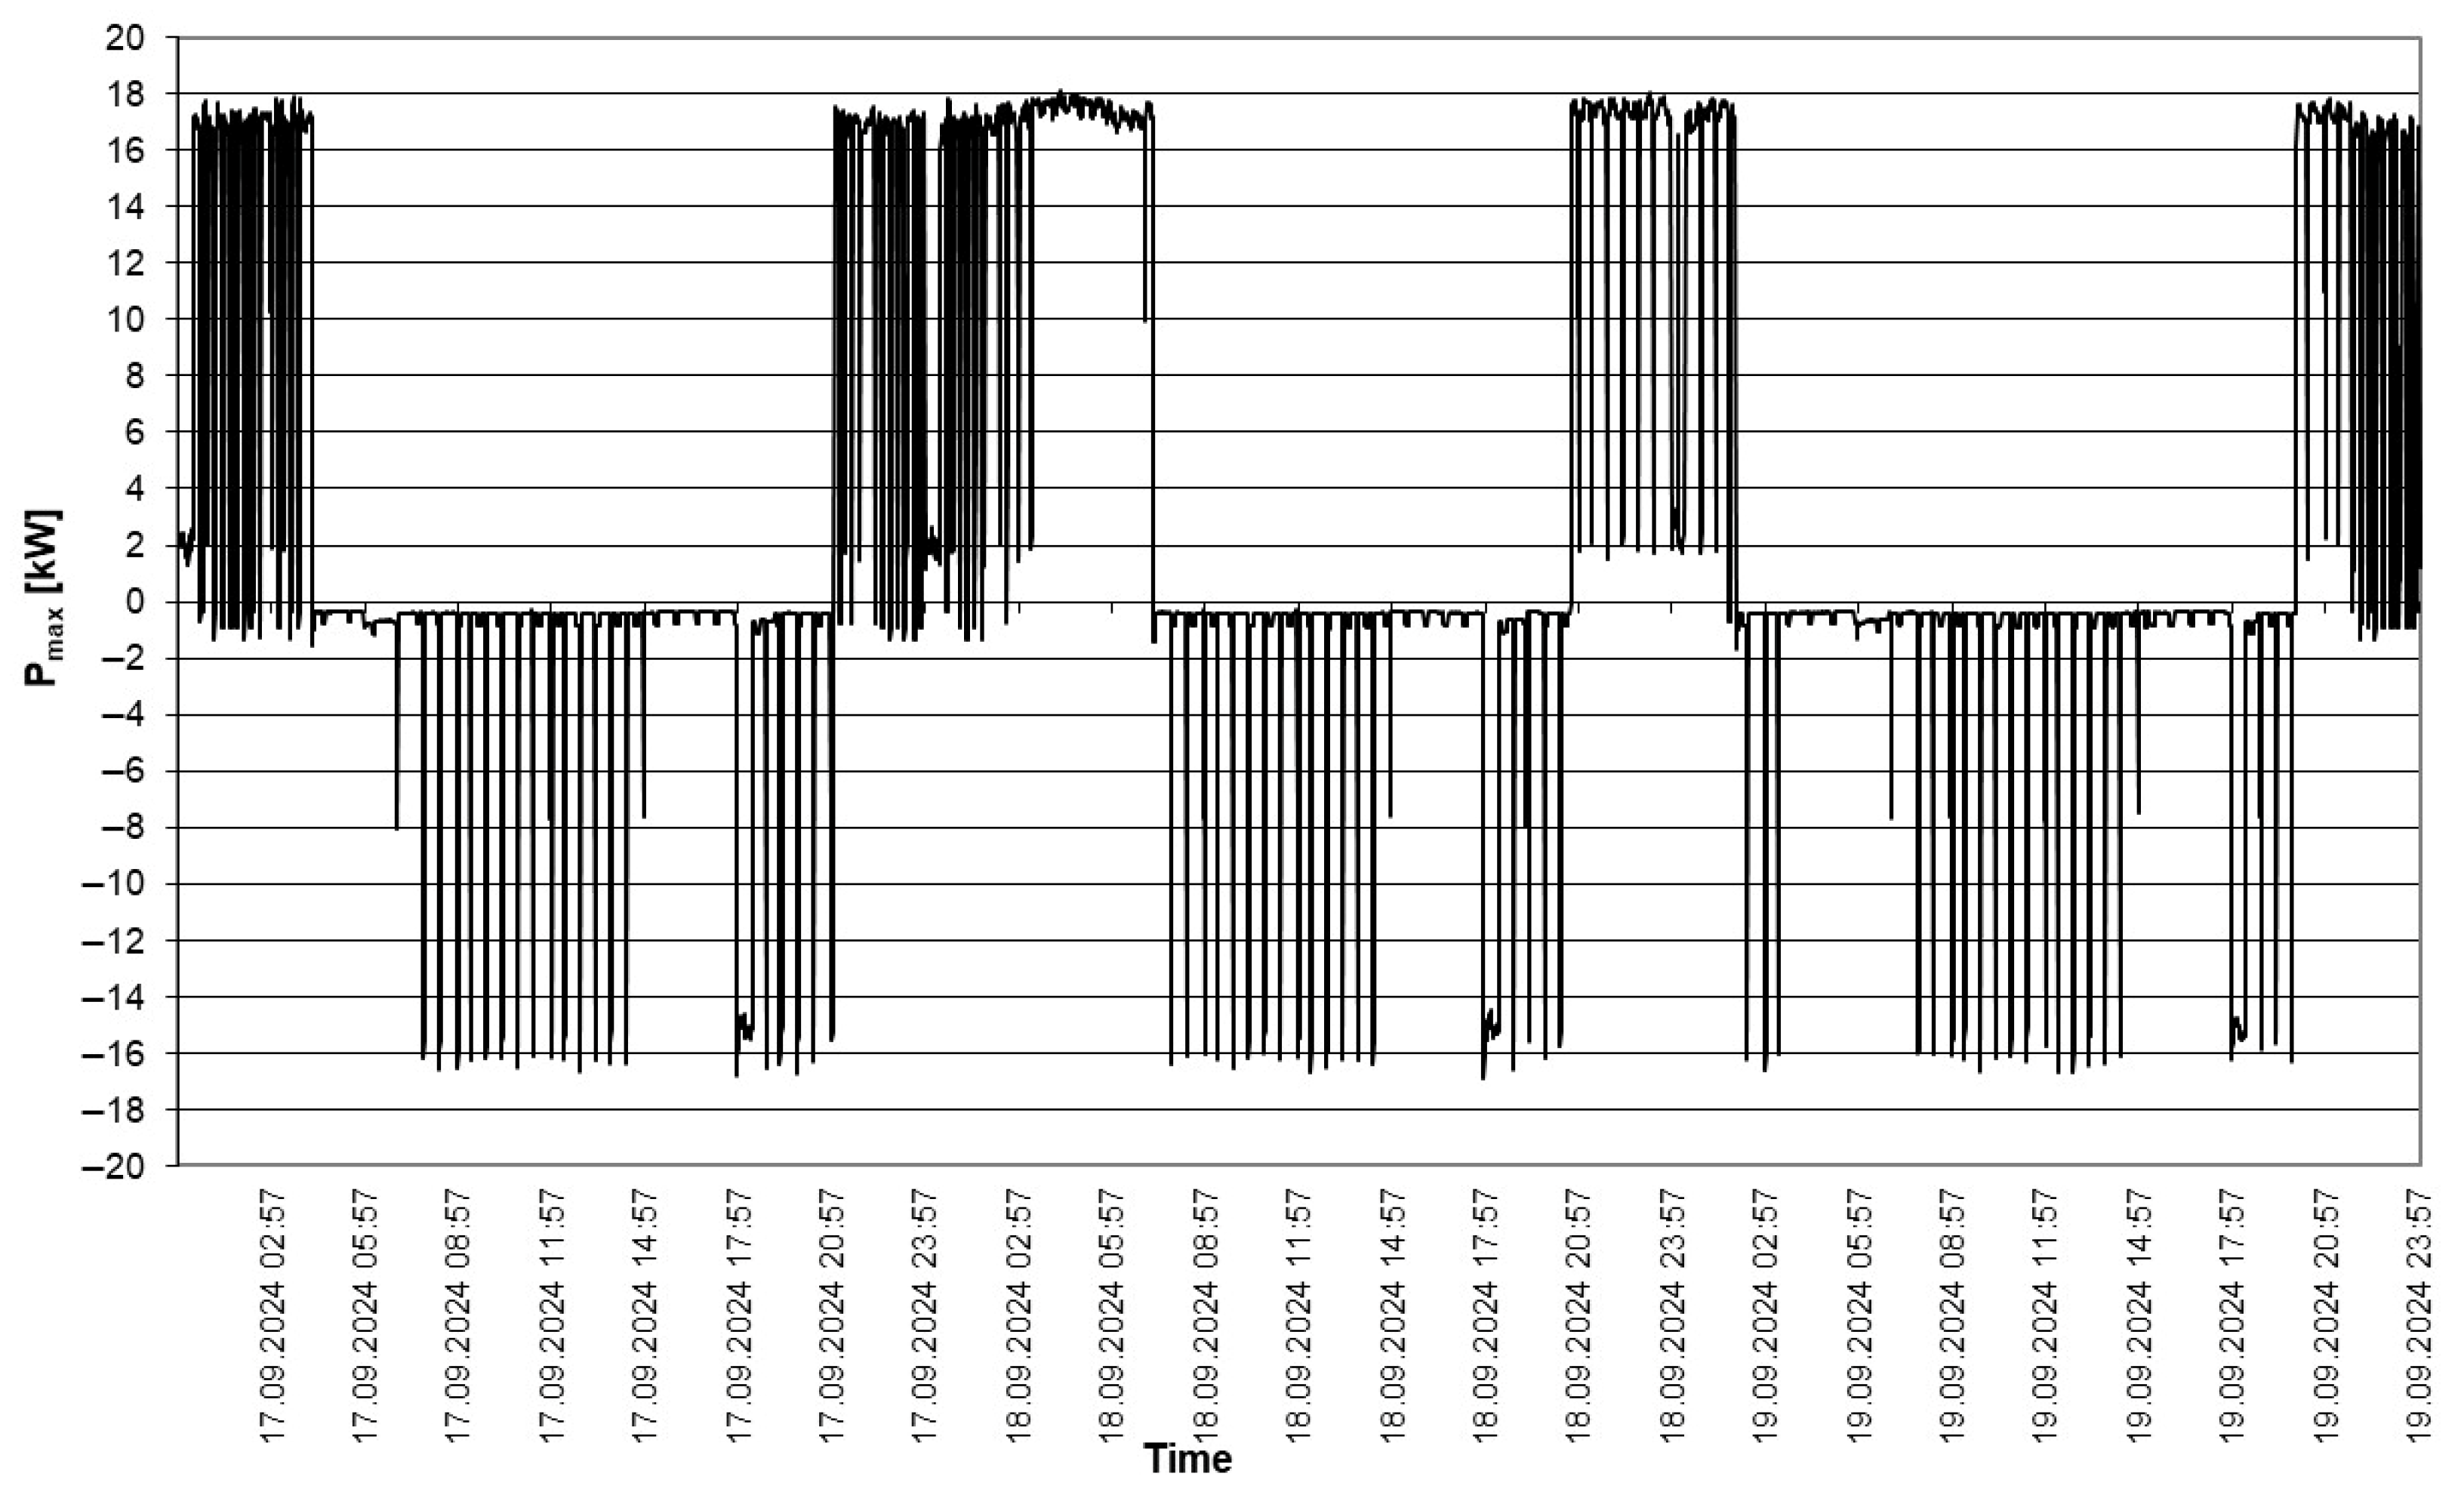
As a result of the tests conducted from 8 September 2024 to 19 September 2024, at the two agricultural micro-gas plants, the levels of active power (P) output from the biogas plant were recorded, among other parameters. Figure 2 (one-minute average values) and Figure 3 (maximum values in one-minute intervals) display the recorded time waveforms for biogas plant no. 1. Similarly, Figure 4 and Figure 5 display the waveforms of power exported to the grid from biogas plant no. 2. The results of the statistical analysis are presented in Table 3 (for the first biogas plant) and Table 4 (for the second biogas plant).
By analyzing the waveforms in Figure 2 and Figure 3, it can be seen that the agricultural biogas plant never reached its rated output. This was due to the operation of the biogas plant’s demand equipment. It should be noted here that switching on both mixers of the digestion mass resulted in a drop of approximately 16 kW in the power fed into the grid. A much rarer time was recorded when only one of the mixers was running, in which case a reduction in power of around 8 kW was noticeable. An analysis of the values shown in Table 2 showed that the power distribution was close to normal (kurtosis was close to 0), with a slight tendency towards pointedness. The negative skewness indicated a leftward shift of the distribution. The dispersion of the data was moderate, with a standard deviation of 4.76 kW and a range of 19.47 kW. The distribution showed a concentration of data in the higher values and a long tail on the lower values side. The standard error was only 0.0724, which translated into a narrow confidence interval (±0.14). The mean was therefore estimated with great accuracy.
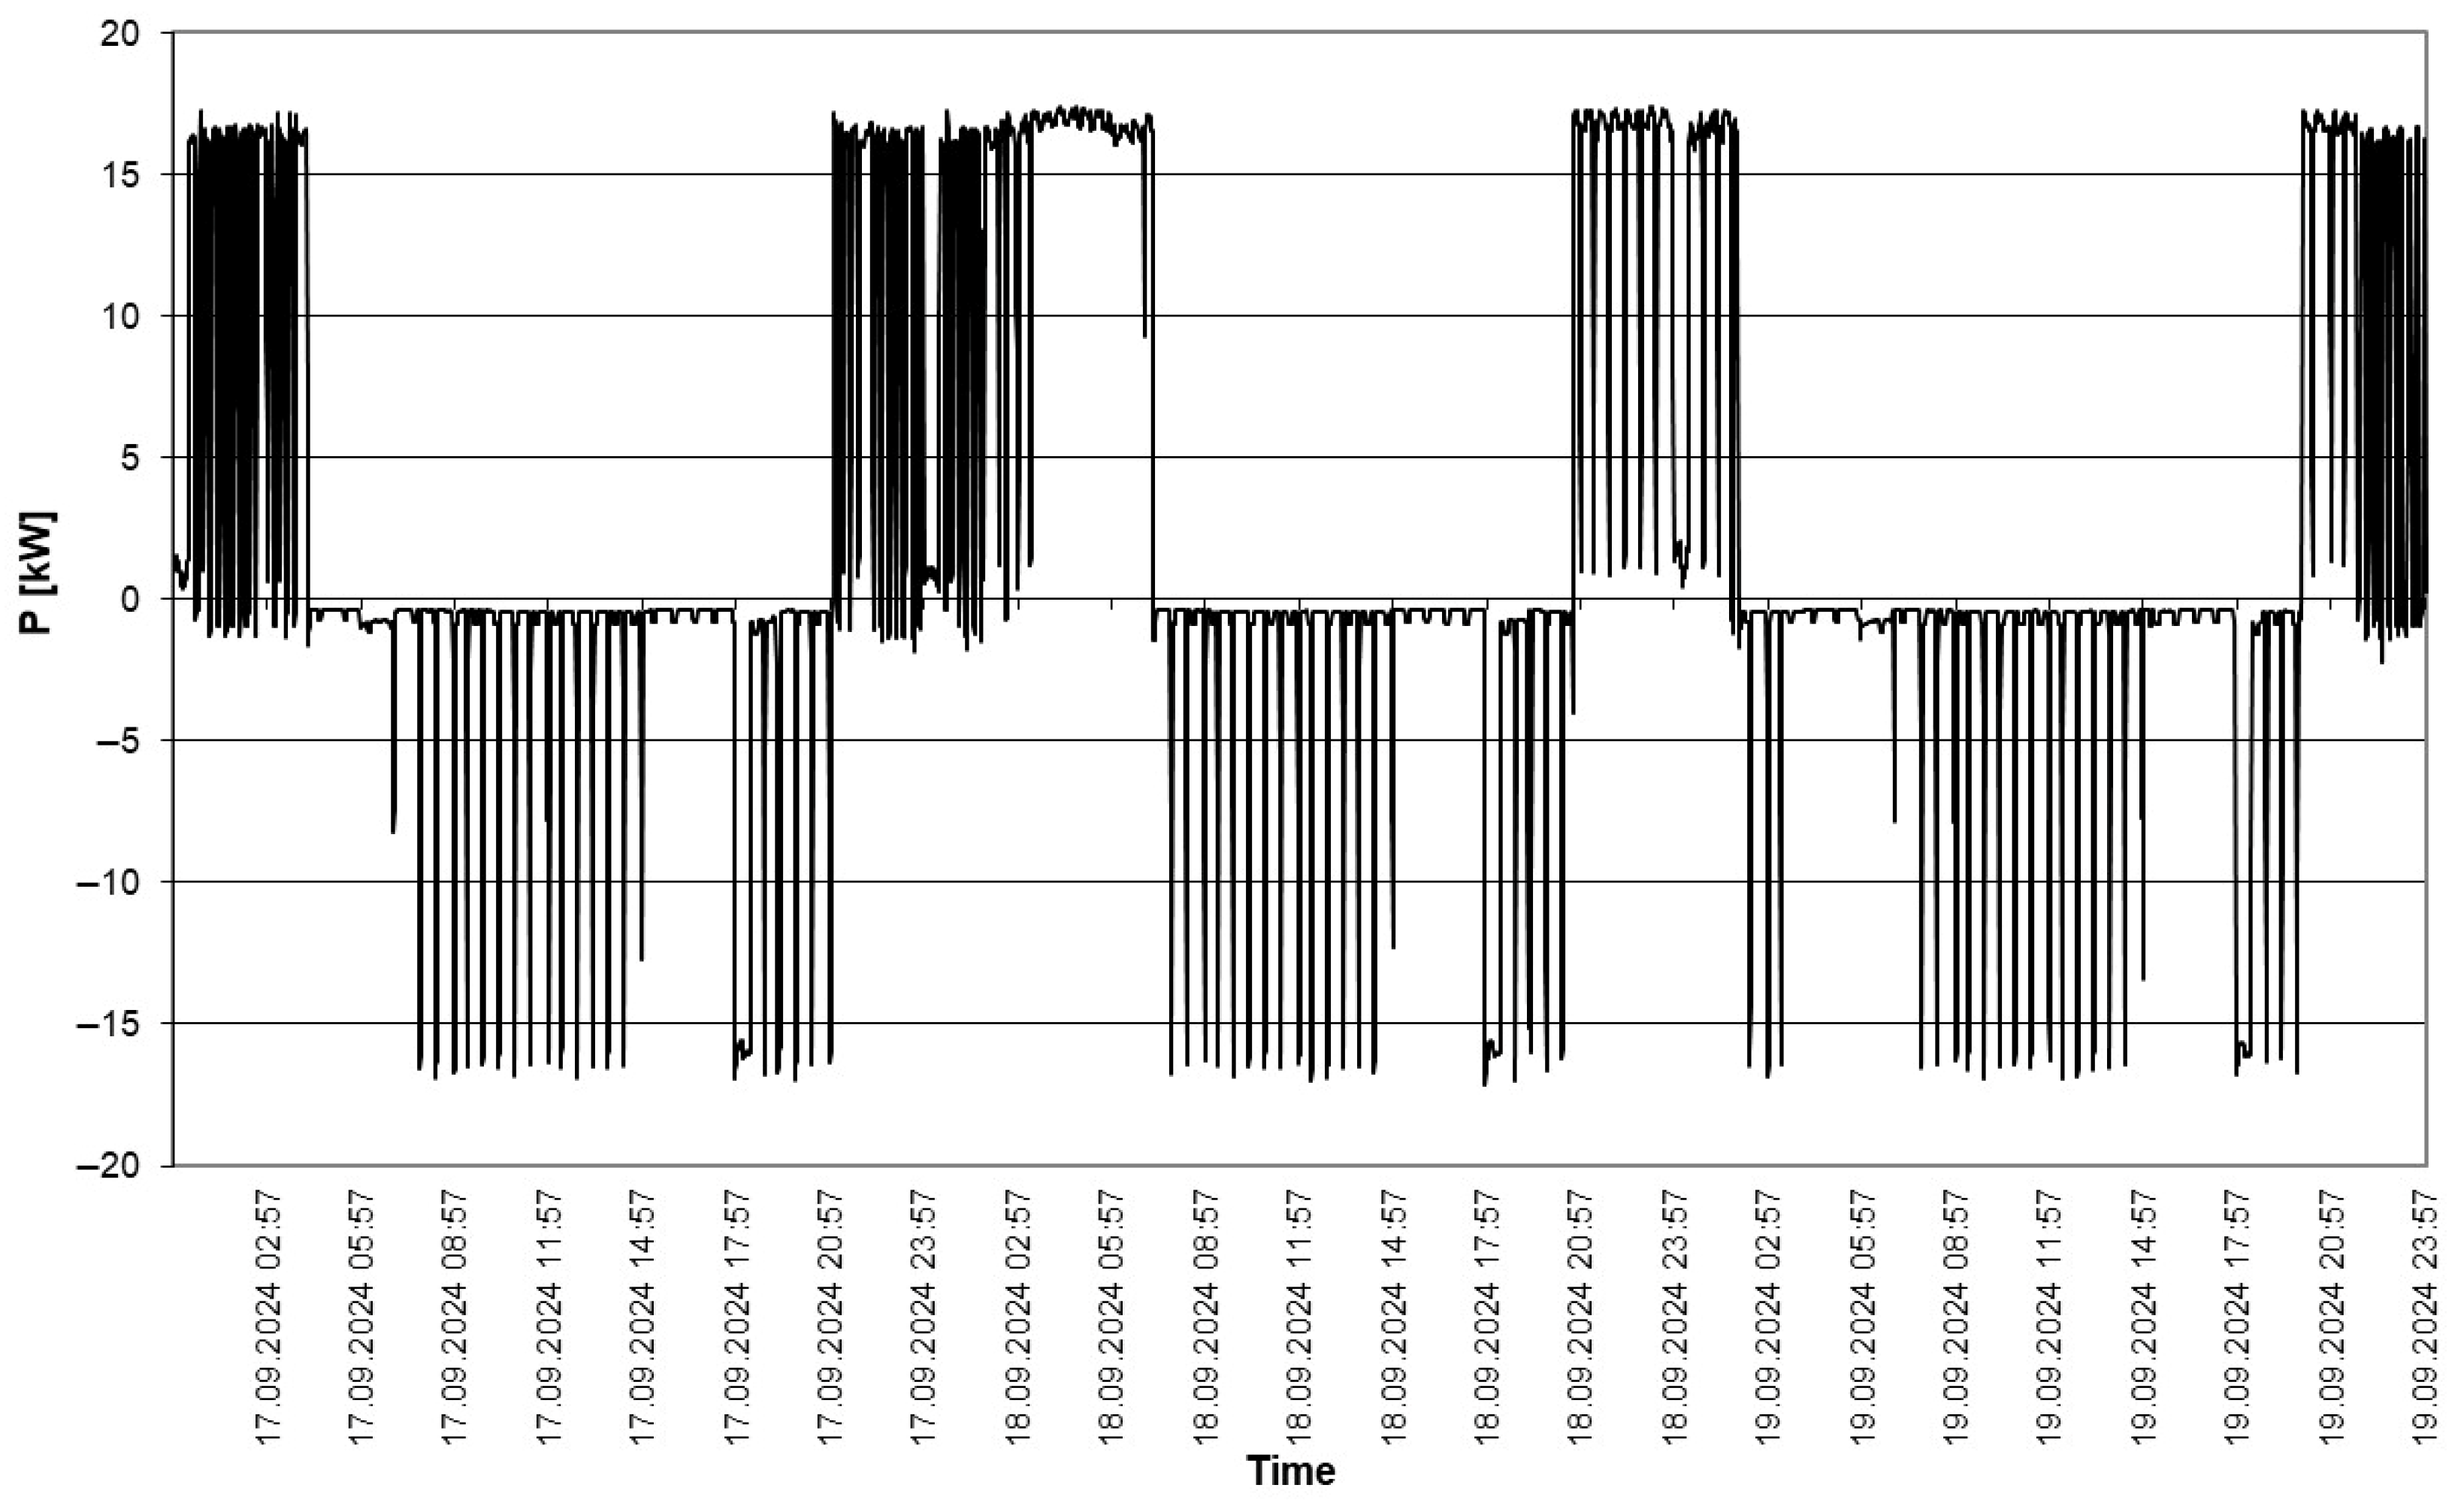
The power profiles observed at the second biogas plant (Figure 4 and Figure 5) differed significantly from those of the first biogas plant. In the second source, only one of the turbogenerators was running, and there were extended times without generation. As in the first biogas plant, switching on both mixers resulted in a drop of approximately 16 kW of power fed into the grid. Occasionally, there were also times when only one of the mixers was running. During periods without generation, the operation of the mixers caused the power demand to be covered by the electricity grid, which significantly increased the cost of electricity consumption for the biogas plant.
The statistical values describing the power generated at the second biodigester were quite different. The mean power value was 2.53 kW, while the median was −0.41 kW, and the mode was as high as 16.65 kW. Such a large scatter of these measures indicated an asymmetric and non-regular distribution. The standard deviation was very high, at 8.72 kW, and the range reached as high as 34.51 kW, indicating significant variability in the data. The skewness (0.33) suggested a slight right-handed asymmetry but with a longer tail on the side of higher values. The kurtosis (−0.088) was very close to zero, indicating that the distribution was nearly normal, albeit with a slightly flatter top.
The daily running time of the mixers at the two biogas plants differed, as shown in the graphs in Figure 6. The mixers ran 16 min longer per day at the second biogas plant than at the first biogas plant. This extended operation time could reduce biogas output due to lower fermentation efficiency in the digestion process—the lower amount of biogas resulted in the inoperability of both turbogenerators. The average running time of both mixers was approximately 2 h per day, resulting in a reduction of about 1 MWh of energy fed into the grid.
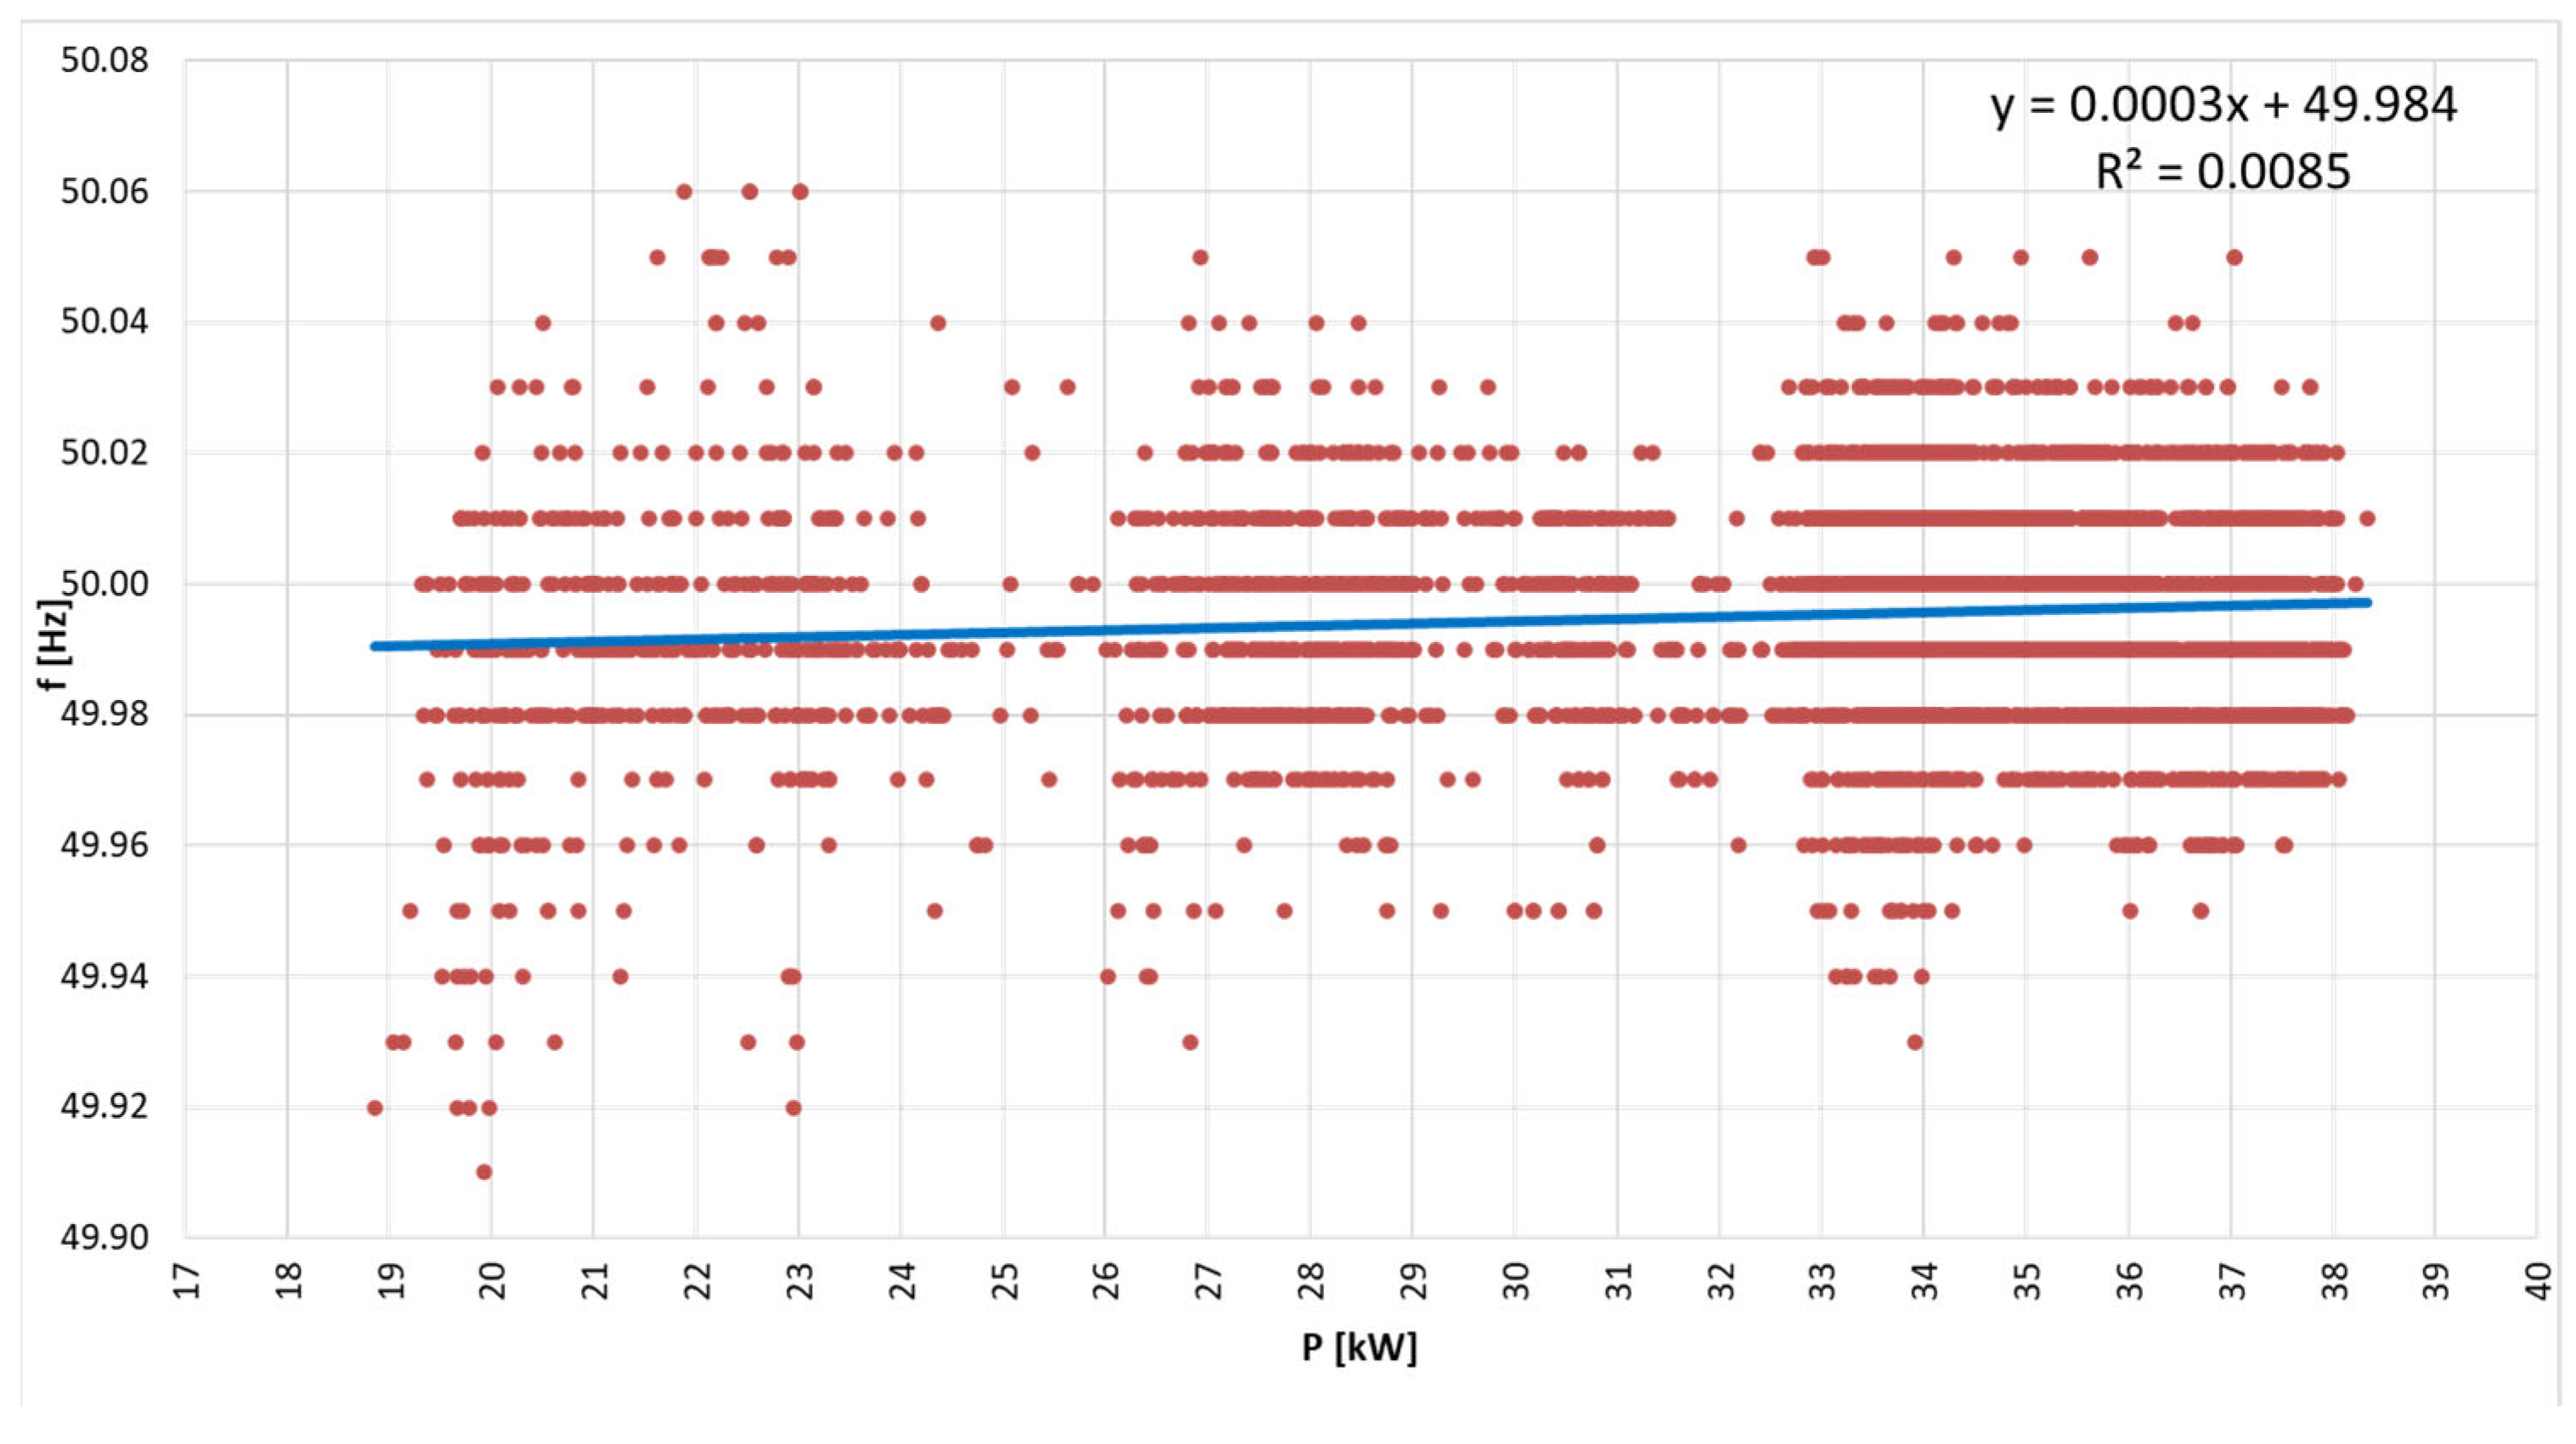
The operation of the agricultural biogas plant, with both generators at their rated outputs, did not affect the frequency of the mains voltage (Figure 7). Although the lowest frequency values were recorded during the operation of both digester mixers, the reason for this could not be identified due to the small number of such measurement points. This was also evidenced by the coefficient of determination value, which was close to 0.
The coefficient of determination between frequency and active power, recorded at the second biogas plant (Figure 8), took an even smaller value. In this case, it was difficult to identify the state of the biogas plant where the lowest frequency values were concentrated. This confirmed the theoretical assumption that a 40 kW agricultural biogas plant has too little power, relative to the short-circuit power at the source connection point, to influence the change in the frequency value of the voltage on the electricity grid.
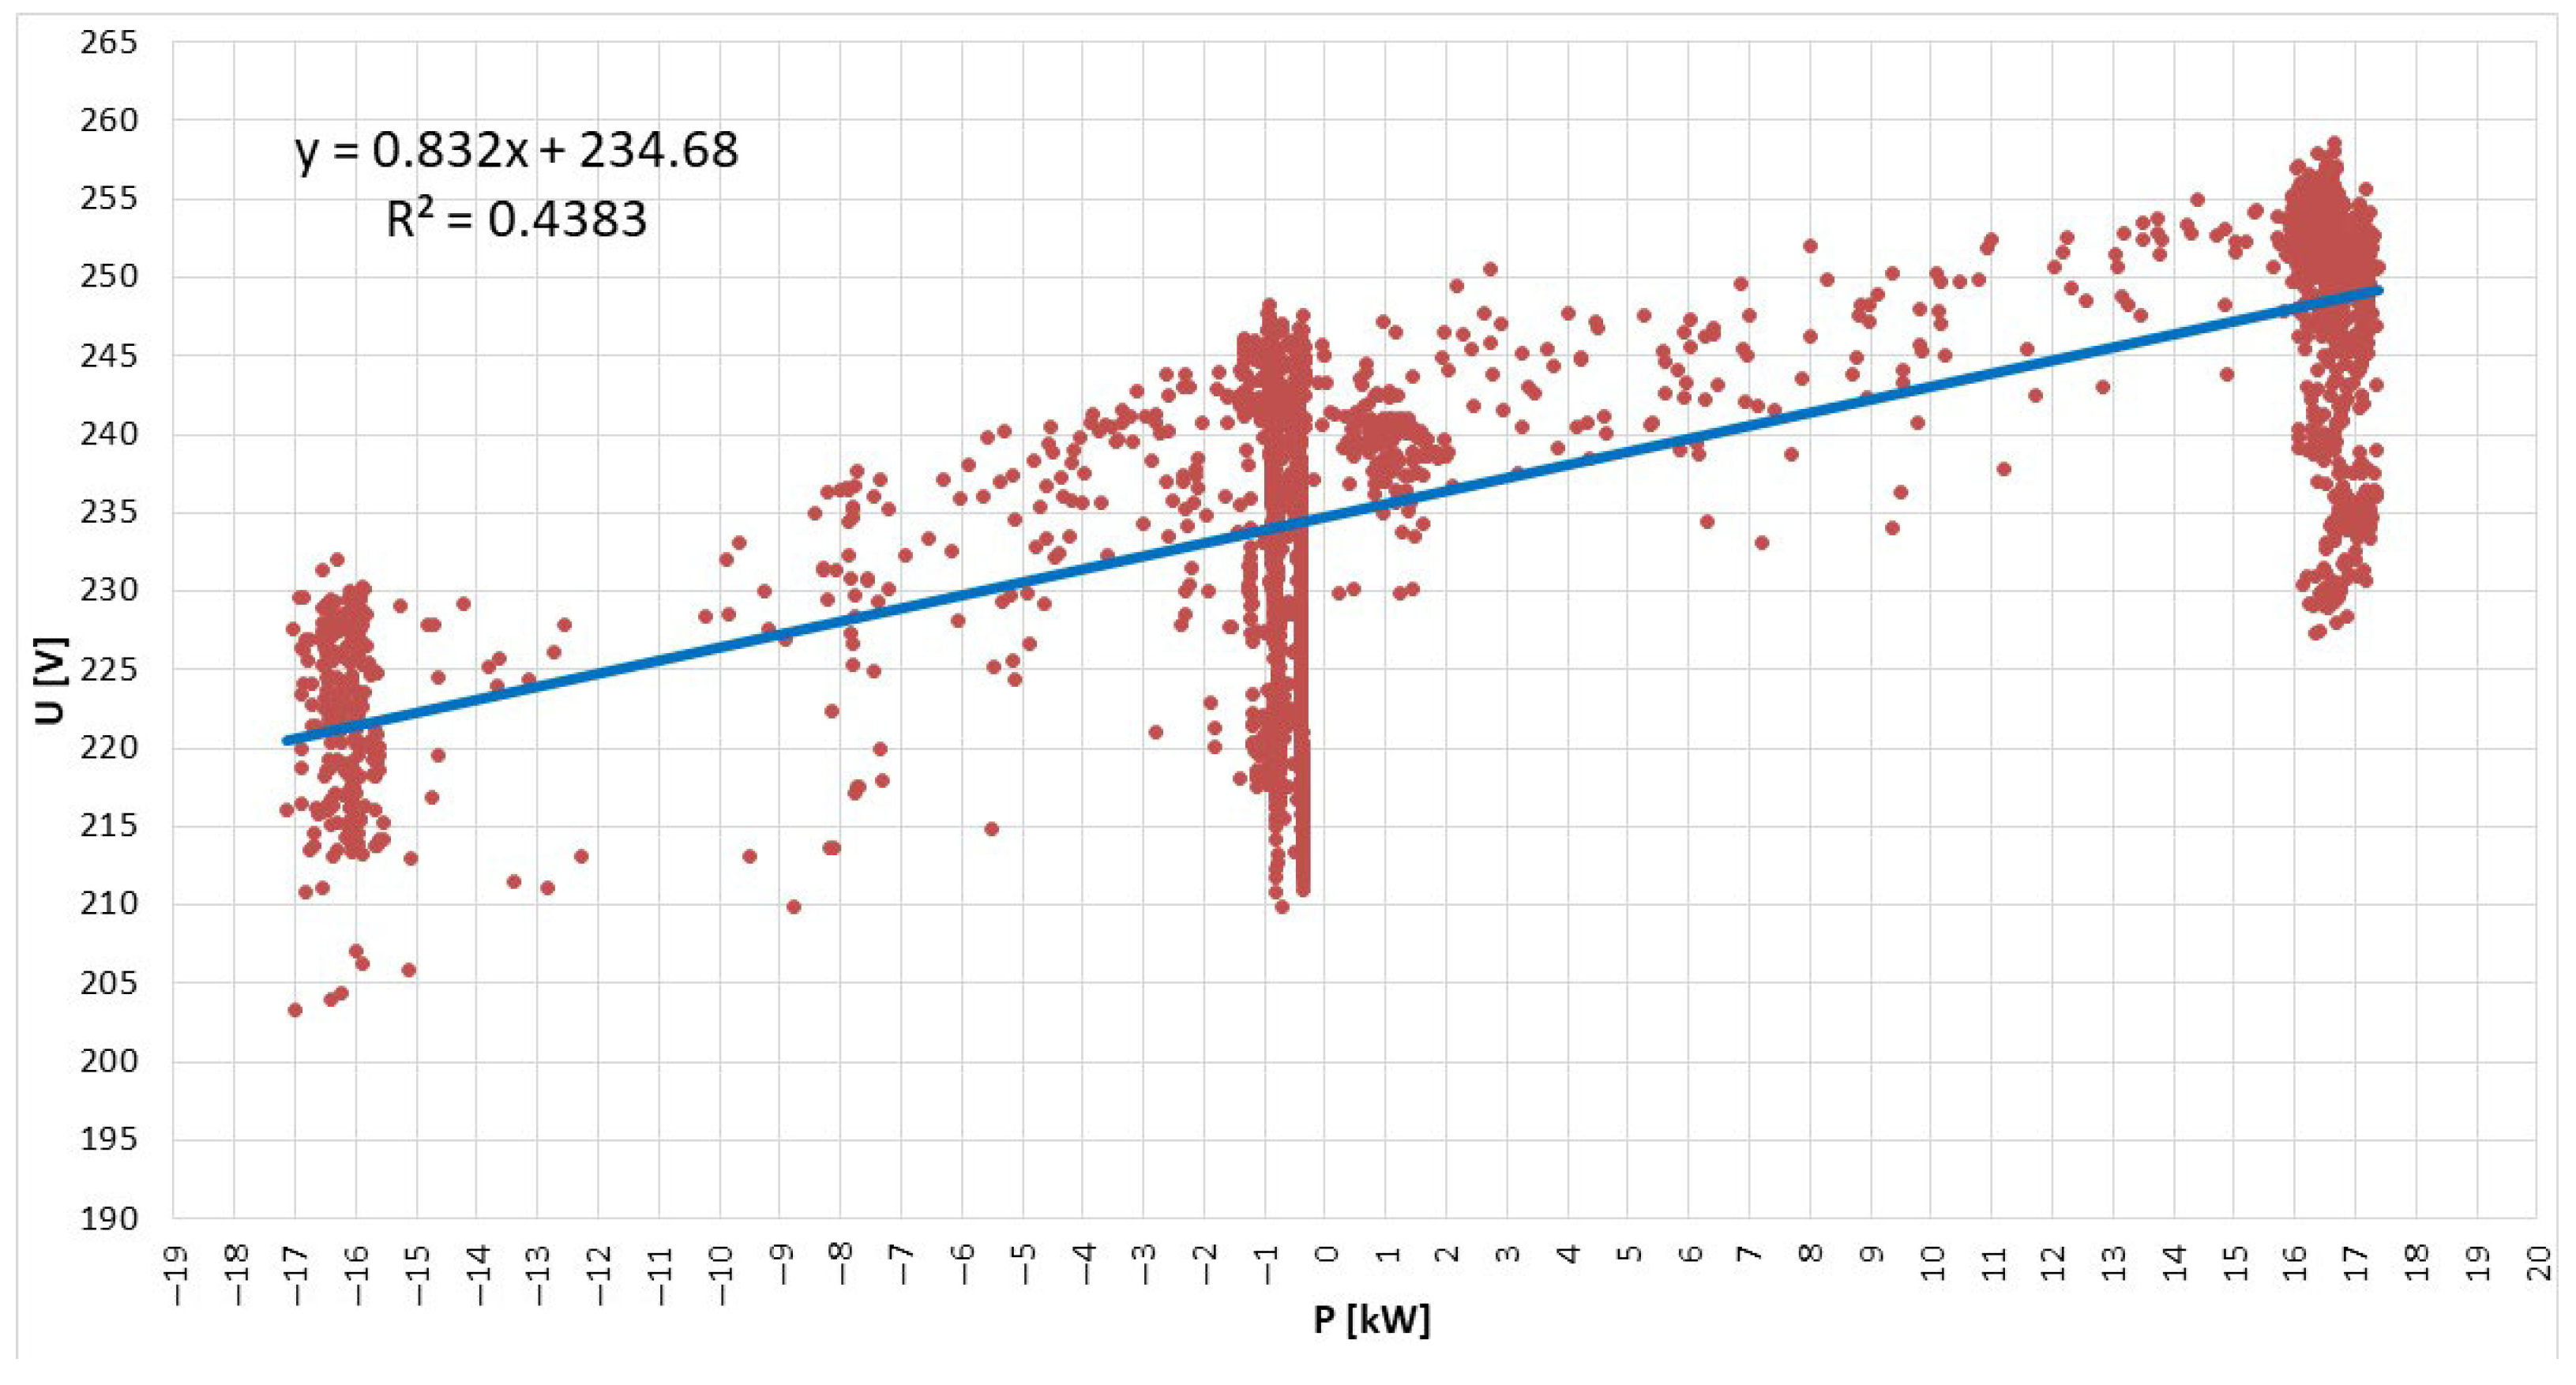
The correlation between power injected into the grid and grid voltage was quite different. According to theory [41], the voltage increased as the power generated at the biogas plant increased (Figure 9 and Figure 10). This correlation was stronger when the short-circuit power was lower at the source connection point. In the case of the second biogas plant, located significantly farther from the substation, the system impedance was several times higher, which amplified the influence of power generation on the voltage at the biogas plant, as confirmed by the studies presented in [42]. It should be noted that when the biogas plant was operated at maximum power, the grid voltage was close to the upper value allowed by the applicable regulations [37,38]. Switching on the digester mixer reduced generation by almost half, resulting in a voltage below the permissible value. Switching off the agitator drive caused the voltage value to rise again, and this cycle was repeated many times a day. This phenomenon is undesirable, both from the perspective of power quality of generated electricity (e.g., noticeable flickering of light) and the durability of consumer devices. (Cyclic, jumping voltage fluctuations may lead to the malfunction of devices sensitive to the value of voltage (mainly electronic), leading, in extreme cases, to their shutdown or even damage.) A low R2 value indicated that the frequency and power values were mismatched, i.e., there were no significant relationships between the compared data. No dependence of frequency on the power generated in the agricultural biogas plant was observed; the variability of this parameter during measurement was random.
Switching on the digester mixers in the second biogas plant (Figure 10) caused a significant drop in the grid voltage. This occurred when the biogas plant was operational, and the generator was shut off. The operation of the mixers without generation caused a voltage drop to a value close to the lower limit. This was mainly the result of a weak power line (considerable distance between the biogas plant and the transformer station), which is in line with studies published by Cherkov et al. [43]. The strong relationship between power and voltage was confirmed by the value of the determination index R2, which was close to 0.5.
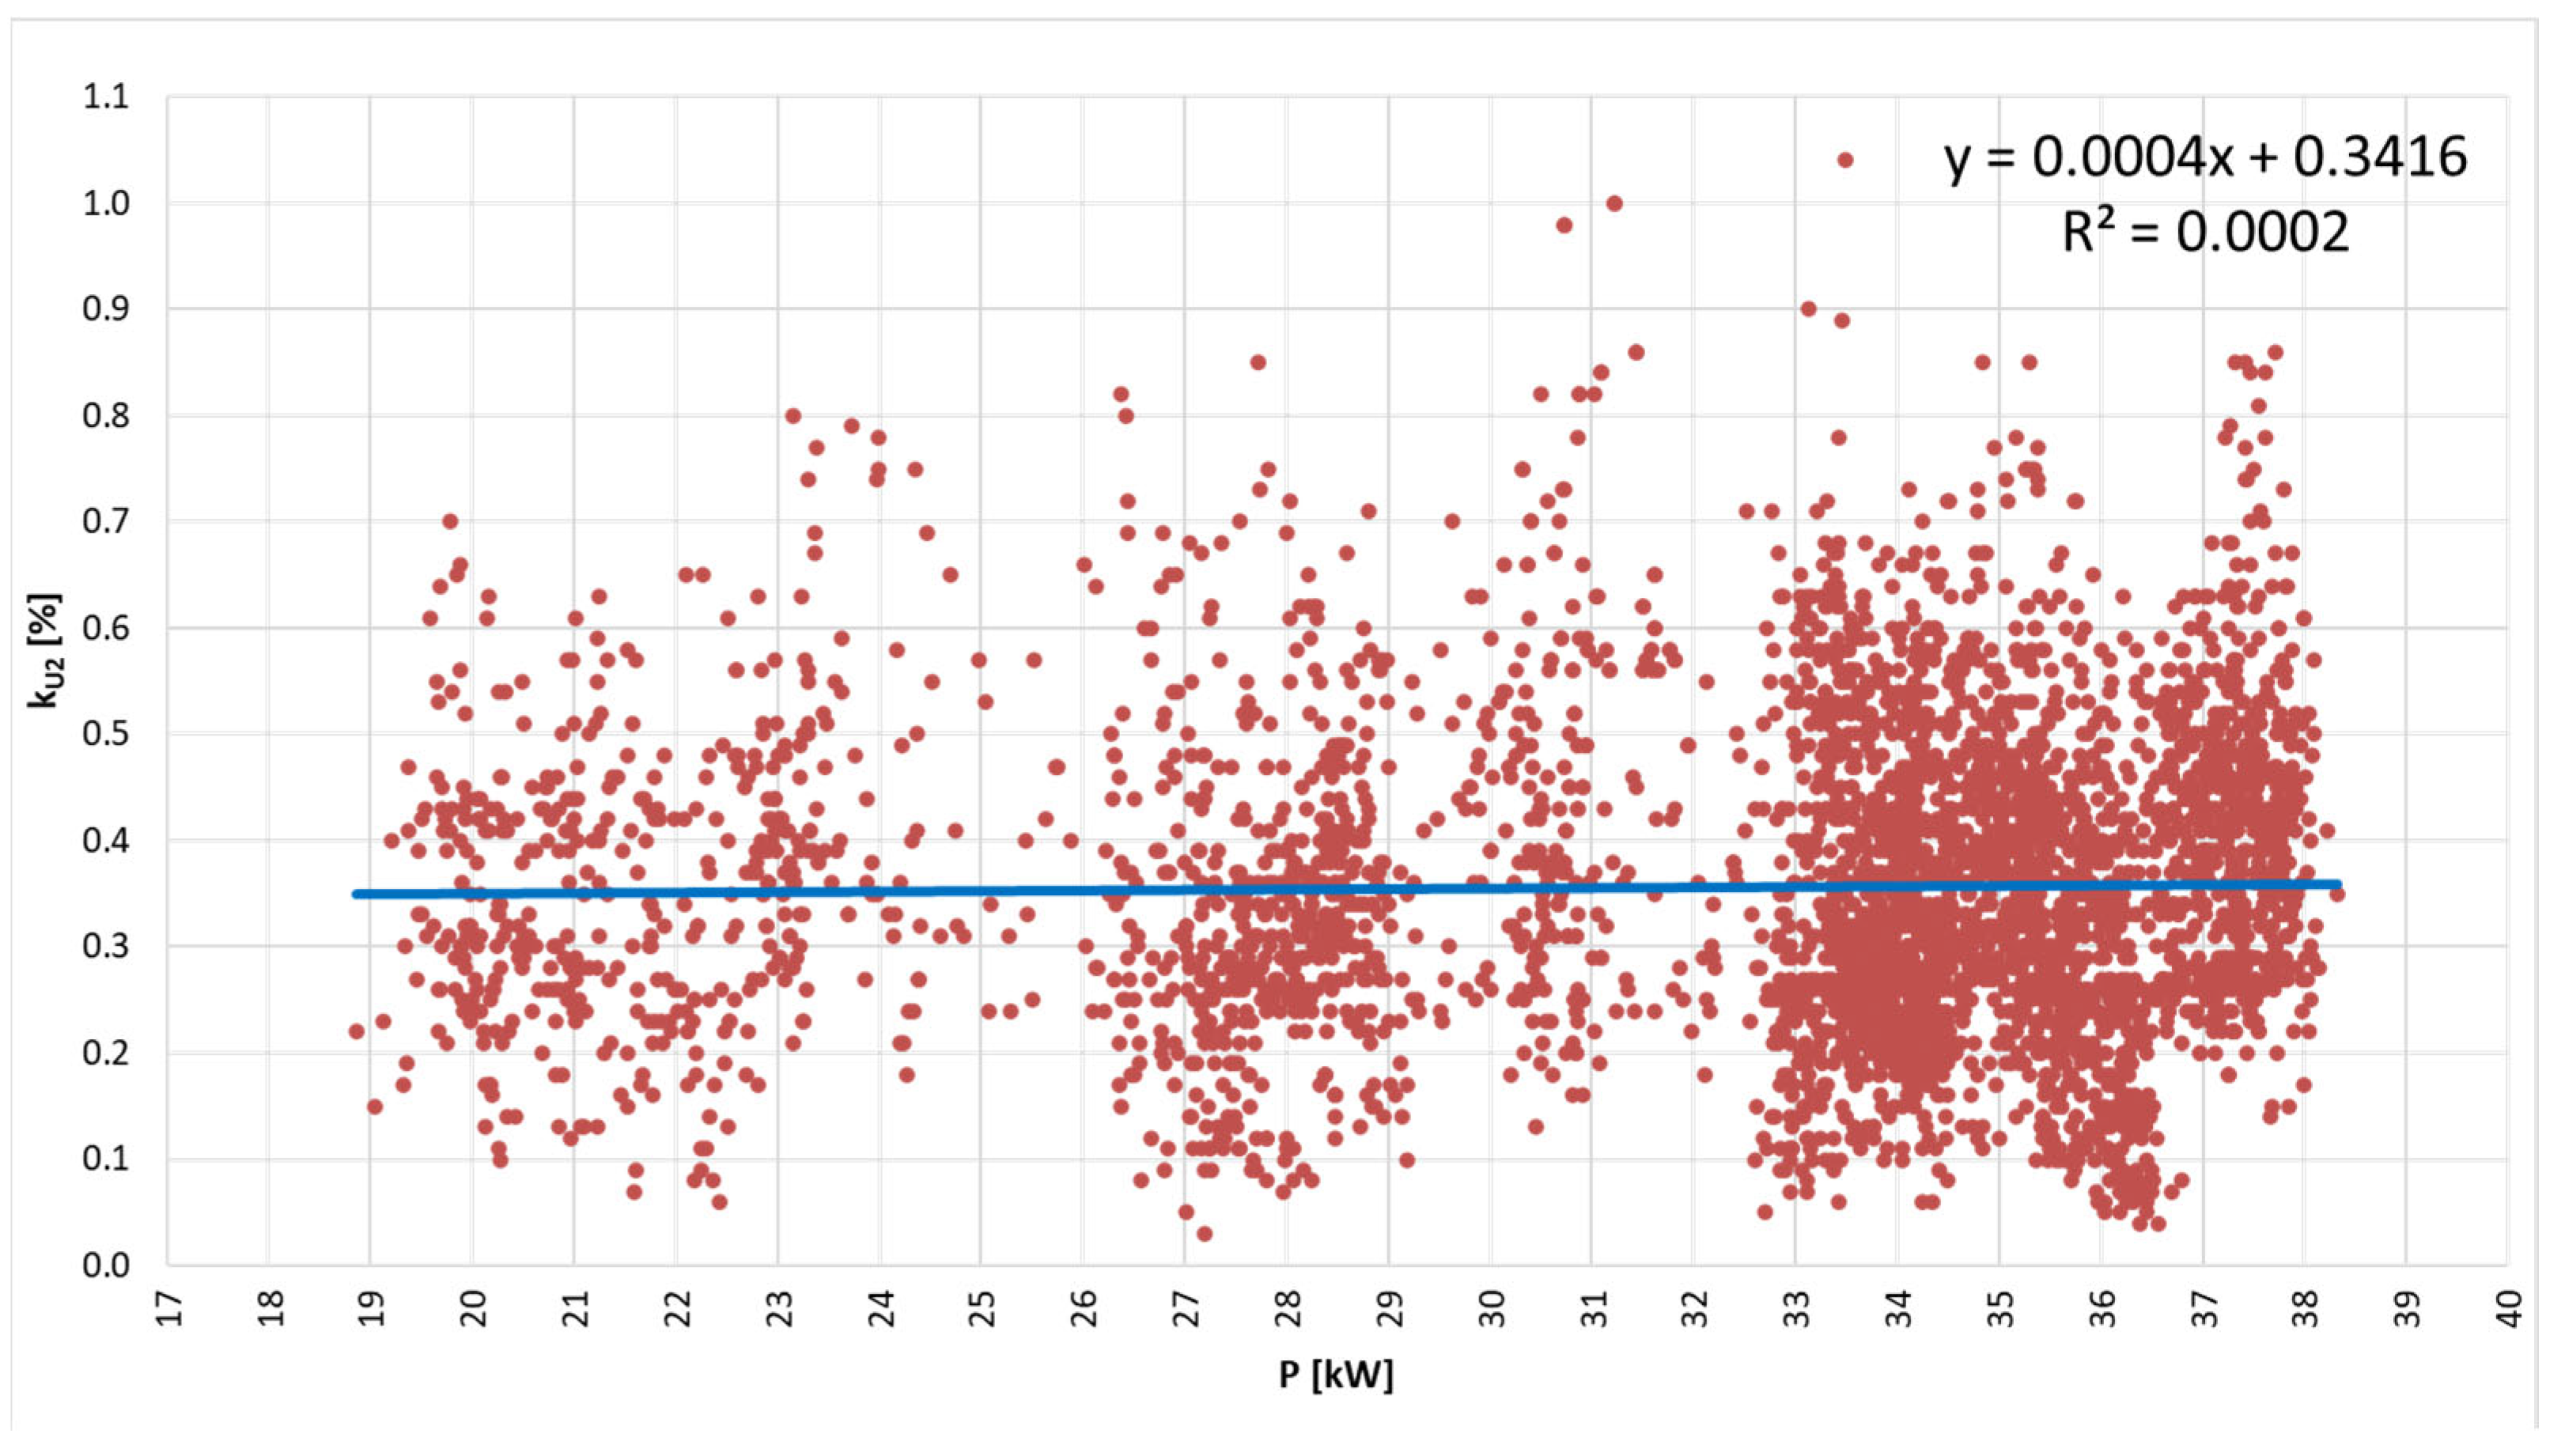
The operation of the digester mixers had a negligible effect on the reverse voltage asymmetry factor. When the mixers were switched on with the agricultural biogas plant operating at close to its rated output, no significant changes in the asymmetry factor values were observed (Figure 11). All recorded kU2 values did not exceed 1.1% and were within the range allowed by the applicable regulations [37].
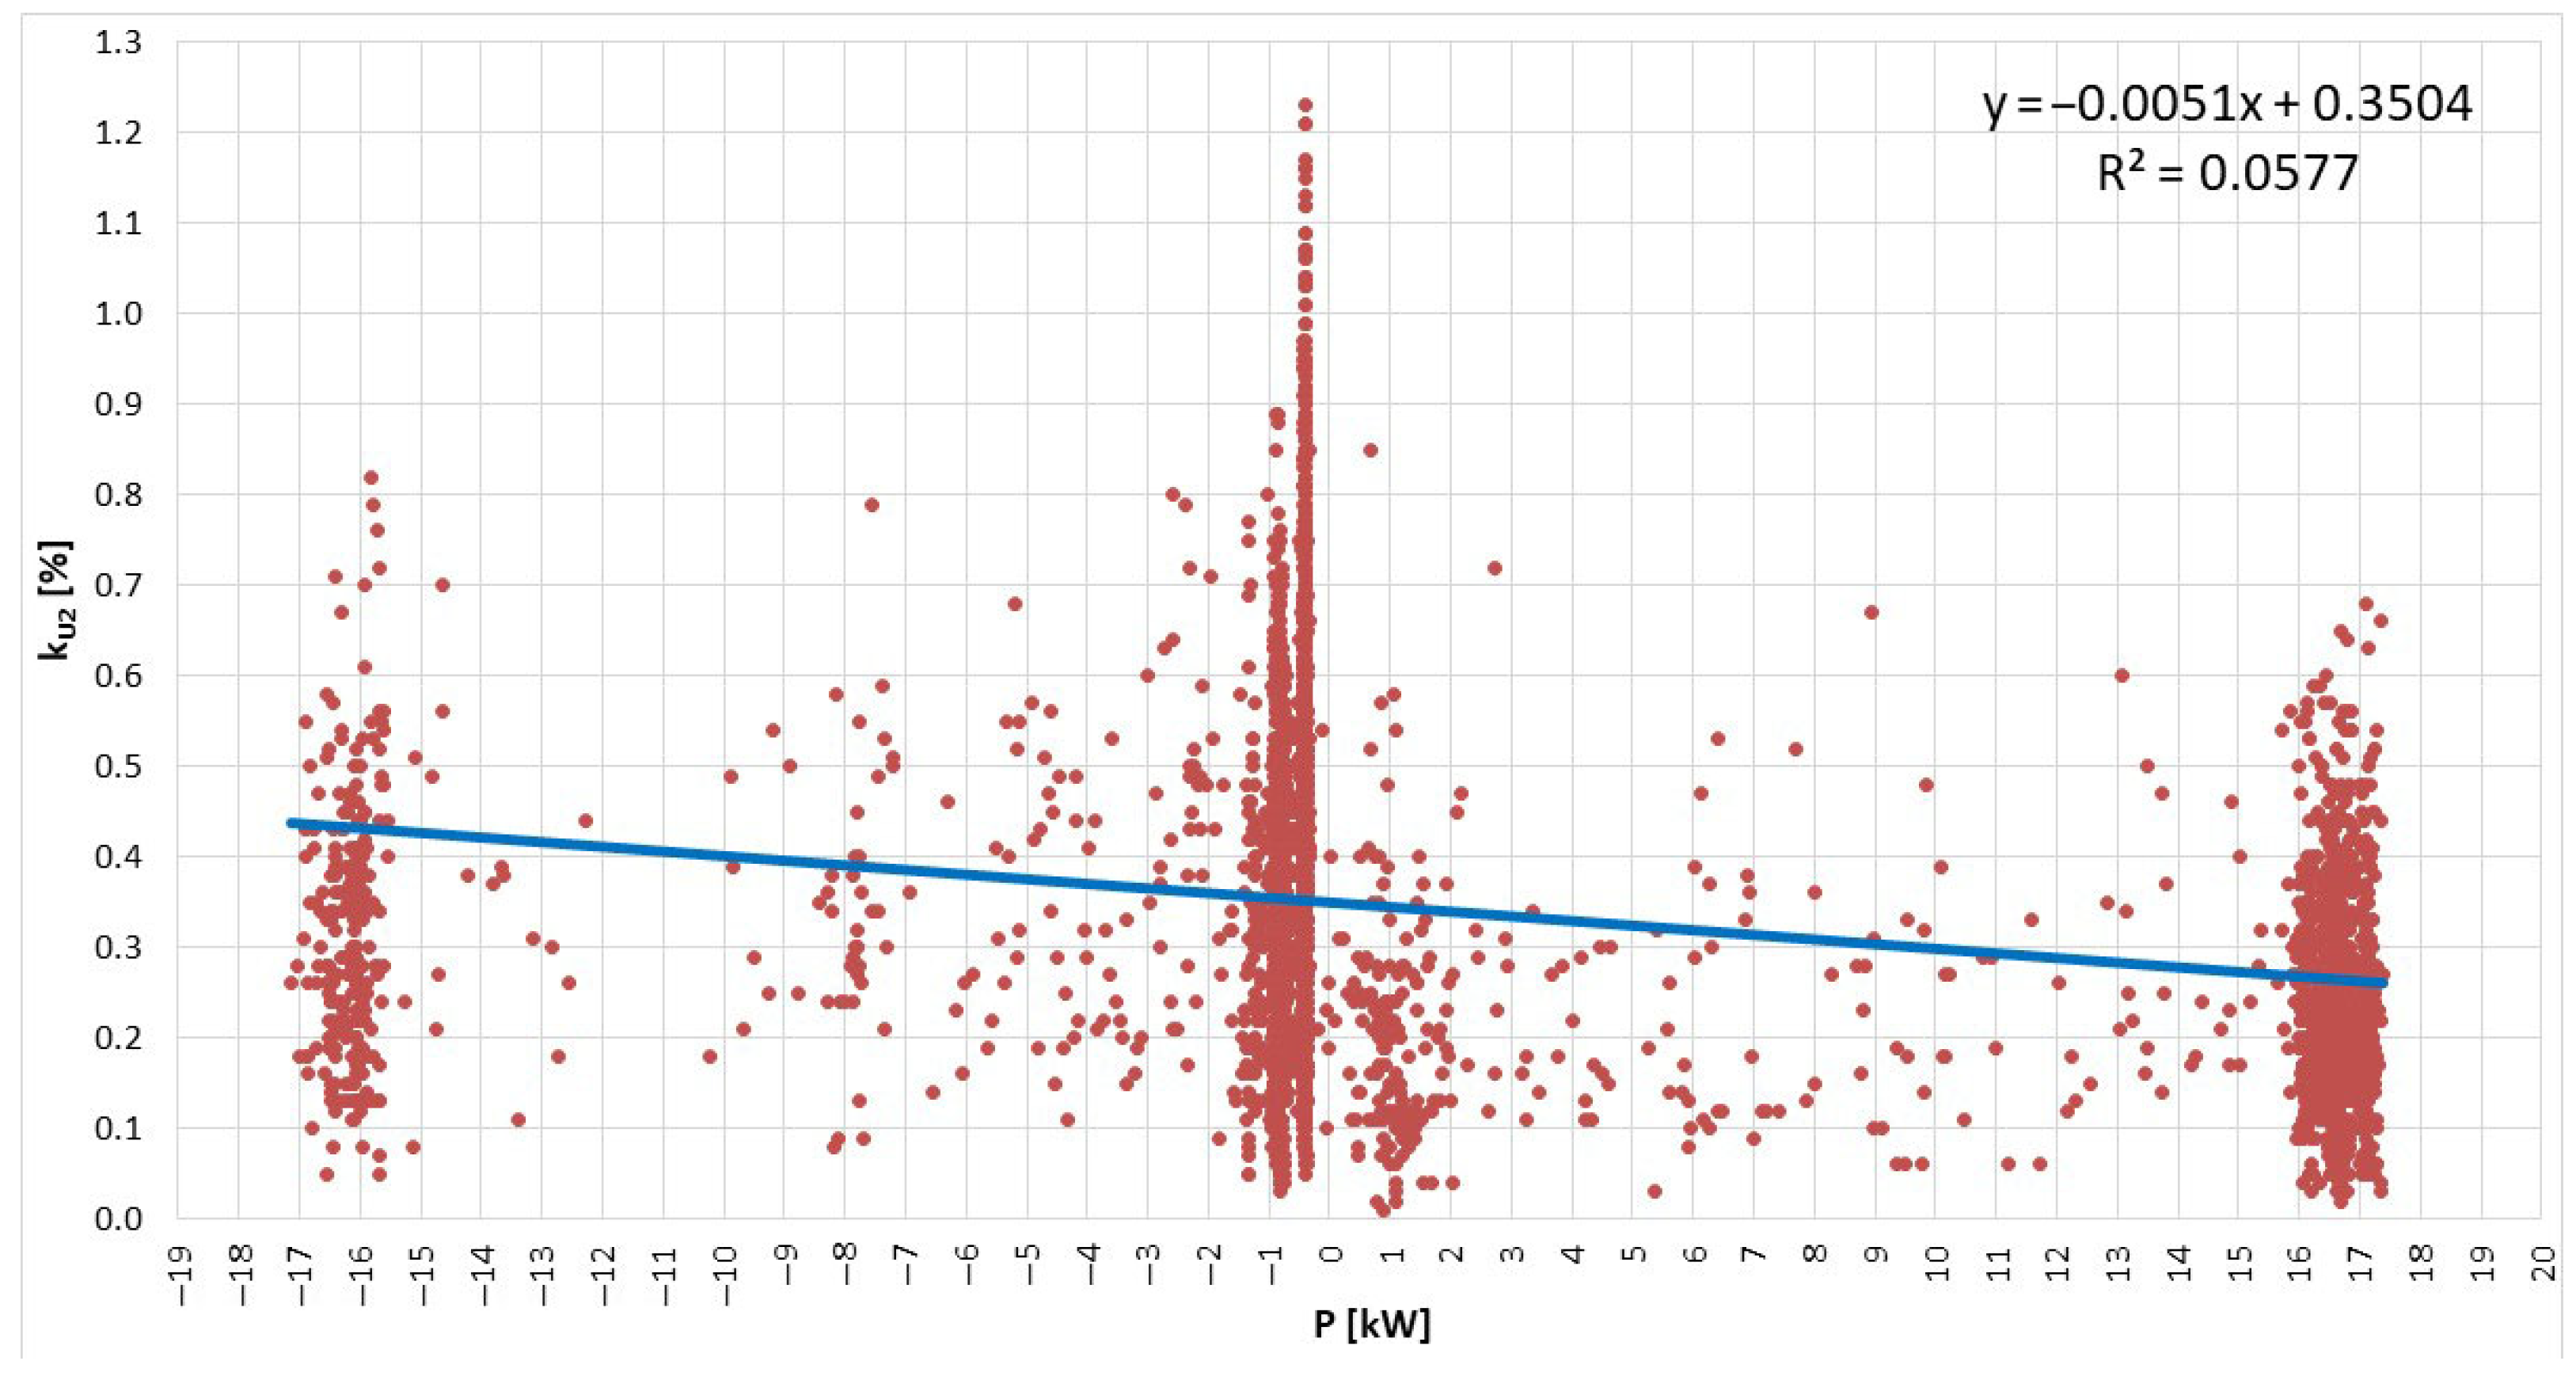
When the mixers were switched on without generation in the biogas plant or with a single generator running (Figure 12), the recorded values of the asymmetry factor of the opposite voltage did not differ significantly from the values recorded in the first biogas plant. This was mainly because the digester mixers were driven by three-phase motors, which did not introduce asymmetries in the load of the individual phases [44]. The highest values of kU2 were recorded when the generator and mixers were switched off (power taken from 0 to 1 kW). At that time, mainly single-phase equipment was operating in the biogas plant, which introduced load asymmetry in the system.
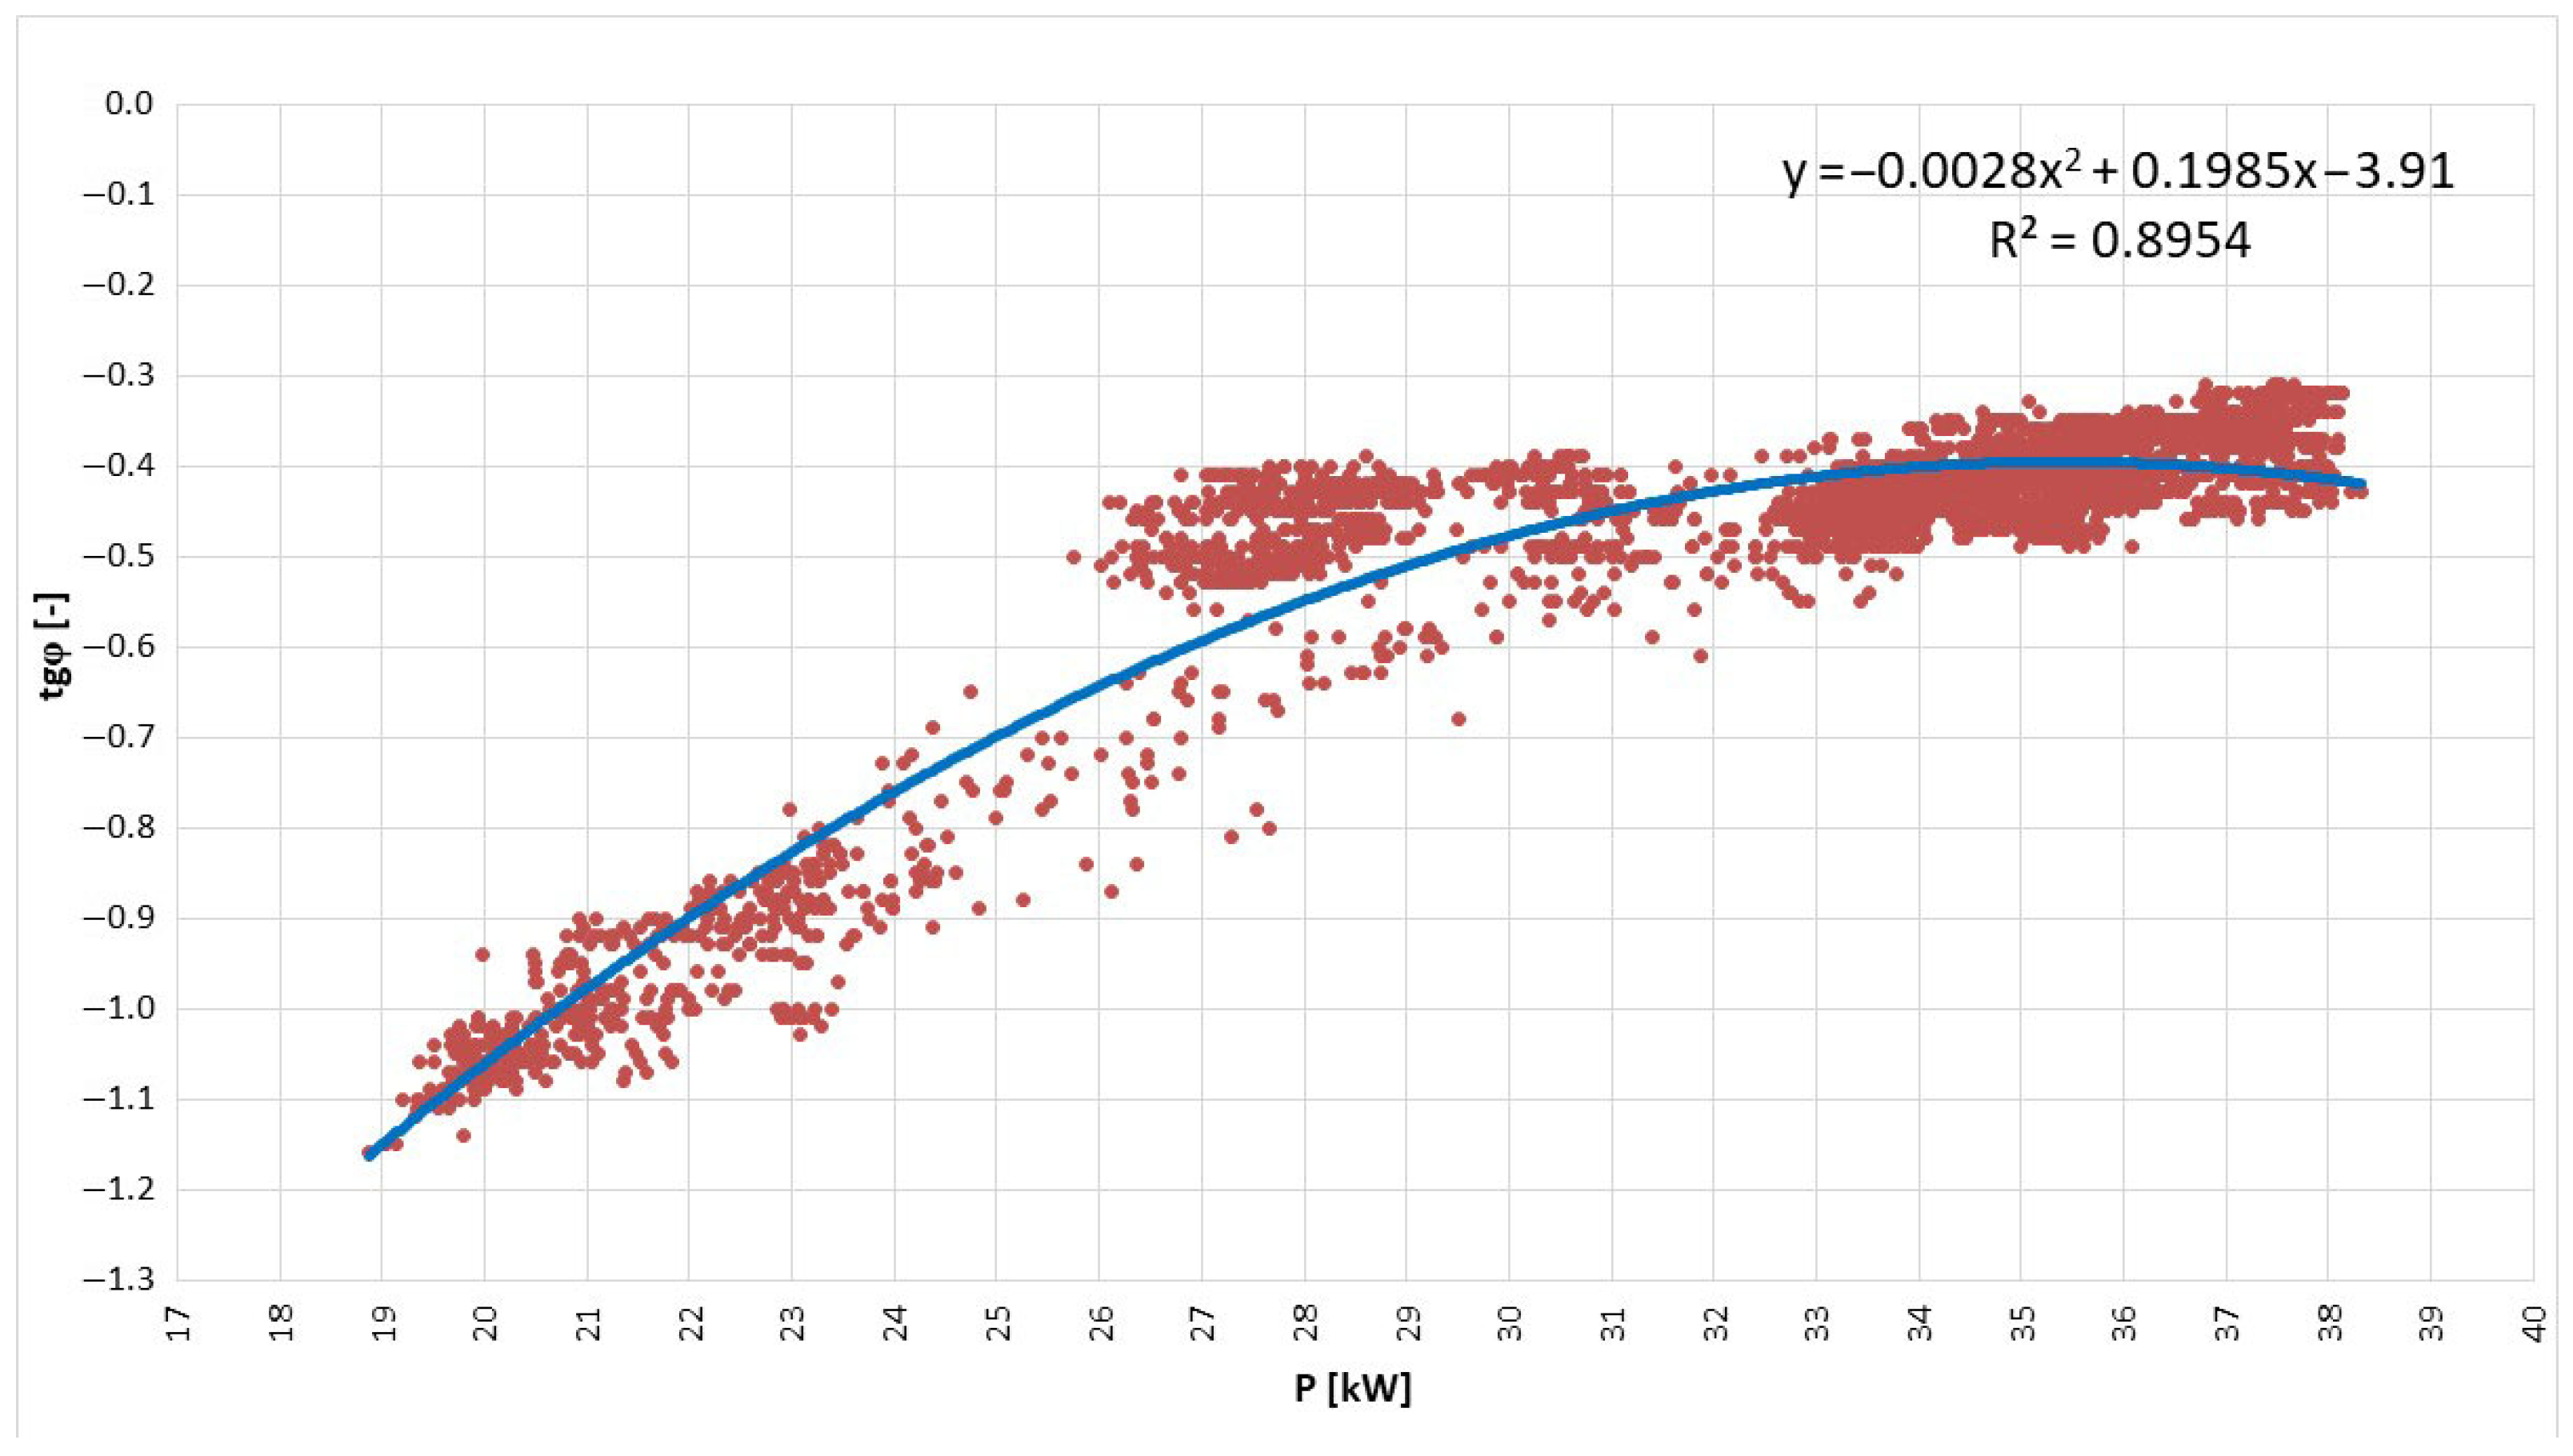
The operation of the digester mixers strongly influenced the power factor value in the grid supplying the agricultural biogas plant. When the power injected into the grid was close to the rated power of the generators, the power factor was close to the value required by the regulations (0.4), as shown in Figure 13. As the biogas plant’s load increased, tg φ increased and reached its highest value when both mixers were operated. This is in line with research conducted by Khodapanah et al. [45]. The dependence of the power factor on the power consumed for own consumption was close, as evidenced by the value of the coefficient of determination, which was close to 0.9. To avoid charges for excessive reactive power consumption, the agricultural biogas plant should be equipped with a reactive power compensation system.
A similar relationship existed in the second biogas plant (Figure 14). In the case of operating one of the generators, the power factor was close to 0 but increased significantly (up to 52) when the share of own-needs equipment increased. The highest value occurred when both digester mixers were in operation. This was because the generator operation covered the active power demand of the biogas plant’s power equipment, while the grid mainly supplied the reactive power. In the case of a complete lack of power generation in an agricultural biogas plant, the value of the power factor over the entire analyzed interval was close to 0. However, it is worth highlighting that the tg φ factor shown in Figure 14 took both positive (capacitive) and negative (inductive) values. A compensation system capable of generating both inductive and capacitive reactive power should be integrated into the biogas plant to prevent penalties for excessive reactive power usage [46]. In this case, a static SVG generator (STATCOM SVG compensator) of at least 55 kvar would be best, which, based on information about the current power consumption on each phase, would generate power of the required character (inductive or capacitive) and a maximum value equal to 1/3 of QN (where QN is the rated power of the SVG). Adjusting the SVG power to match the nature of the load (inductive or capacitive) was performed automatically and did not require any software changes. An additional advantage of such an arrangement was that the actual power of the SVG was not affected by the value of the supply voltage. To avoid additional charges for excess reactive power consumption and thereby shorten the payback time, the compensation system should be installed before or immediately after the biogas plant is commissioned.
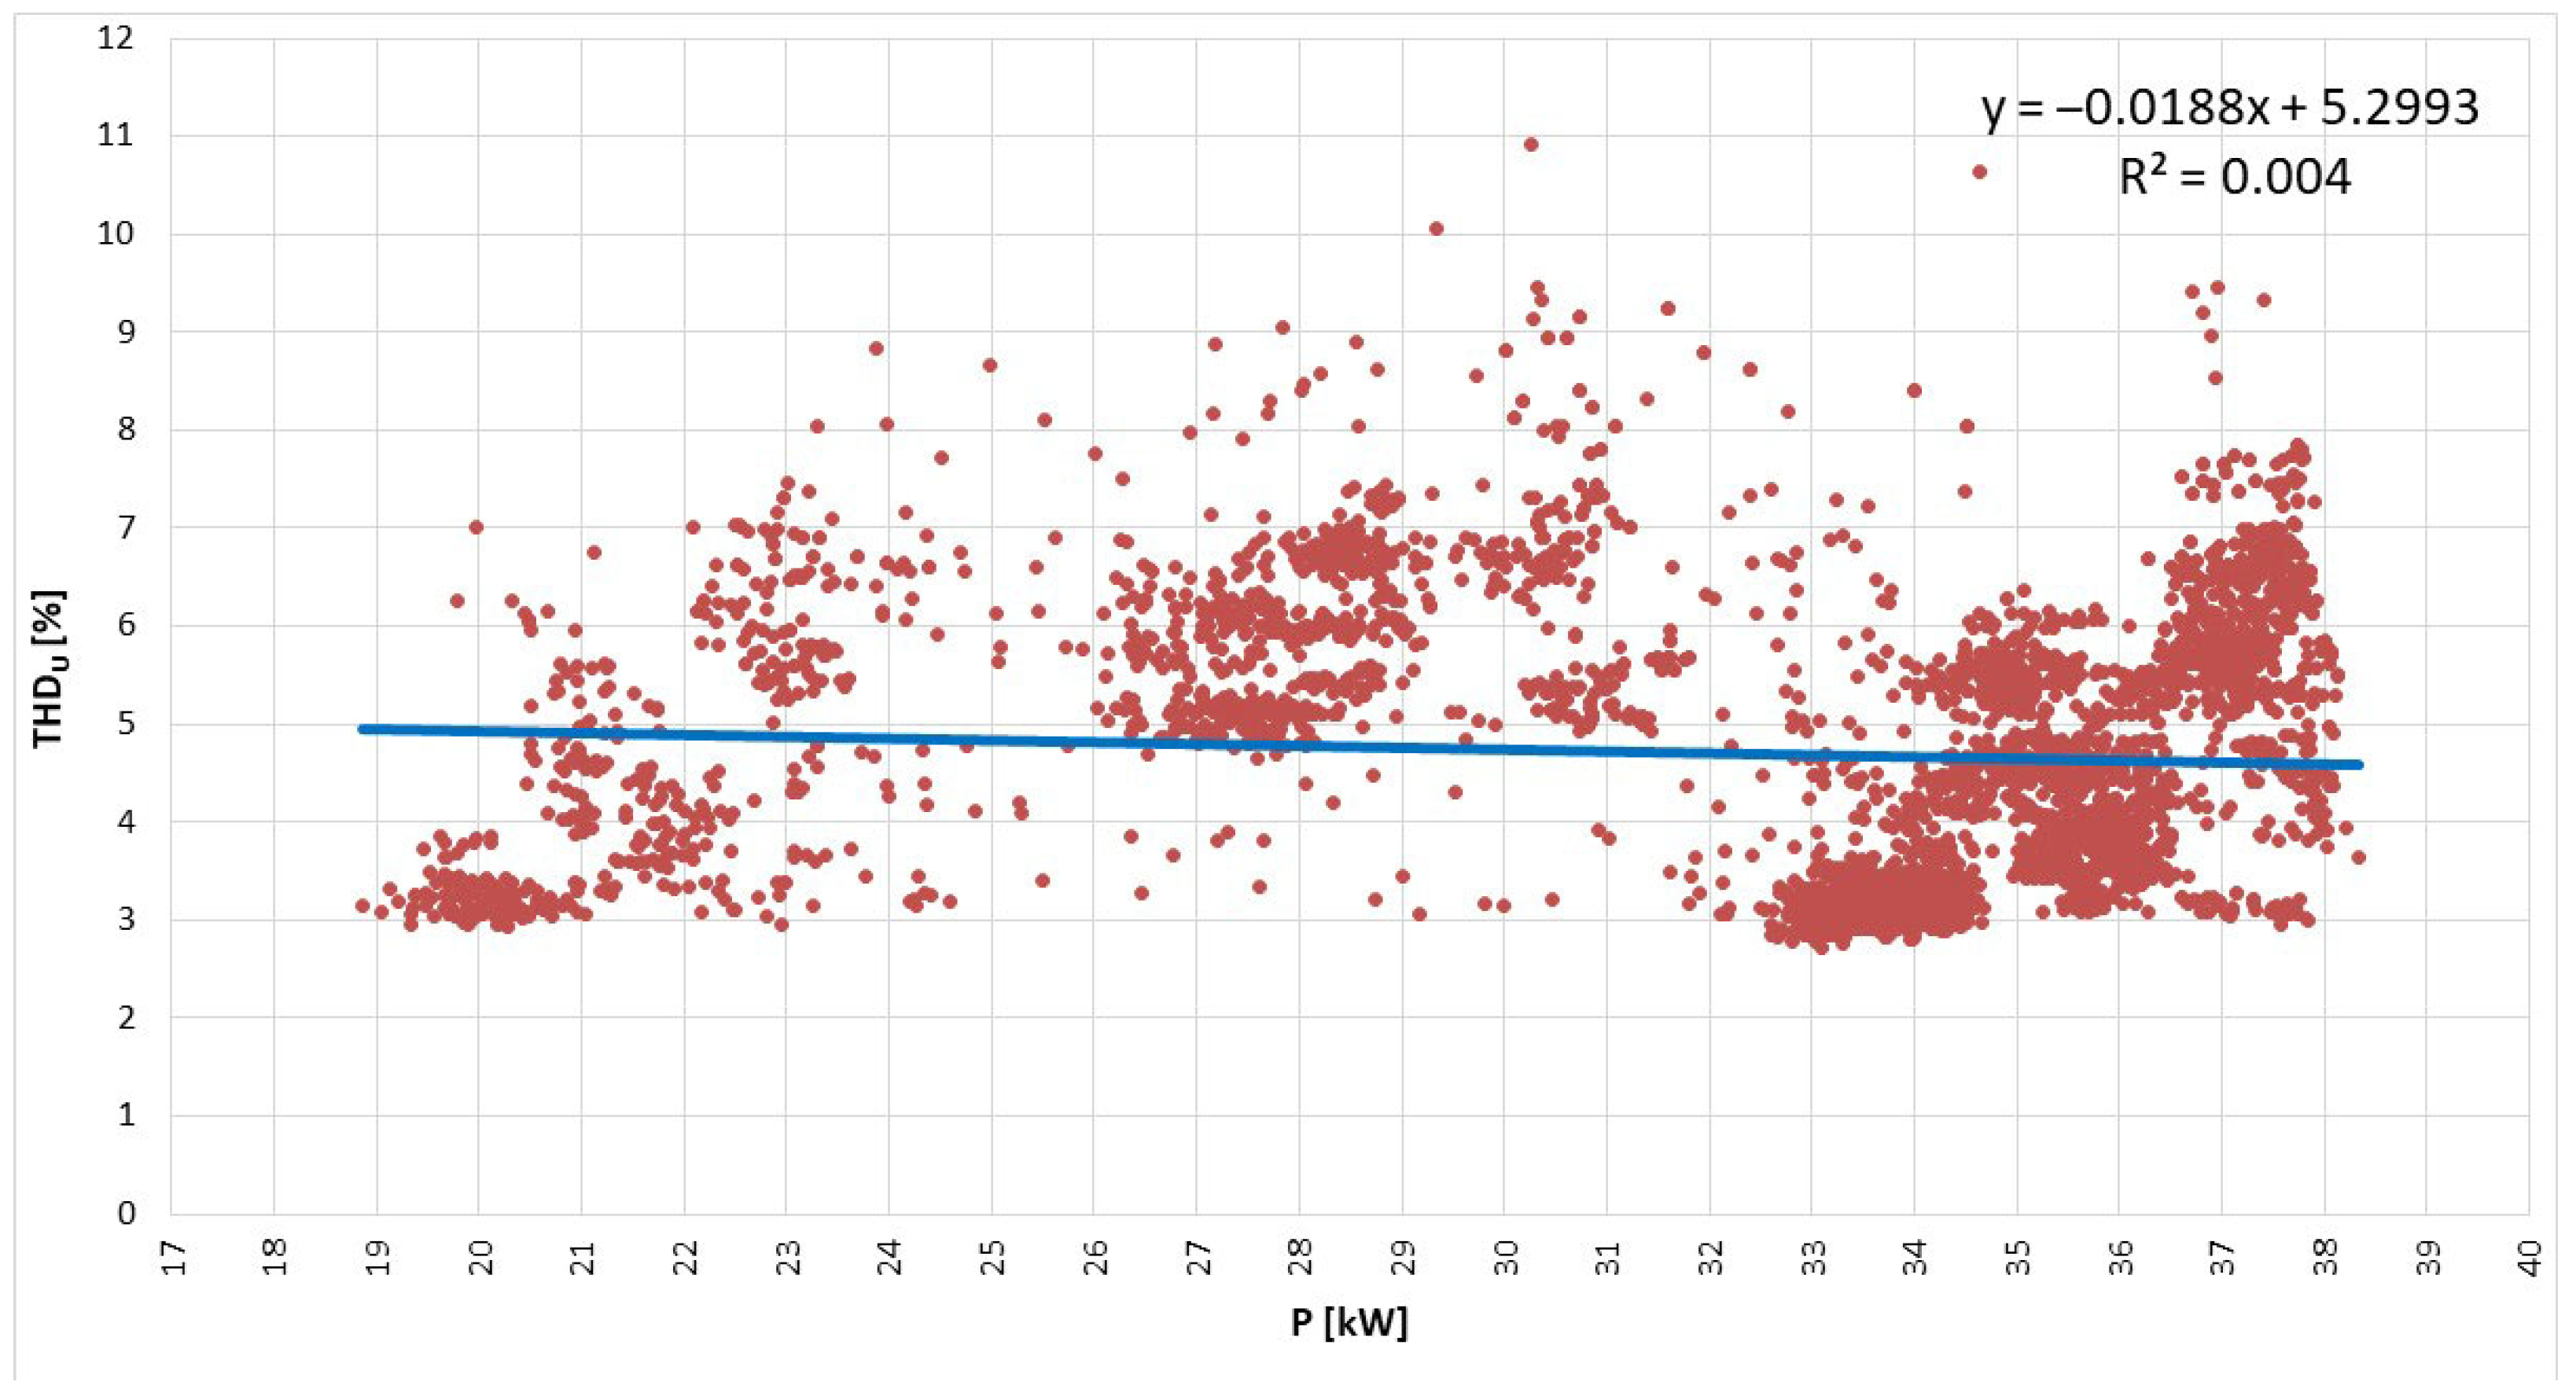
From the perspective of power quality, a crucial aspect was the distortion of voltage and current waveforms from their sinusoidal waveform. In the case of the first biogas plant, a change in the power fed into the grid (due to switching on the digester mixers) had no noticeable effect on voltage distortion (THDU) (Figure 15). This was evidenced by the determination index, which was close to 0. However, it should be noted that the value of THDU repeatedly exceeded the value allowed by current regulations (8%) during the measurements [37]. Since the locations of these exceedances were randomly distributed across the measurement timeline shown in Figure 15, it can be concluded that they were not attributable to the biogas plant’s biogas plant operation but rather originated from other consumers connected to the same electricity network [47].
The relationship was different (Figure 16) when the biogas plant was connected considerably farther from the transformer station. At the second biogas plant, a clear relationship was observed between the power input/output from the grid and the total voltage distortion coefficient, with an R2 index of approximately 0.3. The recorded THDU values did not exceed 3%, which was significantly smaller than in the case of the first biogas plant. In this case, the equipment of other consumers connected to the same network did not cause significant voltage distortion. Switching on the generator at the biogas plant increased the total voltage distortion factor by approximately 0.5%.
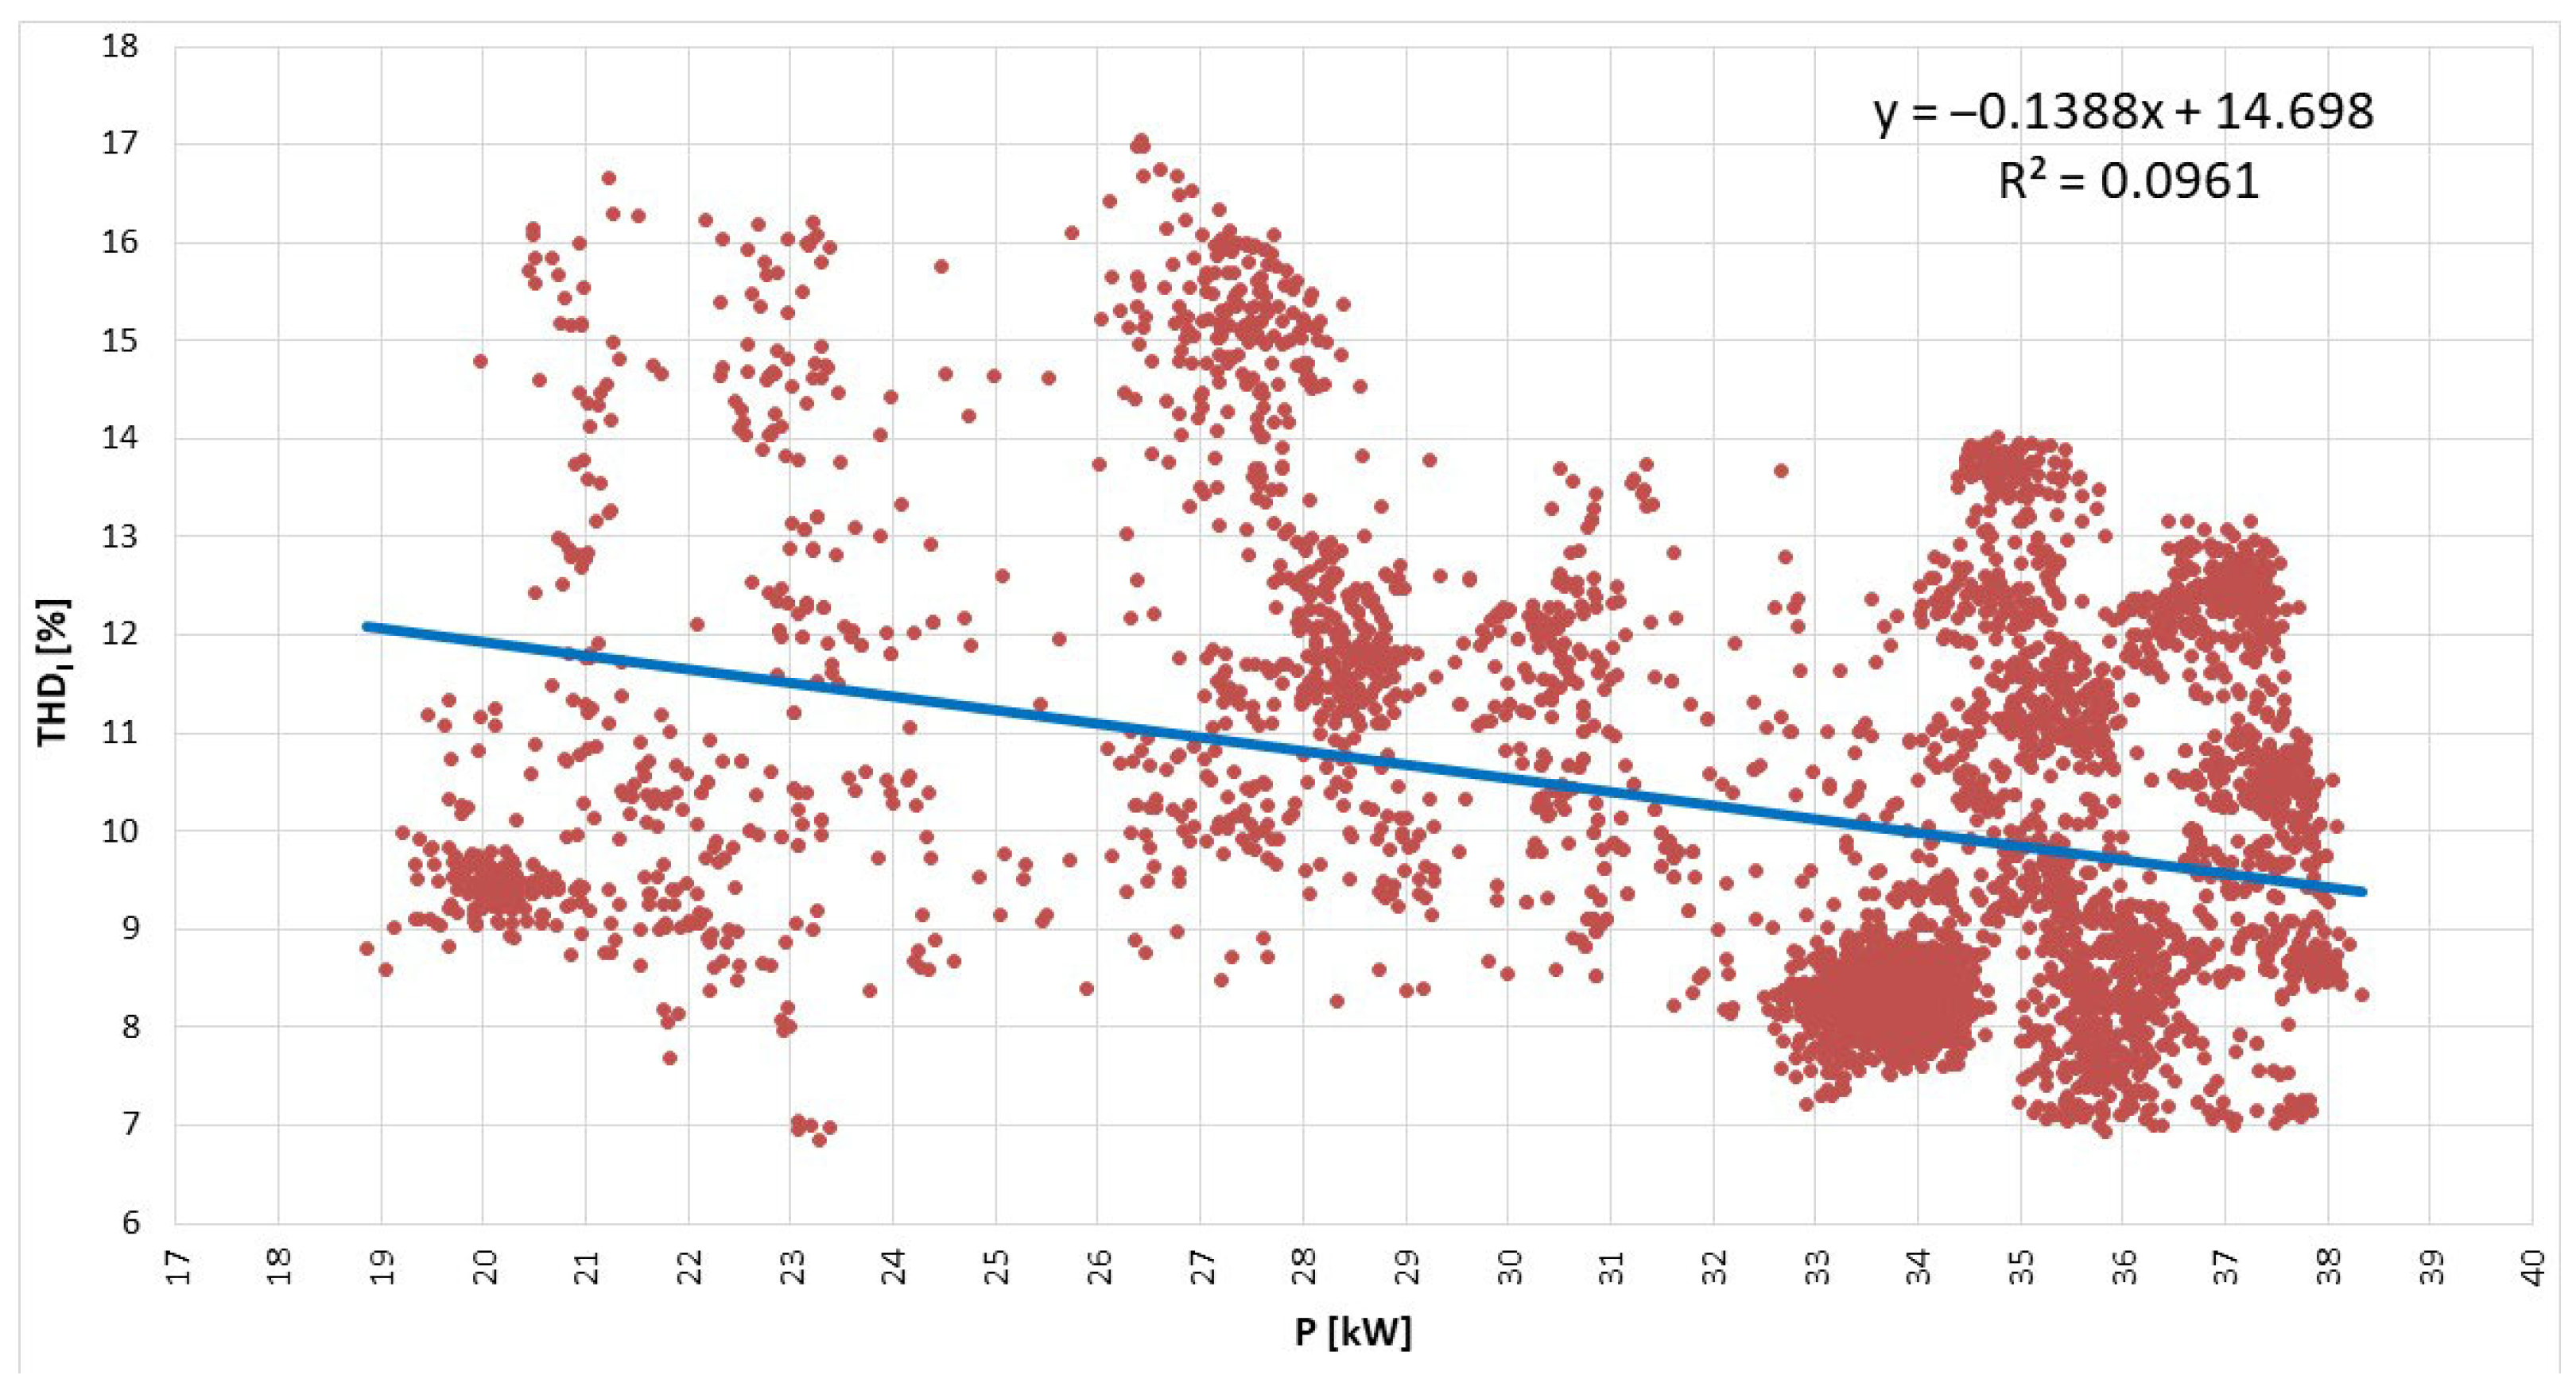
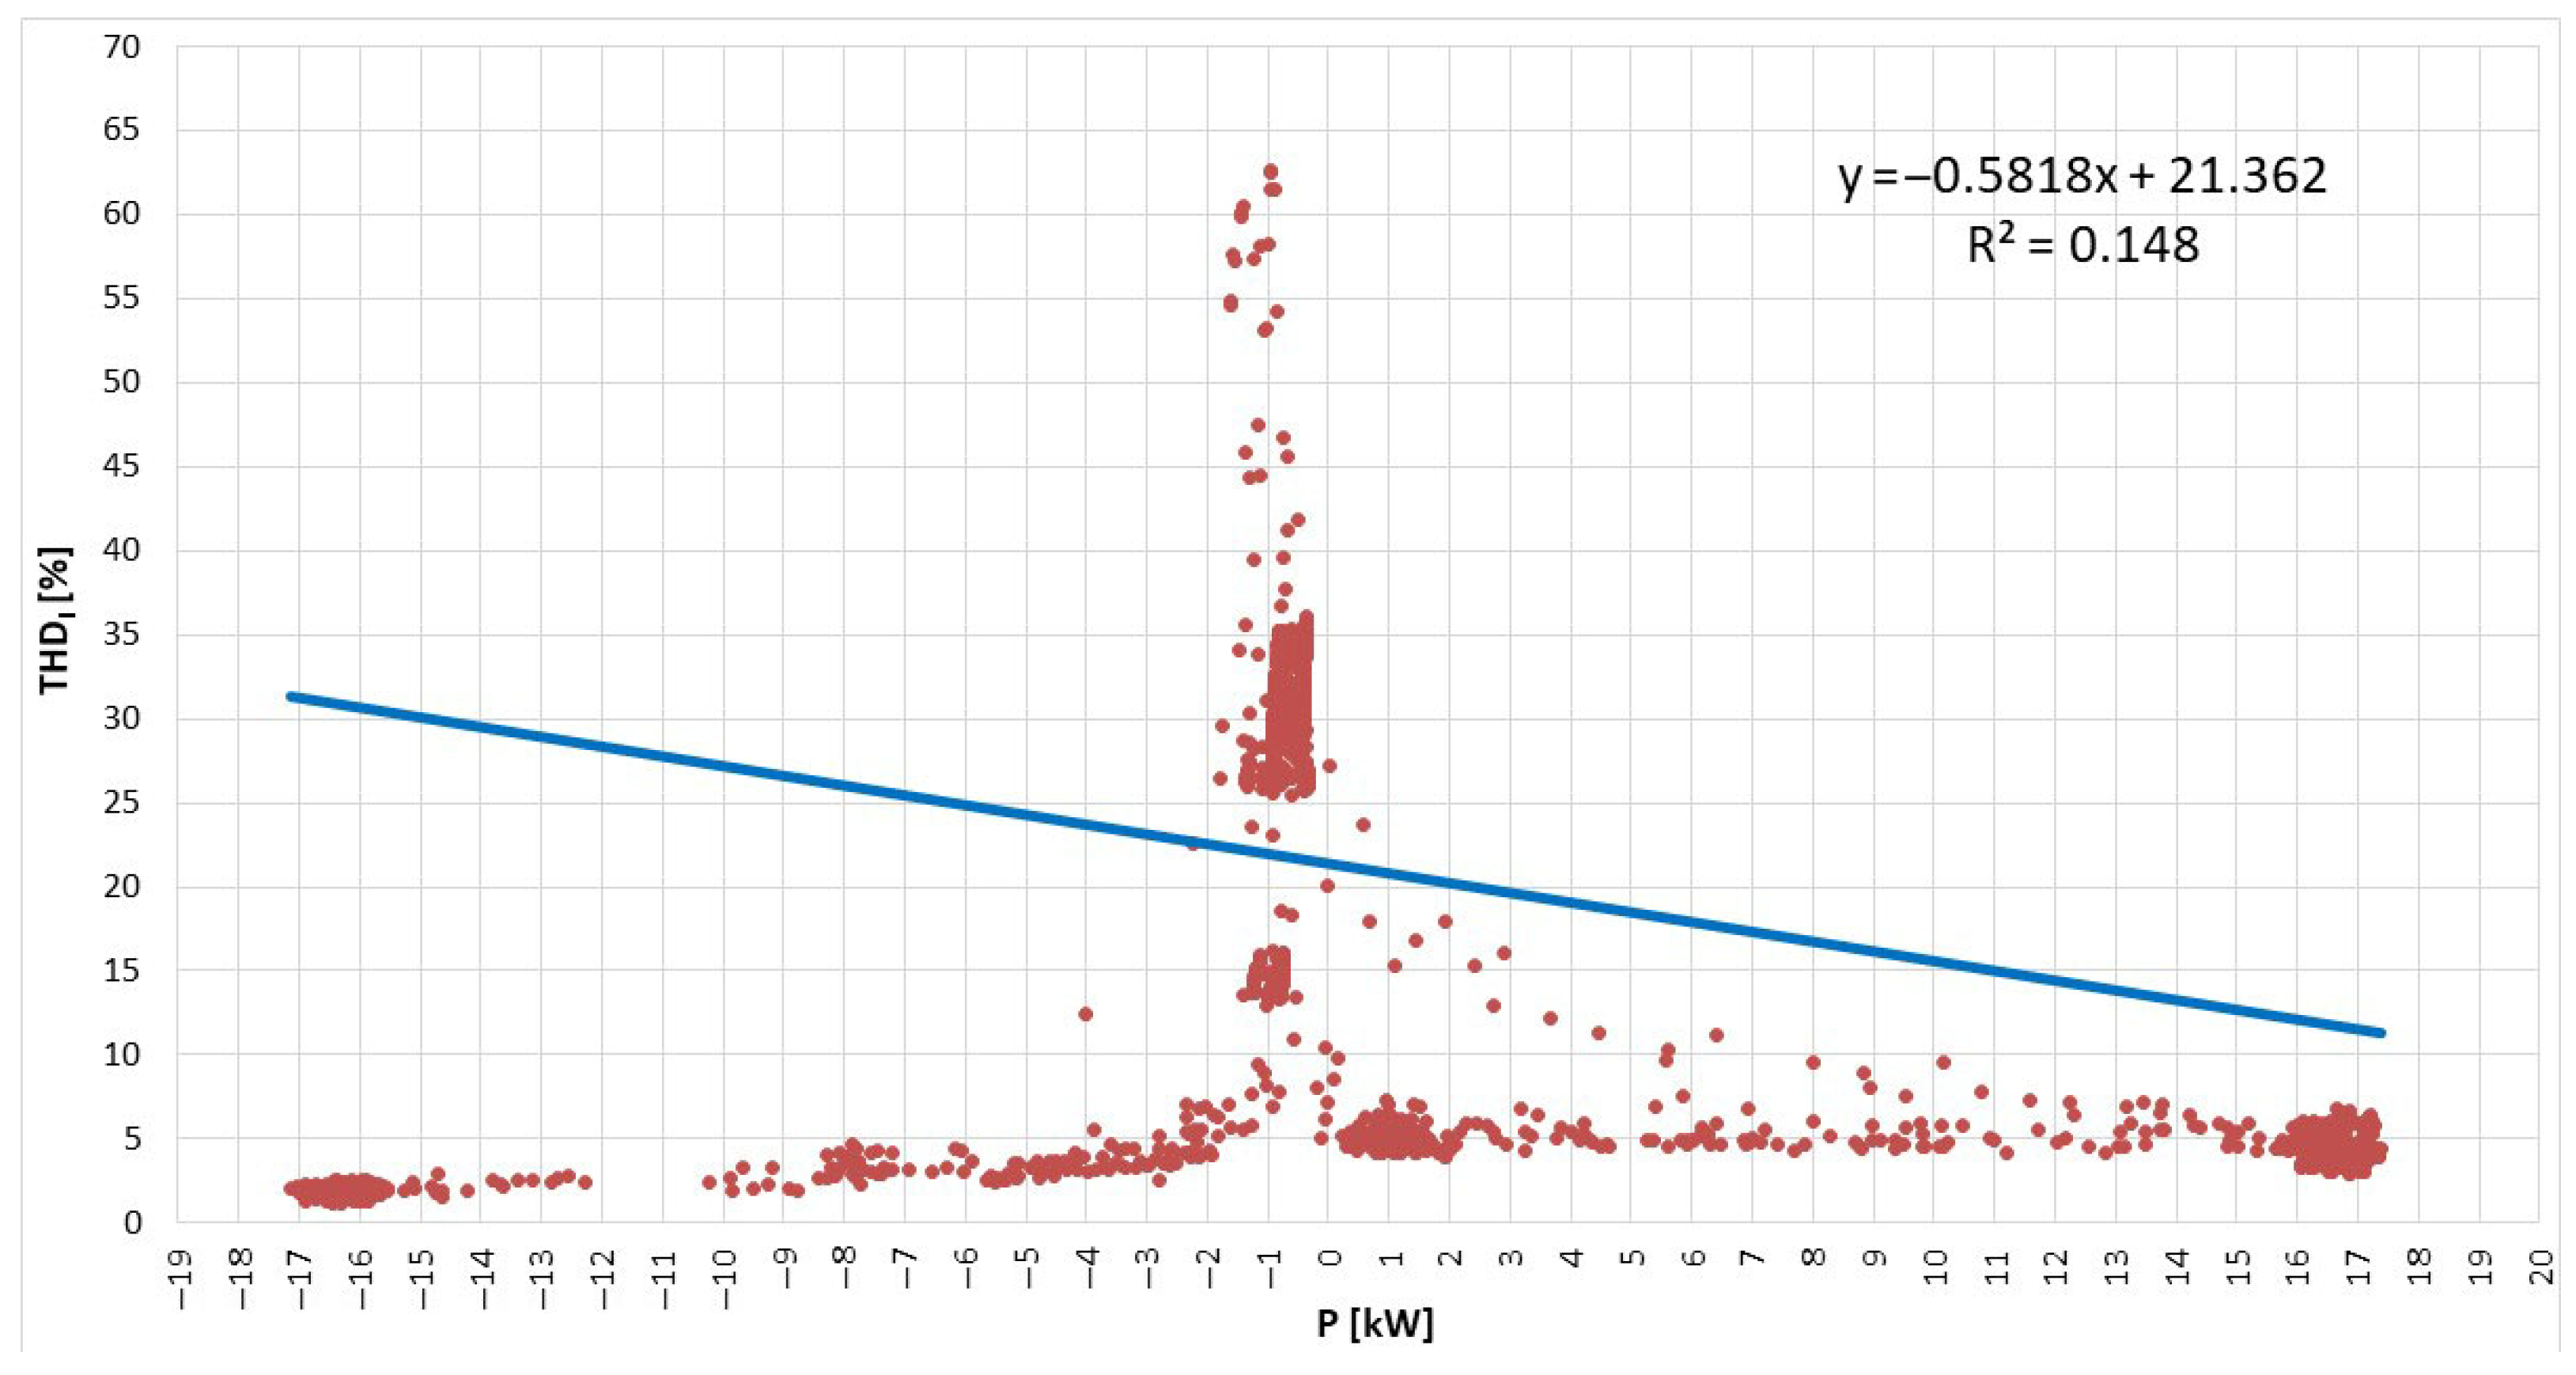
The correlations between the power fed into the electricity grid and the total current distortion coefficient were different for each biogas plant studied, as shown in Figure 17 and Figure 18. For the first biogas plant, a significantly greater scatter of THDI was observed during the operation of both digester mixers. The maximum values recorded during the tests were also present there. When power was fed into the grid at or near the rated power of the biogas plant, the scatter of THDI values was significantly reduced.
The operation of one of the generators (biogas plant no. 2) with the digester mixers turned off did not result in significant changes in the total current distortion coefficient value, as shown in Figure 18. In this case, a significant (more than sixfold) increase in the THDI value occurred when the power generated by the biogas plant was equalized to the power consumed by the source’s own-needs equipment. This was an inverse relationship to that observed in networks with photovoltaic installations, where PV generation affects the increase in THDI values [48].

4. Conclusions

In this paper, the influence of a fermentation mass mixer operation on selected quality parameters of electrical energy was analyzed. The research results revealed that the mixer operation directly contributed to a more extended return on investment for biogas plant construction. The average running time of the mixers was about 120 min per day. During this time, the power fed into the grid (and thus the revenue from electricity sales) was reduced by approximately 16 kW, resulting in a monthly grid energy input of around 1 MWh. The operation of mixers—mainly when the power generated equaled the power consumed by the plant’s internal systems—resulted in excessive reactive power consumption (registered tg φ was as high as −51 at biogas plant no. 2), which led to additional charges on the electricity bill. This significantly reduced the profits generated by the agricultural biogas plant, resulting in a longer payback period. The analyses carried out in this article showed that for technological and economic reasons, agricultural biogas plants should be connected as close as possible to the transformer station and should operate as close as possible to the nominal power of the generators. (Then, the interference introduced into the grid will be the smallest—THDI drops to 3.5–13.2%.) When constructing a biogas plant, consideration should also be given to installing in the digester a more significant number of mixers of lower nominal power, working in alternation (ensuring a stable power demand), and selecting a turbine set to ensure the total generator output exceeds the connection capacity by the power of its own needs. This will ensure that the power injected into the grid will closely match the connection capacity most of the time (currently, the range of power changes is from 19 kW for the first biogas plant to as much as 34 kW at biogas plant no. 2), thus increasing the returns from the biogas plant and reducing the payback time. In further studies, the authors plan to assess the impact of operating a biogas plant with multiple cyclic mixers on the amount of biogas produced and the quality of energy fed into the electricity grid.

Author Contributions

Conceptualization, Z.S. and A.B.; methodology, Z.S. and M.K.; software, Z.S. and Ł.P.; validation, J.F.; formal analysis, A.B.; investigation, Z.S. and M.K.; resources, Ł.P.; data curation, J.F. and Ł.P.; writing—original draft preparation, J.F. and Ł.P.; writing—review and editing, Z.S. and A.B.; visualization, Z.S. and Ł.P.; supervision, J.F.; project administration, Z.S. and A.B.; funding acquisition, Z.S. and M.K. All authors have read and agreed to the published version of the manuscript.

Funding

This research received no external funding.

Data Availability Statement

The original contributions presented in the study are included in the article. Further inquiries can be directed to the corresponding author.

Conflicts of Interest

The authors declare no conflicts of interest.

References

  1. Pang, L.; Liu, L.; Zhou, X.; Hafeez, M.; Ullah, S.; Sohail, M.T. How does natural resource depletion affect energy security risk? New insights from major energy-consuming countries. Energy Strategy Rev. 2024, 54, 101460. [Google Scholar] [CrossRef]
  2. Kabeyi, M.J.B.; Olanrewaju, O.A. Sustainable Energy Transition for Renewable and Low-Carbon Grid Electricity Generation and Supply. Front. Energy Res. 2022, 9, 743114. [Google Scholar] [CrossRef]
  3. Antar, M.; Lyu, D.; Nazari, M.; Shah, A.; Zhou, X.; Smith, D.L. Biomass for a sustainable bioeconomy: An overview of world biomass production and utilisation. Renew. Sustain. Energy Rev. 2021, 139, 110691. [Google Scholar] [CrossRef]
  4. Baasch, S. Energy transition with biomass residues and waste: Regional-scale potential and conflicts. A case study from North Hesse, Germany. J. Environ. Policy Plan. 2021, 23, 243–255. [Google Scholar] [CrossRef]
  5. Chia, W.Y.; Chew, K.W.; Le, C.F.; Lam, S.S.; Chee, C.S.C.; Ooi, M.S.L.; Show, P.L. Sustainable utilisation of biowaste compost for renewable energy and soil amendments. Environ. Pollut. 2020, 267, 115662. [Google Scholar] [CrossRef] [PubMed]
  6. Benjamin, M.F.D.; Andiappan, V.; Lee, J.-Y.; Tan, R.R. Increasing the reliability of bioenergy parks utilising agricultural waste feedstock under demand uncertainty. J. Clean. Prod. 2020, 269, 122385. [Google Scholar] [CrossRef]
  7. Niemiec, M.; Komorowska, M.; Atilgan, A.; Abduvasikov, A. Labelling the Carbon Footprint as a Strategic Element of Enviro-mental Assessment of Agricultural Systems. Agric. Eng. 2024, 28, 235–250. [Google Scholar] [CrossRef]
  8. Derehajło, S.; Tymińska, M.; Skibko, Z.; Borusiewicz, A.; Romaniuk, W.; Kuboń, M.; Olech, E.; Koszel, M. Heavy Metal Content in Substrates in Agricultural Biogas Plants. Agric. Eng. 2023, 27, 315–329. [Google Scholar] [CrossRef]
  9. Subramaniam, Y.; Masron, T.A.; Azman, N.H.N. Biofuels, environmental sustainability, and food security: A review of 51 countries. Energy Res. Soc. Sci. 2020, 68, 101549. [Google Scholar] [CrossRef]
  10. Saleem, M. Possibility of utilising agriculture biomass as a renewable and sustainable future energy source. Heliyon 2022, 8, e08905. Available online: https://www.cell.com/heliyon/fulltext/S2405-8440(22)00193-1#au1 (accessed on 5 March 2025). [CrossRef] [PubMed]
  11. Gautam, A.; Pant, M.; Pant, G.; Kumar, G. Second-Generation Biofuels: Concepts, Applications, and Challenges. In Microbial Applications for Environmental Sustainability; Karnwal, A., Mohammad Said Al-Tawaha, A.R., Eds.; Springer Nature: Singapore, 2024; pp. 277–304. [Google Scholar] [CrossRef]
  12. Song, J.; Wang, Y.; Zhang, S.; Song, Y.; Xue, S.; Liu, L.; Lvy, X.; Wang, X.; Yang, G. Coupling biochar with anaerobic digestion in a circular economy perspective: A promising way to promote sustainable energy, environment, and agriculture development in China. Renew. Sustain. Energy Rev. 2021, 144, 110973. [Google Scholar] [CrossRef]
  13. Tymińska, M.; Skibko, Z.; Borusiewicz, A. The Effect of Agricultural Biogas Plants on the Quality of Farm Energy Supply. Energies 2023, 16, 4600. [Google Scholar] [CrossRef]
  14. Gadirli, G.; Pilarska, A.A.; Dach, J.; Pilarski, K.; Kolasa-Więcek, A.; Borowiak, K. Fundamentals, Operation and Global Prospects for the Development of Biogas Plants-A Review. Energies 2024, 17, 568. [Google Scholar] [CrossRef]
  15. Uzodinma, E.O.U.; Ofoefule, A.U.; Eze, J.I.; Onwuka, N.D. Optimum Mesophilic Temperature of Biogas Production from Blends of Agro-Based Wastes. Trends Appl. Sci. Res. 2007, 2, 39–44. [Google Scholar] [CrossRef]
  16. Wang, S.; Ma, F.; Ma, W.; Wang, P.; Zhao, G.; Lu, X. Influence of Temperature on Biogas Production Efficiency and Microbial Community in a Two-Phase Anaerobic Digestion System. Water 2019, 11, 133. [Google Scholar] [CrossRef]
  17. Dyjak-Wojciechowska, M. Proper Mixing Is a Challenge, Now Environment. 2 April 2024. Available online: https://www.teraz-srodowisko.pl/publikacje/biogaz-biometan-insight-Polska-2024/teraz-srodowisko-publikacja-biogaz-biometan-insight-Polska-2024.pdf (accessed on 27 February 2024).
  18. Grzybek, A. Biogas Plants as an Opportunity for Agriculture for the Environment; Ministry of Agriculture and Rural Development: Warsaw, Poland, 2013; p. 37. ISBN 978-83-937363-0-0. [Google Scholar] [CrossRef]
  19. Lemmer, A.; Naegele, H.-J.; Sondermann, J. How Efficient are Agitators in Biogas Digesters? Determination of the Efficiency of Submersible Motor Mixers and Incline Agitators by Measuring Nutrient Distribution in Full-Scale Agricultural Biogas Digesters. Energies 2013, 6, 6255–6273. [Google Scholar] [CrossRef]
  20. Gowin, K. Technological Solutions for a ‘Universal’ Biogas Plant. Czysta Energia, no. 3. 2017. Available online: https://yadda.icm.edu.pl/baztech/element/bwmeta1.element.baztech-f1a6da9b-a6a8-4750-a7a6-2a3e11d3ff3a (accessed on 28 February 2025).
  21. Skibko, Z.; Borusiewicz, A.; Romaniuk, W.; Pietruszynska, M.; Milewska, A.; Marczuk, A. Voltage Problems on Farms with Agricultural Biogas Plants-A Case Study. Appl. Sci. 2024, 14, 7003. [Google Scholar] [CrossRef]
  22. Slatter, P. The Engineering Hydrodynamics of Viscoplastic Suspensions. Sci. Technol. 2011, 29, 139–150. [Google Scholar] [CrossRef]
  23. Kuboń, M.; Skibko, Z.; Borusiewicz, A.; Romaniuk, W.; St. Gajda, J.; Kłosowska, O.; Wasąg, Z. Influence of the Parameters of an Agricultural Biogas Plant on the Amount of Power Generated. Appl. Sci. 2024, 14, 4200. [Google Scholar] [CrossRef]
  24. Caillet, H.; Adelard, L. Advances in Computational Fluid Dynamics modelling of anaerobic digestion process for renewable energy production: A review. Waste Biomass Valoriz 2023, 14, 389–405. [Google Scholar] [CrossRef]
  25. Czekała, W.; Nowak, M.; Bojarski, W. Anaerobic Digestion and Composting as Methods of Bio-Waste Management. Agric. Eng. Sciendo 2023, 27, 173–186. [Google Scholar] [CrossRef]
  26. Di Maria, F.; Sisani, F.; Norouzi, O.; Mersky, R.L. The effectiveness of anaerobic digestion of bio-waste in replacing primary energies: An EU28 case study. Renew. Sustain. Energy Rev. 2019, 108, 347–354. [Google Scholar] [CrossRef]
  27. Singh, B.; Szamosi, Z.; Siménfalvi, Z. State of the art on mixing in an anaerobic digester: A review. Renew. Energy 2019, 141, 922–936. [Google Scholar] [CrossRef]
  28. Stroot, P.G.; McMahon, K.D.; Mackie, R.I.; Raskin, L. Anaerobic codigestion of municipal solid waste and biosolids under various mixing conditions-I. digester performance. Water Res. 2001, 35, 1804–1816. [Google Scholar] [CrossRef] [PubMed]
  29. Kaparaju, P.; Buendiaa, I.; Ellegaardb, L.; Angelidakiaa, I. Effects of mixing on methane production during thermophilic anaerobic digestion of manure: Lab-scale and pilot-scale studies. Bioresour. Technol. 2007, 99, 4919–4928. [Google Scholar] [CrossRef] [PubMed]
  30. Lindmark, J.; Thorin, E.; Fdhila, R.B.; Dahlquista, E. Effects of mixing on the result of anaerobic digestion: Review. Renew. Sustain. Energy Rev. 2014, 40, 1030–1047. [Google Scholar] [CrossRef]
  31. Caillet, H.; Bastide, A.; Adelard, L. Advances in Computational Fluid Dynamics modeling of anaerobic digestion process for renewable energy production: A review. Clean. Waste Syst. 2023, 6, 100124. [Google Scholar] [CrossRef]
  32. López-Jiménez, P.; Escudero-González, J.; Martínez, T.M.; Montañana, V.F.; Gualtieri, C. Application of CFD methods to an anaerobic digester: The case of Ontinyent WWTP, Valencia, Spain. J. Eng. Water Process 2015, 7, 131–140. [Google Scholar] [CrossRef]
  33. Vesvikar, M.S.; Al-Dahhan, M. Flow pattern visualisation in a mimic anaerobic digester using CFD. Biotechnol. Bioeng. 2005, 89, 719–732. [Google Scholar] [CrossRef] [PubMed]
  34. Wu, B.; Chen, S. CFD simulation of non-Newtonian fluid flow in anaerobic digesters. Biotechnol. Bioeng. 2007, 99, 700–711. [Google Scholar] [CrossRef] [PubMed]
  35. Caillet, H.; Bastide, A.; Adelard, L. CFD Simulations in Mechanically Stirred Tank and Flow Field Analysis: Application to the Wastewater (Sugarcane Vinasse) Anaerobic Digestion; Promising Techniques for Wastewater Treatment and Water Quality, Assessment; Moujdin, I.A., Summers, J.K., Eds.; IntechOpen: London, UK, 2020; p. 93926. [Google Scholar] [CrossRef]
  36. Kabeyi, B.; Jeremiah, M.; Oludolapo, O. Biogas Treatment and Upgrading Techniques. In Proceedings of the 4th Asia Pacific International Conference on Industrial Engineering and Operations Management, Ho Chi Minh City, Vietnam, 12–14 September 2023. [Google Scholar] [CrossRef]
  37. EN 50160:2010; Supply Voltage Parameters for Public Distribution Networks. EU: Maastricht, The Netherlands, 2010.
  38. Regulation of the Minister of Economy of 4 May 2007 on Detailed Conditions for the Operation of the Electric Power System (in Polisch). JoL. 2007 No 93 Item 623. Available online: https://isap.sejm.gov.pl/isap.nsf/DocDetails.xsp?id=wdu20070930623 (accessed on 8 March 2025).
  39. Robak, S.; Pawlicki, A.; Pawlicki, B. The analysis of the voltage and current asymmetry in the power transmission lines. Przegląd Elektrotechniczny 2014, 90, 23–31. [Google Scholar]
  40. Kosicki, Ł.; Typańska, D. The research of current and voltage distortions generated by luminaries with the light emmiting diodes. Electr. Eng. 2017, 92, 215–226. [Google Scholar] [CrossRef]
  41. Huang, B.; Song, K.; Zhang, T.; Lian, Z.; Li, H.; Jin, D.; Wang, R. Solving Power Supply Stability Issues in Remote Agricultural Areas Based on an Improved Sliding-Mode Active Disturbance Rejection Control Method. Agriculture 2025, 15, 674. [Google Scholar] [CrossRef]
  42. Kiangebeni Lusimbakio, K.; Boketsu Lokanga, T.; Sedi Nzakuna, P.; Paciello, V.; Nzuru Nsekere, J.-P.; Tshimanga Tshipata, O. Evaluation of the Impact of Photovoltaic Solar Power Plant Integration into the Grid: A Case Study of the Western Transmission Network in the Democratic Republic of Congo. Energies 2025, 18, 639. [Google Scholar] [CrossRef]
  43. Chertkov, M.; Backhaus, S.; Turtisyn, K.; Chernyak, V.; Lebedev, V. Voltage Collapse and ODE Approach to Power Flows: Analysis of a Feeder Line with Static Disorder in Consumption/Production. arXiv 2011, arXiv:1106.5003. [Google Scholar] [CrossRef]
  44. Khatsevskiy, K.V.; Antonov, A.I.; Gonenko, T.V.; Khatsevskiy, V.F. The voltage asymmetry in electrical networks with single-phase load. In Proceedings of the 2017 Dynamics of Systems, Mechanisms and Machines (Dynamics), Omsk, Russia, 14–16 November 2017; pp. 1–4. [Google Scholar] [CrossRef]
  45. Khodapanah, M.; Zobaa, A.F.; Abbod, M. Estimating power factor of induction motors at any loading conditions using support vector regression (SVR). Electr Eng. 2018, 100, 2579–2588. [Google Scholar] [CrossRef]
  46. AbdElhafez, A.; Alruways, S.; Alsaif, Y.; Althobaiti, M.; AlOtaibi, A.; Alotaibi, N. Reactive Power Problem and Solutions: An Overview. J. Power Energy Eng. 2017, 5, 40–54. [Google Scholar] [CrossRef]
  47. Alawasa, K.M.; Al-Badi, A.H. Investigation and Analysis of the Power Quality in an Academic Institution’s Electrical Distribution System. Energies 2024, 17, 3998. [Google Scholar] [CrossRef]
  48. Pereira, J.L.M.; Leal, A.F.R.; Almeida, G.O.d.; Tostes, M.E.d.L. Harmonic Effects Due to the High Penetration of Photovoltaic Generation into a Distribution System. Energies 2021, 14, 4021. [Google Scholar] [CrossRef]
Figure 1. View of one of the agitators installed in the agricultural biogas plants under study [own photo].
Energies 18 03849 g001
Figure 2. Recorded course of variation in the average value of three-phase active power obtained from biogas plant no. 1.
Energies 18 03849 g002
Figure 3. Recorded course of the variation of the maximum value of the three-phase active power obtained from biogas plant no. 1.
Energies 18 03849 g003
Figure 4. Recorded course of variation in the average value of three-phase active power obtained from biogas plant no. 2.
Energies 18 03849 g004
Figure 5. Recorded course of variation of the maximum value of three-phase active power obtained from biogas plant no. 2.
Energies 18 03849 g005
Figure 6. Recorded average operating times of digester agitators in both biogas plants with marked measurement errors.
Energies 18 03849 g006
Figure 7. Recorded correlation between grid frequency (f) and active power (P) injected into the grid from biogas plant no. 1.
Energies 18 03849 g007
Figure 8. Recorded correlation between grid frequency (f) and active power (P) injected into the grid from biogas plant no. 2.
Energies 18 03849 g008
Figure 9. Recorded course of the correlation between grid voltage (U) and active power (P) injected into the grid from biogas plant no. 1.
Energies 18 03849 g009
Figure 10. Recorded correlation between grid voltage (U) and active power (P) entering the grid from biogas plant no. 2.
Energies 18 03849 g010
Figure 11. Recorded course of the correlation between voltage asymmetry (kU2) and active power (P) injected into the grid from biogas plant no. 1.
Energies 18 03849 g011
Figure 12. Recorded correlation between voltage asymmetry (kU2) and active power (P) injected into the grid from biogas plant no. 2.
Energies 18 03849 g012
Figure 13. Recorded correlation between power factor (tg φ) and active power (P) injected into the grid from biogas plant no. 1.
Energies 18 03849 g013
Figure 14. Recorded correlation between power factor (tg φ) and active power (P) injected into the grid from biogas plant no. 2.
Energies 18 03849 g014
Figure 15. Recorded correlation between the total voltage distortion coefficient (THDU) and the active power (P) injected into the grid from biogas plant no. 1.
Energies 18 03849 g015
Figure 16. Recorded correlation between the total voltage distortion coefficient (THDU) and the active power (P) injected into the grid from biogas plant no. 2.
Energies 18 03849 g016
Figure 17. Recorded correlation between the total current distortion coefficient (THDI) and the active power (P) injected into the grid from biogas plant no. 1.
Energies 18 03849 g017
Figure 18. Recorded correlation between the total current distortion coefficient (THDI) and the active power (P) injected into the grid from biogas plant no. 2.
Energies 18 03849 g018
Table 1. Summary of selected parameters characterizing the slurry used in the tested agricultural biogas plants [own study].
ParameterUnitBiogas Plant No.Average
12
pH-88.68.3
dry matter%8.68.48.5
total nitrogen%0.480.440.46
phosphorus% P2O50.280.290.285
phosphorus% K2O0.330.320.325
calcium% CaO0.510.610.56
magnesium% MgO0.130.160.145
total sulfur% DM0.4520.4490.4505
irong/kg DM1.0360.9751.0055
manganeseg/kg DM0.4670.4010.434
Table 2. Basic technical data of the generating sets installed in the studied agricultural biogas plants.
ParameterValue
Internal combustion engine typeOtto WG1605
Number of cylinders in an internal combustion engine4
Internal combustion engine speed2700 rpm
Electrical efficiency of the internal combustion engine32%
Maximum temperature of flue gases110 °C
Generator typeAsynchronous 4P/IE2
Rated active power of the generator20 kW
Nominal apparent generator power26 kVA
Rated unit voltage400 V
Rated unit current29 A
Rated frequency of the unit50 Hz
Rated power factor φ0.25
Overall turbine efficiency97%
Table 3. Results of statistical analysis of mean values of three-phase active power in biogas plant no. 1.
ParameterValueUnit
Mean 32.42995kW
Standard Error0.072423kW
Median33.97441kW
Mode28.38627kW
Standard Deviation4.760141kW
Sample Variance22.65894kW2
Kurtosis0.48279-
Skewness−1.1993-
Range19.46663kW
Minimum18.8621kW
Maximum38.32873kW
Confidence Level (95.0%)0.141986kW
Table 4. Results of statistical analysis of mean values of three-phase active power in the biogas plant no. 2.
ParameterValueUnit
Mean 2.529704kW
Standard Error0.132715kW
Median−0.41462kW
Mode16.6456kW
Standard Deviation8.72292kW
Sample Variance76.08933kW2
Kurtosis−0.08842-
Skewness0.32512-
Range34.513kW
Minimum−17.1332kW
Maximum17.37978kW
Confidence Level (95.0%)0.26019kW
Disclaimer/Publisher’s Note: The statements, opinions and data contained in all publications are solely those of the individual author(s) and contributor(s) and not of MDPI and/or the editor(s). MDPI and/or the editor(s) disclaim responsibility for any injury to people or property resulting from any ideas, methods, instructions or products referred to in the content.