
Site Selection for Solar–Wind Hybrid Energy Storage Plants Based on Triangular Fuzzy Numbers: A Case Study of China


Abstract
1. Introduction
- A two-stage evaluation indicator system was made, combining qualitative and quantitative analyses. The method innovatively combines GIS and traditional evaluation methods. It uses spatial data and subjective opinions. This makes it more objective and effective than traditional methods.
- A new evaluation index system is made. DEMATEL and the relative similarity methods based on triangular fuzzy numbers (TFNs) are used together for the first time in renewable energy site selection.
- This paper proposes a new decision-making framework to solve the SWHESP site selection problem by combining prospect theory and the VIKOR method. This framework includes risk preferences, uncertainty, and the decision maker’s (DM’s) subjective bias, giving a more complete and practical solution.
2. Literature Review
2.1. SWHESPs
2.2. Site Selection Issues
- In the literature on new energy power plants, most scholars have researched how to improve power delivery efficiency from the energy source and maintain stability through energy storage technology. However, finding the best way to combine the advantages of different energy sources is still a major challenge.
- Regarding site selection, traditional weighting methods rely on exact data, which makes them less suitable for handling fuzzy factors. Most studies use a single method to evaluate the model, leading to incomplete analyses, and cases are primarily foreign, with fewer cases in China.
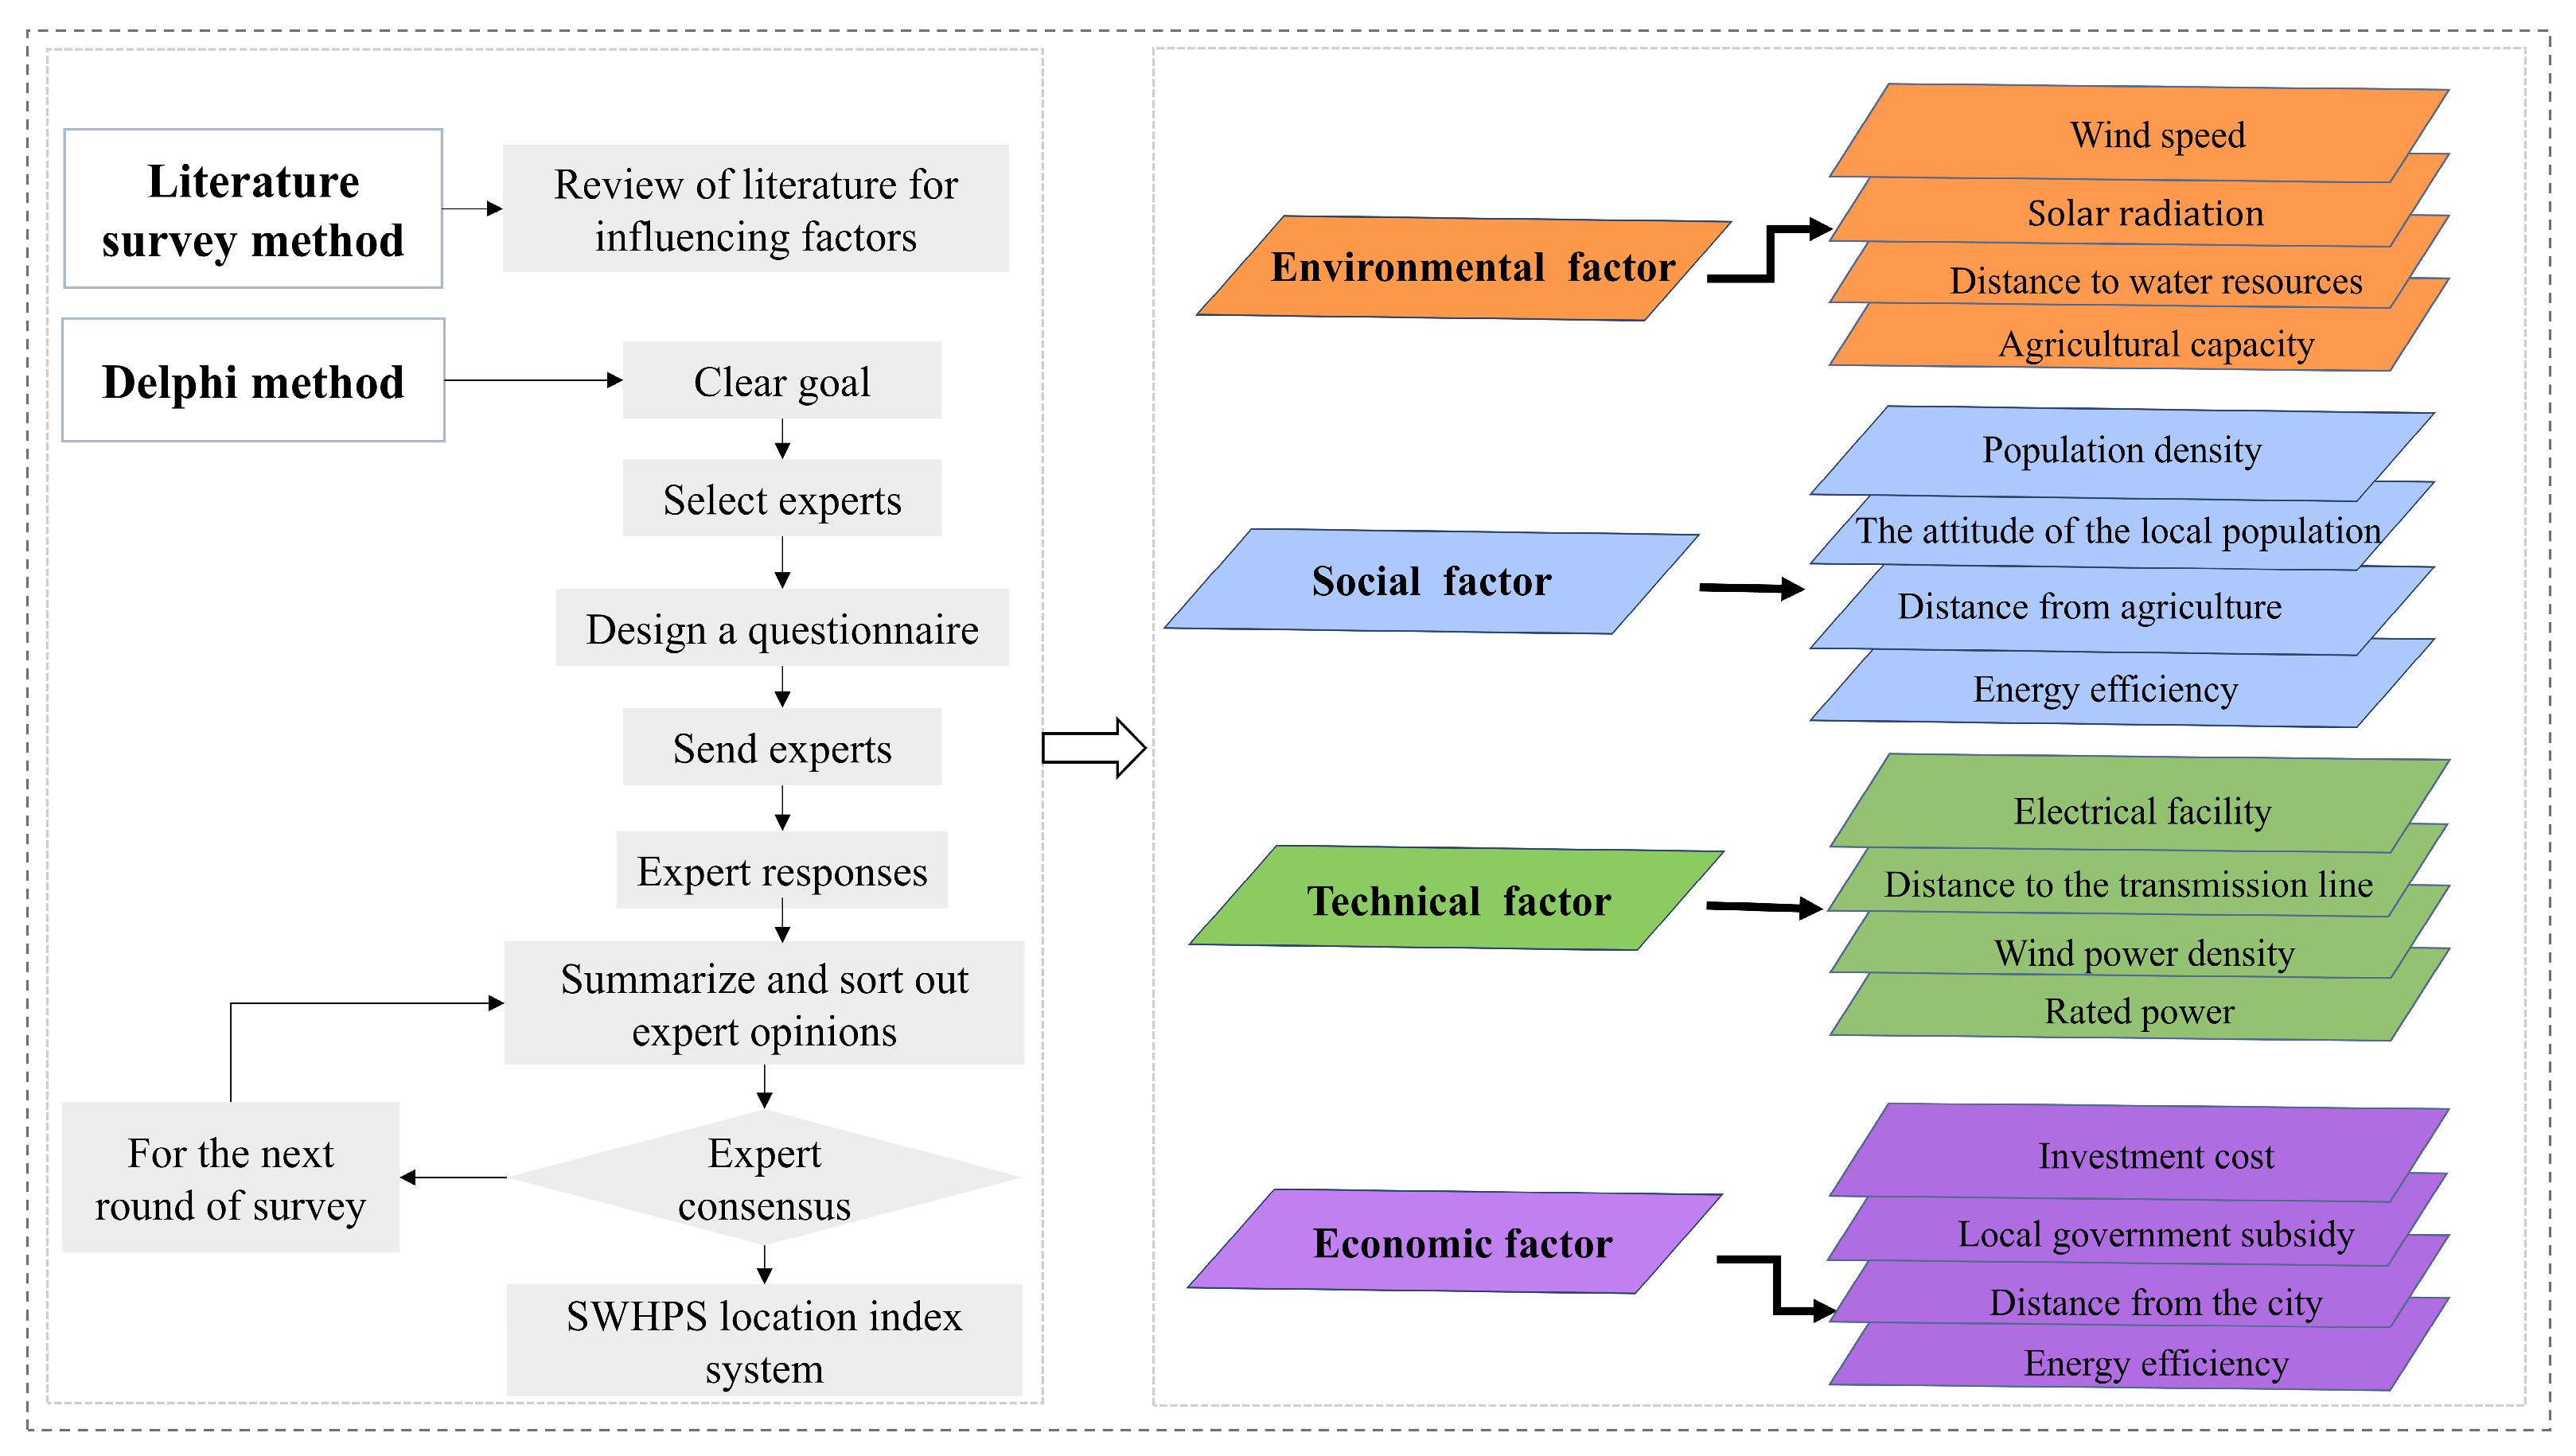
3. Establishment of an Evaluation Criteria System
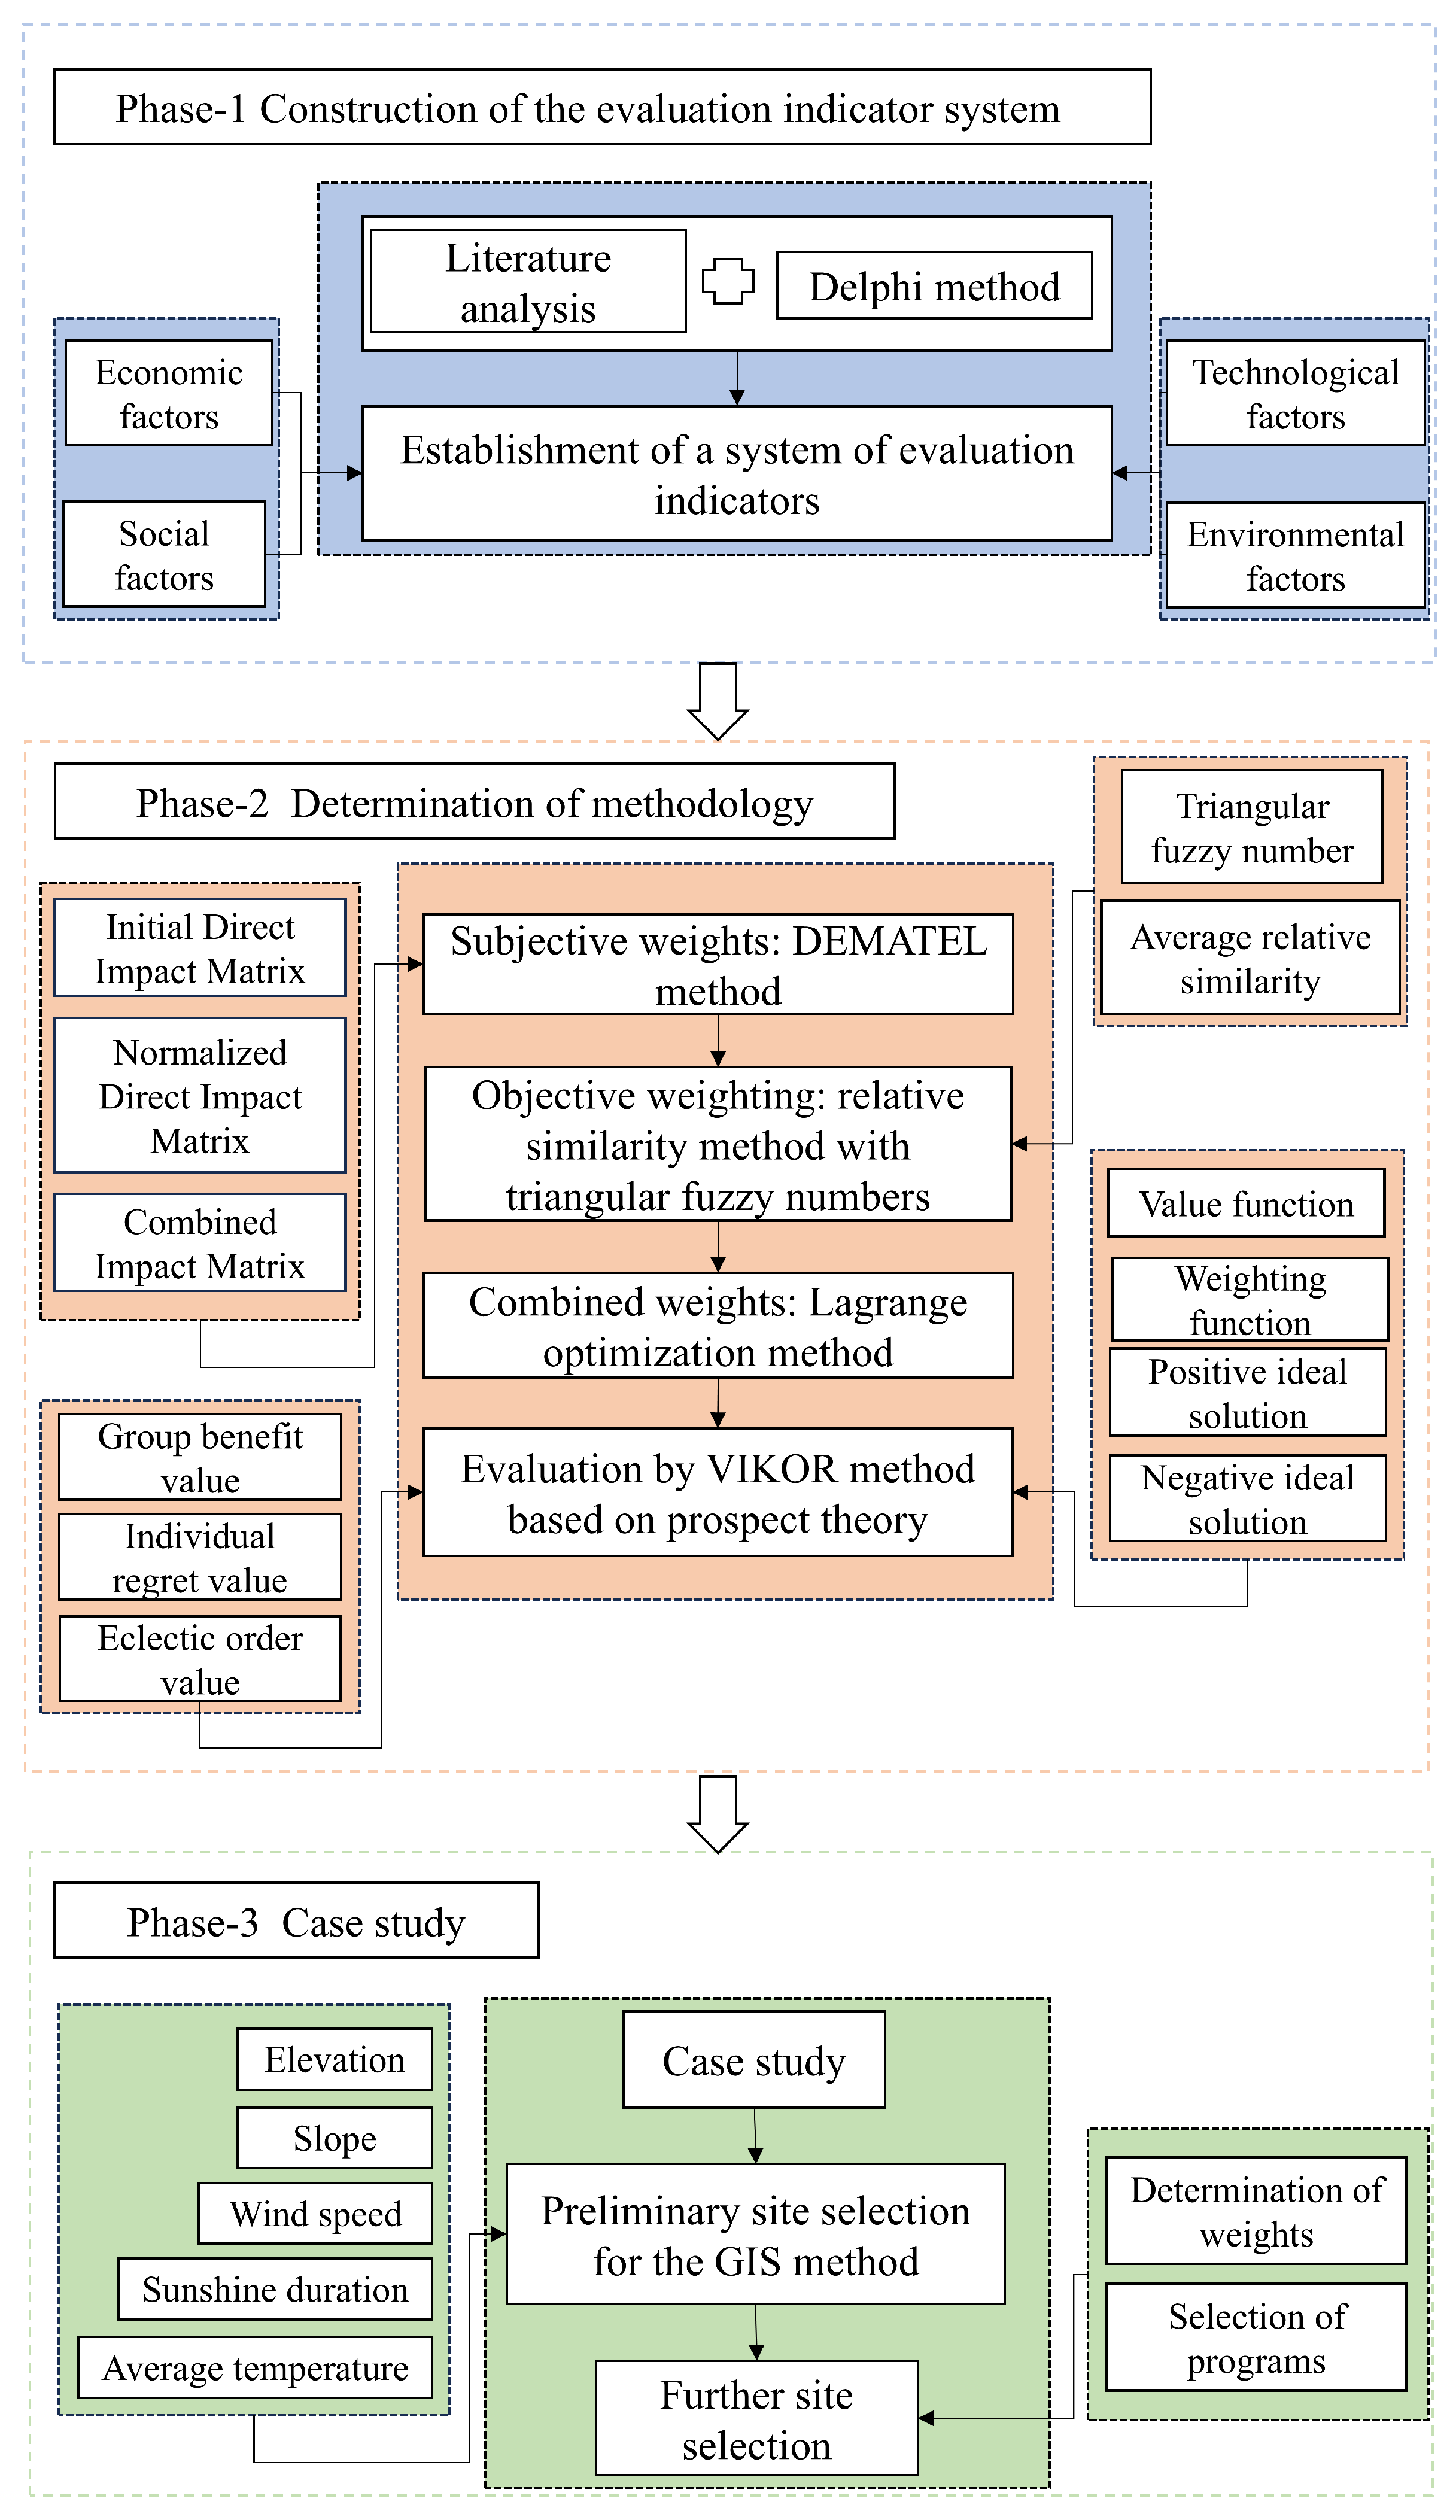
4. Materials and Methods
4.1. Determining the Weight of Evaluation Indices
4.1.1. Determining Subjective Weight Using the DEMATEL Approach
4.1.2. Knowledge Base of Relative Similarity Based on TFNs
- Model building
- 2.
- Calculation of the relative similarity of TFNs
4.1.3. Objective Weight Calculation Based on the Relative Similarity of TFNs
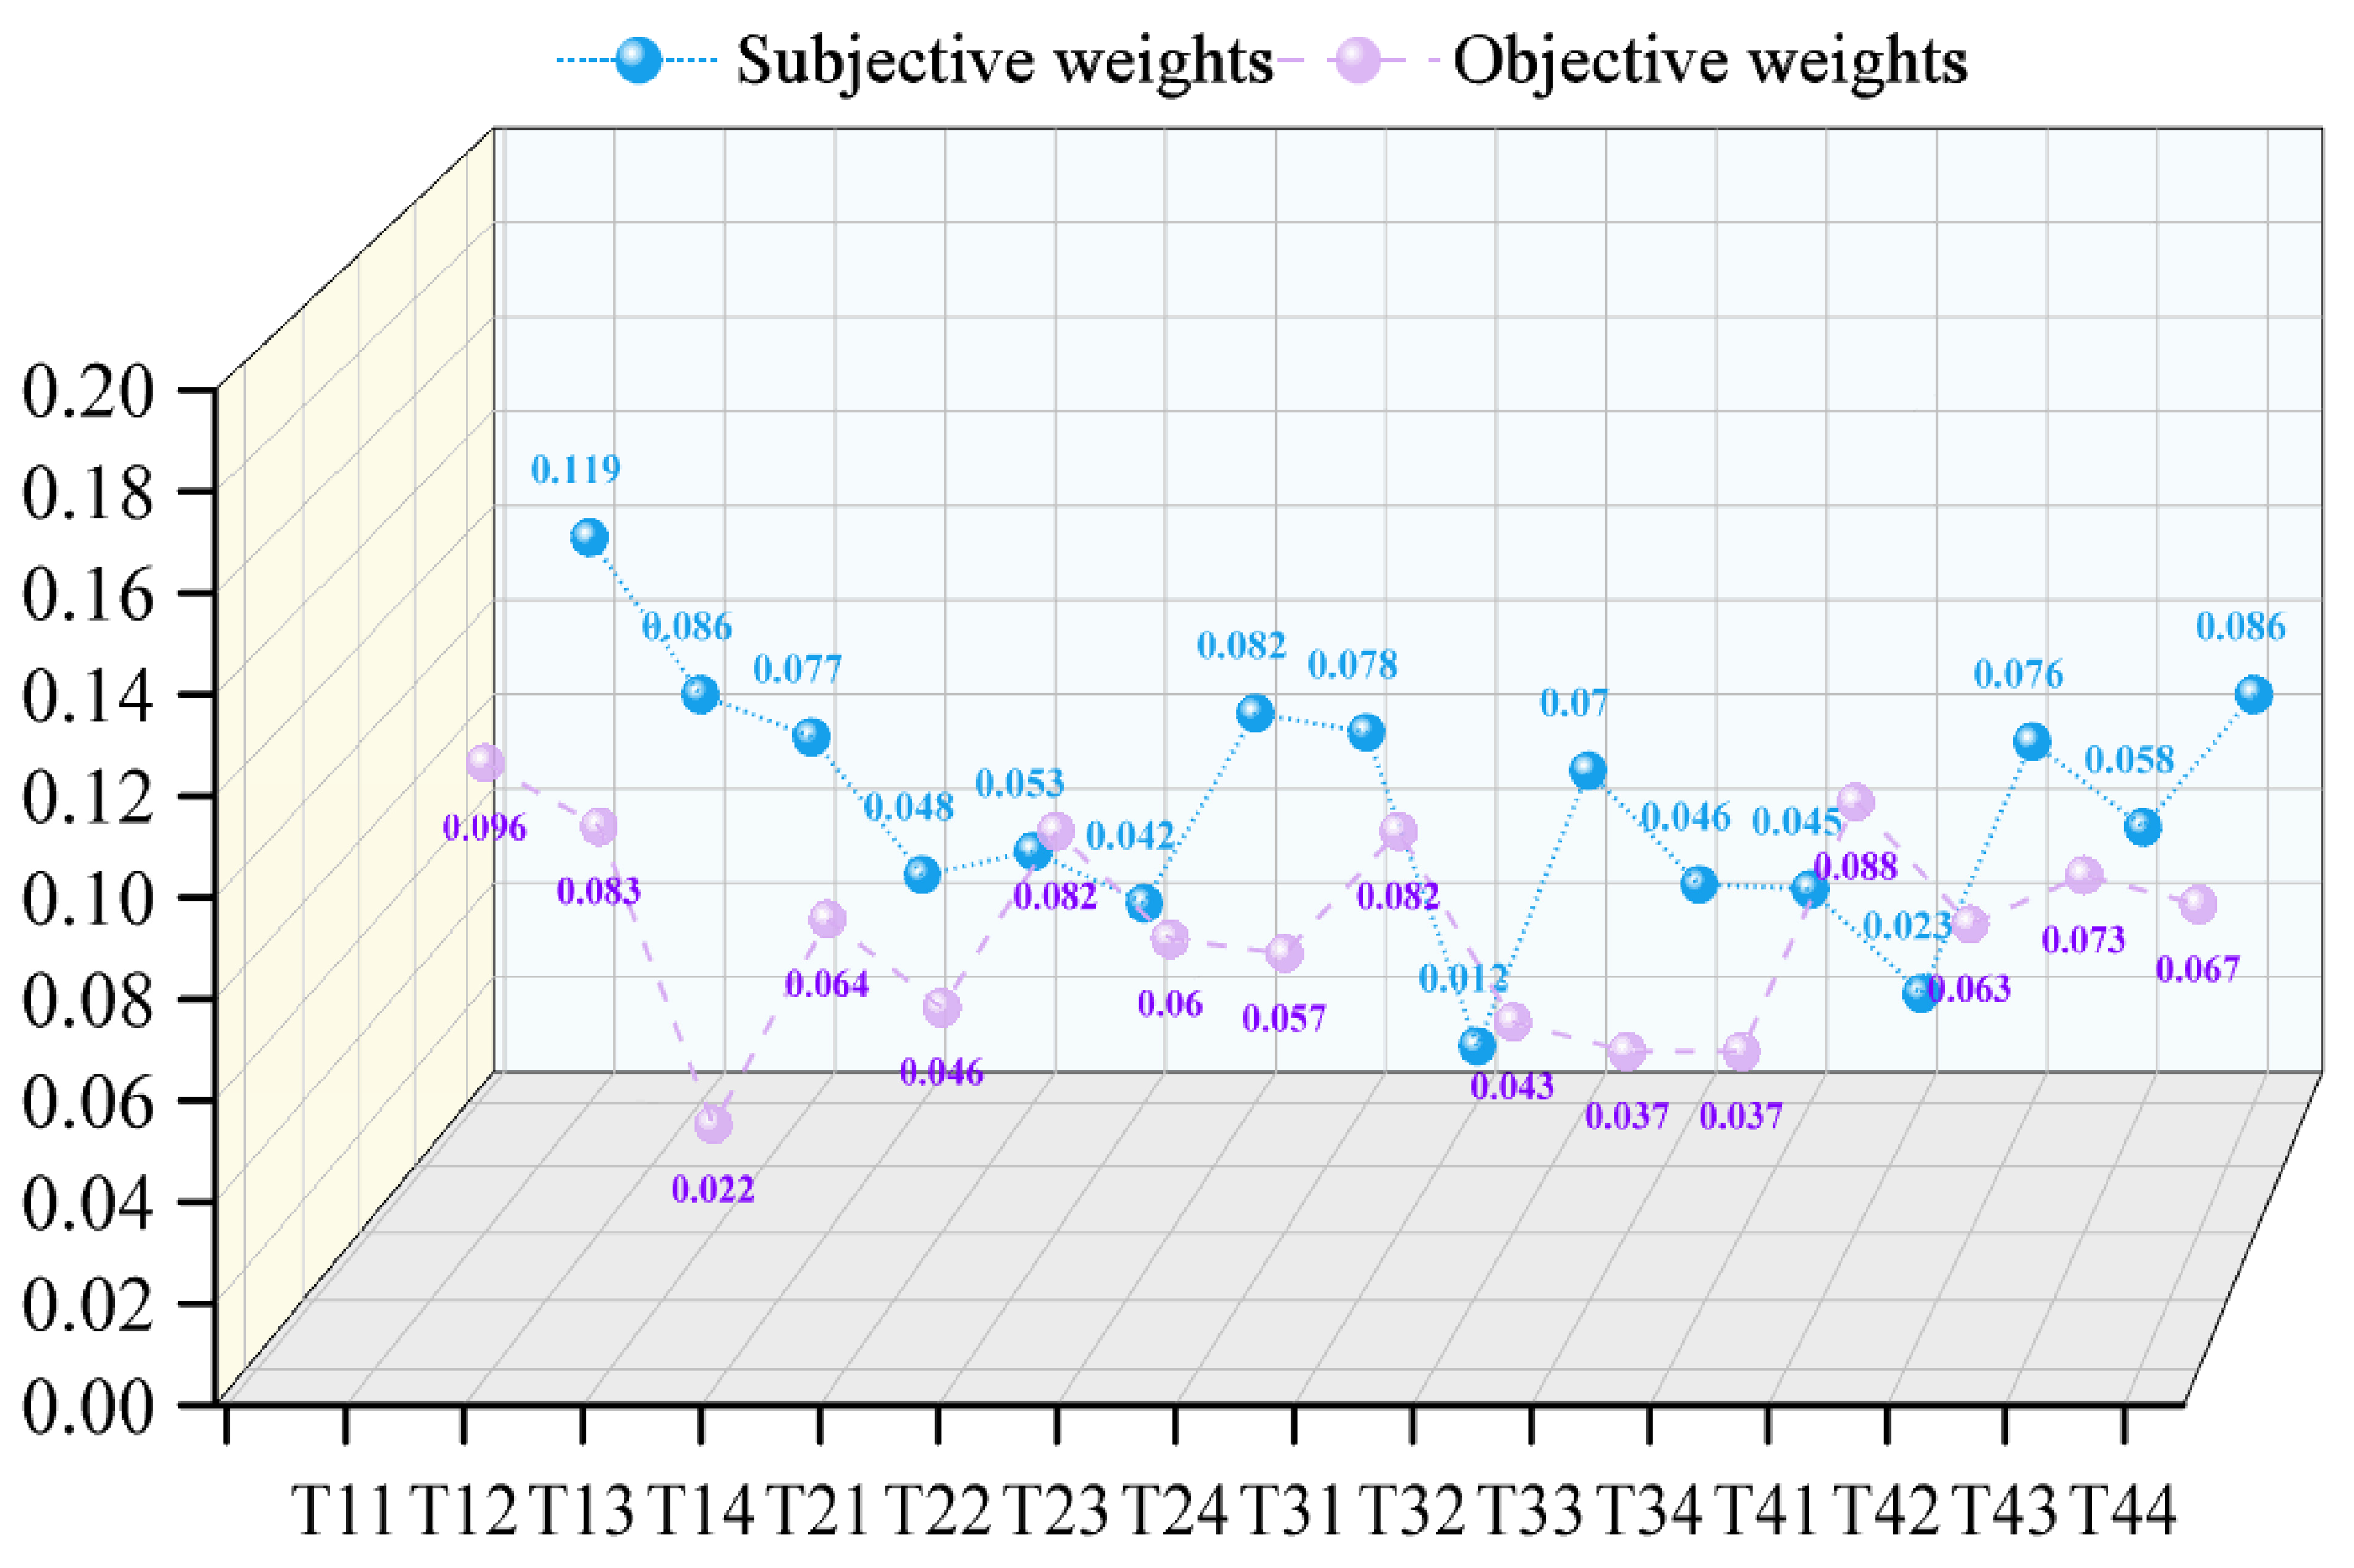
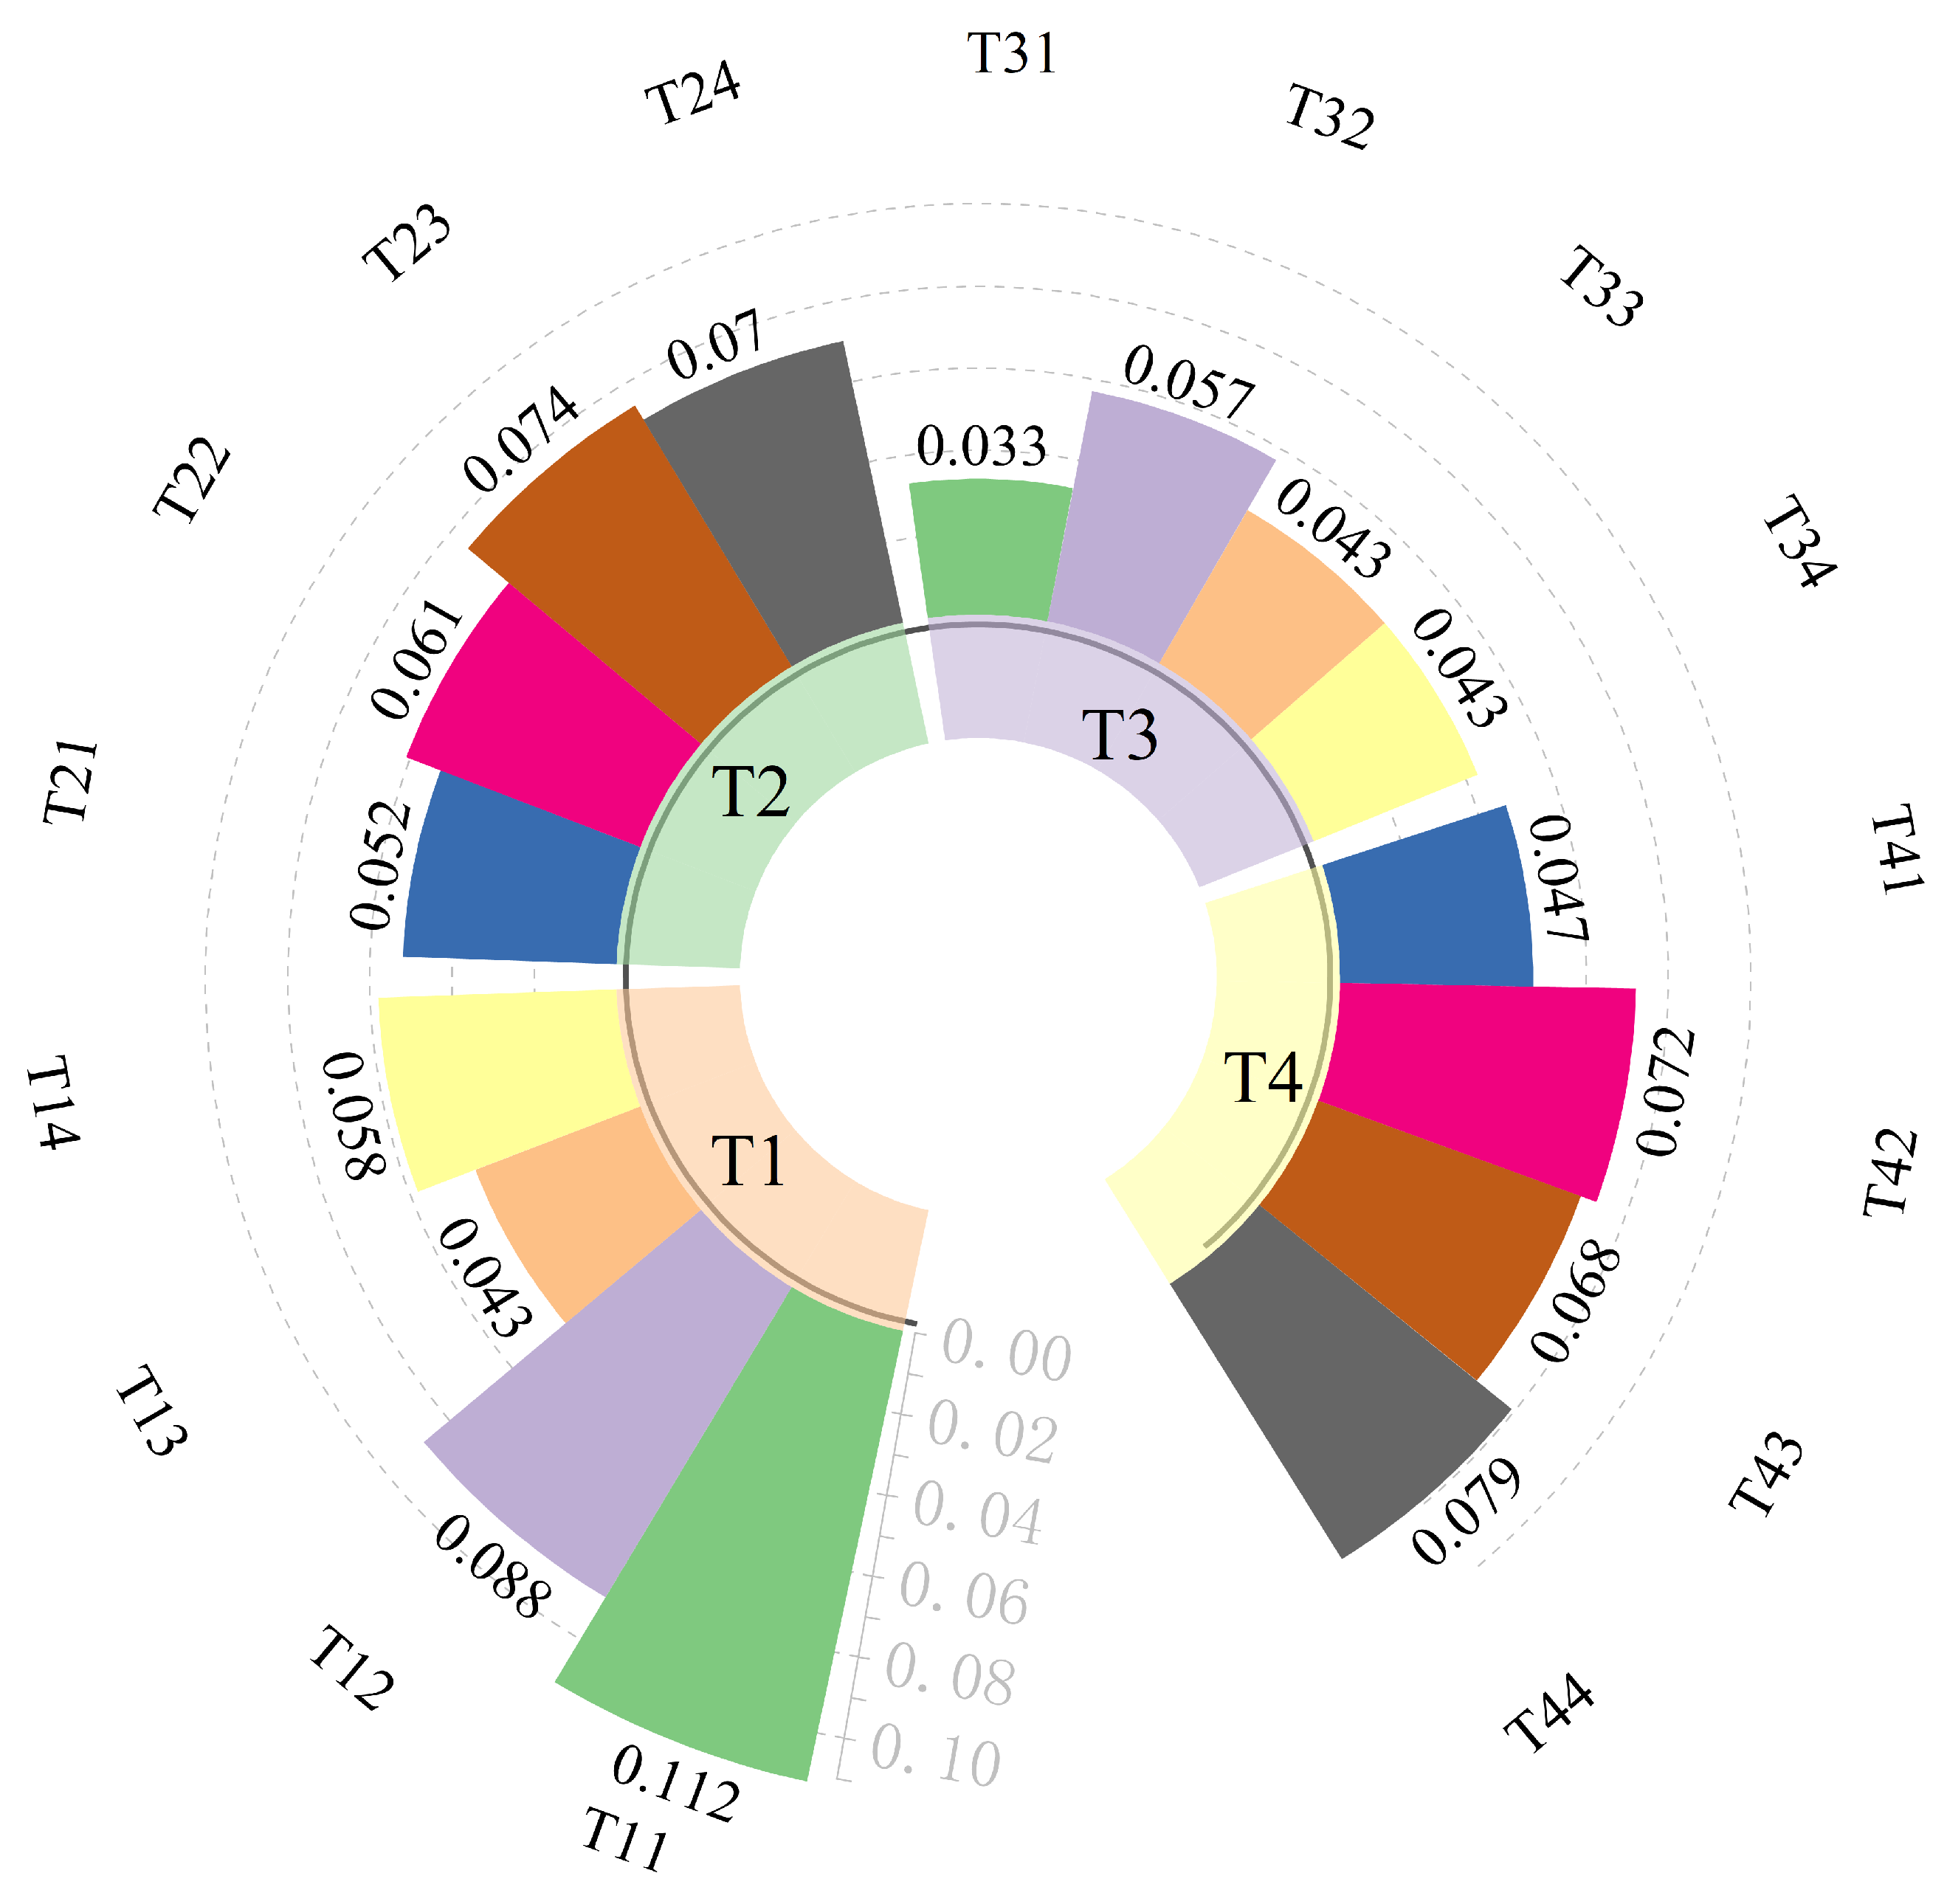
4.1.4. Calculating the Combination Weights
4.2. Prospect Theory-Based VIKOR Approach Decision Model
4.2.1. Prospect Theory
4.2.2. VIKOR Method
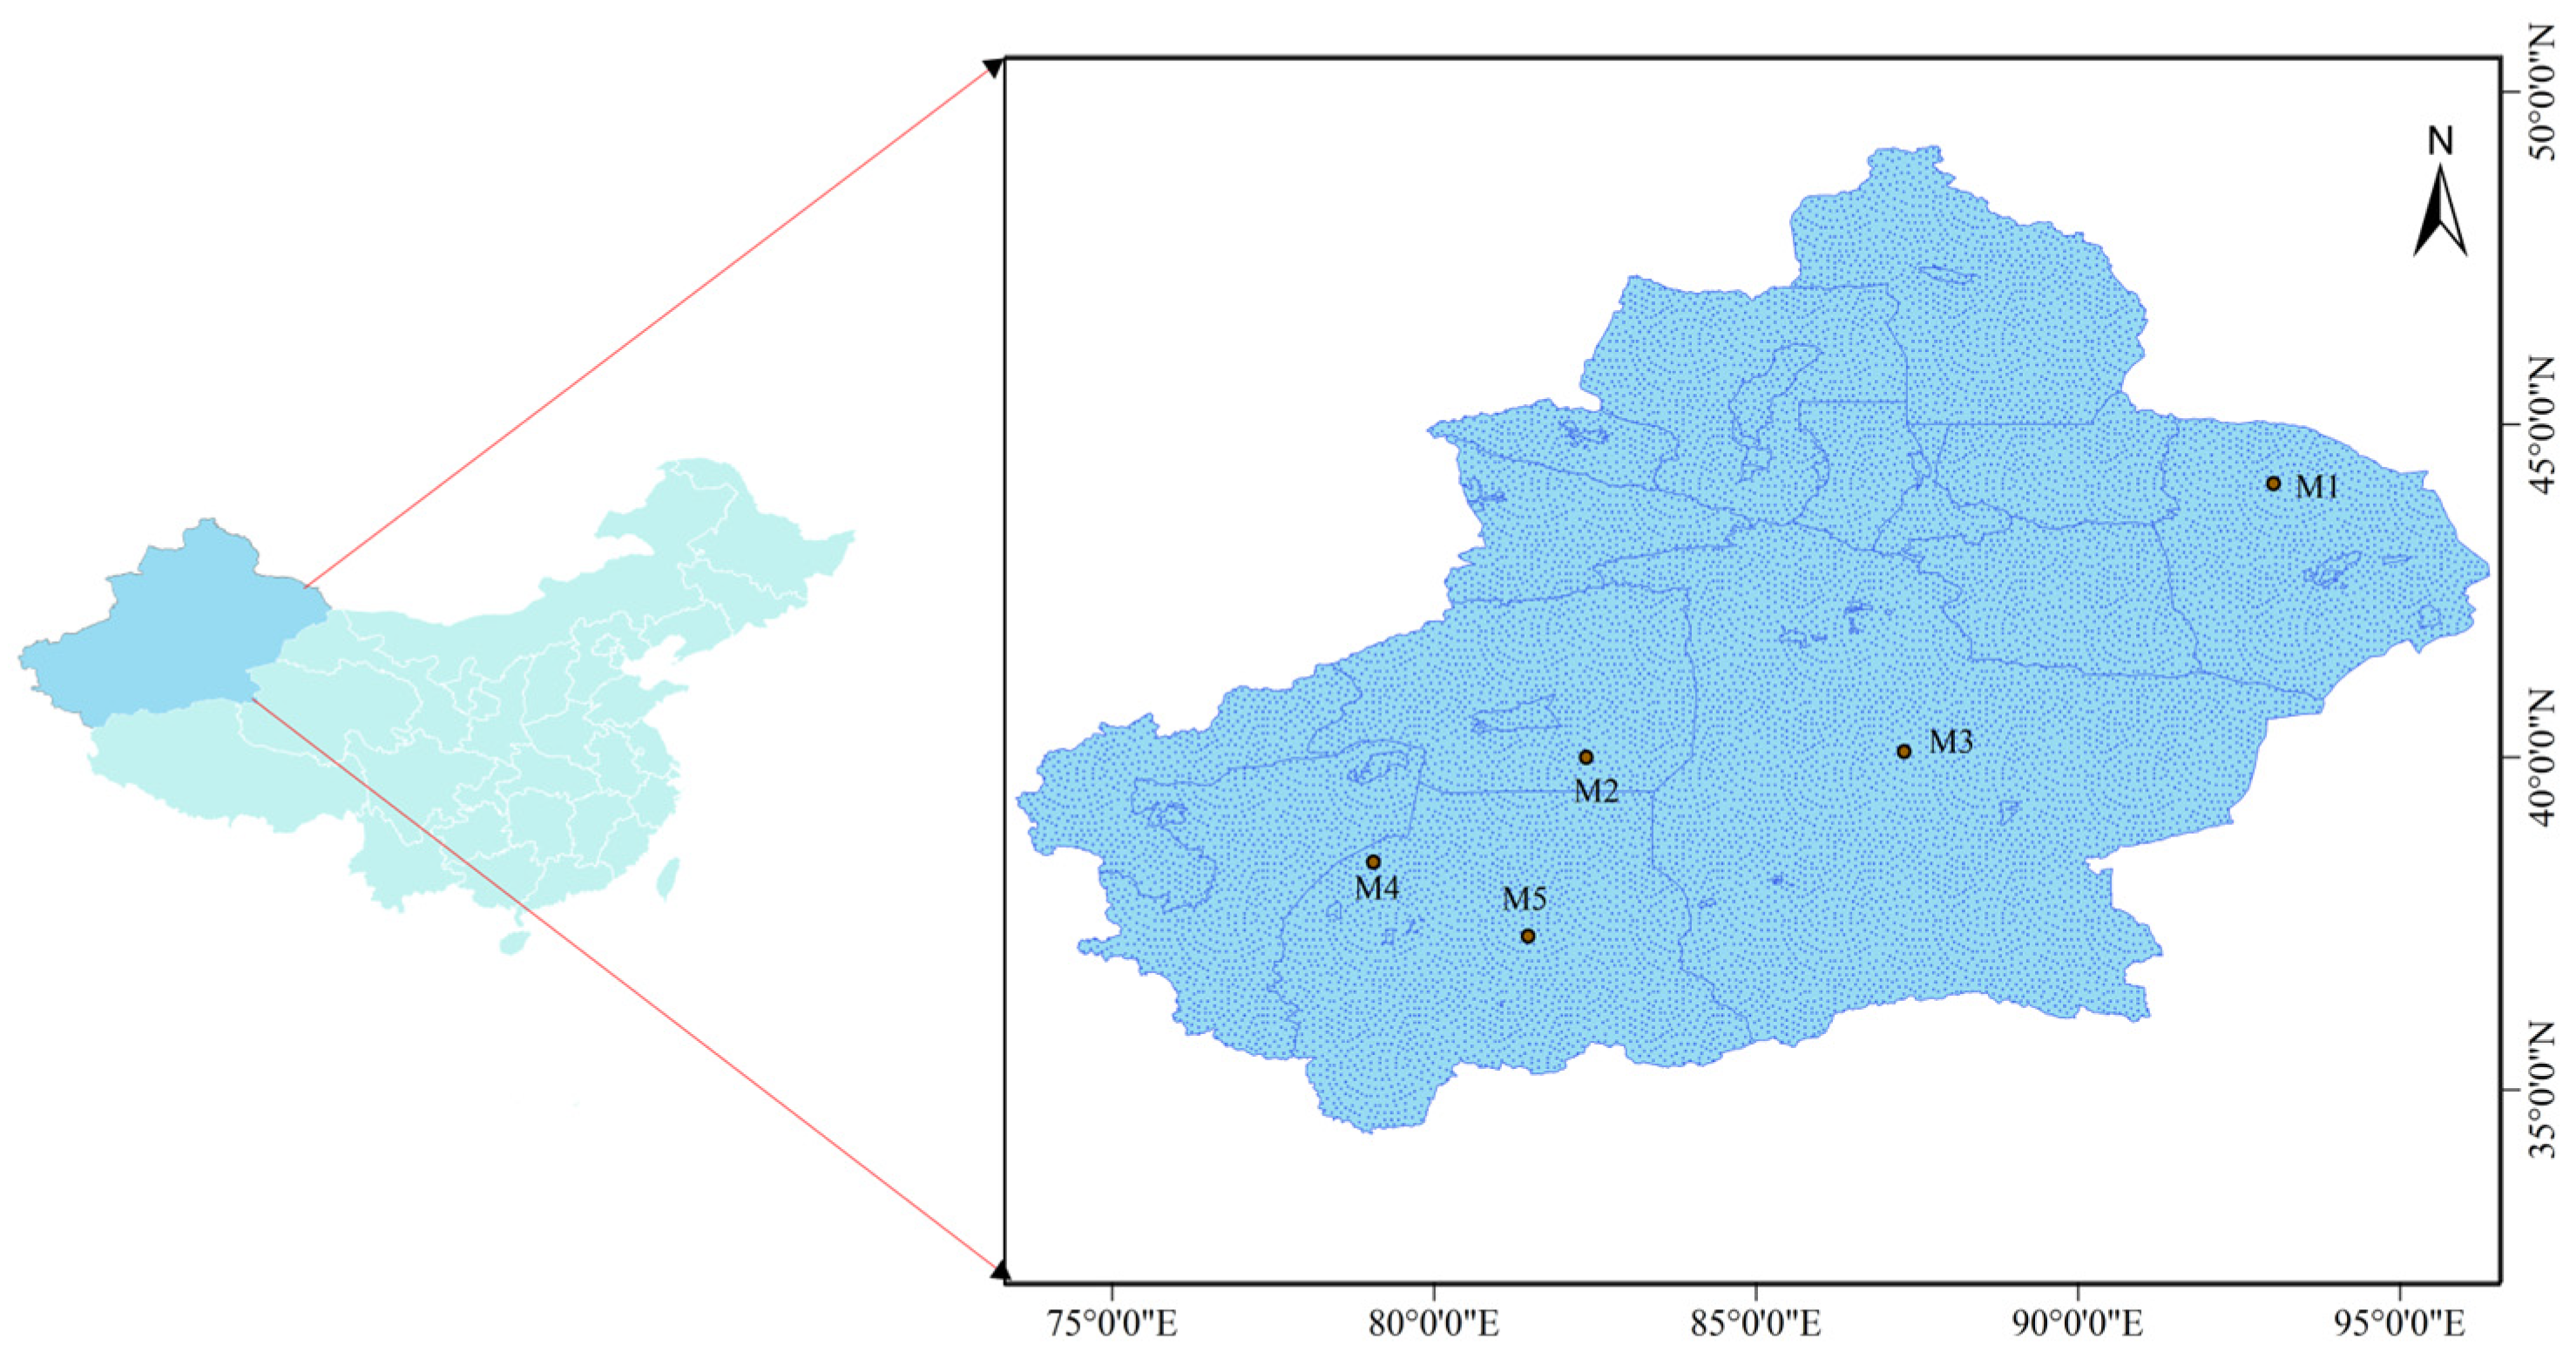
5. Case Study
5.1. Background of the Case
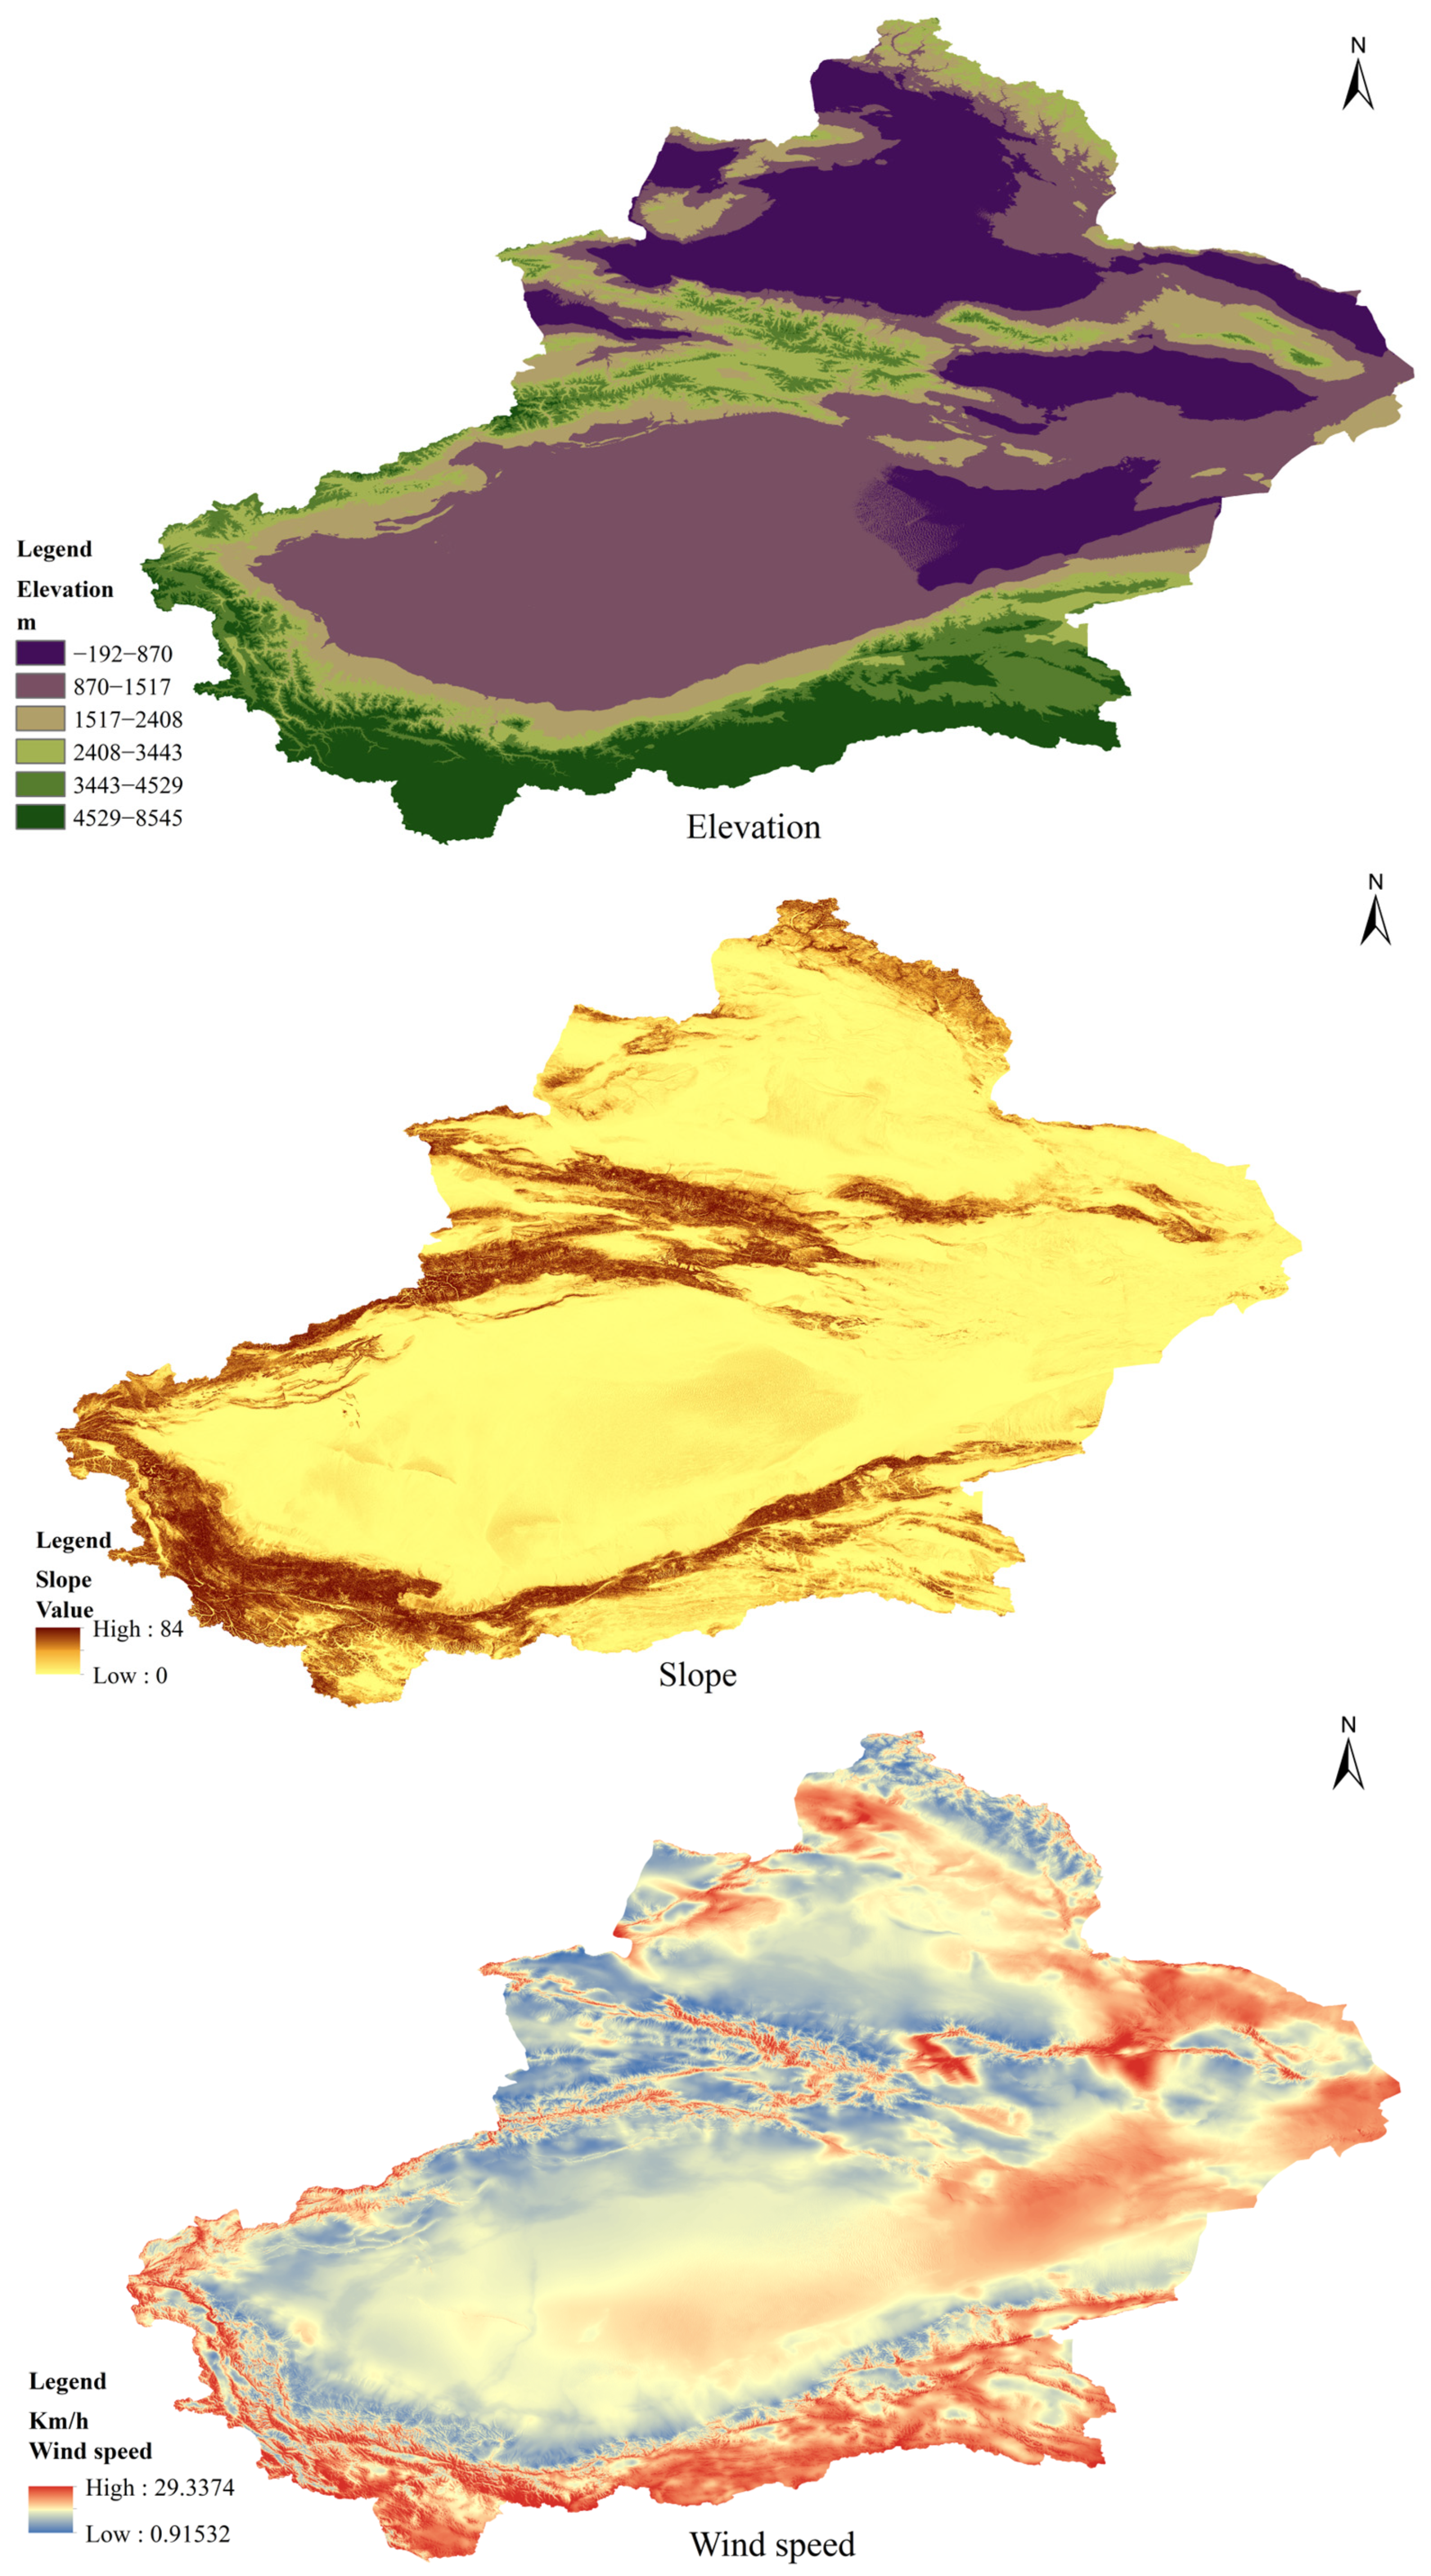
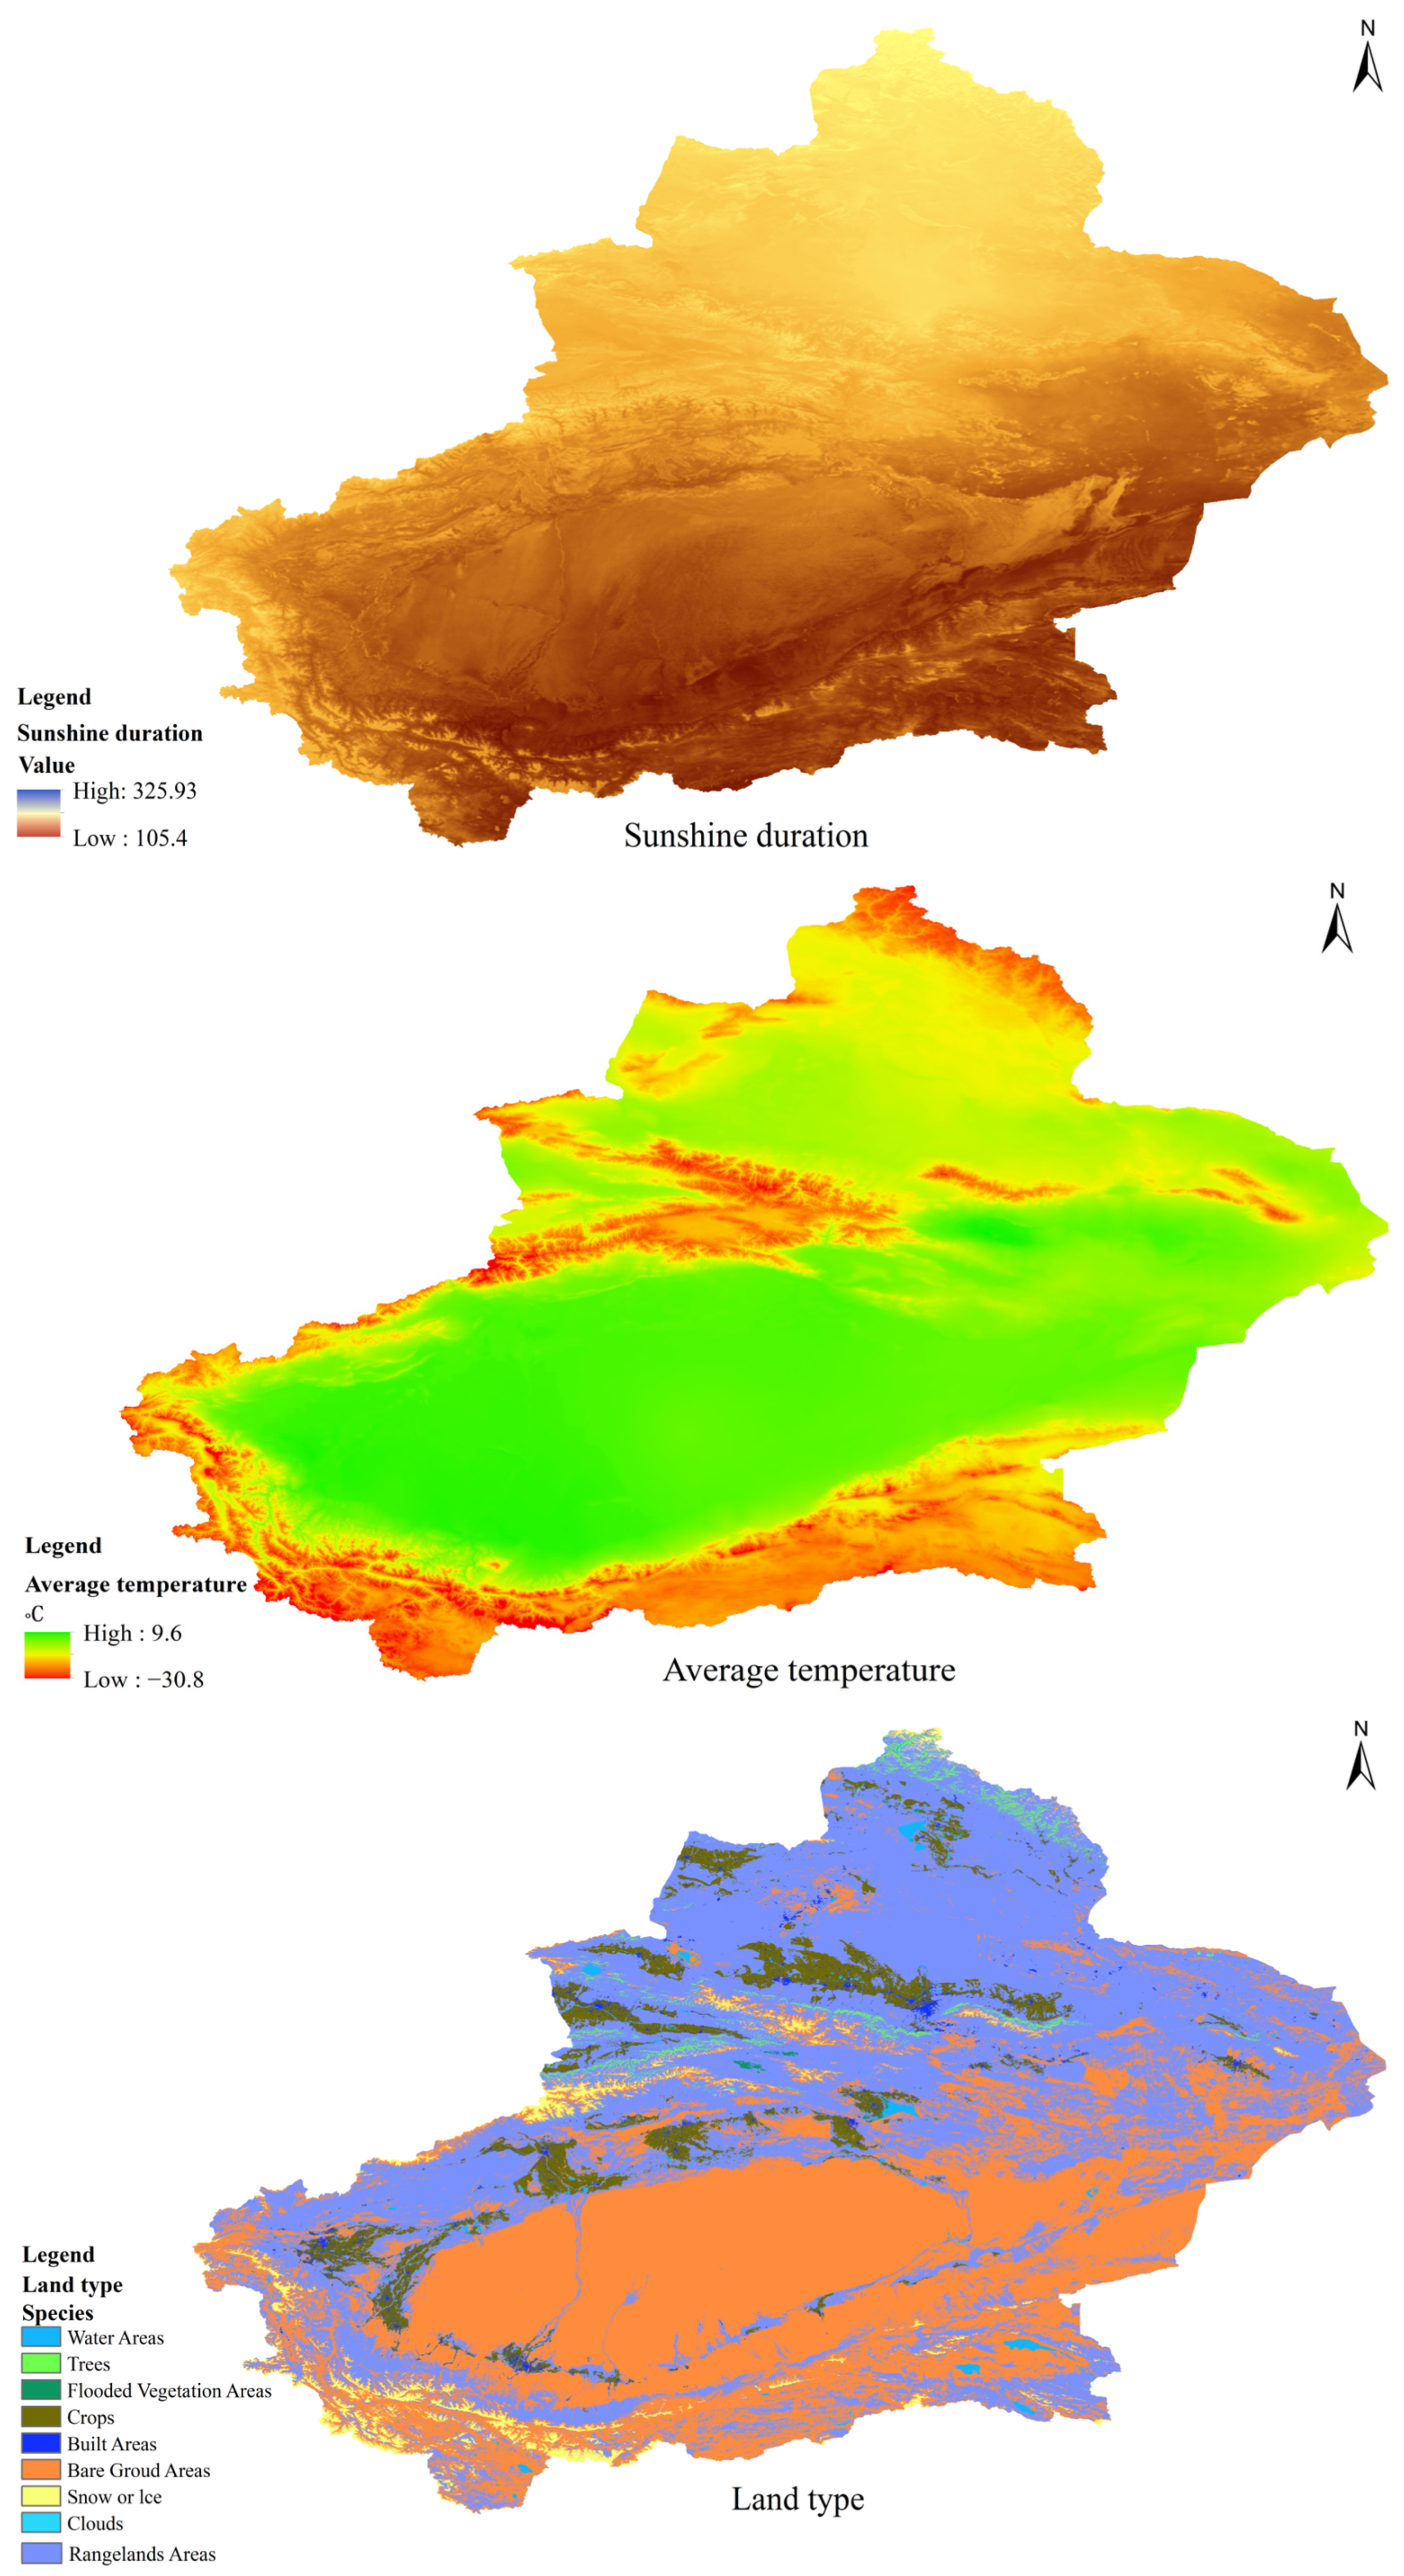
5.2. Phase I: Determining the Preliminary Site of a SWHESP Using GIS
5.3. Stage II: Further Site Selection
5.3.1. Determination of Weights
5.3.2. Program Selection
5.4. Analysis of Results
6. Further Analysis and Discussion
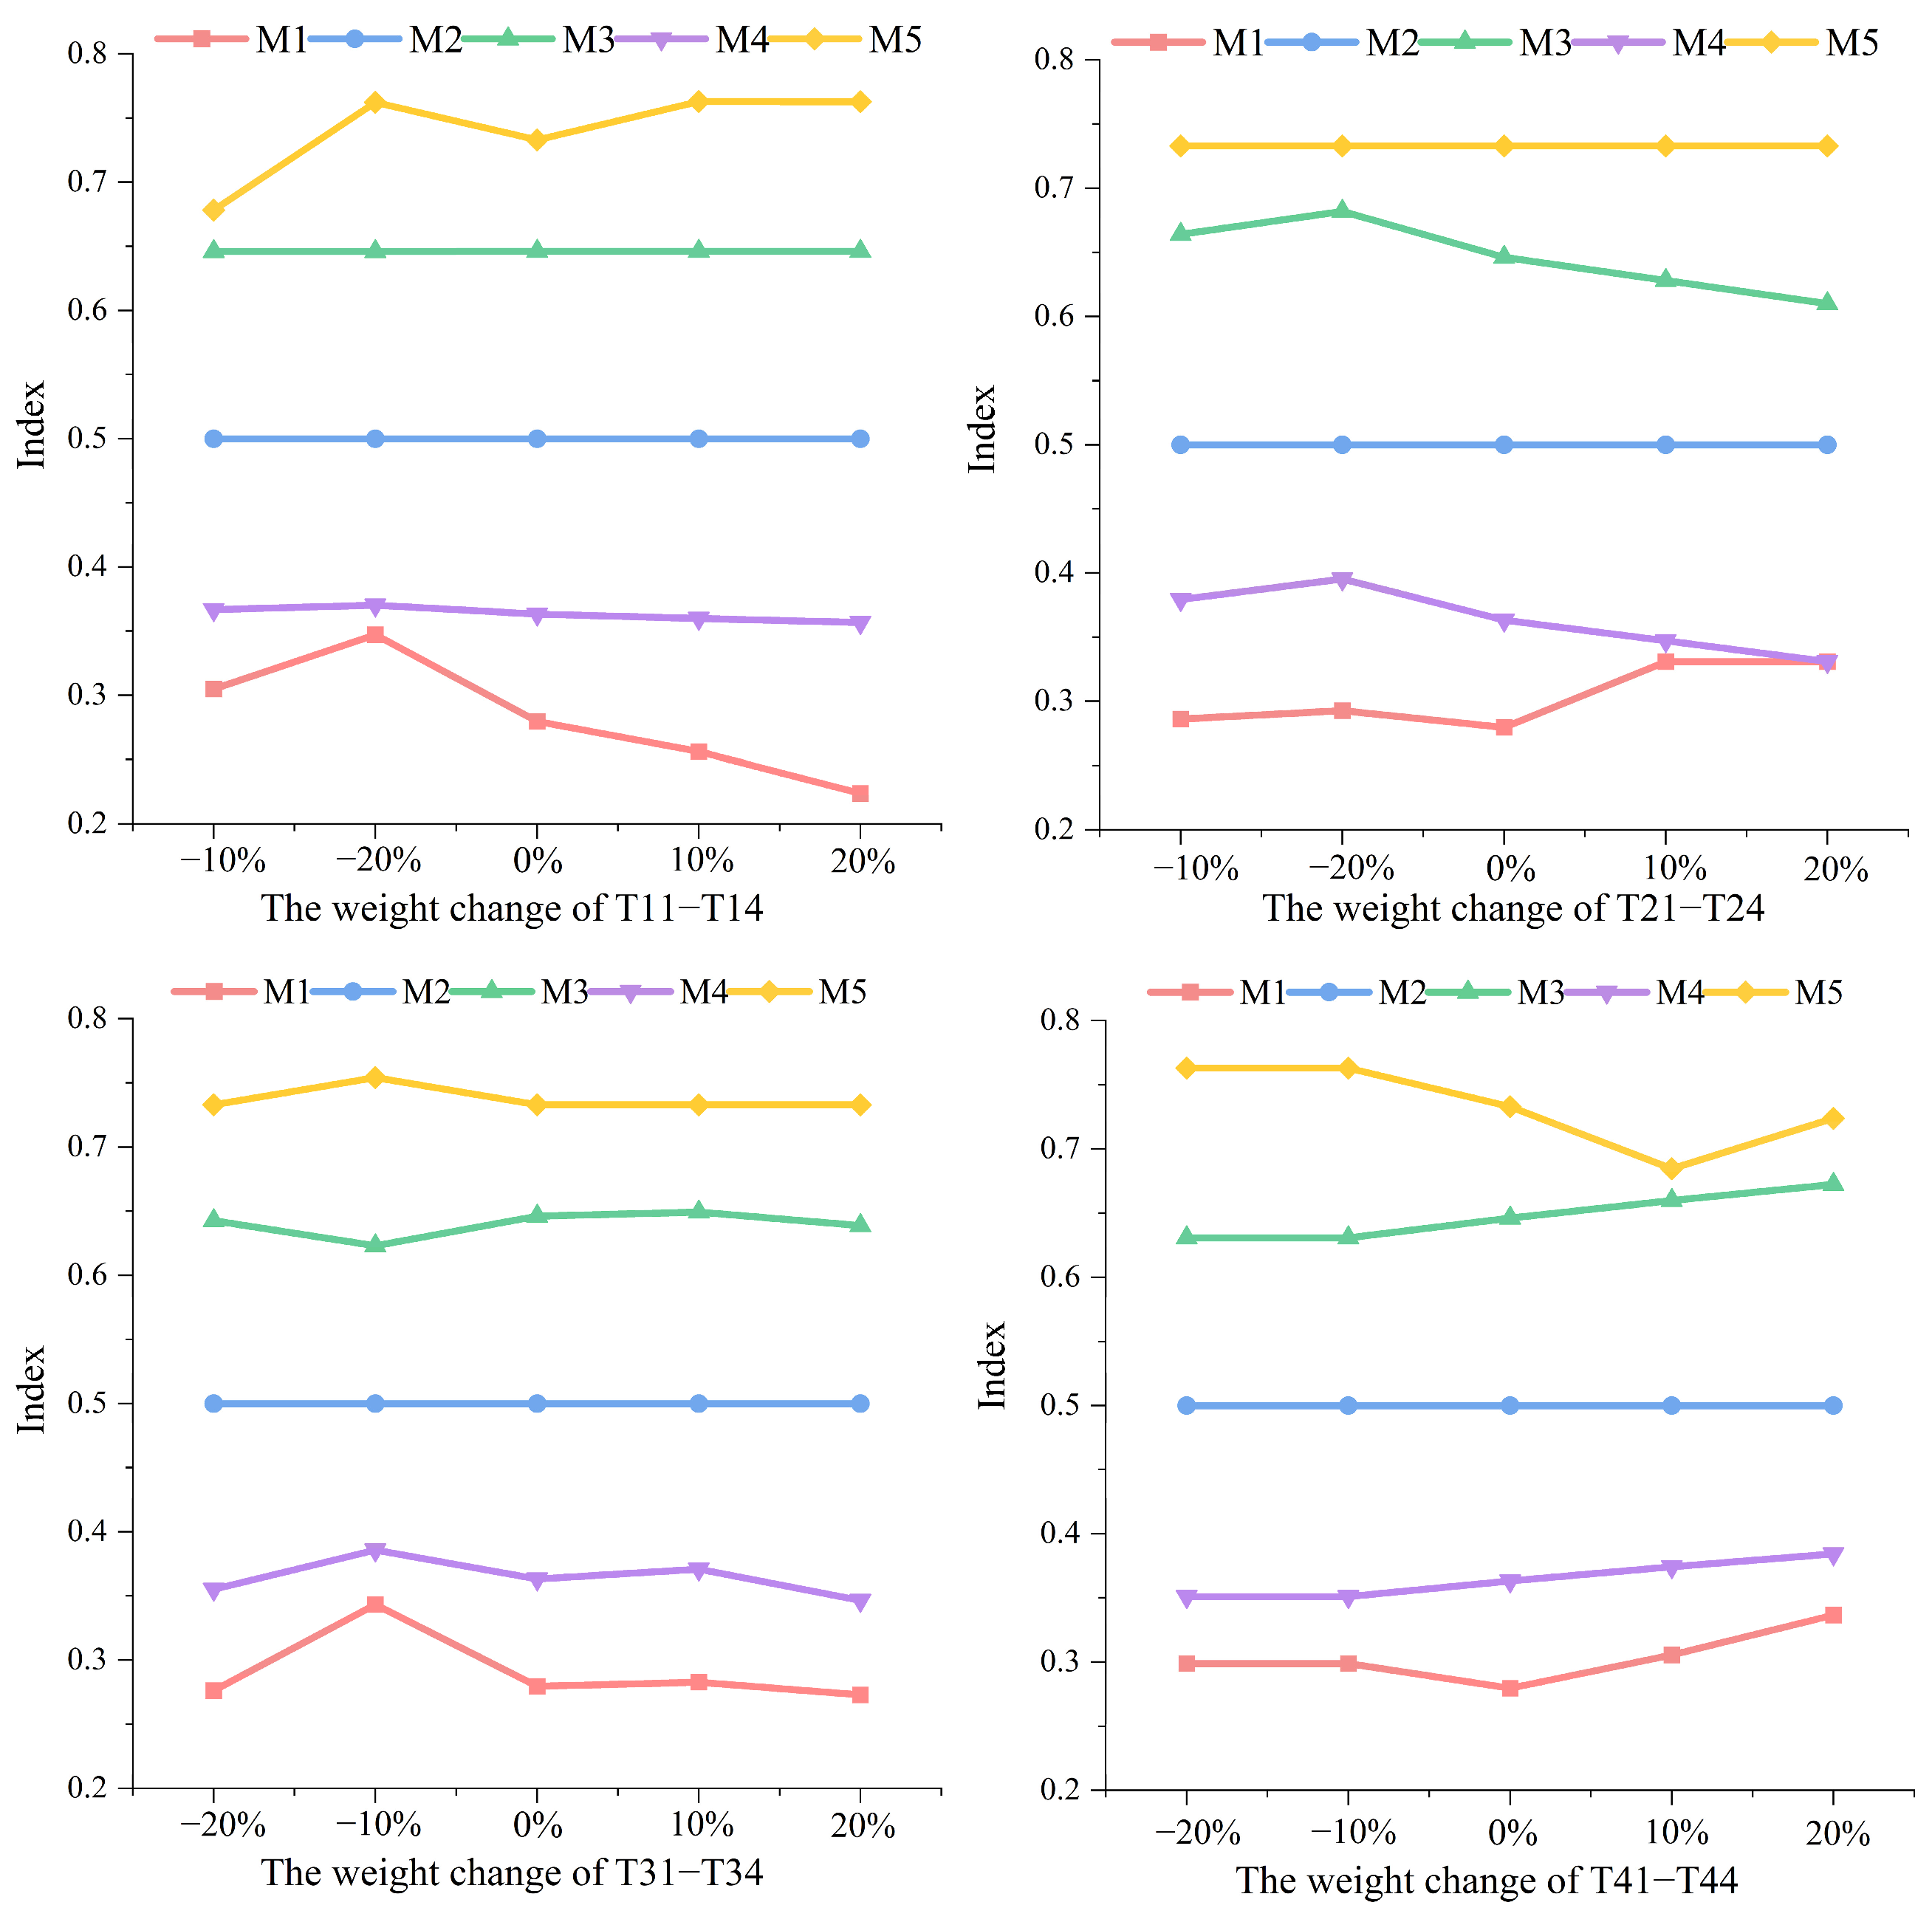
6.1. Sensitivity Analysis
6.1.1. Change in Weights
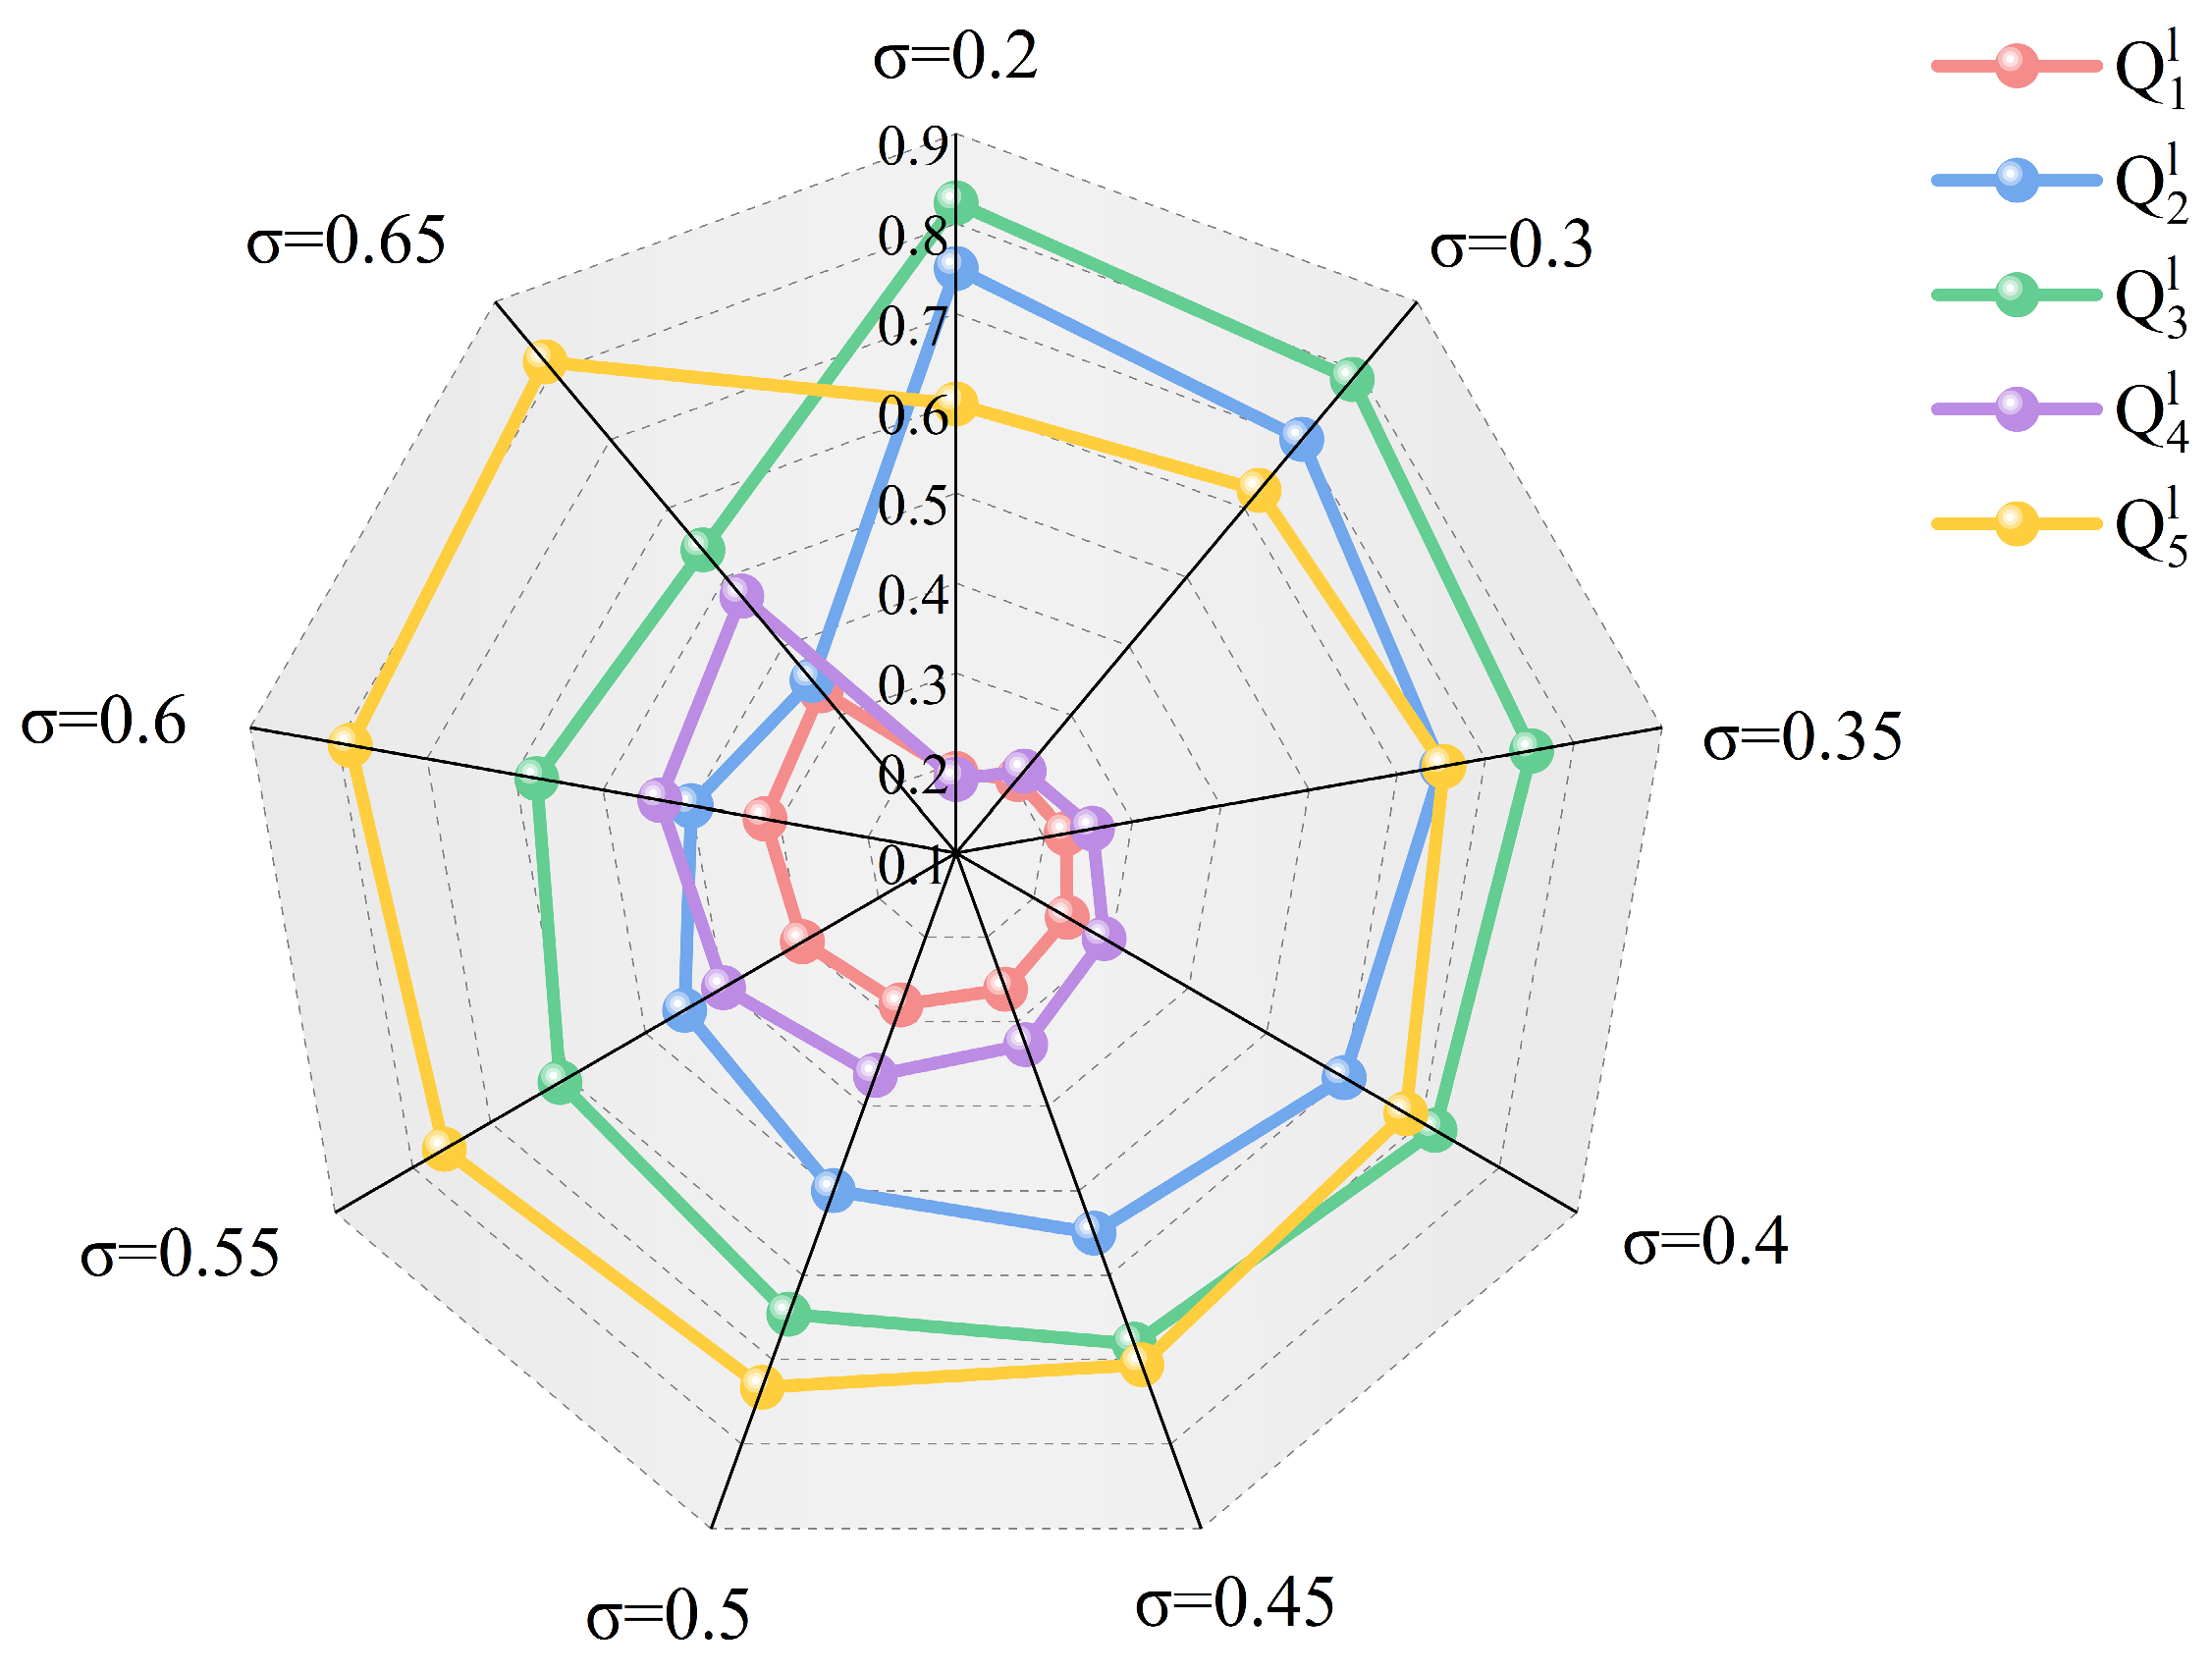
6.1.2. Sensitivity Analysis for Compromise Factor
6.1.3. Sensitivity Analysis for Expert Inputs
6.1.4. Sensitivity Analysis for TFNs
6.2. Comparative Analysis
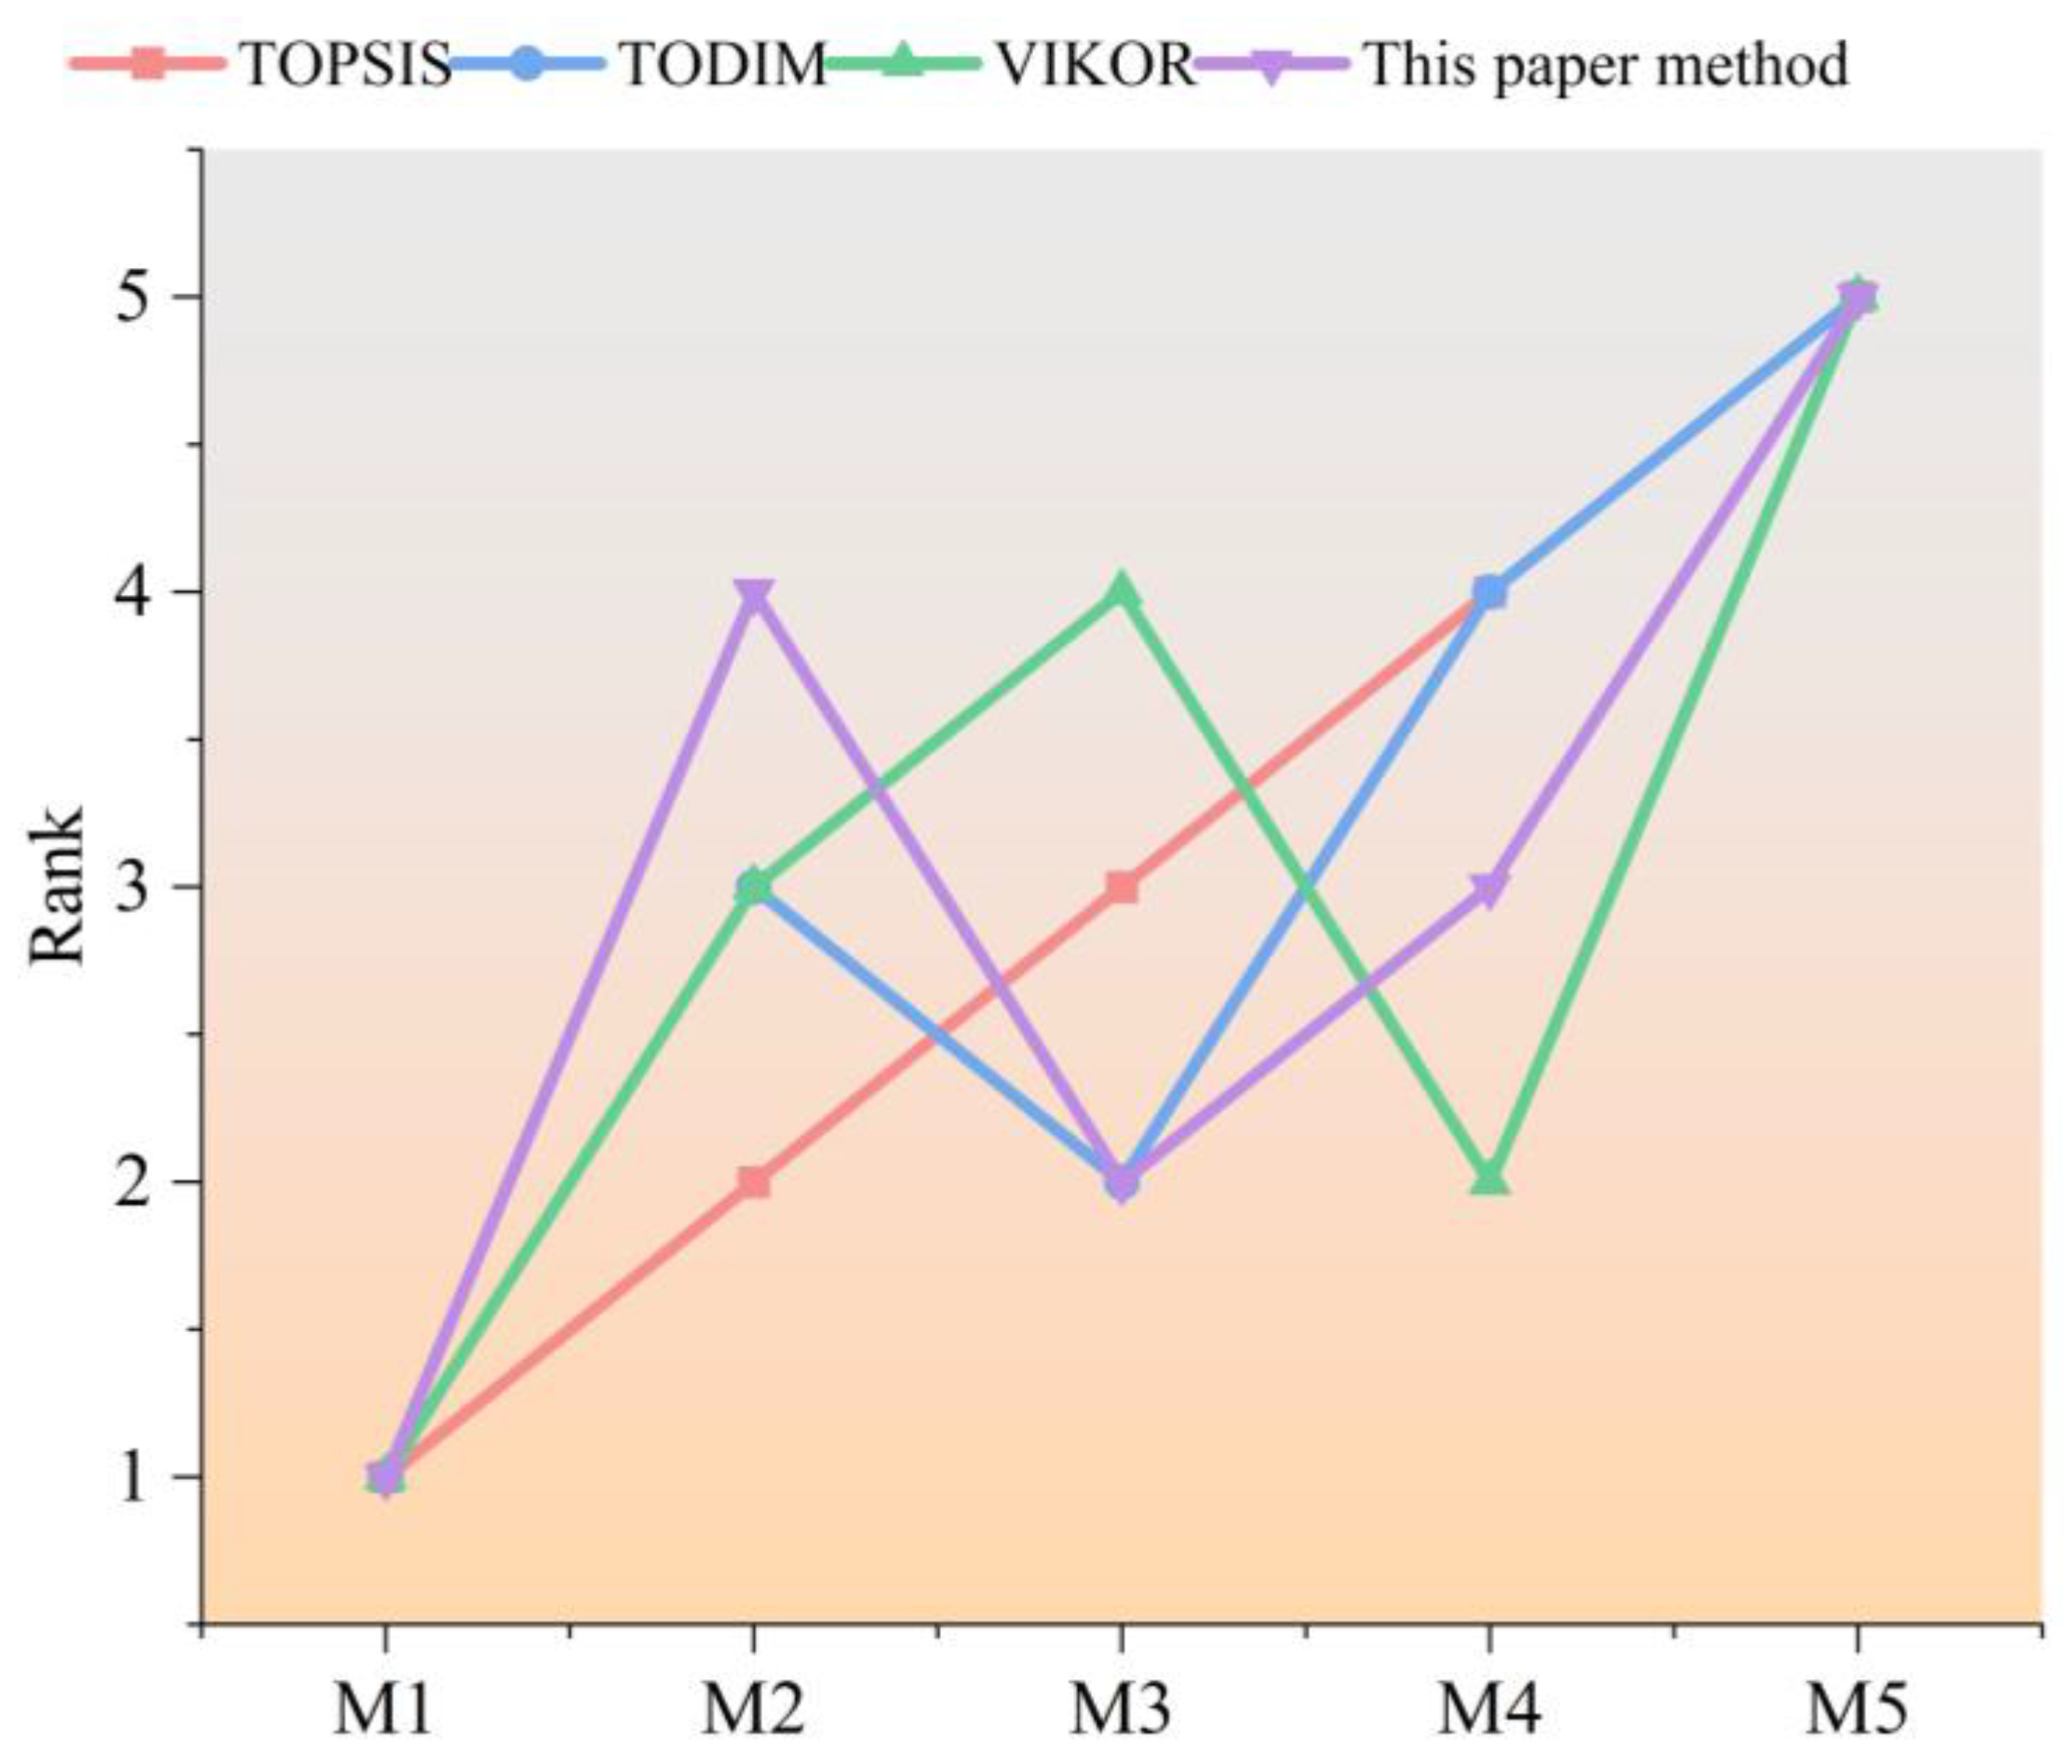
6.2.1. Comparative Analysis of MCDM Methods
6.2.2. Comparative Analysis of Entropy Weighting and Linear Weighting Methods
7. Conclusions
- To develop the SWHESP site selection assessment index system, this research innovatively combines the Delphi method with a literature survey, resulting in a more comprehensive evaluation system. Compared to conventional single-method approaches, this combined approach enhances decision-making robustness.
- Considering the inherent ambiguity of the site selection problem, the integration of TFNs with the DEMATEL method improves weight distribution, making it more reasonable and enhancing the reliability of decision-making.
- This paper is the first to address the SWHESP site selection problem using the VIKOR method combined with prospect theory. This method considers the DM’s behavior under risk. It also uses GIS, which helps handle spatial data. The method uses double screening to solve complex, multidimensional decision-making problems more easily.
- The comprehensive consideration of factors in the siting of energy storage power plants improves the site selection process and provides a critical reference for countries transitioning to clean energy.
- Wind speed and solar radiation are crucial factors for energy efficiency in SWHESP siting. Optimized levels of these variables lead to higher energy output compared to traditional siting methods.
- In addition to environmental factors, financial, ecological, and social aspects influence SWHESP siting. Government and local community support are essential for achieving sustainable development and balancing benefits across all areas.
- The site selection evaluation method has been optimized. This work extends the weighting approach to the fuzzy domain, utilizes GIS and the VIKOR method based on prospect theory, improving decision-making accuracy compared to traditional methods.
- Using China as an example, along with real cases, makes the research in this paper more convincing.
- First, the limitations of the survey may result in a selection of one-sided evaluation indicator elements. Future development should focus on refining the method for screening indicator factors to cover all relevant aspects.
- Due to varying conditions, the approach in this paper only applies to some energy storage power stations. Future work should explore methods that fit more types of power stations.
- Most of the data was collected from experts during the data collection phase, and future research should consider more quantitative analysis techniques.
Author Contributions
Funding
Data Availability Statement
Conflicts of Interest
References
- Wang, J.; Wu, J.; Zhou, Y.; Shao, Z. Capacity adequacy assessment and pricing for power systems with high penetration of renewable energy. ApEn 2025, 396, 126209. [Google Scholar] [CrossRef]
- Long, Y.; Chen, Y.; Xu, C.; Li, Z.; Zhu, J.; Liu, Y.; Wang, H. Enhancing and stabilizing effects of low-carbon models on the synergistic benefits of wind and solar energy: Evidence from China. ApEn 2025, 395, 126212. [Google Scholar] [CrossRef]
- Monforti, F.; Huld, T.; Bódis, K.; Vitali, L.; D’Isidoro, M.; Lacal-Arántegui, R. Assessing complementarity of wind and solar resources for energy production in Italy. A Monte Carlo approach. Renew. Energy 2014, 63, 576–586. [Google Scholar] [CrossRef]
- Aly, A.; Jensen, S.S.; Pedersen, A.B. Solar power potential of Tanzania: Identifying CSP and PV hot spots through a GIS multicriteria decision making analysis. Renew. Energy 2017, 113, 159–175. [Google Scholar] [CrossRef]
- Teng, X.Y.; Zhuang, W.W.; Liu, F.P.; Chiu, Y.H. China’s energy efficiency improvement on account of the development of wind and solar power: Applying a dynamic non-radial directional distance function. Int. J. Hydrogen Energy 2022, 47, 35914–35927. [Google Scholar] [CrossRef]
- Li, X.; Hu, C.; Luo, S.; Lu, H.; Piao, Z.; Jing, L. Distributed Hybrid-Triggered Observer-Based Secondary Control of Multi-Bus DC Microgrids Over Directed Networks. IEEE Trans. Circuits Syst. I Regul. Pap. 2025, 72, 2467–2480. [Google Scholar] [CrossRef]
- Ammari, C.; Belatrache, D.; Touhami, B.; Makhloufi, S. Sizing, optimization, control and energy management of hybrid renewable energy system—A review. Energy Built Environ. 2022, 3, 399–411. [Google Scholar] [CrossRef]
- Nahak, N.; Satapathy, S. A coordinated modelling and control of modified pumped storage governor with unified power flow controller to damp low frequency oscillations in power system for stochastic renewable penetrations. Eng. Appl. Artif. Intell. 2024, 130, 107702. [Google Scholar] [CrossRef]
- Yuan, H.; Hao, Y.; Xin, H.; Huang, L.; Zhou, Y.; Wang, X.; Chen, C.; Lu, G.; Qu, L.; Wu, D. Placing Storage Energies for Enhancing Small-Signal Stability of Converter-Based-Renewable Systems. ITIA 2025, 61, 5684–5698. [Google Scholar] [CrossRef]
- Başeğmez, M. Strategic multi-criteria framework for nuclear plant siting: Integrating AHP, EWM, and Game Theory with GIS. Prog. Nucl. Energy 2025, 188, 105897. [Google Scholar] [CrossRef]
- Wu, T.-H.; Chen, C.-Y.; Huang, S.-W.; Yu, T.-T. An integrated decision framework for landfill mining site selection using GIS, multi-criteria analysis, and optimization models. Socioecon. Plann. Sci. 2025, 99, 102220. [Google Scholar] [CrossRef]
- Tong, D.; Farnham, D.J.; Duan, L.; Zhang, Q.; Lewis, N.S.; Caldeira, K.; Davis, S.J. Geophysical constraints on the reliability of solar and wind power worldwide. Nat. Commun. 2021, 12, 6146. [Google Scholar] [CrossRef] [PubMed]
- Liu, Z.; Cui, Y.; Wang, J.; Yue, C.; Agbodjan, Y.S.; Yang, Y. Multi-objective optimization of multi-energy complementary integrated energy systems considering load prediction and renewable energy production uncertainties. Energy 2022, 254, 124399. [Google Scholar] [CrossRef]
- Gao, Y.; Meng, Y.; Dong, G.; Ma, S.; Miao, C.; Xiao, J.; Mao, S.; Shao, L. The wind-solar hybrid energy could serve as a stable power source at multiple time scale in China mainland. Energy 2024, 305, 132294. [Google Scholar] [CrossRef]
- Cappellen, L.V.; Deckers, M.; Engelen, K.; Yordanov, G.H.; Daenen, M. Simulation-Based Investigation of Wind Turbine Induced Shadow Flicker on IGBT Reliability and Energy Yield in Solar Converters in Hybrid Wind-Solar Systems. IEEE Access 2025, 13, 48746–48757. [Google Scholar] [CrossRef]
- Mahmoud, M.; Ramadan, M.; Olabi, A.G.; Pullen, K.; Naher, S. A review of mechanical energy storage systems combined with wind and solar applications. Energy Convers. Manag. 2020, 210, 112670. [Google Scholar] [CrossRef]
- Papadopoulou, A.G.; Vasileiou, G.; Flamos, A. A Comparison of Dispatchable RES Technoeconomics: Is There a Niche for Concentrated Solar Power? Energies 2020, 13, 4768. [Google Scholar] [CrossRef]
- Nair, D.R.; Nair, M.; Thakur, T. A Smart Microgrid System with Artificial Intelligence for Power-Sharing and Power Quality Improvement. Energies 2022, 15, 5409. [Google Scholar] [CrossRef]
- Zhao, A.P.; Li, S.; Xie, D.; Wang, Y.; Li, Z.; Hu, P.J.-H.; Zhang, Q. Hydrogen as the nexus of future sustainable transport and energy systems. Nat. Rev. Electr. Eng. 2025, 2, 447–466. [Google Scholar] [CrossRef]
- Kaan, M.; Bozkurt, A.; Genç, M.S.; Genç, G. Optimization study of an energy storage system supplied solar and wind energy sources for green campus. Process Saf. Environ. Prot. 2024, 190, 863–872. [Google Scholar] [CrossRef]
- Şahin, G.; Koç, A.; van Sark, W. Multi-criteria decision making for solar power-Wind power plant site selection using a GIS-intuitionistic fuzzy-based approach with an application in the Netherlands. Energy Strategy Rev. 2024, 51, 101307. [Google Scholar] [CrossRef]
- Qasimi, A.B.; Al Bahir, A.; Toomanian, A.; Issazade, V.; Samany, N.N. Optimising Wind Energy Site Selection in Northern Afghanistan: An Integrated Analysis of Analytical Hierarchy Process and Genetic Algorithms. IET Renew. Power Gener. 2025, 19, e70032. [Google Scholar] [CrossRef]
- Gupta, M.N.; Gautam, A.; Yadav, H.K.; Gupta, P.; Sarkar, J.; Sarkar, A. Assessment of wind energy potential and turbine selection for sustainable energy generation in India. Energy Sources Part A Recovery Util. Environ. Eff. 2025, 47, 12090–12111. [Google Scholar] [CrossRef]
- Wang, C.N.; Dang, T.T.; Nguyen, N.A.T. Location Optimization of Wind Plants Using DEA and Fuzzy Multi-Criteria Decision Making: A Case Study in Vietnam. IEEE Access 2021, 9, 116265–116285. [Google Scholar] [CrossRef]
- Jani, H.K.; Kachhwaha, S.S.; Nagababu, G.; Das, A. Hybrid wind–solar energy and resource simultaneity: An Indian case study for site selection and feasibility check. Energy Rep. 2022, 8, 593–598. [Google Scholar] [CrossRef]
- Doorga, J.R.S.; Hall, J.W.; Eyre, N. Geospatial multi-criteria analysis for identifying optimum wind and solar sites in Africa: Towards effective power sector decarbonization. Renew. Sust. Energy Rev. 2022, 158, 112107. [Google Scholar] [CrossRef]
- Asadi, M.; Pourhossein, K.; Noorollahi, Y.; Marzband, M.; Iglesias, G. A New Decision Framework for Hybrid Solar and Wind Power Plant Site Selection Using Linear Regression Modeling Based on GIS-AHP. Sustainability 2023, 15, 8359. [Google Scholar] [CrossRef]
- Wang, Y.; Gao, J.; Wei, L.; Wu, H.; Zhao, S. Geographic information system-based multi-criteria decision-making analysis for investment assessment of wind-photovoltaic-shared energy storage power stations: A case study of Shanxi Province. Environ. Sci. Pollut. Res. 2024, 31, 22604–22629. [Google Scholar] [CrossRef] [PubMed]
- Zhu, G.; Wang, W.; Zhu, W. Research on the Location and Capacity Determination Strategy of Off-Grid Wind–Solar Storage Charging Stations Based on Path Demand. Processes 2025, 13, 786. [Google Scholar] [CrossRef]
- Ho, L.W.; Lie, T.T.; Leong, P.T.; Clear, T. Developing offshore wind farm siting criteria by using an international Delphi method. Energy Policy 2018, 113, 53–67. [Google Scholar] [CrossRef]
- Unver, S.; Ergenc, I. Safety risk identification and prioritize of forest logging activities using analytic hierarchy process (AHP). Alex. Eng. J. 2021, 60, 1591–1599. [Google Scholar] [CrossRef]
- Caputo, A.C.; Federici, A.; Pelagagge, P.M.; Salini, P. Scenario Analysis of Offshore Wind-Power Systems under Uncertainty. Sustainability 2023, 15, 16912. [Google Scholar] [CrossRef]
- Ayodele, T.R.; Ogunjuyigbe, A.S.O.; Odigie, O.; Munda, J.L. A multi-criteria GIS based model for wind farm site selection using interval type-2 fuzzy analytic hierarchy process: The case study of Nigeria. ApEn 2018, 228, 1853–1869. [Google Scholar] [CrossRef]
- Aghaloo, K.; Ali, T.; Chiu, Y.-R.; Sharifi, A. Optimal site selection for the solar-wind hybrid renewable energy systems in Bangladesh using an integrated GIS-based BWM-fuzzy logic method. Energy Convers. Manag. 2023, 283, 116899. [Google Scholar] [CrossRef]
- Ali, S.; Taweekun, J.; Techato, K.; Waewsak, J.; Gyawali, S. GIS based site suitability assessment for wind and solar farms in Songkhla, Thailand. Renew. Energy 2019, 132, 1360–1372. [Google Scholar] [CrossRef]
- Sánchez-Lozano, J.M.; Teruel-Solano, J.; Soto-Elvira, P.L.; García-Cascales, M.S.J.R.; Reviews, S.E. Geographical Information Systems (GIS) and Multi-Criteria Decision Making (MCDM) methods for the evaluation of solar farms locations: Case study in south-eastern Spain. Renew. Sustain. Energy Rev. 2013, 24, 544–556. [Google Scholar] [CrossRef]
- Majumdar, D.; Pasqualetti, M.J. Analysis of land availability for utility-scale power plants and assessment of solar photovoltaic development in the state of Arizona, USA. Renew. Energy 2019, 134, 1213–1231. [Google Scholar] [CrossRef]
- Wang, C.-N.; Chung, Y.-C.; Wibowo, F.D.; Dang, T.-T.; Nguyen, N.-A.-T. Site Selection of Solar Power Plants Using Hybrid MCDM Models: A Case Study in Indonesia. Energies 2023, 16, 4042. [Google Scholar] [CrossRef]
- Gašparović, I.; Gašparović, M. Determining Optimal Solar Power Plant Locations Based on Remote Sensing and GIS Methods: A Case Study from Croatia. Remote Sens. 2019, 11, 1481. [Google Scholar] [CrossRef]
- Yunna, W.; Geng, S. Multi-criteria decision making on selection of solar–wind hybrid power station location: A case of China. Energy Convers. Manag. 2014, 81, 527–533. [Google Scholar] [CrossRef]
- Sreenath, S.; Sudhakar, K.; Yusop, A.F. Technical assessment of captive solar power plant: A case study of Senai airport, Malaysia. Renew. Energy 2020, 152, 849–866. [Google Scholar] [CrossRef]
- Gacu, J.G.; Garcia, J.D.; Fetalvero, E.G.; Catajay-Mani, M.P.; Monjardin, C.E.F. Suitability Analysis Using GIS-Based Analytic Hierarchy Process (AHP) for Solar Power Exploration. Energies 2023, 16, 6724. [Google Scholar] [CrossRef]
- Wu, Y.; Yang, Y.; Feng, T.; Kong, L.; Liu, W.; Fu, L. Macro-site selection of wind/solar hybrid power station based on Ideal Matter-Element Model. Int. J. Electr. Power Energy Syst. 2013, 50, 76–84. [Google Scholar] [CrossRef]
- Cavazzi, S.; Dutton, A.G. An Offshore Wind Energy Geographic Information System (OWE-GIS) for assessment of the UK’s offshore wind energy potential. Renew. Energy 2016, 87, 212–228. [Google Scholar] [CrossRef]
- Deveci, M.; Cali, U.; Pamucar, D. Evaluation of criteria for site selection of solar photovoltaic (PV) projects using fuzzy logarithmic additive estimation of weight coefficients. Energy Rep. 2021, 7, 8805–8824. [Google Scholar] [CrossRef]
- Effat, H.A.; El-Zeiny, A.M. Geospatial modeling for selection of optimum sites for hybrid solar-wind energy in Assiut Governorate, Egypt. Egypt. J. Remote Sens. Space Sci. 2022, 25, 627–637. [Google Scholar] [CrossRef]
- Mostafa, N.A.; Aboelezz, A. Feasibility-sustainability study of power generation using solar energy at an industrial site: A case study from Egypt. Energy Sustain. Soc. 2024, 14, 36. [Google Scholar] [CrossRef]
- García-Orozco, S.; Vargas-Gutiérrez, G.; Ordóñez-Sánchez, S.; Silva, R. Using Multi-Criteria Decision Making in Quality Function Deployment for Offshore Renewable Energies. Energies 2023, 16, 6533. [Google Scholar] [CrossRef]
- Mockor, J.; Hynar, D. On Unification of Methods in Theories of Fuzzy Sets, Hesitant Fuzzy Set, Fuzzy Soft Sets and Intuitionistic Fuzzy Sets. Mathematics 2021, 9, 447. [Google Scholar] [CrossRef]
- Lee, Y.; Cho, S. User segmentation via interpretable user representation and relative similarity-based segmentation method. Multimed. Syst. 2021, 27, 61–72. [Google Scholar] [CrossRef]
- Xing, H.; Song, L.; Yang, Z. An Evidential Prospect Theory Framework in Hesitant Fuzzy Multiple-Criteria Decision-Making. Symmetry 2019, 11, 1467. [Google Scholar] [CrossRef]
- Tversky, A.; Kahneman, D. Advances in prospect theory: Cumulative representation of uncertainty. J. Risk Uncertain. 1992, 5, 297–323. [Google Scholar] [CrossRef]
- Zhao, H.; Wang, S.; Lu, C. A study on site selection of wind power plant based on prospect theory and VIKOR: A case study in China. Kybernetes 2025, 54, 4043–4066. [Google Scholar] [CrossRef]
- Sang, X.; Yu, X.; Chang, C.-T.; Liu, X. Electric bus charging station site selection based on the combined DEMATEL and PROMETHEE-PT framework. Comput. Ind. Eng. 2022, 168, 108116. [Google Scholar] [CrossRef]
- Fan, X.-C.; Wang, W.-Q.; Shi, R.-J.; Cheng, Z.-J. Hybrid pluripotent coupling system with wind and photovoltaic-hydrogen energy storage and the coal chemical industry in Hami, Xinjiang. Renew. Sust. Energ. Rev. 2017, 72, 950–960. [Google Scholar] [CrossRef]
- Alami Merrouni, A.; Elwali Elalaoui, F.; Mezrhab, A.; Mezrhab, A.; Ghennioui, A. Large scale PV sites selection by combining GIS and Analytical Hierarchy Process. Case Study East. Morocco. Renew. Energy 2018, 119, 863–873. [Google Scholar] [CrossRef]
- Charabi, Y.; Gastli, A. PV site suitability analysis using GIS-based spatial fuzzy multi-criteria evaluation. Renew. Energy 2011, 36, 2554–2561. [Google Scholar] [CrossRef]
- Höfer, T.; Sunak, Y.; Siddique, H.; Madlener, R. Wind farm siting using a spatial Analytic Hierarchy Process approach: A case study of the Städteregion Aachen. ApEn 2016, 163, 222–243. [Google Scholar] [CrossRef]
- Günen, M.A. A comprehensive framework based on GIS-AHP for the installation of solar PV farms in Kahramanmaraş, Turkey. Renew. Energy 2021, 178, 212–225. [Google Scholar] [CrossRef]
- Uyan, M. GIS-based solar farms site selection using analytic hierarchy process (AHP) in Karapinar region, Konya/Turkey. Renew. Sust. Energy Rev. 2013, 28, 11–17. [Google Scholar] [CrossRef]
- Öner, G.; Akgün, H.; Koçkar, M.K.; Kelam, A.A. Municipal landfill site selection using TOPSIS methodology: A case study for Polatlı, Ankara, Türkiye. Bull. Eng. Geol. Environ. 2025, 84, 126. [Google Scholar] [CrossRef]
- Wu, Y.; Chen, M.; Shen, K.; Wang, J. Z-number extension of TODIM-CPT method combined with K-means clustering for electric vehicle battery swapping station site selection. J. Energy Storage 2024, 85, 110900. [Google Scholar] [CrossRef]
- Biswas, B.; Ghosh, A.; Sailo, B.L. Spring water suitable and vulnerable watershed demarcation using AHP-TOPSIS and AHP-VIKOR models: Study on Aizawl district of North-Eastern hilly state of Mizoram, India. Environ. Earth Sci. 2023, 82, 80. [Google Scholar] [CrossRef]


| Sequence | Unit | Title |
|---|---|---|
| 1 | Xinjiang Uygur Autonomous Region (XUAR) Development and Reform Commission (Xuar, China) | Coordinating member |
| 2 | China Energy Construction Corporation Limited (Beijing, China) | Technical personnel |
| 3 | Xi’an Jiaotong University (Xi’an, China) | Professor |
| 4 | North China Electric Power University (Hebei, China) | Professor |
| 5 | Mingyang New Energy Investment Holding Group Company Limited (Co., Ltd.) (Zhongshan, China) | Manager |
| 6 | Saneng New Energy Group (Nanjing, China) | Manager |
| 7 | Energy Research Institute, Peking University (Beijing, China) | Researcher |
| 8 | Bank of China Law Firm (Beijing, China) | Lawyer |
| 9 | Tbea Electric Co., Ltd. (Xuar, China) | Manager |
| 10 | Shanghai University of Electric Power (Shanghai, China) | Professor |
| First-Level Indicators | Secondary Indicators | Description |
|---|---|---|
| Environmental factor T1 | Wind speed T11 | The air velocity about a given location on Earth [33]. |
| Solar radiation T12 | Electromagnetic waves and particle streams are emitted into cosmic space [34]. | |
| Distance from the road T13 | Spatial distance of the construction site from the road [35]. | |
| Agricultural capacity T14 | Relatively stable output power of the various agricultural production factors over time [36]. | |
| Social factor T2 | Population density T21 | Measurement of population distribution [37]. |
| The attitude of the local population T22 | It encompasses the views of people living in a particular area about an event [38]. | |
| Distance from agriculture T23 | Spatial distance between the construction site and the area of agricultural activity [39]. | |
| Energy efficiency T24 | It refers to benefits in terms of energy savings and reductions in environmentally harmful emissions [40]. | |
| Technical factor T3 | Electrical facility T31 | It refers to the equipment and systems for generating, transmitting, distributing, and using electrical energy. This also includes the grid capacity, which affects power efficiency and the ability [41]. |
| Distance to the transmission line T32 | It refers to the spatial distance between the construction site and the power transmission line [42]. | |
| Wind power density T33 | Measuring the abundance of wind energy resources in a given location [27]. | |
| Rated power T34 | Maximum output power can be achieved by the machinery and equipment [43]. | |
| Economic factor T4 | Investment cost T41 | It refers to all costs incurred in an investment project [44]. |
| Local government subsidy T42 | Local governments provide enterprises and organizations with financial support [45]. | |
| Distance from the city T43 | It is the distance between the construction site and the downtown or central business district [46]. | |
| Operating cost T44 | Costs incurred to keep operations running smoothly [47]. |
| Semantic Evaluation Levels | Weighted Semantic Evaluation Levels | TFNs |
|---|---|---|
| Excellent | Very important | (8,9,9) |
| Good | More important | (6,7,8) |
| Fair | Important | (4,5,6) |
| Poor | General | (2,3,4) |
| Unqualified | Not important | (1,1,1) |
| Criteria | Standards |
|---|---|
| Elevation (m) | <1500 [56] |
| Slope (%) | <5 [57] |
| Wind speed (m/s) | >4 [58] |
| Sunshine duration (kWh/m2) | >132 [34] |
| Average temperature (°C) | >5.6 [59] |
| Land type | It should not be in water bodies or residential areas [60]. |
| M1 | M2 | M3 | M4 | M5 | |
|---|---|---|---|---|---|
| Latitude | 44°6′22″ N | 39°59′44″ N | 40°4′34″ N | 38°25′9″ N | 37°18′12″ N |
| Longitude | 93°2′4″ E | 82°21′48″ E | 87°17′55″ E | 79°3′35″ E | 81°27′32″ E |
| Wind speed (m/s) | 8.84 | 6.01 | 6.95 | 6.12 | 5.98 |
| Sunshine duration (kWh/m2) | 224.6 | 258.2 | 250.03 | 267.6 | 288.37 |
| T11 | 0.714 | 0.556 | 0.556 | 1 | 0.714 | 0.714 | 1 | 1 | 0.556 | 0.714 |
| T12 | 0.714 | 1 | 1 | 0.556 | 0.455 | 0.556 | 0.455 | 0.455 | 0.714 | 1 |
| T13 | 1 | 0.556 | 1 | 0.3846 | 0.3333 | 0.333 | 0.455 | 0.333 | 0.714 | 1 |
| T14 | 1 | 1 | 0.556 | 0.455 | 1 | 0.455 | 0.455 | 0.714 | 1 | 0.455 |
| T21 | 0.714 | 0.333 | 1 | 0.714 | 0.714 | 0.385 | 1 | 0.333 | 0.385 | 0.385 |
| T22 | 0.714 | 0.455 | 0.455 | 1 | 0.455 | 0.556 | 1 | 1 | 0.455 | 1 |
| T23 | 0.714 | 0.333 | 1 | 1 | 0.455 | 0.385 | 1 | 0.333 | 0.333 | 0.556 |
| T24 | 0.385 | 1 | 1 | 0.455 | 0.455 | 1 | 0.385 | 0.385 | 0.714 | 0.714 |
| T31 | 0.455 | 0.714 | 0.455 | 1 | 0.385 | 0.714 | 0.455 | 0.714 | 0.385 | 1 |
| T32 | 0.714 | 1 | 0.714 | 0.455 | 0.556 | 0.556 | 0.455 | 0.556 | 1 | 0.714 |
| T33 | 0.455 | 1 | 0.714 | 0.385 | 0.385 | 0.714 | 0.385 | 0.455 | 1 | 1 |
| T34 | 1 | 1 | 1 | 0.556 | 1 | 0.556 | 0.556 | 0.556 | 1 | 0.556 |
| T41 | 1 | 1 | 1 | 0.556 | 1 | 0.556 | 0.556 | 0.556 | 1 | 0.556 |
| T42 | 0.556 | 1 | 0.714 | 0.714 | 0.714 | 1 | 0.556 | 0.714 | 0.714 | 0.714 |
| T43 | 0.714 | 1 | 0.556 | 0.556 | 0.556 | 0.714 | 0.556 | 1 | 1 | 1 |
| T44 | 0.455 | 1 | 0.556 | 0.455 | 0.385 | 0.714 | 0.385 | 0.556 | 0.714 | 1 |
| T11 | 0.197 | 0.182 | 0.097 | −0.201 |
| T12 | 0.175 | 0.158 | 0.103 | −0.209 |
| T13 | 0.122 | 0.102 | 0.085 | −0.16 |
| T14 | 0.142 | 0.122 | 0.083 | −0.161 |
| T21 | 0.134 | 0.114 | 0.094 | −0.179 |
| T22 | 0.146 | 0.126 | 0.086 | −0.166 |
| T23 | 0.16 | 0.141 | 0.112 | −0.222 |
| T24 | 0.156 | 0.137 | 0.102 | −0.201 |
| T31 | 0.106 | 0.086 | 0.069 | −0.127 |
| T32 | 0.141 | 0.121 | 0.082 | −0.159 |
| T33 | 0.122 | 0.102 | 0.08 | −0.149 |
| T34 | 0.121 | 0.101 | 0.059 | −0.111 |
| T41 | 0.128 | 0.108 | 0.063 | −0.119 |
| T42 | 0.158 | 0.14 | 0.078 | −0.154 |
| T43 | 0.154 | 0.134 | 0.075 | −0.148 |
| T44 | 0.166 | 0.148 | 0.108 | −0.217 |
| Changes in T11–T14 Scores | Changes in T21–T24 Scores | Changes in T31–T34 Scores | Changes in T41–T44 Scores | |||||
|---|---|---|---|---|---|---|---|---|
| Increase by 1 Point | Down by 1 Point | Increase by 1 Point | Down by 1 Point | Increase by 1 Point | Down by 1 Point | Increase by 1 Point | Down by 1 Point | |
| M1 | ||||||||
| M2 | ||||||||
| M3 | ||||||||
| M4 | ||||||||
| M5 | ||||||||
| Rank | M1 > M4 > M2 > M3 > M5 | |||||||
| TOPSIS | TODIM | VIKOR | Methodology of This Paper | |
|---|---|---|---|---|
| M1 | ||||
| M2 | ||||
| M3 | ||||
| M4 | ||||
| M5 | ||||
| Rank | M1 > M2 > M3 > M4 > M5 | M1 > M3 > M2 > M4 > M5 | M1 > M3 > M4 > M2 > M5 | M1 > M4 > M2 > M3 > M5 |
| Linear Weighting Method | Entropy-Based Method | Methodology of This Paper | |
|---|---|---|---|
| M1 | |||
| M2 | |||
| M3 | |||
| M4 | |||
| M5 | |||
| Rank | M3 > M2 > M1 > M4 > M5 | M1 > M2 > M3 > M4 > M5 | M1 > M4 > M2 > M3 > M5 |
Disclaimer/Publisher’s Note: The statements, opinions and data contained in all publications are solely those of the individual author(s) and contributor(s) and not of MDPI and/or the editor(s). MDPI and/or the editor(s) disclaim responsibility for any injury to people or property resulting from any ideas, methods, instructions or products referred to in the content. |
© 2025 by the authors. Licensee MDPI, Basel, Switzerland. This article is an open access article distributed under the terms and conditions of the Creative Commons Attribution (CC BY) license (https://creativecommons.org/licenses/by/4.0/).
Share and Cite
Zhao, H.; Zang, H. Site Selection for Solar–Wind Hybrid Energy Storage Plants Based on Triangular Fuzzy Numbers: A Case Study of China. Energies 2025, 18, 3851. https://doi.org/10.3390/en18143851
Zhao H, Zang H. Site Selection for Solar–Wind Hybrid Energy Storage Plants Based on Triangular Fuzzy Numbers: A Case Study of China. Energies. 2025; 18(14):3851. https://doi.org/10.3390/en18143851
Chicago/Turabian StyleZhao, Hui, and Hongru Zang. 2025. "Site Selection for Solar–Wind Hybrid Energy Storage Plants Based on Triangular Fuzzy Numbers: A Case Study of China" Energies 18, no. 14: 3851. https://doi.org/10.3390/en18143851
APA StyleZhao, H., & Zang, H. (2025). Site Selection for Solar–Wind Hybrid Energy Storage Plants Based on Triangular Fuzzy Numbers: A Case Study of China. Energies, 18(14), 3851. https://doi.org/10.3390/en18143851