Article

Optimal Scheduling of Integrated Energy Systems Considering Oxy-Fuel Power Plants and Carbon Trading

by
Hui Li
1,*,
Xianglong Bai
1,
Hua Li
2 and
Liang Bai
3
1
School of Electrical Engineering, Xi’an University of Technology, Xi’an 710048, China
2
Electric Power Research Institute of State Grid Shaanxi Electric Power Company, Xi’an 710100, China
3
College of Hydraulic and Hydropower Engineering, Xi’an University of Technology, Xi’an 710048, China
*
Author to whom correspondence should be addressed.
Energies 2025, 18(14), 3814; https://doi.org/10.3390/en18143814
Submission received: 11 June 2025 / Revised: 2 July 2025 / Accepted: 15 July 2025 / Published: 17 July 2025
(This article belongs to the Section B: Energy and Environment)

Abstract

To reduce carbon emission levels and improve the low-carbon performance and economic efficiency of Integrated Energy Systems (IESs), this paper introduces oxy-fuel combustion technology to transform traditional units and proposes a low-carbon economic dispatch method. Considering the stepwise carbon trading mechanism, it provides new ideas for promoting energy conservation, emission reduction, and economic operation of integrated energy systems from both technical and policy perspectives. Firstly, the basic principles and energy flow characteristics of oxy-fuel combustion technology are studied, and a model including an air separation unit, an oxygen storage tank, and carbon capture equipment is constructed. Secondly, a two-stage power-to-gas (P2G) model is established to build a joint operation framework for oxy-fuel combustion and P2G. On this basis, a stepwise carbon trading mechanism is introduced to further constrain the carbon emissions of the system, and a low-carbon economic dispatch model with the objective of minimizing the total system operation cost is established. Finally, multiple scenarios are set up for simulation analysis, which verifies that the proposed low-carbon economic optimal dispatch strategy can effectively reduce the system operation cost by approximately 21.4% and improve the system’s carbon emission level with a total carbon emission reduction of about 38.3%. Meanwhile, the introduction of the stepwise carbon trading mechanism reduces the total cost by 12.3% and carbon emissions by 2010.19 tons, increasing the carbon trading revenue.

1. Introduction

Energy serves as the foundational pillar and driving force for national socio-economic development, critically influencing economic security, public welfare, and social stability [1]. However, the energy sector faces escalating challenges as climate change intensifies global sustainability pressures [2]. Fossil fuels, the primary source of pollutants, account for the majority of global CO2 emissions through their production and consumption [3]. As China commits to achieving carbon peak by 2030 and carbon neutrality by 2060 [4], the energy industry—responsible for one-third of national CO2 emissions from coal-fired power generation in integrated energy systems—becomes pivotal for deep decarbonization. China’s energy transition is particularly challenging given its coal-dominated energy infrastructure (60% of current energy mix) [5,6], constrained by resource endowment characteristics of “abundant coal, limited oil, and scarce natural gas” [7].
Carbon Capture, Utilization, and Storage (CCUS) has emerged as a pivotal technology for low-carbon retrofitting and operational flexibility enhancement of thermal power units [8], serving as the cornerstone tool for emission reduction in coal-fired power plants. Characterized by its capacity to reconcile energy security with decarbonization imperatives, CCUS is widely recognized as a critical enabler for achieving carbon neutrality targets [9]. Chen et al. [10] investigated carbon capture plant energy flows, revealing peak-shaving capabilities and grid optimization roles. Sheng et al. [11] demonstrated carbon capture integration in IESs enhances carbon reduction capabilities. Chen et al. [12] demonstrated P2G-CCUS integration enhances renewable utilization and emission reduction, while oxy-fuel CCS overcomes conventional CCS limitations through carbon capture. Zheng et al. [
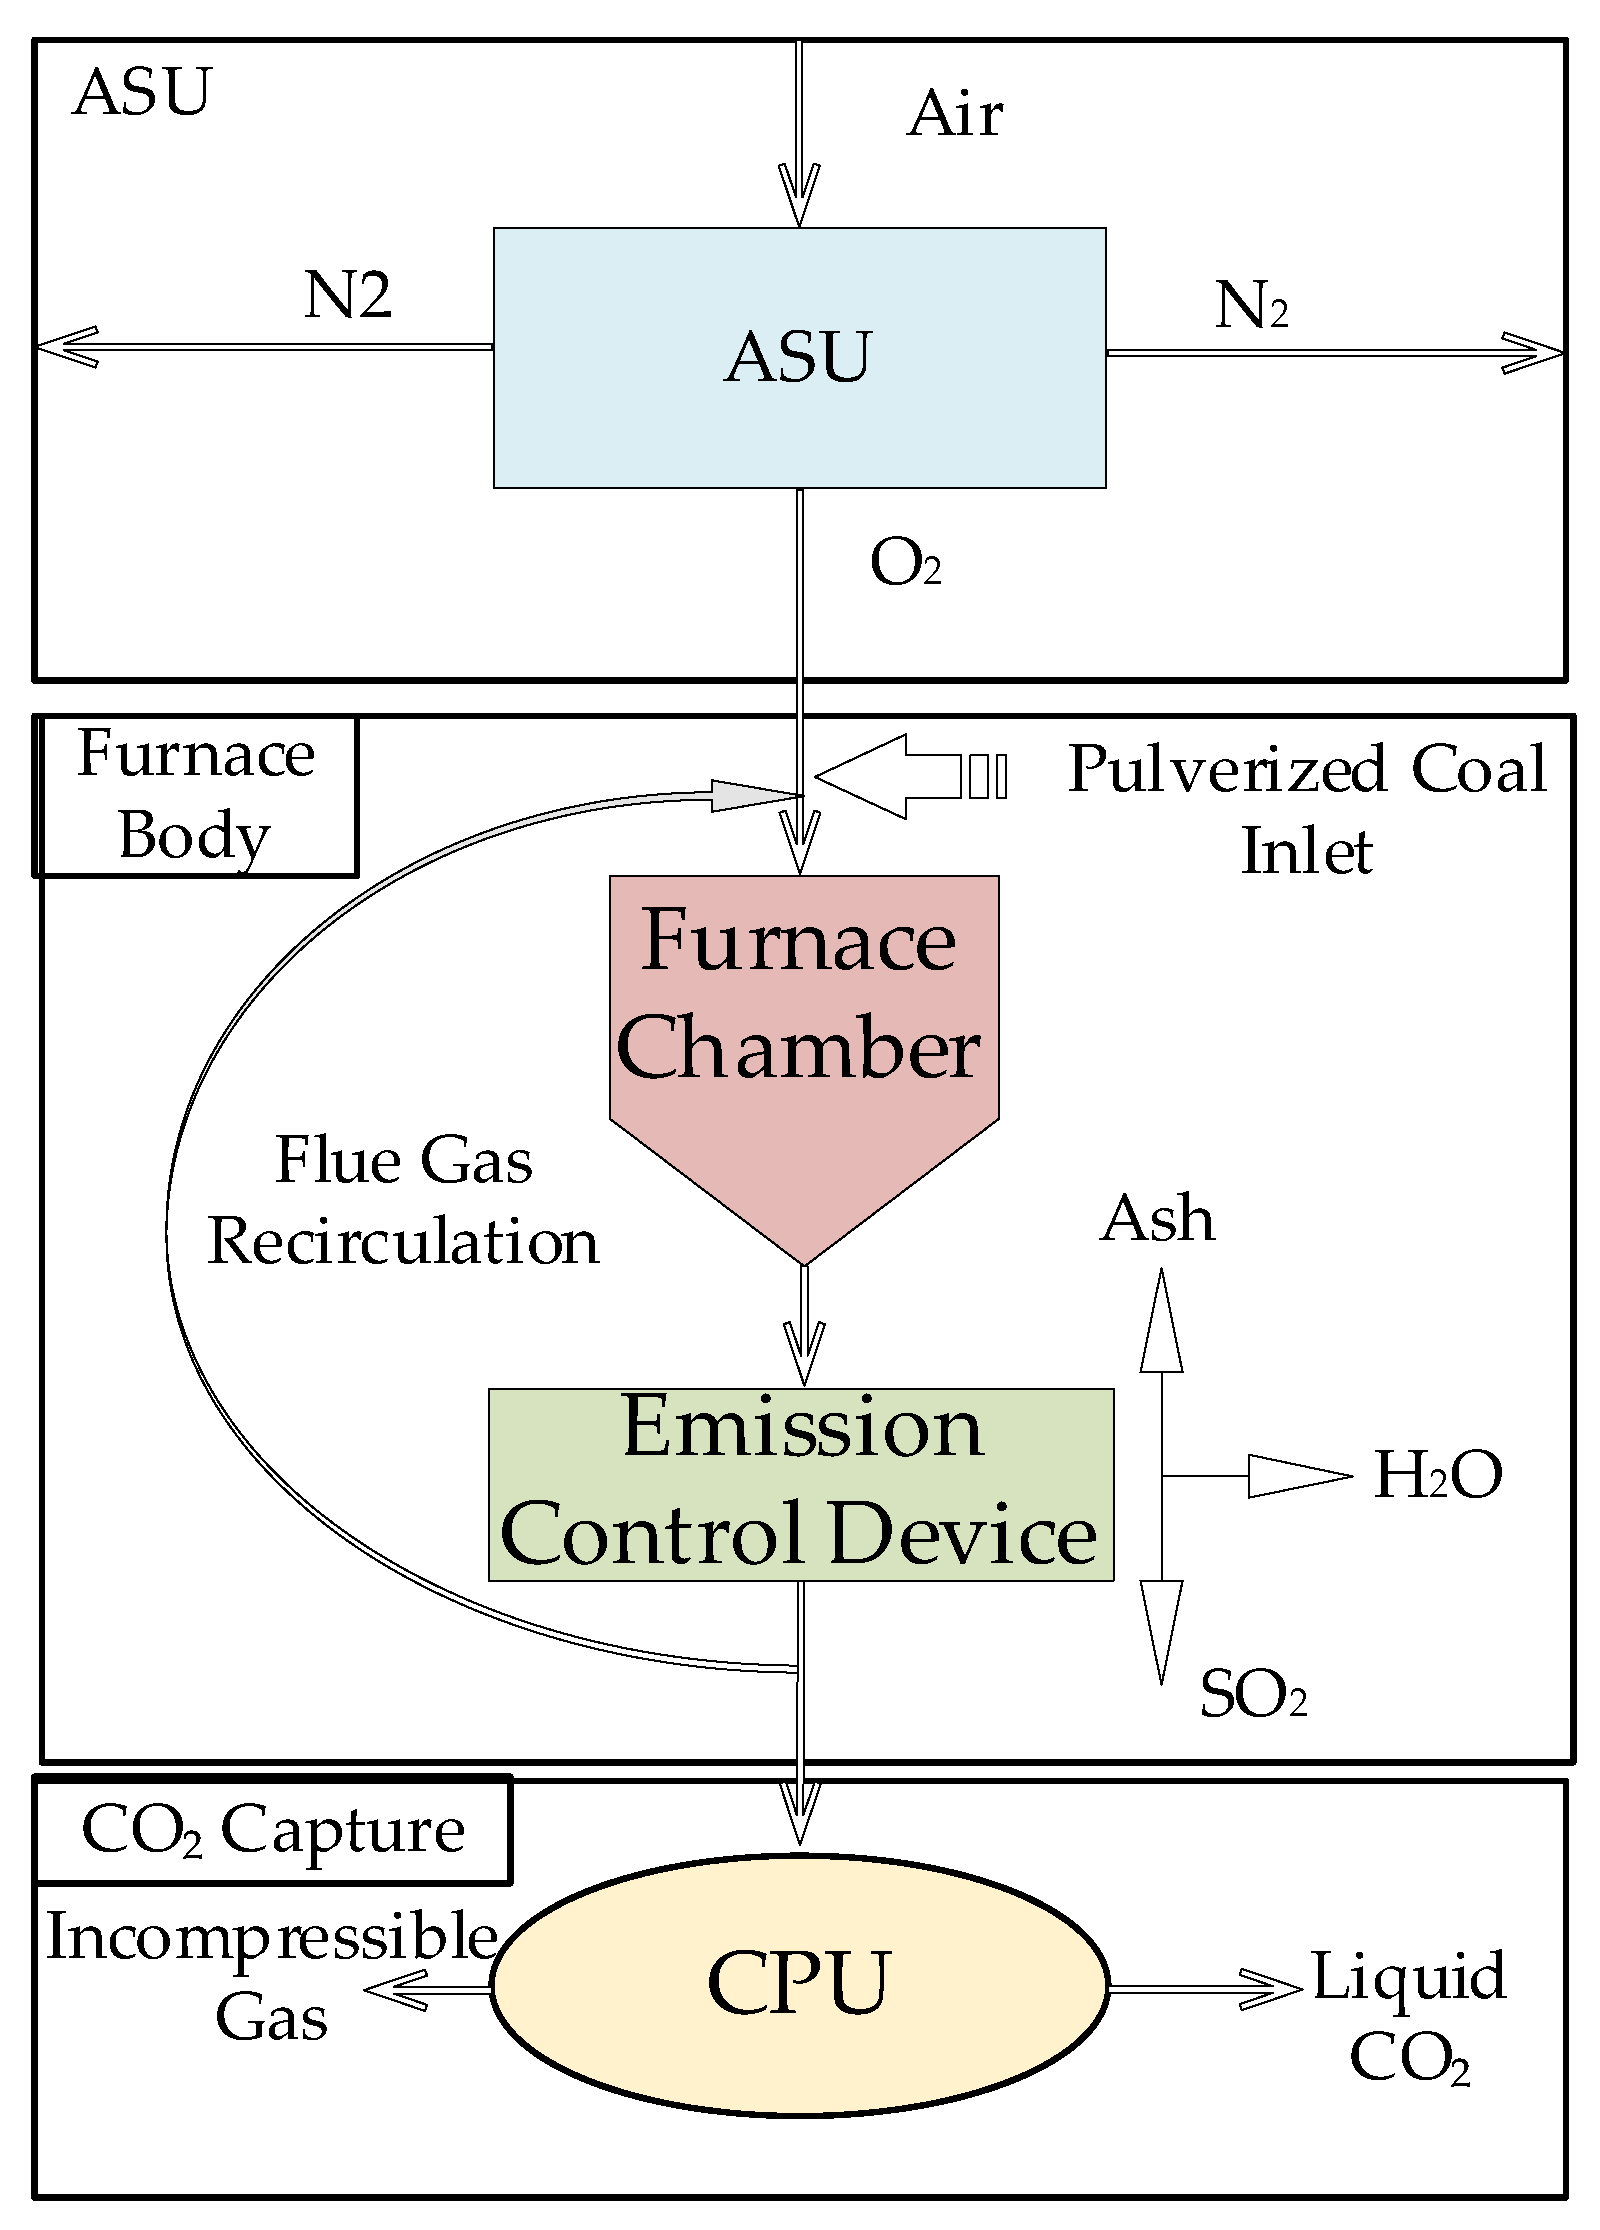
13] systematically reviewed China’s oxy-fuel combustion R&D progress, highlighting its potential as a leading carbon-reduction solution for coal plants. Liu et al. [14] analyzed oxy-fuel combustion principles, demonstrating superior economic-environmental performance versus air-fired systems. This literature only discusses the technology itself and does not combine it with IESs, so the CO2 captured by CCS and the oxygen produced by the P2G process are not effectively utilized. As the core technology for carbon capture during combustion, oxy-fuel combustion technology, when compared with the other two technologies, has the following characteristics: pre-combustion capture efficiency is high, and it has good synergy in pollution control, but it requires large-scale transformation, with complex equipment and high costs; post-combustion carbon capture technology has strong adaptability and mature technology, and can directly treat tail flue gas. However, due to the low concentration of CO2, the energy consumption for separation is extremely high, and problems such as solvent degradation and equipment corrosion are prominent, resulting in high long-term operating costs. In contrast, oxy-fuel combustion and flue gas recirculation can increase the concentration of CO2 in the flue gas and significantly reduce the energy consumption for separation in subsequent capture, and are compatible with existing coal-fired power plants without the need to transform the main body of the boiler. Therefore, under the background of “dual carbon” goals, it has great development potential and unique competitiveness. However, existing literature focuses solely on oxy-fuel combustion technology itself without systemic integration into low-carbon integrated energy systems.
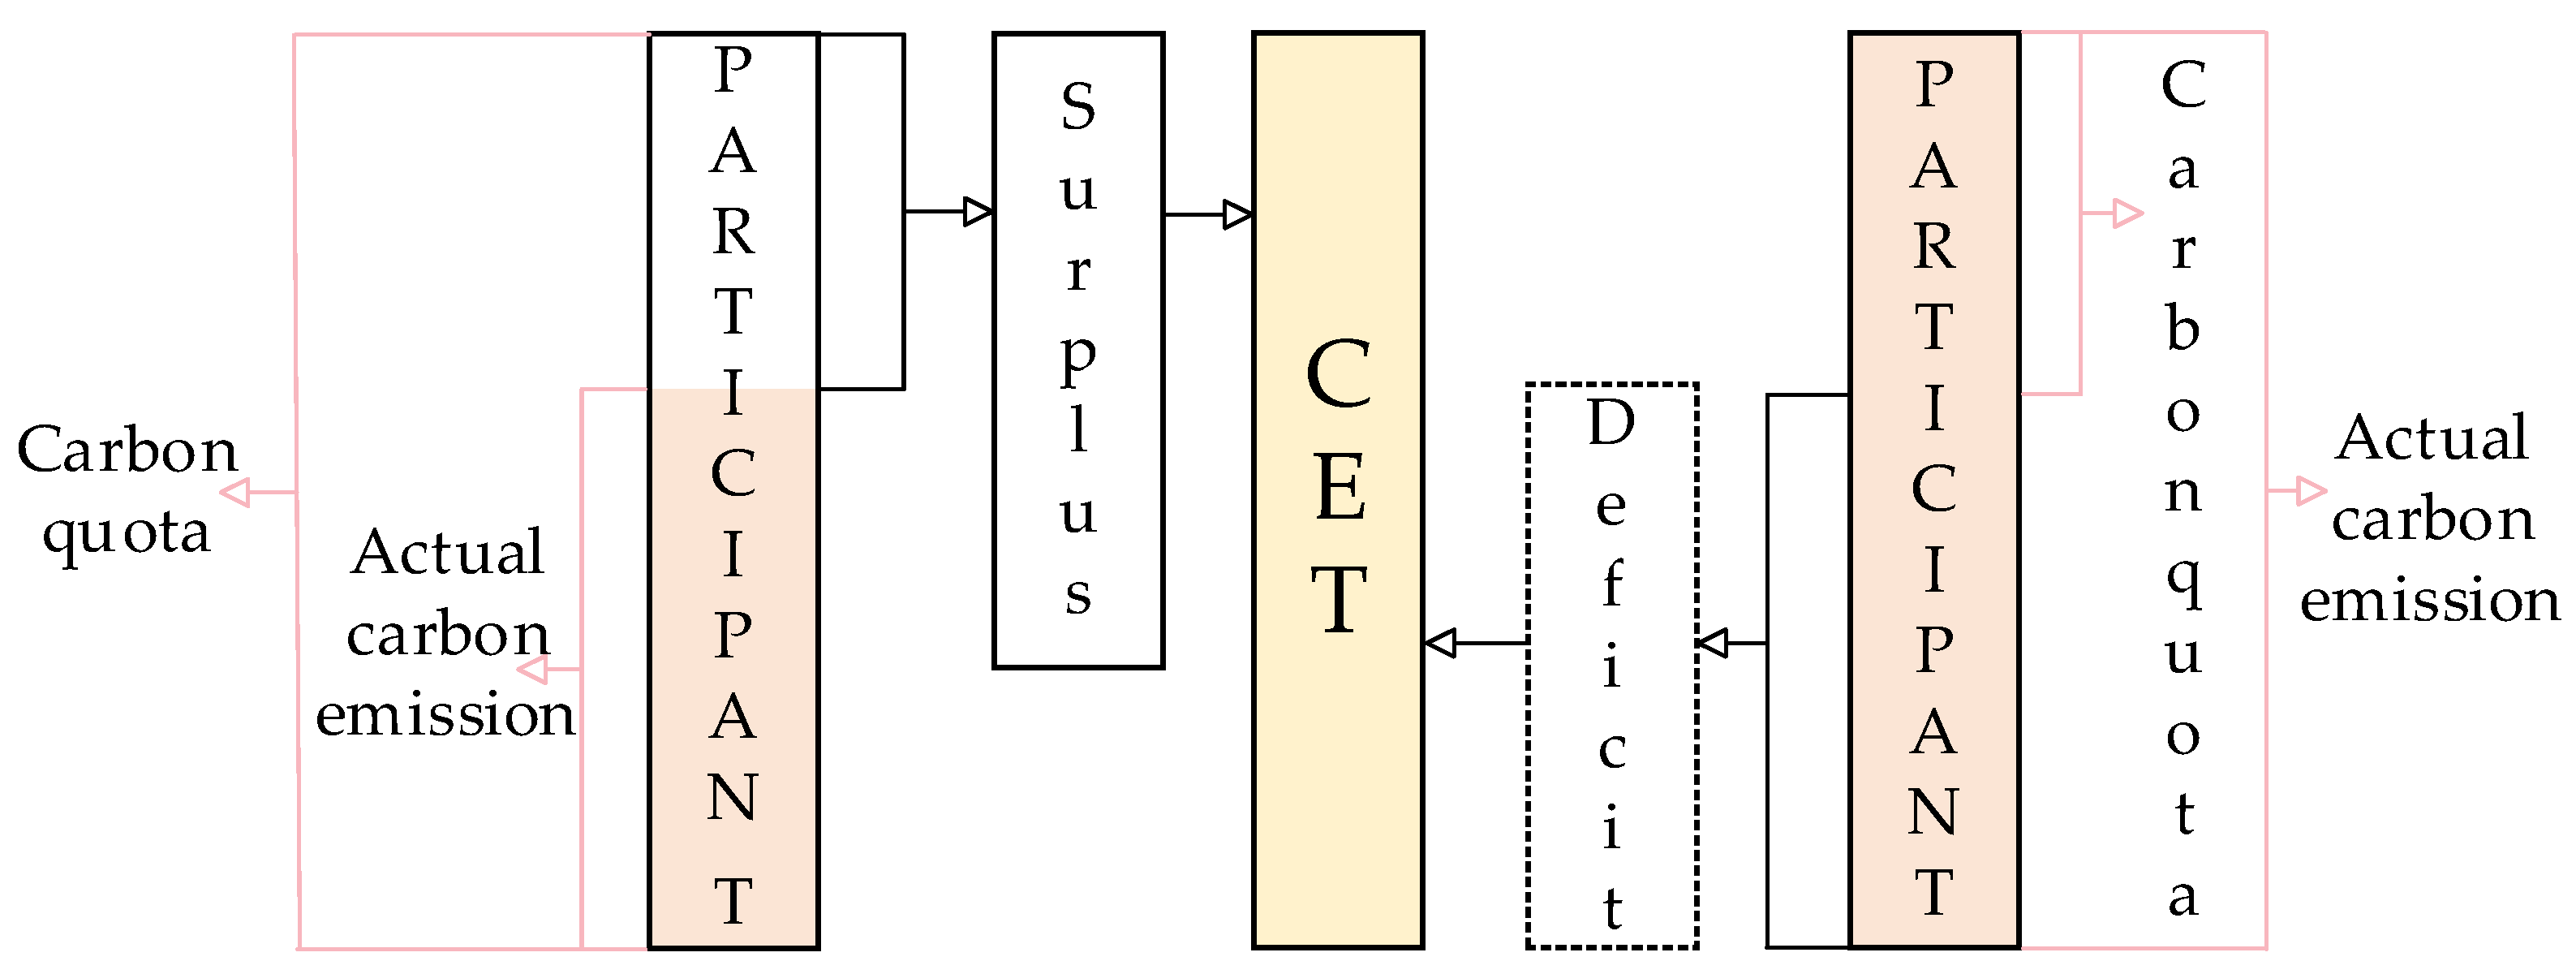
Amidst accelerating global decarbonization efforts, carbon emission trading (CET) markets have emerged as critical policy levers for accelerating low-carbon transitions in energy systems, serving as central market-driven instruments for emission mitigation. Ma et al. [15] integrated a multi-energy complementary system into the carbon trading market and introduced a hierarchical carbon trading mechanism to guide the system in controlling carbon emissions. Tang et al. [16] developed an IES model considering stepped carbon trading, two-stage P2G, adjustable CHP heat-to-power ratio, and load demand response. Xing et al. [17] proposed a multi-objective optimal scheduling method for integrated energy systems with combined heat, power, and hydrogen supply considering a stepped carbon trading mechanism. Wu et al. [18] established a two-layer carbon trading mechanism and proposed a stepped carbon price cost model. Bao et al. [19] proposed a low-carbon operation model for multi-energy complementary integrated energy systems considering two-layer power-to-gas and demand response. Cui et al. [20] introduced carbon capture and P2G into a multi-energy IES, building a two-layer model to analyze output and costs under demand response and carbon trading. Wang et al. [21] introduced a carbon trading market into an IES model with green energy and analyzed stepped carbon trading’s impact on economic costs.
However, current market mechanisms exhibit limited interaction, with most studies employing parallel optimization models that lack carbon emission trading. Addressing this gap, this study focuses on optimizing the coordinated dispatch of oxy-fuel combustion technology and CET mechanisms. A dual-path framework is developed through technical and policy innovations: (1) Technically, an IES scheduling model integrates oxy-fuel combustion plants, two-stage P2G systems, and wind–solar co-generation; (2) policy-wise, a market mechanism embedding CET rules is formulated. This approach enables synergistic optimization of low-carbon technology deployment and market-driven emission constraints.
Building upon existing research [9,10,11,12,13,14,15,16,17,18,19,20,21], this study proposes an optimized scheduling model that synergistically integrates oxy-fuel carbon capture technology with carbon trading mechanisms. The mixed-integer linear programming framework is solved using MATLAB’s CPLEX solver, with comparative scenario analyses demonstrating the strategy’s effectiveness. The results validate the technical–economic superiority of coupling oxy-fuel retrofitting with CET policies for low-carbon transitions. The following is a summary of this paper’s primary contributions:
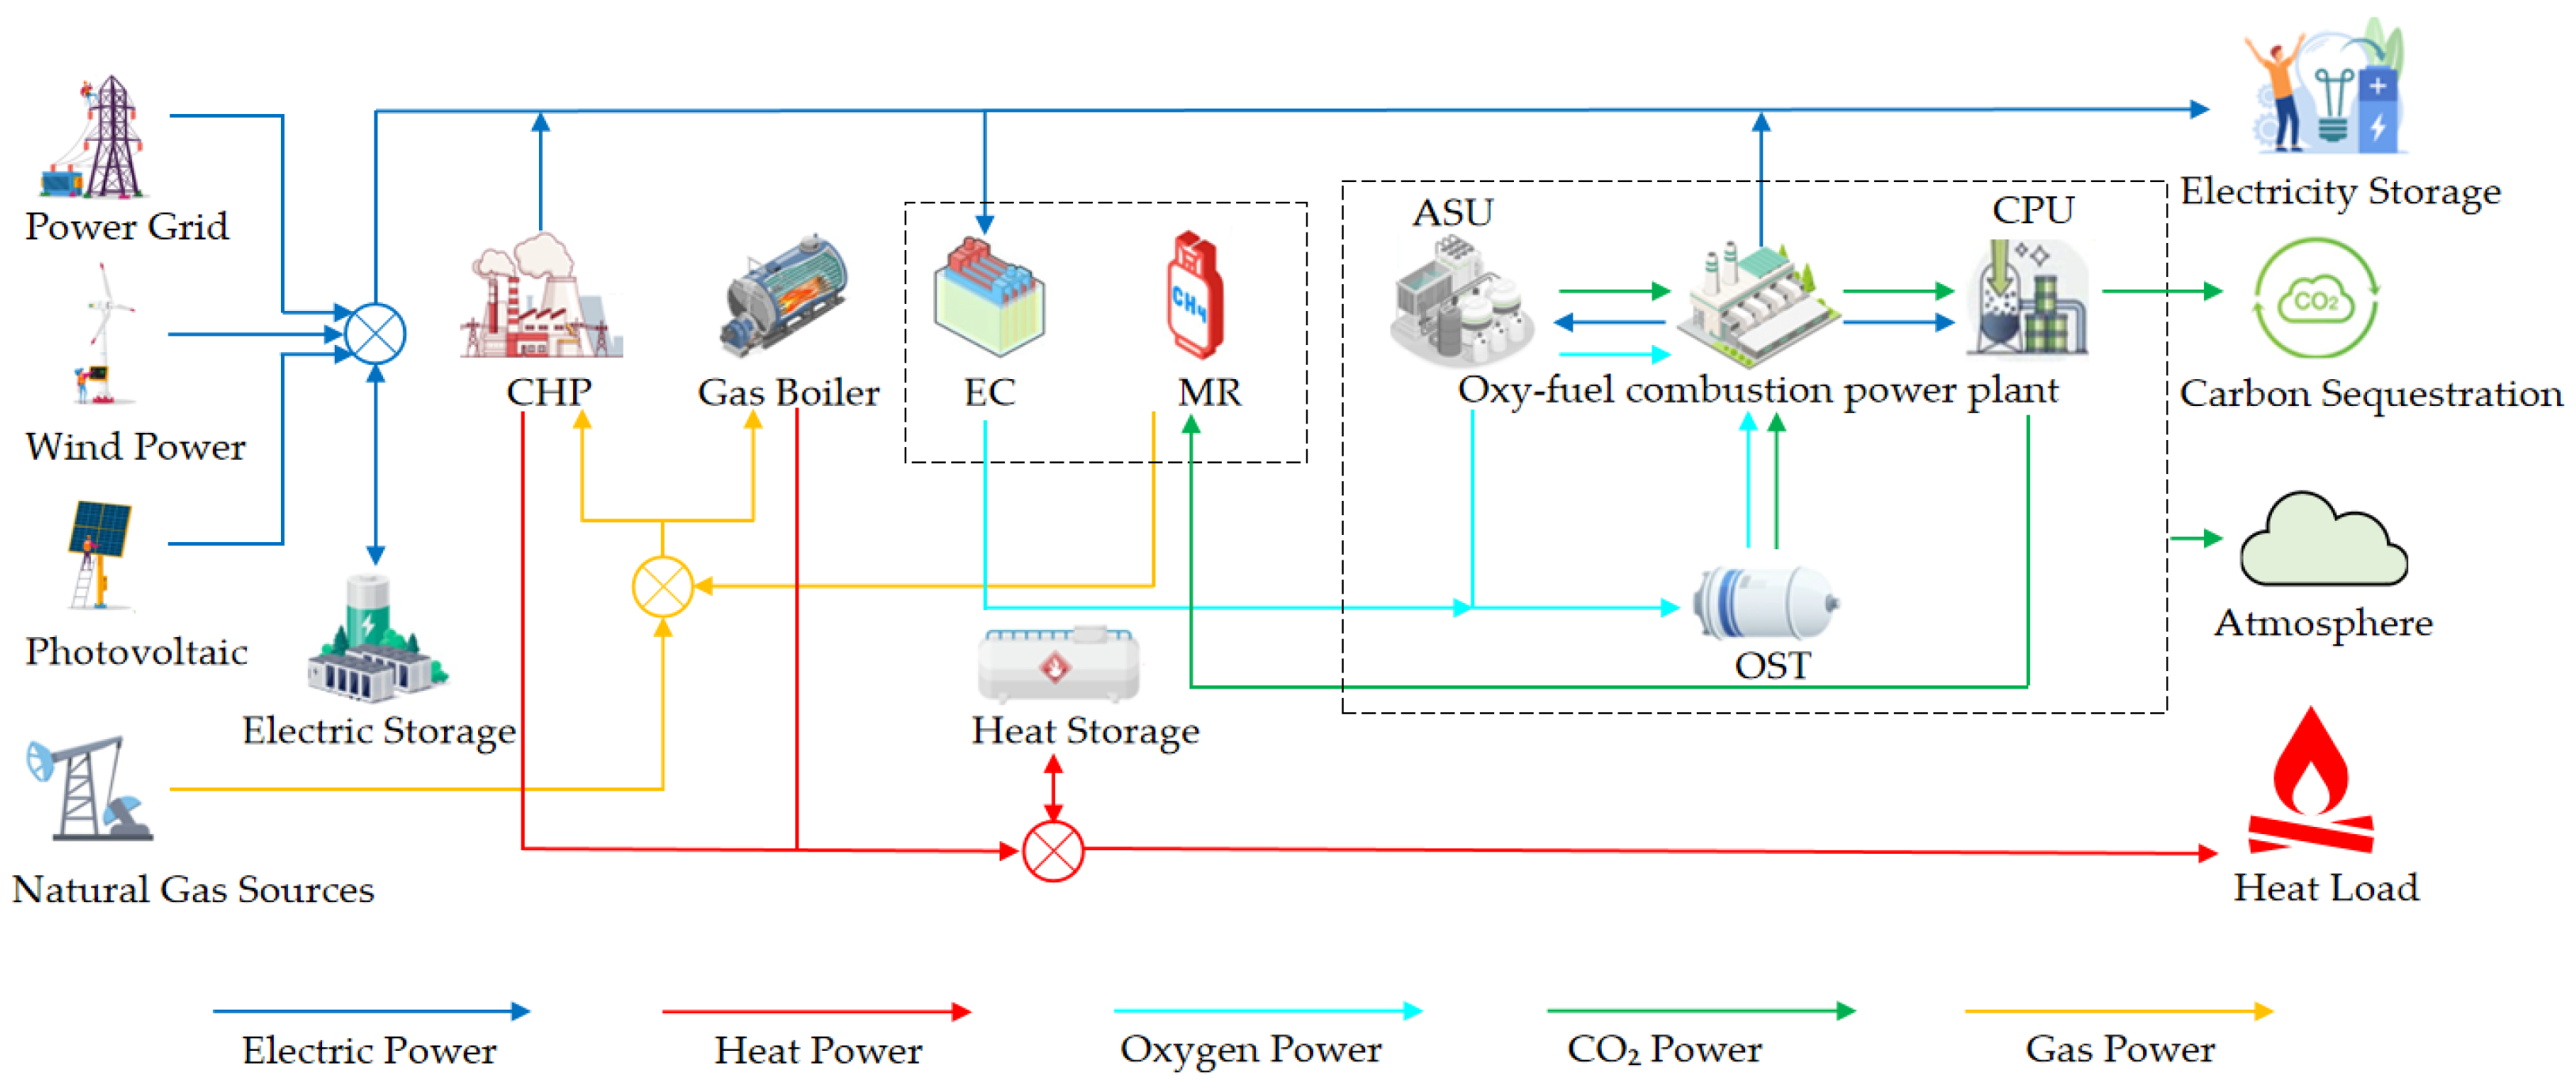
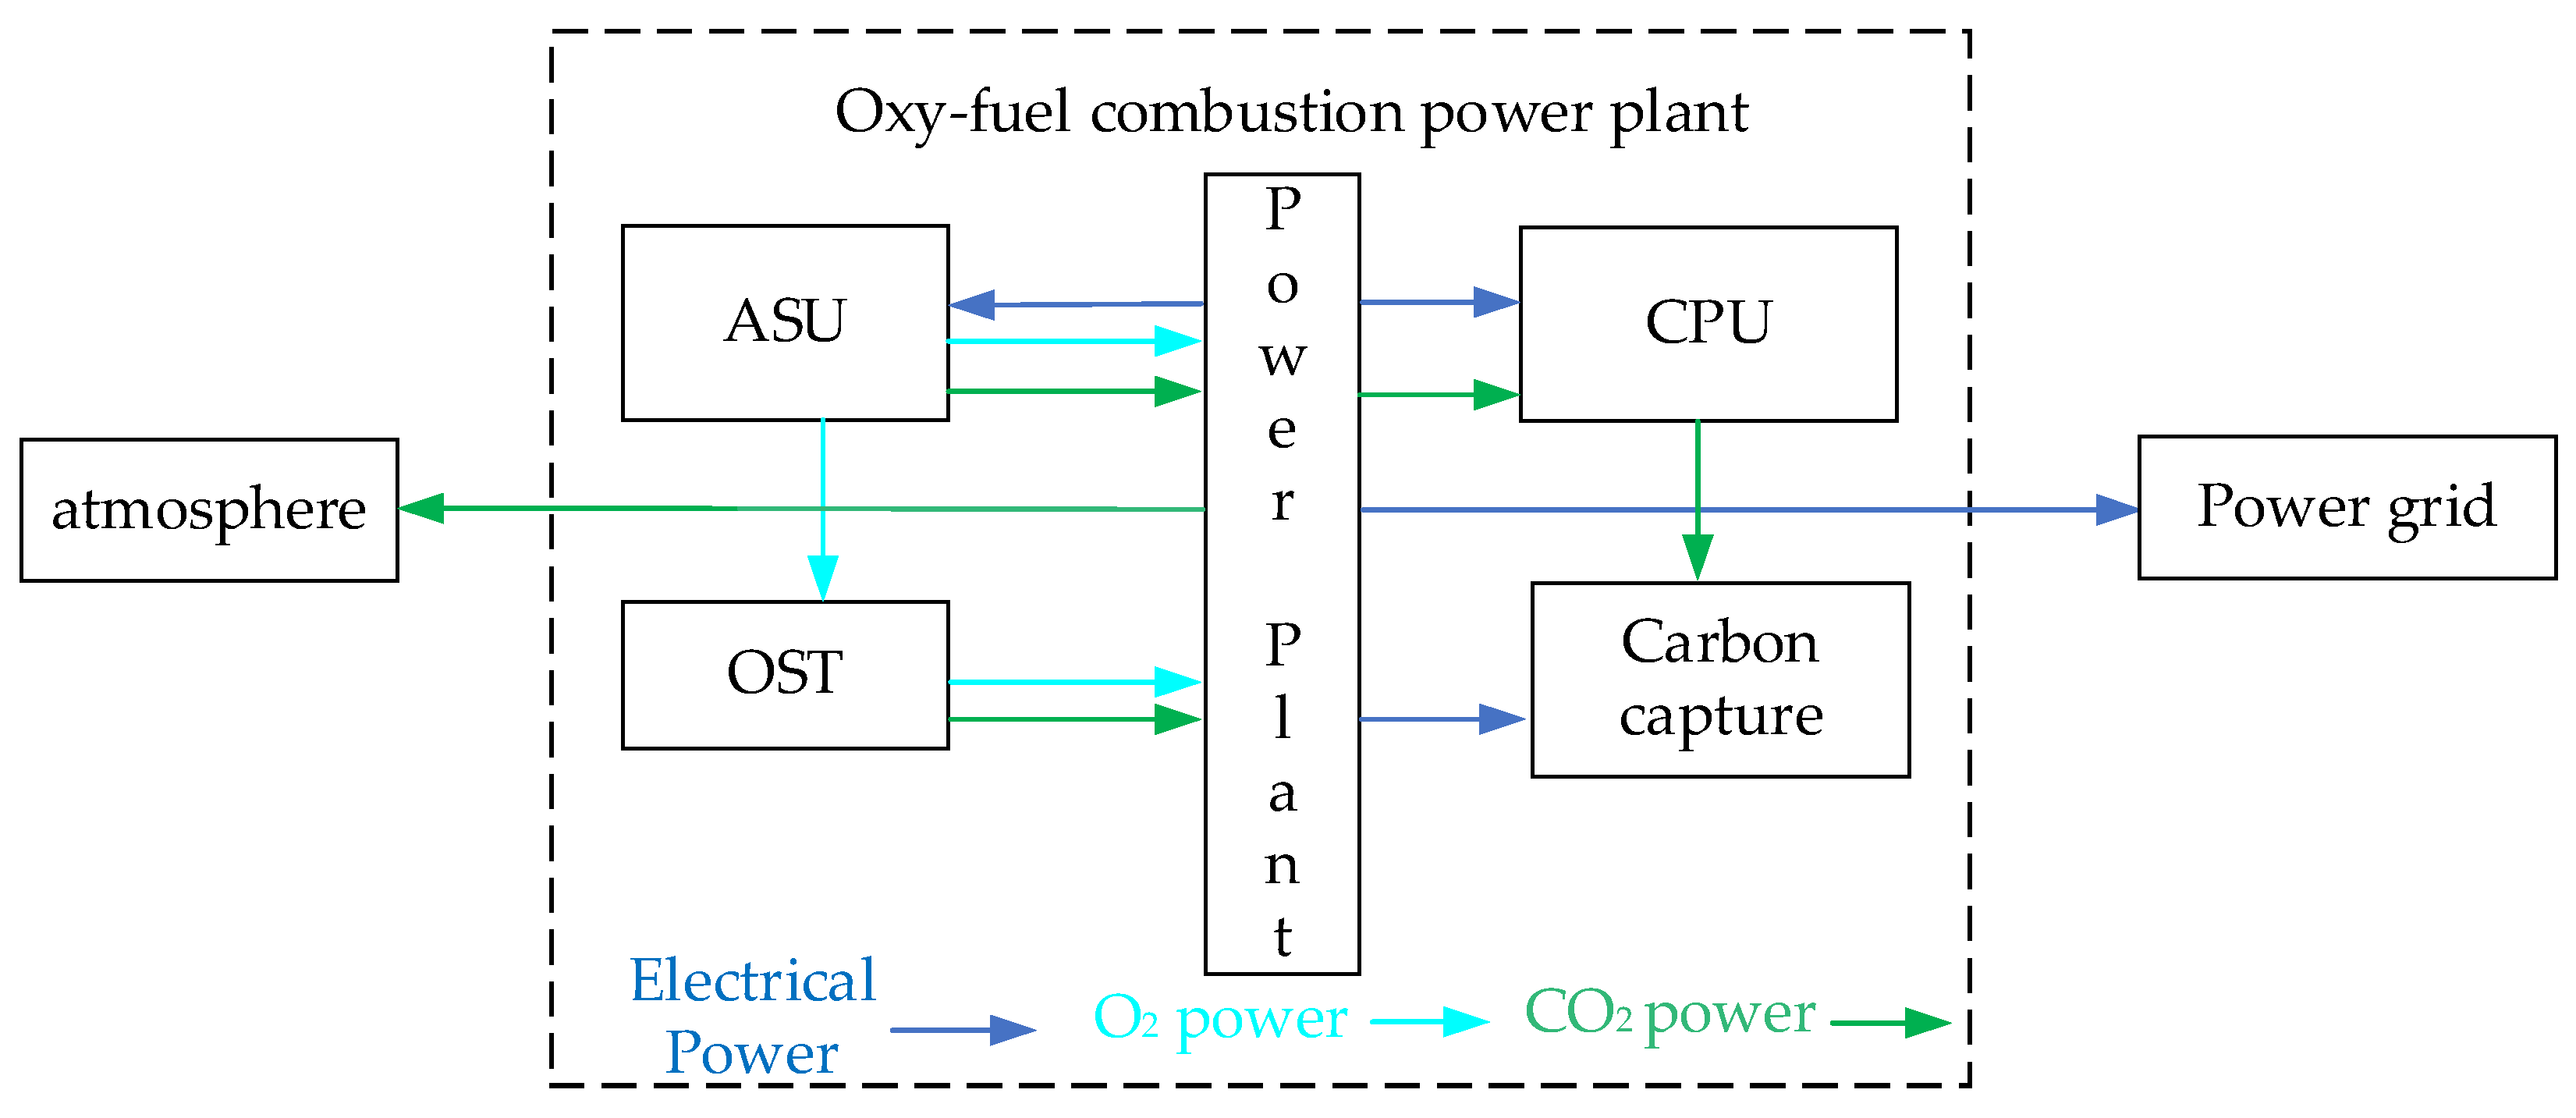
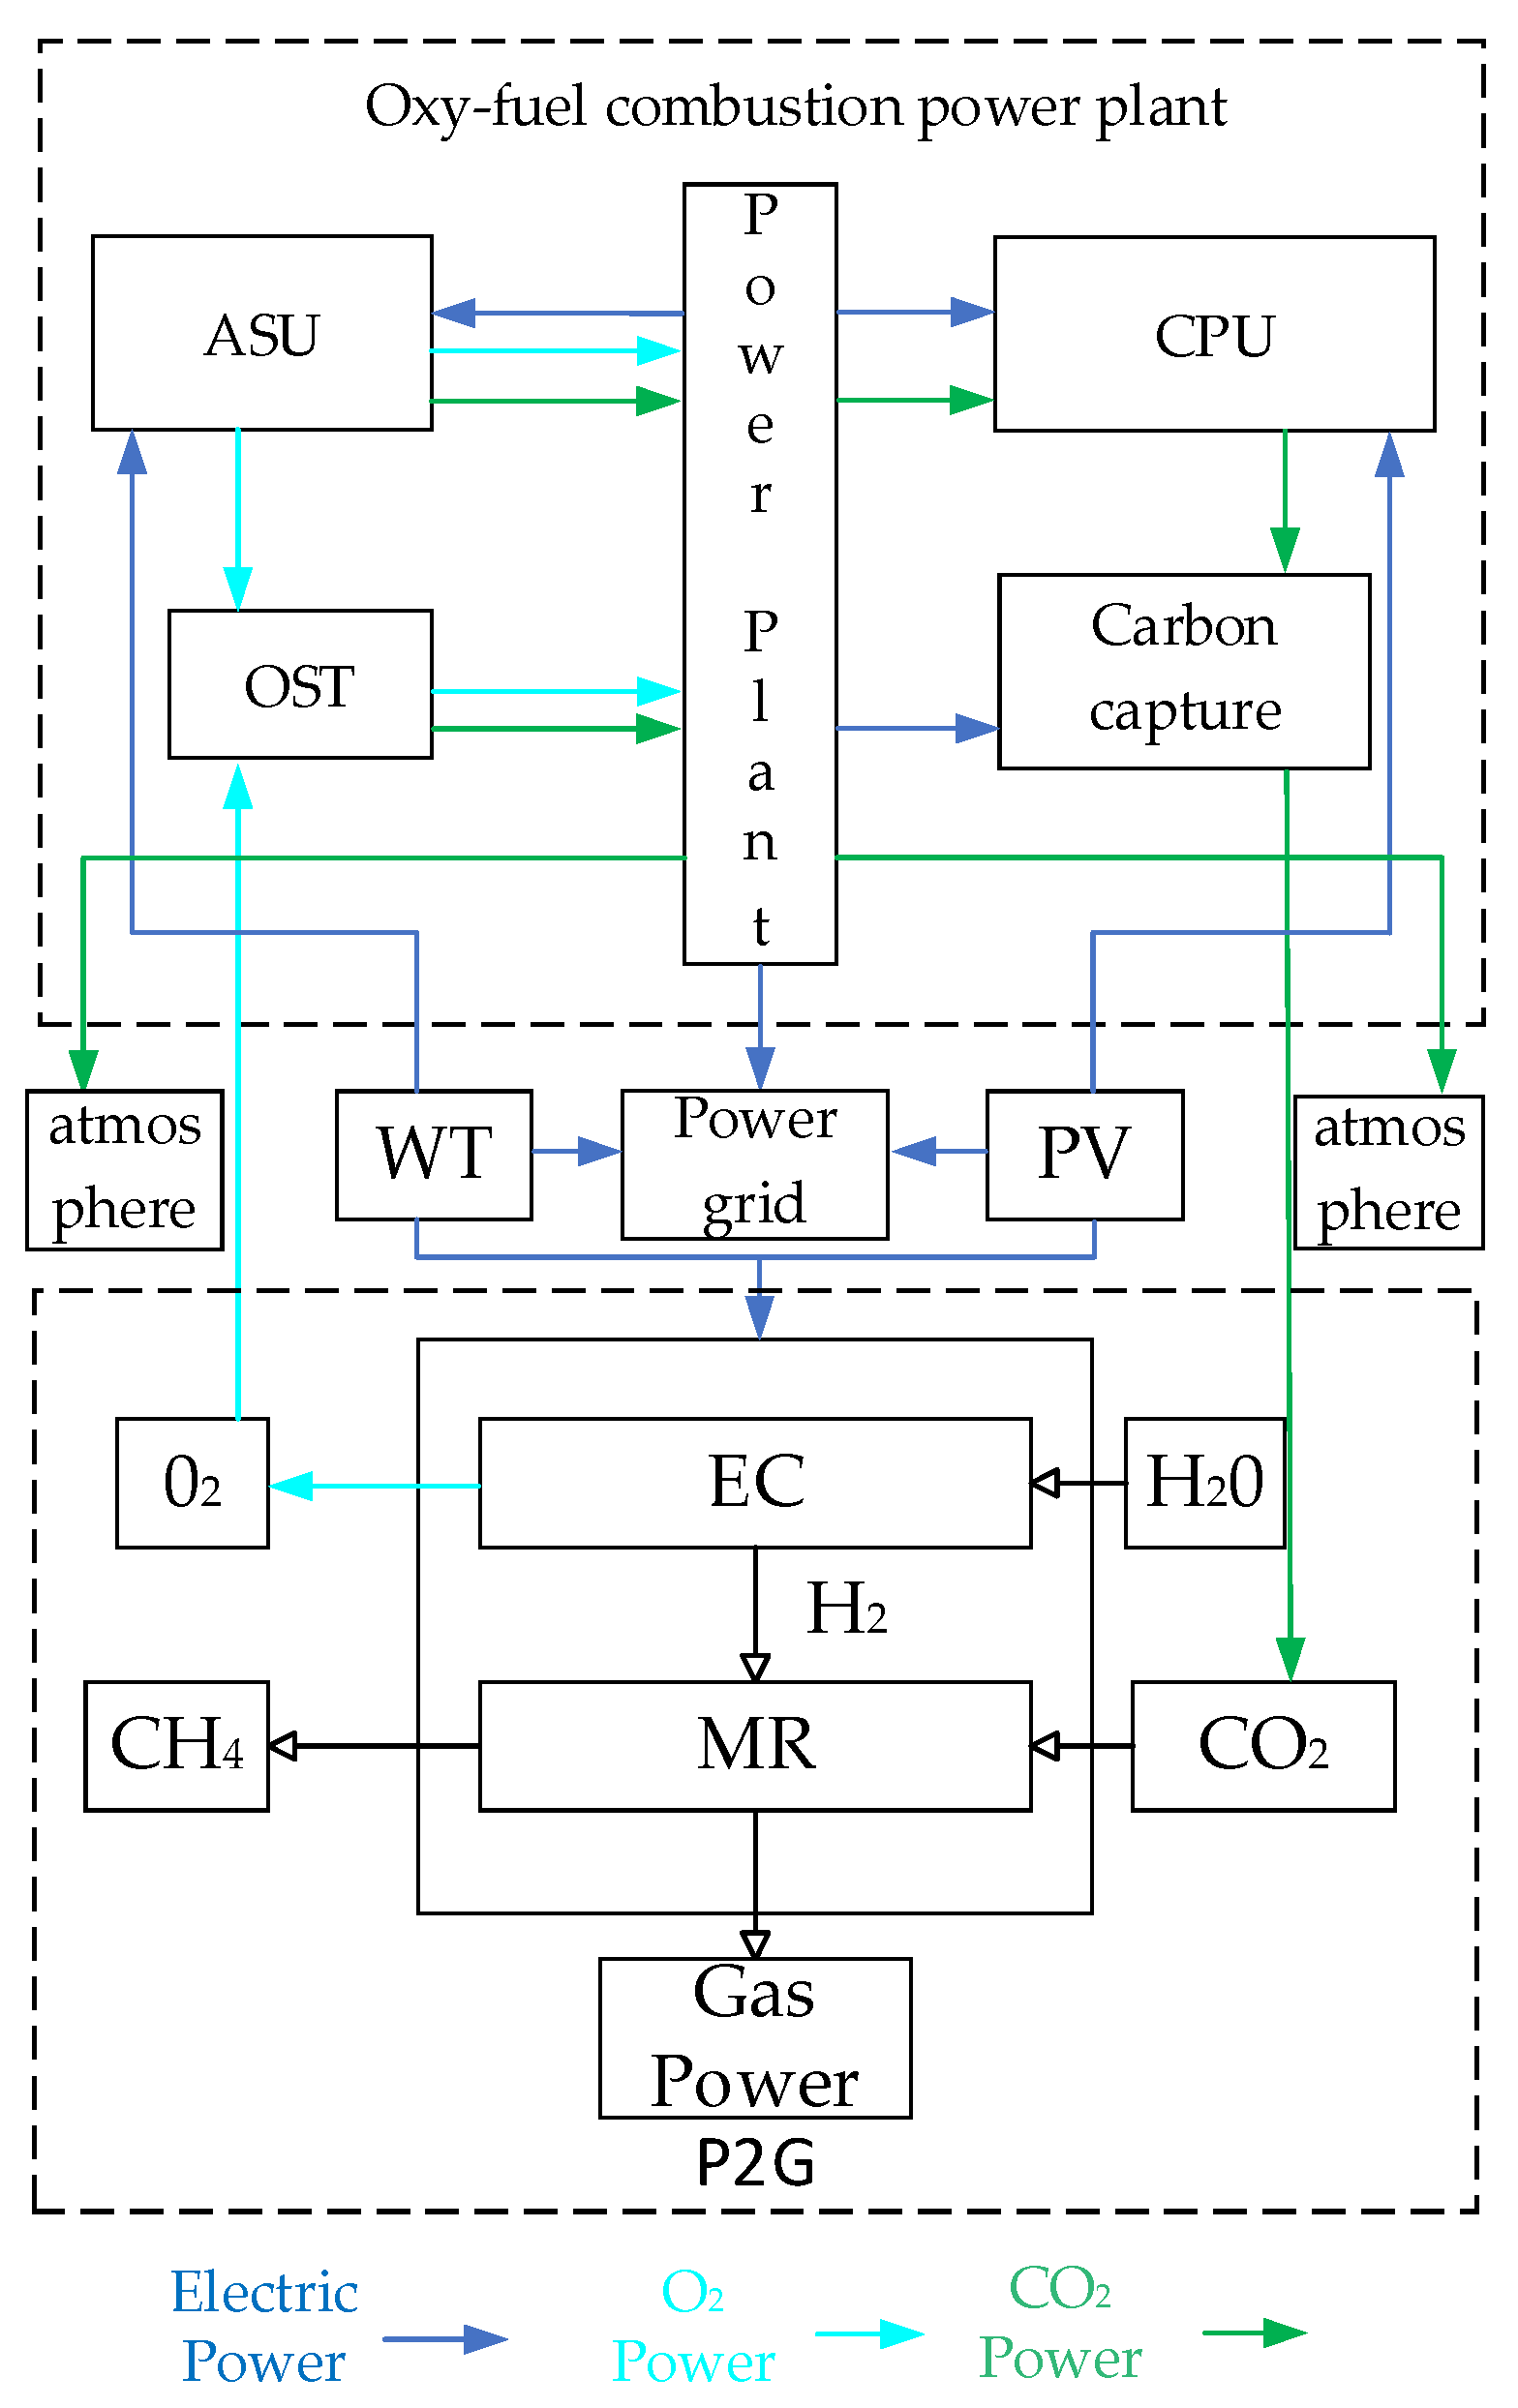
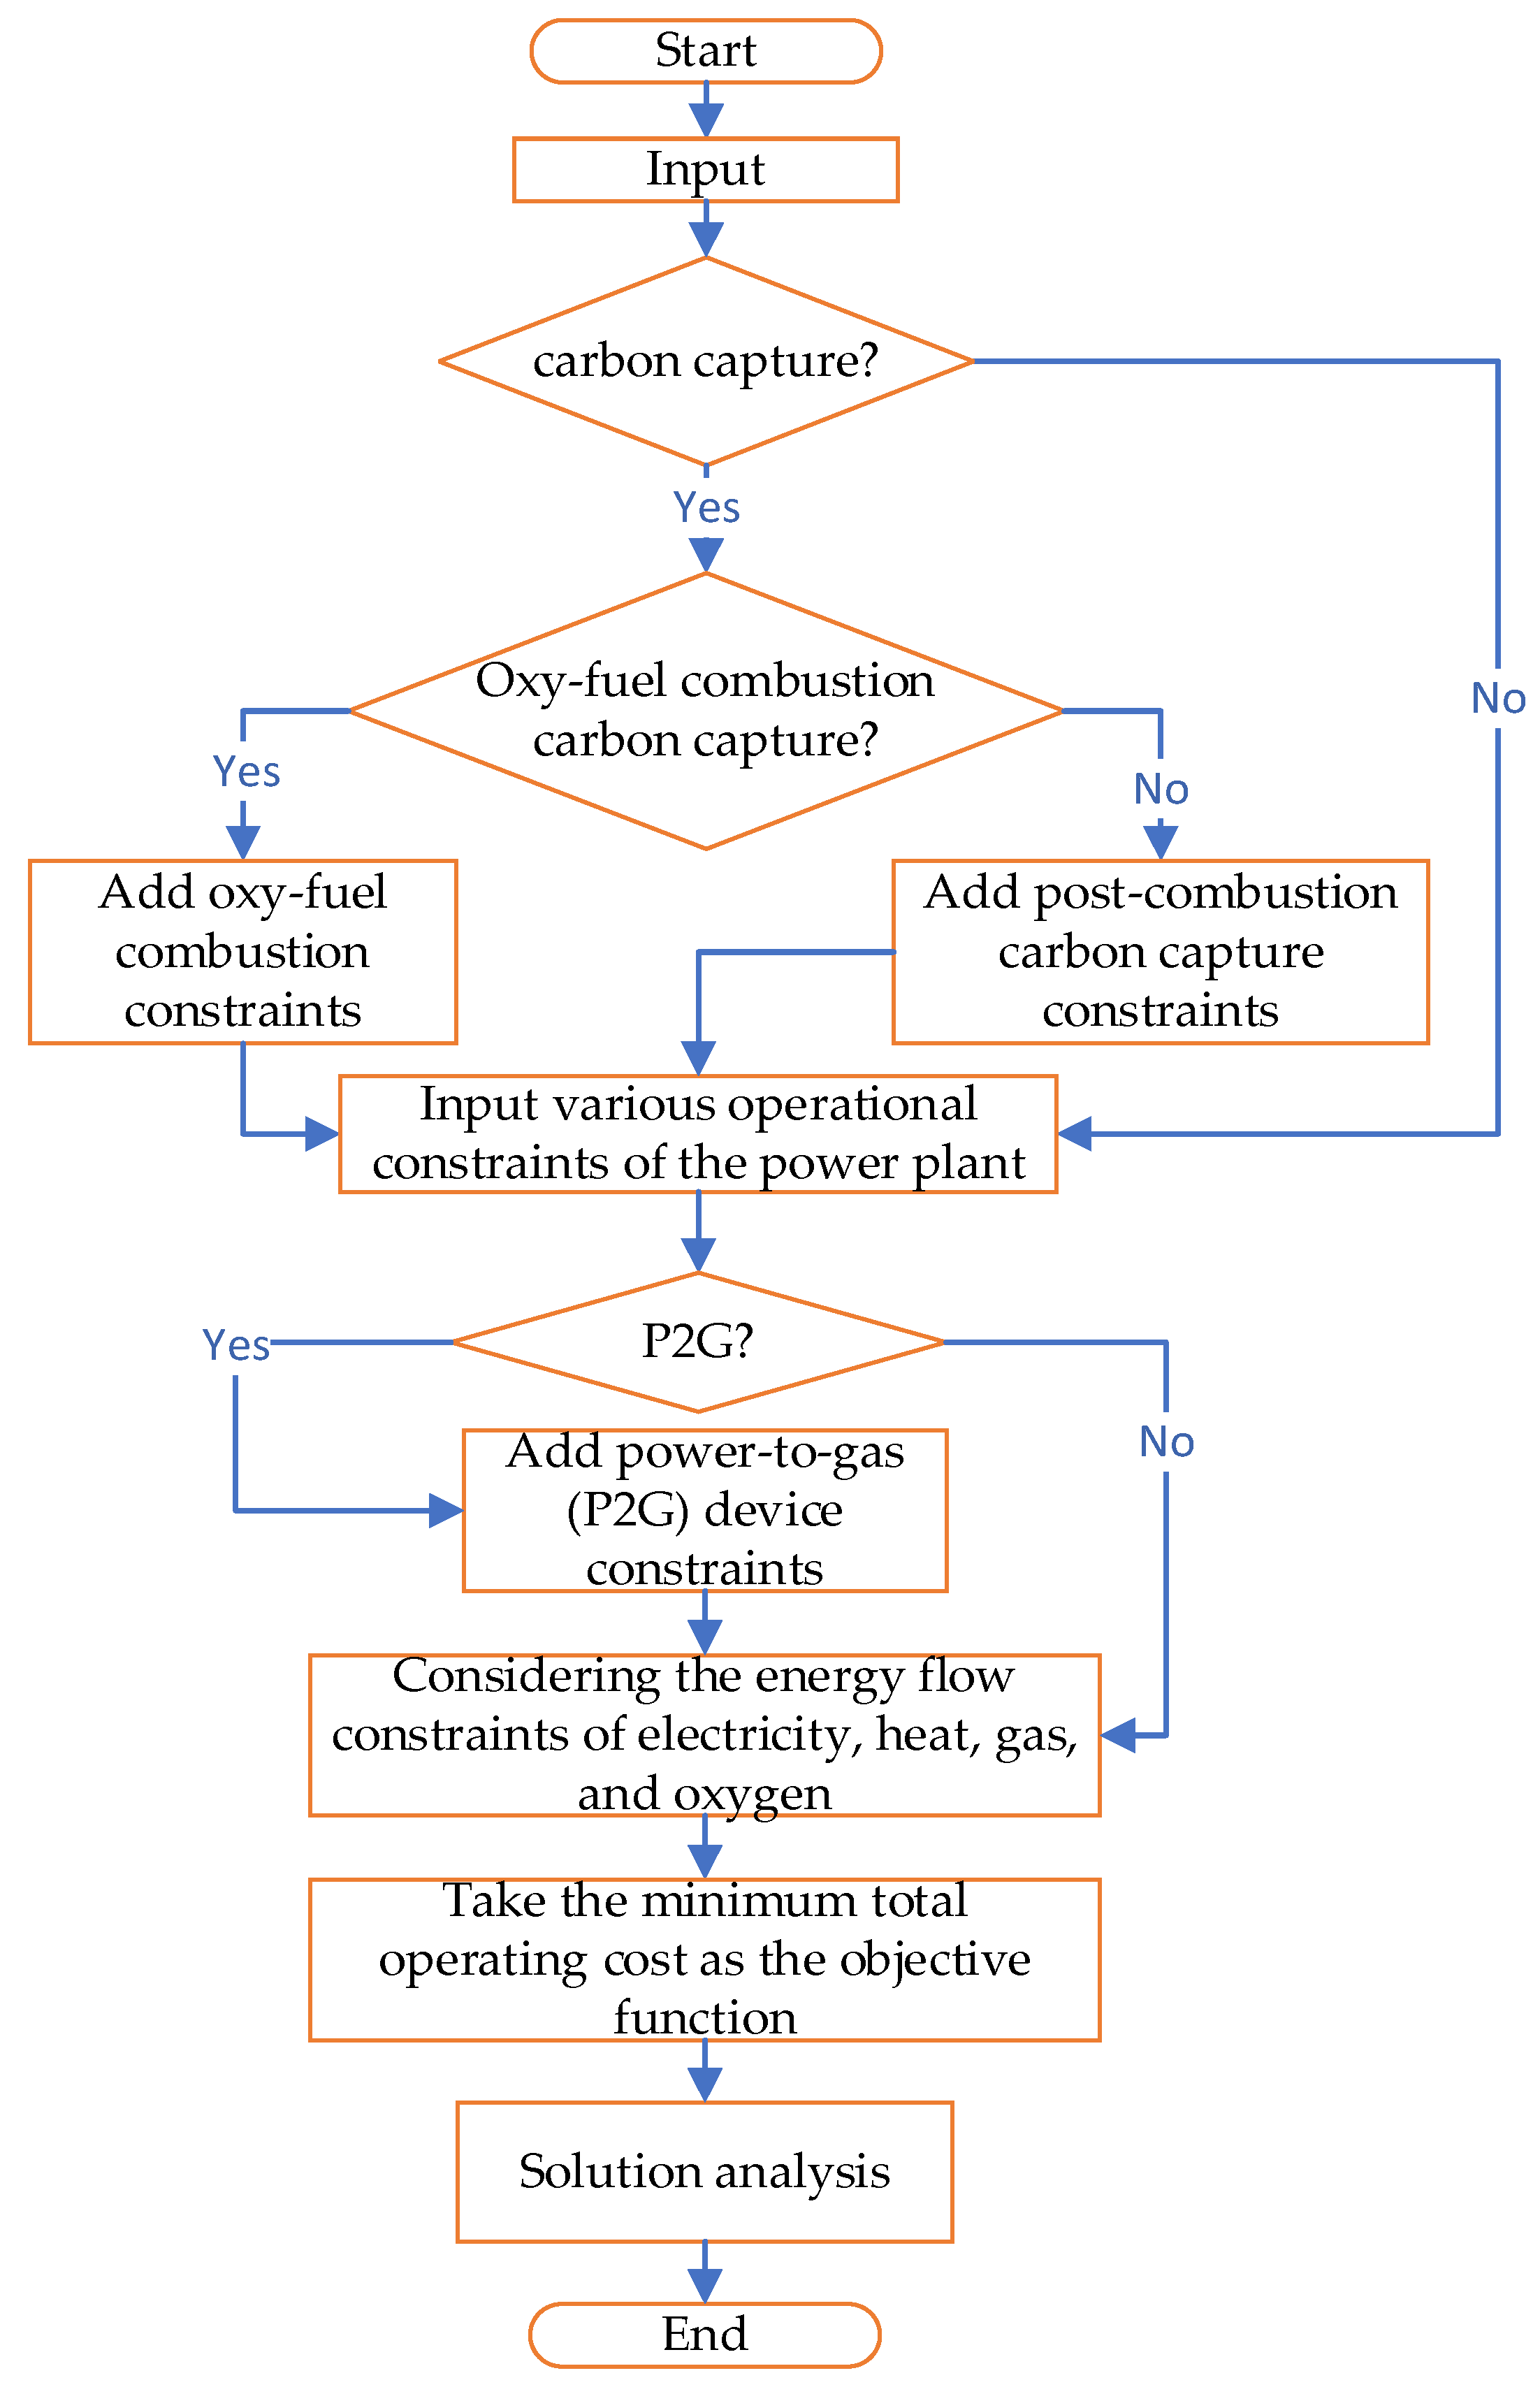
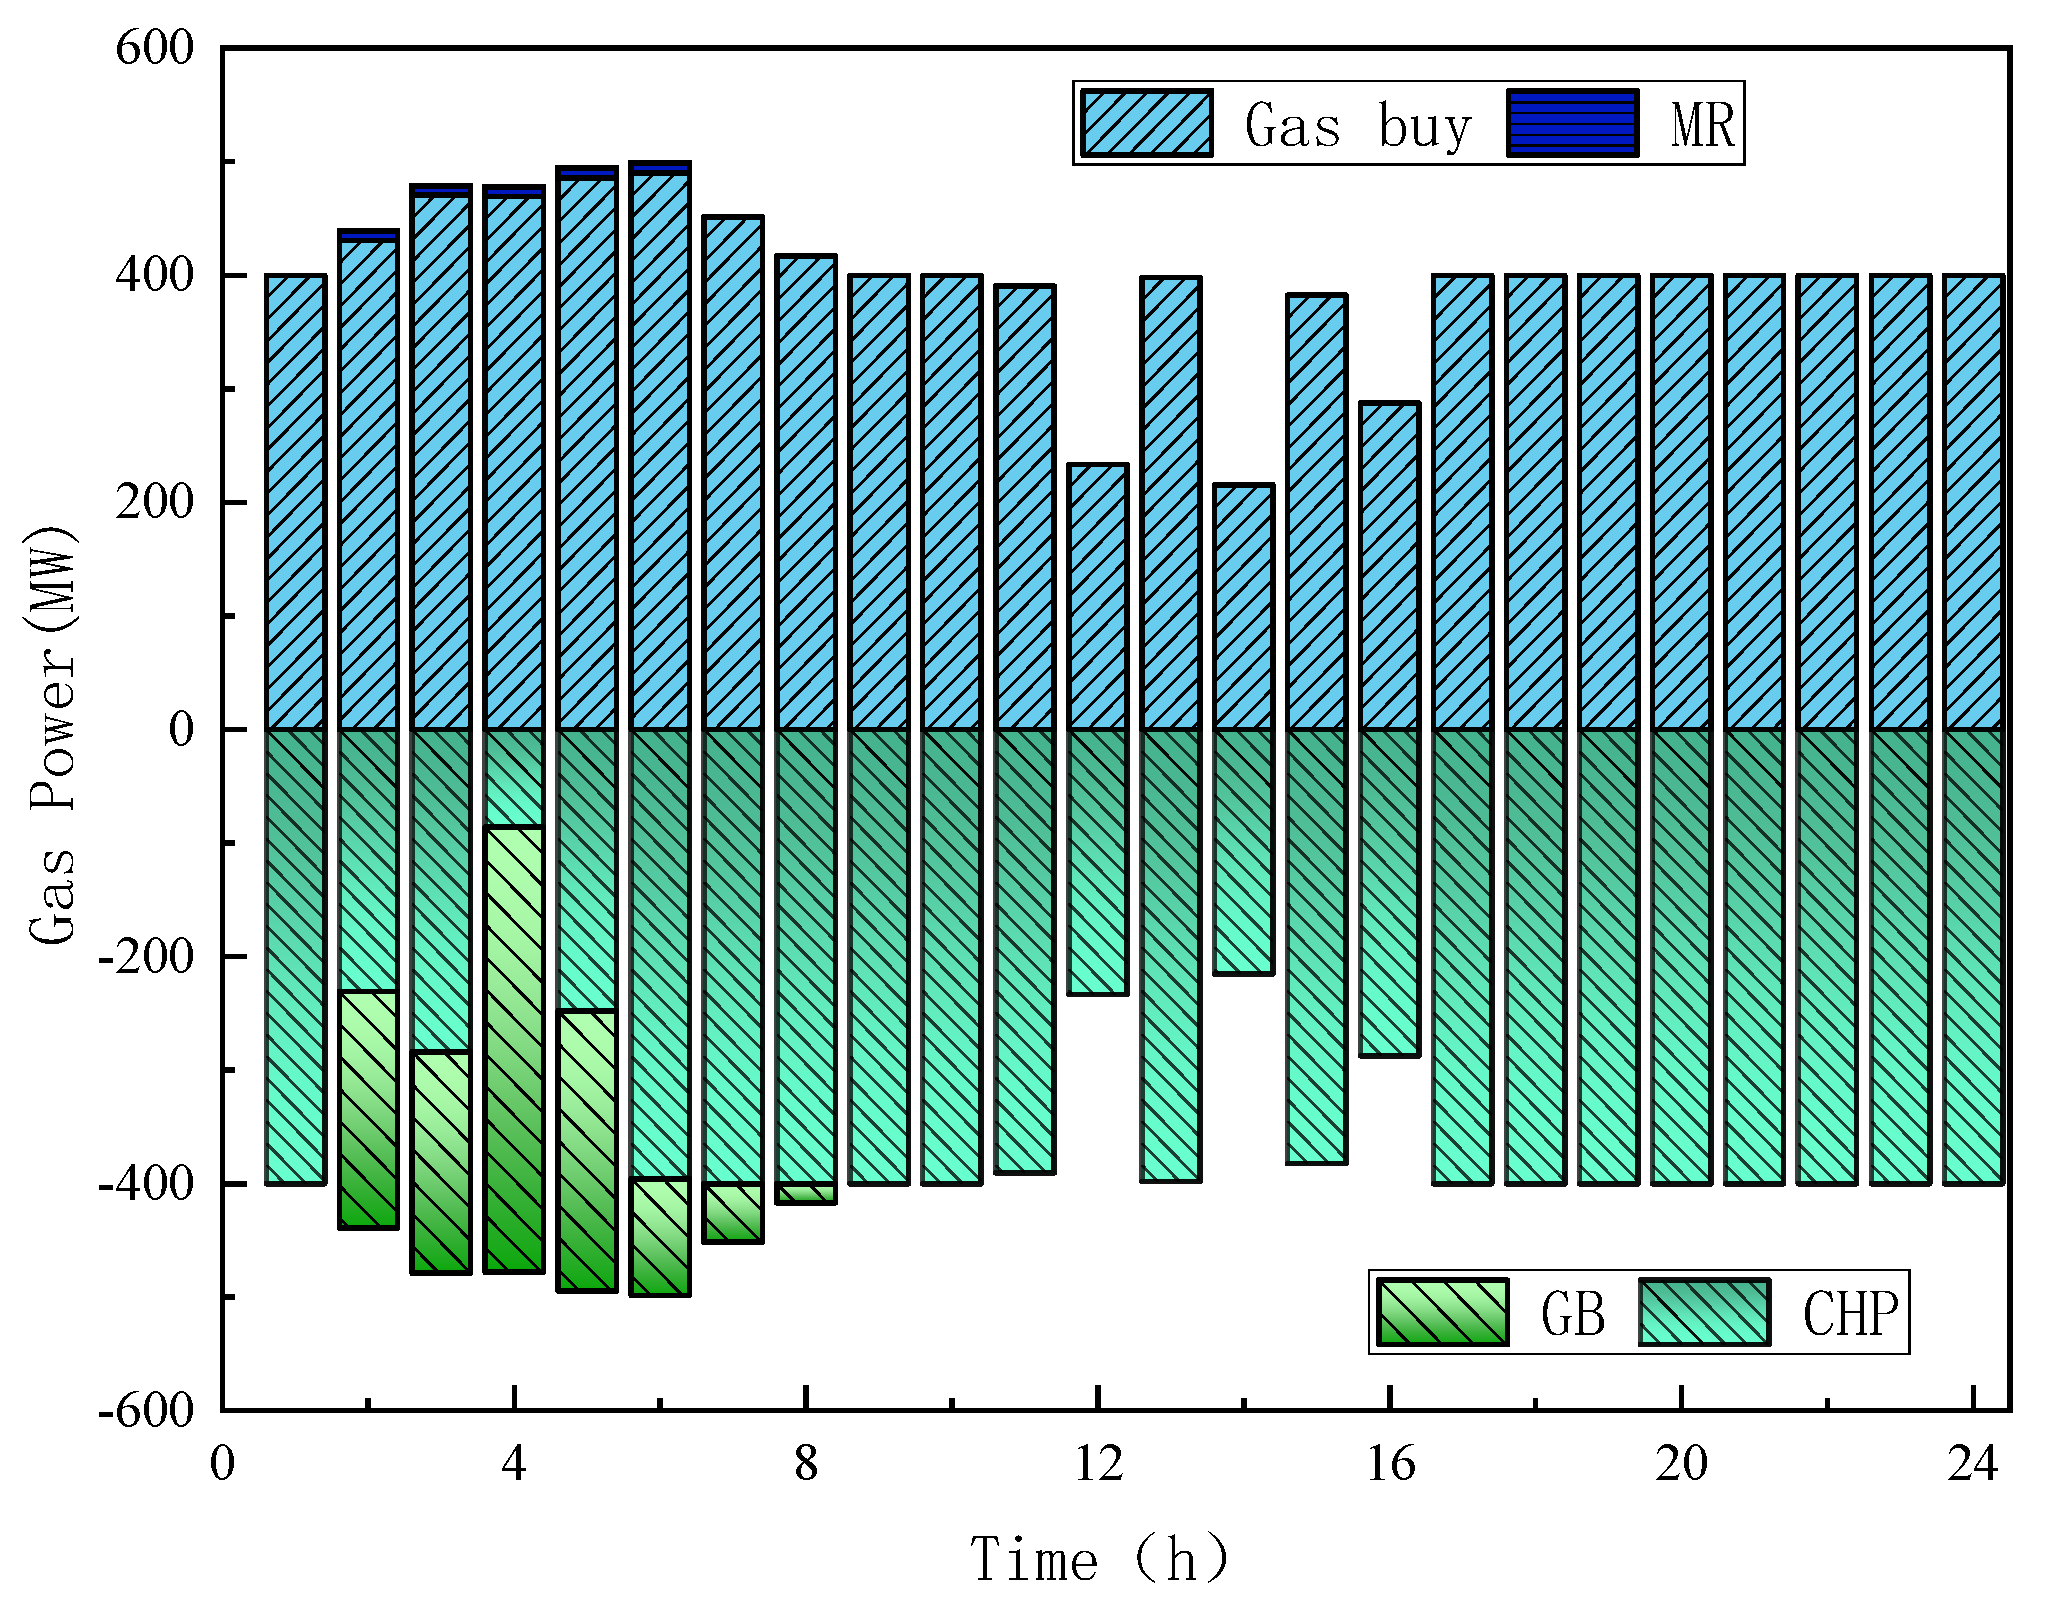
  • An optimal scheduling model was developed incorporating oxy-fuel combustion technology, two-stage P2G conversion, and Combined Heat and Power (CHP) units, thereby enhancing the multi-energy coupling among electricity, heat, gas, and oxygen storage systems.
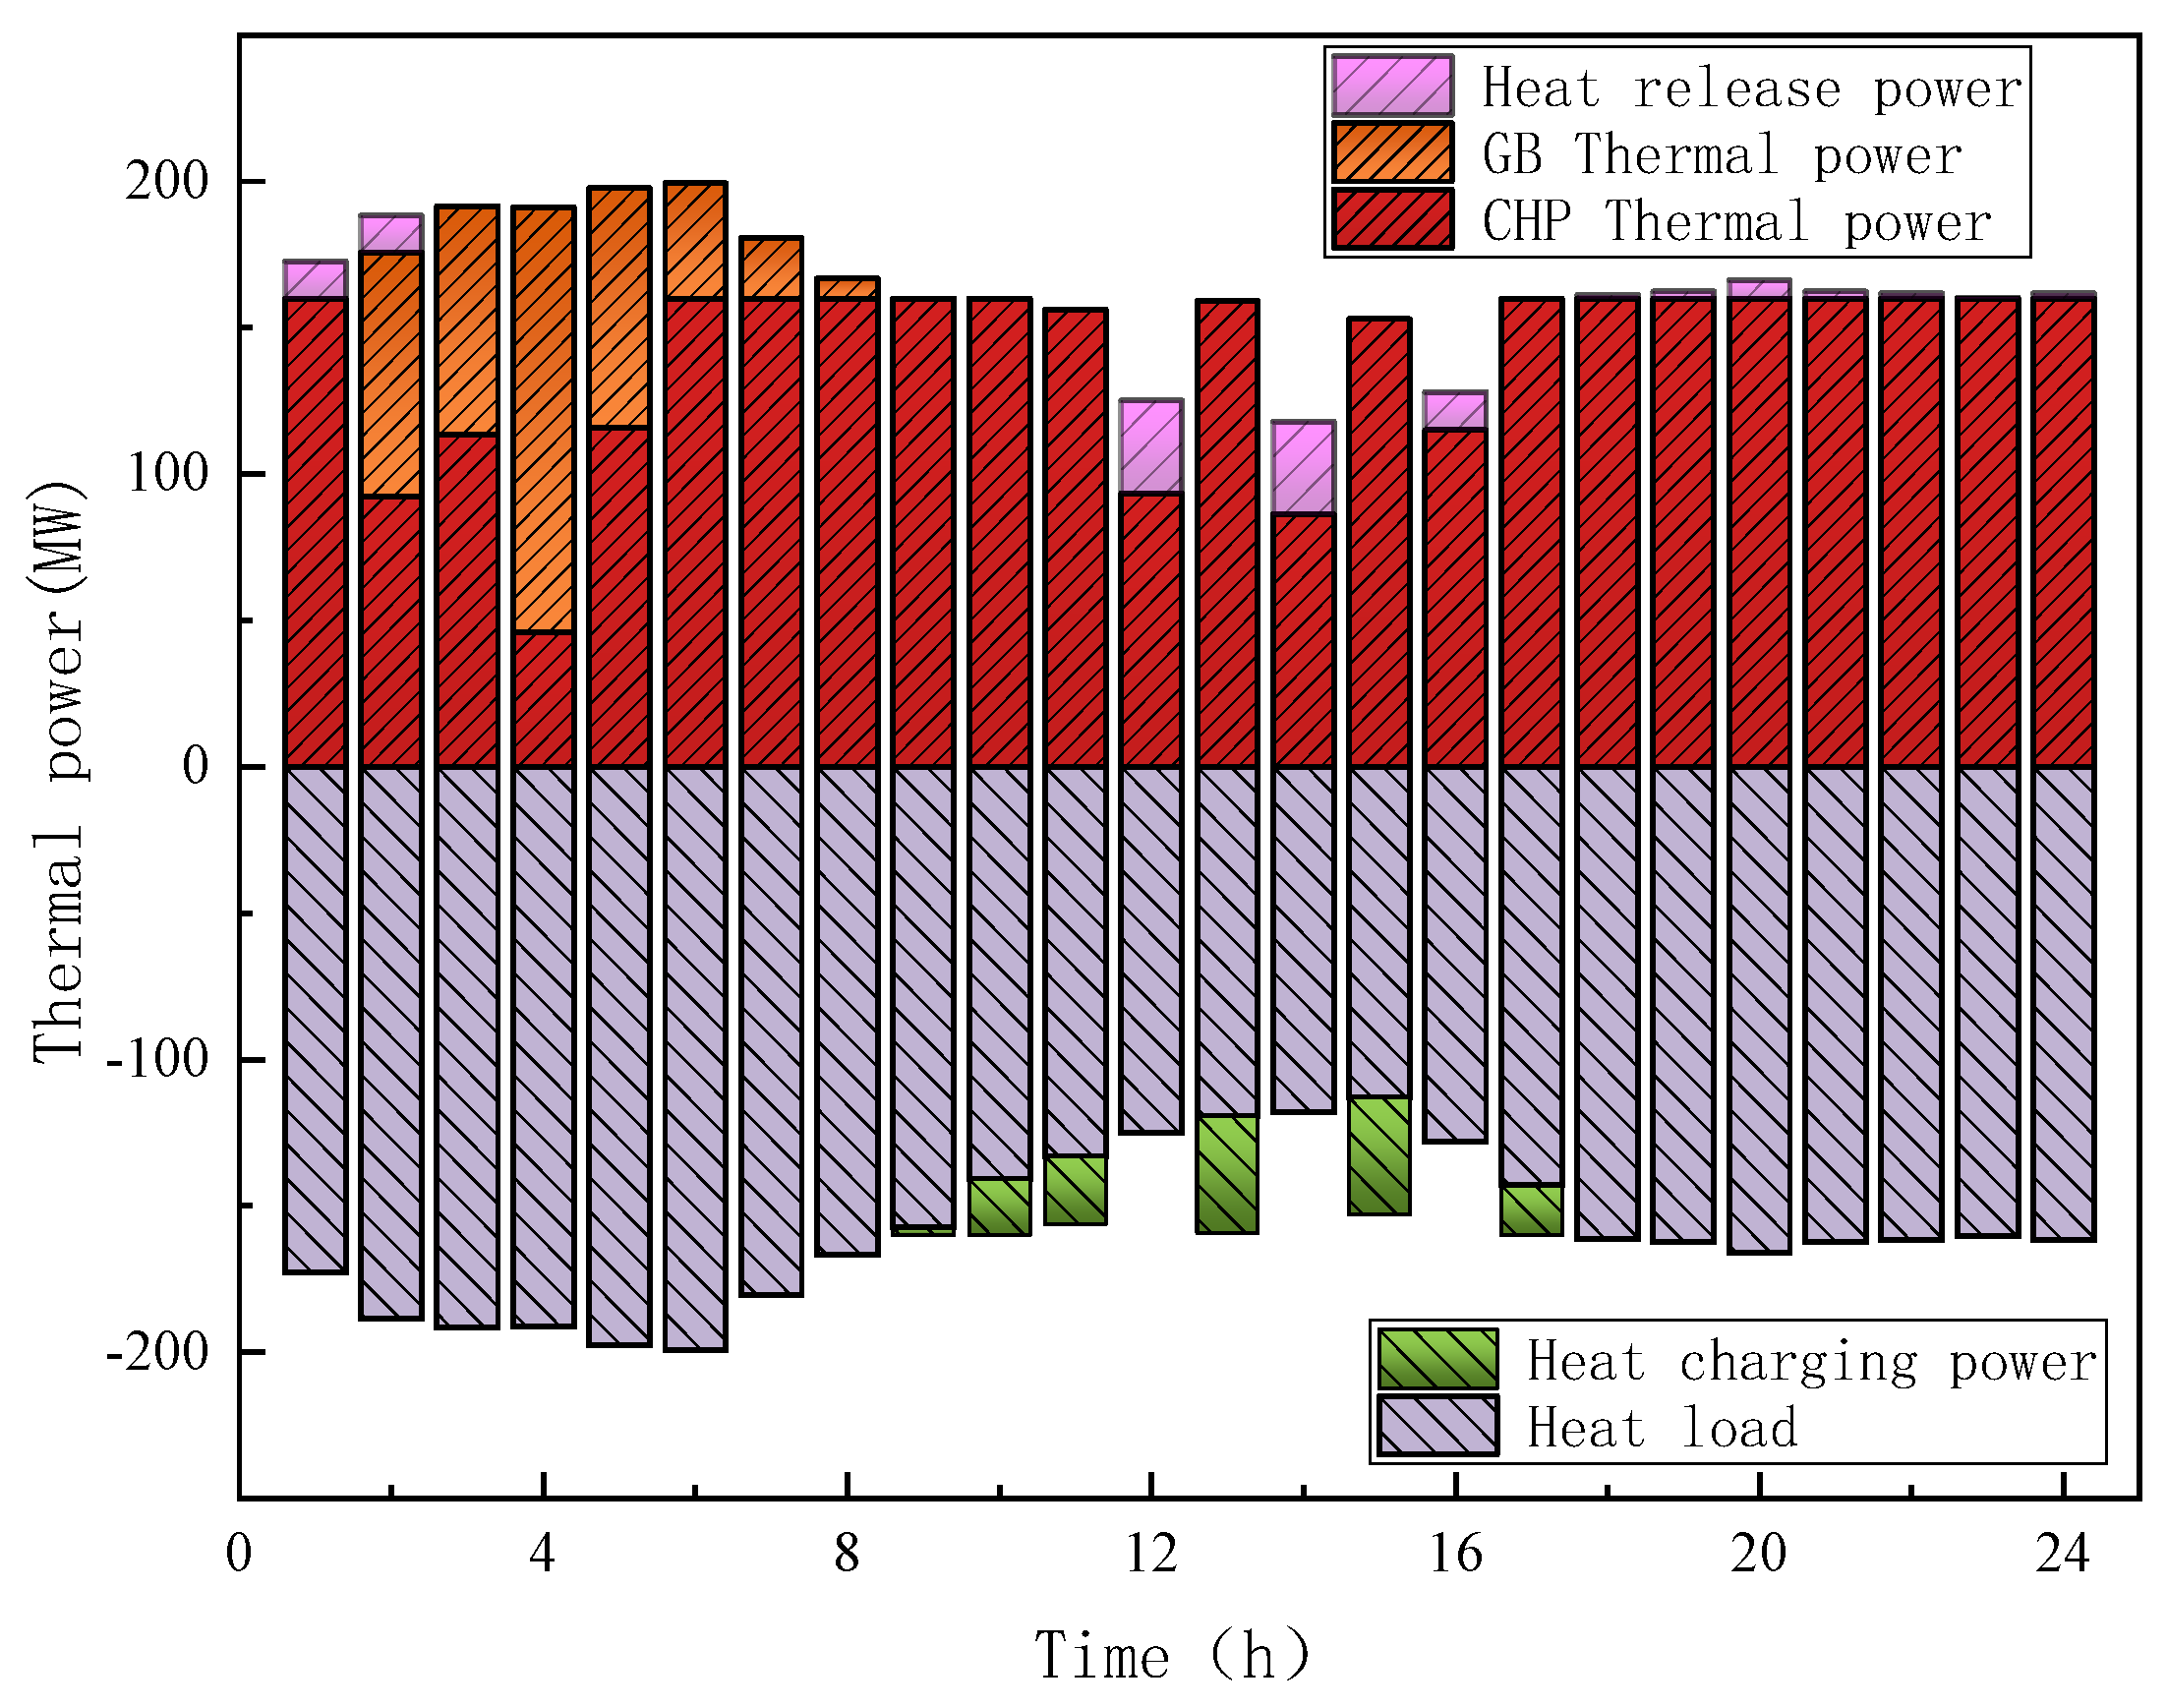
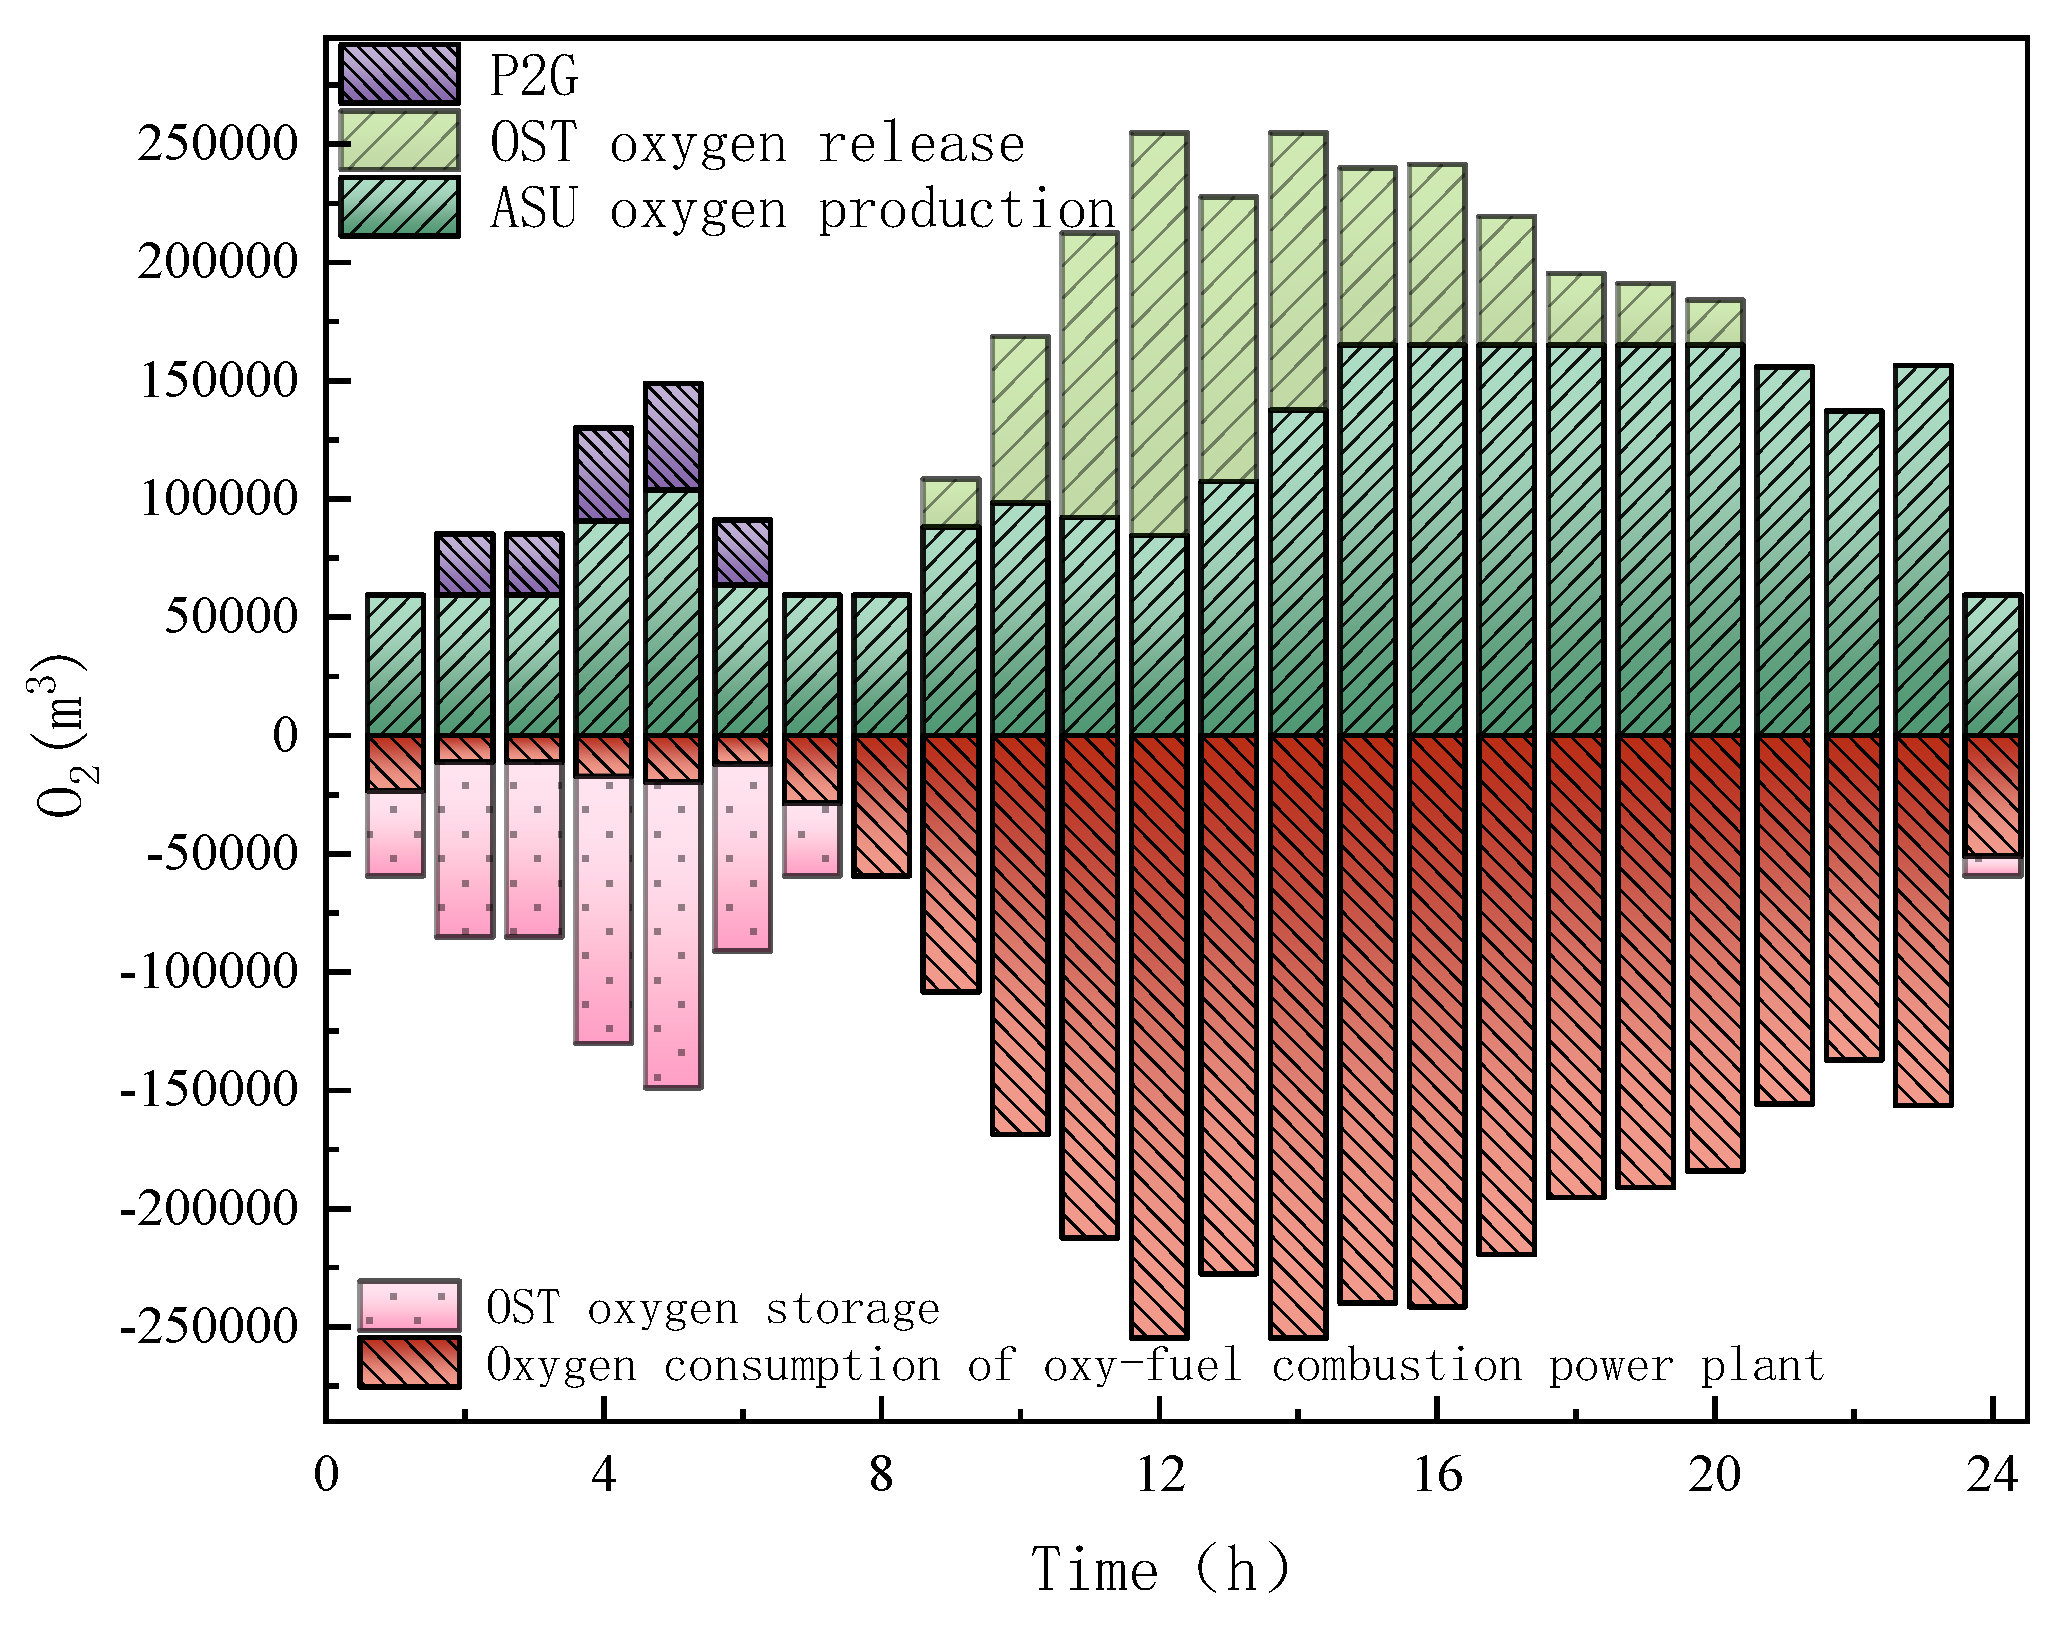
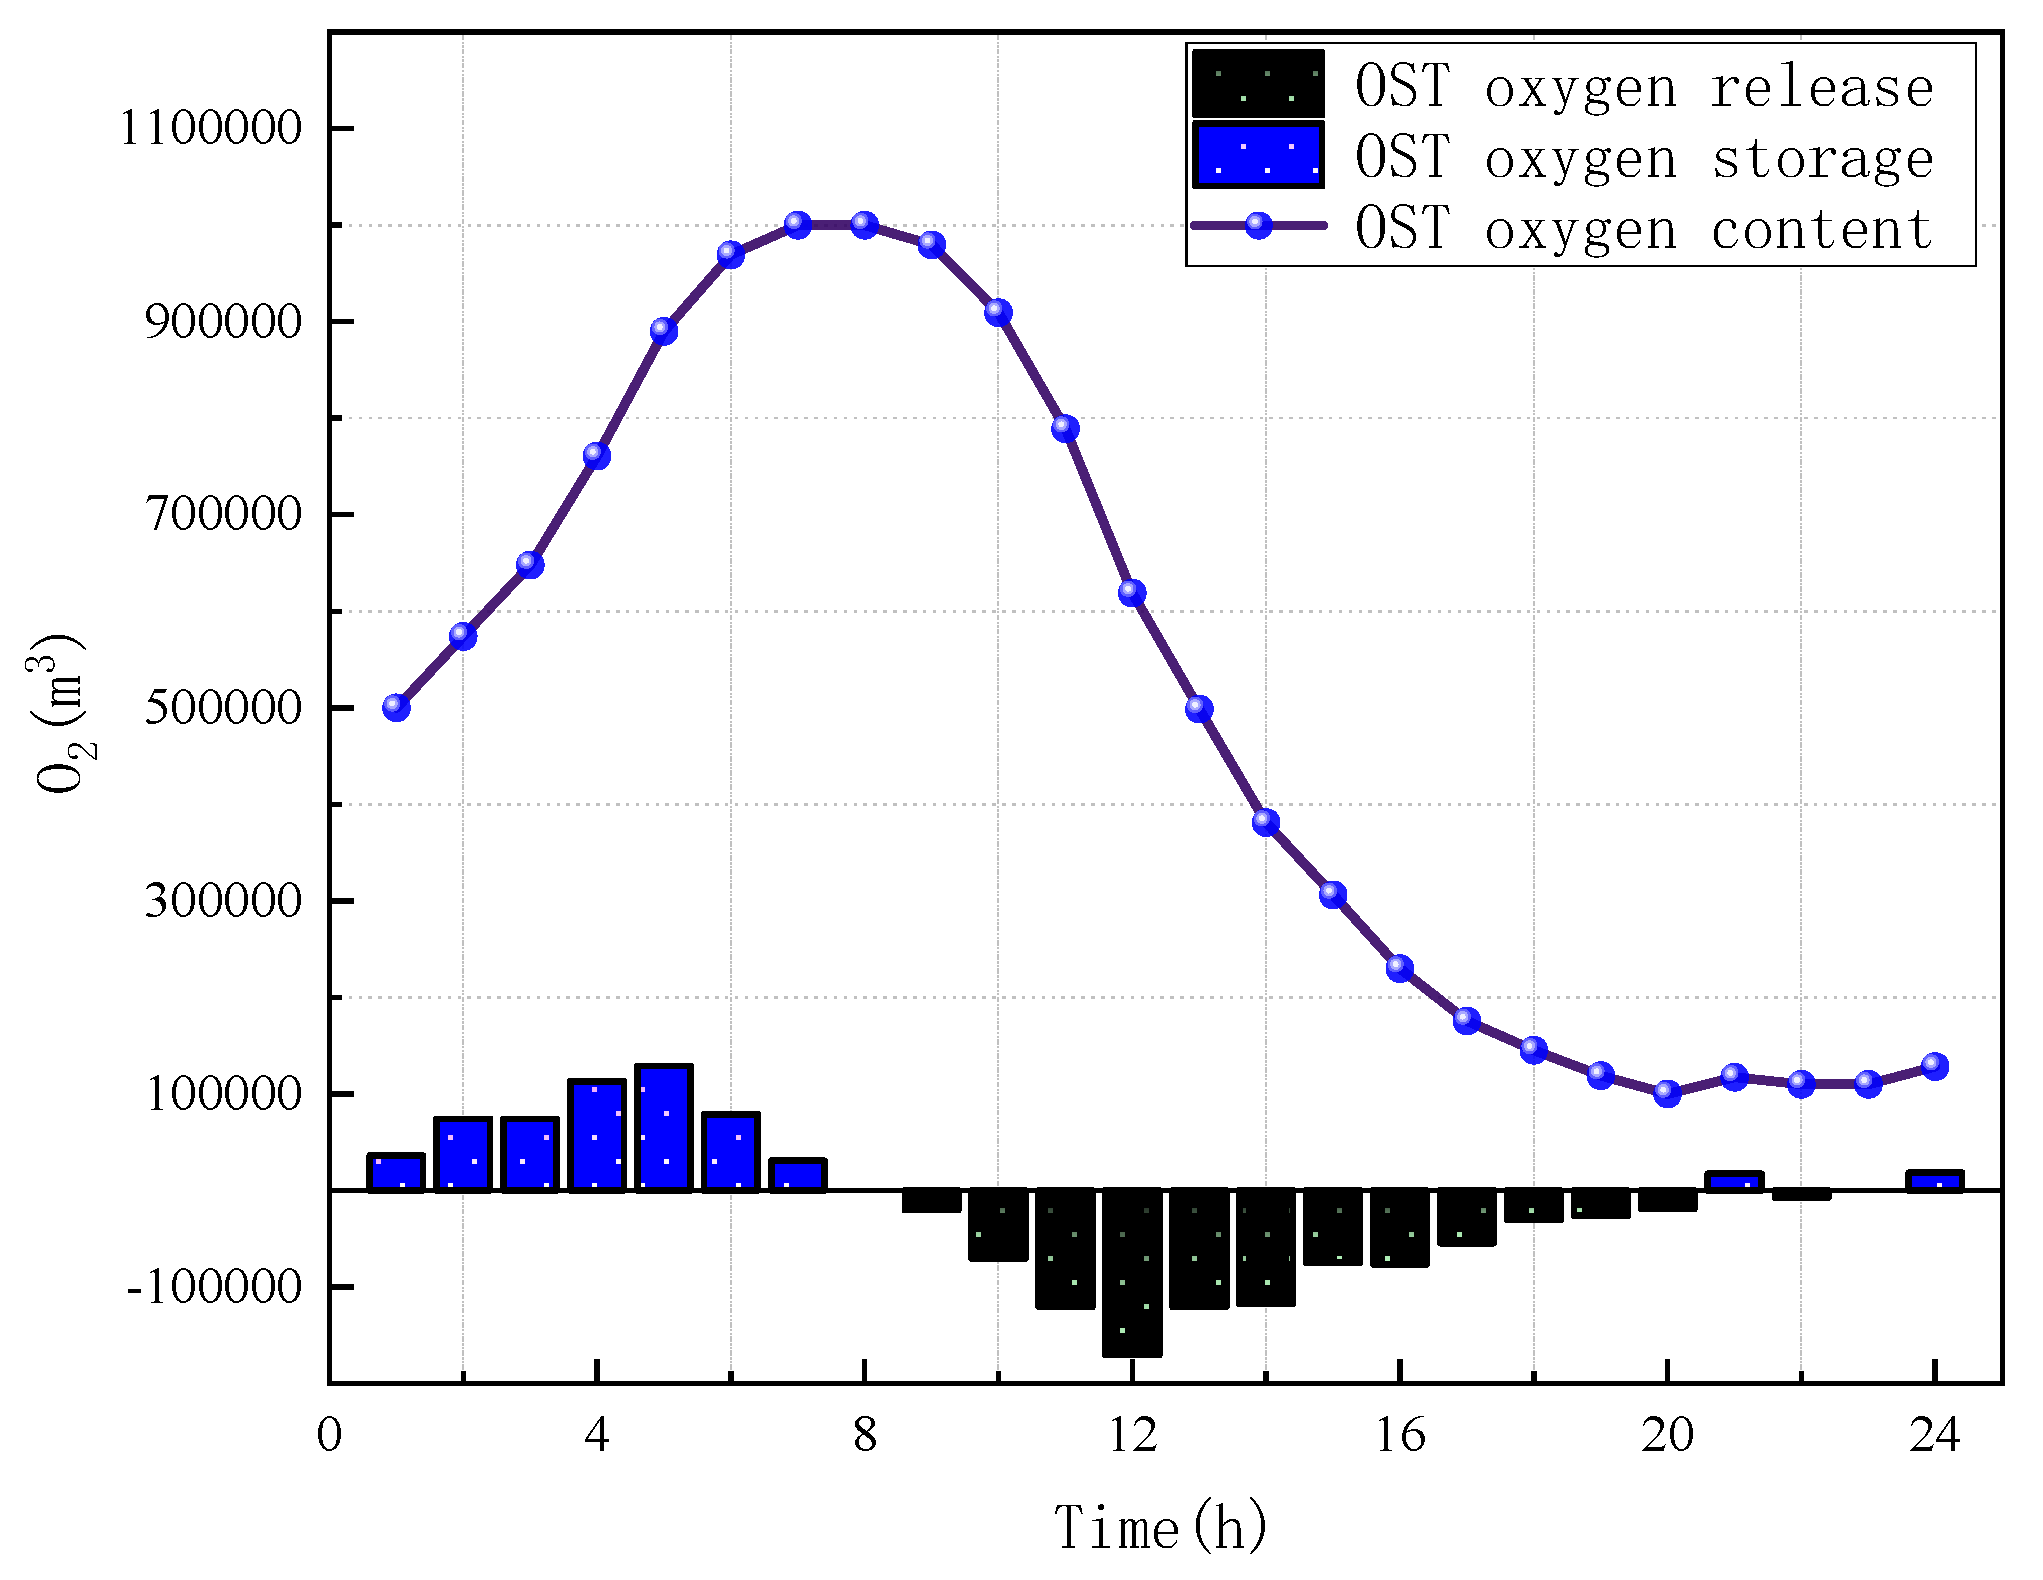
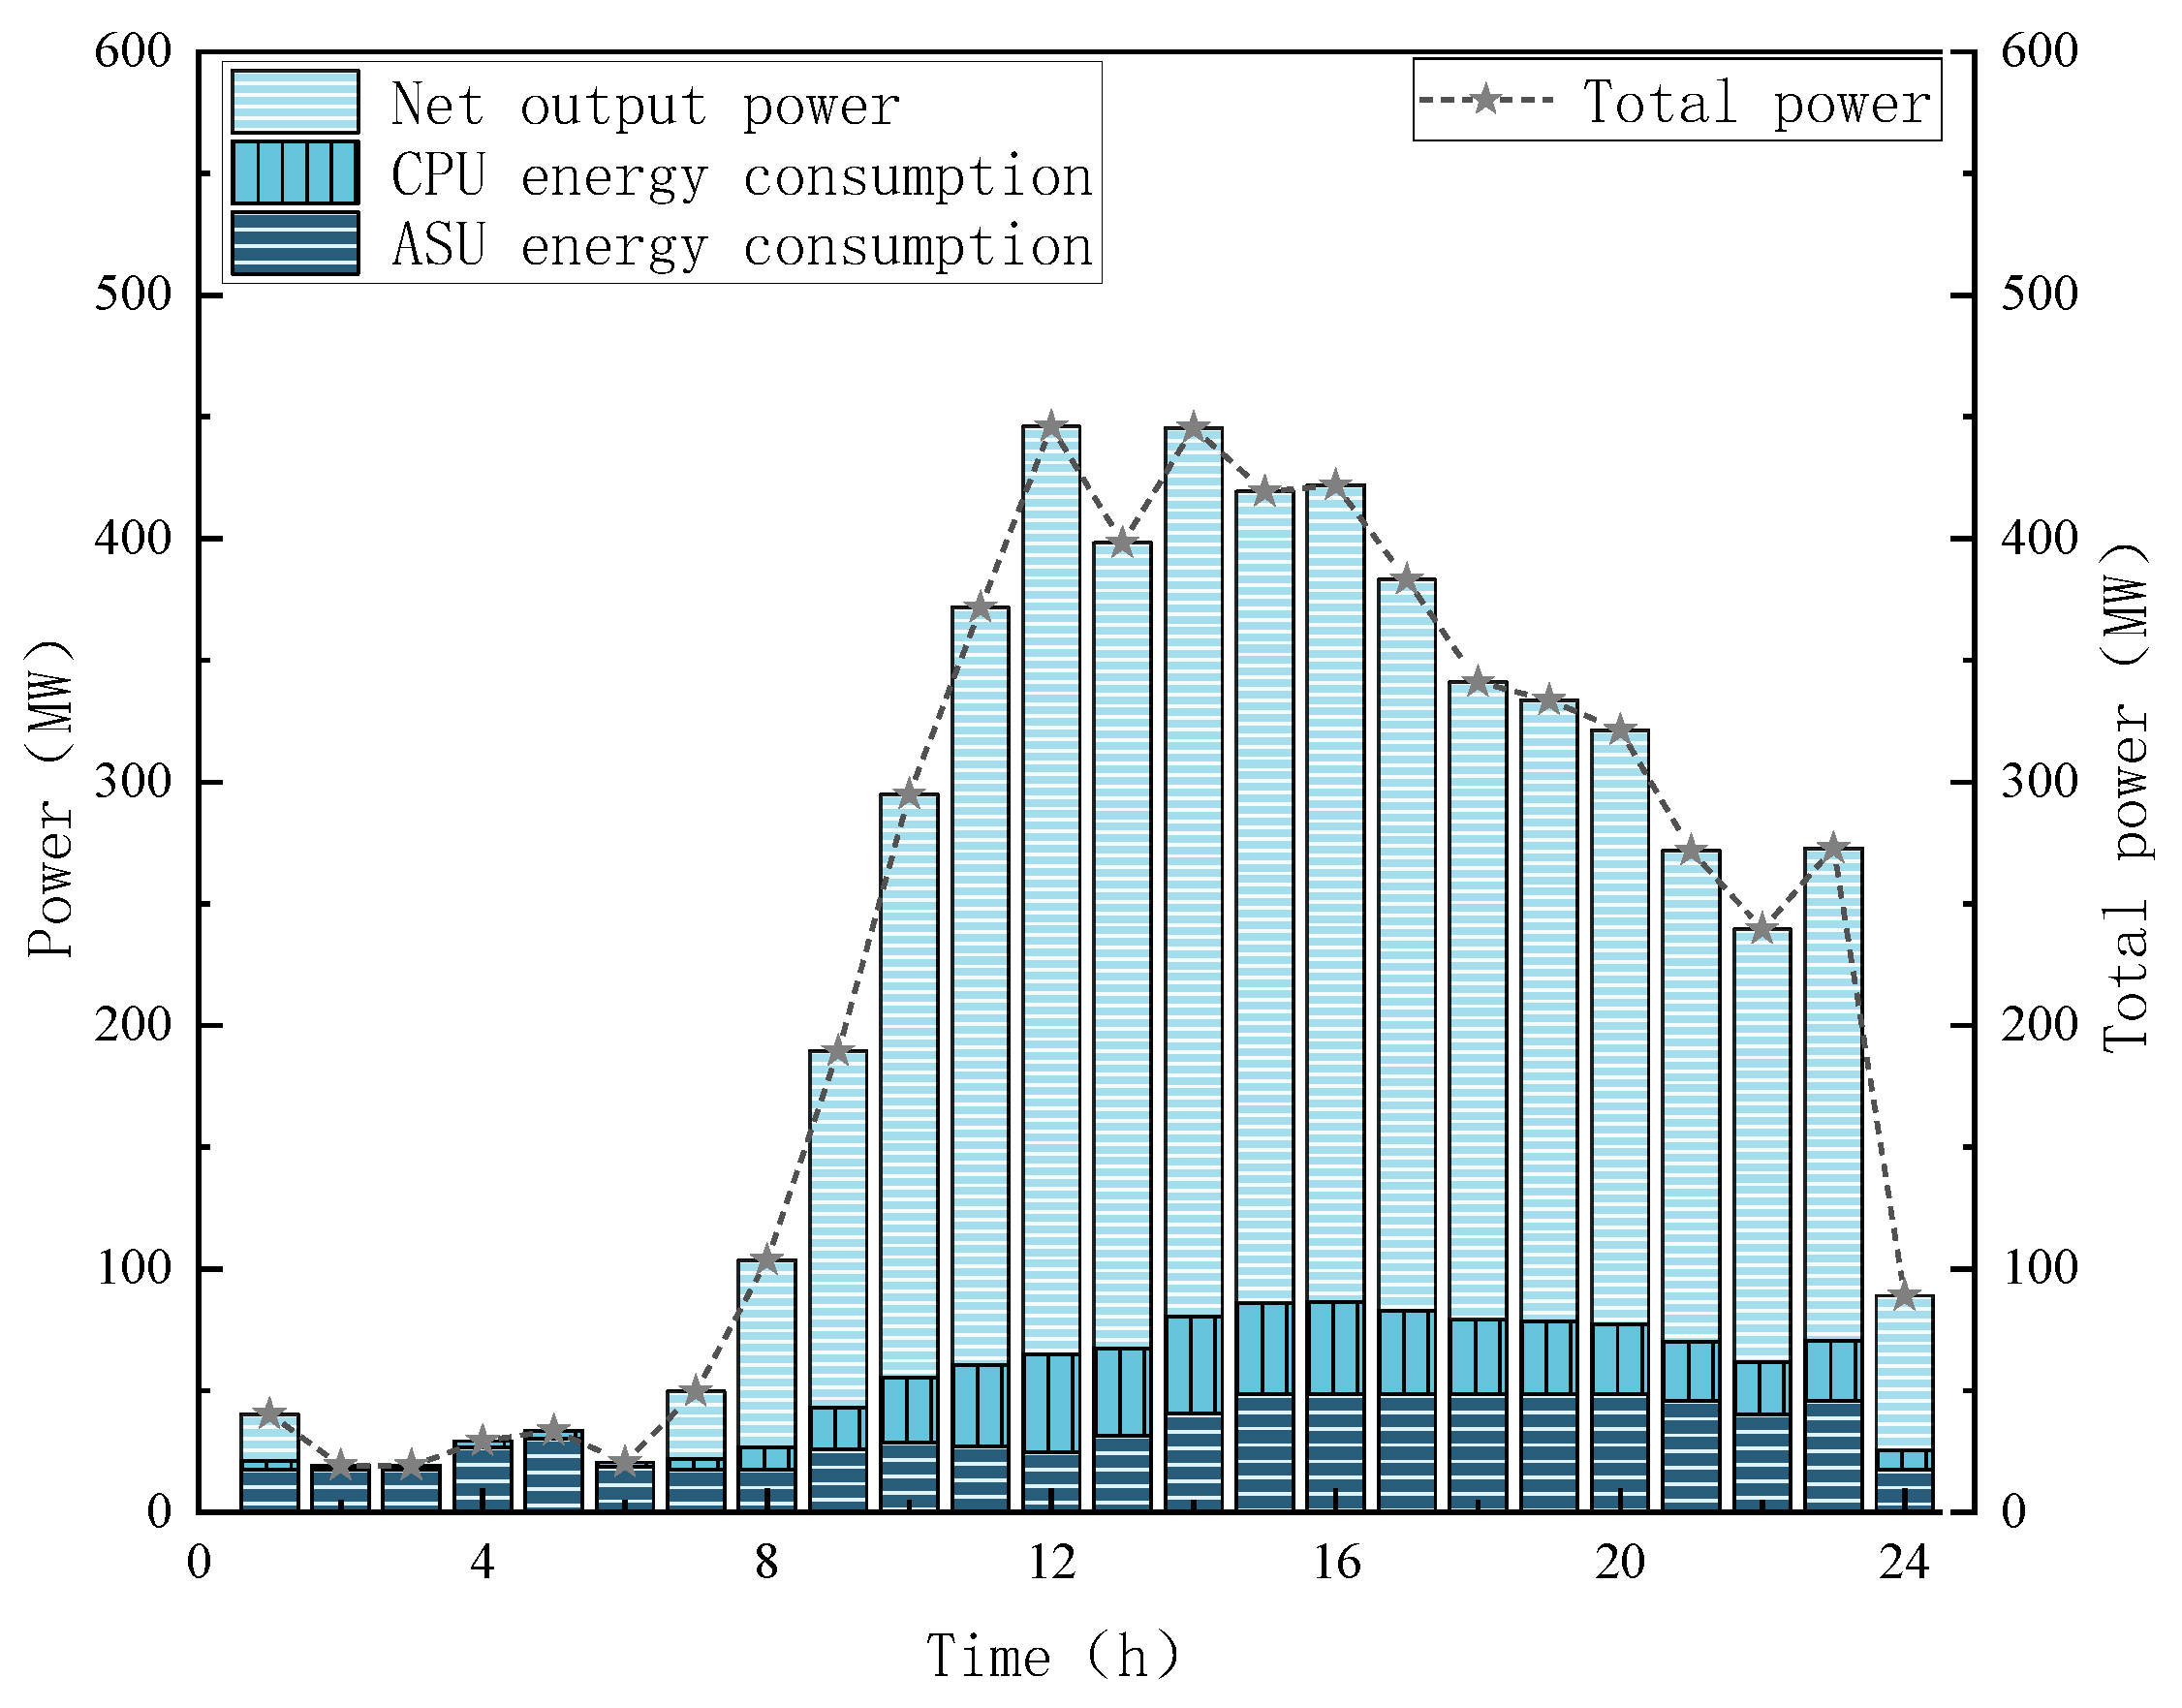
  • The oxygen storage tank in oxy-fuel plants implements valley-storage/peak-release strategies to optimize oxygen supply flexibility while reducing energy consumption of air separation units (ASU). Coupled with battery/thermal storage systems enabling dual-peak regulation of electricity and heat loads, this configuration coordinates multi-energy outputs across timeframes, demonstrating energy storage’s critical role in enhancing system flexibility.
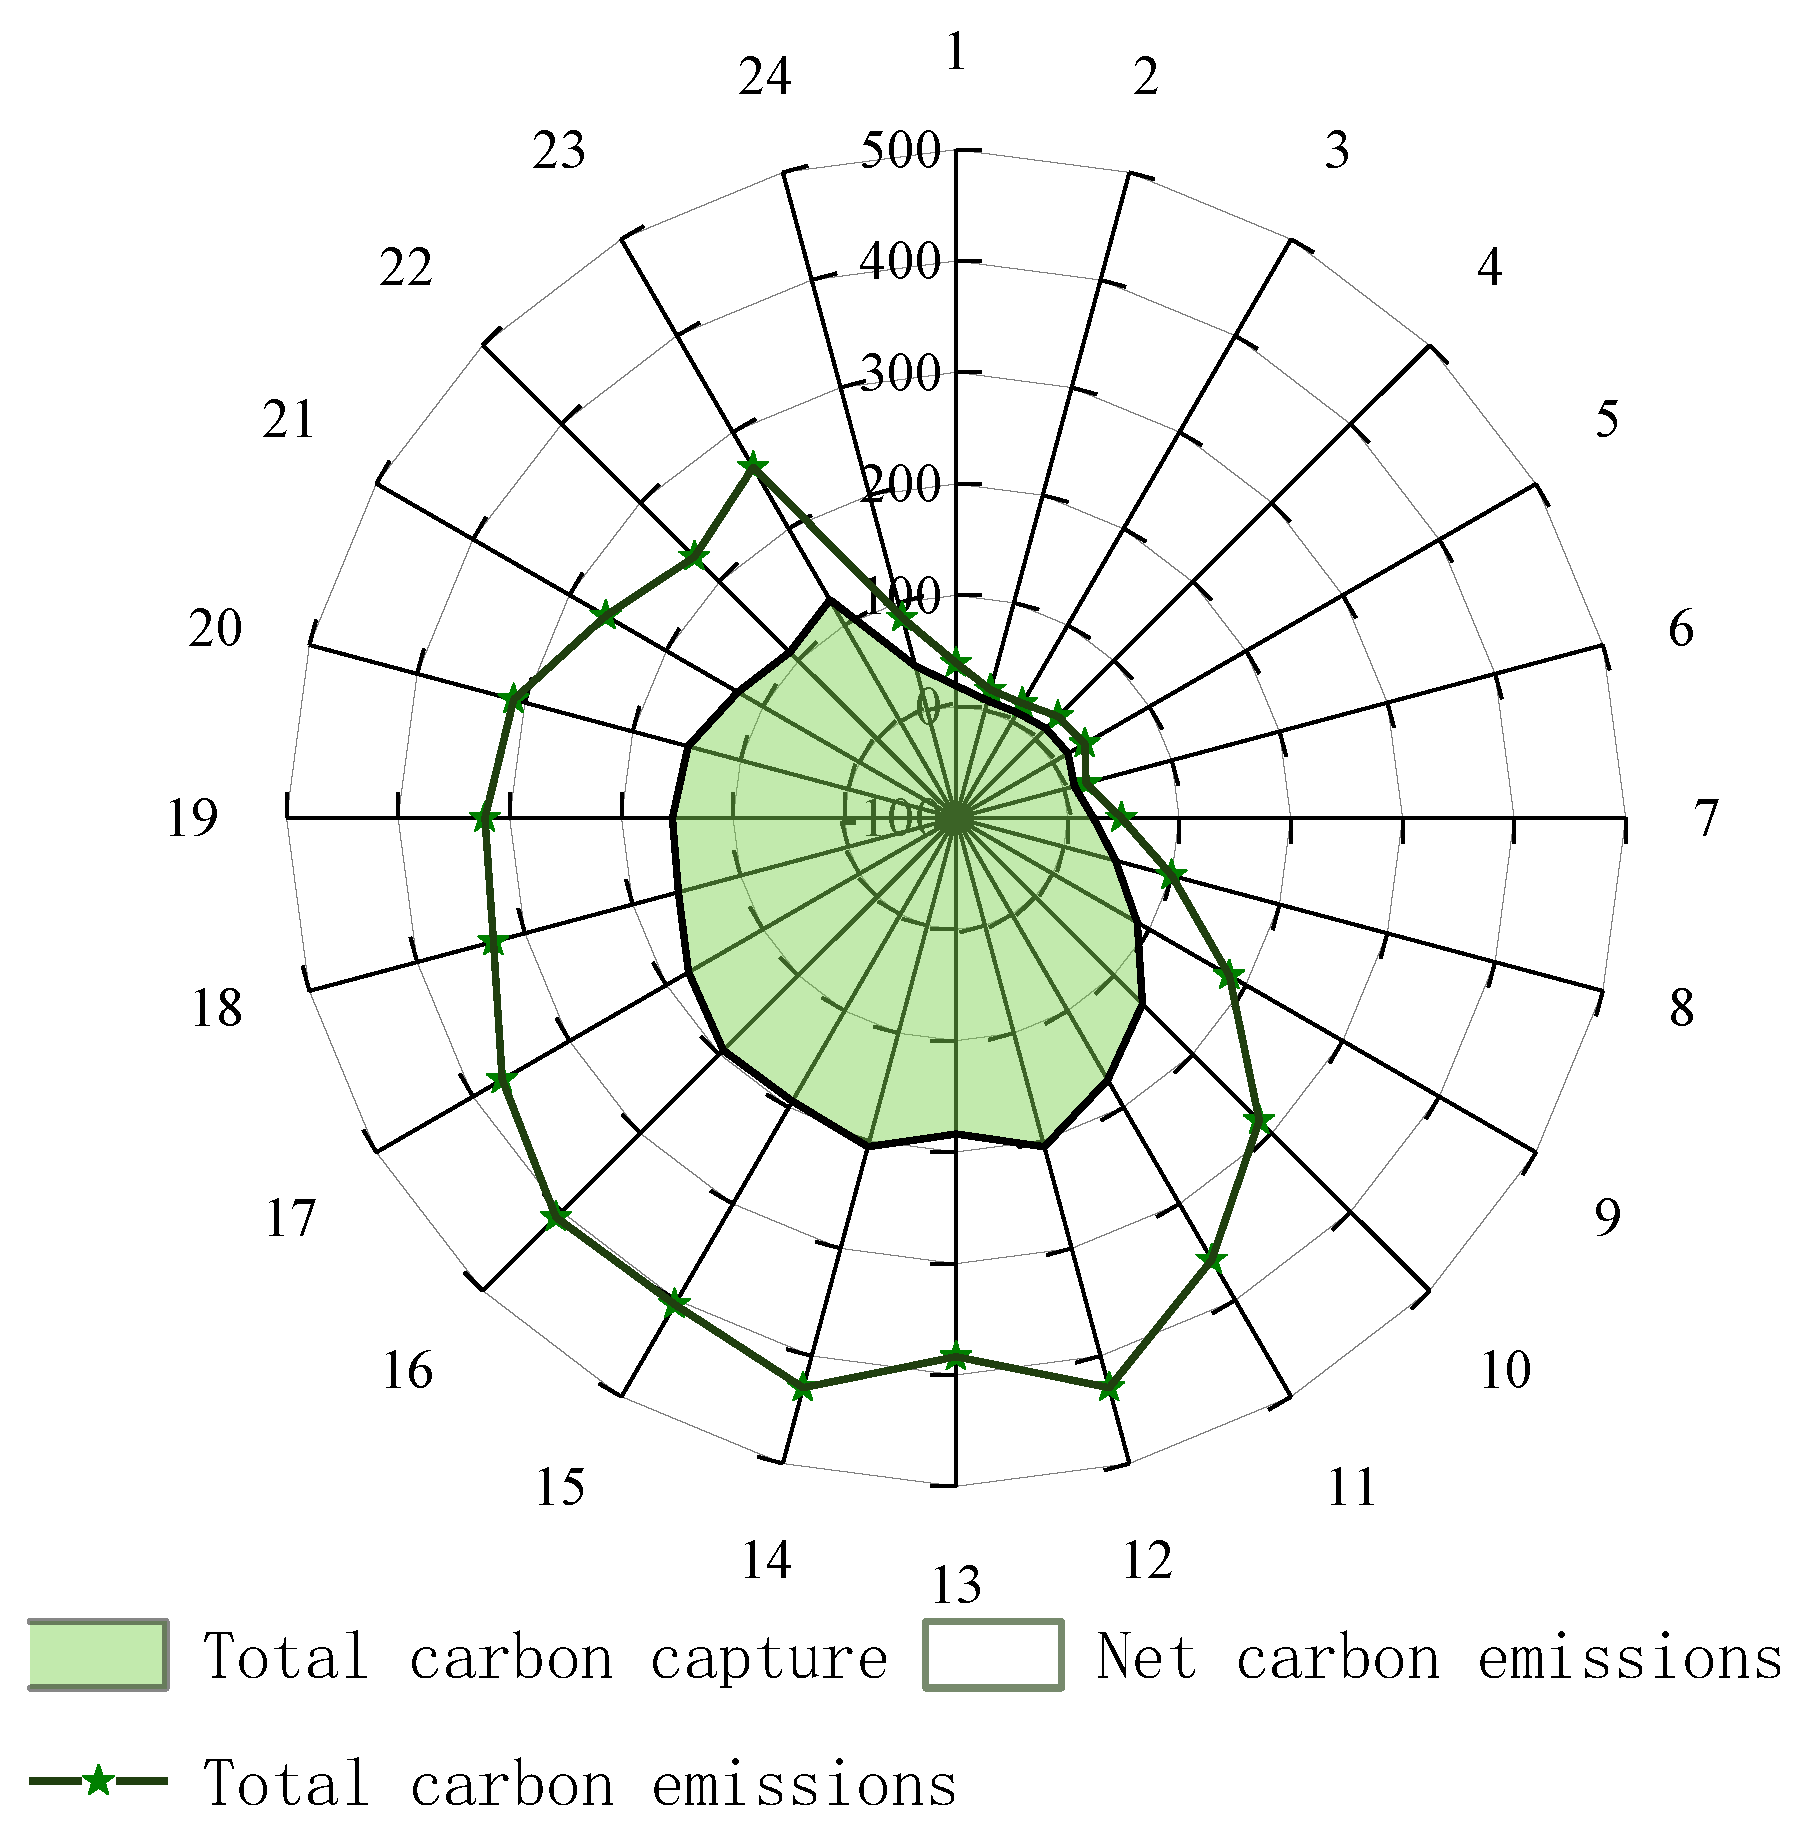
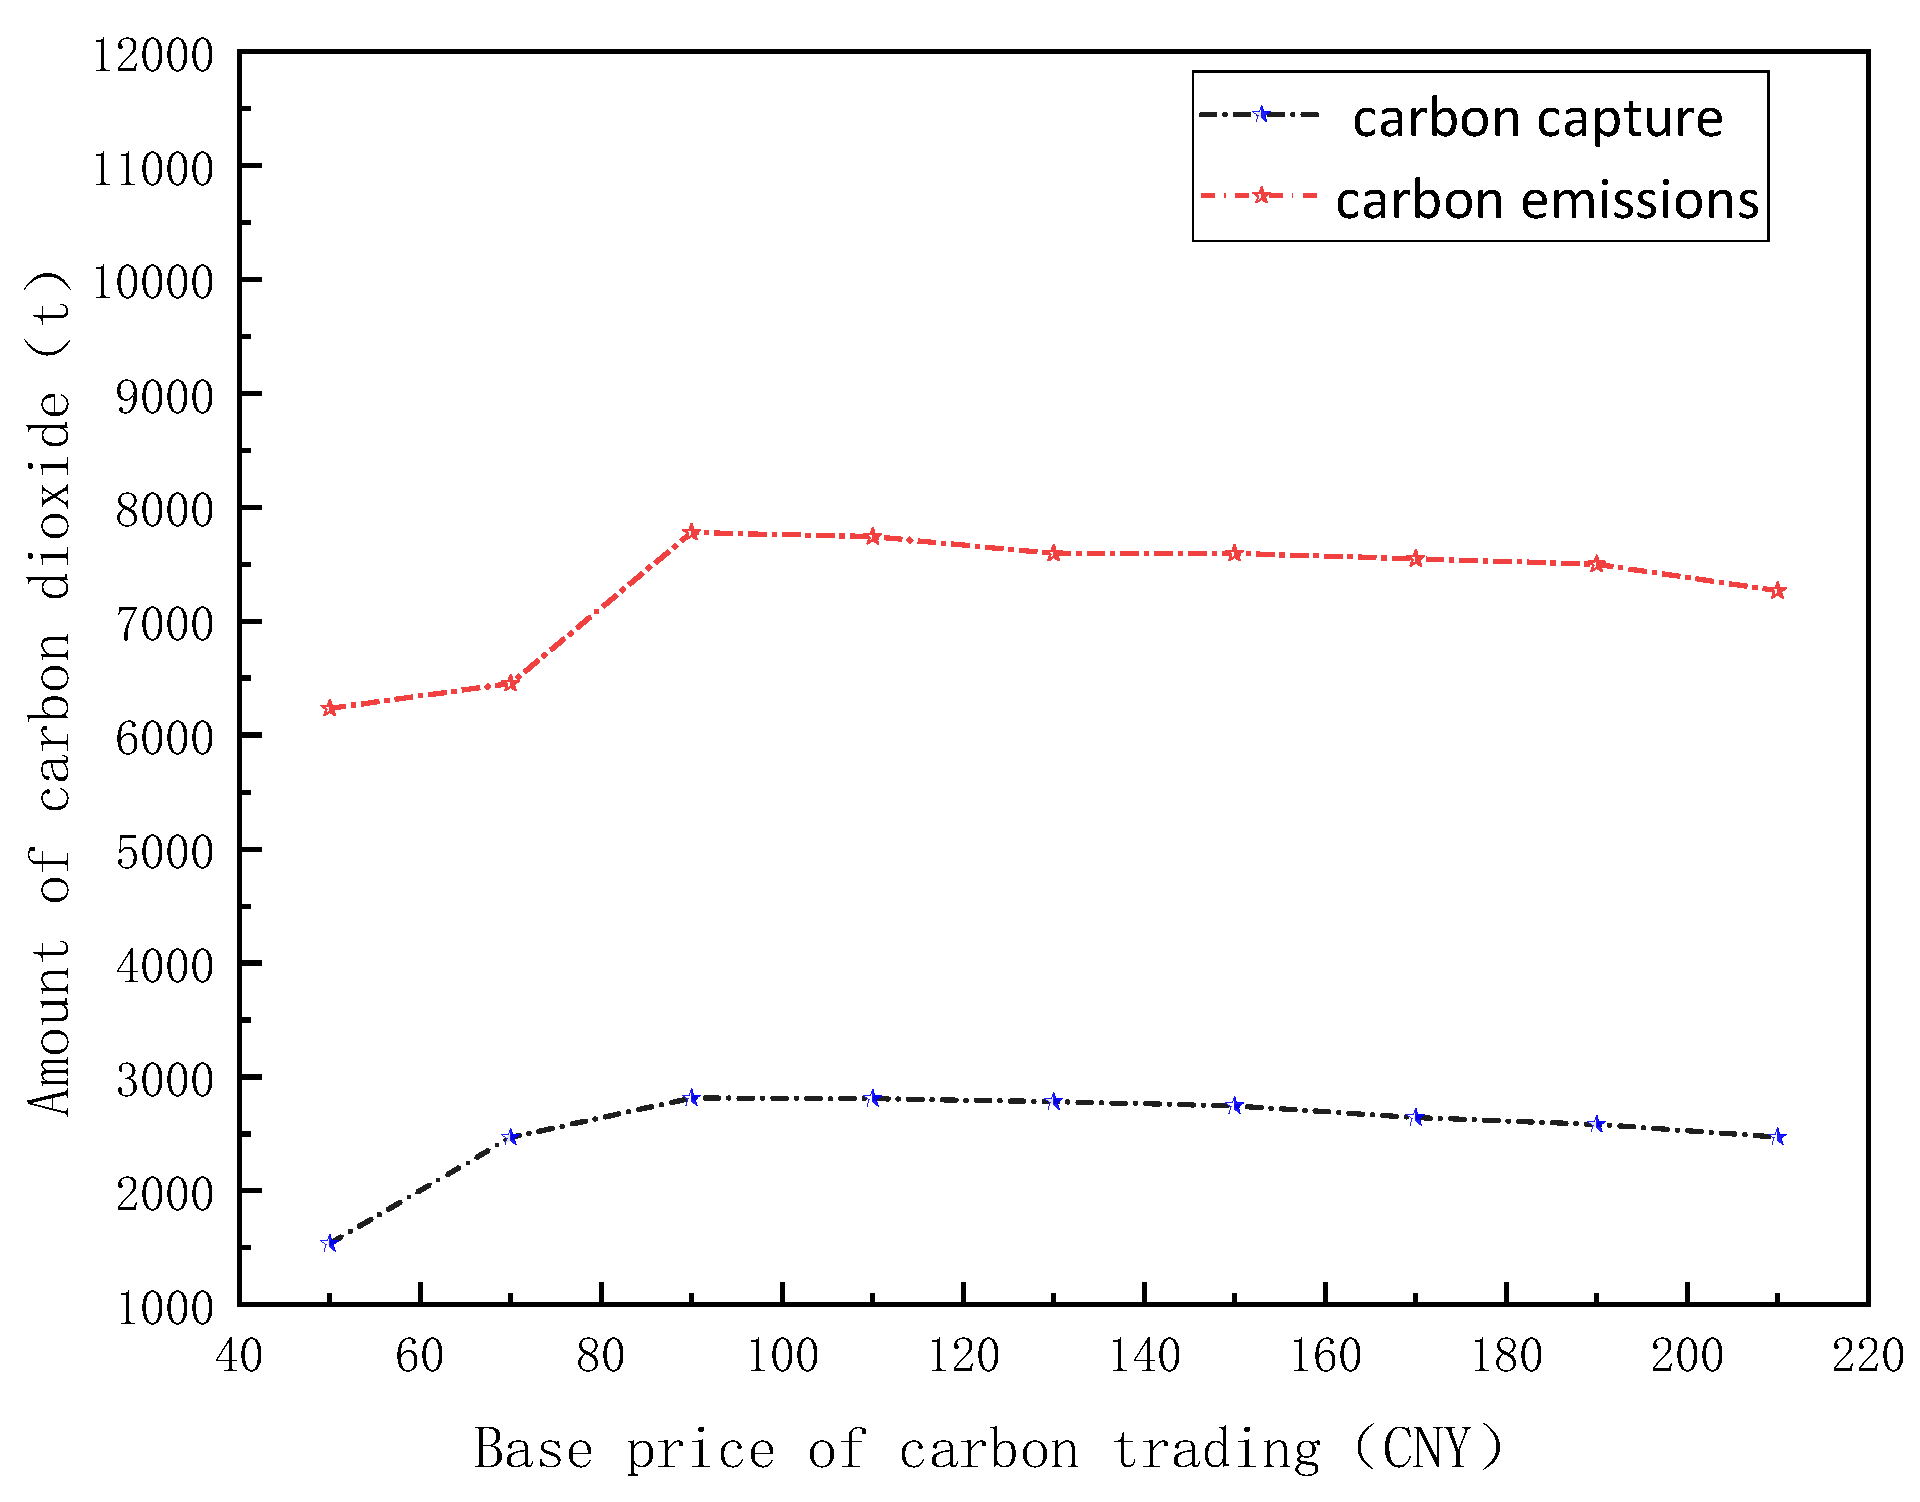
  • The continuous refinement of the CET mechanism drives synergistic enhancements in system economic viability and low-carbon performance, where cross-mechanism interoperability resolves the inherent economic–environmental trade-off through resource coordination.
The main research content of this paper is as follows. First, Section 2 introduces the integrated energy system architecture and establishes mathematical models for various energy conversion and storage devices. Section 3 develops an optimal dispatch model with the objective of minimizing operational costs. In Section 4, case studies are conducted to analyze the system benefits under four operational modes. Finally, conclusions are drawn in Section 5.

2. IES Architecture and Mathematical Modeling

2.1. IES Architecture

Integrated Energy Systems (IESs) serve as critical enablers for low-carbon transitions by coupling heterogeneous energy sources and facilitating complementary utilization through cascaded energy flows. As depicted in Figure 1, the proposed IES architecture comprises three functional components: the energy input layer integrates an oxy-fuel combustion power plant-comprising a coal-fired unit, Air Separation Unit (ASU), and Compression Passivation Unit (CPU)—alongside renewable generation units (wind turbines [WTs] and photovoltaic arrays [PVs]); the energy conversion layer incorporates P2G facilities (Electrolysis Cell [EC] and Methane Reactor [MR]), Gas Boilers (GB), and Combined Heat and Power (CHP) units for multi-vector energy transformation; the energy storage layer employs Electricity Storage (ES), Heat Storage (HS), and Oxygen Storage Tanks (OST) to dynamically regulate energy buffering and release via valley-storage/peak-release strategies, aligning with real-time supply–demand conditions. This tripartite structure achieves synergistic coordination of oxygen resource optimization, P2G-driven renewable absorption, and cross-temporal energy dispatch, demonstrating enhanced operational flexibility and carbon-intensity reduction.

2.2. IES Model Establishment

2.2.1. The Model of Oxy-Fuel Combustion Power Plant

Currently, several typical types of carbon dioxide emission reduction technologies for fossil fuel combustion internationally include pre-combustion capture technology, post-combustion capture technology, and oxy-fuel combustion technology [22]. Among them, oxy-fuel combustion technology and post-combustion capture technology are applicable to the low-carbon transformation of traditional coal-fired power plants. Owing to the advantages of lower investment costs and high carbon capture capacity, oxy-fuel combustion technology has increasingly become a research hotspot in this field.
The schematic diagram of the oxy-fuel combustion technology process is illustrated in Figure 2. In the oxy-fuel combustion carbon capture system, to fulfill the technical requirement of large-scale oxygen supply, air is first introduced into the ASU within the system, where it is condensed into a liquid state. Subsequently, the components are separated based on their distinct evaporation temperatures. The high-concentration oxygen enables more adequate contact between the fuel and oxygen, resulting in a more thorough chemical reaction and facilitating a more complete combustion process. The flue gas produced by oxy-fuel combustion exhibits a significantly elevated CO2 concentration. The CO2-rich tail gas enters the CPU, where it undergoes multiple compression stages and low -temperature condensation, thereby achieving the separation of CO2 from the flue gas [23].
Oxy-fuel combustion power plants are retrofitted from traditional coal-fired power plants by incorporating oxy-fuel combustion technology. The model constructed in this study is illustrated in Figure 3. The oxy-fuel combustion power plant system comprises four key components: a conventional coal-fired power unit, ASU unit, CPU unit, and OST unit. The electrical energy flow within the system is primarily distributed to the ASU unit, CPU unit, carbon capture unit energy consumption, and grid-side power demand. The ASU unit generates the required high-purity oxygen environment for combustion. The CPU unit facilitates compression and condensation processes to obtain liquefied compressible gases. Distinct from conventional coal-fired plants, this system integrates carbon capture units to collect CO2 emissions rather than direct atmospheric release. The net power output to the grid represents the plant’s capacity to meet electrical load demands after internal energy consumption. The OST plays a critical role in oxygen management, enabling both storage and controlled release within the system. During periods of high oxygen demand, the OST supplements the combustion system with stored oxygen, simultaneously reducing the operational intensity and energy consumption of the ASU during peak periods. Conversely, when ASU-generated oxygen exceeds immediate combustion requirements, surplus O2 is stored in the OST. This operational mechanism effectively endows oxygen with an “energy storage” characteristic, enhancing energy utilization efficiency and system flexibility through dynamic oxygen resource management.
Derived from the low-carbon retrofitting of conventional coal-fired power plants, the total power output of an oxy-fuel combustion power plant is composed of three components: the plant’s net power output to the grid, the power consumption of the ASU, and the energy consumption of the CPU. This configuration reflects the integrated operational framework that balances energy generation, oxygen supply optimization, and carbon capture efficiency in the retrofitted system.
In oxy-fuel combustion power plants, the oxygen supply to the system can be sourced from both the ASU and the OST, which enables oxygen storage and controlled release. During operation, greenhouse gas CO2 generated in the process is captured by the carbon capture unit. A portion of the captured CO2 is utilized by the P2G unit, while the remaining unutilized fraction is permanently sequestered.
P t T = P t A U S + P t C P U + P t L
O 2 t T + O 2 t O S T c = O 2 t A S U + O 2 t O S T d
C O 2 t T = C O 2 t A + C O 2 t C P U = C O 2 t A + C O 2 t P 2 G + C O 2 t S
where P t T is the total power output of the oxy-fuel combustion power plant at a time t, P t A U S is the power required by the ASU, P t C P U is the power required by the CPU, P t L is the net output power of the unit. O 2 t T is the total amount of oxygen consumed by an oxy-fuel combustion power plant, O 2 t O S T c and O 2 t O S T d are the oxygen storage and release amounts of the oxygen storage tank, and O 2 t A S U is the amount of oxygen produced by the ASU. C O 2 t T and C O 2 t A are the total carbon dioxide released and the actual carbon dioxide emitted by the oxy-fuel combustion power plant, respectively; C O 2 t C P U , C O 2 t P 2 G , and C O 2 t S are the amounts of carbon dioxide captured by CPU, utilized by power-to-gas equipment, and stored, respectively.
Through the aforementioned modeling framework, the operational model of the plant’s generating units and the mathematical expression for its net power output can be established. This formulation integrates the dynamic interactions between oxygen supply management, carbon capture efficiency, and energy conversion processes within the retrofitted system. The procedural steps are detailed as follows:
C O 2 t T = λ P t T C O 2 t C P U = ρ C O 2 t T O 2 t T = σ P t T O 2 t A S U = ϖ 1 P t A S U C O 2 t C P U = ϖ 2 P t C W
P t L = P t T ( ϖ 2 × ρ × λ ϖ 1 σ ) P t T + ϖ 1 × O 2 t O S T d
where λ is the unit carbon emission intensity, ρ is the carbon capture coefficient of CPU, σ is the amount of oxygen required for unit power output, ϖ 1 is the amount of oxygen produced per unit of electric energy by ASU, and ϖ 2 is the amount of CO2 captured per unit of electric energy by CPU.

2.2.2. Two-Stage P2G Mathematical Model

The P2G system comprises two sequential processes: hydrogen production via an EC and methane synthesis through an MR [24]. The EC utilizes electrical energy to electrolyze water into hydrogen and oxygen, followed by the MR process, where the captured CO2 reacts with hydrogen to synthesize methane through catalytic methanation [25]. This integrated approach enables the conversion of surplus renewable electricity and captured carbon into storable methane, enhancing energy system flexibility and carbon utilization efficiency.
P t H 2 = η E L × P t E L
P t M R = η M R × P t M R H 2 / H C H 4
C O 2 t P 2 G = 3.6 × P t M R × ρ C O 2
where P t H 2 is the hydrogen output by P2G, η E L is the efficiency of hydrogen production by water electrolysis, P t E L is the power consumption during operation, P t M R H 2 is the hydrogen consumption of the MR, and ρ C O 2 is the density of carbon dioxide.

2.2.3. Mathematical Model of CHP Equipment

The CHP unit generates electricity via a generator driven by natural gas combustion, while simultaneously recovering waste heat generated during electricity production for district heating. Within integrated energy systems, CHP units complement intermittent renewable energy sources such as wind and photovoltaic power, effectively mitigating fluctuations inherent to these renewables. This dual functionality—simultaneous power and heat generation—plays a critical role in optimizing energy structure and achieving efficient, low-carbon energy supply, thereby advancing the transition toward sustainable and resilient energy systems.
P t C H P . e = η C H P . e × G t C H P
P t C H P . h = η C H P . e × G t C H P
P t C H P . a = P t C H P . e + P t C H P . h
where P t C H P . e and P t C H P . h are the power generation capacity and heat generation capacity of CHP, respectively, and η C H P . e and η C H P . h are the power generation efficiency and heat generation efficiency of CHP, respectively.

2.2.4. Mathematical Model of GB Equipment

In comprehensive energy systems, the demand–supply dynamics of thermal energy systems primarily rely on gas-fired boilers, which exhibit rapid start–stop capabilities, robust load regulation performance, and flexible output adjustment responsive to operational requirements. These systems play a pivotal role in energy structure transition through synergistic multi-energy coordination, intelligent control strategies, and the integration of low-carbon technologies, demonstrating critical adaptability in modern energy infrastructure optimization.
P t G B = η G B × G t E B
where P t G B is the heat output of GB, η G B is the efficiency of GB, and G t E B is the natural gas consumption power of GB.

2.2.5. Mathematical Models of Energy Storage Devices

Energy storage systems function not only as power supply units but also as controllable demand entities within modern power grids [26]. Battery Energy Storage Systems (BESSs) dynamically regulate their charging and discharging operations in alignment with real-time operational parameters and grid supply–demand imbalances, while simultaneously formulating adaptive operational strategies in response to heterogeneous market signals, such as time-of-use pricing, frequency regulation incentives, or carbon emission constraints. This dual capability—balancing technical constraints with economic objectives—enables BESSs to optimize energy dispatch efficiency, mitigate grid intermittency, and participate in ancillary service markets, thereby serving as a critical enabler of low-carbon, high-resilience energy systems.
E t b a t t e r y = E ( t 1 ) b a t t e r y × ( 1 χ l o s s ) + η c h b a t t e r y × P t b , c h × Δ t
E t b a t t e r y = E ( t 1 ) b a t t e r y × ( 1 χ l o s s ) P t b . d i s η d i s b a t t e r y × Δ t
where E t b a t t e r y and E ( t 1 ) b a t t e r y are the electrical storage capacity and charge–discharge capacity of the battery bank, respectively; χ l o s s , η c h b a t t e r y , and η d i s b a t t e r y are the power loss coefficient, charging efficiency, and discharging efficiency, respectively.
Thermal storage tanks enable the retention of thermal energy to ensure reliable supply within integrated energy systems [27]. Given the diversity of energy forms and heterogeneous coupling mechanisms in such systems, coupled with temporally mismatched peak demand periods across various load types, coordinated operation becomes critical. For instance, the CHP unit can increase power generation to meet electrical load demands during peak periods, thereby stabilizing electrical power balance, while surplus heat output is stored in Thermal Energy Storage (TES) systems. Conversely, during intervals of insufficient thermal load demand, the stored energy in TES systems can be dispatched to fulfill heating requirements, enhancing the utilization efficiency and spatiotemporal matching of heterogeneous energy streams. This operational flexibility supports dynamic multi-energy complementarity, mitigates curtailment risks, and optimizes system-wide energy cascade utilization in response to fluctuating supply-demand patterns.
E t h e a t = E ( t 1 ) h e a t × ( 1 χ h , l o s s ) + η c h h e a t × P t h , c h × Δ t
E t h e a t = E ( t 1 ) h e a t × ( 1 χ h , l o s s ) P t h , d i s η d i s h e a t × Δ t
Oxygen storage tanks in oxy-fuel combustion power plants serve as critical energy storage infrastructure, enabling oxygen enrichment and buffering between ASU and combustion chambers [28]. Their operational principles rely on phase-state storage mechanisms (cryogenic liquid or pressurized gaseous oxygen) coupled with dynamic regulation of oxygen inventory to address temporal mismatches between continuous ASU production and fluctuating combustion demand. This dual functionality stabilizes oxygen supply pressure, mitigates transient operational stresses on cryogenic systems, and enhances combustion efficiency through precise oxygen stoichiometry control, thereby optimizing carbon capture readiness and load-following capabilities in low-carbon power generation systems.
O 2 t O S T = ( 1 χ k O S T ) O 2 ( t 1 ) O S T c + O 2 t O S T c O 2 t O S T d
O 2 t O S T c = η c h O S T × O 2 ( t 1 ) O S T c
O 2 t O S T d = O 2 ( t 1 ) O S T c / η d i s O S T
where O 2 t O S T and O 2 ( t 1 ) O S T c are the oxygen storage amounts of the OST in time periods t and t − 1, respectively, η c h O S T and η d i s O S T are the oxygen charging efficiency and oxygen discharging efficiency of the OST, respectively, and χ k O S T is the oxygen loss coefficient.

2.2.6. Mathematical Models of Joint Operating Mechanism

Figure 4 shows the framework for the combined operation of an oxy-fuel power plant, power-to-gas, wind power generation, and photovoltaic power generation.
Among them, the energy consumption of air separation oxygen production equipment and compression passivation carbon capture equipment of oxygen-rich combustion power plants comes from wind power generation, photovoltaic power generation, and power plants; the energy consumption of the two-stage power-to-gas operation can be absorbed through wind and solar curtailment, so as to make full use of renewable energy. The procedural steps are detailed as follows:
P t T = P t A U S + P t C P U + P t L P t A U S = P t A O F C + P t A W P + P t A P V P t C P U = P t C O F C + P t C W P + P t C P V P t W P = P t A W P + P t C W P + P t N W P + P t W P 2 G P t P V = P t A P V + P t C P V + P t N P V + P t P V P 2 G
where P t A O F C and P t C O F C are the energy consumption power supplied by the oxy-fuel combustion power plant to the ASU and the energy consumption power of the CPU, respectively.

2.3. Stepwise Carbon Trading Mechanism Model

Carbon trading, also known as carbon emissions trading, refers to a mechanism where governments or relevant institutions set a total carbon emission cap for an entire industry, country, or region, and allocate this cap to individual emitters in the form of quotas. Each entity is prohibited from exceeding its allocated quota. If an entity emits less than its quota, it can sell the surplus to other enterprises that exceed their quotas. This mechanism determines the price of carbon emissions through market regulation, incentivizing companies to innovate technologically to reduce emission costs and cut emissions. The relevant carbon trading principles are shown in Figure 5.
The implementation of carbon trading not only effectively reduces carbon emissions but also promotes the green transformation of energy structures and technologies, driving the development of a low-carbon economy. By linking environmental goals with market forces, it creates economic incentives for emission reductions, encourages the adoption of cleaner production methods, and accelerates the transition toward sustainable development.
In the integrated energy system, the main sources of carbon emissions are coal-fired power plants and cogeneration units. At present, the method used in China is mainly to allocate carbon quotas free of charge, and this paper uses the baseline method to determine the initial quota of the system.
I t o t a l = I o + I C H P + I G B I o = ϑ e t = 1 24 P t T I C H P = ϑ h ( ϑ e h t = 1 24 P t C H P . e + t = 1 24 P t C H P . h ) I G B = ϑ h t = 1 24 P t G B
where I t o t a l , I O , I C H P , and I G B represent the initial carbon emission allowances of the IES, oxy-fuel combustion power plant, CHP, and GB, respectively; ϑ e , ϑ h , and ϑ e h represent the carbon emission right allowance per unit electric power, the carbon emission right allowance per unit thermal power, and the conversion coefficient of carbon emission right allowance for converting unit electric power into thermal power, respectively.
The actual CO2 emissions are made up of the difference between the CO2 generated by the system and the CO2 used by the power-to-gas equipment.
I 2 a c t = t = 1 24 C O 2 t A + C O 2 C H P + C O 2 G B t = 1 24 C O 2 P 2 G C O 2 C H P = ϑ h ( ϑ e h t = 1 24 P t C H P . e + t = 1 24 P t C H P . h ) C O 2 G B = ϑ h t = 1 24 P t G B
where I 2 a c t is the actual carbon emissions of IES, C O 2 C H P and C O 2 G B are the actual carbon emissions of CHP and GB, respectively, and ϑ h is the actual carbon emissions corresponding to unit heat.
Based on the degree of deviation between the actual emissions and the quota benchmark, this paper establishes a multi-level reward and punishment constraint model; that is, if the carbon dioxide emissions are lower than the standard value, market entities can subsidize them according to the gradient increase, and the larger the emission reduction, the stronger the reward. If emissions exceed the allowance threshold, they will have to pay the punitive cost of the step-by-step increase according to the excess range. The procedural steps are detailed as follows:
F t , C O 2 I E S f ( 1 + 2 k ) ( I total ν I 2 act ) , I 2 act I total ν f ( 1 + 2 k ) ν f ( 1 + q ) ( I total I 2 act ) , I total ν < I 2 act < I total f ( I total I 2 act ) , I total < I 2 act I total + ν f v + f ( 1 + q ) ( I 2 act I total ν ) , I total + ν < I 2 act I total + 2 ν f ( 2 + q ) ν + f ( 1 + 2 q ) ( I 2 act I total 2 ν ) , I total + 2 ν < I 2 act I total + 3 ν f ( 3 + 3 q ) ν + f ( 1 + 3 q ) ( I 2 act I total 3 ν ) , I total + 4 ν I 2 act
where F t , c o 2 I E S is the carbon trading cost of the system, and f , k , ν , and q represent the unit carbon trading price, compensation-reward ladder coefficient, carbon trading interval length, and excess-penalty ladder coefficient, respectively.

3. Objective Functions and Constraint Conditions

3.1. Objective Functions

This paper proposes an optimal scheduling model for integrated energy systems considering the combined operation of oxy-fuel combustion, power-to-gas, wind power, and photovoltaic power, with the optimization objective of minimizing the total operating cost of the system.
min   F = F T + F B U Y + F P + F t , c o 2 c e t
where F , F T , F B U Y , and F P represent the total operating cost, unit operating cost, energy purchase cost, and carbon sequestration cost, respectively.
The operating costs of the system units are as follows:
F T = t = 1 24 i = 1 N a 1 P t T i 2 + b 1 P t T i + c 1
where a 1 , b 1 , and c 1 are the consumption characteristic parameters of the i-th unit.
The energy procurement cost of the system is as follows:
F B U Y = F E + F G + F C F E = 1 24 s 1 ( P E , b u y P E , s e l l ) F C = s 2 ( 1 24 C O 2 t P 2 G 1 24 C O 2 t C P U ) F G = 1 24 ( d 1 G b u y d 2 G s e l l )
where s 1 and s 2 are the time-of-use electricity price and the unit price for purchasing carbon dioxide, respectively.
The carbon sequestration cost of the system is as follows:
F P = s 3 1 24 C O 2 t S
where s 3 is the unit price of carbon dioxide for carbon sequestration in the system.

3.2. Constraint Conditions

The constraints include equality constraints and inequality constraints. In the integrated energy system, constraints need to be imposed on each device, including the power balance constraints of the system, thermal power balance constraints of the system, gas power balance constraints, oxy-fuel combustion power plant constraints, P2G device constraints, CHP unit constraints, GB constraints, and energy storage device constraints of the system. The maximum and minimum output thresholds and climbing power constraints of each energy conversion device of the system, as well as the energy-storing devices’ operational limitations, have already been covered in detail in Section 2 and will not be repeated here.
The following are the electric power equilibrium restrictions:
P t L + P t W P + P t P V + P t C H P . e + P t b , d i s = P t L O A D + P t E L + P t b , c h
The following are the thermal power equilibrium limitations:
P t C H P . h + P t G B + P t h , d i s = P t h , L O A D + P t h , c h
The gas power equilibrium constraints are as follows:
G b u y + G M R = G l o a d + G s e l l + G C H P + G G B
The oxy-fuel combustion power plant operation constraints are as follows:
0.5 P t A S U , min P t A U S 1.05 P t A S U , max 0 P t C P U P t C P U , max 0 P t L P t L , max
where P t A S U , min and P t A S U , max represent the minimum and maximum total output of the ASU, respectively; P t C P U , max and P t L , max represent the maximum total output of the CPU and the maximum net output power of the unit, respectively.

4. Model Solution and Case Study Analysis

4.1. Data Acquisition and Model Solution

The system scheduling diagram is shown in Figure 6. The electrical and thermal load values of the integrated energy system, as well as the predicted output of wind power and photovoltaic power, are shown in Figure 7, respectively; the segmented power purchase prices for each period are shown in Table 1; the segmented gas purchase prices for each period are shown in Table 2; the parameters of each energy storage device in the integrated energy system are shown in Table 3; the relevant parameters of the oxy-fuel combustion power plant are shown in Table 4; and the relevant parameters of other devices are shown in Table 5. This simulation platform uses MATLAB R2022b. The computer specifications are as follows: it is equipped with an i7-10700K high-performance processor as the CPU, an RTX 4060 as the graphics card, and runs on the Windows 11 operating system, and the CPLEX solver in the YALMIP toolbox is used for optimization and solution [29,30,31,32]. The scheduling cycle is 24 h, and the unit scheduling time step is 1 h. The optimization process is shown in Table 6.
To verify the effectiveness of the proposed integrated energy system model considering the combined operation of oxy-fuel combustion, P2G, wind, and PV energy, four optimized scheduling scenarios are set for comparative analysis based on whether oxy-fuel combustion technology is considered, whether P2G equipment is included, whether a carbon trading mechanism is incorporated, and whether combined operation is implemented, as shown in Table 7.
Table 8 compares the results of the optimal scheduling of the amount of renewable energy used by the system, operating costs, and CO2 emissions for the four cases.
In Scenario 1, the traditional post-combustion carbon capture method is adopted without considering the application of oxy-fuel combustion technology and the investment in P2G equipment, resulting in the highest total system operation cost. On the basis of Scenario 4, Scenario 3 considers the application of oxy-fuel combustion technology, reducing carbon emissions by 3381.7 tons (i.e., 35%) and the total cost by CNY 444,878.8 (i.e., 21.17%). This indicates that compared with the ordinary post-combustion carbon capture unit, the oxy-fuel combustion carbon capture unit significantly reduces the total cost and carbon emissions, demonstrating that the oxy-fuel combustion carbon capture unit has better carbon reduction potential and a more economical carbon capture method. Compared with Scenario 3, Scenario 4 considers the application of P2G equipment under the oxy-fuel combustion carbon capture mode, and the carbon trading revenue increases by CNY 3158.3, indicating that the application of P2G can improve the economic efficiency of the system.
The power balance results of the system show the power output of each energy supply unit in the IES at each time period, as shown in Figure 8. The low valley of the system’s electrical load occurs between 0:00–7:00 and 23:00–24:00. During this period, the reduction in users’ energy consumption behavior causes the electrical load to reach its lowest point. The electrical energy generated by the wind turbine units can be absorbed and becomes the main part of the power supply. In addition, it can also be provided to power-to-gas equipment to participate in two-stage reactions, and the extra remaining electrical energy is stored by the battery pack during the low valley period as backup power. The peak electrical load of the system occurs between 11:00–13:00 and 14:00–16:00. The Combined Heat and Power generation units and the oxy-fuel combustion power plant both operate at full load to meet the system’s electrical load demand while ensuring the system’s carbon capture level. With the increase in sunlight, the power output of photovoltaic power generation gradually rises and participates in the system’s power supply. In addition, the battery pack releases electrical energy to meet the supply-demand matching and relieve the pressure of power supply.
The thermal power balance results of the system show the heat output of each energy supply unit in the IES at each time period, as shown in Figure 9. The system’s heat load exhibits significant day–night differences, with a “double-peak” output characteristic. Its peak periods mainly occur between 1:00–9:00 and 18:00–24:00. During these times, the CHP units continuously output heat as the base load thermal energy source, while gas boilers work together with CHP units to maintain continuous heat supply during peak heat demand. The thermal energy storage system activates its heat discharge mode during the morning peak period, releasing stored heat to effectively alleviate the load climbing pressure on the units. During the low valley of heat demand (10:00–17:00), the thermal storage system stores excess heat during non-peak periods for future use, achieving the effect of “heat load shifting”. Through multi-energy complementarity and thermal storage regulation, the IES realizes efficient electro-thermal coordination, while the energy storage system effectively suppresses load fluctuations, providing a reliable guarantee for the integrated energy system to meet heat load demands.
The gas load balance results of the system show the natural gas supply status of each energy supply unit in the IES, as shown in Figure 10. The gas load in the IES comes from GB and CHP units. Among them, the P2G equipment uses a methane reactor to convert excess power from WT and PV systems during their peak output periods into natural gas to meet the system’s gas load demand, improving energy utilization efficiency. Its main operation period is concentrated between 2:00–6:00, when wind turbines are at their peak output, promoting the consumption of clean energy and effectively saving gas purchase costs.
The oxygen balance results of the system show the consumption of oxygen in the IES, while the storage capacity results of the OST indicate the changes in oxygen content, as shown in Figure 11 and Figure 12, respectively. Taken together, the carbon dioxide captured by the compressed passivation carbon capture system is divided into two parts: one part is subsequently sequestered, and the other is used as a reaction raw material for P2G equipment, a process that reduces carbon sequestration costs. Meanwhile, converting carbon dioxide into natural gas through P2G equipment, which then becomes fuel for unit combustion, not only enables the reciprocating use of carbon resources in the system and reduces dependence on traditional fuels but also achieves good efficiency in system energy conversion.
As shown in Figure 12, the OST mainly absorbs oxygen during the periods of 1:00–8:00 and 21:00–24:00, and releases oxygen during 10:00–20:00 to meet the system’s oxygen demand, thereby achieving the effect of load shifting. During peak demand periods, the oxygen stored in the OST provides more oxygen to the oxy-fuel combustion units to maintain an oxygen-rich environment, increasing the oxygen release from the OST. This not only reduces the energy consumption of the air separation unit but also ensures the normal capture of carbon dioxide by the compressed passivation unit.
When the system load is at a low ebb, the oxy-fuel combustion power plant does not require excessive oxygen supply from the OST. At this time, the energy consumption of the air separation oxygen production equipment increases during the low-load period, and the oxy-fuel combustion units cannot fully utilize the generated oxygen. To achieve full utilization, the excess produced oxygen is stored in the OST, and the oxygen content supplied by the OST to the oxy-fuel combustion units decreases, allowing the oxygen storage capacity in the OST to continuously increase and guarantee the oxygen demand of the oxy-fuel combustion power plant during peak periods.

4.2. Analysis of System Carbon Emissions and Unit Power Allocation

The power allocation diagram of the oxy-fuel combustion power plant is shown in Figure 13. During the low-load period from 0:00 to 8:00, the internal energy consumption of the oxy-fuel combustion power plant is mainly allocated to the air separation unit for oxygen production, with the oxygen generated during this period stored in the OST for future use to achieve conversion between electrical energy and oxygen energy; additionally, the net output power of the oxy-fuel combustion power plant is not the main part during this period because the load demand is primarily met by clean energy and energy storage devices in the system. In the peak-load period, the power allocation of the oxy-fuel combustion power plant changes significantly with the load demand: the OST releases oxygen to alleviate the system’s demand for oxygen energy, while the energy consumption and proportion of the air separation unit are buffered by the oxygen release process of the OST, based on which the output of the oxy-fuel combustion carbon capture units in the IES gradually reaches peak levels to provide reliable energy supply for the system.
The energy consumption of the CPU in the oxy-fuel combustion power plant changes over time, and this part of the energy is used to compress and passivate carbon dioxide, enabling the capture of carbon dioxide generated during the combustion process and reducing carbon emissions.
Figure 14 shows the specific carbon dioxide emissions of the system in each time period within a 24 h scheduling cycle. The area of the green shaded part represents the total carbon capture amount of the system; the more carbon captured in each time period, the less the net carbon emissions of the system, that is, the amount of carbon dioxide directly emitted into the atmosphere decreases. Combined with the power allocation of the oxy-fuel combustion power plant, the carbon emission results of the system can be divided into four periods according to the horizontal and vertical axes: from 1:00 to 6:00, both the net carbon emissions and carbon capture amount of the system are not high, so the total carbon emissions of the system are also at a low level; from 7:00 to 12:00, the output power of the oxy-fuel combustion power plant in the system gradually increases, and the total carbon emissions of the system also continue to rise over time, during which the energy consumption of the CPU in the oxy-fuel combustion power plant also continues to increase to achieve the capture of carbon dioxide and promote the maximization of the environmental benefits of the IES; from 13:00 to 18:00, the total carbon emissions of the system basically remain in a high range of about 400 tons in each time period, and at the same time, the CPU energy consumption also basically remains at the peak level to suppress the high-intensity emissions of the system; from 19:00 to 24:00, the total carbon emissions of the system gradually decline to the lowest level.
Figure 15 is a price sensitivity analysis chart. To fully explore the sensitivity between key parameters in the system and carbon trading prices under this model, an analysis is conducted based on the model data under Scenario 4, focusing on the impact of carbon emissions, carbon capture amounts, and price changes in the system. The fluctuation range of the base price of carbon trading is between 50 CNY/ton and 210 CNY/ton. As can be seen from the figure, with the increase in the carbon trading base price, the carbon capture volume basically shows a gradual downward trend, and the carbon trading base price of CNY 90 becomes an obvious dividing line. With the rise of the carbon trading base price, the inhibitory effect on carbon emissions is weak when the carbon trading base price is between CNY 70 and CNY 90; when the carbon trading base price is higher than CNY 90, carbon emissions show a downward trend.

5. Conclusions

To achieve low-carbon and economic optimal operation of IES, this paper introduces an oxy-fuel combustion carbon capture technology into an electricity–gas–heat integrated energy system, establishes a combined operation system of oxy-fuel combustion and P2G, and further restricts system carbon emissions through a stepped carbon trading mechanism. Simulation analysis yields the following main conclusions:
(1)
Compared with a low-carbon IES using conventional air combustion carbon capture technology, the system incorporating oxy-fuel combustion carbon capture technology reduces the total cost by CNY 446,010.21 (a 21.4% decrease) and lowers total carbon emissions by 3806.87 tons (a 38.3% reduction). The results demonstrate that oxy-fuel combustion carbon capture technology enhances both the economic efficiency and low-carbon performance of IES.
(2)
The carbon capture compression passivation unit, air separation unit, and OST in the constructed oxy-fuel combustion unit achieve coordinated conversion between electrical energy and oxygen energy through oxygen storage and release, improving the system’s flexibility and carbon emission reduction capability.
(3)
The combined operation mode of oxy-fuel combustion carbon capture and P2G technology has the potential to supply multiple forms of energy. It can increase the system’s carbon trading revenue to CNY 3158.3, reduce the total operating cost of the system by CNY 16,944.8, and at the same time enhance economic efficiency and carbon capture and emission reduction potential.
(4)
The introduction of a stepped carbon trading mechanism reduces total costs by 12.3%, cuts carbon emissions by 2010.19 tons, and increases carbon trading revenue from CNY 133,100.14 to CNY 233,678.94 (an increase of CNY 100,579.8). This further constrains the system’s carbon emission level while maintaining good economic performance.
With the development and advancement of technology, the requirements for optimal system operation will continue to be refined and improved. Due to limited research time and resources, the model proposed in this paper has certain limitations in practical applications, and the following aspects are worthy of further analysis and research:
(1)
The oxy-fuel combustion retrofitting of coal-fired power plants and the implementation cycle of the coupling model considered in this paper are relatively long, and the refinement level of the model can be further improved through research. Additionally, the impact of full-life cycle costs such as investment costs on the overall system economy is not considered, which can be further optimized and improved in the future.
(2)
The time scale adopted in this paper uses intraday optimal scheduling, while in practice, research and analysis can be conducted from multiple time scales such as intraday and day-ahead. Therefore, in follow-up research and exploration, multi-time scale optimization scheduling can be integrated to achieve more comprehensive and accurate research results.

Author Contributions

Conceptualization and methodology, H.L. (Hui Li) and X.B.; validation, L.B. and X.B.; formal analysis and investigation, X.B.; writing—original draft preparation, X.B.; writing—review and editing, H.L. (Hua Li); writing—translation and sentence checking, X.B.; software, X.B.; supervision and project administration, H.L. (Hui Li). All authors have read and agreed to the published version of the manuscript.

Funding

This research received no external funding.

Data Availability Statement

The original contributions presented in this study are included in the article. Further inquiries can be directed to the corresponding author.

Acknowledgments

The authors are very grateful to the reviewers, associate editors, and editors for their valuable comments and time spent.

Conflicts of Interest

Author Hua Li was employed by the Electric Power Research Institute of State Grid Shaanxi Electric Power Company. The remaining authors declare that the research was conducted in the absence of any commercial or financial relationships that could be construed as a potential conflict of interest.

References

  1. Zhu, G.; Zhang, X.; Yan, X. Evaluation of the Construction Process of China’s Modern Energy System. Eng. Sci. Technol. 2024, 56, 206–217. [Google Scholar]
  2. Mi, J.; Ma, X. Analysis of the Development Trend of CCUS Technology in China. Proc. CSEE 2019, 39, 2537–2544. [Google Scholar]
  3. Shen, W.; Qiu, J.; Meng, K. Low-carbon electricity network transition considering retirement of aging coal generators. IEEE Trans. Power Syst. 2020, 35, 4193–4205. [Google Scholar] [CrossRef]
  4. Huang, Y.; Ding, T.; Li, Y. Review of Energy Low-Carbonization Technologies and Enlightenment for the Development of New Power Systems under the Carbon Neutrality Background. Proc. CSEE 2021, 41 (Suppl. S1), 28–51. [Google Scholar]
  5. An, Y.; Su, R.; Zheng, S. Low-Carbon Economic Optimization of Integrated Energy Systems Considering Carbon Trading and Source-Load Side Resources. Acta Energiae Solaris Sin. 2023, 44, 547–555. [Google Scholar]
  6. Yin, L.; Cao, X.; Bu, C. Research Progress on Oxy-Fuel Combustion of Coal and Pollutant Emission Characteristics. Electr. Power Technol. Environ. Prot. 2025, 41, 96–109. [Google Scholar]
  7. Cai, R.; Zhu, H.; Li, W. Research on the Development Path of Multi-Energy Integration in Energy Science and Technology under the “Double Carbon” Goals. Bull. Chin. Acad. Sci. 2022, 37, 502–510. [Google Scholar]
  8. Liu, M.; Liang, X.; Lin, Q. Key Issues and Countermeasures for CCUS Projects Connecting to Carbon Trading Markets Driven by Carbon Neutrality. Proc. CSEE 2021, 41, 4731–4739. [Google Scholar]
  9. Zhou, X.; Liu, Y.; Han, J. Comprehensive Benefit Forecasting of Carbon Capture, Utilization and Storage (CCUS) Investments in Chinese Coal-Fired Power Plants. Resour. Sci. 2024, 46, 1604–1619. [Google Scholar]
  10. Chen, Q.; Kang, C.; Xia, Q. Study onthe Operation Mechanism and Peak Shaving Benefits of Carbon Capture Power Plants. Proc. CSEE 2010, 30, 22–28. [Google Scholar]
  11. Sheng, S.; Wu, H.; Gu, Q. Low-Carbon Economic Operation of Integrated Electrical Energy Systems with Carbon Capture Devices. Electr. Meas. Instrum. 2021, 58, 82–90. [Google Scholar]
  12. Chen, D.; Liu, F.; Liu, S. Optimal Dispatch of Virtual Power Plant with P2G-CCS Coupling and Hydrogen-Blended Gas Based on Tiered Carbon Trading. Power Syst. Technol. 2022, 46, 2042–2054. [Google Scholar]
  13. Zheng, C.; Zhao, Y.; Guo, X. Progress in the Development of Oxy-Fuel Combustion Technology in China. Proc. CSEE 2014, 34, 3856–3864. [Google Scholar]
  14. Liu, Y.; Liu, K.; Chen, Q. Economic and Environmental Analysis of Oxy-Fuel Combustion Technology. Fuel Chem. Process. 2023, 54, 53–58. [Google Scholar]
  15. Ma, R.; Hao, X.; Li, J. Research on Operation Optimization of Multi-Energy Complementary Systems Considering Stepped Carbon Trading Mechanism. J. Therm. Energy Power Eng. 2024, 39, 132–139. [Google Scholar]
  16. Tang, X.; Yuan, F.; Dai, Y. Optimal Dispatch Model of Integrated Energy System Considering Stepped Carbon Trading Mechanism and Load Response. Shandong Electr. Power Technol. 2024, 51, 74–84. [Google Scholar]
  17. Xing, J.; Zhao, S.; Yang, S. Multi-Objective Optimal Dispatch of Combined Heat-Electricity-Hydrogen Integrated Energy System Considering Stepped Carbon Trading Mechanism. Shandong Electr. Power Technol. 2025, 52, 21–31. [Google Scholar]
  18. Wu, D.; Jin, Y.; Li, Z. Research on Collaborative Optimal Dispatch of Source-Grid-Load-Storage in Integrated Energy Systems under a Two-Tier Carbon Trading Mechanism. Electr. Autom. 2025, 47, 15–18+22. [Google Scholar]
  19. Bao, S.; Wang, W. Low-Carbon Optimization of Integrated Energy System Considering Double-Layer Power-to-Gas and Demand Response: A Case Study of Nanning Jiangnan Industrial Park. Sci. Technol. Eng. 2025, 25, 3730–3738. [Google Scholar]
  20. Cui, J.; Jiang, H.; Cheng, H. Optimization of Integrated Energy System Considering Comprehensive Demand Response and Stepped Carbon Trading. J. Zhejiang Univ. Technol. 2025, 53, 179–188+236. [Google Scholar]
  21. Wang, Y.; Ma, T.; Li, T. Multi-objective Optimal Operation of Park-level Integrated Energy System Considering Stepped Carbon Trading Mechanism and Hydrogen Energy. J. Beijing Inst. Graph. Commun. 2024, 32, 28–35. [Google Scholar]
  22. Cui, Y.; Zeng, P.; Zhong, W. Low-Carbon Economic Dispatch of Electric-Gas-Heat Integrated Energy System Considering Oxygen-Enriched Combustion Technology. Proc. CSEE 2021, 41, 592–608. [Google Scholar]
  23. Song, C. Key Technologies for Oxygen-Enriched Combustion Carbon Capture; Electric Power Press: Beijing, China, 2020; pp. 7–12. [Google Scholar]
  24. Yuan, S.; Pan, P.; Wei, Y. Research on Low-Carbon Economic Optimal Dispatch Model of Park Integrated Energy System. Acta Energiae Solaris Sin. 2024, 45, 347–356. [Google Scholar]
  25. Yang, H.; Bai, Y.; Zhang, P. Optimal Dispatch of Integrated Energy System Considering Oxygen-Enriched Combustion Carbon Capture Technology and Source-Load Bilateral Response. Electr. Power China 2024, 373, 1–13. [Google Scholar]
  26. Liu, X. Energy storage technology in new energy power systems under the energy internet. Smart China 2025, 5, 122–123. [Google Scholar]
  27. Wang, A.; Yang, Q.; Wang, J.; Lu, J.; Liu, H.; Wang, P. Multi-objective optimization algorithm for economy and flexibility of combined heat and power units with heat storage. Electr. Power Eng. Technol. 2024, 43, 248–259. [Google Scholar]
  28. Qu, J.; Liu, X.; Zhao, H.; Luo, X.; Yang, P.; Li, H. Capacity optimization configuration of wind power coupled chemical system based on gas turbine oxy-fuel auxiliary energy supply. Sci. Technol. Eng. 2023, 23, 213–219. [Google Scholar]
  29. Qin, T.; Liu, H.D.; Wang, J. Low-Carbon Economic Dispatch of Electricity-Heat-Gas Integrated Energy System Based on Carbon Trading. Autom. Electr. Power Syst. 2018, 42, 8–13+22. [Google Scholar]
  30. Chu, Z.; Zhao, L.; Sun, J. Thermal-Electrical Optimization of an Integrated Energy System with Hydrogen Energy Storage Considering Thermal Energy Dynamic Equilibrium. Power Syst. Prot. Control 2023, 51, 1–12. [Google Scholar]
  31. Zhu, X.; Yuan, Z.; Li, H. A deformation prediction method for concrete dams based on BP-PCA-WCA-SVM. Yangtze River Sci. Acad. 2024, 41, 138–145. [Google Scholar]
  32. Wang, L.; Zhang, Y.; Qu, Y. Optimal Dispatch of Integrated Energy System Based on Stepped Carbon Trading Mechanism and Detailed Power-to-Gas and Carbon Cycle. Mod. Electr. Power 2024, 41, 335–343. [Google Scholar]
Figure 1. Architectural diagram of integrated energy system.
Energies 18 03814 g001
Figure 2. Schematic diagram of oxy-fuel combustion technology process.
Energies 18 03814 g002
Figure 3. Multidimensional feature vector.
Energies 18 03814 g003
Figure 4. Integrated framework of OFC-P2G-Wind-PV hybrid systems.
Energies 18 03814 g004
Figure 5. Schematic diagram of the carbon trading market.
Energies 18 03814 g005
Figure 6. System solution flowchart.
Energies 18 03814 g006
Figure 7. Power diagrams.
Energies 18 03814 g007
Figure 8. Scenario 4 system electric power balance diagram.
Energies 18 03814 g008
Figure 9. Scenario 4 system thermal power balance diagram.
Energies 18 03814 g009
Figure 10. Scenario 4 system natural gas power balance diagram.
Energies 18 03814 g010
Figure 11. Scenario 4 system oxygen quantity balance diagram.
Energies 18 03814 g011
Figure 12. Scenario 4 oxygen storage tank usage.
Energies 18 03814 g012
Figure 13. Power distribution diagram of oxy-fuel combustion power plant.
Energies 18 03814 g013
Figure 14. System carbon emission results diagram.
Energies 18 03814 g014
Figure 15. Price sensitivity analysis chart.
Energies 18 03814 g015
Table 1. Time-of-use electricity purchase price schedule.
TimeLabel Electricity Price (CNY/kW·h)
01:00–08:000.471
09:00–14:000.876
15:00–17:001.0947
18:00–19:000.876
20:00–22:001.0947
23:00–24:000.876
Table 2. Time-interval natural gas purchase price schedule.
TimeGas Price (CNY)
00:00–07:003.2
08:00–10:003.5
11:00–14:003.9
15:00–18:003.5
19:00–21:003.9
22:00–23:003.5
Table 3. Technical parameters of energy storage devices.
Energy Storage Device ParametersValues
Charging efficiency0.9
Discharging efficiency0.9
Power loss factor0.07
Capacity minimum 100   kW h
Capacity maximum 500   kW h
Thermal storage efficiency0.88
Exothermic efficiency0.99
Heat loss rate0.06
OST capacity maximum 150,000   m 3
Table 4. Technical parameters of oxy-fuel combustion power plants.
ParametersValues
λ 0.95   kg / kW h
σ 250   m 3 / MW h
ρ 0.98
ϖ 1 3.3   m 3 / kW h
ϖ 2 11.2   t / MW h
P t max 500   MW
P t A S U , max 48.48   MW
Table 5. Technical parameters of auxiliary system components.
ParametersValues
η E L 0.65
η M R 0.8
η C H P . e 0.35
η C H P . h 0.4
P t G B , max 200   MW
η G B 0.9
Table 6. Optimization processes.
Day-Ahead
Decision variablesOutput of each entity by time period
UnitsMW
Objective functionsTotal operating cost of the system
The limits for the decision variables
(1)
Electrical power constraints;
(2)
Thermal power constraints;
(3)
Gas power balance constraints;
(4)
Oxygen balance constraints;
(5)
Power constraints of each device;
(6)
Ramping constraints of each unit
Table 7. Four different scenario settings.
CaseCondition
Case 1An IES do not take into account oxy-fuel combustion technology and P2G
Case 2An IES considers P2G based on case 1
Case 3An IES considers oxy-fuel combustion technology based on case 1
Case 4An IES considers P2G based on case 3
Table 8. The operating costs for four different scenarios.
CaseCost/CNYCarbon Trading Costs/CNYCarbon Emission Quantity/t
Case 12,101,378.9200,579.49658.6
Case 22,085,565.4196,899.09935.7
Case 31,656,500.0−230,520.66276.9
Case 41,639,555.2−233,678.96128.8
Disclaimer/Publisher’s Note: The statements, opinions and data contained in all publications are solely those of the individual author(s) and contributor(s) and not of MDPI and/or the editor(s). MDPI and/or the editor(s) disclaim responsibility for any injury to people or property resulting from any ideas, methods, instructions or products referred to in the content.

