Article

Modification of Canola Oil Properties Using Ethyl Oleate and n-Hexane

by
Katarzyna Szymczyk
*,
Anna Zdziennicka
and
Bronisław Jańczuk
Department of Interfacial Phenomena, Institute of Chemical Sciences, Faculty of Chemistry, Maria Curie-Skłodowska University in Lublin, Maria Curie-Skłodowska Sq. 3, 20-031 Lublin, Poland
*
Author to whom correspondence should be addressed.
Energies 2025, 18(14), 3802; https://doi.org/10.3390/en18143802
Submission received: 4 June 2025 / Revised: 9 July 2025 / Accepted: 15 July 2025 / Published: 17 July 2025

Abstract

Canola oil (rapeseed oil, RO), despite being a potential source of biofuel, needs some modifications of its properties to be effectively used as a fuel. The reason RO needs to be altered lies above all in its viscosity, fatty acid composition, and other chemical properties, which affect its efficiency as a fuel. These properties of RO can be changed by mixing it with various bioadditives, among other methods. For this reason, studies of the physicochemical properties of mixtures including RO, n-hexane (Hex), and ethyl oleate (EO) were carried out. These mixtures were prepared at a constant EO concentration and a ratio of n-hexane in the mixture with RO in the range from 0 to 1. For these mixtures, the surface tension, density and viscosity were measured. The obtained results were considered to determine the chemical properties of particular components of the mixtures. From these considerations, it results that based on the properties of these components, the surface tension and density of the studied mixtures can be described, and their viscosity can be predicted. These facts and results of the measurements suggest that based on the properties of the mixture components, we can determine the composition of a mixture whose surface tension, density, and viscosity are close to those of diesel fuel. The results obtained from the measurements also suggest that the addition of 10% n-hexane to RO causes a considerable reduction in the surface tension, viscosity, and density of RO. The addition of 10% of EO to this mixture results in a further reduction in RO + Hex viscosity and increases its density and surface tension slightly. As such, a mixture of RO with Hex and EO may be appropriate as a biofuel.

1. Introduction

Vegetable oils, including canola oil (rapeseed oil, RO), are used in the food, cosmetic, pharmaceutical, chemical, and textile industries as well as in the production of biofuels and lubricants [1,2,3,4,5,6,7,8]. The use of these oils as a biofuel is supported by their chemical composition because they contain unsaturated and saturated fatty acids. Therefore, unlike diesel fuel, vegetable oils contain only carbon, hydrogen, and oxygen, but no sulfur, and have better lubricating properties.
It is known that the macroscopic injection and spray characteristics of pure RO and its mixtures are among the most important factors playing a critical role in diesel engine performance and emissions. The main goal of atomization is to expand the surface area of the biofuel, which significantly improves its evaporation rate—an essential factor for efficient heat and mass transfer from the surrounding gases to the fuel. According to Lefebvre and McDonell [9], the liquid properties that influence atomization to the largest extent include surface tension, viscosity, and density. These characteristics can affect not only the fuel flow rate and jet velocity but also the structure and distribution of the resulting spray [10,11,12,13,14]. However, the surface tension, density, and viscosity of RO differ from those of diesel fuel, which makes it difficult to use RO directly as a biofuel in diesel engines [15,16,17].
The particularly large viscosity of vegetable oils is an obstacle for their direct use in high-pressure engines powered by diesel fuel. Canola oil (rapeseed oil, RO), which is one of the raw materials for possible biofuel production, is characterized by a viscosity that is more than ten times higher than that of diesel fuel. Various methods have been applied to reduce the viscosity of canola oil and to change other physicochemical properties [18,19,20,21]. One of them is obtaining esters of fatty acids containing oil with short-chain alcohols. Many physicochemical properties of these esters, particularly ethyl oleate (EO), are similar to those of diesel fuel [22,23,24]. For this reason, attempts have also been made to use a mixture of oil and esters obtained from oil as a biofuel [24,25,26]. Another method of using oil as a biofuel is to convert it into a microemulsion using ethyl alcohol and a suitable surfactant [27,28,29,30]. Some attempts were also made to use vegetable oil as a biofuel with the addition of n-hexane and a mixture of n-hexane with ethyl alcohol [18,31].
Taking into account the values of surface tension, density, and viscosity of RO compared to those of diesel fuel (DF) [18,32], it would be necessary to add to it a substance which, although not in large amounts, significantly reduces the viscosity and to a small extent the surface tension and density. It would be advisable for this substance to be obtained from compounds occurring in plants. So far, it has been difficult to come across compounds satisfying all these conditions. It seems that the addition of two appropriately selected organic compounds to RO instead of one can be a better solution to the problem of its use as biofuel. For this reason, n-hexane (Hex) and EO were selected for this study as two additives to RO in order to change its surface tension, density, and viscosity. It should be mentioned that n-hexane, which is a petroleum product, can be obtained from sorbitol, which was first synthesized from cellulose [33] and for this reason can be treated as a bio. The most efficient systems (e.g., metal–acid bifunctional catalysts or gas-phase pyrolysis via iodo intermediates) deliver high selectivity (>70%) to Hex [33,34,35]. It should be emphasized that n-hexane is an apolar hydrocarbon characterized by low density, viscosity, and surface tension, which results only from Lifshitz-van der Waals (LW) interactions. These parameters of n-hexane are considerably smaller than those of RO and diesel fuel [18,31]. In turn, the surface tension, density, and viscosity of EO synthesized from oleic acid and ethanol are smaller than those of RO but, as mentioned above, similar to those of diesel fuel [36,37,38]. Its surface tension results similar to n-hexane only from LW intermolecular interactions but can form hydrogen bridges with the adjacent medium [36]. For this reason, EO is monopolar but Hex is an apolar liquid [18,36]. Contrary to Hex and EO, the surface tension of RO results from LW and Lewis acid–base (AB) intermolecular interactions and is treated as a weak bipolar liquid [36]. These compounds selected as additives to RO did not make any changes to the type of atoms included in the obtained mixture in relation to RO. However, it should be expected that Hex and EO would complement each other in adjusting the density, viscosity, and surface tension of RO to those of DF.
Taking the above-mentioned facts into account, the aim of the present study was accomplished based on the surface tension, density, and viscosity measurements of RO + Hex, RO + EO, and EO + Hex mixtures as well as RO + EO + Hex at a temperature equal to 293 K. Changes in the surface tension, density, and viscosity for both binary and ternary mixtures were considered and compared to diesel fuel (DF) [39]. In these considerations, the possibility of predicting or describing density, surface tension, and viscosity isotherms of binary and ternary mixtures was also taken into account.

2. Materials and Methods

2.1. Materials

For the studies, commercial, unmodified canola oil (rapeseed oil, RO) called Kujawski produced by ZT “Kruszwica” S.A. (Kruszwica, Poland) was applied. Ethyl oleate (EO, 99.9%, Organic Chemistry, Bielsko-Biała, Poland) and n-hexane (Hex, 99.8%, POCH, Gliwice, Poland) were used without further purification.
The following binary mixtures were prepared (composition expressed as the volume ratio (v/v)):
RO + Hex: RO90Hex10, RO80Hex20, RO70Hex30, RO60Hex40, RO50Hex50, RO40Hex60, RO30Hex70, RO20Hex80, RO10Hex90.
RO + EO: RO90EO10, RO80EO20, RO70EO30, RO60EO40, RO50EO50, RO40EO60, RO30EO70, RO20EO80, RO10EO90.
EO + Hex: EO90Hex10, EO80Hex20, EO70Hex30, EO 60Hex40, EO50Hex50, EO40Hex60, EO30Hex70, EO20Hex80, EO10Hex90.
The following ternary mixtures were prepared:
At a constant composition of EO equal to 10: RO80EO10Hex10, RO70EO10Hex20, RO50EO10Hex40, RO30EO10Hex60, RO10EO10Hex80.
At a constant composition of EO equal to 20: RO70EO20Hex10, RO60EO20Hex20, RO40EO20Hex40, RO20EO20Hex60, RO10EO20Hex70.
At a constant composition of EO equal to 40: RO50EO40Hex10, RO40EO40Hex20, RO20EO40Hex40, RO10EO40Hex50.
At a constant composition of EO equal to 60: RO30EO60Hex10, RO20EO60Hex20, RO10EO60Hex30.
At a constant composition of EO equal to 80: RO10EO80Hex10.
To consider changes in the physicochemical properties of the studied mixtures as a function of the composition, the composition was expressed in molar fractions ( x ) . The mixtures were stored in tightly sealed containers at a temperature of 283 K. The results obtained from the measurements were the same when measured directly after mixture preparation or after a passage of time.

2.2. Methods

The equilibrium surface tension of RO, EO, Hex, and binary and ternary mixtures was measured by applying Du Noüy’s method (K9 tensiometer, Krüss, Hamburg, Germany). Before the surface tension measurements, the tensiometer was calibrated using water ( γ L V = 72.8 mN/m at 293 K) and methanol ( γ L V = 22.5 mN/m at 293 K). Before each measurement, the ring was thoroughly cleaned with distilled water and heated to a red glow using a Bunsen burner. For each sample, over 10 consecutive measurements were taken, with a standard deviation of ±0.1 mN/m. To maintain a given temperature, the tensiometer was thermostated using the thermostat Lauda with cooling and heating circulations as well as a temperature stability of ±0.05 K.
The density of RO, EO, and Hex as well as their binary and ternary mixtures was measured at 293 K with the U-tube densitometer, DMA 5000 Anton Paar (Graz, Austria). The manufacturer specified the accuracy of the density measurements as ±0.000001 g/cm3 and the temperature accuracy as ±0.001 K, with a measurement uncertainty of 0.000002 g/cm3.
Viscosity measurements of the RO, EO, and Hex and as well as their binary and ternary mixtures were made at 293 K using the glass capillary viscometers in the form of a U-tube (130 A Visco3, Huber Kaltemaschinenbau AG, Offengurg, Germany). The time required for a fixed standard volume of fluid to pass through the capillary under the influence of gravity was recorded. The capillary constant used was 0.02981 mm2/s2. The viscosity of the examined mixtures and liquids was determined using a calibration curve, which was established from the flow times of model liquids—formamide, oleic acid, and glycerol—with known viscosity values [18]. All viscosity measurements have an accuracy of ±0.0001 mPa s and a measurement uncertainty of 0.0002 mPa s. Prior to the measurements, both the densitometer and viscosimeter were calibrated using distilled and deionized water as well as methanol.

3. Results and Discussion

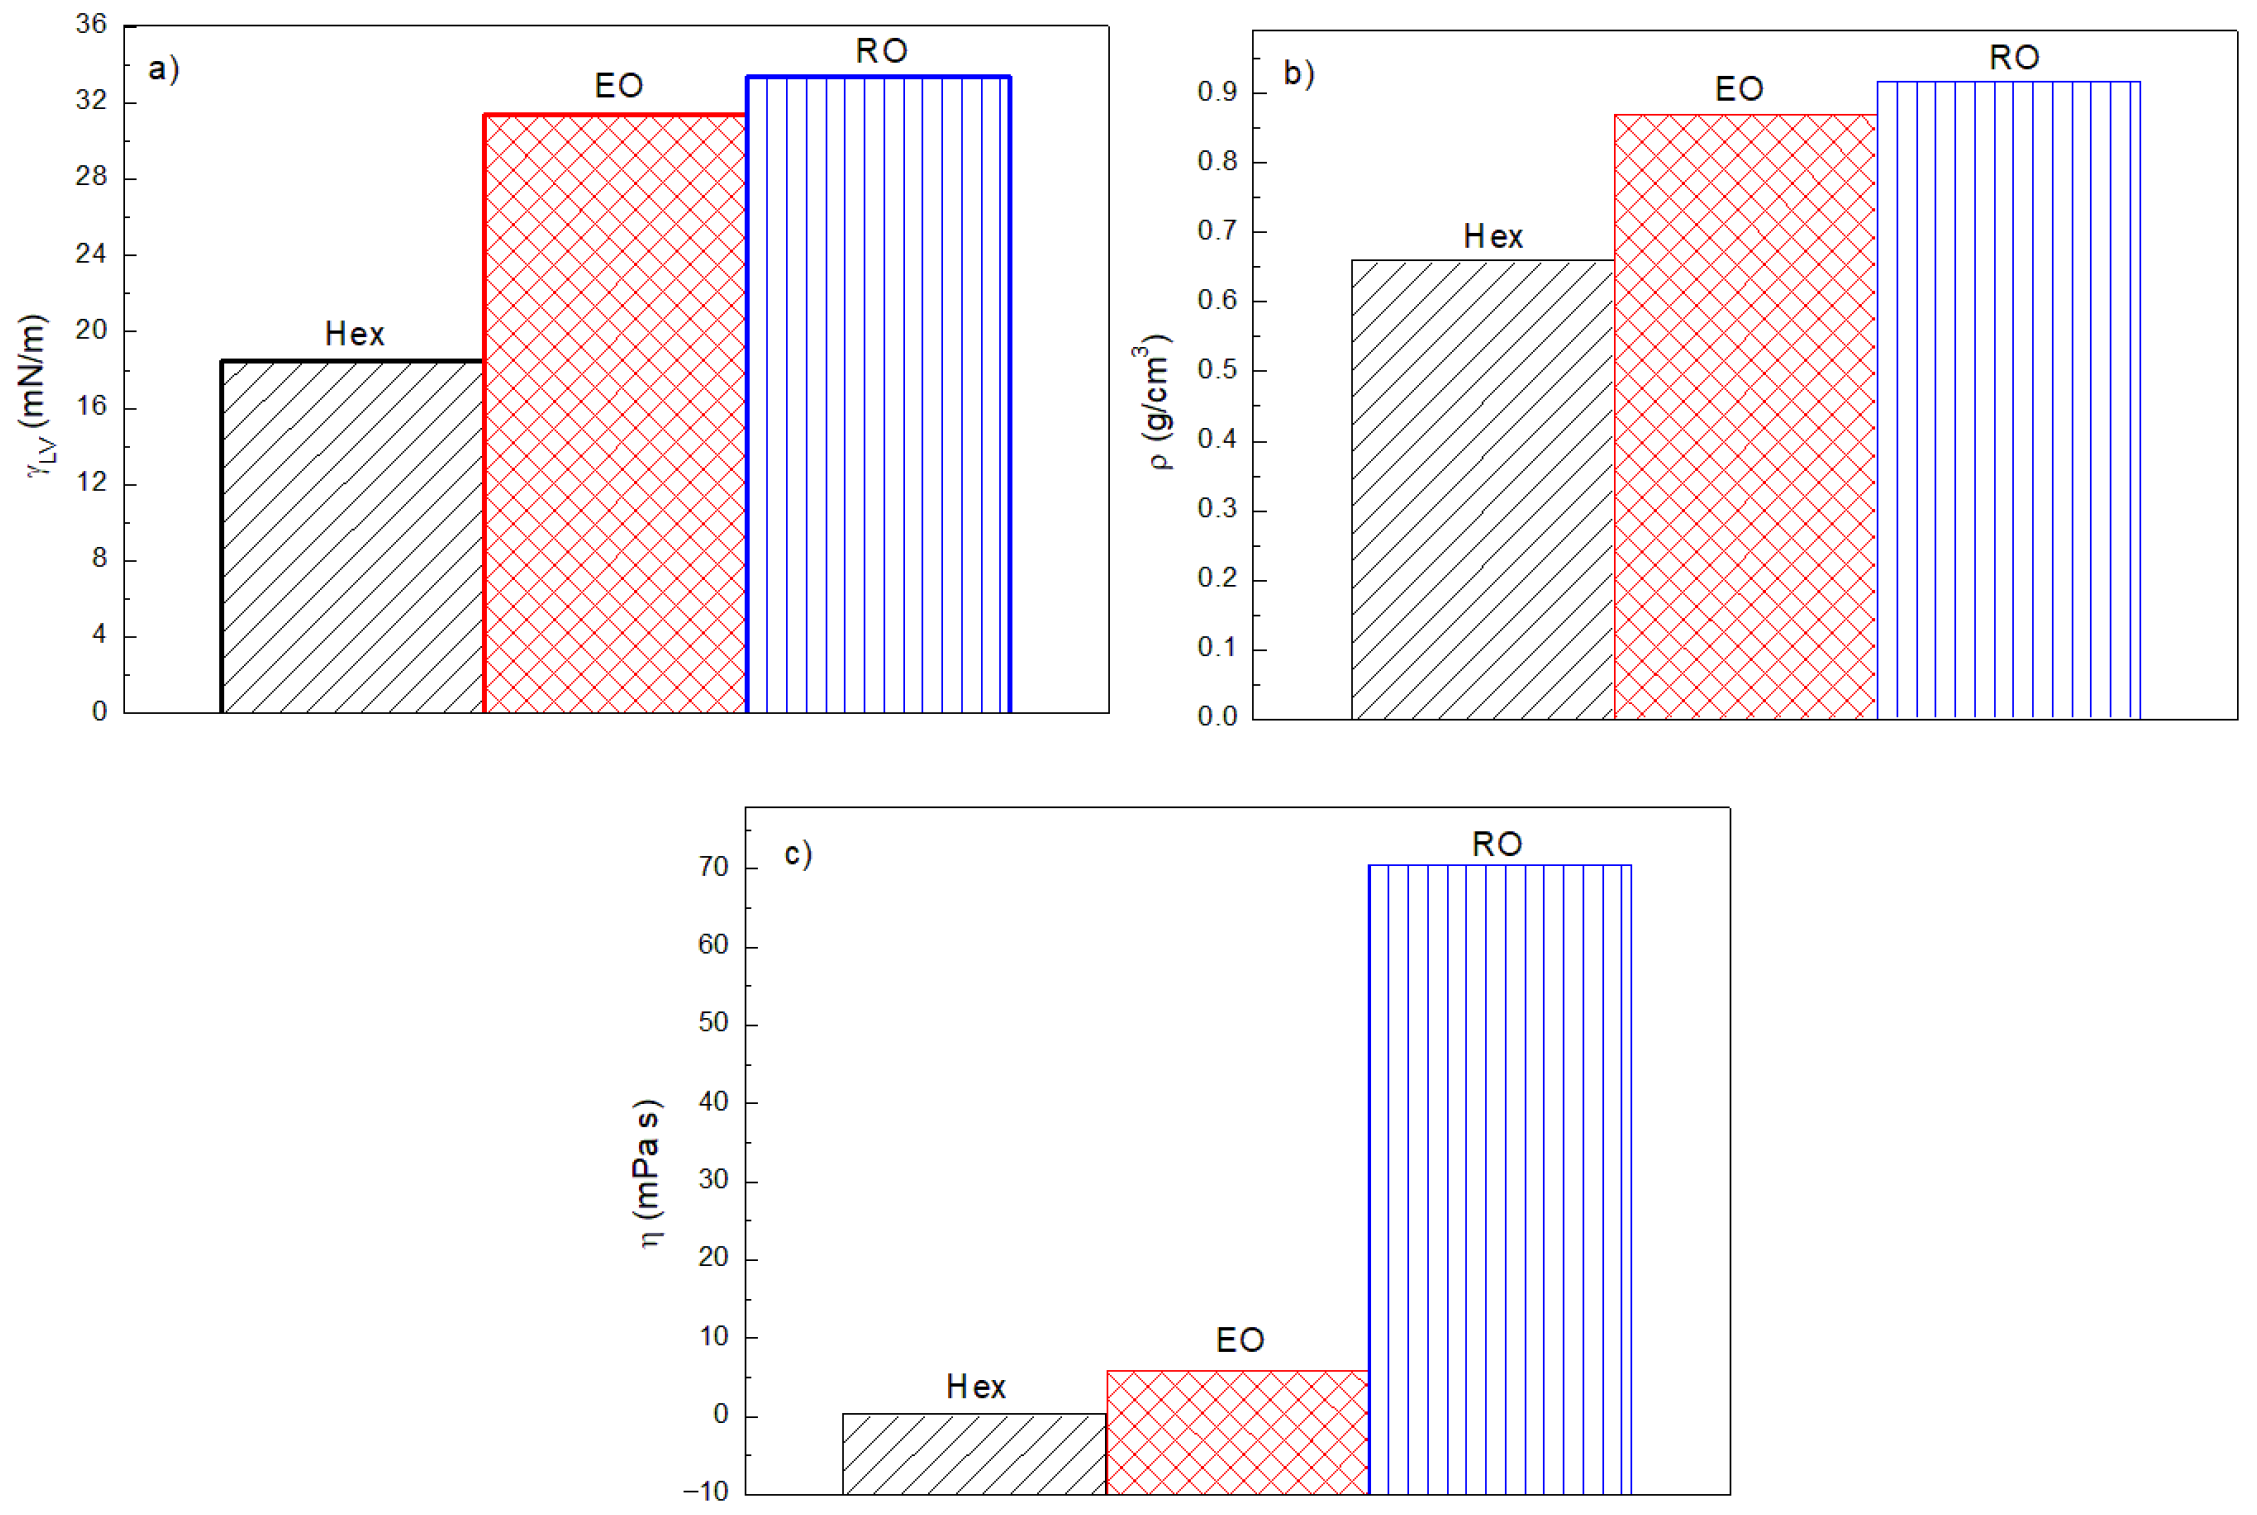
3.1. Some Physicochemical Properties of Canola Oil, n-Hexane, Ethyl Oleate, and Diesel Fuel

The canola oil (RO) used in this study contained over 94% of unsaturated fatty acids and only 6% saturated ones [18]. Therefore, the surface tension ( γ L V ) , density ( ρ ), and viscosity ( η ) values of fatty acids result only from the presence of the CH3, CH2, CH, and COOH groups in their molecules. Fowkes [40] stated that in the case of substances with large molecules, their surface tension depends on the interactions of individual chemical groups present in the molecules in the interface region and the distance between them. Therefore, differences in the surface tension of canola oil components are practically due to the density of individual chemical groups found in their molecules at the liquid–air interface (Table 1). The surface tension of fatty acids included in the canola oil results from both Lifshitz–van der Waals (LW) and Lewis acid–base (AB) intermolecular interactions, but it should be remembered that COOH groups are also present at the liquid–air interface. One should also notice that the approach of van Oss et al. regarding the AB component of the surface tension is consistent with both Lewis and Brønsted’s theories [41].
Van Oss and Constanzo [42] stated that the surface tension of high-molecular-weight substances depends on the orientation of their molecules towards the air. Therefore, if molecules of fatty acids are oriented only with the hydrophobic group towards the air, the surface tension should correspond to the tension of proper hydrocarbon, but when the COOH group is oriented towards the air, the surface tension should correspond to the tension of a small-molecule organic acid. The surface tension values of fatty acids (Table 1) suggest a rather parallel orientation of their molecules towards the liquid–air interface, and the obtained values are averaged from the hydrophobic and polar parts (COOH group) of these acids. Interestingly, γ L V of canola oil is higher than that of all its components (Figure 1, Table 1). Since surface tension depends not only on the type of chemical groups but also on the distances between them in the surface layer, the CH3, CH2, CH, and COOH groups of RO are perhaps more tightly packed than the individual components of the oil. It is also possible that in the case of RO, the packing of COOH groups in the surface layer is greater than that of fatty acids.
Table 1. Composition of canola oil in percentages (%), and the values of molecular mass (M, g/mole) density ( ρ , g/cm3) (measured, ρ 1 and calculated,   ρ 2 ) , viscosity ( η , mPa s), surface tension ( γ , mN/m) and mole volume ( V m M , cm3/mole) of canola oil components as well as those of diesel fuel, ethyl oleate, and n-hexane [18,43]. V m M ( 1 ) —determined by taking into account the molar mass and density of compounds.
Substance%M γ η ρ 1 ρ 2 V m M V m M ( 1 )
Canola oil 34.2070.450.9161
Oleic acid 62282.4631.9226.910.8950.8774321.90315.60
Linoleic acid 20280.4525.0227.200.90120.8796318.82311.20
α -linolenic acid 12278.4330.3527.650.91340.8818315.74304.83
Palmitic acid 3256.4329.257.60 a0.90520.8755292.87283.29
Stearic acid 2284.4829.019.81 a0.8420.8753324.99337.86
Trans fatty 0.5358.5727.519.12 b0.85210.8701412.09420.81
Erucic acid <0.1338.5828.128.75 a0.85710.8768386.14395.03
n-hexane 86.1818.500.31020.65940.6668129.23130.69
Ethyl oleate 310.5131.005.810.87010.8504365.11356.87
Diesel fuel 2.7 c0.8350
a at 343 K, b at 348 K, c kinematic viscosity at 313 K (mm2/s).
A good example of the influence of packing of the same chemical groups in a surface layer on the surface tension is the homologous series of saturated hydrocarbons. The γ L V values of these hydrocarbons from n-hexane to n-hexadecane at 293 K vary from 18.49 to 26.35 mN/m [44]. Due to its small surface tension, Hex is a suitable additive to canola oil to bring its surface tension closer to that of DF (Table 1, Figure 1). Since the surface tension of RO results from both the LW and AB interactions and that of Hex only from the LW interactions according to the classification of van Oss et al. [45,46,47], canola oil is treated as a bipolar liquid and n-hexane as an apolar liquid. Obviously, the acid–base component of the surface tension is a function of two parameters: electron-acceptor ( γ + ) and electron-donor ( γ ). If one of the parameters is equal to zero and the other is greater than zero, then a liquid is treated as monopolar. The monopolar liquid is ethyl oleate (EO). The occurrence of a COO group in its molecule causes γ > 0   while γ + = 0   due to the inability the hydrogen atom to form a hydrogen bond. The surface tension of EO is slightly lower than that of RO and higher than that of DF (Table 1). This indicates that the addition of EO to RO will not change its surface tension significantly but it can change the volumetric properties of RO, which are similar to those of DF.
Just as in the case of the surface layer, the packing of individual chemical groups present in the molecules of a given substance affects the surface tension, and their packing in the bulk phase affects the density and viscosity of the substance. Packing of the groups present in a given molecule can be demonstrated by calculating the volume of the molecule ( V m ) from the bond lengths, the angle between bonds, and the average distance between molecules ( d ) [18]. This volume can be determined by inscribing a molecule or part of it in an appropriate geometric figure or by adding up the volume occupied by individual chemical groups. In the case of unsaturated and saturated fatty acids, EO, and Hex, the volume of their molecules can be expressed by the following equations, respectively:
V m = V C H 3 + a V C H 2 + b V C H + V C O O H ,
V m = V C H 3 + a V C H 2 + V C O O H ,
V m = V C H 3 + a V C H 2 + b V C H + V C O O ,
V m = V C H 3 + a V C H 2 ,
where a and b are the numbers of C H 2 and C H groups in the molecule.
In the present study, in the calculation of V m , it was assumed that the average distance between the molecules of a given substance was equal to d = 2 Å. Based on V m , the mole volume ( V m M ) and density of RO, EO, and Hex were determined (Table 1). The V m M values were also determined, taking into account the molar mass and density of compounds (Table 1). According to these calculations, the packing of unsaturated fatty acid molecules in EO is tighter than that in Hex. For unsaturated fatty acids, which constitute 92% of RO as well as EO, the V m M values calculated based on the bond lengths, the angle between them, and d = 2 Å are greater than those calculated from the density and molar mass (Table 1). In the case of Hex, the volumes of its molecules calculated by the two methods are very close (Table 1). As a matter of fact, the density of Hex resulting from the volume of its molecules is much smaller than the density of RO, DF, EO, and all canola oil components (Table 1, Figure 1). Therefore, Hex is a good additive to RO to reduce its density to a value close to that of DF (Figure 1). However, as mentioned earlier, the density of EO is close to that of DF and not much smaller than the RO density, and its addition to canola oil will not change its density significantly (Figure 1). Therefore, the addition of EO to RO does not reduce its surface tension and density significantly. However, its addition could be more effective for reducing the viscosity of canola oil (Figure 1). An interesting and as yet inexplicable fact is that the viscosity of canola oil is more than twice as large as that of all its components. For this reason, it is difficult to use canola oil directly as a biofuel. Similarly to γ L V and ρ , the η values of canola oil can be drastically changed by Hex and/or EO addition. As mentioned above, the γ L V , ρ and η values of EO are close to those of DF (Figure 1). However, in order to reduce the viscosity of canola oil to a value that would guarantee its direct use as a biofuel, it would be necessary to add EO in very large quantities. Therefore, Hex is more effective in this respect. On the other hand, Hex having small values of viscosity, surface tension, and density can cause a large reduction in the γ L V and ρ values of canola oil. However, the values of surface tension and density of canola oil mixed with n-hexane at a Hex concentration at which the viscosity of this mixture is close to that of DF are smaller than that of diesel fuel (Table 1, Figure 1). Therefore, it appears that the addition of a mixture of Hex and EO to RO can be more effective in adapting its physicochemical properties to be applied in diesel engines as a fuel.

3.2. Surface Tension, Density, and Viscosity of Canola Oil Mixtures with n-Hexane and Ethyl Oleate

For a better understanding of changes in the surface tension, density, and viscosity of the ternary mixture canola oil + ethyl oleate + n-hexane (RO + EO + Hex) as a function of its composition, it is necessary to analyze changes in these parameters for the binary mixtures of canola oil with n-hexane (RO + Hex) and ethyl oleate (RO + EO) as well as of ethyl oleate with n-hexane (EO + Hex) as a function of their compositions.
Dependencies between the surface tension and composition of the binary mixtures can be linear, and γ L V can change from the value of one component to the other; however, there can be positive and negative deviations from linearity. If the concentration of both components in the bulk and surface phases is the same, a linear relationship between γ L V and the concentration of one of the components can be expected. The linear dependence between γ L V and the composition can be expected for a mixture in which there are only Lifshitz–van der Waals interactions both between molecules of the same component and between molecules of both components of the mixture. A positive deviation of γ L V from the linear dependence on the mixture composition should occur if the concentration of the mixture component with a higher surface tension in the surface phase is larger than in the bulk phase. On the contrary, a negative deviation from linearity occurs if the concentration of the component with the smaller surface tension is higher in the surface region than in the bulk phase. Therefore, considering the changes in the measured γ L V values of RO + Hex, RO + EO and EO + Hex, it can be concluded that the concentration of n-hexane and ethyl oleate in the surface layer is higher than in the bulk phase of the mixture with canola oil, while the concentration of Hex and EO is the same in their mixture in the surface layer and the bulk phase (Figure 2).
As mentioned earlier, Hex is an apolar liquid and ethyl oleate is a monopolar liquid. However, Hex molecules cannot form a hydrogen bond with the oxygen atoms in EO molecules. Thus, there are only LW interactions between the Hex and EO molecules. This is probably the reason why there is a linear relationship between γ L V of the EO + Hex mixture and its composition (Figure 2). In the case of the RO + Hex mixture, positive adsorption of Hex may occur at the canola oil–air interface, and therefore, its concentration is higher in the surface region than in the bulk phase of this mixture, which causes the γ L V of the mixture to deviate from the linear dependence on its composition (Figure 2). It should be pointed out that in the binary mixture of RO + EO, the surface tensions of both components do not differ much from each other (Figure 2) [36]. In this mixture, hydrogen bridges can be formed between the molecules of the canola oil components as well as between the ethyl oleate molecules and the canola oil components. On the other hand, the hydrophobic part of EO molecules has a larger contactable area than the molecules of acids that are present in canola oil, and simultaneously, EO molecules do not have a distinct polar part. For this reason, a small increase in the concentration of ethyl oleate in the surface layer in relation to the bulk phase can take place. This probably causes a small deviation from the linear relation between the surface tension and concentration of the mixture (Figure 2).
The shape of the γ L V isotherms of mixtures indicates the type of chemical groups present in the surface layer that determine the value of the surface tension. As a matter of fact, besides the type of groups, their packing also influences the shape of the γ L V isotherm of multi-component mixtures. For a given mixture, types of chemical groups that might be present in the surface region are known but not their packing. Therefore, it is difficult to predict or describe the γ L V isotherm of a given mixture. The only certain values are molar fractions of the components of a given mixture in the bulk phase. In the case of an ideal mixture, such as the EO + Hex one, its surface tension ( γ 12 ) follows the simple relationship
γ 12 = γ 1 x 1 + γ 2 x 2 ,
where γ is the surface tension, x is the molar fraction, and 1 and 2 refer to n-hexane and ethyl oleate, respectively.
The calculations based on Equation (5) and the Connors equation (Equation (6)) confirm the above-mentioned statement (Figure 2). The Connors equation has the form [48,49]
γ 12 = γ 2 γ 2 γ 1 1 + b 1 x 1 1 a 1 x 1 x 1 ,
where b and a are constants that are equal to zero for the Hex + EO mixture.
Contrary to the Hex + EO mixture, for the RO + Hex and RO + EO mixtures, Equation (5) is not satisfied, and in Equation (6), b > 0 and a > 0. This proves that RO mixtures with Hex and EO are not ideal. For these mixtures, it is not possible to predict their surface tension based on Equations (5) and (6), taking into account the surface tension of individual mixture components and their molar fractions in the bulk phase. Using Equation (6), it is only possible to describe the γ L V isotherms of these mixtures by selecting the values of constants.
It was proved that the γ L V isotherm of the RO + EO mixture can be described at b = 0.95 and a = 0.4 , whereas that for the RO + Hex mixture can be described at b = 0.55 and a = 0.55 (Figure 2). As follows from these constants, the interactions between the RO and EO molecules are different from those between RO and Hex. Despite the fact that canola oil is a mixture of different types of compounds at various concentrations, in our study, we treated it as a single component of the mixtures. Taking this into account, the RO + Hex and RO + EO mixtures are treated as binary mixtures, while RO + Hex + EO is treated as ternary. The surface tension isotherms of RO mixtures with EO and Hex can be successfully described using the Prigogine and Defay equation [50] (Figure 2) which has the form
γ 12 = γ 1 x 1 + γ 2 x 2 β x 1 x 2   ,
where β is the constant determined numerically.
The β constant is equal to 12 for the RO + Hex mixture and 2.5 for the RO + EO mixture. This indicates that, similarly to the data obtained from Equation (6), there are significant differences in the interactions between the RO and EO molecules and between the RO and Hex ones.
Contrary to the surface tension, which depends on the behavior of the mixture components in the surface region, density ( ρ ) and viscosity ( η ) are closely related to the behavior of its components in the bulk phase. The ρ values of a mixture depend on the molar volume of the components in the mixture, which is not always equal to its own volume before the mixture is formed at a given temperature. The density of a mixture ( ρ m i x ) can be determined from the densities of mixture components ( ρ 1 ,   ρ 2   ρ i   ), their volumes ( V 1 ,   V 2 V i ) taken to form a mixture, and the volume of the obtained mixture ( V m i x ) using the expression
ρ m i x = ρ 1 V 1 + ρ 2 V 2 +   ρ i V i   V m i x ,
The density calculations from Equation (8) for the EO + Hex, RO + Hex, and RO + EO mixtures show that for the RO + EO mixture, its V m i x = V 1   + V 2 is almost the same, for EO + Hex, it is slightly smaller, and for the RO + Hex mixture, it is quite different from the sum of components volume (Figure 3) [36]. In particular, n-hexane seems to be susceptible to changes in its volume when mixed with components with much larger molecules. Such changes in the Hex volume during the formation of a mixture with EO and/or RO can be explained based on the average intermolecular distance. It was shown that the average distance between n-hexane molecules in the bulk phase at 293 K is equal to 2 Å [18], and at this temperature, its ρ = 0.6594 g/cm3. On the other hand, the minimum distance between the particles cannot be smaller than 1.56 Å [51]. At this distance, the density of n-hexane would be 0.8841 g/cm3. It is possible that after mixing RO with Hex or EO, the fatty acid molecules and EO do not change their volume significantly. It is surprising that the density of the RO + Hex mixture can be described by the following equation [43]:
ρ m i x = ρ 1 x 1 + ρ 2 x 2 + k x 1 x 2 ,
where k is a constant equal to 0.14.
Not only density depends on the packing of molecules of a given substance and their structure in the bulk phase, but also viscosity. The η isotherms (Figure 4) indicate that only in the case of RO + Hex mixture is it possible to obtain an η value close to that of diesel fuel at a 20% concentration of Hex in the mixture. In the case of the RO + EO mixture, the η value is close to that of diesel fuel if the molar fraction of EO is close to unity (Figure 4). This proved that the viscosity isotherm of RO + Hex and RO + EO can be described by the Gmehling et al. equation [52], which for the multi-component mixture has the form
l n η m i x c P = i x i l n η i c P ,
where η m i x   a n d   η i are the viscosities of the mixture, and its i component is expressed in cP.
Unfortunately, the η isotherm of the EO + Hex mixture cannot be described by Equation (10). The values of mixture viscosity calculated from this equation differ from those measured by 3.486 x 1 x 2 [36]. The difference between the viscosity values of the EO + Hex mixture measured and calculated from Equation (11) probably results from a large decrease in n-hexane’s molar volume in this mixture.

3.3. Surface Tension, Density, and Viscosity of RO + EO + Hex Mixture

As mentioned earlier, the surface tension, density, and viscosity of Hex are much smaller than those of EO and RO. However, γ L V and ρ of EO are not much lower than those of RO and not much higher than those of DF. In the case of EO, η is much lower than RO and similar to DF. This indicates that the addition of Hex to RO causes mostly favorable changes in viscosity and less favorable ones in the surface tension and density [36]. However, the addition of EO to RO causes favourable changes in η and minor changes in γ L V and ρ . Thus, it should be concluded that the presence of Hex in the RO + Hex + EO mixture reduces the surface tension, density, and viscosity. In turn, the presence of EO intensifies the reduction of viscosity but reduces that of surface tension and density (Figure 3, Figure 4, Figure 5, Figure 6 and Figure 7). Based on the behavior of two-component mixtures, it should also be assumed that changes in the surface tension of a three-component mixture (conventionally) result primarily from the difference in the concentrations of the mixture components in the surface layer in relation to the bulk phase, while those in density and viscosity result from changes in the structure and intermolecular distances in the bulk phase. The inhibitory effect of EO on the reduction of RO γ L V by Hex is confirmed by the surface tension changes of the RO + EO + Hex mixture as a function of Hex concentration at different mixture compositions (Figure 5). At the same molar fraction of Hex in the mixture, its surface tension increases with increasing EO content. It is interesting to note that there is a smaller deviation of γ L V of the ternary RO + EO + Hex mixture as a function of its composition than in the case of the RO + Hex and RO + EO mixtures (Figure 2 and Figure 5).
As mentioned above, the γ L V isotherms of the binary EO + Hex, RO + EO, and RO + Hex mixtures could be described using Equation (7). As a matter of fact, RO is treated as one component, although it contains many different substances. In the mixture, Hex molecules can interact with RO and EO molecules, while EO can interact with Hex and RO molecules, so γ L V of this mixture can be expressed by the following equation:
γ 123 = γ 1 x 1 + γ 2 x 2 + γ 3 x 3 k x 1 x 2 + l x 1 x 3 + m x 2 x 3 ,
where 123 corresponds to the ternary mixture, whereas 1, 2, and 3 correspond to Hex, RO, and EO, respectively.   k , l , and m are constants.
As shown earlier, EO + Hex is an ideal mixture, thus l = 0, and Equation (11) simplifies to the form
γ 123 = γ 1 x 1 + γ 2 x 2 + γ 3 x 3 k x 1 x 2 + m x 2 x 3 ,
The constants k and m can be determined numerically.
It was proved that by using Equation (12), it was possible to describe all isotherms obtained from the surface tension measurements of ternary mixtures including those with a constant volume of EO and a variable volume of Hex and RO (Figure 5). Moreover, except for the mixture including 10% of EO volumetrically, for which the constants k and m were equal to 3, these constants were equal to 2. These constants are close to β for the RO + EO binary mixture (2.5), whereas the constants k and m are considerably smaller than β for the RO + Hex binary mixture ( β = 12).
The γ L V isotherms of mixtures of RO with Hex and EO depend on the number of molecules of RO, Hex, and EO present in the surface region as well as their packing in this region. The density and viscosity of this mixture depend on the behavior of the molecules of its components in the bulk phase. Similarly to γ L V , the presence of EO in the ternary mixture inhibits the strong reduction in RO density by Hex (Figure 6). This conclusion also follows from the comparison of the ρ isotherms of the RO + Hex mixture (Figure 3) with the isotherms for the RO + Hex + EO mixture (Figure 6).
Similarly to the EO + Hex and EO + RO mixtures, the ρ m i x of the RO + EO + Hex mixture solution can be predicted based on ρ of the individual mixture components and their molar fractions from Equation (8). The ρ m i x values of ternary mixtures calculated from Equation (8), based on the measured values of V of the RO + EO + Hex mixture, are consistent with those measured directly. For all studied ternary mixtures, V < V 1 + V 2 + V 3 . Indeed, the reduction in volume of the mixture during its preparation influences the mixture viscosity. This may be due to strong Lifshitz–van der Waals interactions between the Hex molecules and RO and EO, which may result in the formation of aggregates composed of Hex and RO or Hex and EO molecules. The fatty acids and EO molecules have a large surface area and they can be surrounded by up to 12 Hex molecules in parallel contact with them. Such small aggregates probably interact with each other with forces much smaller than those of the RO and EO molecules directly interacting with each other. This is probably the main reason for RO’s viscosity reduction due to the addition of Hex.
It was found that the viscosity of the RO + EO + Hex mixtures (Figure 7) can be predicted based on Equation (10) and taking into account the viscosity of their individual components.
The η m i x values of the RO + EO + Hex mixture obtained from Equation (10) are close to those measured. This means that based on Equation (10), one can select the composition of the RO + EO + Hex mixture so that its viscosity value is suitable for its use as a biofuel. In fact, the selection of viscosity is also related to the selection of density and surface tension of the mixture.

4. Conclusions

By adding Hex to RO, its high viscosity can be reduced to a value close to that of DF, while simultaneously lowering its surface tension and density below those of DF. For this reason, there may be difficulties in using a RO + Hex mixture as a biofuel.
In contrast to Hex, by adding EO to RO, it is possible to obtain a density and surface tension similar to those of DF, but at the same time, it is not possible to obtain a viscosity of the RO + EO mixture similar to that of DF. Hence, the use of such a mixture as biofuel may be less effective than RO + Hex mixtures.
The simultaneous addition of Hex and EO to RO with the same total volume of Hex and EO as the individual additives results in more favorable changes in its surface tension, density, and viscosity compared to those values for DF and for those of RO + Hex and RO + EO mixtures.
The isotherms of the surface tension of both binary and ternary mixtures can be described by the Prigogine and Defay equation based on the surface tension values of the mixture’s components and composition and the constant that reflects the intermolecular interactions between the mixture components. For RO + EO + Hex mixtures, the equation of Prigogine and Defay was slightly modified by us.
The density of the RO + EO + Hex, RO + Hex, and RO + EO mixtures can be calculated based on the density and volume of individual components of the mixture.
The equation of Gmehling et al. can be helpful to determine the most appropriate composition of the RO + EO + Hex mixture for its possible use as biofuel.
This equation allows us to predict the viscosity of a mixture of canola oil with either Hex or EO, or RO + Hex + EO. We can predict the viscosity of any composition based on the viscosity of the mixture components.
Studies on the effect of the simultaneous addition of Hex and EO on the surface tension, density, and viscosity of RO are difficult to find in the literature. It seems that such a mixture can be the most suitable as a biofuel. However, this conclusion should be supported by further studies, including studies on the effect of temperature on the surface tension of the RO + EO + Hex mixture or spectroscopic studies.

Author Contributions

Conceptualization, K.S., A.Z. and B.J.; methodology, K.S. and A.Z.; software, K.S. and A.Z.; validation, K.S., A.Z. and B.J.; formal analysis, K.S. and A.Z.; investigation, K.S. and A.Z.; resources, K.S. and A.Z.; data curation, K.S., A.Z. and B.J.; writing—original draft preparation, K.S., A.Z. and B.J.; writing—review and editing, K.S., A.Z. and B.J.; visualization, K.S., A.Z. and B.J.; supervision, B.J.; project administration, B.J. All authors have read and agreed to the published version of the manuscript.

Funding

This research received no external funding.

Data Availability Statement

The original contributions presented in the study are included in the article; further inquiries can be directed to the corresponding author.

Conflicts of Interest

The authors declare no conflicts of interest.

References

  1. Chen, C.; Lu, J.; Ma, T.; Zhang, Y.; Gu, L.; Chen, X. Applications of vegetable oils and their derivatives as Bio-Additives for use in asphalt binders: A review. Const. Build. Mater. 2023, 383, 131. [Google Scholar] [CrossRef]
  2. Nogales-Delgado, S.; Encinar, J.M.; González, J.F. A Review on Biolubricants Based on Vegetable Oils through Transesterification and the Role of Catalysts: Current Status and Future Trends. Catalysts 2023, 13, 1299. [Google Scholar] [CrossRef]
  3. Kumar, A.; Sharma, A.; Upadhhyaya, K.C. Vegetable Oil: Nutritional and Industrial Perspective. Curr. Genomics. 2016, 17, 230–240. [Google Scholar] [CrossRef] [PubMed]
  4. Moghadas, H.C.; Chauhan, R.; Smith, J.S. Application of Plant Oils as Functional Additives in Edible Films and Coatings for Food Packaging: A Review. Foods 2024, 13, 997. [Google Scholar] [CrossRef] [PubMed]
  5. Szczepaniak, I.; Olech, I.; Szymańska, E.J. The Use of Canola for Biofuel Production in the Context of Energy Security—A Systematic Literature Review. Energies 2025, 18, 2410. [Google Scholar] [CrossRef]
  6. Banga, S.M.; Pathak, V.V. Biodiesel production from waste cooking oil: A comprehensive review on the application of heterogenous catalysts. Energy Nexus 2023, 10, 100209. [Google Scholar] [CrossRef]
  7. Rajak, A.K.; Harikrishna, M.; Mahato, D.L.; Anandamma, A.U.; Pothu, R.; Sarangi, P.K.; Sahoo, U.K.; Vennu, V.; Boddula, R.; Karuna, M.S.L. Valorising orange and banana peels: Green catalysts for transesterification and biodiesel production in a circular bioeconomy. J. Taiwan Instit. Chem. Eng. 2024, 13, 105804. [Google Scholar] [CrossRef]
  8. Badsha, M.; Maheer, U.; Omar, F.M.; Ramli, A.; Balakrishnan, V.; Hamed, Y.; Arafath, A.; Hossain, S. Sustainable approaches on innovative utilization of household food waste as a renewable biomass for bioenergy production: Potential, challenges and social-environmental impacts. Biomass Bioenergy 2025, 200, 107995. [Google Scholar] [CrossRef]
  9. Lefebvre, A.H.; McDonell, V.G. Atomization and Sprays, 2nd ed.; CRC Press: Boca Raton, FL, USA, 2017; p. 300. [Google Scholar]
  10. Slavinskas, S. An Experimental Study on the Injection Characteristics and the Macroscopic Spray Characteristics of Rapeseed Oil-Diesel Fuel Blends. Appl. Sci. 2023, 13, 5944. [Google Scholar] [CrossRef]
  11. Khan, E.; Ozaltin, K.; Spagnuolo, D.; Bernal-Ballen, A.; Piskunov, M.V.; Di Martino, A. Biodiesel from Rapeseed and Sunflower Oil: Effect of the Transesterification Conditions and Oxidation Stability. Energies 2023, 16, 657. [Google Scholar] [CrossRef]
  12. Silva, L.E.; Santos, C.A.C.; Ribeiro, J.E.S.; Souza, C.C.; Sant’Ana, A.M.S. Rheological Analysis Of Vegetable Oils Used For Biodiesel Production In Brazil. Rev. Eng. Térmica 2015, 14, 31–36. [Google Scholar] [CrossRef]
  13. Maksimuk, Y.V.; Buglak, A.F.; Kruk, V.S.; Antonova, Z.A. Rheological properties of residual fuel oil containing fuel blends with bioadditives. Part 1. Rapeseed oil based bioadditives. Chem. Technol. Fuels Oils 2013, 49, 108–114. [Google Scholar] [CrossRef]
  14. Mawatari, T.; Fukuda, R.; Mori, H.; Mia, S.; Ohno, N. High Pressure Rheology of Environmentally Friendly Vegetable Oils. Tribol. Lett. 2013, 51, 273–280. [Google Scholar] [CrossRef]
  15. Sajjadi, B.; Raman, A.A.A.; Arandiyan, H. A Comprehensive Review on Properties of Edible and Non-Edible Vegetable Oil-Based Biodiesel: Composition, Specifications and Prediction Models. Renew. Sustain. Energy Rev. 2016, 63, 62–92. [Google Scholar] [CrossRef]
  16. Mamedov, I.G.; Mamedova, G.; Azimova, N. Testing of Ethylene Glycol Ketal, Dioxane and Cyclopentanone as Components of B10, B20 Fuel Blends. Energy Environ. Storage 2022, 2, 9–12. [Google Scholar] [CrossRef]
  17. Binhweel, F.; Bahadi, M.; Elgamouz, A. A Comparative Review of Some Physicochemical Properties of Biodiesels Synthesized from Different Generations of Vegetative Oils. Mater. Today Proc. 2021, 47, 2217–2224. [Google Scholar] [CrossRef]
  18. Longwic, R.; Sander, P.; Zdziennicka, A.; Szymczyk, K.; Jańczuk, B. Changes of Some Physicochemical Properties of Canola Oil by Adding n-Hexane and Ethanol Regarding Its Application as Diesel Fuel. Appl. Sci. 2023, 13, 1108. [Google Scholar] [CrossRef]
  19. Borugadda, V.B.; Somidi; A. K.R.; Dalai, A.K. Chemical/Structural Modification of Canola Oil and Canola Biodiesel: Kinetic Studies and Biodegradability of the Alkoxides. Lubricants 2017, 5, 11. [Google Scholar] [CrossRef]
  20. Gotovuša, M.; Medić, M.; Faraguna, F.; Šibalić, M.; Konjević, L.; Vuković, J.P.; Racar, M. Fatty acids propyl esters: Synthesis optimization and application properties of their blends with diesel and 1-propanol. Renew. Energy 2022, 185, 655–664. [Google Scholar] [CrossRef]
  21. Zeng, Y.; Shang, Z.; Zheng, Z.; Shi, N.; Yang, B.; Han, S.; Yan, J. A Review of Chemical Modification of Vegetable Oils and Their Applications. Lubricants 2024, 12, 180. [Google Scholar] [CrossRef]
  22. Wedler, C.; Trusler, J.P.M. Review of density and viscosity data of pure fatty acid methyl ester, ethyl ester and butyl ester. Fuel 2023, 339, 127466. [Google Scholar] [CrossRef]
  23. Xiao, H.-M.; Rao, D.; Zhao, S.; Hussain, D.; Chen, J.-L.; Luo, D.; Wang, D.; Lv, X.; Wei, F.; Chen, H. Formation of medium- and long-chain fatty alcohols in long-term stored oil and biodiesels revealed by chemical isotope labeling-liquid chromatography-high resolution mass spectrometry. Ind. Crops Prod. 2023, 193, 116171. [Google Scholar] [CrossRef]
  24. Rayapureddy, S.M.; Matijošius, J.; Rimkus, A.; Caban, J.; Słowik, T. Comparative Study of Combustion, Performance and Emission Characteristics of Hydrotreated Vegetable Oil–Biobutanol Fuel Blends and Diesel Fuel on a CI Engine. Sustainability 2022, 14, 7324. [Google Scholar] [CrossRef]
  25. Brahma, S.; Patir, B.N.K.; Basumatary, B.; Basumatary, S. Biodiesel production from mixed oils: A sustainable approach towards industrial biofuel production. Chem. Eng. J. Adv. 2022, 10, 100284. [Google Scholar] [CrossRef]
  26. Estevez, R.; López-Tenllado, F.J.; Aguado-Deblas, L.; Bautista, F.M.; Romero, A.A.; Luna, D. Evaluation of Advanced Biofuels in Internal Combustion Engines: Diesel/Fuel Oil/Vegetable Oil Triple Blends. Fuels 2024, 5, 660–672. [Google Scholar] [CrossRef]
  27. Sukjit, E.; Maneedaeng, A. Effect of mixed nonionic surfactants on microemulsion phase boundary, fuel property, and engine performance of biofuels. Energy Rep. 2022, 8, 722–730. [Google Scholar] [CrossRef]
  28. Phasukarratchai, N. Phase behavior and biofuel properties of waste cooking oil-alcohol-diesel blending in microemulsion form. Fuel 2019, 243, 125–132. [Google Scholar] [CrossRef]
  29. Arpornpong, N.; Attaphongc, C.; Charoensaengd, A.; Sabatinic, D.A.; Khaodhiar, S. Ethanol-in-palm oil/diesel microemulsion-based biofuel: Phase behavior, viscosity, and droplet size. Fuel 2014, 132, 101–106. [Google Scholar] [CrossRef]
  30. Najjar, R.; Zarei-Gharehbaba, L.; Tazerout, M. The exhaust emission characteristics of a water-emulsified diesel/sunflower oil blend fuel by ionic liquid surfactants. Inter. J. Environ. Sci. Technol. 2022, 19, 1175–1184. [Google Scholar] [CrossRef]
  31. Longwic, R.; Sander, P.; Jańczuk, B.; Zdziennicka, A.; Szymczyk, K. Modification of Canola Oil Physicochemical Properties by Hexane and Ethanol with Regards of Its Application in Diesel Engine. Energies 2021, 14, 4469. [Google Scholar] [CrossRef]
  32. Sander, P.; Longwic, R.; Jańczuk, B.; Zdziennicka, A.; Szymczyk, K. The Use of Canola Oil, n-Hexane, and Ethanol Mixtures in a Diesel Engine. SAE Int. J. Fuels Lubr. 2021, 14, 123–138. [Google Scholar] [CrossRef]
  33. Xin, H.; Hu, X.; Cai, C.; Wang, H.; Zhu, C.; Li, S.; Xiu, Z.; Zhang, X.; Liu, Q.; Ma, L. Catalytic Production of Oxygenated and Hydrocarbon Chemicals From Cellulose Hydrogenolysis in Aqueous Phase. Front. Chem. 2020, 5, 333. [Google Scholar] [CrossRef] [PubMed]
  34. Gunawan, M.; Hudaya, T.; Soerawidjaja, T.H. Synthesis of Bio-hexane and Bio-Hexene from Sorbitol, Using Formic Acid as Reducing Agent. J. Eng. Technol. Sci. 2021, 53, 210106. [Google Scholar] [CrossRef]
  35. Liu, S.; Tamura, M.; Nakagawa, Y.; Tomishige, K. One-pot conversion of cellulose into n -hexane over the Ir-ReO x/SiO2 catalyst combined with HZSM-5. ACS Sustain. Chem. Eng. 2014, 2, 1819–1827. [Google Scholar] [CrossRef]
  36. Szymczyk, K.; Zdziennicka, A.; Jańczuk, B. Some physicochemical properties of ethyl oleate mixtures with ethanol and n-hexane. J. Mol. Liq. 2024, 408, 125318. [Google Scholar] [CrossRef]
  37. Suzara, R.; de Castro, S.; Eduardo, L.; de Barros, N.; Gambini, C. Effect of ethyl octanoate and ethyl oleate on the properties of gasoline fuel mixture. Energy Fuels 2019, 33, 9429–9436. [Google Scholar] [CrossRef]
  38. Senna, S.R.C.; Barros Neto, E.L.; Pereira, C.G. Evaluation of the lubrication of ethyl oleate and ethyl octanoate as gasoline additive. Braz. J. Petrol. Gas 2019, 13, 111–118. [Google Scholar] [CrossRef]
  39. Polish Standard PN-EN 590; Fuels for Motor Vehicles—Gas Oils—Requirements and Test Methods. European Committee: Brussels, Poland, 2011.
  40. Fowkes, F.M. Attractive forces at interfaces. Ind. Eng. Chem. 1964, 56, 40–52. [Google Scholar] [CrossRef]
  41. Oss, C.J.V. Interfacial Forces in Aqueous Media, 1st ed.; Marcel Dekker: New York, NY, USA, 1994. [Google Scholar]
  42. Van Oss, C.J.; Costanzo, P.M. Adhesion of anionic surfactants to polymer surfaces and low-energy materials. J. Adhes. Sci. Technol. 1992, 6, 477–487. [Google Scholar] [CrossRef]
  43. Szymczyk, K.; Zdziennicka, A.; Jańczuk, B.; Lubas, J.; Jaworski, A.; Kuszewski, H.; Woś, P.; Longwic, R.; Sander, P. N-hexane influence on canola oil adhesion and volumetric properties. Int. J. Adhes. Adhes. 2025, 140, 103990. [Google Scholar] [CrossRef]
  44. Klein, T.; Yan, S.; Cui, J.; Mangee, J.W.; Kroenlein, K.; Rausch, M.H.; Koller, T.M.; Fröba, A.P. Liquid Viscosity and Surface Tension of n-Hexane, n-Octane, n-Decane, and n-Hexadecane up to 573 K by Surface Light Scattering. J. Chem. Eng. Data 2019, 64, 4116–4131. [Google Scholar] [CrossRef] [PubMed]
  45. Oss, C.J.V.; Good, R.J. Surface tension and the solubility of polymers and biopolymers: The role of polar and apolar interfacial free energies. J. Macromol. Sci. 1989, 26, 1183–1203. [Google Scholar]
  46. Oss, C.J.V.; Chaudhury, M.K.; Good, R.J. Monopolar surfaces. Adv. Colloid Interface Sci. 1987, 28, 35–64. [Google Scholar] [CrossRef] [PubMed]
  47. Oss, C.J.V.; Good, R.J.; Chaudhury, M.K. Additive and nonadditive surface tension components and the interpretation of contact angles. Langmuir 1988, 4, 884–891. [Google Scholar] [CrossRef]
  48. Connors, K.A.; Wright, J.L. Dependence of surface tension on composition of binary aqueous-organic solutions. Anal. Chem. 1989, 61, 194–198. [Google Scholar] [CrossRef]
  49. Khossravi, D.; Connors, K.A. Solvent effects on chemical processes. 3. Surface tension of binary aqueous organic solvents. J. Sol. Chem. 1993, 22, 321–330. [Google Scholar] [CrossRef]
  50. Defay, R.; Prigogine, I.; Bellemas, A.; Everett, D.H. Surface Tension and Adsorption; John Wiley & Sons: New York, NY, USA, 1966. [Google Scholar]
  51. Szymczyk, K.; Zdziennicka, A.; Jańczuk, B. Comparison of surface tension, density, viscosity and contact angle of ethyl oleate to those of ethanol and oleic acid. J. Mol. Liq. 2024, 400, 124525. [Google Scholar] [CrossRef]
  52. Gmehling, J.; Kolbe, B.; Kleiber, M.; Rarey, J. Chemical Thermodynamics for Process Simulation, 2nd ed.; Wiley-VCH Verlag GmbH & Co. KGaA: Weinheim, Germany, 2019. [Google Scholar]
Figure 1. The γ L V (a), ρ (b) and η (c) values for Hex, EO, and RO at 293 K.
Energies 18 03802 g001
Figure 2. The γ L V values for EO + Hex (EO90Hex10, EO80Hex20, EO70Hex30, EO 60Hex40, EO50Hex50, EO40Hex60, EO30Hex70, EO20Hex80, EO10Hex90, point 1, curves 1′ and 1”), RO + Hex (RO90Hex10, RO80Hex20, RO70Hex30, RO60Hex40, RO50Hex50, RO40Hex60, RO30Hex70, RO20Hex80, RO10Hex90, point 2, curves 2′ and 2″), and RO + EO mixtures (RO90EO10, RO80EO20, RO70EO30, RO60EO40, RO50EO50, RO40EO60, RO30EO70, RO20EO80, RO10EO90, point 3, curves 3′ and 3″) vs. x H e x or x R O . Points 1–3—measured; curves 1′–3′ calculated from Equation (7) and 1″–3″ calculated from Equation (6).
Energies 18 03802 g002
Figure 3. The ρ values for EO + Hex (EO90Hex10, EO80Hex20, EO70Hex30, EO 60Hex40, EO50Hex50, EO40Hex60, EO30Hex70, EO20Hex80, EO10Hex90, point 1 and curve 1′), RO + Hex (RO90Hex10, RO80Hex20, RO70Hex30, RO60Hex40, RO50Hex50, RO40Hex60, RO30Hex70, RO20Hex80, RO10Hex90, point 2 and curve 2′), and RO + EO mixtures (RO90EO10, RO80EO20, RO70EO30, RO60EO40, RO50EO50, RO40EO60, RO30EO70, RO20EO80, RO10EO90, point 3 and curve 3′) vs. x H e x or x R O . Points 1–3—measured, curves 1′–3′ calculated from Equation (9).
Energies 18 03802 g003
Figure 4. The η values for EO + Hex (EO90Hex10, EO80Hex20, EO70Hex30, EO 60Hex40, EO50Hex50, EO40Hex60, EO30Hex70, EO20Hex80, EO10Hex90, point 1 and curve 1′), RO + Hex (RO90Hex10, RO80Hex20, RO70Hex30, RO60Hex40, RO50Hex50, RO40Hex60, RO30Hex70, RO20Hex80, RO10Hex90, point 2 and curve 2′), and RO + EO mixtures (RO90EO10, RO80EO20, RO70EO30, RO60EO40, RO50EO50, RO40EO60, RO30EO70, RO20EO80, RO10EO90, point 3 and curve 3′) vs. x H e x or x R O . Points 1–3—measured, curves 1′–3′ calculated from Equation (10).
Energies 18 03802 g004
Figure 5. The γ L V values measured (points 1–5) and calculated from Equation (12) (curves 1′–5′) for the RO + EO + Hex mixture vs. x H e x . Point 1 and curve 1′—EO = 10% v/v, RO and Hex change from 0 to 90% v/v (RO80EO10Hex10, RO70EO10Hex20, RO50EO10Hex40, RO30EO10Hex60, RO10EO10Hex80); point 2 and curve 2′—EO = 20% v/v, RO and Hex change from 0 to 80% v/v (RO70EO20Hex10, RO60EO20Hex20, RO40EO20Hex40, RO20EO20Hex60, RO10EO20Hex70); point 3 and curve 3′—EO = 40% v/v, RO and Hex change from 0 to 60% v/v (RO50EO40Hex10, RO40EO40Hex20, RO20EO40Hex40, RO10EO40Hex50); point 4 and curve 4′—EO = 60% v/v, RO and Hex change from 0 to 40% v/v (RO30EO60Hex10, RO20EO60Hex20, RO10EO60Hex30); point 5 and curve 5′—EO = 80% v/v, RO and Hex change from 0 to 20% v/v (RO10EO80Hex10).
Energies 18 03802 g005
Figure 6. The ρ values measured (points 1–5) and calculated from Equation (8) (curves 1′–5′) for the RO + EO + Hex mixture vs. x H e x . Point 1 and curve 1′—EO = 10% v/v, RO and Hex change from 0 to 90% v/v (RO80EO10Hex10, RO70EO10Hex20, RO50EO10Hex40, RO30EO10Hex60, RO10EO10Hex80); point 2 and curve 2′—EO = 20% v/v, RO and Hex change from 0 to 80% v/v (RO70EO20Hex10, RO60EO20Hex20, RO40EO20Hex40, RO20EO20Hex60, RO10EO20Hex70); point 3 and curve 3′—EO = 40% v/v, RO and Hex change from 0 to 60% v/v RO50EO40Hex10, RO40EO40Hex20, RO20EO40Hex40, RO10EO40Hex50); point 4 and curve 4′—EO = 60% v/v, RO and Hex change from 0 to 40% v/v (RO30EO60Hex10, RO20EO60Hex20, RO10EO60Hex30); point 5 and curve 5′—EO = 80% v/v, RO and Hex change from 0 to 20% v/v (RO10EO80Hex10).
Energies 18 03802 g006
Figure 7. The η values measured (points 1–5) and calculated from Equation (10) (curves 1′–5′) for the RO + EO + Hex mixture vs. x H e x . Point 1 and curve 1′—EO = 10% v/v, RO and Hex change from 0 to 90% v/v (RO80EO10Hex10, RO70EO10Hex20, RO50EO10Hex40, RO30EO10Hex60, RO10EO10Hex80); point 2 and curve 2′—EO = 20% v/v, RO and Hex change from 0 to 80% v/v (RO70EO20Hex10, RO60EO20Hex20, RO40EO20Hex40, RO20EO20Hex60, RO10EO20Hex70); point 3 and curve 3′—EO = 40% v/v, RO and Hex change from 0 to 60% v/v (RO50EO40Hex10, RO40EO40Hex20, RO20EO40Hex40, RO10EO40Hex50); point 4 and curve 4′—EO = 60% v/v, RO and Hex change from 0 to 40% v/v (RO30EO60Hex10, RO20EO60Hex20, RO10EO60Hex30); point 5 and curve 5′—EO = 80% v/v, RO and Hex change from 0 to 20% v/v (RO10EO80Hex10).
Energies 18 03802 g007
Disclaimer/Publisher’s Note: The statements, opinions and data contained in all publications are solely those of the individual author(s) and contributor(s) and not of MDPI and/or the editor(s). MDPI and/or the editor(s) disclaim responsibility for any injury to people or property resulting from any ideas, methods, instructions or products referred to in the content.

