Article

Research on Energy Security in the EU from a Trade Perspective: A Historical Analysis from 1991 to 2021

by
Quanxiao Li
1,2,3 and
Zhouying Song
1,2,3,*
1
Institute of Geographic Sciences and Natural Resources Research, Chinese Academy of Sciences, Beijing 100101, China
2
Key Laboratory of Regional Sustainable Development Modeling, Chinese Academy of Sciences, Beijing 100101, China
3
College of Resources and Environment, University of Chinese Academy of Sciences, Beijing 100049, China
*
Author to whom correspondence should be addressed.
Energies 2025, 18(14), 3801; https://doi.org/10.3390/en18143801
Submission received: 6 June 2025 / Revised: 9 July 2025 / Accepted: 14 July 2025 / Published: 17 July 2025
(This article belongs to the Section C: Energy Economics and Policy)

Abstract

Energy security is a global and strategic issue that is vital to national economic and social development. The conflict between Russia and Ukraine has profoundly changed the world’s energy trade structure and brought great challenges to global energy security, especially to the European Union (EU). Under this background, this study tries to construct a conceptual framework for energy security from trade and selects the EU as a case to analyze its energy security evolution at both the regional and national scales. The findings of this paper are as follows. (1) In the context of energy transition, oil and gas remain pivotal components due to their longstanding historical presence. However, they are also the most susceptible elements within the EU’s energy system. (2) The level of oil security within the EU is higher than that of natural gas. The level of oil security in member countries varies considerably, with significant geographic disparities. Aside from the exception of the Netherlands and Denmark, the majority of member countries exhibit a consistently low level of natural gas security. (3) From 1991 to 2021, the EU’s energy security pattern underwent significant changes, exhibiting a general downward trend due to the increased utilization of natural gas. In light of the aforementioned research outcomes, this paper seeks to offer policy recommendations for the enhancement of the EU’s energy security.

1. Introduction

As a pillar of civilization, energy has been deeply embedded in almost every aspect of modern society and has been directly related to regional economic, social, and environmental development [1]. The community, including policymakers, scientists, and the public, has reached a broad consensus that energy security is a global and strategic issue, which is of great significance to national socioeconomic advancement [2,3,4]. The assurance of a secure, effective, and reliable energy supply over an extended period is an important element in ensuring the sustainable and healthy advancement of a country’s socioeconomic system [5]. In recent years, the production of renewable energy has continuously expanded under the guidance of sustainable development [6], which has led to more and more attention to the supply security of renewable energy [7]. Nevertheless, the pursuit of sustainable development has precipitated the systematic decommissioning of fossil fuel extraction and processing operations, driven by policy initiatives prioritizing ecological preservation. This phenomenon has been particularly pronounced within industrialized nations, where environmental regulations have accelerated the phase out of carbon-intensive energy infrastructure. Consequently, this has served to exacerbate the geospatial imbalance of fossil energy consumption and production. Given the lengthy transition period required for the substitution of renewable energy for fossil energy, it is prudent to maintain vigilance concerning the supply security of fossil energy sources, including oil and natural gas.
A comprehensive definition of energy security has yet to be established. The concept of energy security encompasses a multitude of dimensions and is inherently polysemous [8]. Indeed, the connotation of energy security is contingent on specific contextual circumstances and evolves dynamically over time [9]. The quantification of energy security has emerged as a growing focal point in contemporary energy research. Scholarly investigations in this domain predominantly proceed by analyzing the fundamental determinants of energy security frameworks, subsequently developing multidimensional or composite metric systems from various perspectives. The 4A method is a common starting point for quantifying energy security, including availability, affordability, accessibility, and acceptability [10]. However, the extant literature has underexplored the critical nexus between international trade and energy security. Given the persistent geographical disparities in energy endowments, cross-border commerce serves as an indispensable mechanism for securing energy provisions in resource-constrained economies. This causal relationship establishes international trade as a pivotal determinant meriting systematic investigation within energy security frameworks. Moreover, the geographical scope of commodity trade provides an invaluable source of geographic data that can be employed in investigating the spatiotemporal patterns and evolution of energy security.
As one of the world’s major economies, the EU’s energy security has garnered substantial scholarly attention. The socioeconomic functioning of the EU necessitates substantial energy consumption to sustain its operations. In 2022, the EU consumed 9.63% of the world’s total primary energy [11]. However, the EU’s fossil energy reserves are seriously insufficient, and the reserves of oil and natural gas account for only 0.1% and 0.2% of the corresponding global resource reserves [12]. As a result, 55.60% of the EU’s energy consumption depends on imports, and the energy import dependencies on natural gas and oil are as high as 83.41% and 92.00%, respectively. Moreover, Russia accounts for 41.07% and 22.56% of the EU’s total imports of natural gas and oil, respectively, in 2021. It can be reasonably deduced that the high external dependence and concentration of energy supply, particularly the high dependence on Russia, represent the most significant issues affecting the energy security of the EU [13]. Following the onset of the Russian–Ukrainian conflict, the reciprocal sanctions imposed by Russia and the EU in the energy sector have significantly undermined the preexisting energy trade between the two entities [14]. It is challenging for the EU to identify and engage with new suppliers capable of supplying the same level of imported energy from Russia in a relatively short timeframe [15]. This has resulted in a serious shortage of residential and industrial energy, as well as a rapid increase in energy prices, which has triggered a new round of European energy crises [16].
To date, there remains a notable gap in systematic analyses of energy security from a trade perspective. Leveraging a comprehensive dataset, this paper investigates the spatiotemporal dynamics of EU energy security through trade, aiming to contribute to the extant literature in three key dimensions. First, it seeks to construct a trade-based framework for evaluating energy security, addressing two core research questions: which energy types should be included in such evaluations, and which analytical dimensions are appropriate for assessing the security status of individual energy types? Second, by utilizing the geographic information inherent in trade flows, this study presents a holistic analysis of the spatiotemporal evolution of energy security, integrating geospatial perspectives into the analytical framework. Third, given that the ongoing energy crisis in the EU is significantly influenced by fluctuations in energy trade, this paper selects the EU as a case study to help clarify its current energy predicament and inform the formulation of targeted policy recommendations.
The rest of our paper is designed as follows. The subsequent section introduces the theoretical background, builds the conceptual framework of energy security from the trade perspective, and presents the data sources and methods. Section 3 analyzes the spatiotemporal pattern of the EU’s main energy imports and evaluates the EU’s energy security. Further discussion, conclusions, and policy suggestions are presented in Section 4.

2. Conceptual Framework of Energy Security from the Perspective of Trade

2.1. Theoretical Background

Energy security is one of the research hotspots, but the concept of energy security still lacks a clear and explicit definition [17]. The conceptualization of energy security is fundamentally shaped by the contextual milieu in which it is articulated—encompassing the local energy system architecture, socioeconomic development trajectories, and the policy frameworks of both the researcher’s academic context and the region under study [18]. For example, the International Energy Agency (IEA) defines energy security as the uninterrupted availability of energy sources at an affordable price [19]. According to the European Commission, energy security can be referred to as the uninterrupted physical availability on the market of energy products at a price that is affordable to all consumers [20]. Andrews (2005) brought political and socio-cultural factors into the consideration of energy security, stating that the goal of energy security is to ensure adequate and reliable energy supplies at reasonable prices without jeopardizing the country’s major values and development goals [21]. Intharak et al. (2010) combined energy security with the environment and divided energy security into three aspects: physical energy security, economic energy security, and environmental sustainability [22]. Rodriguez-Fernandez et al. (2022) incorporated global challenges such as climate change and geopolitical shocks into their analysis to further expand the conceptual framework of energy security and evaluated the evolution of natural gas security across EU member states [23]. In conclusion, although the notion of energy security is evolving in terms of diversification and synthesis along with the growing intricacy of the energy system, the uninterrupted provision of energy has consistently been the pivotal aspect within its conceptual framework [24,25]. The quantitative assessment of energy security represents a critical methodological extension in the field, as it not only validates theoretical frameworks but also facilitates systematic cross-regional evaluations and comparisons. Existing scholarship has extensively explored methodologies for operationalizing energy security measurements. Some studies concentrate on a single indicator pertaining to a specific aspect of energy security, including the Shannon-Wiener Diversity Index (SWI) [26,27,28] and the Herfindahl-Hirschman Index (HHI) [28,29]. However, a single indicator is insufficient for comprehensively assessing energy security, as it tends to focus on a narrow aspect of the subject [30,31]. The application of the HHI or SWI in existing studies overlooks two critical issues: (1) the distortion introduced by neglecting import dependency when assessing energy security through market concentration, and (2) the relationship between the security of individual energy types and overall energy security. More and more scholars posit that the assessment of energy security is a multifaceted challenge that necessitates the development of a multidimensional quantitative evaluation index system [32]. Notable models in this regard include the US Energy Security Risk Index [33] and the short-term energy security model developed by the International Energy Agency [34]. Although these models are more comprehensive, they are susceptible to information loss during the integration of indicators. Consequently, the evaluation outcomes may not accurately reflect the actual circumstances of the evaluation subject, potentially leading to an emphasis on numerical outcomes at the expense of meaningful interpretation. Furthermore, most models limit their consideration of the energy trade factor which plays a significant role in energy security for most countries and regions. What’s more, prior research predominantly emphasizes fluctuations in energy security indices without conducting a systematic analysis of the underlying drivers behind these changes.
Since the commencement of the Russian–Ukrainian conflict, the EU’s energy security has become a subject of heightened concern within the academic community due to a marked increase in supply uncertainty. While existing scholarship, such as Rabbi’s (2022) analysis of Central Europe’s path to energy security and carbon neutrality [35], concentrates on accelerating the EU’s long-term sustainable transition, it often overlooks the immediate crisis driven by fluctuations in the fossil fuel market. Another stream of research investigates the link between geopolitical conflicts and resulting disruptions to the EU’s energy trade. For instance, Lambert et al. (2022) critically analyzed the EU’s emergent gas procurement strategy, evaluating the feasibility of supply diversification in the wake of the Russia-Ukraine conflict [36]. Rokicki et al. (2023) systematically examined how the crises of the COVID-19 pandemic and the conflict in Ukraine reshaped the EU’s reliance on energy raw materials [37]. While these studies provide vital insights into specific facets of the energy sector, a holistic evaluation of the entire, interconnected energy system has been largely overlooked. Therefore, examining the EU’s historical energy trade and evaluating its energy security from a holistic, systemic perspective is crucial for understanding the origins of the current predicament and for formulating effective policy solutions.
This study tries to fill the above gaps by providing a systematic analysis of energy security from trade and geographic perspectives. This study may contribute to the existing literature twofold. On the one hand, this paper presents a framework for evaluating energy security based on trade. Understanding regional energy trade flows, grasping its network structural characteristics, and identifying the potential risk nodes is important for evaluating and optimizing its energy security. On the other hand, this paper examines the spatiotemporal evolution of EU energy security from both the regional and national scales. Analyzing the changing energy trade, pinpointing the vulnerable links within the energy system, and examining the disparities in regional energy security are of paramount importance for formulating targeted recommendations to address the EU’s energy challenges.

2.2. Conceptual Framework

From a trade perspective, this study defines “energy security” as the ability of a country or region to ensure the continuity, stability, and economic rationality of energy supply to meet its energy consumption demand, with a focus on realizing the supply security of key energy sources.
In accordance with this definition, we establish a theoretical framework for evaluating energy security that considers factors of supply and demand structure, import dependency, and spatial differences (as illustrated in Figure 1). The initial step involves an analysis of the energy supply and demand structure to identify the most vulnerable energy type concerning regional energy security. This identification process is guided by three primary criteria: the energy type’s proportion in regional energy imports, its overall share in total energy consumption, and its import dependency. The first criterion requires that the energy type constitutes a substantial share of the total energy consumption structure; based on empirical justification, this threshold is set at 5%. The second criterion stipulates that domestic production of the specific energy type is insufficient to meet demand, thereby resulting in a heavy reliance on imports. An import dependency of 50% serves as a critical warning threshold [38], a level widely recognized by nations such as China as a key indicator for national oil security and subsequent policy formulation. Drawing upon this established benchmark, we adopt a 50% import dependency as our assessment standard. The import dependency is calculated using the following formula:
I m p o r t s   D e p e n d e n c y t = ( x i , t x e , t ) / x c , t × 100 %
The letter ‘ t ’ is used to denote the energy type t . x i , t denotes imports scale, x e , t denotes exports scale, and x c , t is domestic consumption. A greater level of import dependency in a country is indicative of a heightened level of dependence on foreign energy imports, a less stable energy supply, and an elevated level of vulnerability to external environmental factors.
The third criterion requires that the specified energy type be the principal component of national energy imports. A 15% threshold within the import’s composition is employed as a quantitative indicator of its status as a primary imported energy source. This critical value is based on empirical observations suggesting that energy commodities with an import share below 15% generally exhibit a greater of supply elasticity in international trade.
The security profiles of diverse energy types are critically assessed through the interconnected dimensions of supply stability and source diversification, which collectively provide a comprehensive measure of a nation’s energy resilience from a trade perspective. Supply stability is primarily gauged by import dependency levels. A foundational tenet of energy security, as emphasized in existing research [39], is the assurance of a stable energy supply from both indigenous production and reliable foreign imports. Consequently, greater reliance on domestic energy sources is widely advocated to diminish dependence on external suppliers. This strategy enhances resilience against geopolitical pressures, market volatility, and other external shocks, thereby strengthening overall supply security. Concurrently, the diversification of energy import sources is evaluated using a geographical concentration index, notably the HHI [40]. The HHI quantifies the concentration of import sources, where a lower index indicates a more diversified and secure import portfolio. Conversely, a high HHI signifies significant reliance on a few countries, amplifying vulnerability to disruptions from any dominant supplier. The strategic importance of diversifying import sources lies in risk management: distributing reliance across a wider array of politically and economically varied supplier nations reduces a country’s susceptibility to supply cut-offs or price manipulation by a limited group of exporters. The HHI offers a standardized metric to monitor diversification progress, enabling policymakers to identify over-concentration and implement strategies such as forging new energy partnerships or investing in infrastructure to connect with diverse suppliers. Compared to metrics like the SWI, the HHI exhibits greater sensitivity to market entities with substantial shares, rendering it more effective in detecting monopoly risks within competitive landscapes. The HHI is calculated using the following formula:
H H I i , t = j = 1 n x i , j , t / x i , t 2 × 10 , 000
x i , j , t denotes the energy type t import of country i from country j , and n is the number of energy importers of country i . H H I i , t denotes the Herfindahl-Hirschman index of energy type t in country i , whose value range is 10,000 / n ,     10,000 . The larger the value of H H I i , t , indicating that a few countries occupy a larger share of the energy type t market in country i , the higher the geographical concentration. The energy exports of supplier countries are susceptible to fluctuations or even interruptions due to a multitude of factors, including political, economic, military, technological, and other considerations. As a result, the diversification of energy imports can serve to mitigate the potential consequences of trade disruptions with one or more energy suppliers, thereby enhancing energy security.
Third, our methodological framework involves constructing a multiregional energy flow matrix through the systematic integration of heterogeneous energy commodities, capturing international trade dynamics across multiple energy vectors. The conventional practice of aggregating heterogeneous energy sources through calorific value equivalence, while widely adopted, presents significant methodological limitations [41]. This approach fundamentally overlooks critical distinctions in energy quality, substitution potentials, and sector-specific utilization efficiencies across energy types [42]. Such oversimplification may introduce systematic biases when evaluating the security dimensions of integrated energy systems. The Divisia method, incorporating inherent heterogeneity and limited substitutability among energy sources [43], provides a robust analytical mechanism to quantify the differential impacts of structural transitions in energy mix, energy intensity, economic activity, and auxiliary determinants on aggregate energy demand trajectories. However, owing to challenges associated with base period selection and calibration, this approach is unsuitable for horizontal comparative calculations following the aggregation of distinct energy trade flows between countries. This paper adopts the concept of economic weighting for different energy types from the Divisia method, employing energy-specific prices to facilitate aggregation. On this basis, we calculate the geographic concentration of energy inputs when treating each country as a unique energy system post-aggregation. While price-based aggregation can partially reflect variations in energy quality, it still exhibits limitations when compared to the Divisia method [42].
Notably, we acknowledge that perfect substitutability does not exist between different energy types. Our aggregation of diverse energy forms serves solely to consolidate the trade flows of different energy products between the two countries into a single aggregated energy trade flow from a trade perspective. This enables comparative analysis of geographical concentration in energy imports when countries are modeled as unitary energy systems. We recognize that energy sources differ in their end-use functionalities and possess distinct energy security profiles. Nevertheless, this study focuses on the energy trade dimension, wherein countries or entities must procure energy from external suppliers. Within this specific context of traded volumes and market concentration, an aggregated framework allows for the analysis of dependency structures and supplier diversification across a defined portfolio of traded energy commodities. The specific formula is as follows:
x i = t = 1 m p i , t , y × x i , t
x i represents the total energy imports of the country i after integration. p i , t , y denotes the price of energy type t in country i for year y . p i , t , y can illustrate the spatiotemporal heterogeneity of energy economic value. m is the number of energy types. This matrix is then utilized to assess the diversity and stability of the energy supply. By removing the subscript t in Formula (1) and Formula (2), the formula for calculating the H H I and I m p o r t s   D e p e n d e n c y of the overall energy system can be obtained.
We will classify different energy security levels based on the calculation results of the energy supply stability and diversification (Table 1). First, the classification of import dependency is contingent upon the threshold of 0% and 50%. Countries with an import dependency higher than 50% are highly dependent on foreign energy supply and have a limited ability to resist the risk of fluctuations in the international energy market. On the other hand, a country with an import dependency ratio below 0% is considered a net energy exporter. Under ideal circumstances, these nations are capable of attaining energy self-sufficiency in the face of a total cessation of external energy supplies, thereby implying that their energy security levels are expected to be very high. Second, according to the report of the U.S. Department of Justice [44], this study classifies energy supply diversification into three types based on HHI value. As shown in Table 1, HHI 0–1500 represents low geographic concentration, 1500–2500 signifies medium geographic concentration, and a value greater than 2500 indicates high geographic concentration. It is argued that the growth in the geographical concentration of energy sources points to a reduction in the diversity of energy supply, which in turn has an adverse effect on energy security.

2.3. Data Sources

The EU’s energy import data is sourced from Eurostat’s database [45]. The energy price data comes from the database of the International Energy Agency [46]. Missing price data will be approximated using the average price in the EU. In the analysis of specific energy products, reference is made to the United Nations SIEC coding system, in which oil (including petroleum products) and natural gas are coded as O4000 and G3000, respectively.

3. Results

3.1. EU’s Energy Supply and Demand Structure

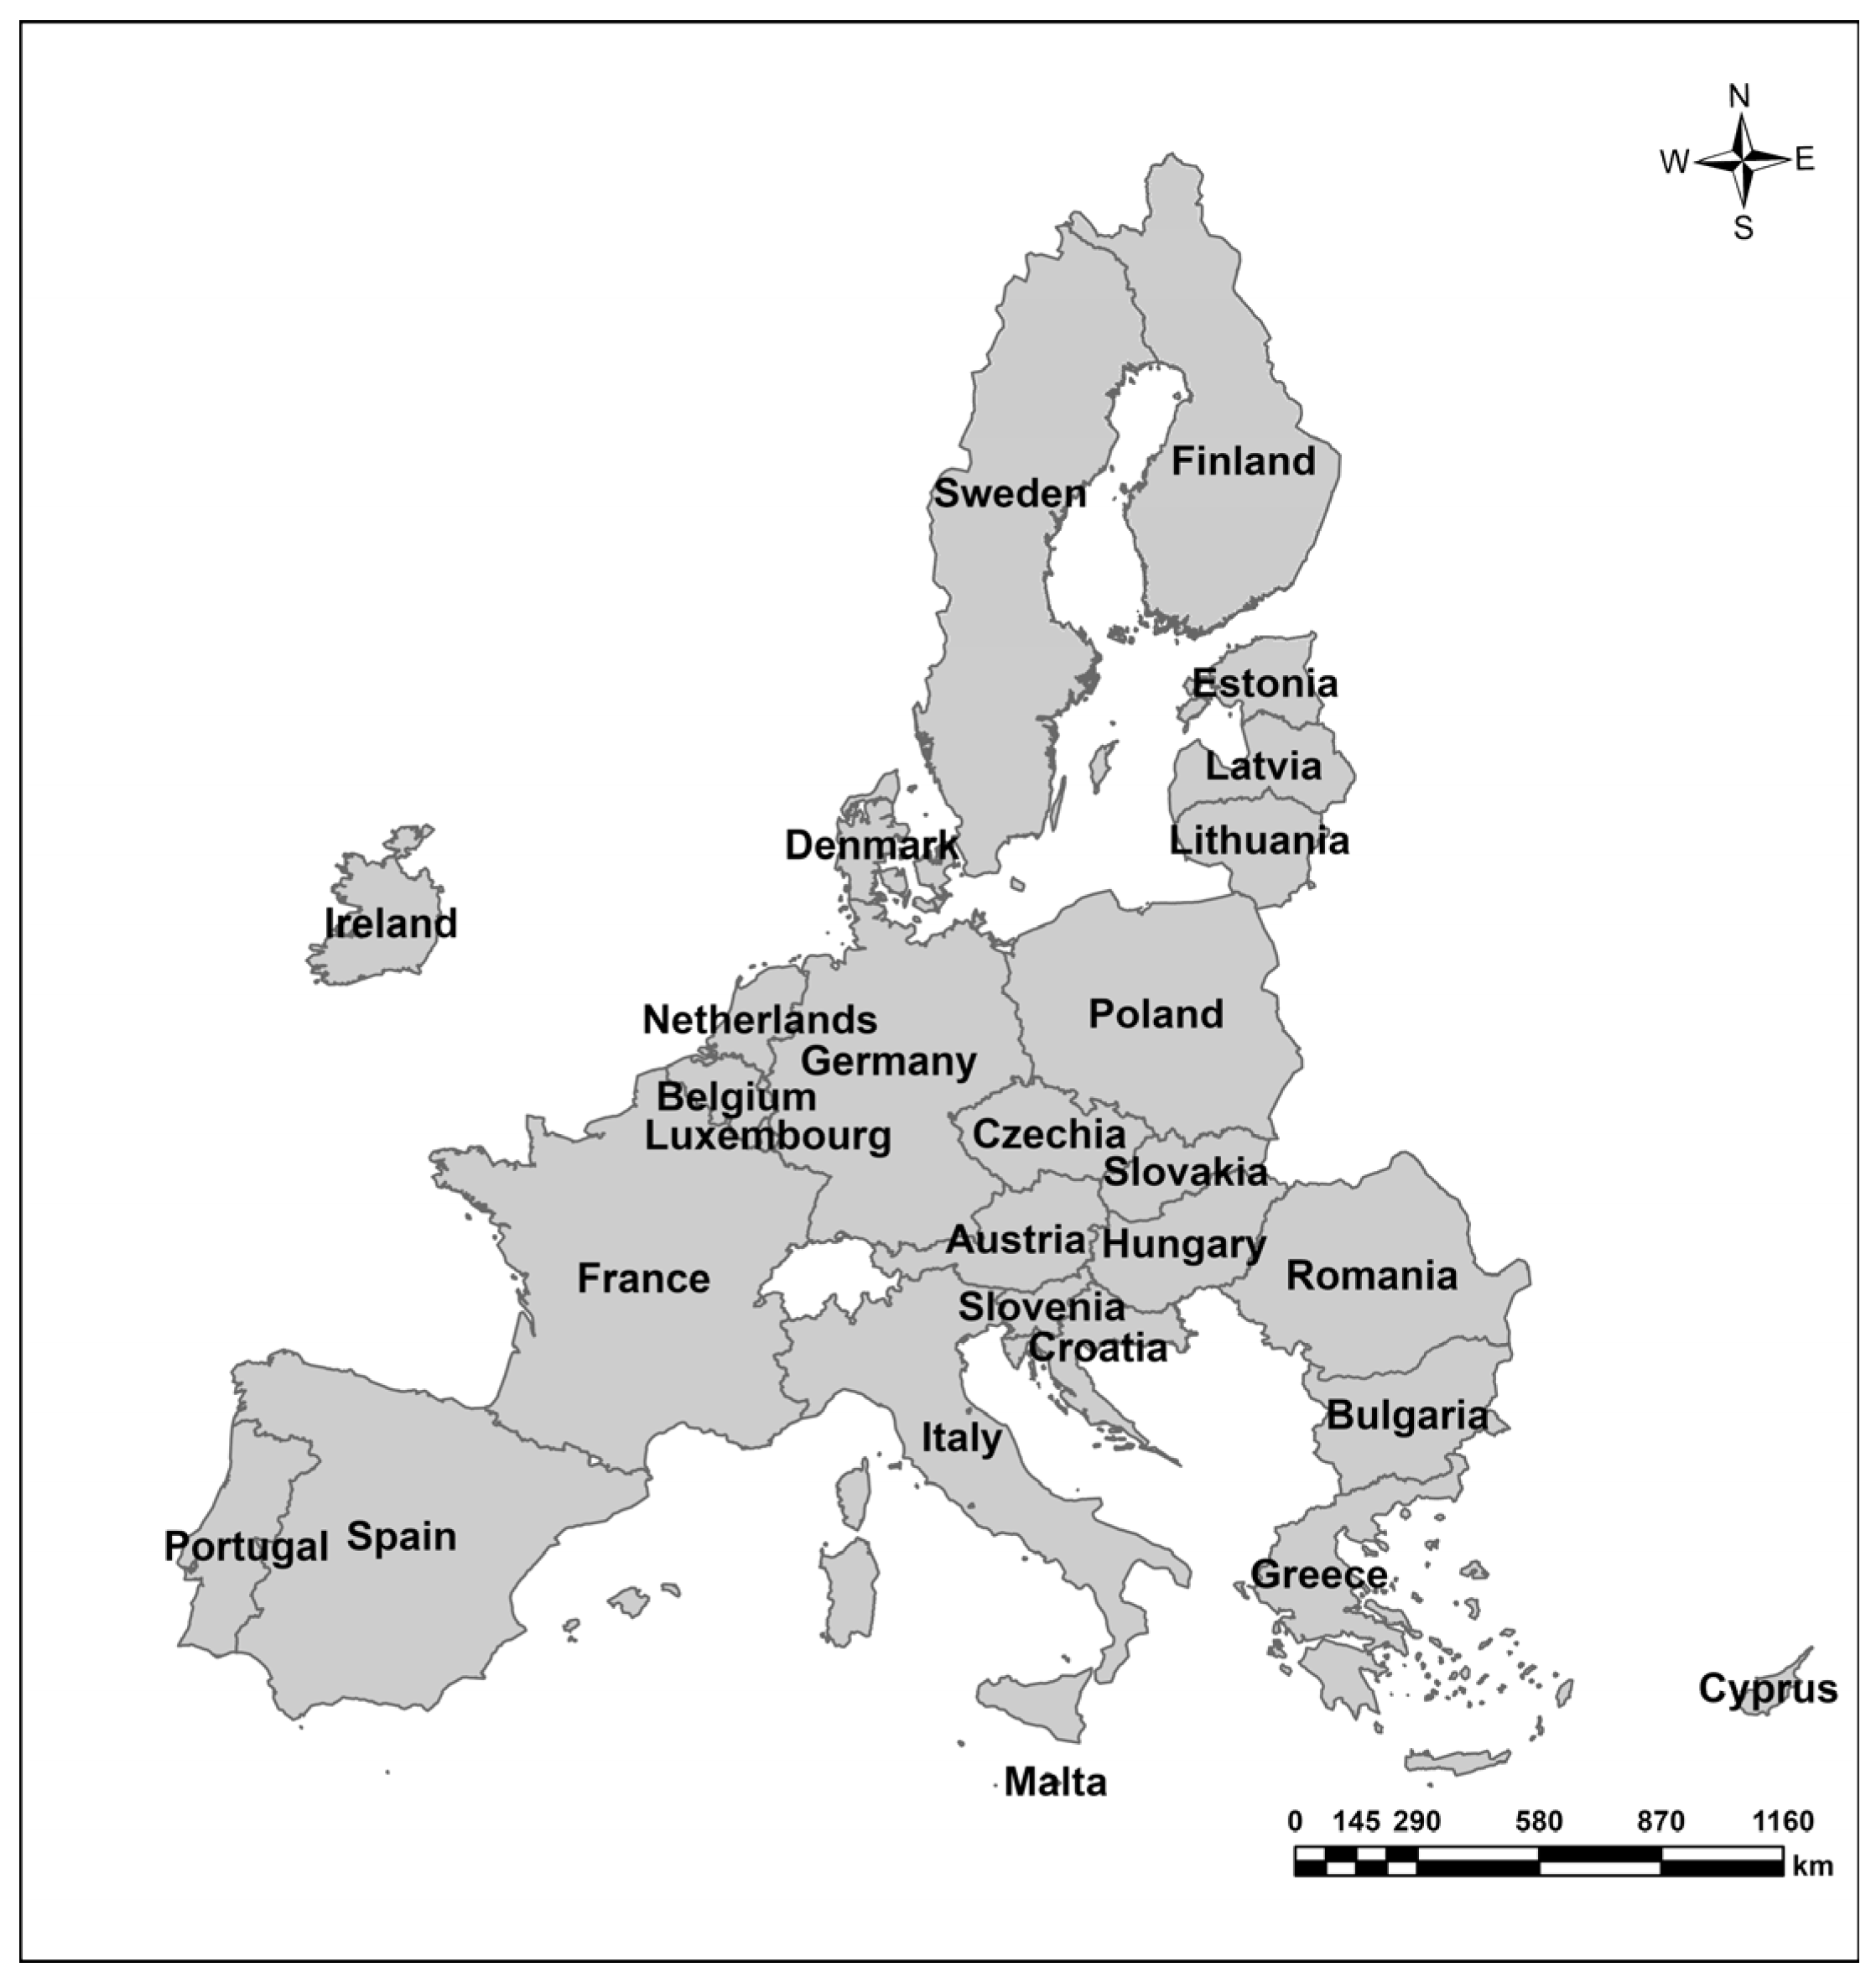
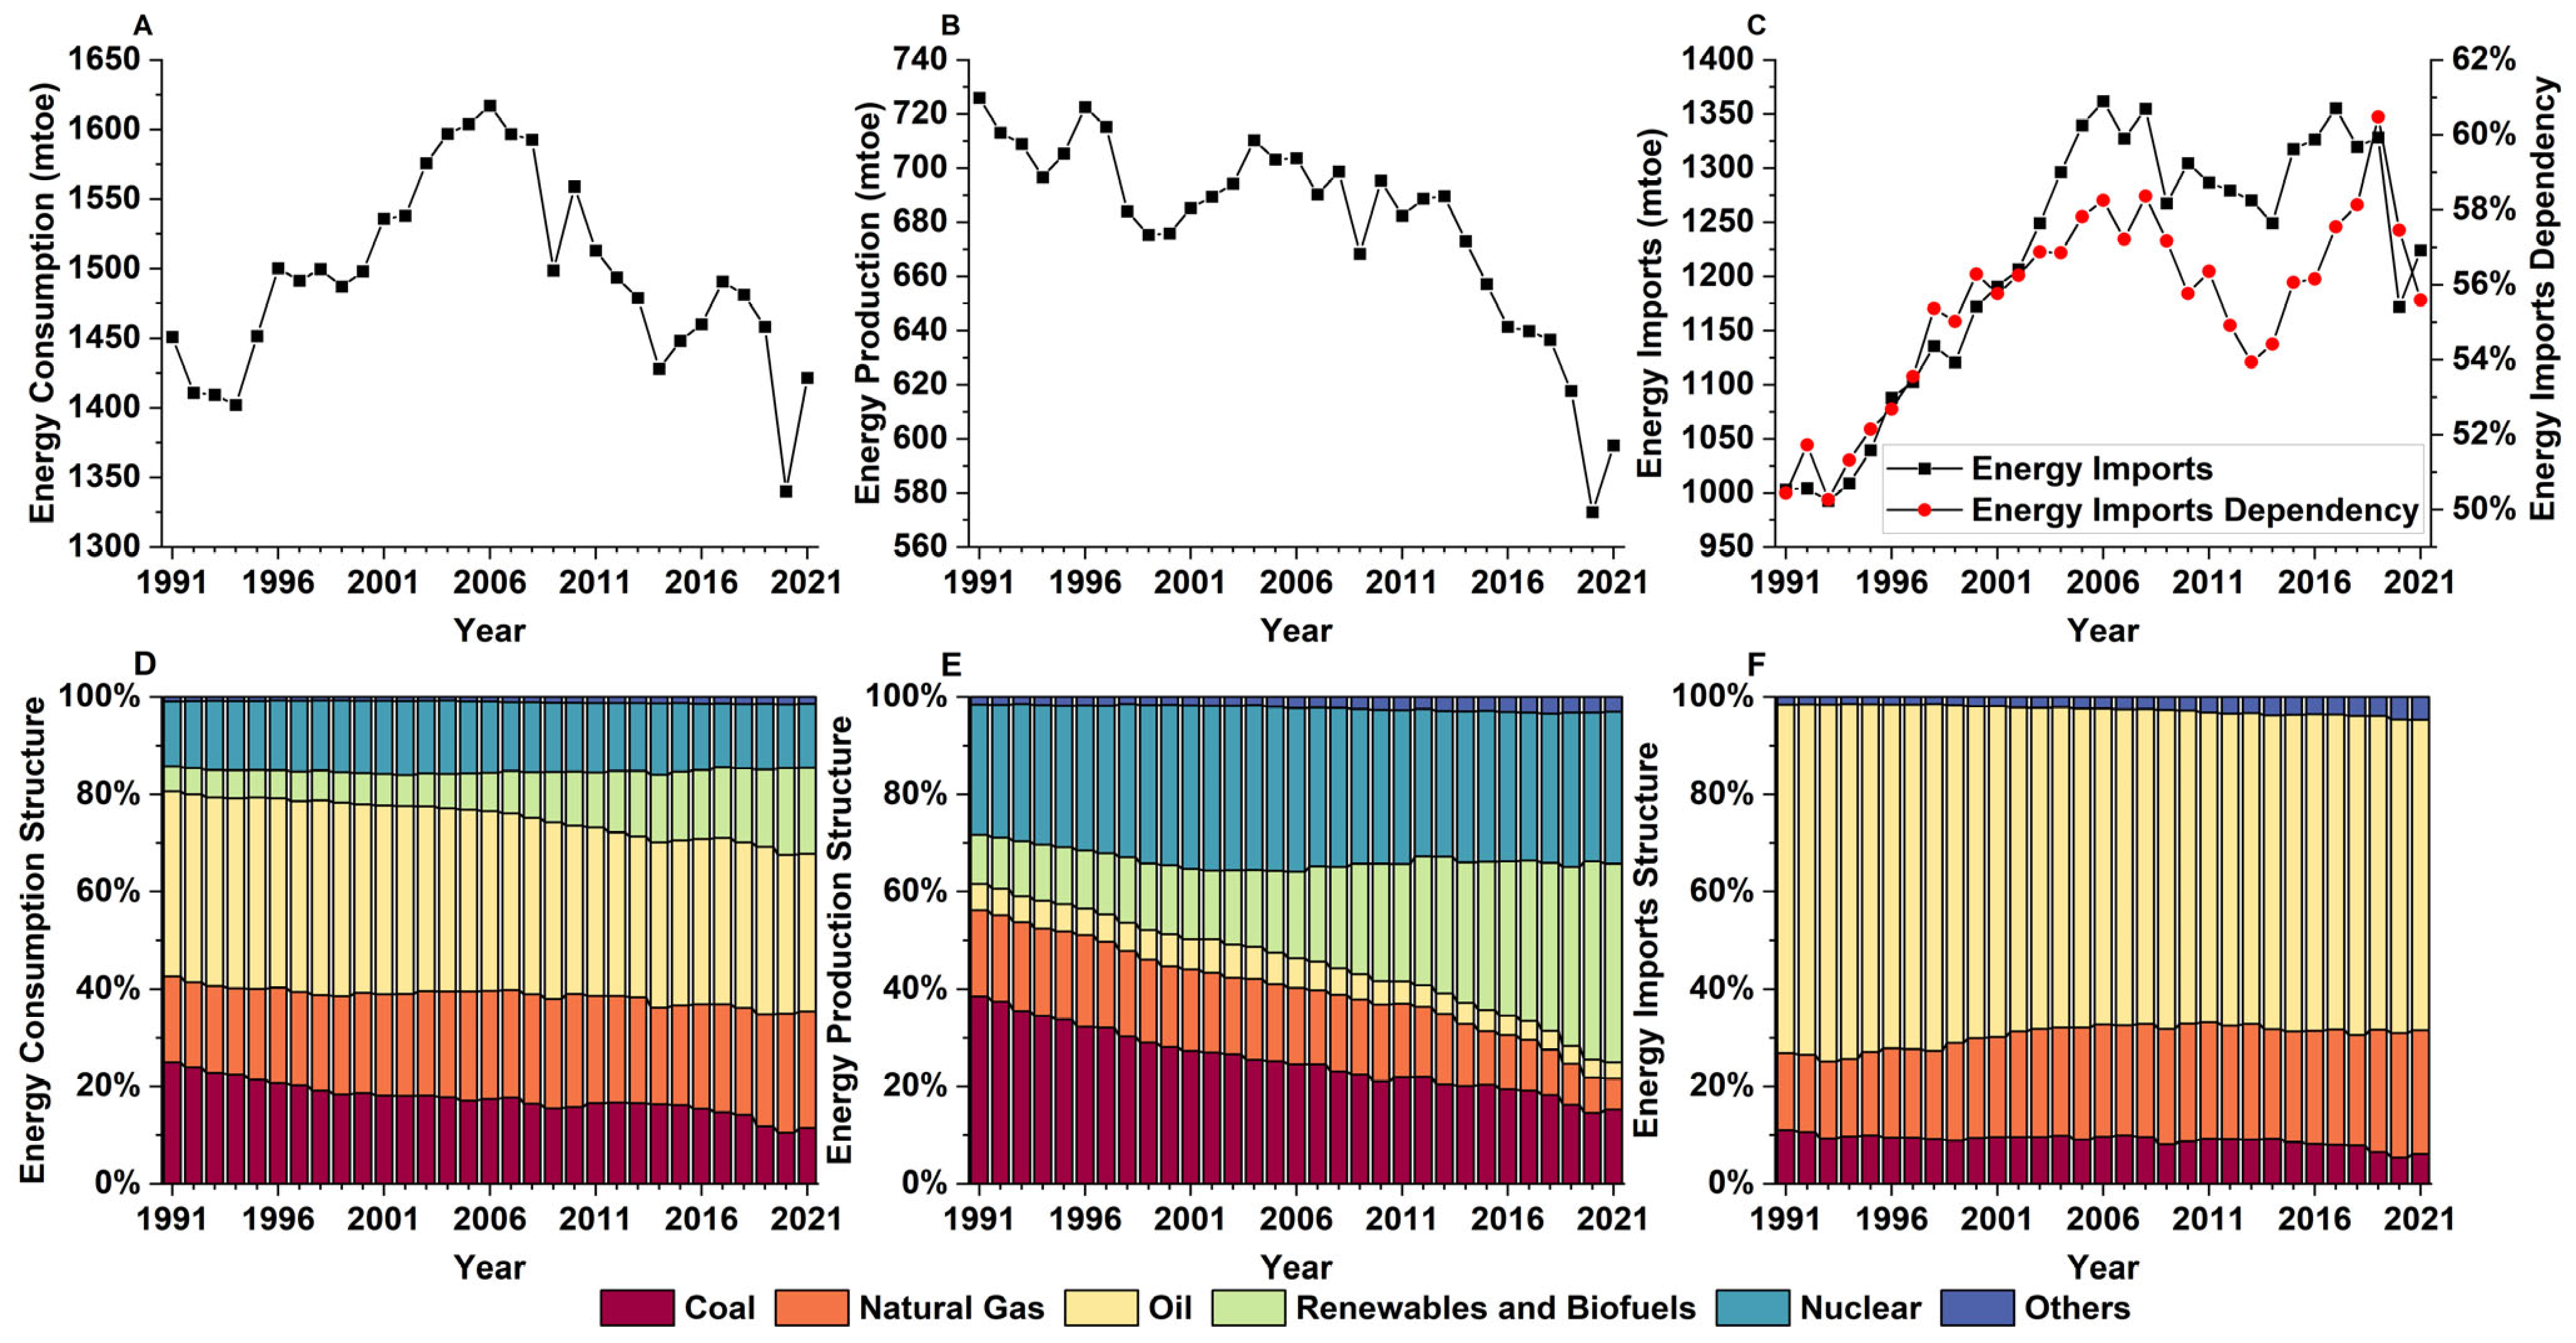
Figure 2 shows the map of the EU. Figure 3 presents the fundamental dynamics of energy supply and demand within the EU. From 1991 to 2021, the EU’s energy consumption exhibited a general trend of an initial increase followed by a subsequent decrease, reaching its peak in 2006. In terms of the energy consumption structure, the proportion of renewables and biofuels has increased from 5.01% to 17.69%, propelled by objectives aimed at reducing carbon emissions. As a clean energy resource, natural gas is regarded as an important alternative to oil in the EU, with its share in the EU’s energy consumption structure expanded from 17.63% to 23.91%. Overall, the proportion of fossil energy including coal, oil, and natural gas in the EU’s energy consumption structure continued to decrease but still accounted for 67.75% of the EU’s energy consumption by 2021. It is anticipated that fossil energy, predominantly oil and natural gas, will continue to exert a dominant influence on the EU’s energy consumption market for an extended period [47].
From 1991 to 2021, the energy production capacity within the EU exhibited a persistent downward trajectory, decreasing from 726.04 million tons of oil equivalent (mtoe) to 597.60 mtoe. The output of solid fossil fuels, oil, and natural gas witnessed a significant decline, plummeting from 447.12 mtoe and 61.58% share in 1991 to 149.04 mtoe and 24.94% share by 2021. In contrast, the output of renewable energy and biofuels surged from 73.60 mtoe to 243.97 mtoe, with their share amplifying from 10.14% to 40.83%, thereby establishing itself as the predominant energy production type within the EU. Nuclear energy production and its associated share have demonstrated stability throughout this period. In comparison to energy consumption, the EU’s low-carbon transformation of energy production is a more radical undertaking, resulting in a notable imbalance between energy supply and demand, a rapid expansion of energy imports, and an upward trajectory in energy import dependency. The composition of energy imports into the EU reveals a persistent decrease in the shares of coal and oil, which fell from 11.00% and 71.50% in 1991 to 6.14% and 63.77% in 2021, respectively. Conversely, the proportion of natural gas has risen from 15.87% to 25.39% during the same timeframe. Oil and natural gas have consistently represented the predominant sources of energy imports for the EU, with their combined share surpassing 85% of total energy imports from 1991 to 2021.
Consistent with the three criteria outlined in Section 2.2, this study includes oil and natural gas, while coal, nuclear, renewables, and biofuels energy are excluded. The exclusion of coal is twofold: first, the EU’s substantial domestic coal production capacity results in an external dependency level below 50%; second, coal constitutes a minor share of the EU’s energy import structure. Nuclear, renewables, and biofuels are also omitted from this analysis due to the distinct nature of their international trade. Transactions in these sectors predominantly involve power generation equipment—such as solar panels, wind turbines, and nuclear reactor components—rather than the direct exchange of energy units characteristic of fossil fuels. Consequently, they do not appear in energy import structure statistics. It is important to underscore that the exclusion of nuclear, renewables, and biofuels does not diminish their significance. They are integral to a secure and sustainable energy system. However, this research adopts a trade-centric perspective, focusing on energy types that are directly traded as commodities and represent potentially vulnerable segments within the energy system.
Oil and natural gas represent the most disproportionate forms of energy production and consumption within the EU, and they constitute the primary imported energy sources for the region. The continued stability of the oil and gas import trade will be a determinant influencing the energy security of the EU for the foreseeable future. In light of the aforementioned considerations, we pinpoint oil and natural gas as the central themes of our investigation. The initial stage of the research process entails a comprehensive examination of the import trade of oil and natural gas, which is followed by an in-depth assessment of their respective supply security. Subsequently, the sum of the economic value of oil and natural gas is employed to characterize the total amount of energy imported by the EU from a range of countries. The findings are employed to assess the energy security of the EU. Given that oil and gas constitute 90% of the EU’s energy imports, this approach is reasonable.

3.2. The Stability and Diversity of EU’s Energy Import

3.2.1. Oil Import

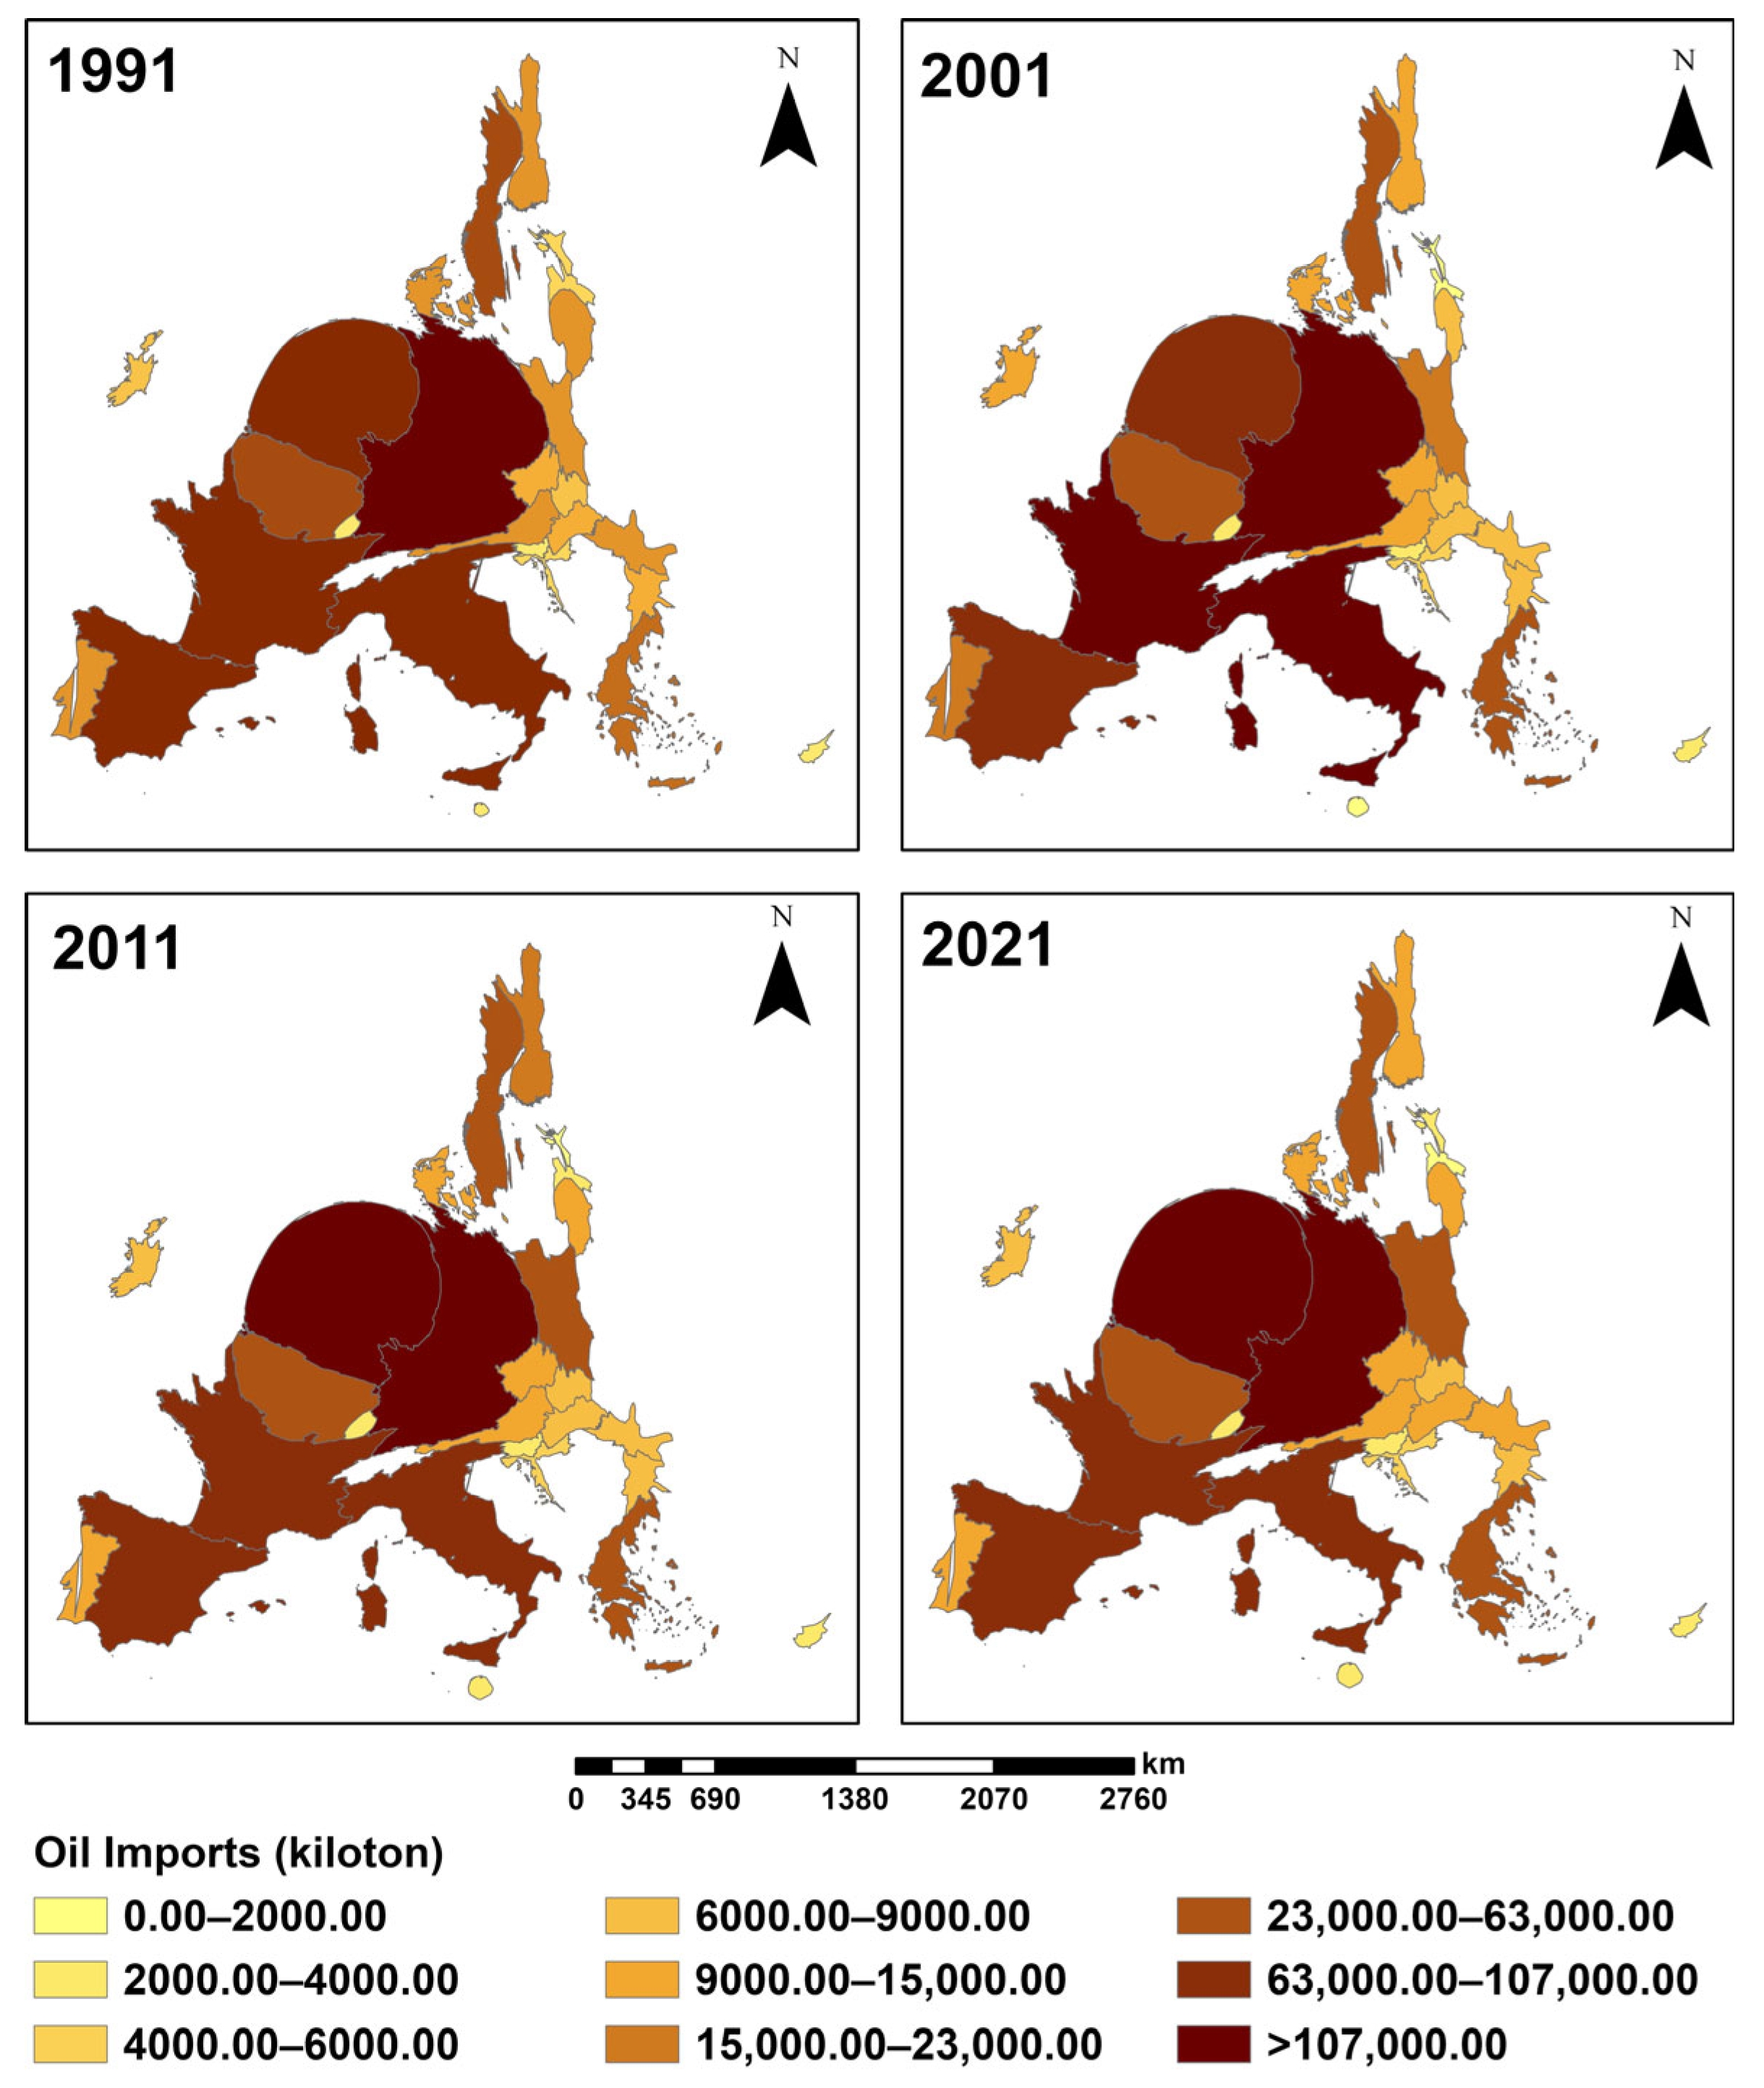
From 1991 to 2021, the EU’s total oil imports fluctuated from 719 million tons to 771 million tons. The trajectory of oil imports within the EU is significantly influenced by the underlying dynamics of economic evolution. Between 1991 and 2008, the vigorous growth of the EU’s economy resulted in heightened energy requirements, which caused oil imports to escalate from 717.79 million tons to 866.73 million tons. The sustained effects of the financial crisis and the European sovereign debt crisis contributed to sluggish economic performance and a subsequent decrease in oil imports after 2008. From 2015 to 2019, there was a gradual recuperation of oil import levels to pre-financial crisis figures. Nevertheless, the emergence of the COVID-19 pandemic has significantly altered this trajectory. The pandemic has resulted in a steep reduction in oil consumption across the EU. Oil imports volumes plummeted from 846.97 million tons in 2019 to 745.2 million tons in 2020. Figure 4 presents a cartogram of the EU based on the oil imports of each member state. Between 1991 and 2021, six nations—Germany, Italy, France, the Netherlands, Spain, and Belgium—have established a significant role in the EU’s oil import sector, collectively accounting for approximately 70% of total imports. In 1991, the Netherlands held a mere 12.44% share of the EU’s oil imports, which escalated to 18.31% by 2021, allowing it to overtake Germany as the leading oil importer within the EU in 2009. The maritime oil imports funneled through Dutch ports, including Rotterdam, Hague, and Amsterdam, have increasingly become a critical energy supply route for the EU.
Constrained by the limited availability of oil resources, the EU’s reliance on oil imports has consistently remained elevated over the year, oscillating between 91% and 97%. The overwhelming majority of member states exhibit an oil import dependency that consistently exceeds 80%. In certain years, some nations surpass a dependency level of 100%. Between 1991 and 2021, the number of nations situated below the cordon experienced a shift from three, including Romania, Croatia, and Denmark, to a solitary presence of Denmark. Danish oil import dependency fluctuates the most. Between 1991 and 2004, the advancement of offshore oil extraction technology greatly facilitated the utilization of the North Sea’s oil and natural gas resources. The gradual increase in Danish oil production has made Denmark the only net exporter of oil in the EU since 1997, and its oil import dependency has also decreased from 19.98% in 1991 to −116.42% in 2004. After 2004, under the combined influence of the external factor of the gradual depletion of oil and gas resources in the North Sea and the inherent requirements of the EU’s pursuit of green economic transformation, Danish oil production peaked in 2004 and then continued to decline. Denmark has transitioned into a net oil importer since 2015.
The EU’s geographical concentration of oil imports has consistently remained below 1500, indicating a relatively decentralized distribution of oil sourcing. Following the dissolution of the Cold War and the subsequent removal of trade barriers between the EU and the Council for Mutual Economic Assistance (CMEA), Russia has gradually established itself as the EU’s primary oil supplier, capitalizing on its abundant oil reserves and geographical proximity. As depicted in Table 2, Russia’s contribution to the EU’s total oil imports was a mere 3.87% in 1991. This figure experienced a significant increase, reaching 20.61% by 2001, thereby establishing Russia as the primary supplier of oil to the EU. As a consequence of the concentration of oil imports to Russia, the geographical concentration of the EU’s oil imports increased from 481.67 in 1991 to 945.31 in 2003. Between 2004 and 2015, there was little variation in the geographical concentration of oil imports. The outbreak of the Crimean crisis in 2014 led to a rapid deterioration of European–Russian relations [48]. In response to potential geopolitical risks, the EU proactively sought to diminish its reliance on Russian oil imports, aiming for a more diversified supply network. This led to a decline in geographical concentration from 973.09 in 2016 to 719.96 in 2021, while the Russian share of oil imports decreased from 30.31% in 2016 to 22.56% in 2021. In contrast, the proportion of oil supplied by the US surged significantly, culminating in a share of 6.98% in 2021. The US has emerged as the EU’s second-largest supplier of oil, following Russia.
As shown in Figure 5, we calculate the mean geographical concentration of oil imports across EU member states over the period from 2001 to 2021. Given the limited volume of oil imports, the average value of geographical concentration in eleven countries, including Lithuania, Slovakia, Poland, Luxembourg, Hungary, Finland, Bulgaria, Ireland, Estonia, Romania, and Croatia, is higher than 2500. The single supplier plays a decisive and dominant role in their oil supply market. The emphasis of energy policy development for these nations is on diversifying international oil supply channels to mitigate reliance on a single supplier, thereby enhancing the security of their oil supply. Apart from Croatia, the oil imports of the remaining ten countries show strong geographical proximity. Taking 2021 as an example, the UK occupied 36.39% of the Irish oil imports market, and Belgium monopolized 58.78% of oil imports in Luxembourg. In 2021, Lithuania, Slovakia, Poland, Hungary, Finland, Estonia, and Romania identified Russia as their principal oil supplier, with respective market shares of 76.02%, 77.00%, 60.20%, 40.93%, 64.16%, 38.99%, and 33.01% of oil imports. In 2019, 54.41% of Bulgarian imported oil came from Russia. Given the ongoing nature of the Russian–Ukrainian conflict, the EU’s sanctions on Russia are progressively intensifying, inevitably impacting energy trade relations between member nations and Russia. For those countries reliant on Russian oil, the capability to promptly diversify their oil suppliers to compensate for the market share previously occupied by Russia is important for the uninterrupted functioning of their economies and societies. The countries with a mean value of geographical concentration between 1500 and 2500 are Latvia, Czechia, Sweden, Slovenia, Denmark, Greece, Malta, Cyprus, and Belgium. The geographical concentration of oil imports in these countries is moderate but should be further decentralized to enhance the ability to cope with the volatility of the international oil market. The mean geographical concentration of Germany, Austria, Italy, the Netherlands, Portugal, France, and Spain is below 1500. These nations exhibit a decentralized approach to oil imports and possess robust risk mitigation capabilities.

3.2.2. Natural Gas Import

Natural gas serves as an important clean energy source, significantly contributing to the EU’s efforts to achieve a green energy transition [49]. Its proportion within the EU’s energy consumption framework has been on the rise. Accordingly, the EU’s natural gas imports have been growing rapidly from 194,452 million cubic meters (mcm) in 1991 to 374,799 mcm in 2021. Figure 6 illustrates a cartogram of the EU weighted by countries’ natural gas imports. As the EU’s largest industrial country, Germany has always been the EU’s largest natural gas importer, but its proportion has declined from 29.20% to 22.63% from 1991 to 2021. Italy and France are the second and third largest natural gas importers in the EU, respectively. The above three countries are responsible for more than half of the EU’s natural gas imports. Owing to enhancements in liquefied natural gas (LNG) transportation and storage technologies, the Netherlands has experienced the most significant surge in natural gas imports, escalating from 2443 mcm in 1991 to 31,073 mcm in 2021, reflecting a year-on-year growth rate of 1172%. Prior to the collapse of the Soviet Union, the members of the CMEA could import large quantities of cheap natural gas from the Soviet Union at prices lower than those in the world market. Czechia, Slovakia, Hungary, Bulgaria, Romania, Latvia, Estonia, and Lithuania imported a total of 38,882 mcm of natural gas in 1991, which accounted for 20.00% of the total natural gas imports into the EU. After the dissolution of the Soviet Union, even in the context of the EU’s pursuit of an energy transition with a reduced environmental impact, the volume of natural gas imported by the aforementioned countries continued to decrease due to the cessation of inexpensive natural gas supplies from the Soviet Union. In 2021, the above countries imported 32,300 mcm of natural gas, accounting for only 8.62% of the EU.
Along with the continuous expansion of natural gas demand, the EU’s natural gas import dependency is on an upward trend between 1991 and 2021, increasing from 49.83% to 83.41%. The majority of EU member states exhibit a high degree of dependency on natural gas imports, with this reliance showing a continuing trend of escalation. In 2021, over half of the EU member states, including Spain, France, Italy, and Czech, exhibited a natural gas import dependency exceeding 90%. Only the Netherlands, Denmark, and Romania demonstrate a level of external dependence that is less than 50%. From 1991 to 2017, Denmark and the Netherlands were the only two member states of the EU that exhibited a net export of natural gas. As the largest natural gas field in Europe, the Groningen gas field was previously the primary source of natural gas for the Netherlands and even the EU. Nevertheless, owing to the potential hazard of induced seismicity associated with gas extraction in the region, the Dutch government swiftly curtailed production from the gas field, resulting in the escalation of Dutch natural gas import dependency [50]. The Netherlands has become a net importer of natural gas since 2018. Constrained by the depletion of natural gas resources in the North Sea and the EU’s carbon reduction target, the natural gas import dependency of Denmark has escalated rapidly after hitting a low of −120.97% in 2008. Since 2020, Denmark has undergone a transition in its natural gas trade, becoming a net importer of the commodity.
Due to the challenges associated with the storage and transportation of natural gas, the trade of this resource is significantly reliant on essential infrastructure elements such as natural gas pipeline systems, LNG carriers, and coastal receiving terminals for LNG and is therefore characterized by high geographical concentration and strong geographical proximity. In 1991, there were only four natural gas trading partners for the EU which were concentrated in neighboring regions such as Northern Europe, Eastern Europe, and North Africa (Table 3). In 1991, Russia accounted for over two-thirds of the EU’s natural gas import market. Following 1991, the maturation of the transnational natural gas pipeline network and the advancement of LNG storage and transportation technology provided the EU with a robust foundation upon which to expand its natural gas trade channels. The EU’s natural gas import has gradually become geographically dispersed, with the geographical concentration decreasing from 5052.69 in 1991 to 1951.78 in 2010 (Figure 7). Non-traditional natural gas trading partners such as Qatar and Nigeria, which are geographically distant from the EU, have gradually become important sources of natural gas imports to the EU. Due to the stabilization of the EU natural gas import scale, the geographical concentration of the EU natural gas import trade did not show significant changes after 2011. Russia’s share in the EU’s natural gas import market has increased slightly from 36.36% in 2011 to 44.15% in 2021. Benefiting from the shale revolution, the US has been gradually growing into a major natural gas supplier to the EU. The US share of the EU natural gas import market was 5.65% in 2021, positioning it as the fourth-largest supplier of natural gas to the EU. The geographical concentration of natural gas import trade in almost all EU member states is high, but shows a downward trend in the time series. It is worth noting that due to the single natural gas transportation pipeline and the lack of LNG storage and transportation facilities, the geographical concentration of natural gas imports in some EU member states has been approximately 10,000 for an extended period, which indicates that the natural gas import markets of these countries have been monopolized by a single partner and are susceptible to external risks. In 2021, three EU member states—Czechia, Ireland, and Latvia—remained reliant on a single country for their natural gas imports. Ireland’s gas imports were exclusively sourced from the United Kingdom, while Czechia and Latvia’s imports were dominated by Russia.

3.3. Evaluation of Energy Security from a Trade Perspective

3.3.1. Oil Security

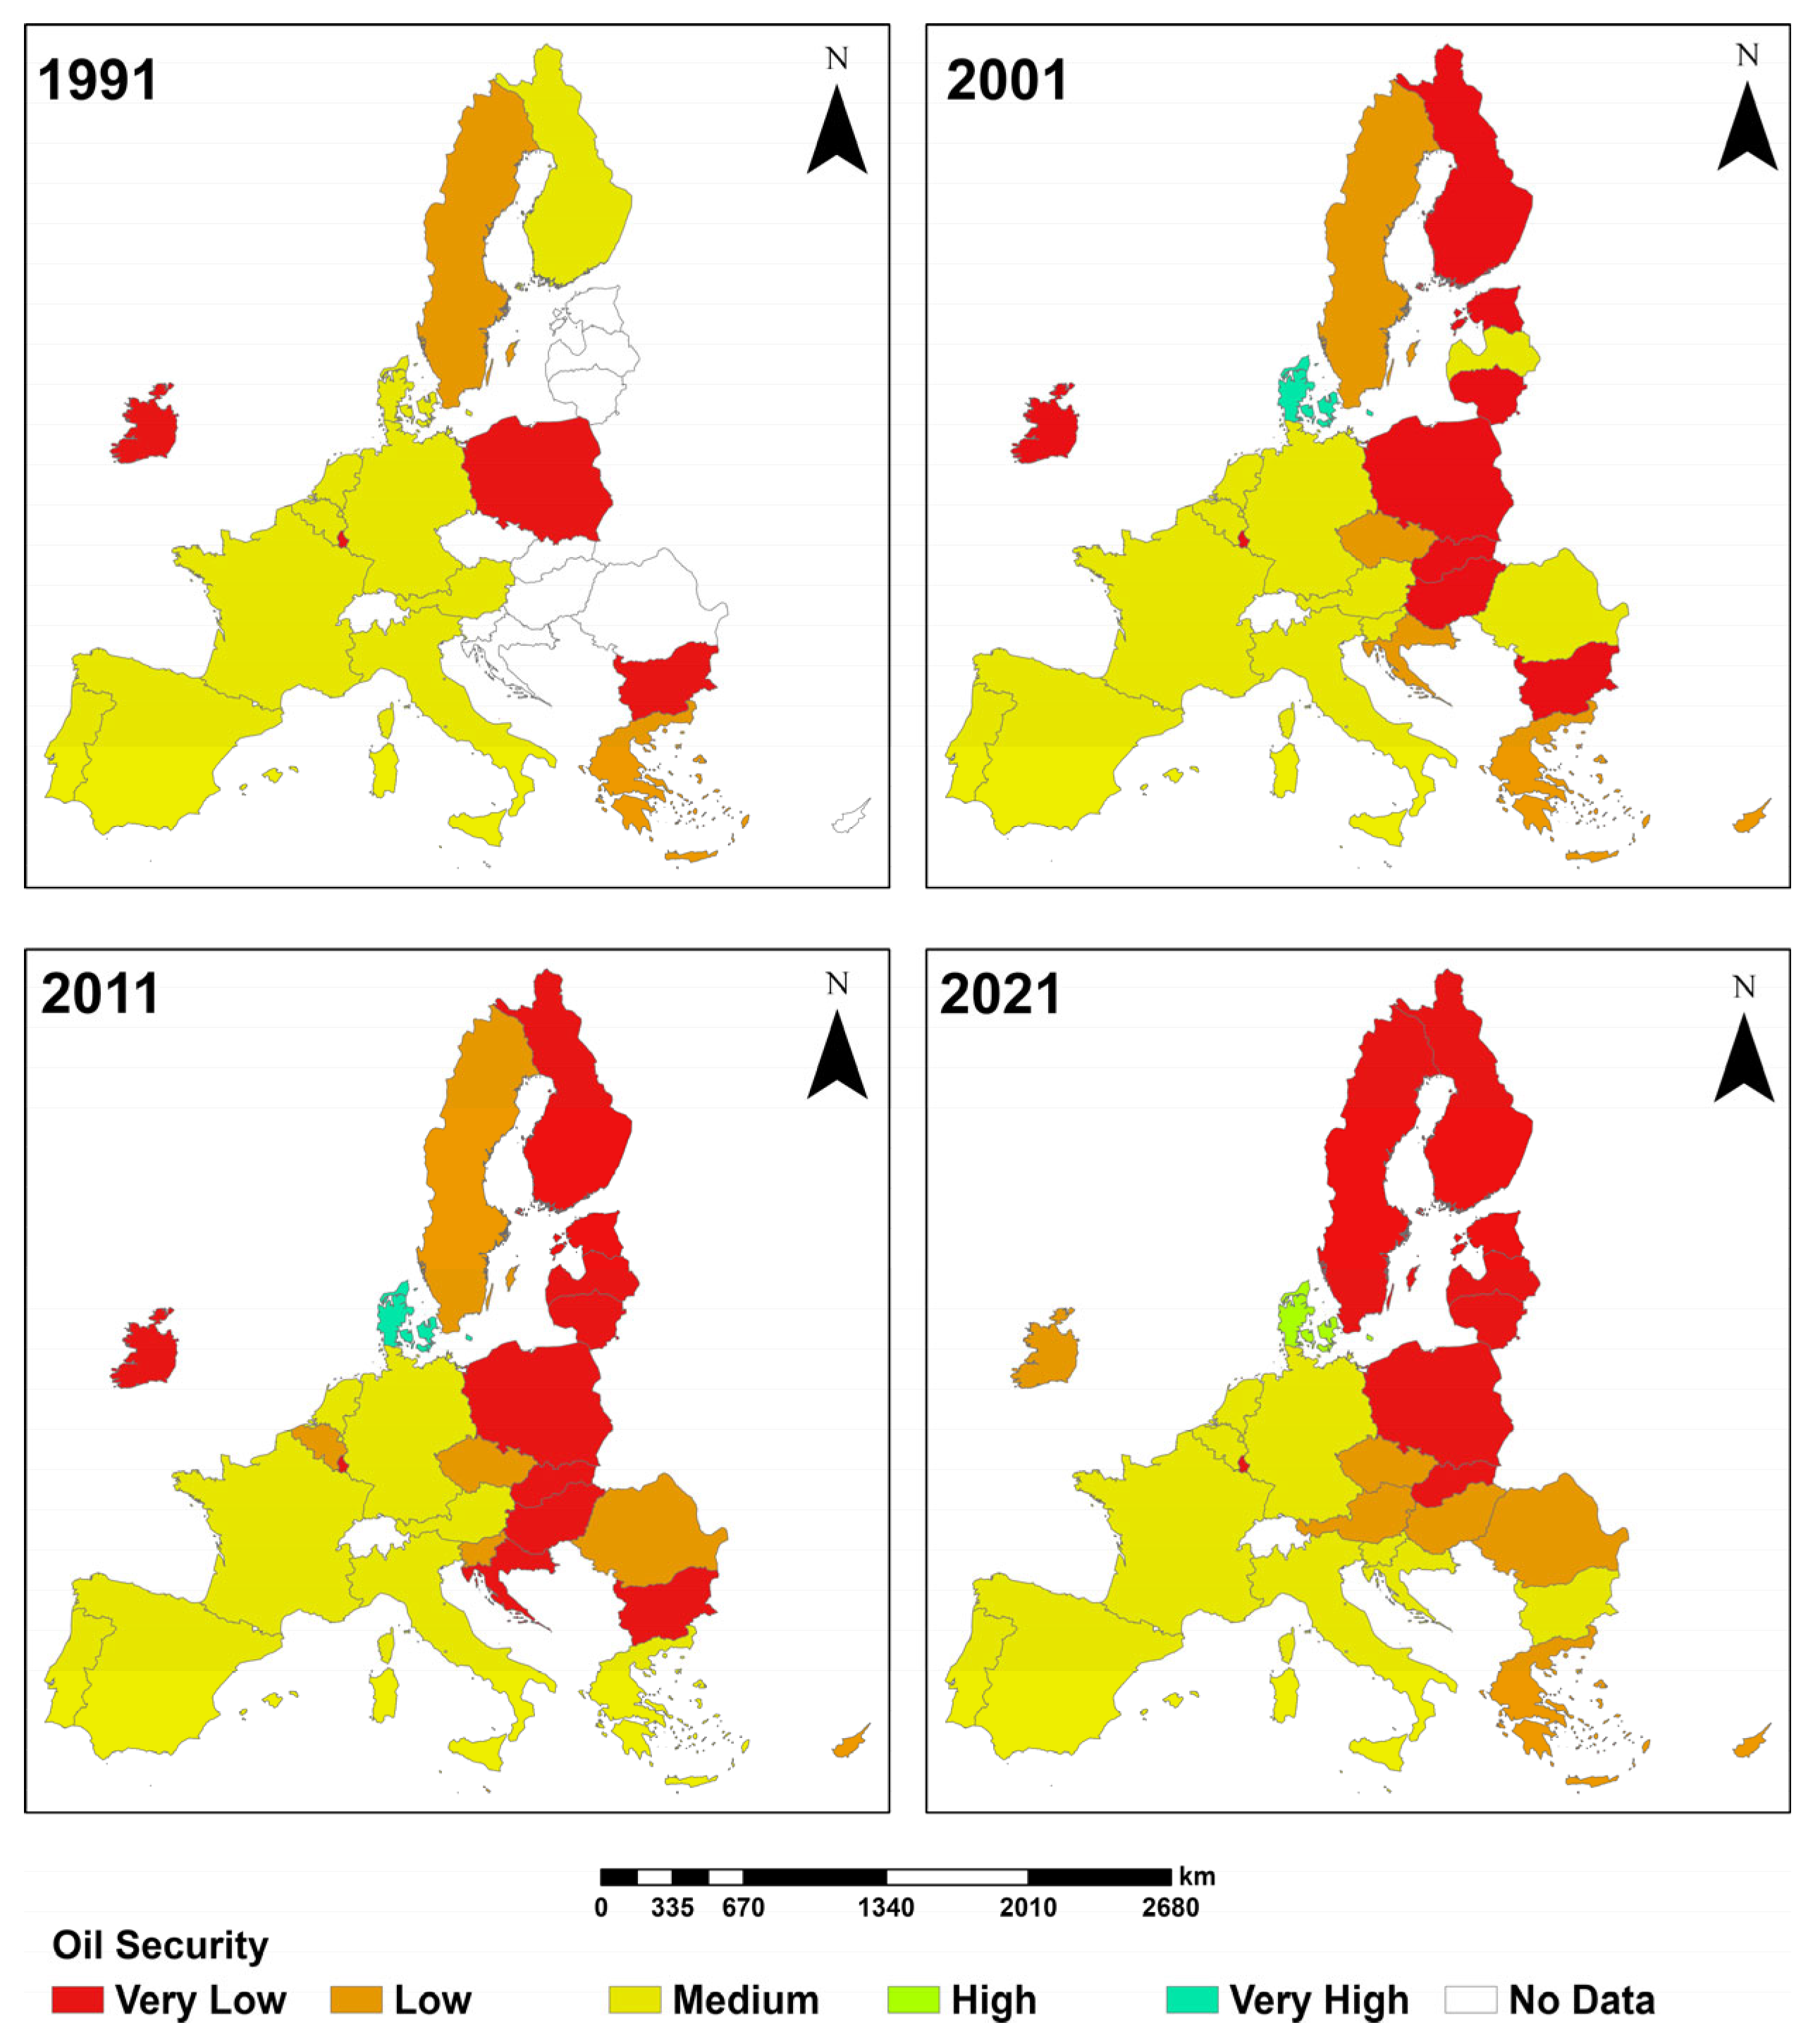
The oil security dynamics within the EU exhibit a fundamental pattern characterized by inland regions experiencing low security levels while coastal areas enjoy high security (Figure 8). Geographical positioning emerges as the pivotal factor influencing oil security. Coastal nations can seamlessly engage with the global oil trading system via port access, thereby mitigating supply risks and reducing the geographical concentration of imports. Conversely, landlocked nations predominantly depend on oil pipelines for their imports, which imposes significant limitations on sourcing, thereby escalating import risks. The robust oil security observed in Western Europe can be attributed to its advantageous coastal location. In contrast, Eastern Europe’s lower oil security levels can be traced partly to a historical reliance on Russian oil, coupled with its remoteness from key global shipping routes. In recent years, motivated by the objective of energy supply diversification, the EU has initiated a comprehensive series of pipeline construction projects. As the oil pipeline infrastructure expands, there has been a noticeable enhancement in oil security levels in the southeastern region of the EU. Notably, Denmark, endowed with substantial oil resources from the North Sea oil field, stands out as the sole EU member exhibiting high or very high oil security levels. However, in recent times, the depletion of North Sea oil resources has led to an increased dependency on imports for Denmark, consequently diminishing its oil security.

3.3.2. Natural Gas Security

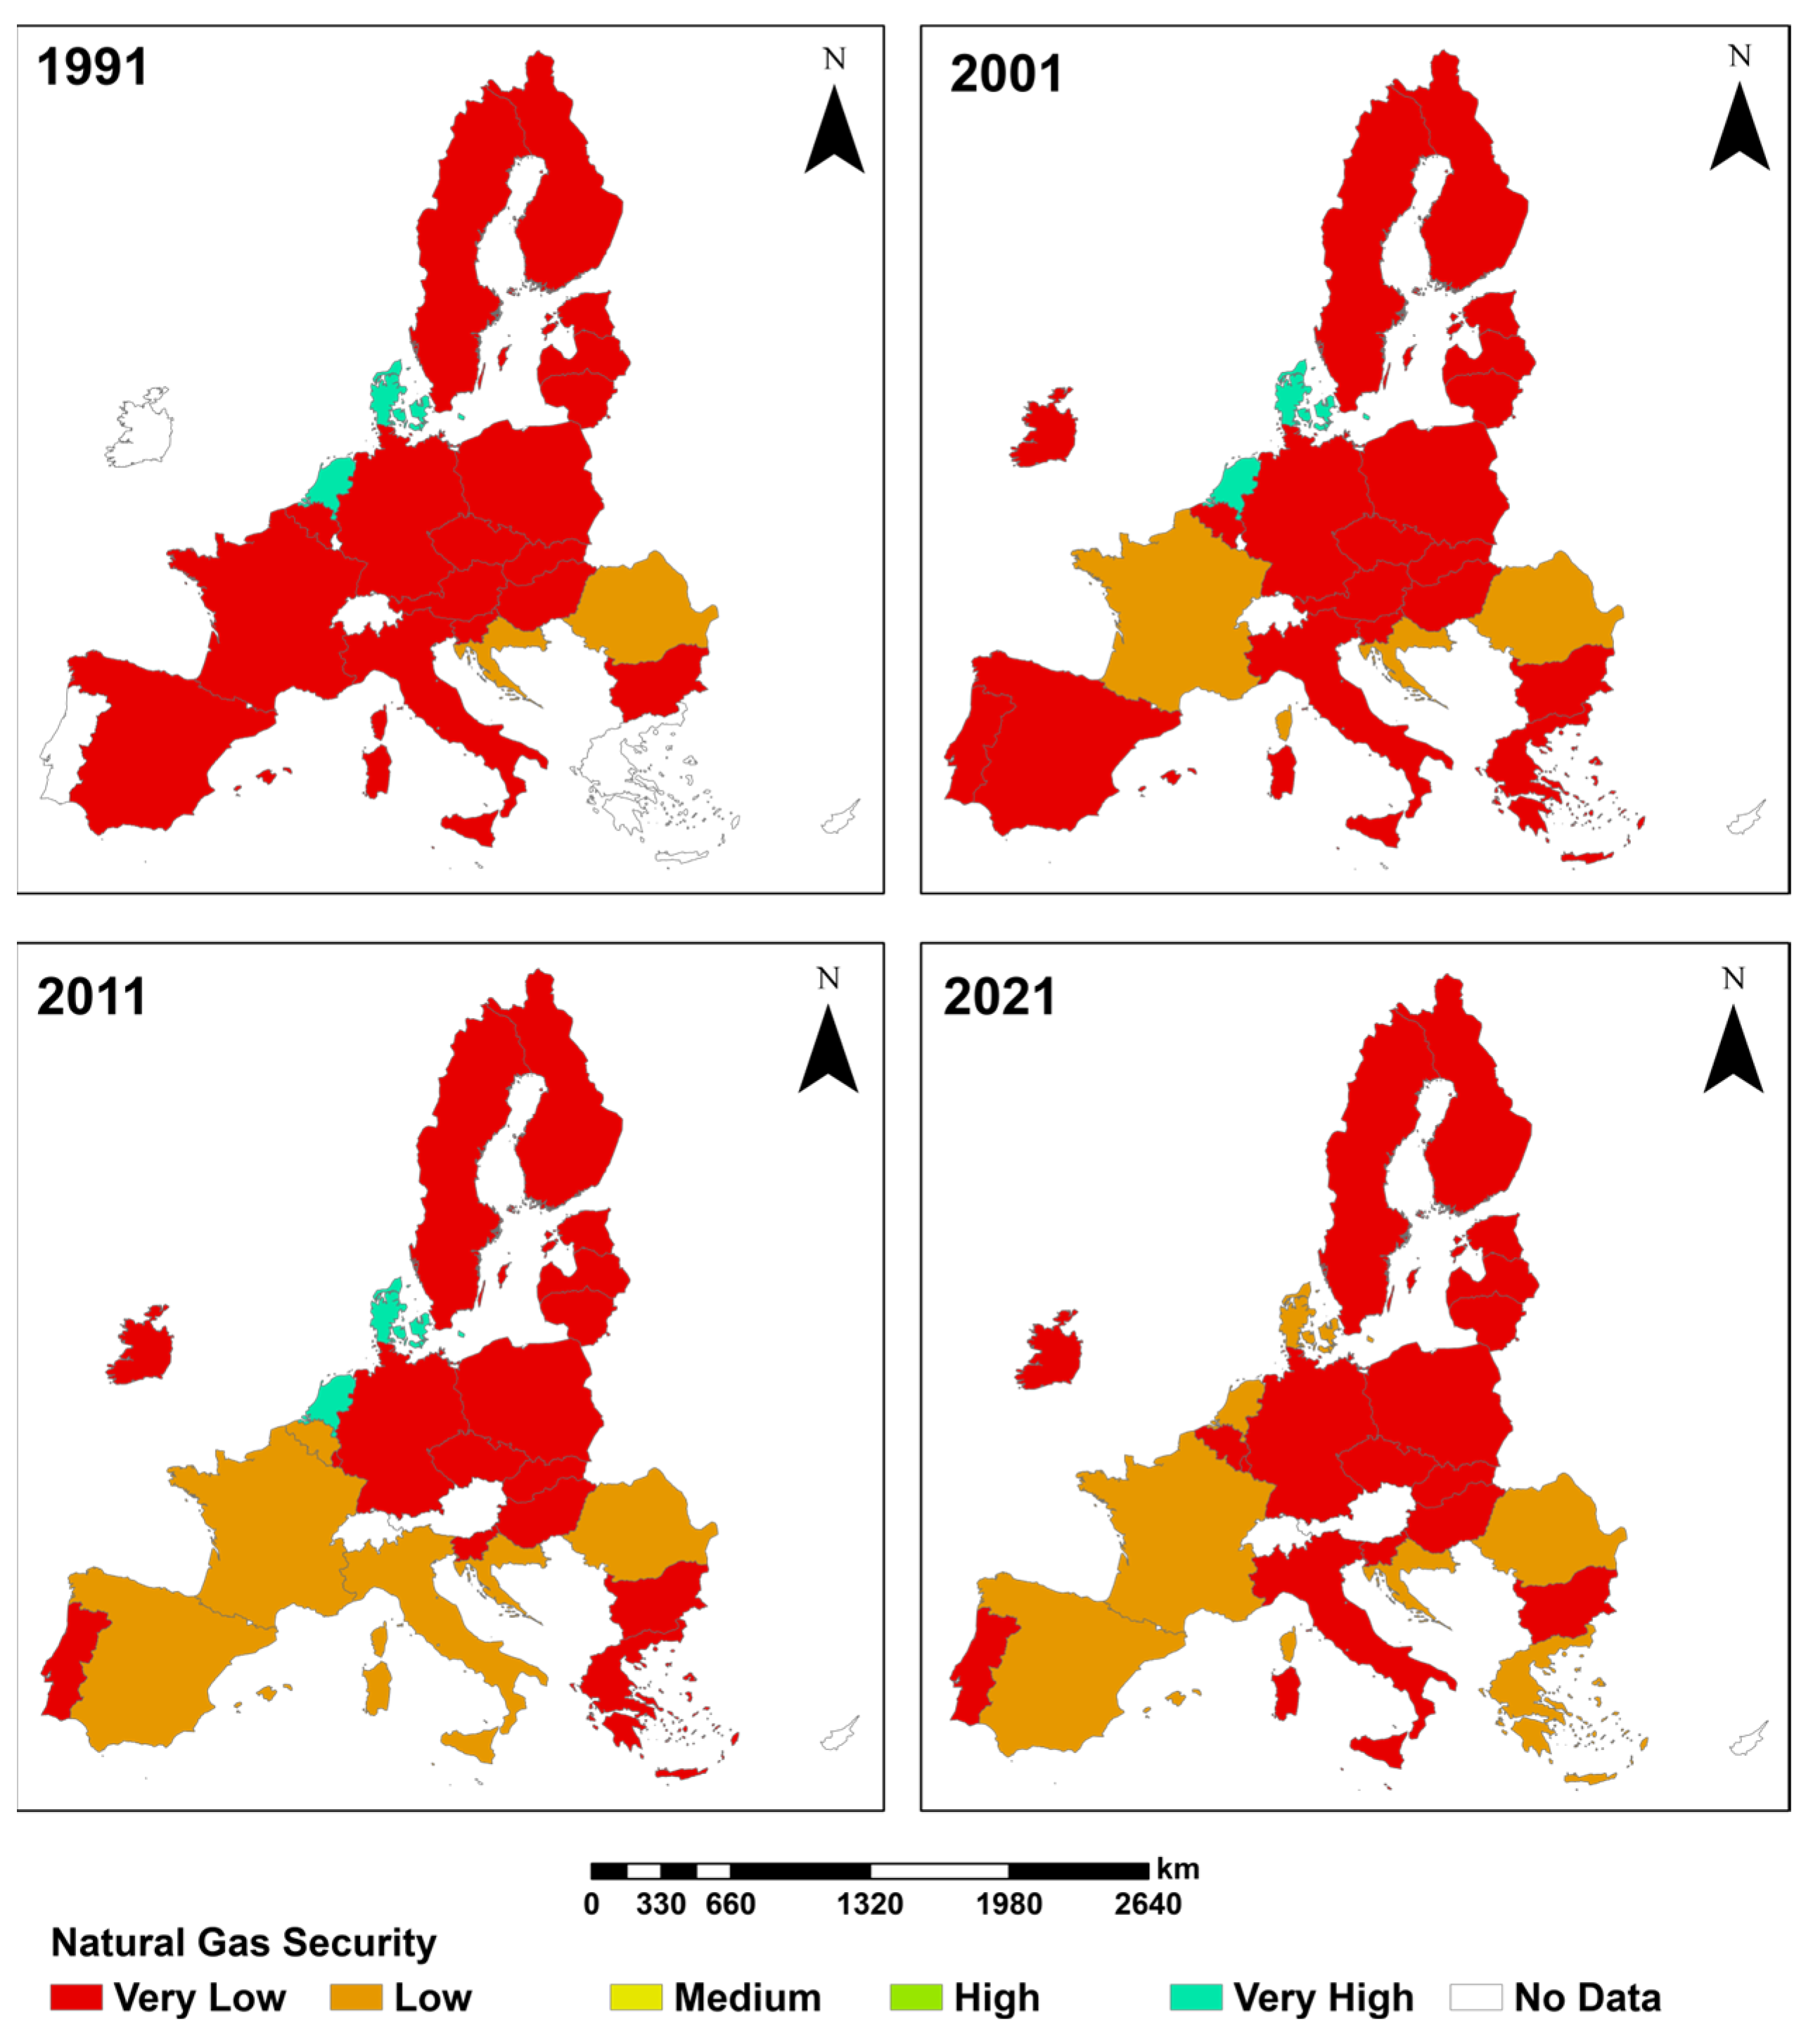
Despite the EU’s lower reliance on natural gas imports compared to oil, the security level associated with natural gas remains considerably inferior due to the pronounced geographical concentration of its imports (Figure 9). A significant number of EU member states exhibit low to very low levels of natural gas security. The breadth of natural gas trade is predominantly influenced by the industry’s delayed inception and its substantial reliance on infrastructure, consequently leading to a notable enhancement in the geographical concentration of natural gas imports within the majority of EU member states with some exhibiting a monopolistic tendency driven by single-source import dependencies. While countries with robust natural gas production capabilities are similarly confronted with a heightened geographical concentration of natural gas imports, these nations possess the capacity to curtail their reliance on external natural gas sources, thereby mitigating the risk of natural gas security concerns. Consequently, in contrast to geographical location, which exerts a pivotal influence on the EU’s oil security, the primary determinant of the degree of natural gas security in disparate countries is the extent of natural gas production capacity. From 1991 to 2011, Denmark and the Netherlands emerged as the EU’s primary natural gas producers, being the sole nations to maintain above-medium natural gas security levels. However, recent years have witnessed a dramatic decline in their natural gas security status, marked by heightened dependencies on imports and increased geographical concentration, resulting in their classification as medium security nations by 2021. Furthermore, advancements in LNG storage and transport technologies have bolstered natural gas security in certain coastal states like France, Spain, and Greece.

3.3.3. Energy Security

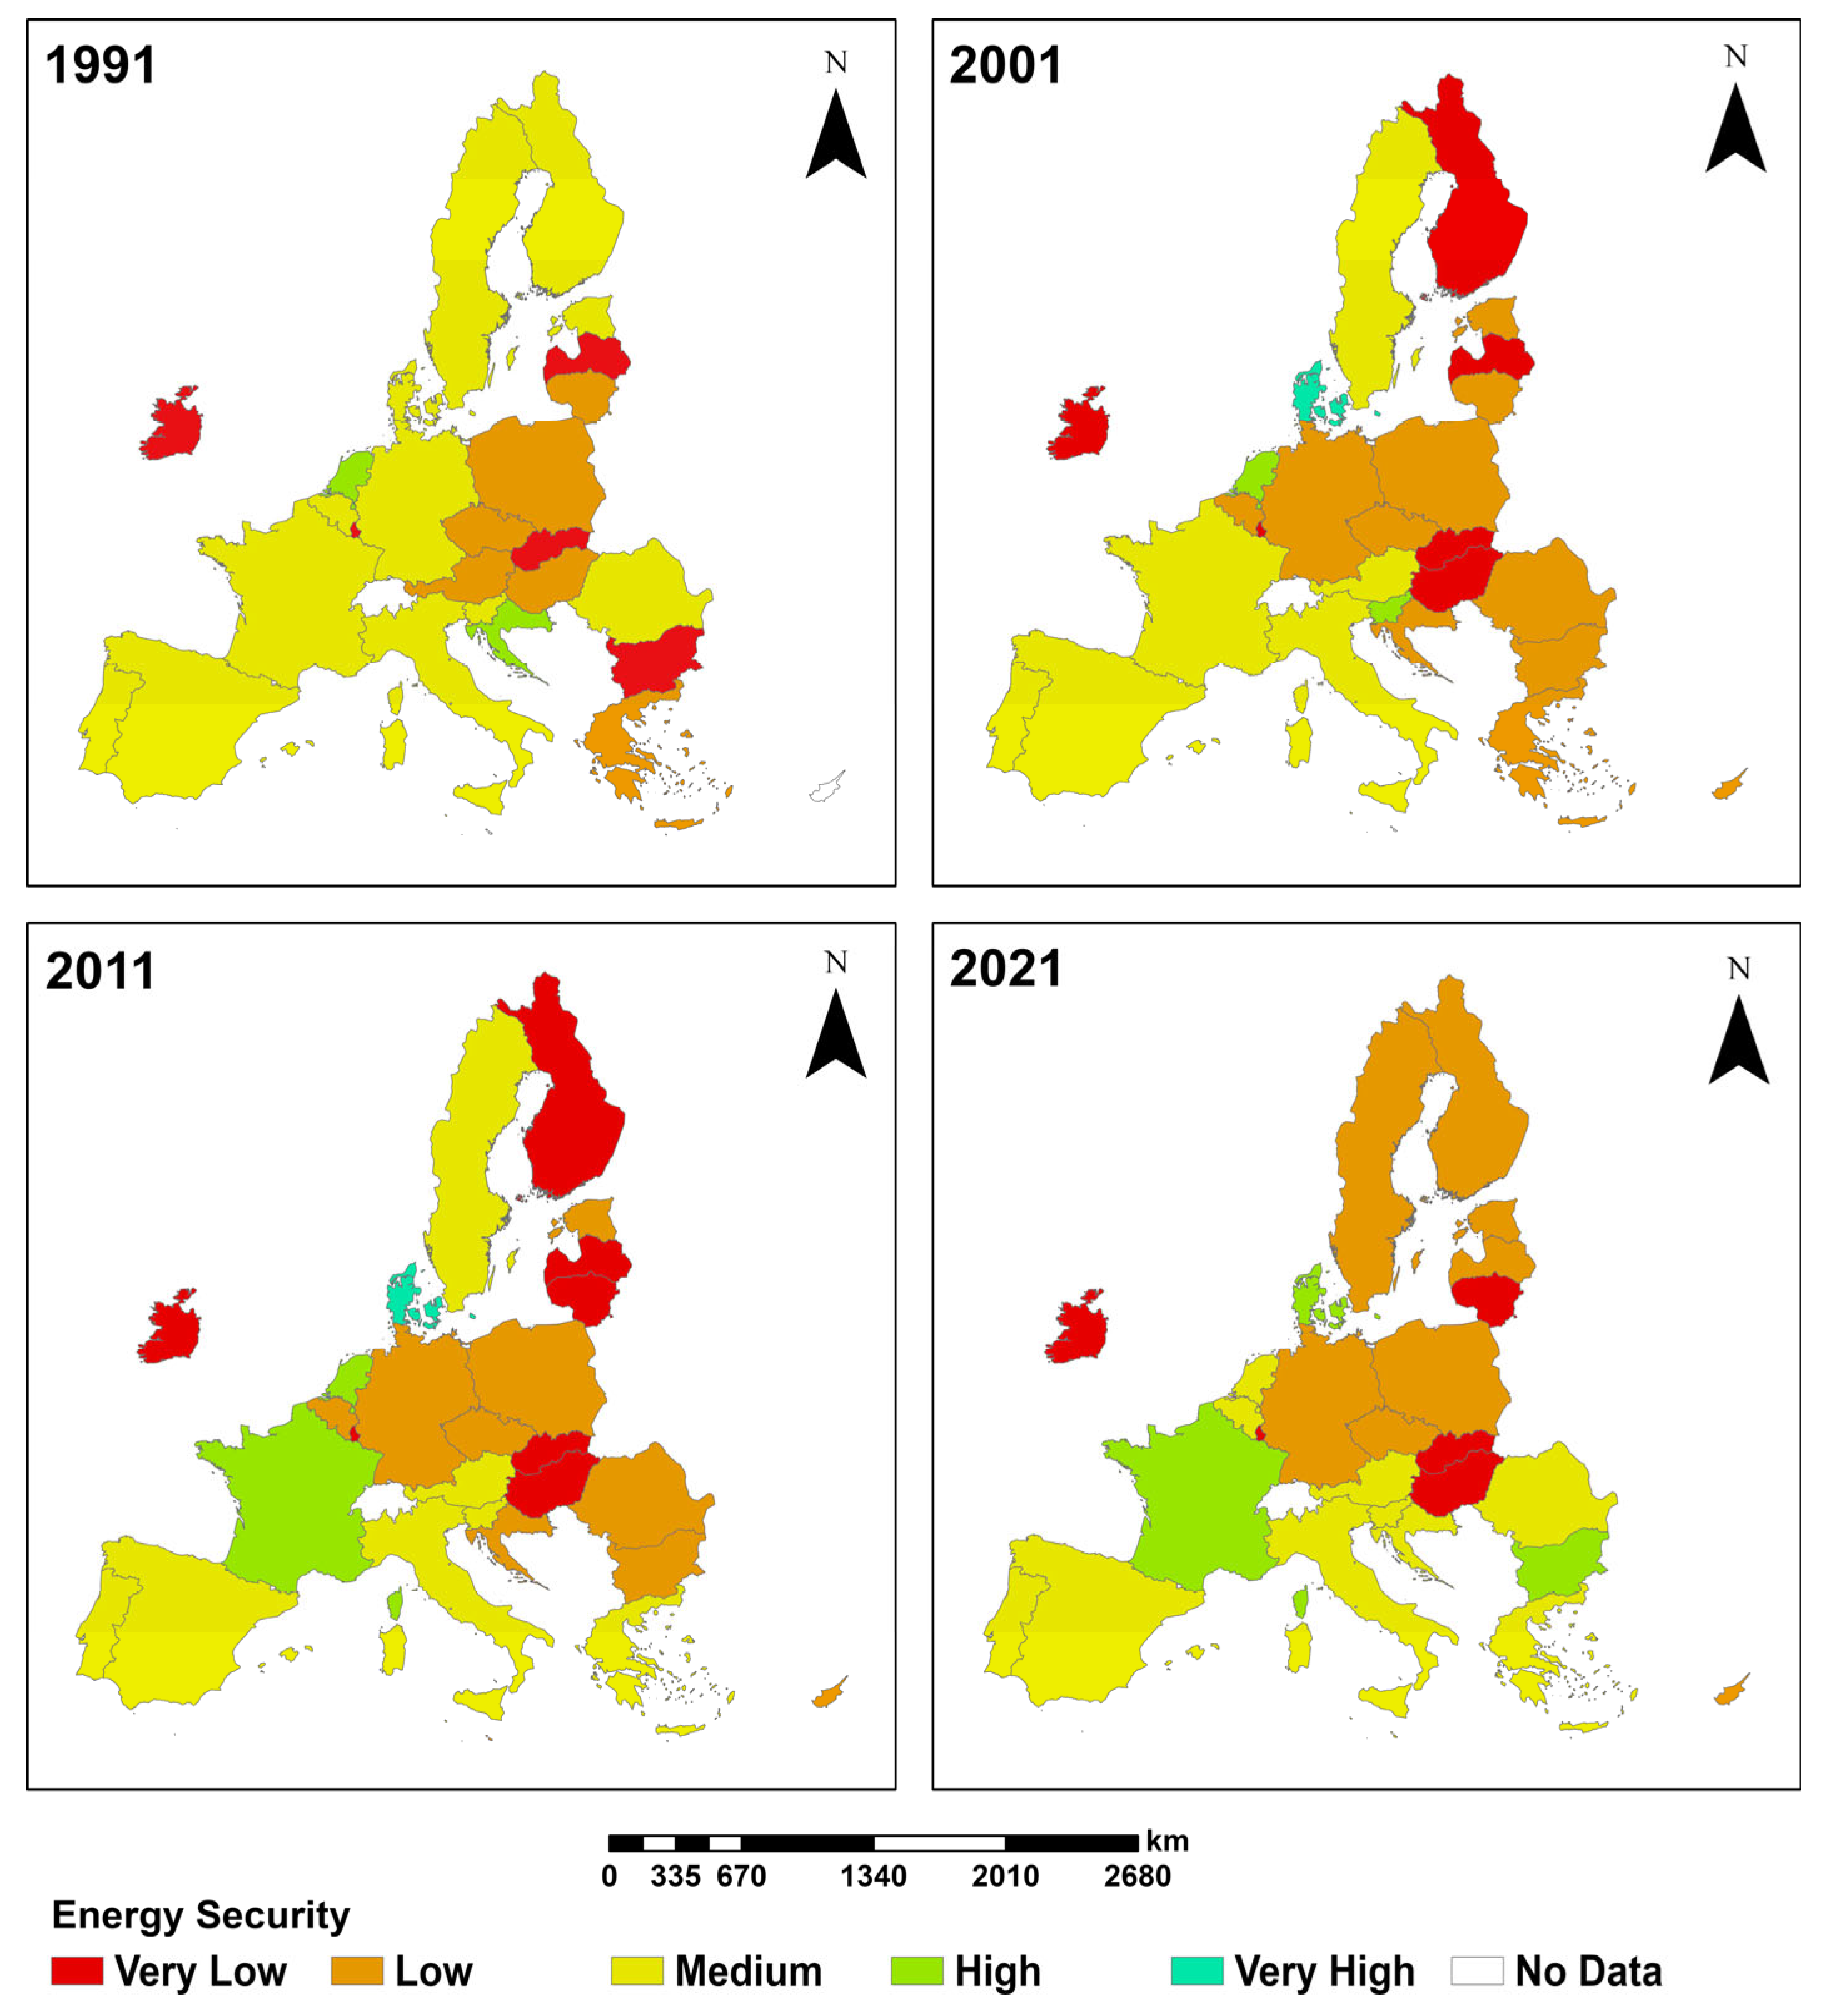
In general, the EU’s energy security landscape in 1991 exhibited a fundamental pattern characterized by lower energy security in eastern regions and higher energy security in western regions (Figure 10). The transportation of natural gas, unlike oil, is significantly constrained by infrastructural limitations, leading to a more pronounced geographical concentration of natural gas imports compared to those of oil. As the proportion of natural gas within the EU’s energy consumption structure has risen, an increased geographical concentration of energy imports has become evident in many member states, contributing to a deterioration in their overall energy security. Nonetheless, coastal nations possess the advantage of accessing the global LNG trade network via their port facilities. Consequently, while these countries may experience a greater geographical concentration of natural gas imports relative to oil, the impact on their overall energy import diversification can be mitigated, often keeping risks at a relatively low level. As a result, the growth in natural gas consumption exerts a comparatively limited negative effect on the energy security of these nations. In contrast, landlocked countries are compelled to rely entirely on pipeline infrastructure for their natural gas imports. For these states, the escalation in natural gas consumption has precipitated a more rapid increase in the geographical concentration of energy imports and a significant compromise of their energy security levels. By 2021, the EU’s energy security pattern had gradually evolved to a state characterized by lower levels in central regions and higher levels in peripheral areas. In 2021, the number of EU member states categorized with low or very low energy security levels reached 13, constituting almost half of the total membership. In contrast, only Bulgaria, France, and Denmark were identified as possessing high energy security. Notably, Denmark, which was classified as a medium-security state in 1991, significantly improved its standing. Supported by the development of oil and gas resources in the North Sea, its dependency on energy imports plummeted from 39.61% in 1991 to −28.63% by 2001. This transformation positioned Denmark as the sole EU country achieving a very high level of energy security in both 2001 and 2011.

4. Discussion, Conclusions, and Policy Suggestions

4.1. Discussion

The findings of this study offer significant insights into the EU’s energy security landscape, particularly in the context of the geopolitical shifts triggered by the Russian–Ukrainian conflict. Our central result, that high dependence on imported oil and gas constitutes the most critical vulnerability for the EU, is consistent with previous research highlighting external dependency, especially on Russia, as the foremost threat to European energy security [51]. The analysis further reveals that the security challenges are not uniform across the bloc. We identified considerable geospatial differences in energy security, a finding also confirmed in other studies [52]. Specifically, the pronounced reliance of Eastern European nations on Russian energy sources, compared to their Western counterparts, illuminates the underlying reasons for the varied pace of sanctions implementation against Russia and a weakened collective bargaining position for the EU.
This study quantitatively demonstrates the differing security profiles of oil and natural gas. While both are marked by high external dependency, natural gas imports exhibit a significantly higher geographic concentration due to logistical constraints in transportation and storage. This concentration renders the natural gas supply chain less resilient and diversified than that of oil. Consequently, with the exception of gas-producing nations like the Netherlands and Denmark, most member states face a low level of natural gas security. This vulnerability is compounded by the structural shift in the EU’s energy consumption, where an increasing share of natural gas is actively contributing to a downward trend in overall energy security for many member states. Despite these contributions, this study has several limitations that warrant consideration. First, the analytical framework is predicated on the central role of trade in energy supply. This makes it highly effective for assessing net energy-importing countries, which is the case for most EU members. However, its applicability to net energy exporters is limited, as their security is primarily determined by domestic production capacity rather than trade dynamics. The inclusion of exporting countries in this analysis was intended to facilitate a comparative overview, but a dedicated study of their security would require a different methodological focus. Furthermore, this paper’s scope is intentionally focused on oil and natural gas due to their dominance in the EU’s energy import structure. Other significant energy sources, such as renewables, biofuels, nuclear, and coal, were excluded. While their share in the import mix is smaller, they are crucial to the energy security of certain member states. Future research should aim to integrate these energy sources to provide an even more comprehensive picture of EU energy security. Coal was excluded because the EU possesses a relatively more robust domestic production capacity compared to oil and gas. The security challenges for renewables and nuclear energy are often tied to the trade of associated equipment, like photovoltaic panels or nuclear power units [53], rather than the energy commodity itself. Future research can extend the framework of this article to further investigate the dimensions of renewable energy security, centering the analysis on the trade dynamics of renewable energy equipment and its essential raw materials.
Extending beyond the direct implications of import reliance, the determinants of energy security in the EU are increasingly complex. The recent literature highlights that the global energy crisis, exacerbated by geopolitical conflict, has not only reshaped energy supply chains but has also significantly influenced the pace of energy efficiency initiatives. This crisis presents an opportunity to accelerate the EU’s energy transition, which aims to build a more sustainable and secure energy system by promoting investment in renewable energy to improve energy efficiency, reduce costs, mitigate climate change, and enhance energy resilience [54]. Furthermore, the rapid acceleration of the energy transition concurrently introduces new challenges. For example, the large-scale deployment of photovoltaic systems has prompted growing concerns regarding the adverse environmental impacts of waste generation and disposal throughout the solar infrastructure lifecycle [55]. These factors, alongside others such as grid resilience [56], cross-border electricity interconnections [57], and digital transformation [58], collectively define the evolving landscape of energy security in the EU. Investigations into these factors are of substantial practical relevance for enabling the EU to strengthen its energy security and navigate the energy crisis, while also warranting in-depth academic inquiry.

4.2. Conclusions

In response to the profound disruption of European energy markets by the Russian–Ukrainian conflict, this paper developed and applied a trade-based framework to assess the EU’s energy security. By focusing on oil and natural gas as the most critical imported commodities, we evaluated supply stability and diversification to map the energy security landscape at both the regional and member state levels.
The main results are as follows. (1) As the primary type of energy imported by the EU, oil and gas constitute a significant proportion of the EU’s energy consumption structure. However, they are highly dependent on imports, rendering them the most vulnerable links in the EU’s energy system. (2) The EU’s limited energy reserves have resulted in a considerable degree of external dependence on oil and gas imports. However, the challenges associated with transportation and storage have led to a notable concentration of natural gas imports in specific regions, with a relatively lower diversification compared to oil imports. The oil security levels among EU member states exhibit considerable variability, significantly influenced by geographical positioning. With the exception of the Netherlands and Denmark, which are endowed with abundant natural gas reserves and display robust natural gas production capabilities, the natural gas security profile of the majority of EU member states is characterized by a relatively low level of security due to the high geographical concentration of imports. (3) The pattern of the EU’s energy security has undergone a gradual transformation, shifting from a configuration characterized by high energy security being concentrated in the west and low energy security in the east to one where low energy security is concentrated in the central area and high energy security is concentrated in the surrounding area. The increasing share of natural gas within the energy consumption structure is leading to a downward trajectory in the energy security of EU member states.

4.3. Policy Suggestions

The fossil energy resource endowment of the EU is limited, rendering self-sufficiency in this regard a challenging proposition. Achieving equilibrium between energy supply and demand is a formidable task, particularly when relying solely on one’s production capabilities. Vigorously promoting the utilization of renewable energy and reducing energy dependence on the outside will be the primary measures for the EU to improve energy security in the medium and long term. However, the process of fossil energy being replaced in a decarbonized EU does not mean the end of fossil energy in the European energy mix [59]. Renewable energy to fossil energy substitution is a long process, which is difficult to achieve overnight. How to broaden the supply diversity of fossil energy, especially oil and natural gas, is an important issue for the EU to enhance energy security in the short term. It is recommended that governmental authorities establish a comprehensive energy reserve mechanism. The implementation of such a strategic framework would facilitate the timely deployment of strategic energy reserves during geopolitical disturbances, thereby enabling the maintenance of temporal equilibrium within the energy system’s supply–demand dynamics. In the medium term, the EU’s energy security faces a fundamental constraint rooted in strategic energy critical infrastructure deficits, which undermine systemic resilience against supply–demand imbalances. The EU should accelerate the construction of ports along the Baltic, Mediterranean, and Black Sea coasts and increase the capacity of these regions to participate in the international maritime trade of oil and liquefied natural gas, so as to reduce the geographical concentration of imports by relying on transportation pipelines. In addition, the EU should strengthen its activities in the construction of natural gas and oil transportation pipelines so as to increase the ability to import natural gas and oil from neighboring regions such as North Africa, the Middle East, and Eastern Europe. What is more, it is difficult for the EU to adopt a unified energy position due to the differences in energy security levels and the degree of close ties with Russia’s energy. The EU countries should strengthen energy cooperation and assume a common energy position to deal with the energy threat brought by the Russian–Ukrainian conflict and improve their voice in the international energy market. The fundamental pathway to ensuring the EU’s long-term energy security lies in the continuous advancement of its green energy transformation. The geopolitical crisis stemming from the Russian–Ukrainian conflict, despite presenting profound short-term security challenges, has also served as a catalyst, opening a valuable policy window to advance the Union’s carbon neutrality objectives with renewed vigor in the context of external pressure. The 2022 REPowerEU plan outlines a strategy to end dependency on Russian energy through savings, diversification, and clean energy production—a rationale our research partially supports. Nevertheless, this transition warrants careful consideration, as it presents the considerable risk that unless the EU substantially enhances its domestic manufacturing capabilities and secures the necessary supply chains for raw materials, it may simply exchange its historical dependency on fossil fuels for a new strategic vulnerability to foreign producers of renewable energy technology.

Author Contributions

Conceptualization, Z.S.; Data Curation, Q.L.; Formal Analysis, Q.L.; Funding Acquisition, Z.S.; Methods and Analysis, Q.L. and Z.S.; Visualization, Q.L.; Writing and Editing, Q.L. and Z.S. All authors have read and agreed to the published version of the manuscript.

Funding

This study was primarily funded by the Program of the National Natural Science Foundation of China, No. 42471202 and No. 72441005.

Data Availability Statement

These data were derived from the following resources available in the public domain: Eurostat (https://ec.europa.eu/eurostat/databrowser/view/TEN00122__custom_5451656/default/table, https://ec.europa.eu/eurostat/databrowser/view/nrg_ti_oil/default/table?lang=en, https://ec.europa.eu/eurostat/databrowser/view/nrg_ti_gas/default/table?lang=en, accessed on 8 July 2025) and the International Energy Agency (https://www.iea.org/data-and-statistics/data-product/energy-prices, accessed on 8 July 2025).

Acknowledgments

During the preparation of this study, the authors used Gemini 2.5 Pro for the purposes of polishing the language. The authors have reviewed and edited the output and take full responsibility for the content of this publication.

Conflicts of Interest

The authors declare no conflicts of interest.

References

  1. Martchamadol, J.; Kumar, S. Thailand’s Energy Security Indicators. Renew. Sustain. Energy Rev. 2012, 16, 6103–6122. [Google Scholar] [CrossRef]
  2. Chester, L. Conceptualising Energy Security and Making Explicit Its Polysemic Nature. Energy Policy 2010, 38, 887–895. [Google Scholar] [CrossRef]
  3. Sovacool, B.K. (Ed.) The Routledge Handbook of Energy Security; Routledge: London, UK, 2011; ISBN 978-0-415-59117-1. [Google Scholar]
  4. Demski, C.; Poortinga, W.; Pidgeon, N. Exploring Public Perceptions of Energy Security Risks in the UK. Energy Policy 2014, 66, 369–378. [Google Scholar] [CrossRef]
  5. Bompard, E.; Carpignano, A.; Erriquez, M.; Grosso, D.; Pession, M.; Profumo, F. National Energy Security Assessment in a Geopolitical Perspective. Energy 2017, 130, 144–154. [Google Scholar] [CrossRef]
  6. Ellabban, O.; Abu-Rub, H.; Blaabjerg, F. Renewable Energy Resources: Current Status, Future Prospects and Their Enabling Technology. Renew. Sustain. Energy Rev. 2014, 39, 748–764. [Google Scholar] [CrossRef]
  7. Escribano Francés, G.; Marín-Quemada, J.M.; San Martín González, E. RES and Risk: Renewable Energy’s Contribution to Energy Security. A Portfolio-Based Approach. Renew. Sustain. Energy Rev. 2013, 26, 549–559. [Google Scholar] [CrossRef]
  8. Vivoda, V. Evaluating Energy Security in the Asia-Pacific Region: A Novel Methodological Approach. Energy Policy 2010, 38, 5258–5263. [Google Scholar] [CrossRef]
  9. Ang, B.W.; Choong, W.L.; Ng, T.S. Energy Security: Definitions, Dimensions and Indexes. Renew. Sustain. Energy Rev. 2015, 42, 1077–1093. [Google Scholar] [CrossRef]
  10. Cherp, A.; Jewell, J. The Concept of Energy Security: Beyond the Four As. Energy Policy 2014, 75, 415–421. [Google Scholar] [CrossRef]
  11. Statistical Review of World Energy 2024. Available online: https://www.energyinst.org/statistical-review (accessed on 15 June 2025).
  12. BP Statistical Review of World Energy 2021. Available online: https://www.bp.com/content/dam/bp/business-sites/en/global/corporate/pdfs/energy-economics/statistical-review/bp-stats-review-2021-full-report.pdf (accessed on 15 June 2025).
  13. Casier, T. The Rise of Energy to the Top of the EU-Russia Agenda: From Interdependence to Dependence? Geopolitics 2011, 16, 536–552. [Google Scholar] [CrossRef]
  14. Cui, L.; Yue, S.; Nghiem, X.-H.; Duan, M. Exploring the Risk and Economic Vulnerability of Global Energy Supply Chain Interruption in the Context of Russo-Ukrainian War. Resour. Policy 2023, 81, 103373. [Google Scholar] [CrossRef]
  15. Hussain, S.A.; Razi, F.; Hewage, K.; Sadiq, R. The Perspective of Energy Poverty and 1st Energy Crisis of Green Transition. Energy 2023, 275, 127487. [Google Scholar] [CrossRef]
  16. Farghali, M.; Osman, A.I.; Mohamed, I.M.A.; Chen, Z.; Chen, L.; Ihara, I.; Yap, P.-S.; Rooney, D.W. Strategies to Save Energy in the Context of the Energy Crisis: A Review. Environ. Chem. Lett. 2023, 21, 2003–2039. [Google Scholar] [CrossRef] [PubMed]
  17. Azzuni, A.; Breyer, C. Definitions and Dimensions of Energy Security: A Literature Review. WIREs Energy Environ. 2018, 7, e268. [Google Scholar] [CrossRef]
  18. Strojny, J.; Krakowiak-Bal, A.; Knaga, J.; Kacorzyk, P. Energy Security: A Conceptual Overview. Energies 2023, 16, 5042. [Google Scholar] [CrossRef]
  19. International Energy Agency Towards a Sustainable Energy Future 2001. International Energy Agency Towards a Sustainable Energy Future 2001. Available online: https://www.iea.org/reports/towards-a-sustainable-energy-future (accessed on 18 March 2025).
  20. European Commission Green Paper: Towards a European Strategy for the Security of Energy Supply 2000. Available online: https://op.europa.eu/en/publication-detail/-/publication/0ef8d03f-7c54-41b6-ab89-6b93e61fd37c/language-en (accessed on 19 March 2025).
  21. Andrews, C.J. Energy Security as a Rationale for Governmental Action. IEEE Technol. Soc. Mag. 2005, 24, 16–25. [Google Scholar] [CrossRef]
  22. Intharak, N.; Julay, J.H.; Nakanishi, S.; Matsumoto, T.; Mat Sahid, E.J.; Ormeno Aquino, A.G.; Aponte, A.A. A Quest for Energy Security in the 21st Century: Resources and Constraints; Inst. of Energy Economics: Tokyo, Japan, 2007; ISBN 978-4-931482-35-7. [Google Scholar]
  23. Rodríguez-Fernández, L.; Carvajal, A.B.F.; De Tejada, V.F. Improving the Concept of Energy Security in an Energy Transition Environment: Application to the Gas Sector in the European Union. Extr. Ind. Soc. 2022, 9, 101045. [Google Scholar] [CrossRef]
  24. Winzer, C. Conceptualizing Energy Security. Energy Policy 2012, 46, 36–48. [Google Scholar] [CrossRef]
  25. Cox, E. Assessing Long-Term Energy Security: The Case of Electricity in the United Kingdom. Renew. Sustain. Energy Rev. 2018, 82, 2287–2299. [Google Scholar] [CrossRef]
  26. Designing Indicators of Long-Term Energy Supply Security. Available online: https://publicaties.ecn.nl/PdfFetch.aspx?nr=ECN-C--04-007 (accessed on 4 May 2025).
  27. Matsumoto, K.; Doumpos, M.; Andriosopoulos, K. Historical Energy Security Performance in EU Countries. Renew. Sustain. Energy Rev. 2018, 82, 1737–1748. [Google Scholar] [CrossRef]
  28. Chalvatzis, K.J.; Ioannidis, A. Energy Supply Security in the EU: Benchmarking Diversity and Dependence of Primary Energy. Appl. Energy 2017, 207, 465–476. [Google Scholar] [CrossRef]
  29. Cohen, G.; Joutz, F.; Loungani, P. Measuring Energy Security: Trends in the Diversification of Oil and Natural Gas Supplies. Energy Policy 2011, 39, 4860–4869. [Google Scholar] [CrossRef]
  30. Yu, Z.; Li, J.; Yang, G. A Review of Energy Security Index Dimensions and Organization. Energy Res. Lett. 2022, 3, 1–5. [Google Scholar] [CrossRef]
  31. Narula, K.; Reddy, B.S. Three Blind Men and an Elephant: The Case of Energy Indices to Measure Energy Security and Energy Sustainability. Energy 2015, 80, 148–158. [Google Scholar] [CrossRef]
  32. Axon, C.J.; Darton, R.C. Sustainability and Risk—A Review of Energy Security. Sustain. Prod. Consum. 2021, 27, 1195–1204. [Google Scholar] [CrossRef]
  33. U.S. Chamber of Commerce’s Global Energy Institute Index of U.S. Energy Security Risk: Assessing America’s Vulnerabilities in a Global Energy Market 2020. Available online: https://www.uschamber.com/energy/index-of-us-energy-security-risk-assessing-americas-vulnerabilities-global-energy-market (accessed on 10 May 2025).
  34. Jewell, J. The IEA Model of Short-Term Energy Security (MOSES): Primary Energy Sources and Secondary Fuels. IEA Energy Papers 2011, 17, 1–43. [Google Scholar] [CrossRef]
  35. Rabbi, M.F.; Popp, J.; Máté, D.; Kovács, S. Energy Security and Energy Transition to Achieve Carbon Neutrality. Energies 2022, 15, 8126. [Google Scholar] [CrossRef]
  36. Lambert, L.A.; Tayah, J.; Lee-Schmid, C.; Abdalla, M.; Abdallah, I.; Ali, A.H.M.; Esmail, S.; Ahmed, W. The EU’s Natural Gas Cold War and Diversification Challenges. Energy Strategy Rev. 2022, 43, 100934. [Google Scholar] [CrossRef]
  37. Rokicki, T.; Bórawski, P.; Szeberényi, A. The Impact of the 2020–2022 Crises on EU Countries’ Independence from Energy Imports, Particularly from Russia. Energies 2023, 16, 6629. [Google Scholar] [CrossRef]
  38. Zhang, X.; Meng, X.; Su, C.W. The Security of Energy Import: Do Economic Policy Uncertainty and Geopolitical Risk Really Matter? Econ. Anal. Policy 2024, 82, 377–388. [Google Scholar] [CrossRef]
  39. Costantini, V.; Gracceva, F.; Markandya, A.; Vicini, G. Security of Energy Supply: Comparing Scenarios from a European Perspective. Energy Policy 2007, 35, 210–226. [Google Scholar] [CrossRef]
  40. Lehocký, F.; Rusnák, J. Regional Specialization and Geographic Concentration: Experiences from Slovak Industry. Misc. Geogr. 2016, 20, 5–13. [Google Scholar] [CrossRef]
  41. Berndt, E.R. Energy Price Increases and the Productivity Measurement. Annu. Rev. Energy 1978, 3, 225–273. [Google Scholar] [CrossRef]
  42. Cleveland, C.J.; Kaufmann, R.K.; Stern, D.I. Aggregation and the Role of Energy in the Economy. Ecol. Econ. 2000, 32, 301–317. [Google Scholar] [CrossRef]
  43. Liao, H.; Wei, Y.-M. China’s Energy Consumption: A Perspective from Divisia Aggregation Approach. Energy 2010, 35, 28–34. [Google Scholar] [CrossRef]
  44. U.S. Department of Justice and the Federal Trade Commission Horizontal Merger Guidelines 2010. Available online: https://www.justice.gov/atr/horizontal-merger-guidelines-08192010#5c (accessed on 15 April 2025).
  45. Eurostat. Available online: https://ec.europa.eu/eurostat/en (accessed on 15 June 2025).
  46. IEA. Available online: https://www.iea.org/data-and-statistics/data-product/energy-prices (accessed on 15 June 2025).
  47. Paraschiv, S.; Paraschiv, L.S. Trends of Carbon Dioxide (CO2) Emissions from Fossil Fuels Combustion (Coal, Gas and Oil) in the EU Member States from 1960 to 2018. Energy Rep. 2020, 6, 237–242. [Google Scholar] [CrossRef]
  48. Nitoiu, C. Towards Conflict or Cooperation? The Ukraine Crisis and EU-Russia Relations. Southeast Eur. Black Sea Stud. 2016, 16, 375–390. [Google Scholar] [CrossRef]
  49. Landry, P. The EU Strategy for Gas Security: Threats, Vulnerabilities and Processes. Energy Policy 2020, 144, 111507. [Google Scholar] [CrossRef]
  50. Van Thienen-Visser, K.; Breunese, J.N. Induced Seismicity of the Groningen Gas Field: History and Recent Developments. Lead. Edge 2015, 34, 664–671. [Google Scholar] [CrossRef]
  51. Elbassoussy, A. European Energy Security Dilemma: Major Challenges and Confrontation Strategies. Rev. Econ. Political Sci. 2019, 4, 321–343. [Google Scholar] [CrossRef]
  52. Streimikiene, D.; Siksnelyte-Butkiene, I.; Lekavicius, V. Energy Diversification and Security in the EU: Comparative Assessment in Different EU Regions. Economies 2023, 11, 83. [Google Scholar] [CrossRef]
  53. Lekavičius, V.; Balsiūnaitė, R.; Bobinaitė, V.; Konstantinavičiūtė, I.; Rimkūnaitė, K.; Štreimikienė, D.; Tarvydas, D. The Diversification of Energy Resources and Equipment Imports in the European Union. Energy 2024, 307, 132595. [Google Scholar] [CrossRef]
  54. Gajdzik, B.; Wolniak, R.; Nagaj, R.; Žuromskaitė-Nagaj, B.; Grebski, W.W. The Influence of the Global Energy Crisis on Energy Efficiency: A Comprehensive Analysis. Energies 2024, 17, 947. [Google Scholar] [CrossRef]
  55. Gajdzik, B.; Wolniak, R.; Nagaj, R.; Žuromskaitė-Nagaj, B.; Grebski, W. Energy Waste as a Side-Effect of Photovoltaic Development: Net Impact of Photovoltaics on CO2 Emissions in European Union Countries. Energies 2024, 18, 78. [Google Scholar] [CrossRef]
  56. Bachanek, K.H.; Drożdż, W.; Kolon, M. Development of Renewable Energy Sources in Poland and Stability of Power Grids—Challenges, Technologies, and Adaptation Strategies. Energies 2025, 18, 2036. [Google Scholar] [CrossRef]
  57. Do, H.X.; Nepal, R.; Pham, S.D.; Jamasb, T. Electricity Market Crisis in Europe and Cross Border Price Effects: A Quantile Return Connectedness Analysis. Energy Econ. 2024, 135, 107633. [Google Scholar] [CrossRef]
  58. Thanh, T.T.; Ha, L.T.; Dung, H.P.; Huong, T.T.L. Impacts of Digitalization on Energy Security: Evidence from European Countries. Environ. Dev. Sustain. 2023, 25, 11599–11644. [Google Scholar] [CrossRef] [PubMed]
  59. Mišík, M. The EU Needs to Improve Its External Energy Security. Energy Policy 2022, 165, 112930. [Google Scholar] [CrossRef]
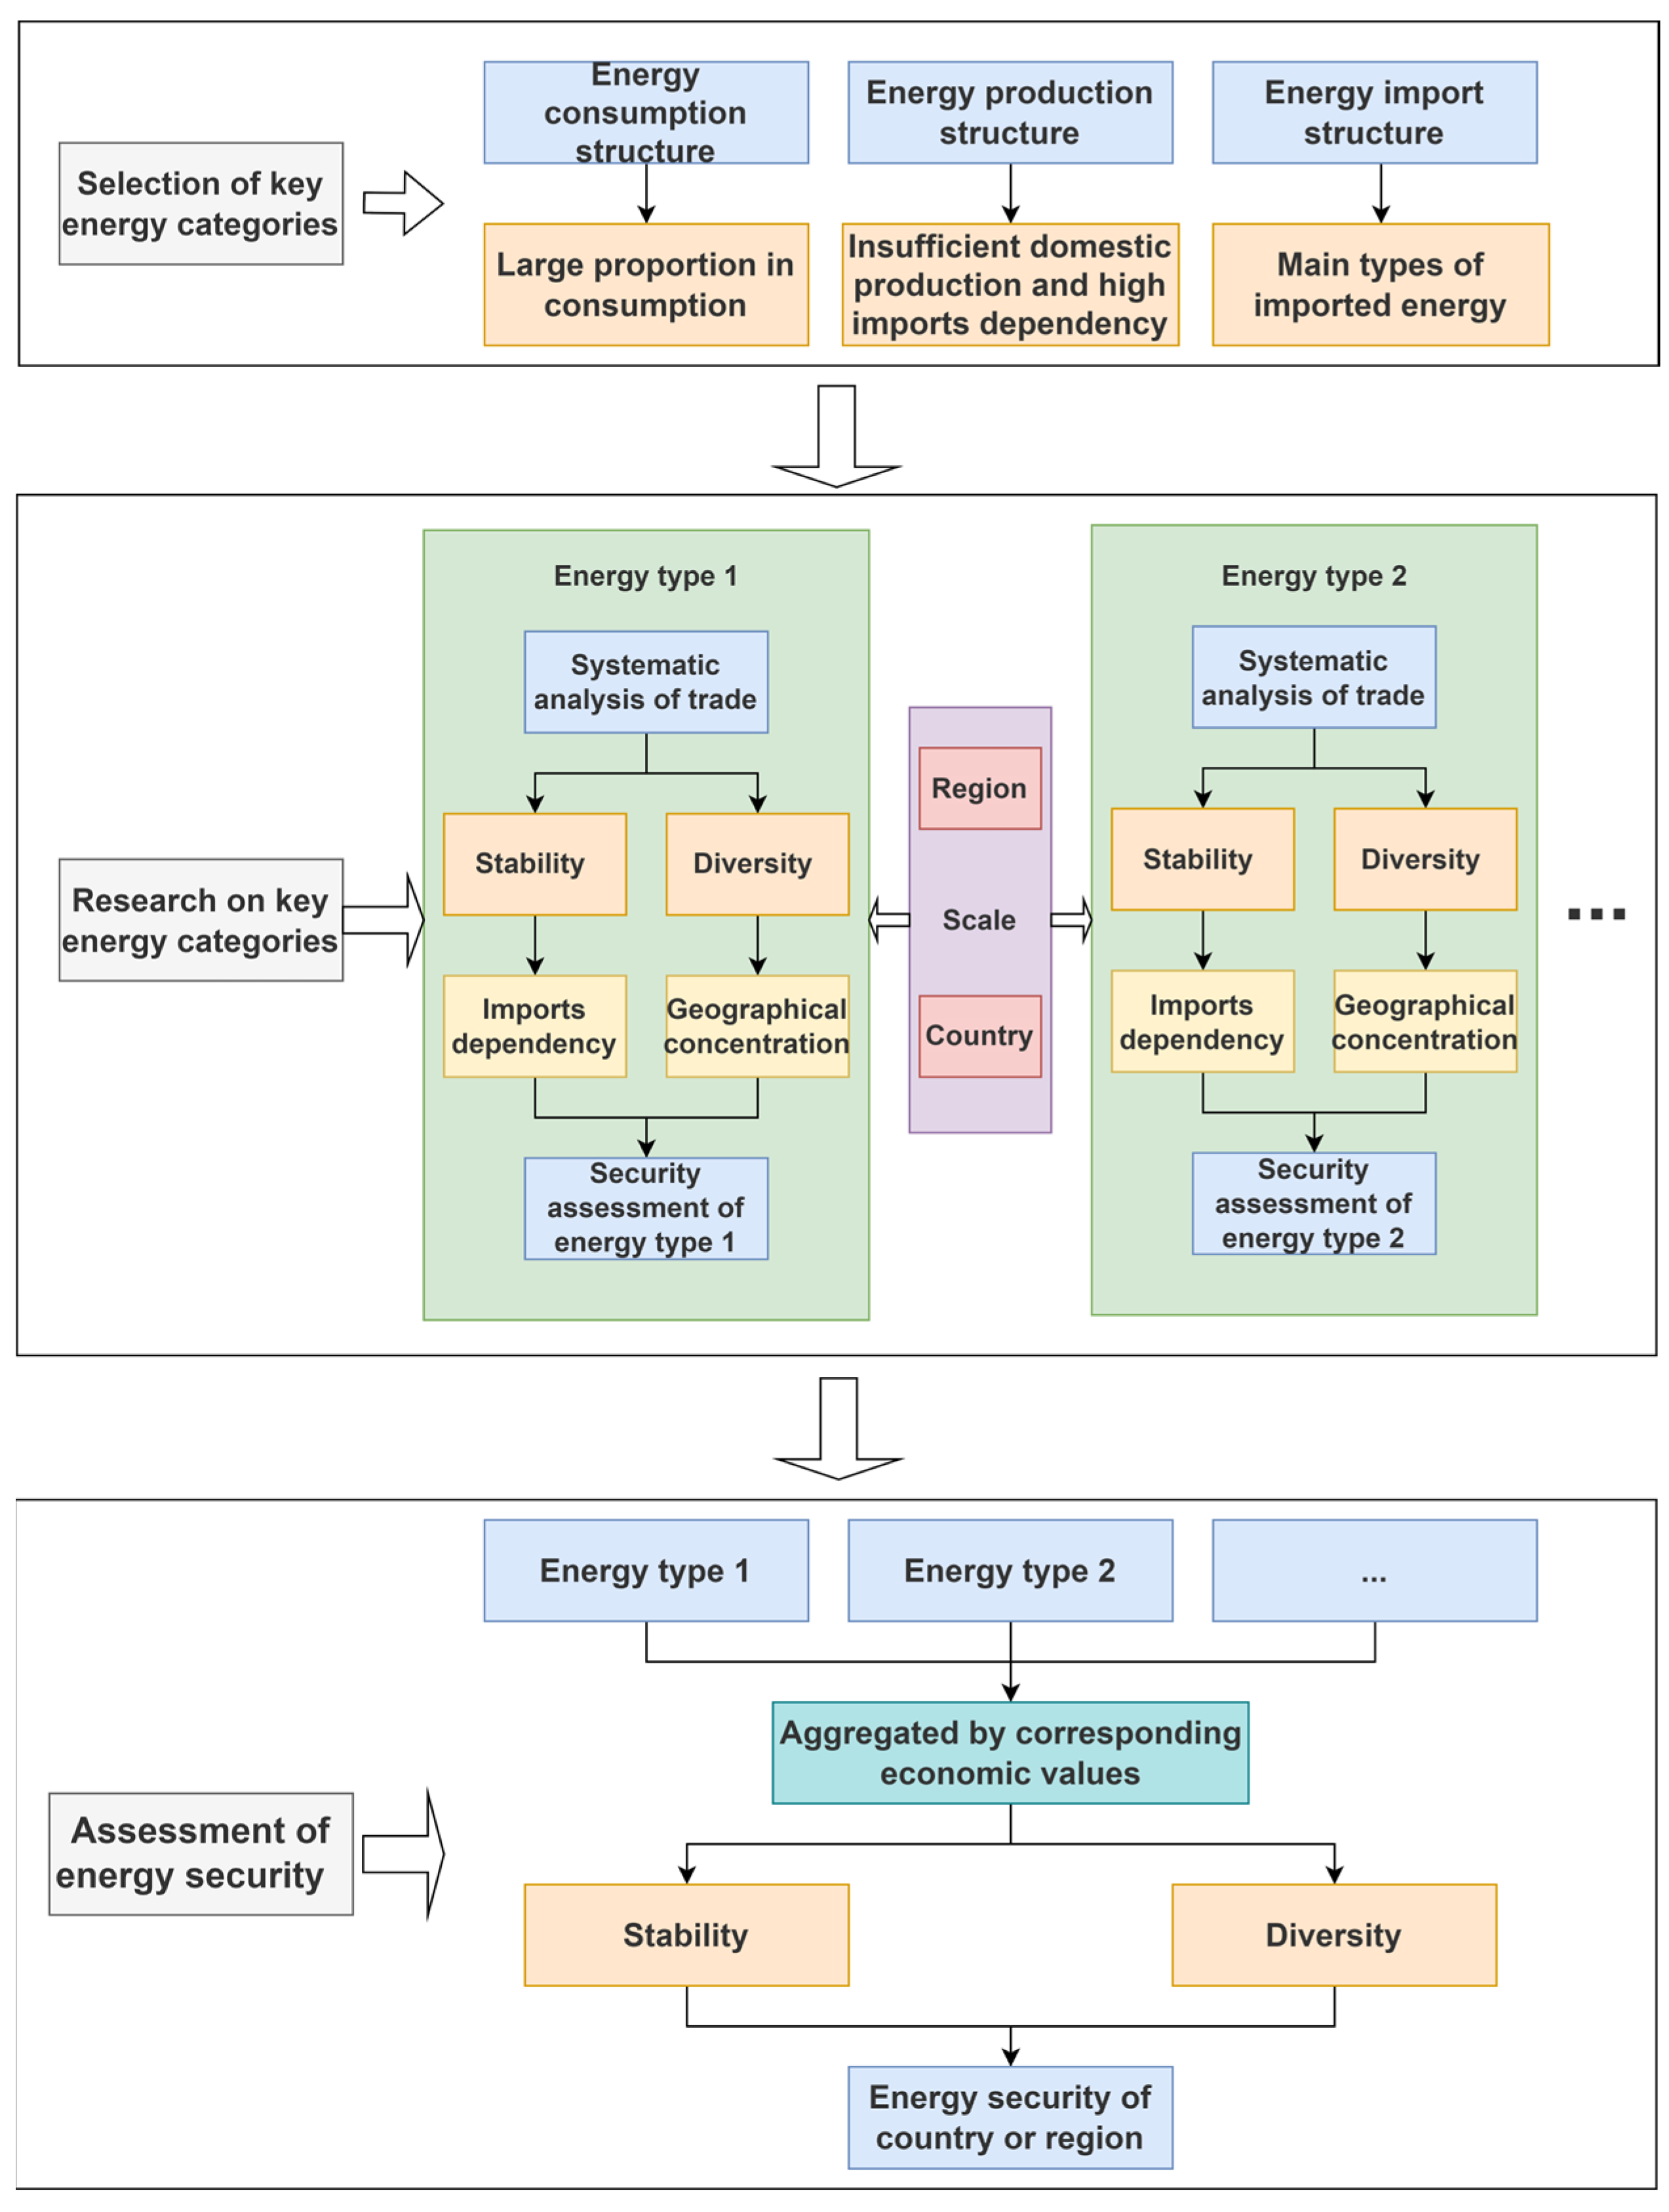
Figure 1. The conceptual framework of energy security. (The ellipses in the figure indicate those energy types that meet the standards and are included in the study, except for energy types 1 and 2).
Energies 18 03801 g001
Figure 2. The map of the EU.
Energies 18 03801 g002
Figure 3. (A) The EU’s energy consumption in 1991–2021. (B) The EU’s energy production in 1991–2021. (C) The EU’s energy imports and import dependency in 1991–2021. (D) The EU’s energy consumption structure in 1991–2021; (E) The EU’s energy production structure in 1991–2021. (F) The EU’s energy import structure in 1991–2021. (Data source: https://ec.europa.eu/eurostat/databrowser/view/TEN00122__custom_5451656/default/table, accessed on 4 July 2025).
Energies 18 03801 g003
Figure 4. Cartogram of the EU weighted by oil imports in 1991, 2001, 2011, and 2021. (Data sources: https://ec.europa.eu/eurostat/databrowser/view/nrg_ti_oil/default/table?lang=en, accessed on 5 July 2025).
Energies 18 03801 g004
Figure 5. (A) The oil import dependency of the EU; (B) The oil import dependency of the EU’s member states; (C) The geographical concentration of oil imports in the EU; (D) The geographical concentration of oil imports in the EU’s member states. (Data sources: https://ec.europa.eu/eurostat/databrowser/view/nrg_ti_oil/default/table?lang=en, accessed on 5 July 2025).
Energies 18 03801 g005
Figure 6. Cartogram of the EU weighted by natural gas imports in 1991, 2001, 2011, and 2021. (Data sources: https://ec.europa.eu/eurostat/databrowser/view/nrg_ti_gas/default/table?lang=en, accessed on 5 July 2025).
Energies 18 03801 g006
Figure 7. (A) The natural gas import dependency of the EU; (B) The natural gas import dependency of the EU’s member states; (C) The geographical concentration of natural gas imports in the EU; (D) The geographical concentration of natural gas imports in the EU’s member states. (Data sources: https://ec.europa.eu/eurostat/databrowser/view/nrg_ti_gas/default/table?lang=en, accessed on 7 July 2025).
Energies 18 03801 g007
Figure 8. The EU’s oil security in 1991, 2001, 2011, and 2021.
Energies 18 03801 g008
Figure 9. The EU’s natural gas security in 1991, 2001, 2011, and 2021.
Energies 18 03801 g009
Figure 10. The EU’s energy security in 1991, 2001, 2011, and 2021.
Energies 18 03801 g010
Table 1. Classification of energy security levels.
Geographical Concentration<15001500–2500>2500
Import Dependency
<0Very highVery highVery high
0–50%HighMediumLow
>50%MediumLowVery low
Table 2. The top ten sources of oil imports to the EU and their share in 1991, 2001, 2011, and 2021.
1991200120112021
PartnerSharePartnerSharePartnerSharePartnerShare
Saudi Arabia12.15%Russia20.61%Russia27.54%Russia22.56%
Libya8.38%Norway10.60%UK6.00%US6.98%
Iran7.61%UK8.96%Norway5.54%Norway6.76%
UK7.42%Saudi Arabia7.13%Saudi Arabia5.44%Libya4.74%
Norway6.39%Libya6.27%Kazakhstan3.85%Kazakhstan4.69%
Nigeria4.79%Iran3.94%Iran3.64%Iraq4.21%
Algeria4.14%Algeria3.51%Nigeria3.54%UK4.15%
Russia3.87%Nigeria3.22%Azerbaijan3.11%Saudi Arabia4.04%
Mexico2.43%Syria2.70%US2.59%Nigeria3.86%
Egypt1.76%Iraq2.54%Iraq2.25%Azerbaijan2.65%
Sum58.95%Sum69.48%Sum63.49%Sum64.63%
Table 3. The top four sources of natural gas imports to the EU and their share in 1991, 2001, 2011, and 2021.
1991200120112021
PartnerSharePartnerSharePartnerSharePartnerShare
Russia67.32%Russia46.84%Russia36.36%Russia44.15%
Algeria19.44%Norway20.64%Norway22.82%Norway16.32%
Norway11.87%Algeria19.73%Algeria14.39%Algeria12.28%
Libya0.88%UK4.98%Qatar5.95%US5.65%
Sum99.52%Sum92.19%Sum79.53%Sum78.40%
Disclaimer/Publisher’s Note: The statements, opinions and data contained in all publications are solely those of the individual author(s) and contributor(s) and not of MDPI and/or the editor(s). MDPI and/or the editor(s) disclaim responsibility for any injury to people or property resulting from any ideas, methods, instructions or products referred to in the content.