1. Introduction
Since the advent of the industrial era, global warming, precipitated by the substantial emission of greenhouse gases (GHG) such as CO
2, has profoundly influenced human production and daily life. The atmospheric CO
2 concentration has exceeded 420 ppm, marking a 50% increase from pre-industrial levels [
1]. Consequently, mitigating GHG emissions has emerged as a pivotal strategy in addressing climate change and ensuring sustainable development [
2].
Environmental assessment is the basis for reducing GHG emissions. A footprint serves as a quantitative metric to assess the influence of human activities on the natural environment [
3]. Notably, the carbon footprint is a crucial index for gauging the impact of these activities on climate and sustainability [
4]. The carbon footprint quantifies GHG emissions from individuals, organizations, products, and activities. These emissions are then converted into CO
2 equivalents (CO
2-eq) to gauge their environmental repercussions [
5]. For organizations such as universities, the carbon footprint represents the GHG emissions generated by GHG inventory associated with their operations.
Research on the carbon footprint within universities carries significant implications for sustainable societal development [
6,
7]. Universities, as unique and influential entities in society, play a pivotal role in spearheading and fostering responses to climate change, thereby enhancing social sustainability [
8]. Furthermore, university campuses encapsulate various facets of social life, including clothing, food, housing, and transportation, thus serving as a microcosm of society. Utilizing universities as a model on a smaller scale offers direct reference value for research on comprehensive societal sustainable development.
Given the diversity among universities, there remains no unified standardized method for calculating GHG emissions from these institutions [
9]. Case studies have emerged as a crucial tool in determining research methodologies related to the university carbon footprint [
10]. Research on the university carbon footprint in developed nations commenced early, and currently, over 1000 universities have set zero-carbon goals, with a significant number of these institutions engaged in research on low-carbon campuses [
11]. WRI/WBCSD GHG Protocol Corporate Standard (GHG Protocol) [
12] is presently the most widely used standard for calculating the university carbon footprint [
13]. It is internationally recognized as a benchmark for GHG accounting and is endorsed by the American College and University Presidents’ Climate Commitment (ACUPCC) [
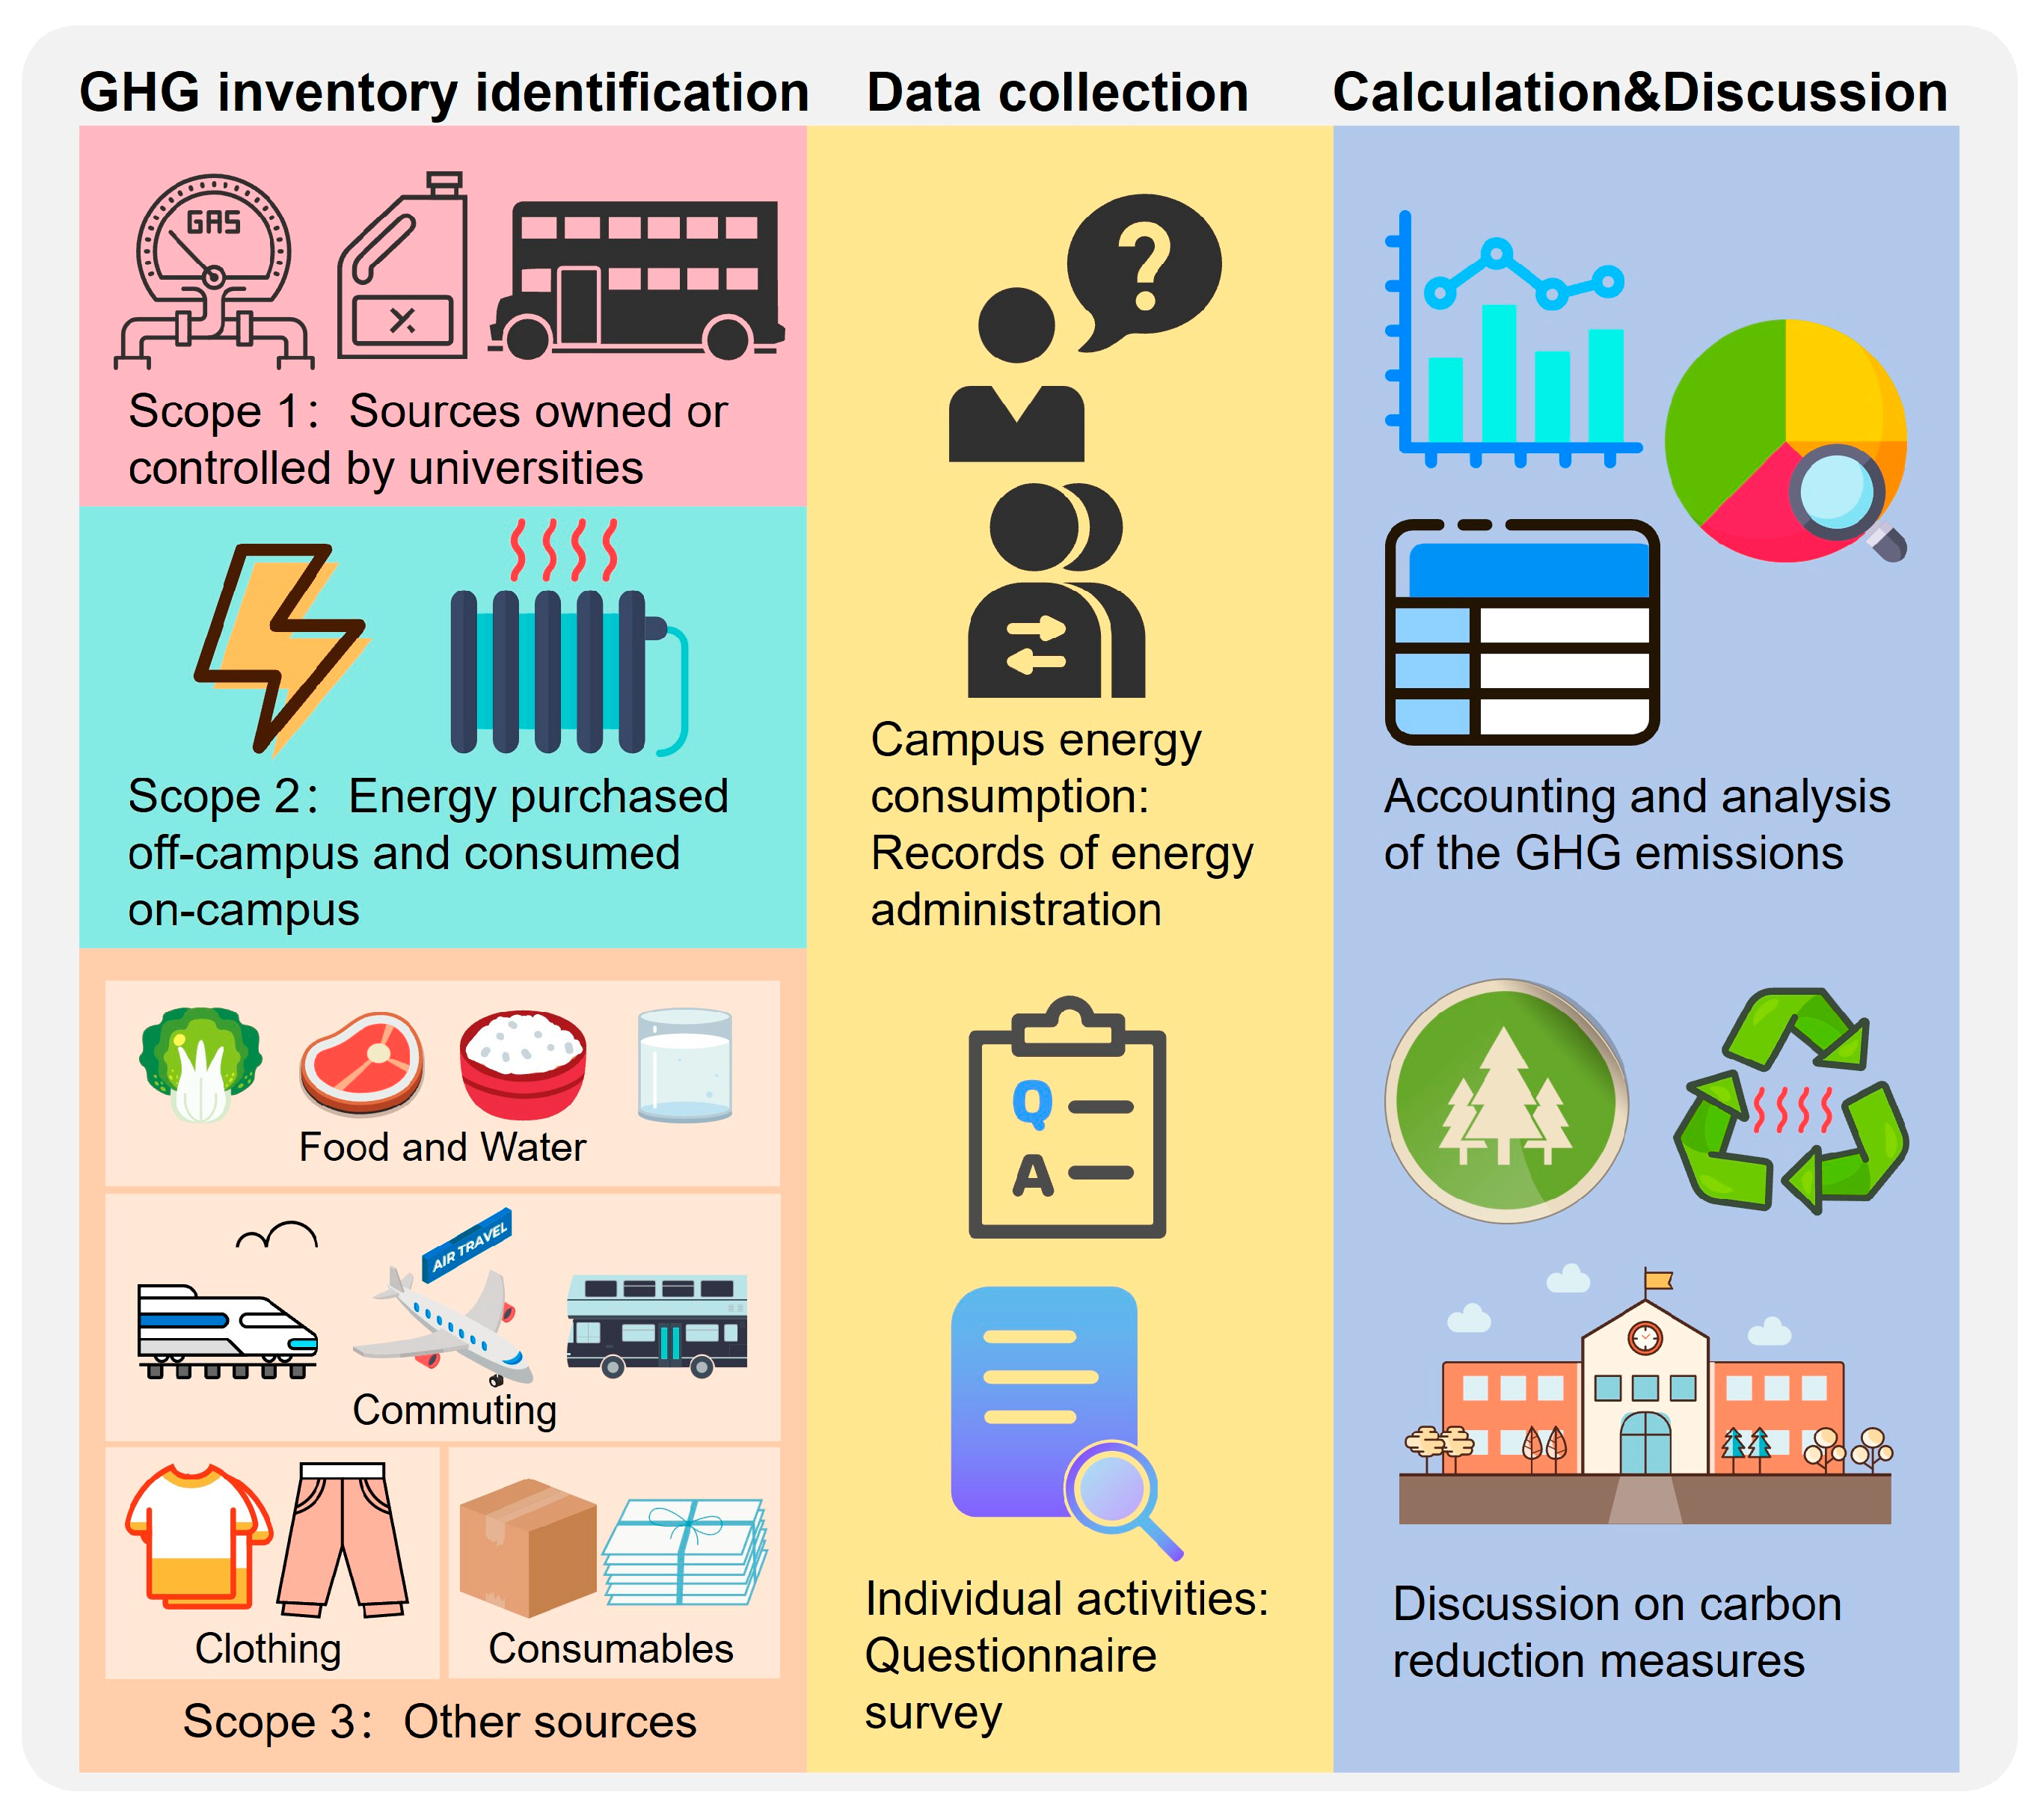
14]. This protocol encompasses three categories of GHG emissions: direct emissions owned by universities (Scope1), indirect emissions resulting from purchased energy (Scope2), and other indirect emissions (Scope3).
The specific calculation methods for carbon footprint include life cycle assessment (LCA), input-output analysis (IOA), and emission factor method [
10]. The LCA method accounts for GHG emissions across all life cycle stages without a defined boundary, making it suitable for calculating the carbon footprint of specific products [
15]. However, it is inapplicable to universities integrating multiple activities. The IOA method, based on economic input–output relationships, is designed for national or organizational GHG emission accounting [
16]. As educational institutions, universities do not have economic activities as the dominant part of campus operations, rendering the IOA method unsuitable for most universities. Moreover, IOA lacks precision in quantifying GHG emissions from specific campus activities, limiting its utility for targeted emission reduction strategies. The emission factor method constructs emission factors for activity data corresponding to different sources, using the product of activity data and factors as estimated GHG emissions [
17]. It suits diverse carbon footprint accounting needs, requires relatively minimal data collection, and can more accurately represent emissions from specific campus activities. Thus, it is optimal for university carbon footprint accounting.
Currently, China is the world’s leading consumer of energy and emitter of GHG emissions [
18]. In 2017, the education sector in China accounted for 2.5% of the country’s total GHG emissions, amounting to 246 million tons [
19]. As of 2020, Chinese universities consumed approximately 8.5% of the national total living consumption energy annually, with the per capita energy consumption of university students significantly exceeding the national average [
20]. In 2022, there were 3013 universities in China, enrolling a total of 46.55 million students [
21]. The substantial GHG emissions and energy consumption associated with university campuses and students present significant potential for emission reduction. Given this context, research into the carbon footprint of Chinese universities has gained significant importance for China’s pursuit of carbon neutrality and global sustainable development. However, research on university carbon footprints in China commenced relatively recently, and there exist common issues, such as a lack of standardization in research methodologies and challenges in data collection. For instance, Li et al.’s calculation of Tsinghua University’s carbon footprint deviates from international standards and methods, leading to the omission of many important emissions sources like heating during winter [
22].
To address these concerns, this paper introduces a research framework for assessing university carbon footprints and provides a case study of a university in Northeast China based on the GHG Protocol and emission factor methodology. The objective is to offer methodological guidance and case reference that can inform future research on university carbon footprints in China and beyond, thereby contributing to the achievement of global carbon neutrality and sustainable development.
5. Novelty and Limitations
This section summarizes the most innovative and generalizable ideas and practices proposed in this paper regarding the carbon footprint accounting method, carbon reduction analysis methodology, and case study, as well as their corresponding limitations.
5.1. Development of the Accounting Method
In existing GHG Protocol, activity data for Scope 3 emission sources such as food procurement should all be derived from the unified records of the organization [
12]. However, most universities currently struggle to achieve this. Responding to the real-life conditions of universities, this paper proposes that questionnaire surveys can be adopted to collect activity data for emission sources lacking unified records in Scope 3. This approach provides a feasible means for quantifying these emissions and can benefit numerous universities and other organizations with similar operational conditions.
This refinement takes into account the objective limitations of organizations such as universities, substantially enhancing the universality of both the accounting inventory and the methodology. However, enhanced universality often entails diminished precision. Thus, organizations capable of conducting accounting fully in accordance with the GHG Protocol should do so to enhance the accuracy of accounting results.
5.2. Methodology for Carbon Reduction Analysis
Previous studies have exhibited two tendencies. One is to discuss each emission item in the inventory in detail; however, most universities lack sufficient data to support such a comprehensive analysis, and discussions lacking adequate empirical grounding risk being superficial. For example, in the study by Mendoza-Flores et al., each emission item of the Cuajimalpa campus of the Autonomous Metropolitan University was discussed, but few practical carbon reduction measures were proposed [
34].
Another common approach is to develop campus carbon neutrality models based on existing national policies, technical means, and assumptions. For instance, Wang et al. established a 2060 carbon neutrality model for a medium-sized university campus in eastern China by integrating seven aspects, including power-sector decarbonization trends and rooftop photovoltaics [
19]. The limitation of this approach is that it can only provide idealized solutions and, to some extent, overlooks the role of the carbon footprint as an environmental indicator, as well as the university’s own efforts.
This paper adopts the approach of conducting targeted discussions on major GHG emission sources, instead of exhaustively analyzing every emission source in the inventory or constructing idealized scenarios. By jointly considering the magnitude of emissions and the university’s controllability over each emission source, the study concentrates on those with large emissions and the greatest mitigation potential, while omitting discussion of sources that are either minor contributors or unlikely to yield significant near-term reductions through university-level interventions.
This approach optimally utilizes the carbon footprint as an indicator for assessing carbon reduction, enhancing the feasibility of further analysis while ensuring the proposal of valuable carbon reduction strategies. However, theoretically, the deliberate omission of minor factors unavoidably reduces the accuracy and comprehensiveness of the discussion. Therefore, researchers must explicitly define the scope of negligible factors in line with the research objectives.
5.3. Proposal of the Energy Use Efficiency Indicator
The energy use efficiency proposed in the case study of this paper holds significant practical value and broad applicability.
The energy supply for campus facilities in the vast majority of universities operates under the same “0–1” mode as the university examined here: during operating hours, facilities remain at full load regardless of occupancy to guarantee that any potential user’s energy demand is met. In this case, managerial waste, rather than modest equipment-level savings, constitutes the main cause of energy waste. Energy use efficiency therefore serves as a straightforward metric for administrators to adjust the number of open facilities. For example, if the energy use efficiency of a certain venue during a specific period remains below 30%, the energy supply to up to 70% of the facilities can be shut down, yielding an immediate 70% reduction in both energy consumption and GHG emissions. This metric is not only applicable to university campuses, but can also be extended to other organizations.
In practice, due to various special needs, facilities and venues cannot be opened or closed solely based on energy occupancy rate. However, this metric provides administrators with a valuable upper-bound reference for energy savings achievable through management.
6. Conclusions
The carbon footprint has emerged as a foundational tool for organizations aiming to curtail greenhouse gas emissions and enhance sustainability. While general guidelines for carbon footprint calculation exist, they usually do not fully consider the specificity of organizations such as higher education institutions.
This paper develops a research framework for carbon footprint studies within universities and provides a case study of a university in Northeast China to extend available methodologies tested under real-life conditions, based on the GHG Protocol and emission factor methodology. Compared with previous studies, this study has refined and enhanced the methodology in several areas:
- (1)
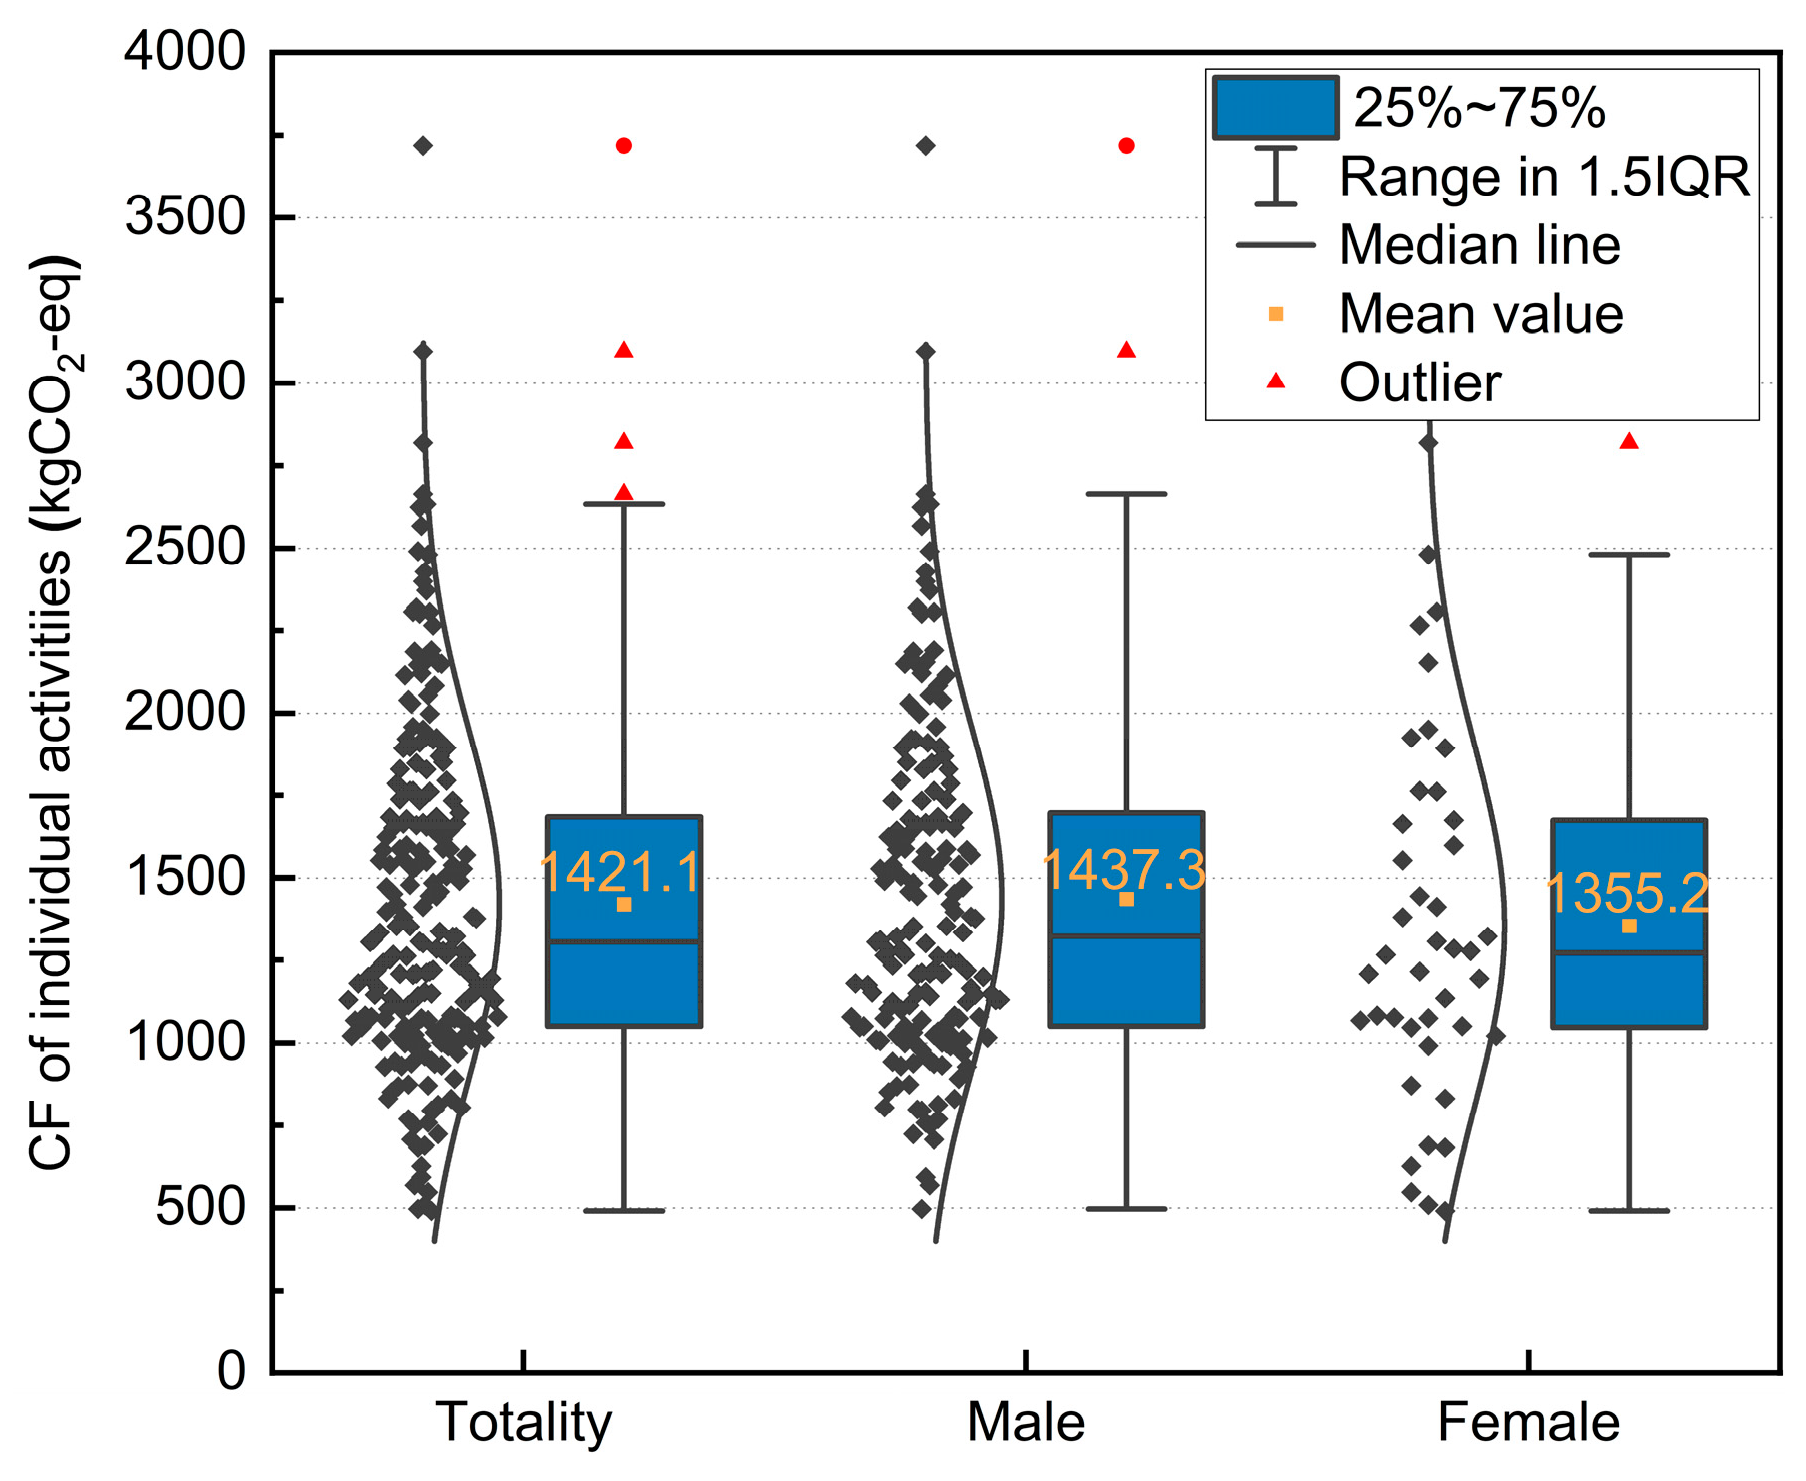
It introduced an investigation and analysis methodology from the perspectives of individual activities and campus energy consumption, streamlining and standardizing the research process for university contexts;
- (2)
It refined and developed a quantitative analysis method centered on the carbon footprint, highlighting its indicative role in carbon reduction efforts;
- (3)
It defined and computed building energy use efficiency metrics, revealing prevalent energy wastage in universities and emphasizing the imperative of energy management systems.
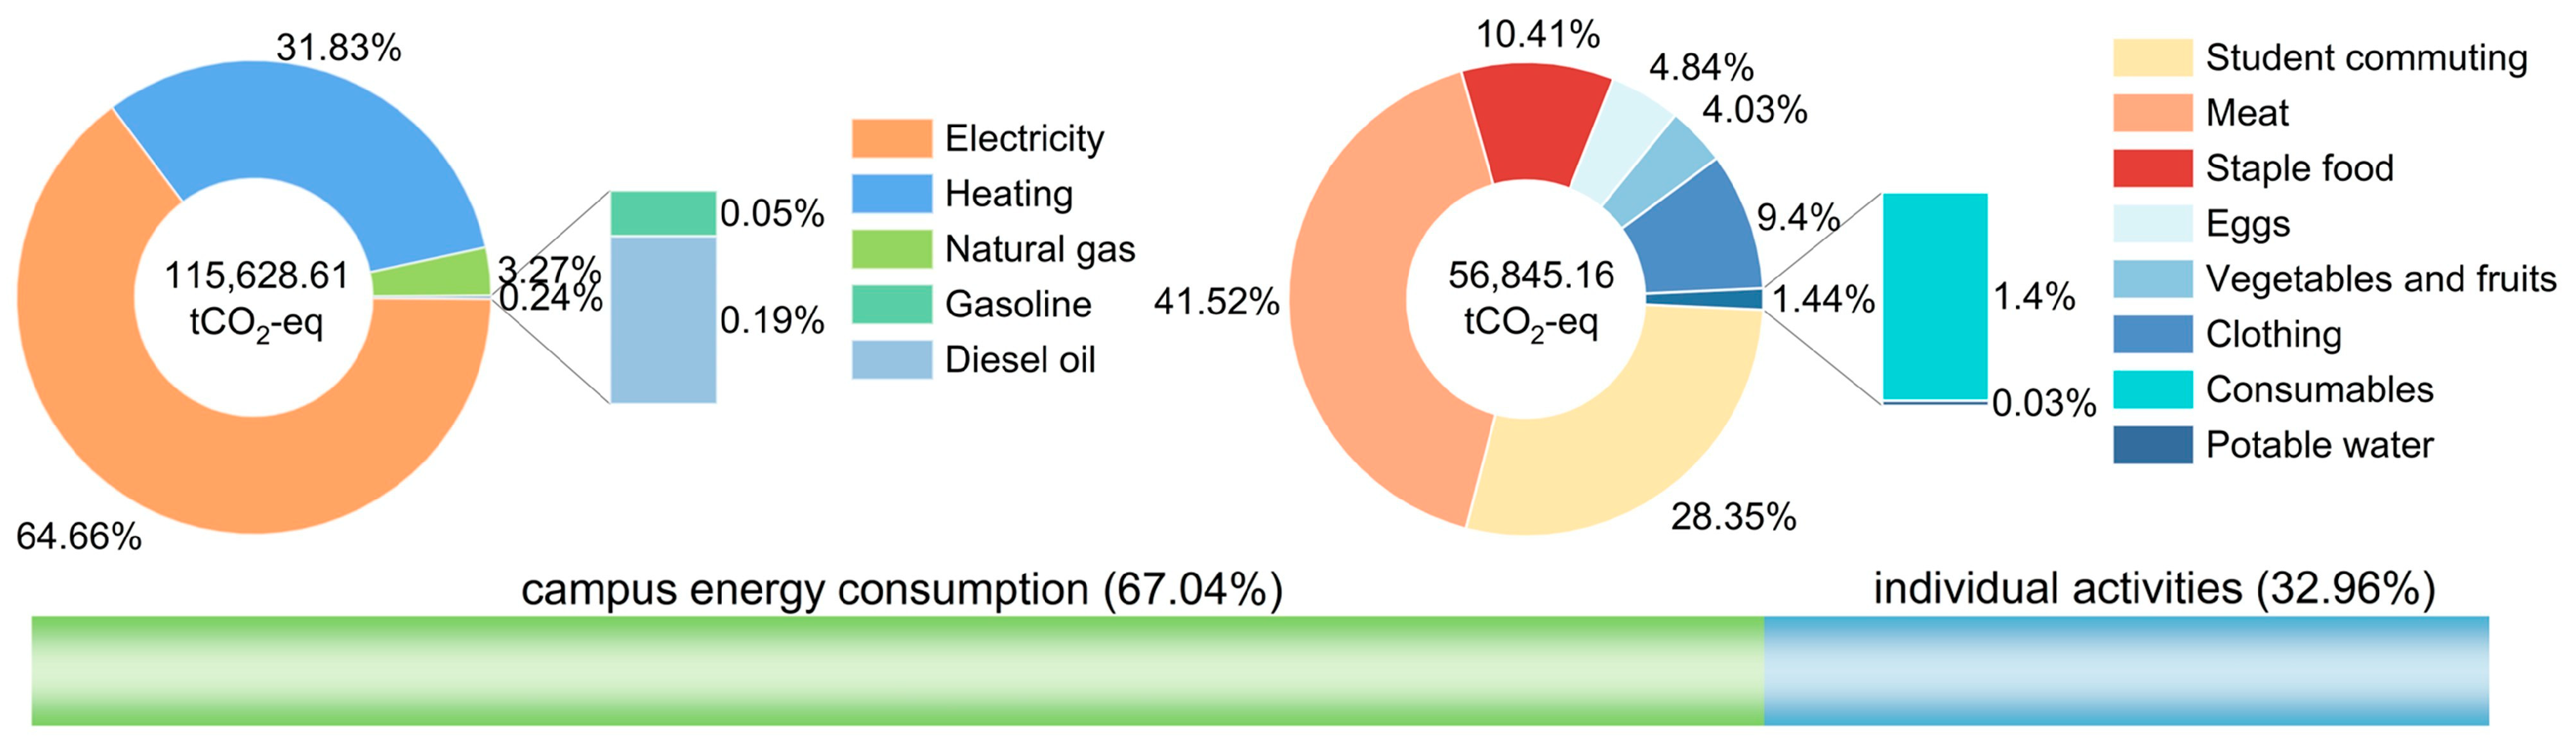
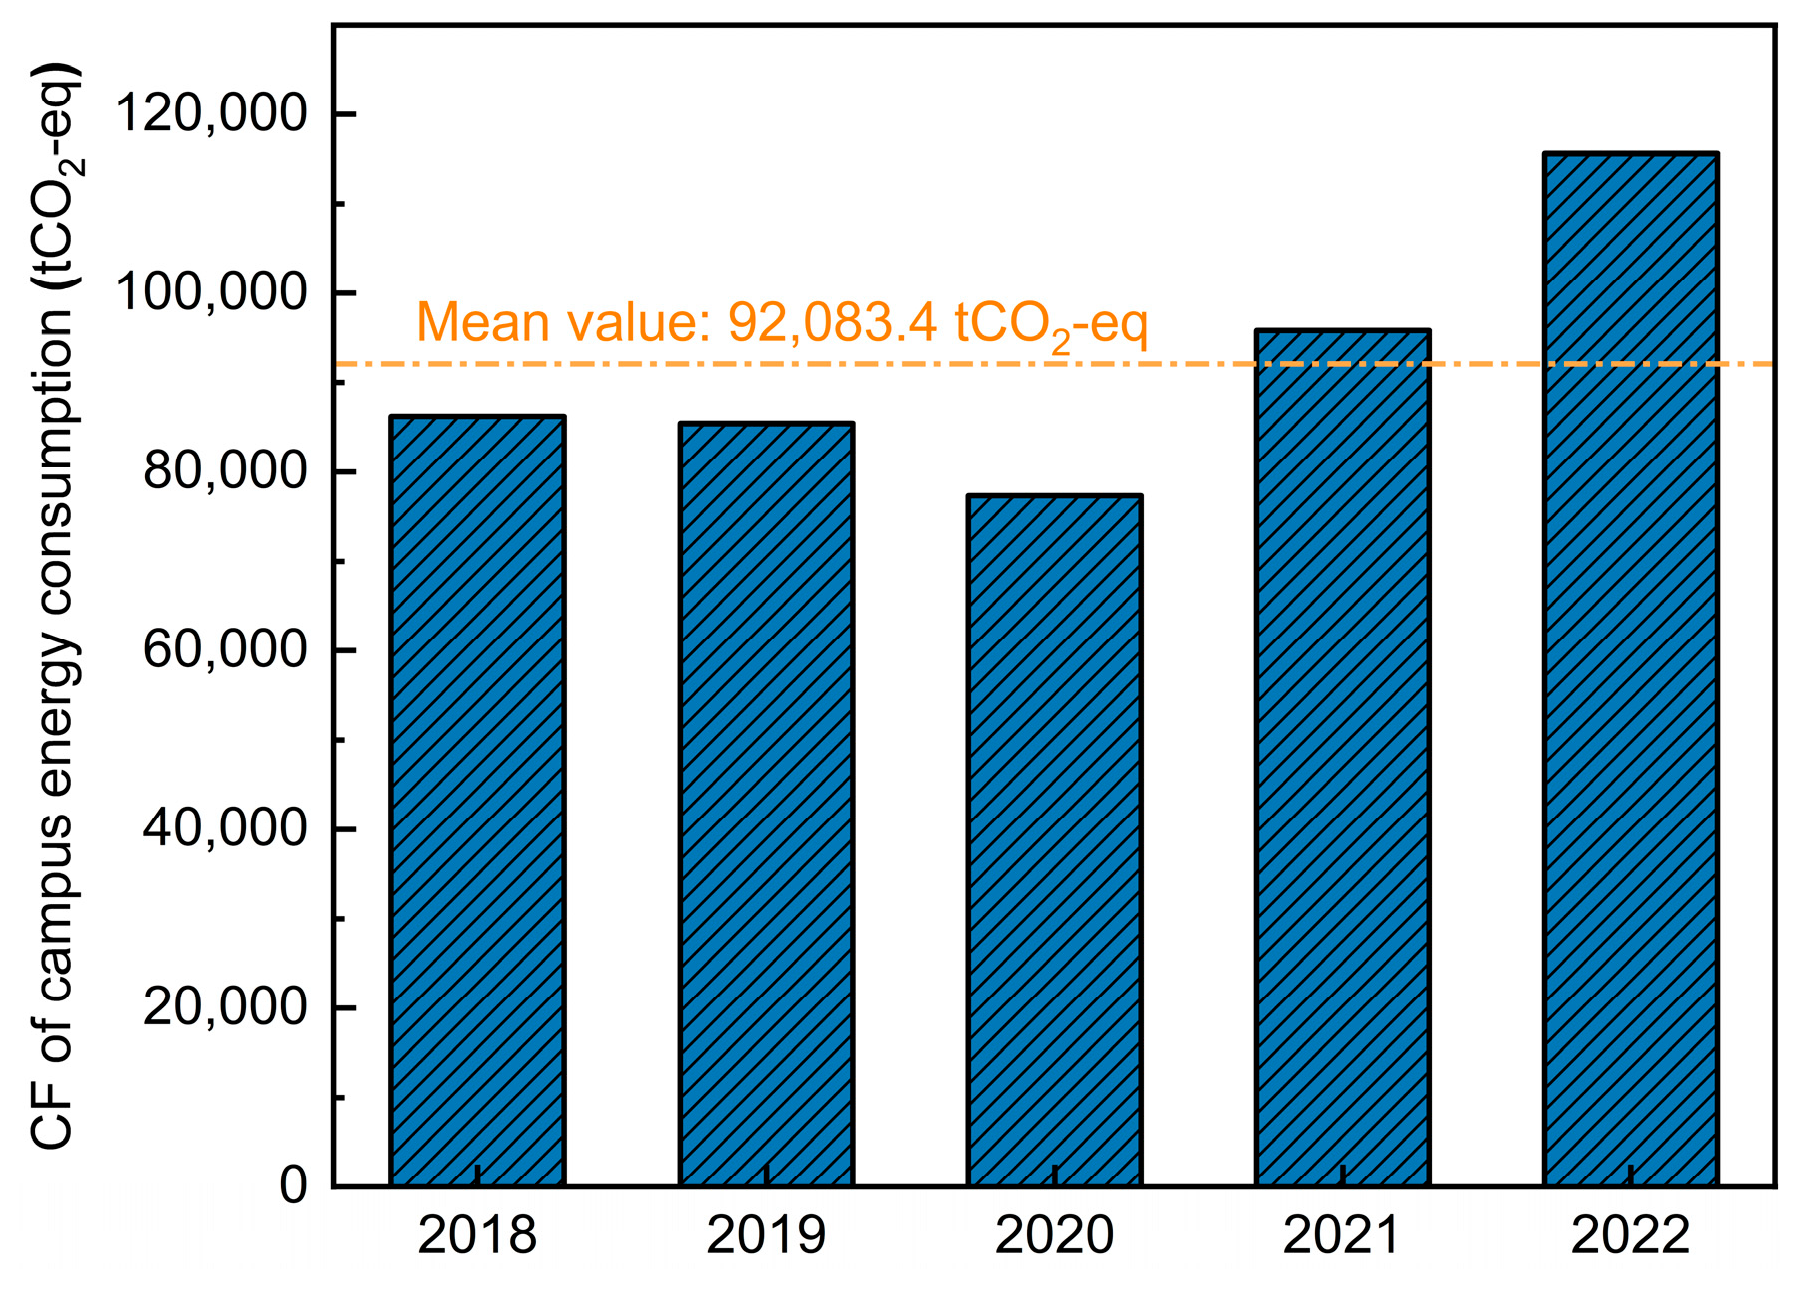
The results show that the annual carbon footprint of this university in 2022 is 172,473.77 t CO2-eq, with a carbon footprint generated by Scope 1, 2, and 3 constituting 2.35%, 64.69%, and 32.96% of the total carbon footprint, respectively. Electricity consumption was the largest contributor to GHG emissions (43.35%), followed by heating (21.34%) and dietary emissions (20.05%). Based on the quantitative carbon footprint results by activity type, targeted measures were proposed to diminish GHG emissions and improve sustainability, encompassing dietary structure modification, energy consumption monitoring management, passive energy-saving design, waste heat utilization, and the enhancement of carbon sinks. In particular, building energy management is a paramount way for carbon reduction within the university. This approach not only underpins carbon footprint research, but also highlights its practical implications in guiding sustainable development.
It must be acknowledged that, due to constraints in the survey duration and feasibility, certain limitations exist in the completeness of the accounting boundary and the adequacy of the sample size. Additionally, simplifications made in the analytical approach to enhance generalizability may slightly reduce the accuracy and comprehensiveness of the discussion. Despite these limitations, this paper offers a practical case for future research reference. Moreover, the research framework proposed herein can contribute to refining research methodologies and enhancing the research system for university carbon footprint studies. On the basis of this paper, future research needs to consider how to enhance the scientificity of research design and the comprehensiveness and accuracy of analysis.


