Article

Analysis of Energy Recovery Out of the Water Supply and Distribution Network of the Brussels Capital Region †

Departement ATM, Université Libre de Bruxelles, 1050 Bruxelles, Belgium
*
Author to whom correspondence should be addressed.
I have included in the article that it has been published in proceedings of the 8th IAHR Europe Congress, Lisbon, Portugal, 4–7 June 2024.
Energies 2025, 18(14), 3777; https://doi.org/10.3390/en18143777
Submission received: 11 June 2025 / Revised: 8 July 2025 / Accepted: 15 July 2025 / Published: 16 July 2025
(This article belongs to the Section B: Energy and Environment)

Abstract

Water Supply and Distribution Networks (WSDNs) offer underexplored potential for energy recovery. While many studies confirm their technical feasibility, few assess the long-term operational compatibility and economic viability of such solutions. This study evaluates the energy recovery potential of the Brussels Capital Region’s WSDN using four years (2019–2022) of operational data. Rather than focusing on available technologies, the analysis examines whether the real behavior of the network supports sustainable energy extraction. The approach includes network topology identification, theoretical power modeling, and detailed flow and pressure analysis. The Brussels system, composed of a Water Supply Network (WSN) and a Water Distribution Network (WDN), reveals strong disparities: the WSN offers localized opportunities for energy recovery, while the WDN presents significant operational constraints that limit economic viability. Our findings suggest that day-ahead electricity markets provide more suitable valorization pathways than flexibility markets. Most importantly, the study highlights the necessity of long-term behavioral analysis to avoid misleading conclusions based on short-term data and to support informed investment decisions in the urban water–energy nexus.

1. Introduction

Water Supply and Distribution Networks (WSDN) constitute critical infrastructure with the fundamental purpose of delivering reliable water access to consumers. Numerous studies address intermittent water supply networks [1,2,3,4,5,6], highlighting that water scarcity is a concrete reality often overlooked in Western countries, wherein continuous water service is taken for granted. Extensive research has identified different WSDN optimization strategies. The primary focus addresses enhancing service continuity [5] and, crucially, reducing water losses [7,8,9,10,11,12,13]. Given that water is vital and scarce, studies on problematic water loss are particularly numerous. Subsequently, research has expanded to energy optimization strategies, including minimizing energy consumption [14,15,16], optimizing valve placement [17,18,19], implementing energy recovery systems such as turbines [20,21] or pumps as turbines (PATs) [22,23,24,25,26], and managing pressure regimes [27,28,29].
Rather than pursuing comprehensive WSDN optimization for the Brussels Capital Region (BCR), this study aims to characterize the topology and operational behavior of Brussels’ WSDN to assess the feasibility and relevance of energy recovery solutions. This approach prioritizes understanding Brussels’ water network behavior before evaluating optimization solutions, recognizing that technical feasibility does not guarantee operational viability. Other countries [30,31,32,33] have performed different surveys on different types of water networks, such as stormwater, wastewater, and irrigation networks. Among these countries, Iran [21], Italy [22], and Spain [31,32,33] can be mentioned, for example.
The Belgian federal government seeks to determine whether BCR’s WSDN can be optimized for energy recovery in day-ahead markets [34] or electrical flexibility markets through aggregators [35,36]. From 2019 to 2022, comprehensive data encompassing flow rates, pressure measurements, reservoir water levels, and electricity prices were systematically collected from a Brussels water company named Vivaqua and analyzed.
The literature rarely addresses water networks through the dual perspective of Water Supply Networks (WSNs) and Water Distribution Networks (WDNs). Most research concentrates exclusively on WDN challenges [37,38,39] or WSN issues [24,40,41], creating conceptual confusion. In Brussels, both operations are managed by Vivaqua, a cooperative company owned by 19 Brussels municipalities, 4 Walloon municipalities, and the Walloon Brabant intermunicipal association.
WSNs transfer water volumes from production facilities to secondary storage locations, prioritizing volumetric flow rates and transfer capacity. Conversely, WDNs distribute water from storage facilities to end-users, focusing on maintaining terminal pressure within specified ranges. The fundamental WSDN structure comprises two interconnected components (Figure 1):
(i) Upstream Infrastructure: Water production facilities connected to treatment plants, with WSN transferring processed water to storage locations. (ii) Downstream Infrastructure: Distribution networks delivering water from storage facilities to end-users while maintaining adequate pressure. (iii) Storage facilities: Critical buffer zones enabling independent management of supply and distribution operations
Extensive research has investigated WSDN management strategies [42,43,44,45,46], typically focusing on individual components rather than integrated systems. Energy recovery research has expanded significantly, investigating turbine installations [20,47] and Pump-as-Turbine (PAT) technologies [48,49,50,51,52,53]. Operational implementation involves two primary strategies: load shifting to optimize pumping schedules according to electricity pricing, and energy recovery from pressure dissipation at strategic valve locations (Figure 2).
Energy recovery potential exists at flow control valves functioning as pressure reducing valves between sections operating at different pressure levels. The fundamental principle is exploiting locations where inlet pressure exceeds outlet pressure (Pinlet > Poutlet), creating pressure differentials ideal for deploying turbines or PAT systems (Figure 3).
Brussels’ primary water production facility is located in Tailfer, operating in conjunction with the Bois-de-Villers storage station (Figure 4). The system comprises two reservoirs at each location, with a significant elevation difference of 152 m between the facilities.
Daily operations involve pumping predetermined volumes from Tailfer to Bois-de-Villers, establishing Brussels’ WSN operational foundation (Figure 5).
Two critical characteristics merit emphasis: (i) Brussels’ WSN operates on a daily cycle structure, and (ii) beyond Tailfer-to-Bois-de-Villers pumping, the entire WSN relies on gravitational flow.
The WSN comprises four primary supply lines at distances of 42 km, 55 km, 65 km, and 91 km from Brussels (Figure 6). Despite Belgium’s flat reputation, elevation variations create different operational heights and pressure levels across supply lines, with interconnection points throughout the WSN.
Brussels’ topography presents significant WDN challenges, with elevations ranging from 12 to 140 m above sea level (Figure 7). These variations necessitate strategic network partitioning using hydraulic partitioning, operational partitioning, District Metered Areas (DMAs) [40,45,46], and Pressure Management Areas (PMAs) [28,29].
Brussels’ WDN operates as a multi-tiered system with pressure differentials up to 100 m height equivalent, creating significant energy recovery opportunities at pressure-reducing valve (PRV) connections. The infrastructure is organized into distinct supply zones (Figure 8), each receiving water from dedicated supply points with zone-specific pressure regimes.
The comprehensive Process and Instrumentation Diagram (P&ID) provides a detailed system overview (Figure 9). The network originates from four color-coded production stations, with the purple line representing the primary Tailfer-Bois-de-Villers connection. Water transport through the WSN relies primarily on gravitational flow to Brussels-adjacent reservoirs where WDN operations begin.

2. Materials and Methods

The data analyzed in this study originate directly from Vivaqua, the Brussels water utility company. These datasets comprise recordings from sensors deployed throughout Vivaqua’s network infrastructure. The raw data were transmitted in CSV table format to Pépite, a Liège-based company specializing in data analysis solutions.
The CSV tables were integrated into Pépite’s proprietary software suite, Data Maestro; https://www.pepite.com/datamaestro.html (accessed on 14 July 2025) (Figure 10).
The graphical interface and mathematical function creation capabilities of this platform enabled visualization of raw data parameters, including pressure measurements, flow rates, water levels, and electricity prices. This platform allows for easy management of billions of data points, as demonstrated in this study with 85 sensors collecting measurements every second over a 4-year period, generating approximately 10.7 billion data points. Power curves were generated by combining these datasets through mathematical operations. These datasets represent 100% of the material available for this study.
It should be noted that error calculations and uncertainty assessments are not indicated in this paper. The measurements constitute direct real-time recordings from professional network sensors without additional processing or validation layers, after discussions related to the accuracy of all sensors and verifications that these accuracies were all within ±2% FS. All Vivaqua sensors have been operational for years, and confidence is placed in Vivaqua’s data quality based on their extensive experience with their sensor network infrastructure.
The methodology employed a systematic approach to energy recovery potential assessment. Energy recovery opportunities within the Water Supply Network (WSN) were investigated first. Subsequently, the same analytical framework was applied to the Water Distribution Network (WDN). When significant operational specificities were identified during the analysis, these findings were documented and discussed in detail to provide a comprehensive understanding of the system’s energy recovery potential.
Following established methodologies for energy optimization processes in WSDN applications [21,54,55], our analysis focused on identifying pressure release valves (PRV) with significant pressure differentials ΔP [m of water height] and flow rates Q [m3/s]. Eight valves were identified as viable energy recovery candidates: five located within the WSN and three within the WDN. These target valves are highlighted with red circles in the P&ID diagram (Figure 9).
Energy recovery potential calculations employ the fundamental hydroelectric power equation:
P = ρ × Q × μ × g × h [kW]
where:
  • ρ: water density ≈ 1000 [kg/m3]
  • Q: water flow rate [m3/s]
  • μ: system efficiency [-]
  • g: gravitational acceleration = 9.8 [m·s−2]
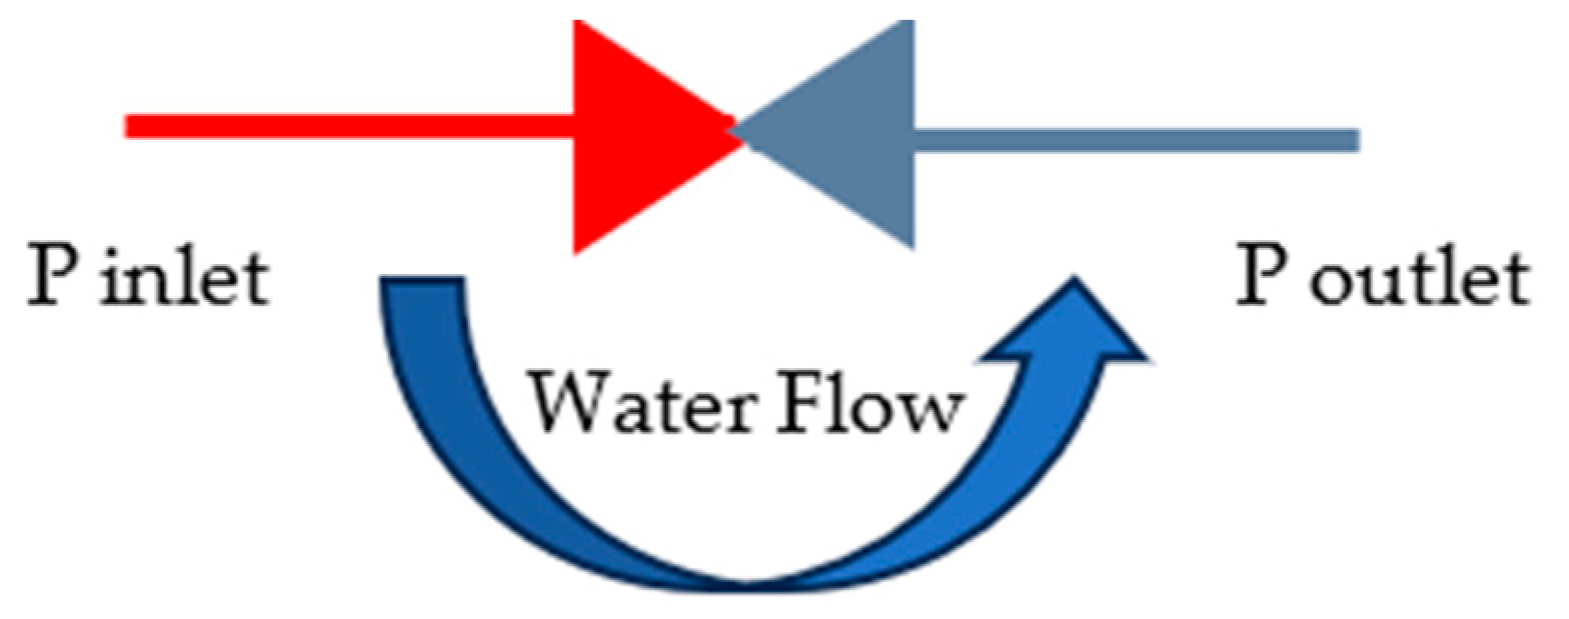
  • h: water height or pressure difference ΔP [m of water height]
Using this equation with recorded operational data from the BCR WSDN operator, power curves were generated for representative WSN locations (Mazy and Plancenoit substations) and WDN locations (Rhode and Boitsfort substations). Efficiency calculations utilized a conservative value of μ = 0.7 for all assessments.

3. Results

3.1. Energy Recovery from the WSN

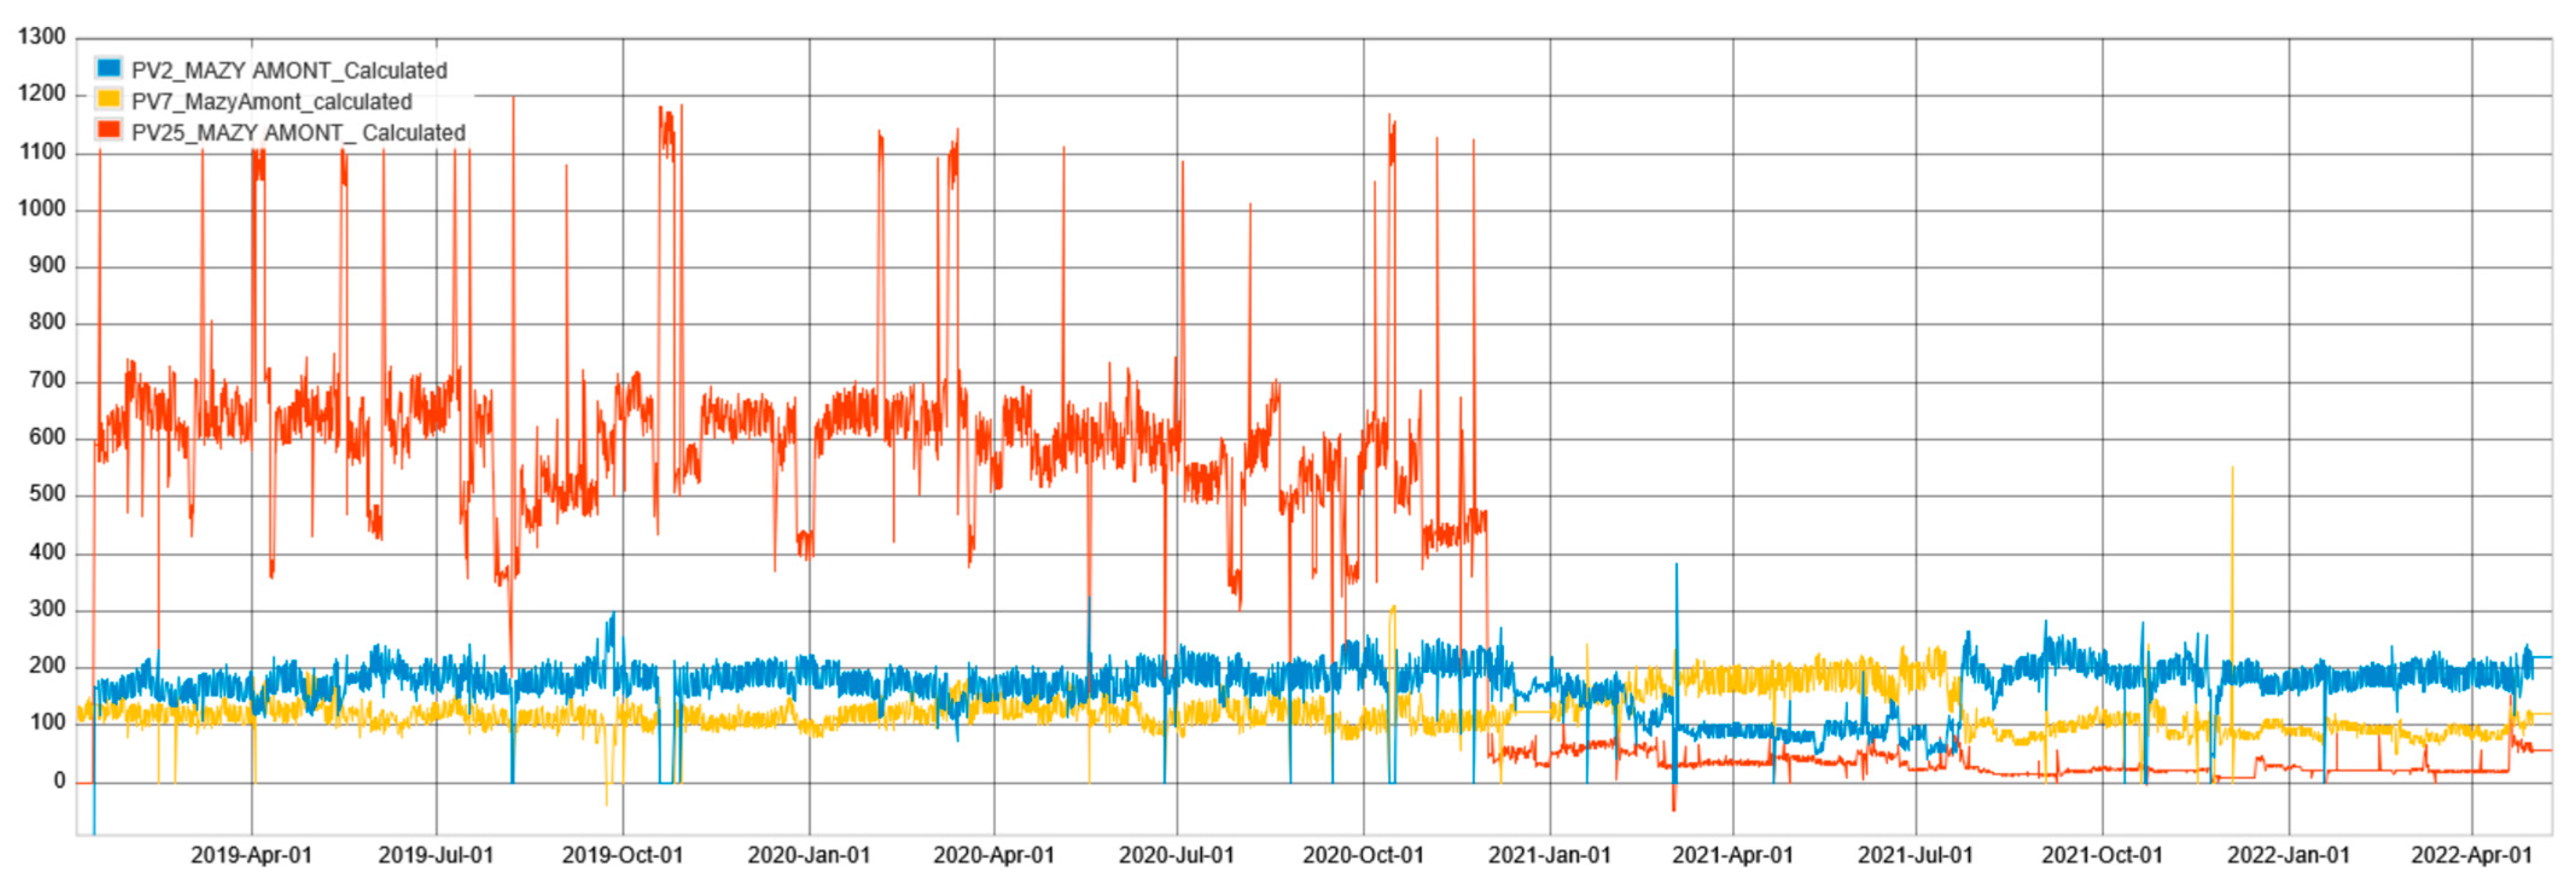
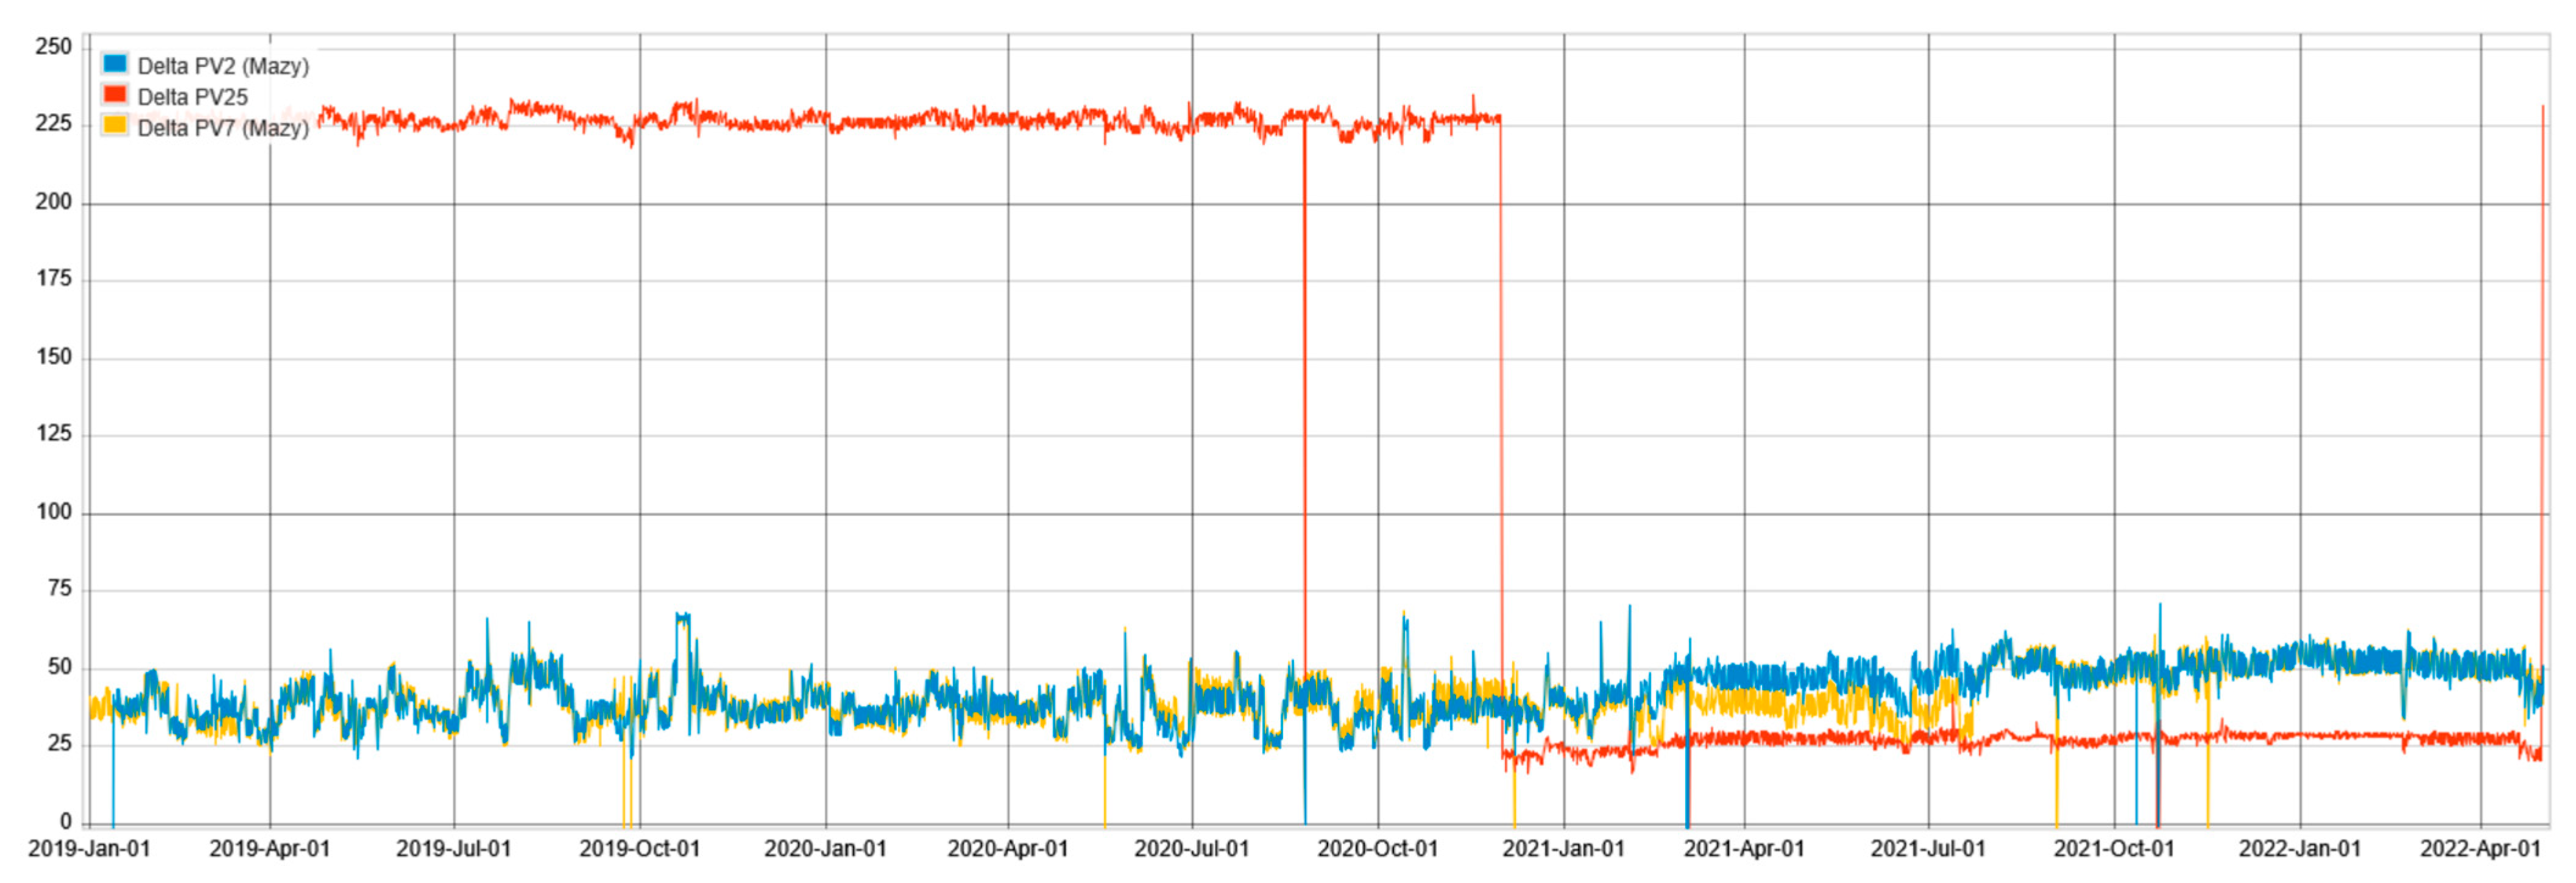
WSN: Mazy Substation

Based on Equation (1), estimated power recovery potentials for the Mazy substation are presented in Figure 11.
The analysis revealed distinct operational patterns among the three valves. Valves V2 and V7 demonstrate consistent power curves throughout the four-year period, with average values of ⟨PV2 = 166 kW and ⟨PV7 = 123 kW, respectively. Conversely, valve V25 exhibits highly irregular behavior characterized by significant temporal variations: from 2019 to late 2020, ⟨PV25 = 650 kW; from late 2020 to late 2022, ⟨PV25 = 50 kW. These variations correlate directly with pressure differential fluctuations at valve V25 (Figure 12).
Pressure differential analysis confirms the stability of valves V2 and V7, both maintaining average ΔP values of approximately 41 m throughout the four-year period. In contrast, valve V25 experiences ΔP oscillations between 225 m and 25 m. The correlation between ΔP variation curves (Figure 11) and power curves (Figure 10) demonstrates that operational differences between V2/V7 and V25 stem primarily from pressure differential variations.
The significant pressure variations observed at V25 result from operational works conducted by Vivaqua, not at the Mazy station itself, but downstream within the network. To ensure adequate water supply to Brussels reservoirs during these downstream operations, the Mazy station undergoes operational modifications by adjusting the station’s valve nodes. These adjustments directly cause the substantial pressure fluctuations observed at valve V25. According to Vivaqua, the Mazy station offers configuration flexibility through its valve system, enabling Vivaqua to undertake maintenance works at various network locations while maintaining water supply to reservoirs. Consequently, the Mazy station is frequently used by Vivaqua for large-scale operations, making pressure variations at Mazy expected and inherent to the system. The station was specifically designed to accommodate these operational requirements and associated pressure fluctuations. It should be noted that these operational modifications at the Mazy station have direct consequences on the downstream WDN, which will be detailed later in this article.

3.2. Operational Implications and Investment Viability

WSN behavioral analysis indicates viable energy recovery potential at valves V2 and V7, while energy recovery at valve V25 presents significant challenges due to operational instability. This study started in 2019 when V25 appeared to offer 650 kW recovery potential. However, subsequent WSN operational changes reduced this potential to 50 kW, highlighting the critical importance of network behavior analysis in energy recovery feasibility assessments.
This operational instability represents a fundamental challenge for energy recovery, investment, sustainability, and profitability. The case study demonstrates that WSN operational management exhibits considerable temporal variability, creating investment risks, particularly evident in valve V25’s performance profile. Such instability complicates long-term energy recovery investments in affected network segments.

3.3. Economic Valuation and Market Analysis

Beyond technical feasibility, energy recovery economic value requires assessment through appropriate market mechanisms. Given the daily operational nature of WSDN processes, the day-ahead electricity market provides the most suitable valorization platform. The Belgian day-ahead market price evolution over the study period is shown in Figure 13.
The average day-ahead market price during 2019–2022 was EUR 72.6/MWh. For annual energy calculations (365 days × 24 h = 8760 h), the stable valves yield significant energy production over six years: EV2 = 166 × 8760 × 6 = 8725 MWh and EV7 = 123 × 8760 × 6 = 6464 MWh.
Based on the average day-ahead price of EUR 72.6/MWh, potential financial returns are:
  • GV2 = 8725 × 72.6 = EUR 633,435 over four years (EUR 158,358/year average)
  • GV7 = 6464 × 98.4 = EUR 469,286 over four years (EUR 117,321 /year average)
The combined potential revenue for the Mazy station totals GV2 + GV7 = EUR 1,102,721 over four years. This financial assessment considers only stable operational processes, excluding valve V25 due to its operational unpredictability.

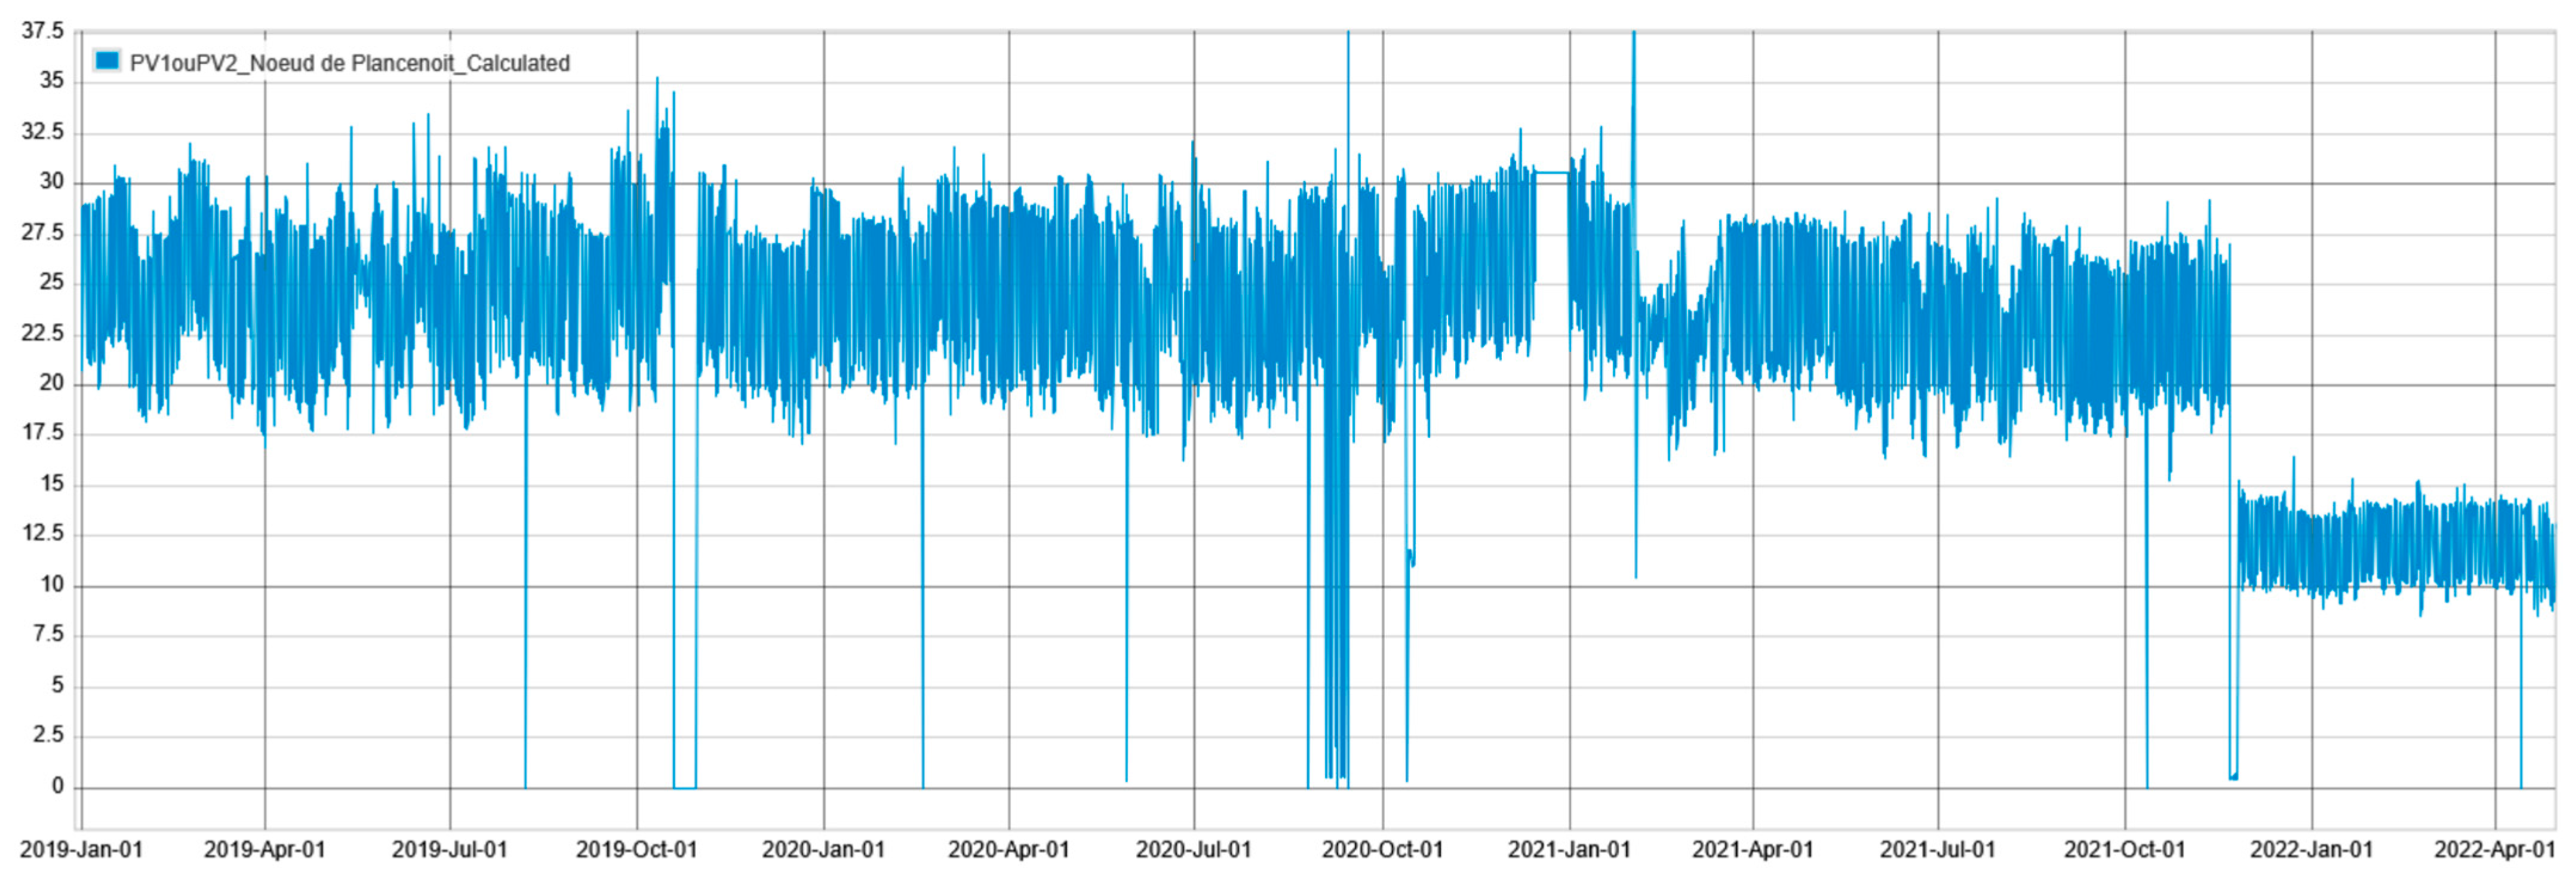
3.3.1. WSN: Plancenoit Substation

Based on Equation (1), estimated power recovery potentials for the Plancenoit substation are presented in Figure 14.
The power recovery profile at the Plancenoit substation exhibits operational variability similar to other WSN components. The system typically maintains average power recovery around 25 kW, though operational requirements occasionally reduce output to 12.5 kW, demonstrating the influence of network management decisions on energy recovery potential.
For quantitative assessment, the period from early 2019 to late 2021 (three years) maintained relatively stable conditions with an average power recovery of 25 kW. This corresponds to energy production of E = 25 × 8760 × 3 = 657,000 kWh = 657 MWh. Using the average day-ahead market price of EUR 58.4/MWh during 2019–2021, this energy production could generate 657 × 58.4 = EUR 38,368, representing an average annual revenue of EUR 12,789/year.

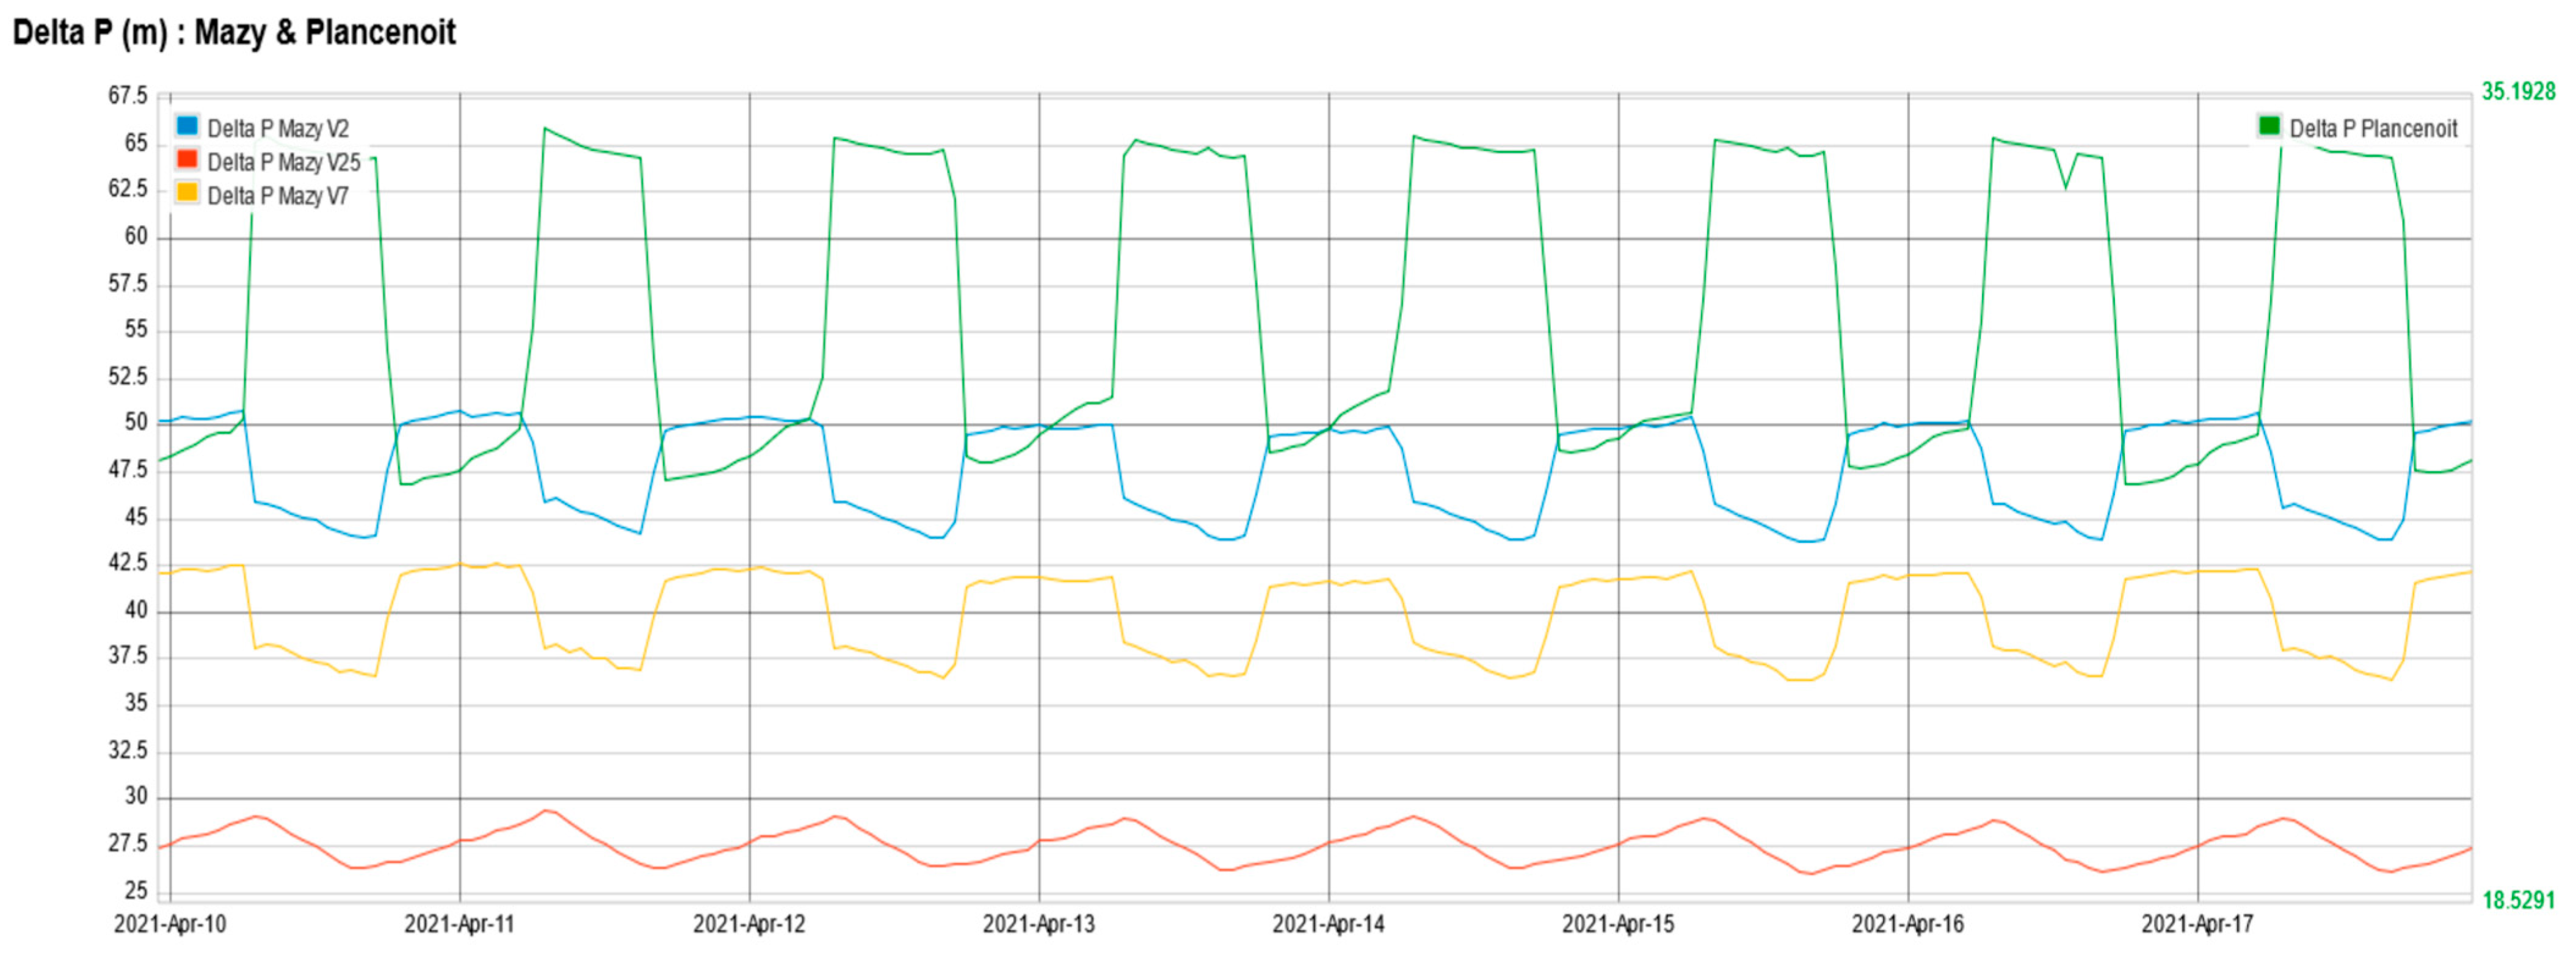
3.3.2. Hydraulic Interdependencies: Mazy–Plancenoit System Analysis

Beyond individual valve performance, the WSN exhibits complex hydraulic interdependencies between stations. While the Mazy station’s different topologies create abrupt pressure changes (as observed at valve V25), subtle daily pressure variations occur throughout the WSN. These interactions are evident in the ΔP variations at PRVs across both the Mazy station (valves V2, V7, and V25) and the Plancenoit station (valves V1 and V2), as shown in Figure 15.
The data reveal a systematic inverse correlation between the two stations: ΔP increases at Mazy valves (V2, V7, and V25) correspond to simultaneous ΔP decreases at Plancenoit valves (V1 and V2), with this pattern reversing cyclically. This phenomenon indicates a common operational factor affecting both stations simultaneously but in opposite directions.
Analysis of the P&ID (Figure 9) reveals that the Callois storage station occupies a strategic position downstream of Mazy valves while simultaneously upstream of Plancenoit valves. This hydraulic configuration suggests that operational changes at Callois station may be the primary cause of the observed inverse pressure variations between the Mazy and Plancenoit substations. Further investigation into Callois station operations and their network-wide impacts is needed.

3.3.3. Callois Substation

The Callois station has four tanks collecting water from the WSN and transferring it to the WDN. However, the P&ID (Figure 9) did not represent the station’s specificities. A technical drawing of the Callois station (Figure 16) is needed to explain its operation.
The Callois station has two separated reservoirs: (i) one south (left) and (ii) one north (right). Each reservoir is an assembly of two separate tanks stacked vertically: C1 and C2 for the south and C3 and C4 for the north. The water company operates the Callois station with a specific routine.
Each reservoir (south and north) works identically: (i) Water from Mazy (WSN) goes to the lower reservoir (C1 and C3) and (ii) water from the higher reservoir (C2 and C4) goes to the WDN. When this cycle completes, lower reservoirs (C1 and C3) are full and higher reservoirs (C2 and C4) are empty. The valve node then reverses reservoir selection: (iii) Water from Mazy goes to the higher reservoir (C2 and C4) and (iv) water from the lower reservoir (C1 and C3) goes to the WDN. This routine is performed daily. Obviously, Vivaqua runs this cycle with certain security margins, ensuring that the reservoir’s water levels are never lower than 30% of the total reservoir capacity.
The switching between higher and lower reservoirs creates height fluctuations that affect the upstream WSN. This operational behavior cannot be changed, as the water company will not modify its routine or invest in new reservoirs for energy recovery optimization.
The daily operation of the Callois station directly influences ΔP in Mazy and Plancenoit. ΔP varies by 15% for V2 and 18% for V7 in Mazy and 40% for V1 and V2 in Plancenoit. This WSN behavior is specific to the Brussels network. Other WSDNs worldwide may not face similar situations from two-stage reservoirs. With constantly changing upstream and downstream pressures, turbine solutions might not be the most profitable for energy recovery. Therefore, PaT solutions may be preferred.
This long-term study provides a clear picture of real-world water network operation. The important point is not to discuss whether energy recovery is theoretically possible, but to express how network behavior and operational reality relate to energy recovery engineering theory.

3.4. Energy Recovery from the WDN

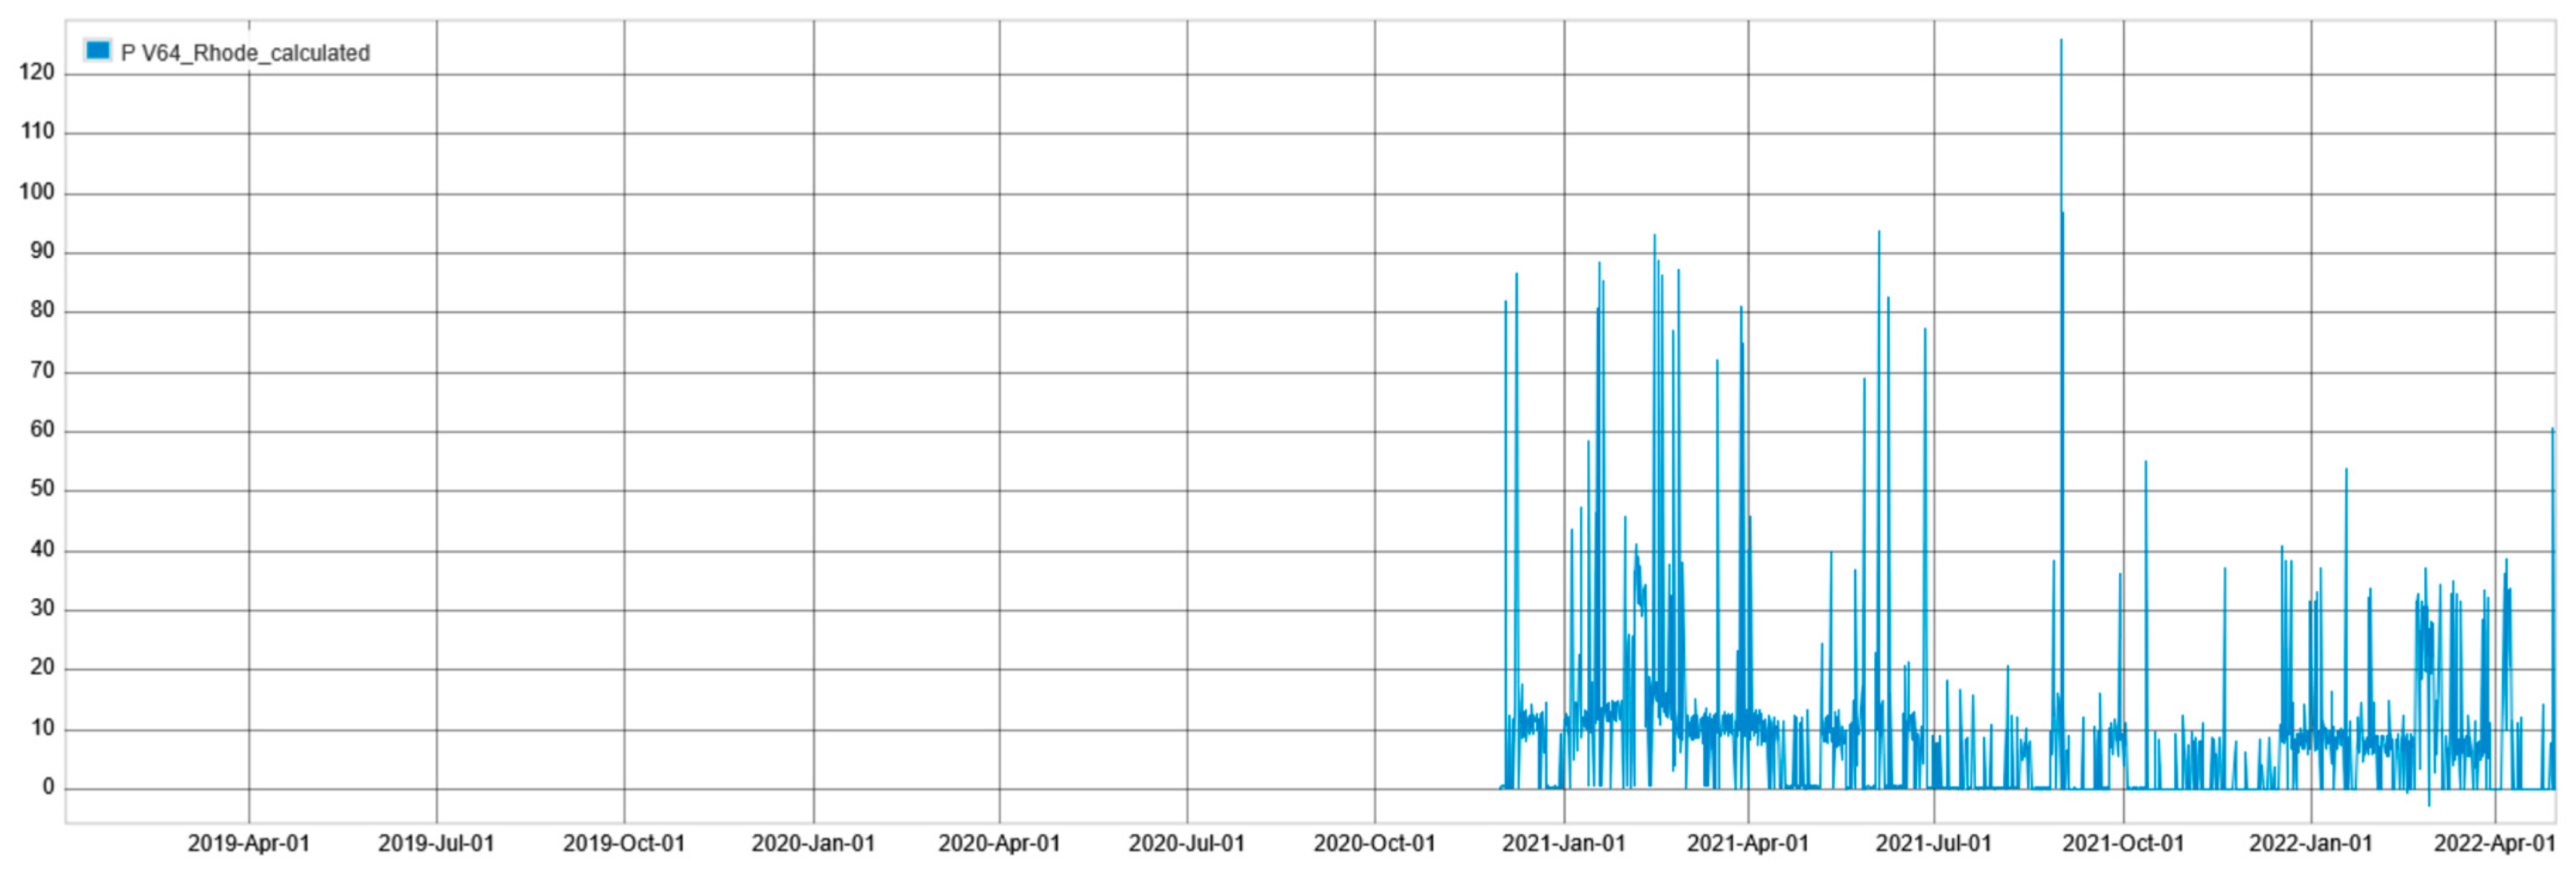
3.4.1. Rhode Substation

The first WDN substation with power recovery potential is Rhode. The power recovery curve at valve V64 of the Rhode substation is shown (Figure 17).
The power curve is highly irregular. From January 2019 to the end of December 2020, no flow was going through V64, therefor, energy recovery was impossible. PV64 oscillates between 0 kW minimum and 90 kW maximum. These power variations result from flow variations.

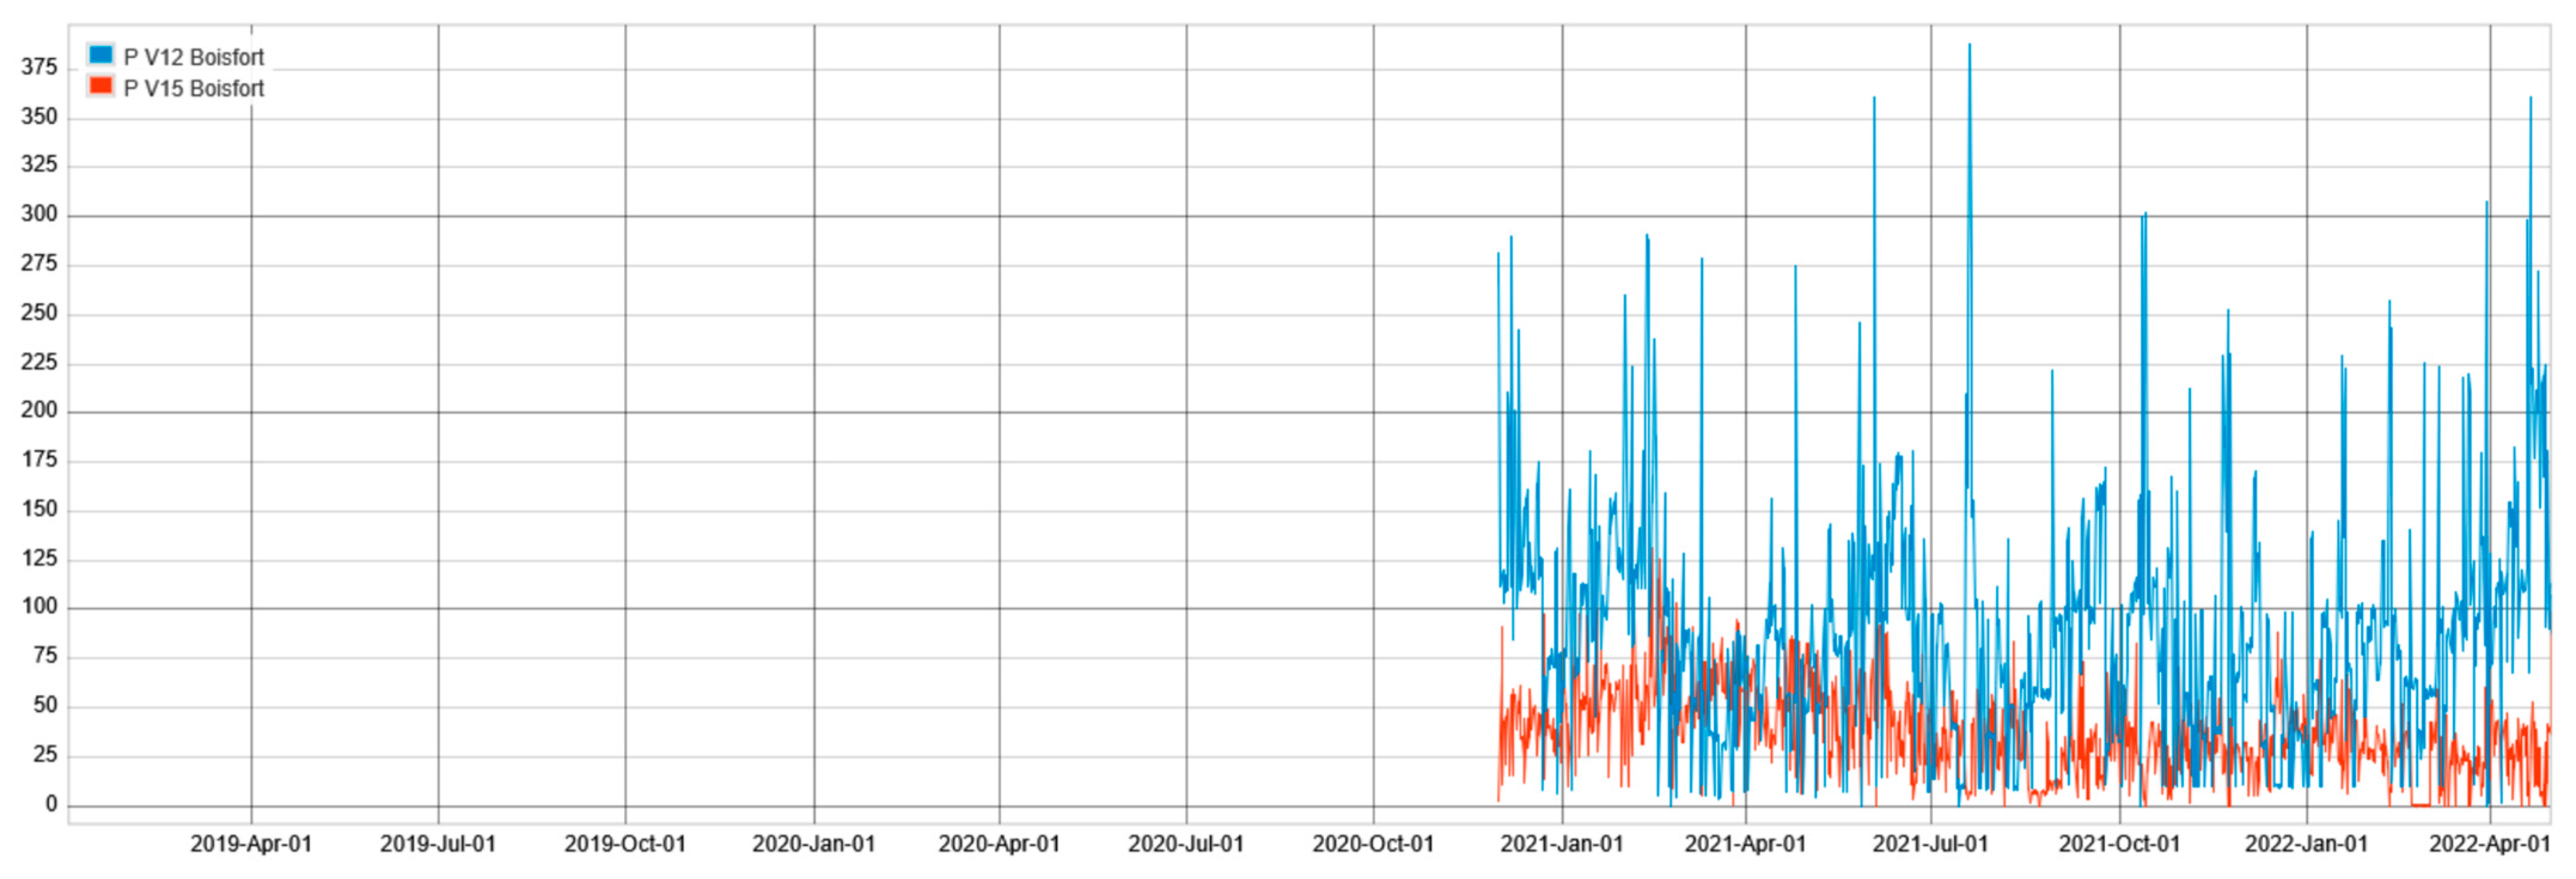
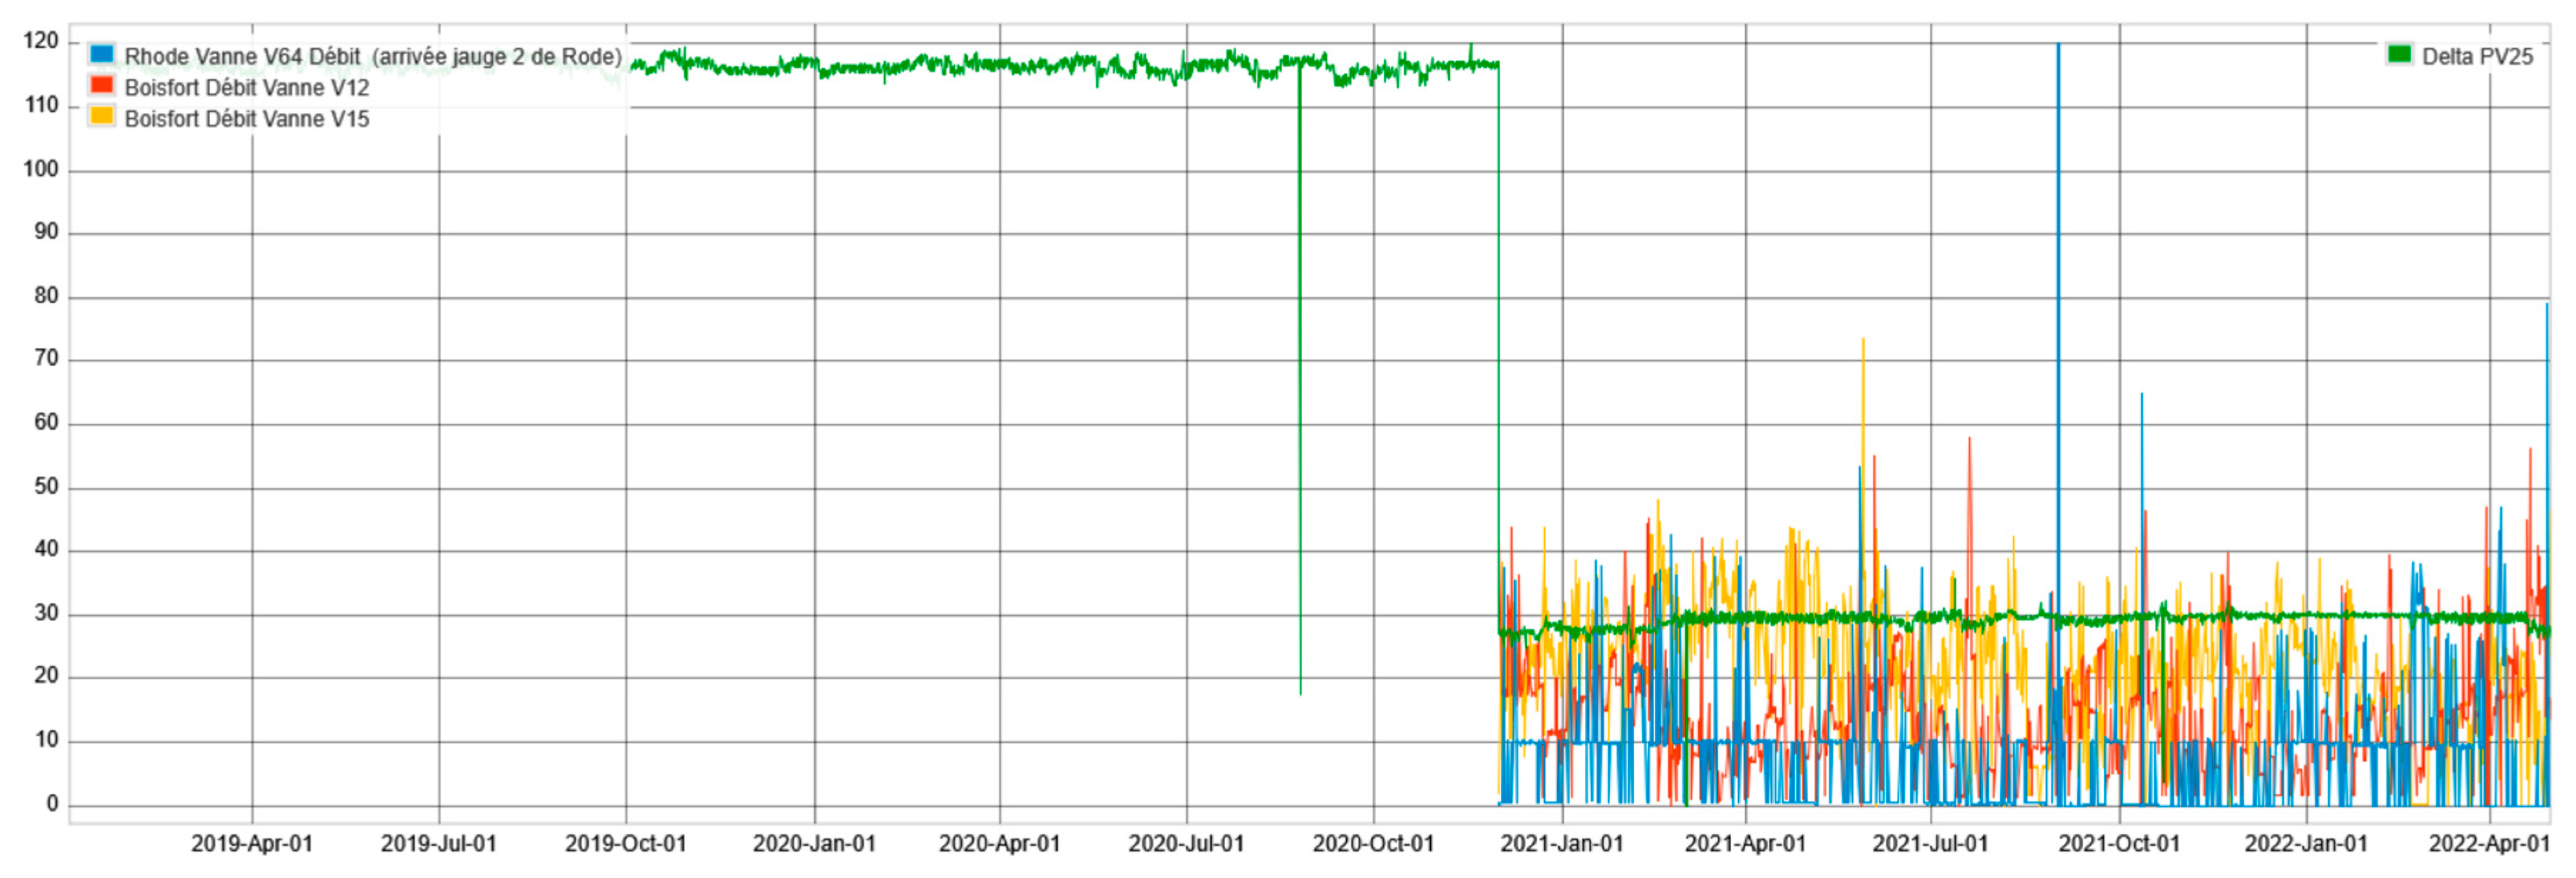
3.4.2. Boistfort Substation

The second WDN substation with power recovery potential is Boistfort. The power recovery curves at valves V12 and V15 are presented (Figure 18).
Similar irregular power curve patterns were observed at this location of the WDN. The power curve is highly irregular. From January 2019 to the end of December 2020, no flow was going through V12 and V15; therefore, energy recovery was impossible. These observations indicate systematic factors affecting overall WDN behavior. The power recovery oscillations for V12 and V15 are characterized as follows:
P V12 min = 2 kW; P V12 max = 360 kW; <P V12> = 87 kW P V15 min = 0 kW; P V15 max = 125 kW; <P V15> = 34 kW
Consistent with the Rhode station findings, power variations at Boistfort are primarily attributed to flow fluctuations. But most important is that, as for V64 in Rhode, there was no flow going through valves V12 and V15 in Boistfort, at the exact same time as in Rhode: from January 2019 to the end of December 2020. Therefore, there was something happening in the network that had a direct impact on those WDN stations.
Both WDN stations experience significant flow variations, which is characteristic of distribution network operations. However, research demonstrates that cross-flow turbine technologies are well-suited to accommodate such variable flow conditions. Therefore, based on this preliminary analysis, investment in a cross-flow turbine-based energy recovery solution appears advisable for the Brussels WDN, given the relatively stable pressure conditions and the adaptability of cross-flow turbines to flow variations.

3.4.3. Mutual Influence from Pressure Variation in V25 in Mazy on the WDN

Records from the Rhode and Boistfort stations indicate that, from 2019 to the end of 2020, energy recovery was not possible. A comparison was conducted between the flow variations at Rhode (V64) and Boistfort (V12 and V15) and the pressure variations (ΔP) at V25 in Mazy (Figure 19). The color code used in Figure 18 corresponds to the following: flows in Boistfort and Rhode are represented by Q64, Q12, and Q15, while the pressure variation in Mazy is represented by ΔP25.
As previously explained, Vivaqua employs a specific valve topology at the Mazy station to conduct large-scale network operations. This topology directly affects valve V25, creating very high ΔP at this location. The P&ID (Figure 9) reveals that V25 of Mazy on WSN is directly connected to V64, V12, and V15 of the WDN, establishing a critical operational dependency. Consequently, when the Mazy station topology is reconfigured for maintenance purposes, it results in flow cutoff at valves V12, V15, and V64 of the WDN, demonstrating how WSN operations directly control WDN functionality.
The operational data from 2019 to 2022 confirms this interdependency. The Water Supply Network (WSN) at the V25 location in Mazy exhibited high instability, characterized by significant ΔP variations. This instability directly correlates with flow intermittency observed at Boistfort and Rhode (WDN), confirming the cascading effect of WSN operations on WDN performance.
This long-term analysis reveals critical implications for energy recovery strategies. If this study had been conducted exclusively during 2021 and 2022,when ΔP was low at V25 and flows were operational in V12, V15, and V64,it would have suggested that cross-flow turbines for energy recovery were viable. However, the extended study period demonstrates that such conclusions would be fundamentally incorrect. Since Vivaqua will continue utilizing the Mazy station’s flexible topology for essential maintenance and large-scale infrastructure works, any energy recovery investment in the WDN becomes inadvisable due to operational unpredictability.
This case study illustrates a key consideration in WSDN optimization: the dynamic operational nature of water networks must be carefully evaluated when assessing the viability of energy recovery solutions.
For the BCR WDN specifically, the three most promising valves for energy recovery (V12, V15, and V64) are entirely dependent on V25’s behavior in the WSN—a component that serves as an operational control point. Therefore, technical feasibility alone cannot justify energy recovery investments when operational requirements create inherent system instability.

4. Discussion

This four-year analysis of the Brussels water network reveals a significant gap between theoretical energy recovery potential and real operational constraints. At valve V25, an initial estimated potential of 650 kW was reduced to about 50 kW after accounting for long-term operational data, highlighting how short-term assessments can lead to major investment errors. This gap is caused by the need for network flexibility and maintenance, which makes energy recovery difficult in practice.
The study also uncovers systemic hydraulic interdependencies. For example, operations at Callois station, featuring a dual-reservoir configuration, directly influence pressure conditions across other substations. The inverse correlation between Mazy and Plancenoit illustrates how decisions at one site cascade through the network. While this topology may be specific to Brussels, the broader insight is that WSDNs function as interconnected systems, where local optimization is insufficient. Water networks must be treated as integrated, dynamic systems.
A key finding is the predominant influence of the upstream supply network (WSN) on the downstream distribution network (WDN). Flow interruptions at key WDN sites during WSN adjustments demonstrate that certain locations may be structurally unsuitable for recovery, regardless of the technology used.
Technological adaptability remains essential. Given the observed pressure stability and flow variability, cross-flow turbines appear suitable for Brussels’ WDN. But this statement is countered by the fact that operational conditions may vary too much for clear financial gain. This reinforces the need for careful site selection based on long-term data.
The added value of this study lies in its temporal scope. The four-year dataset captured operational shifts that shorter analyses would have missed. An analysis limited to 2021–2022, for instance, would have incorrectly suggested viable recovery potential in the WSN V25 and the WDN V12, V15, and V64. Long-term monitoring is thus critical for accurate investment decisions. These findings extend beyond water networks. Across industries, the premature deployment of new technologies without thorough operational analysis can result in costly failures. While data are widely available, they are often underutilized. This study demonstrates that contextual, long-term analysis offers more reliable guidance than short-term projections.
Lastly, integration into daily operations is key. Energy recovery must be matched with flexible valorization strategies, such as participation in electricity day-ahead or ancillary service markets. In systems with modest capacity like Brussels, such participation may be more feasible through aggregators. A network-wide optimization approach, rather than isolated interventions, offers the best path toward viable recovery.

5. Conclusions

This study demonstrates that successful energy recovery implementation in urban water networks requires more than promising technical estimates; it demands a thorough understanding of operational dynamics. Drawing on four years of data from the Brussels Capital Region, the analysis reveals that high theoretical potentials, such as the 650 kW estimated at valve V25, are only achievable during atypical configurations. Under standard conditions, V25 delivers a far lower 50 kW potential. This discrepancy illustrates how operational constraints, such as supply continuity and network flexibility, can severely limit actual recovery opportunities and render optimistic feasibility studies misleading.
The distinction between the Water Supply Network (WSN) and the Water Distribution Network (WDN) is central. The WSN exhibits stable, cyclical pressure variations suitable for PaT integration, especially at sites like Mazy. In contrast, the WDN shows abrupt, unpredictable flow patterns that are theoretically compatible with cross-flow turbines yet practically compromised by upstream dependencies. In Brussels, WDN valves such as V12, V15, and V64 are hydraulically linked to V25, making them vulnerable to flow cuts during routine WSN adjustments. These findings indicate that even with the right technology, structural incompatibilities may render certain sites unsuitable for energy recovery. The centralized management of the WSN and WDN carried out by Vivaqua facilitated this insight. This advantage is not guaranteed in cities with fragmented utilities.
Beyond the Brussels case, this study underlines a broader principle: the viability of energy recovery depends less on technological performance than on long-term operational compatibility. Utilities should prioritize extended data analysis, cross-network coordination, and integration into daily operations, ideally with valorization through flexible electricity markets such as day-ahead trading. Putting real-world observations and data analysis at the center of planning helps avoid costly mistakes and increases the chances of success. For the water sector and beyond, the most sustainable energy gains may not lie in the rapid deployment of new technologies but in the patient extraction of insight from the systems being monitored.

Author Contributions

Formal analysis, F.N.; Investigation, F.N.; Writing—original draft, F.N.; Writing—review & editing, P.H. All authors have read and agreed to the published version of the manuscript.

Funding

FPS Economy Diverision Energy through the ETF (Energy Transition Fund)—Project FlexWatter.

Data Availability Statement

The original contributions presented in this study are included in the article. Further inquiries can be directed to the corresponding author.

Conflicts of Interest

The authors declare no conflict of interest.

References

  1. Agathokleous, A.; Christodoulou, S. Vulnerability of Urban Water Distribution Networks under Intermittent Water Supply Operations. Water Resour. Manag. 2016, 30, 4731–4750. [Google Scholar] [CrossRef]
  2. Ameyaw, E.E.; Memon, F.A.; Bicik, J. Improving equity in intermittent water supply systems. J. Water Supply Res. Technol.-Aqua 2013, 62, 552–562. [Google Scholar] [CrossRef]
  3. Galaitsi, S.; Russell, R.; Bishara, A.; Durant, J.; Bogle, J.; Huber-Lee, A. Intermittent Domestic Water Supply: A Critical Review and Analysis of Causal-Consequential Pathways. Water 2016, 8, 274. [Google Scholar] [CrossRef]
  4. Gottipati, P.V.K.S.V.; Nanduri, U.V. Equity in water supply in intermittent water distribution networks: Equity in water supply. Water Environ. J. 2014, 28, 509–515. [Google Scholar] [CrossRef]
  5. Ilaya-Ayza, A.E.; Benítez, J.; Izquierdo, J.; Pérez-García, R. Multi-criteria optimization of supply schedules in intermittent water supply systems. J. Comput. Appl. Math. 2017, 309, 695–703. [Google Scholar] [CrossRef]
  6. Mokssit, A.; de Gouvello, B.; Chazerain, A.; Figuères, F.; Tassin, B. Building a Methodology for Assessing Service Quality under Intermittent Domestic Water Supply. Water 2018, 10, 1164. [Google Scholar] [CrossRef]
  7. AbdelMeguid, H.; Ulanicki, B. Pressure and Leakage Management in Water Distribution Systems via Flow Modulation PRVs. In Water Distribution Systems Analysis 2010, Proceedings of the 12th Annual Conference on Water Distribution Systems Analysis, Tucson, AZ, USA, 12–15 September 2010; American Society of Civil Engineers: Reston, VA, USA, 2011; pp. 1124–1139. [Google Scholar] [CrossRef]
  8. Adedeji, K.B.; Hamam, Y.; Abe, B.T.; Abu-Mahfouz, A.M. Towards Achieving a Reliable Leakage Detection and Localization Algorithm for Application in Water Piping Networks: An Overview. IEEE Access 2017, 5, 20272–20285. [Google Scholar] [CrossRef]
  9. Araujo, L.S.; Ramos, H.; Coelho, S.T. Pressure Control for Leakage Minimisation in Water Distribution Systems Management. Water Resour. Manag. 2006, 20, 133–149. [Google Scholar] [CrossRef]
  10. Ávila, C.A.M.; Sánchez-Romero, F.-J.; López-Jiménez, P.A.; Leakage, M.P.-S. Management and Pipe System Efficiency. Its Influence in the Improvement of the Efficiency Indexes. Water 2021, 13, 1909. [Google Scholar] [CrossRef]
  11. Mosetlhe, T.C.; Hamam, Y.; Du, S.; Monacelli, E. Appraising the Impact of Pressure Control on Leakage Flow in Water Distribution Networks. Water 2021, 13, 2617. [Google Scholar] [CrossRef]
  12. Thornton, J. Leakage Management: A Practical Approach: 20–22 November, 2002, Lemesos, Cyprus: Conference Proceedings; Water Board of Lemesos: Lemesos, Cyprus, 2002. [Google Scholar]
  13. Walski, T.; Bezts, W.; Posluszny, E.T.; Weir, M.; Whitman, B.E. Modeling leakage reduction through pressure control. J. —Am. Water Work. Assoc. 2006, 98, 147–155. [Google Scholar] [CrossRef]
  14. Monsef, H.; Naghashzadegan, M.; Farmani, R.; Jamali, A. Pressure management in water distribution systems in order to reduce energy consumption and background leakage. J. Water Supply Res. Technol. 2018, 67, 397–403. [Google Scholar] [CrossRef]
  15. Abdelsalam, A.A.; Gabbar, H.A. Energy saving and management of water pumping networks. Heliyon 2021, 7, e07820. [Google Scholar] [CrossRef] [PubMed]
  16. Coelho, B.; Andrade-Campos, A. Efficiency achievement in water supply systems—A review. Renew. Sustain. Energy Rev. 2014, 30, 59–84. [Google Scholar] [CrossRef]
  17. Creaco, E.; Pezzinga, G. Comparison of Algorithms for the Optimal Location of Control Valves for Leakage Reduction in WDNs. Water 2018, 10, 466. [Google Scholar] [CrossRef]
  18. Gullotta, A.; Campisano, A.; Creaco, E.; Modica, C. A Simplified Methodology for Optimal Location and Setting of Valves to Improve Equity in Intermittent Water Distribution Systems. Water Resour. Manag. 2021, 35, 4477–4494. [Google Scholar] [CrossRef]
  19. Abdel-Mottaleb, N.; Saghand, P.G.; Wakhungu, M.J.; Charkhgard, H.; Wells, E.C.; Zhang, Q. Identifying Critical Isolation Valves in a Water Distribution Network: A Socio-Technical Approach. Water 2022, 14, 3587. [Google Scholar] [CrossRef]
  20. Chen, J.; Yang, H.X.; Liu, C.P.; Lau, C.H.; Lo, M. A novel vertical axis water turbine for power generation from water pipelines. Energy 2013, 54, 184–193. [Google Scholar] [CrossRef]
  21. Hamlehdar, M.; Yousefi, H.; Noorollahi, Y.; Mohammadi, M. Energy recovery from water distribution networks using micro hydropower: A case study in Iran. Energy 2022, 252, 124024. [Google Scholar] [CrossRef]
  22. Balacco, G.; Binetti, M.; Capurso, T.; Stefanizzi, M.; Torresi, M.; Piccinni, A.F. Pump as Turbine for the Energy Recovery in a Water Distribution Network: Two Italian (Apulian) Case Studies. Environ. Sci. Proc. 2020, 2, 1. [Google Scholar] [CrossRef]
  23. Kramer, M.; Terheiden, K.; Wieprecht, S. Pumps as turbines for efficient energy recovery in water supply networks. Renew. Energy 2018, 122, 17–25. [Google Scholar] [CrossRef]
  24. Souza, D.E.S.E.; Mesquita, A.L.A.; Blanco, C.J.C. Pump-as-turbine for energy recovery in municipal water supply networks. A review. J. Braz. Soc. Mech. Sci. Eng. 2021, 43, 489. [Google Scholar] [CrossRef]
  25. Stefanizzi, M.; Capurso, T.; Balacco, G.; Binetti, M.; Camporeale, S.M.; Torresi, M. Selection, control and techno-economic feasibility of Pumps as Turbines in Water Distribution Networks. Renew. Energy 2020, 162, 1292–1306. [Google Scholar] [CrossRef]
  26. Kostner, M.K.; Zanfei, A.; Alberizzi, J.C.; Renzi, M.; Righetti, M.; Menapace, A. Micro hydro power generation in water distribution networks through the optimal pumps-as-turbines sizing and control. Appl. Energy 2023, 351, 121802. [Google Scholar] [CrossRef]
  27. Vicente, D.J.; Garrote, L.; Sánchez, R.; Santillán, D. Pressure Management in Water Distribution Systems: Current Status, Proposals, and Future Trends. J. Water Resour. Plann. Manag. 2016, 142, 04015061. [Google Scholar] [CrossRef]
  28. Page, P.R.; Abu-Mahfouz, A.M.; Mothetha, M.L. Pressure Management of Water Distribution Systems via the Remote Real-Time Control of Variable Speed Pumps. J. Water Resour. Plann. Manag. 2017, 143, 04017045. [Google Scholar] [CrossRef]
  29. Mathye, R.P.; Scholz, M.; Nyende-Byakika, S. Optimal Pressure Management in Water Distribution Systems: Efficiency Indexes for Volumetric Cost Performance, Consumption and Linear Leakage Measurements. Water 2022, 14, 805. [Google Scholar] [CrossRef]
  30. Mitrovic, D.; Chacón, M.C.; García, A.M.; Morillo, J.G.; Diaz, J.A.R.; Ramos, H.M.; Adeyeye, K.; Carravetta, A.; McNabola, A. Multi-Country Scale Assessment of Available Energy Recovery Potential Using Micro-Hydropower in Drinking, Pressurised Irrigation and Wastewater Networks, Covering Part of the EU. Water 2021, 13, 899. [Google Scholar] [CrossRef]
  31. García, A.M.; Díaz, J.R.; Morillo, J.G.; McNabola, A. Energy Recovery Potential in Industrial and Municipal Wastewater Networks Using Micro-Hydropower in Spain. Water 2021, 13, 691. [Google Scholar] [CrossRef]
  32. Pérez-Sánchez, M.; Sánchez-Romero, F.J.; Ramos, H.M.; López-Jiménez, P.A. Improved Planning of Energy Recovery in Water Systems Using a New Analytic Approach to PAT Performance Curves. Water 2020, 12, 468. [Google Scholar] [CrossRef]
  33. Chacón, M.C.; Díaz, J.A.R.; Morillo, J.G.; McNabola, A. Evaluation of the design and performance of a micro hydropower plant in a pressurised irrigation network: Real world application at farm-level in Southern Spain. Renew. Energy 2021, 169, 1106–1120. [Google Scholar] [CrossRef]
  34. Liebensteiner, M.; Ocker, F.; Abuzayed, A. High electricity price despite expansion in renewables: How market trends shape Germany’s power market in the coming years. Energy Policy 2025, 198, 114448. [Google Scholar] [CrossRef]
  35. Babatunde, O.M.; Munda, J.L.; Hamam, Y. Power system flexibility: A review. Energy Rep. 2020, 6, 101–106. [Google Scholar] [CrossRef]
  36. Palade, D. Research on Power Aggregators within the European Internal Electricity Market. Proc. Int. Conf. Bus. Excell. 2023, 17, 129–138. [Google Scholar] [CrossRef]
  37. Awe, O.M.; Okolie, S.T.A.; Fayomi, O.S.I. Review of Water Distribution Systems Modelling and Performance Analysis Softwares. J. Phys. Conf. Ser. 2019, 1378, 022067. [Google Scholar] [CrossRef]
  38. Creaco, E.; Campisano, A.; Fontana, N.; Marini, G.; Page, P.R.; Walski, T. Real time control of water distribution networks: A state-of-the-art review. Water Res. 2019, 161, 517–530. [Google Scholar] [CrossRef] [PubMed]
  39. Sonaje, N.P.; Joshi, M.G. A review of modeling and application of water distribution networks (WDN) softwares. Int. J. Tech. Res. Appl. 2015, 3, 6. [Google Scholar]
  40. Kowalska, B.; Suchorab, P.; Kowalski, D. Division of district metered areas (DMAs) in a part of water supply network using WaterGEMS (Bentley) software: A case study. Appl. Water Sci. 2022, 12, 166. [Google Scholar] [CrossRef]
  41. Surco, D.F.; Vecchi, T.P.B.; Ravagnani, M.A.S.S. Optimization of water distribution networks using a modified particle swarm optimization algorithm. Water Supply 2018, 18, 660–678. [Google Scholar] [CrossRef]
  42. Abunada, M.; Trifunović, N.; Kennedy, M.; Babel, M. Optimization and Reliability Assessment of Water Distribution Networks Incorporating Demand Balancing Tanks. Procedia Eng. 2014, 70, 4–13. [Google Scholar] [CrossRef]
  43. Cheung, P.B.; Reis, L.F.R.; Formiga, K.T.M.; Chaudhry, F.H.; Ticona, W.G.C. Multiobjective Evolutionary Algorithms Applied to the Rehabilitation of a Water Distribution System: A Comparative Study. In Evolutionary Multi-Criterion Optimization; Fonseca, C.M., Fleming, P.J., Zitzler, E., Thiele, L., Deb, K., Eds.; Lecture Notes in Computer Science; Springer: Berlin/Heidelberg, Germany, 2003; Volume 2632, pp. 662–676. [Google Scholar] [CrossRef]
  44. Adedeji, K.B.; Hamam, Y.; Abe, B.T.; Abu-Mahfouz, A.M. Pressure Management Strategies for Water Loss Reduction in Large-Scale Water Piping Networks: A Review. In Advances in Hydroinformatics; Gourbesville, P., Cunge, J., Caignaert, G., Eds.; Springer Water; Springer: Singapore, 2018; pp. 465–480. [Google Scholar] [CrossRef]
  45. Alvisi, S.; Franchini, M. A Procedure for the Design of District Metered Areas in Water Distribution Systems. Procedia Eng. 2014, 70, 41–50. [Google Scholar] [CrossRef]
  46. Kim, T.; Oh, Y.; Koo, J.; Yoo, D. Evaluation of Priority Control District Metered Area for Water Distribution Networks Using Water Quality-Related Big Data. Sustainability 2022, 14, 7282. [Google Scholar] [CrossRef]
  47. Sinagra, M.; Creaco, E.; Morreale, G.; Tucciarelli, T. Energy Recovery Optimization by Means of a Turbine in a Pressure Regulation Node of a Real Water Network Through a Data-Driven Digital Twin. Water Resour. Manag. 2023, 37, 4733–4749. [Google Scholar] [CrossRef]
  48. Morabito, A.; Hendrick, P. Pump as turbine applied to micro energy storage and smart water grids: A case study. Appl. Energy 2019, 241, 567–579. [Google Scholar] [CrossRef]
  49. Stefanizzi, M.; Capurso, T.; Balacco, G.; Binetti, M.; Torresi, M.; Camporeale, S.M. Pump as turbine for throttling energy recovery in water distribution networks. Presented at the Second international conference on material science, smart structures and applications. AIP Conf. Proc. 2019, 2191, 020142. [Google Scholar] [CrossRef]
  50. Giugni, M.; Fontana, N.; Ranucci, A. Optimal Location of PRVs and Turbines in Water Distribution Systems. J. Water Resour. Plann. Manag. 2014, 140, 06014004. [Google Scholar] [CrossRef]
  51. Morabito, A.; Furtado, G.C.A.; Mesquita, A.L.A.; Hendrick, P. Variables speed regulation for pump as turbine in a micro pumped hydro energy storage application. Presented at the 38th IAHR World Congress, Panama City, Panama, 1–6 September 2019; pp. 4039–4046. [Google Scholar] [CrossRef]
  52. Mercier, T.; Hardy, C.; Van Tichelen, P.; Olivier, M.; De Jaeger, E. Control of variable-speed pumps used as turbines for flexible grid-connected power generation. Electr. Power Syst. Res. 2019, 176, 105962. [Google Scholar] [CrossRef]
  53. Pirard, T.; Kitsikoudis, V.; Erpicum, S.; Pirotton, M.; Archambeau, P.; Dewals, B. Discharge Redistribution as a Key Process for Heuristic Optimization of Energy Production with Pumps as Turbines in a Water Distribution Network. Water Resour. Manag. 2022, 36, 1237–1250. [Google Scholar] [CrossRef]
  54. Ramos, H.M.; Teyssier, C.; Samora, I.; Schleiss, A.J. Energy recovery in SUDS towards smart water grids: A case study. Energy Policy 2013, 62, 463–472. [Google Scholar] [CrossRef]
  55. Sinagra, M.; Aricò, C.; Tucciarelli, T.; Amato, P.; Fiorino, M. Coupled Electric and Hydraulic Control of a PRS Turbine in a Real Transport Water Network. Water 2019, 11, 1194. [Google Scholar] [CrossRef]
Figure 1. Schematic of Water Supply and Water Distribution Networks.
Energies 18 03777 g001
Figure 2. Schematics on energy optimization possibilities for the WSDN.
Energies 18 03777 g002
Figure 3. Schematic of ΔP at the neck of a valve.
Energies 18 03777 g003
Figure 4. Schematic of Tailfer production center and Bois-de-Villers storage station.
Energies 18 03777 g004
Figure 5. Daily evolution of water volumes in Tailfer and Bois-de-Villers reservoirs per season.
Energies 18 03777 g005
Figure 6. Brussels’ WSN map (https://www.vivaqua.be/content/uploads/2021/06/VIVAQUA-rapport-annuel-2020-1.pdf accessed on 15 May 2020). Energies 18 03777 i001 
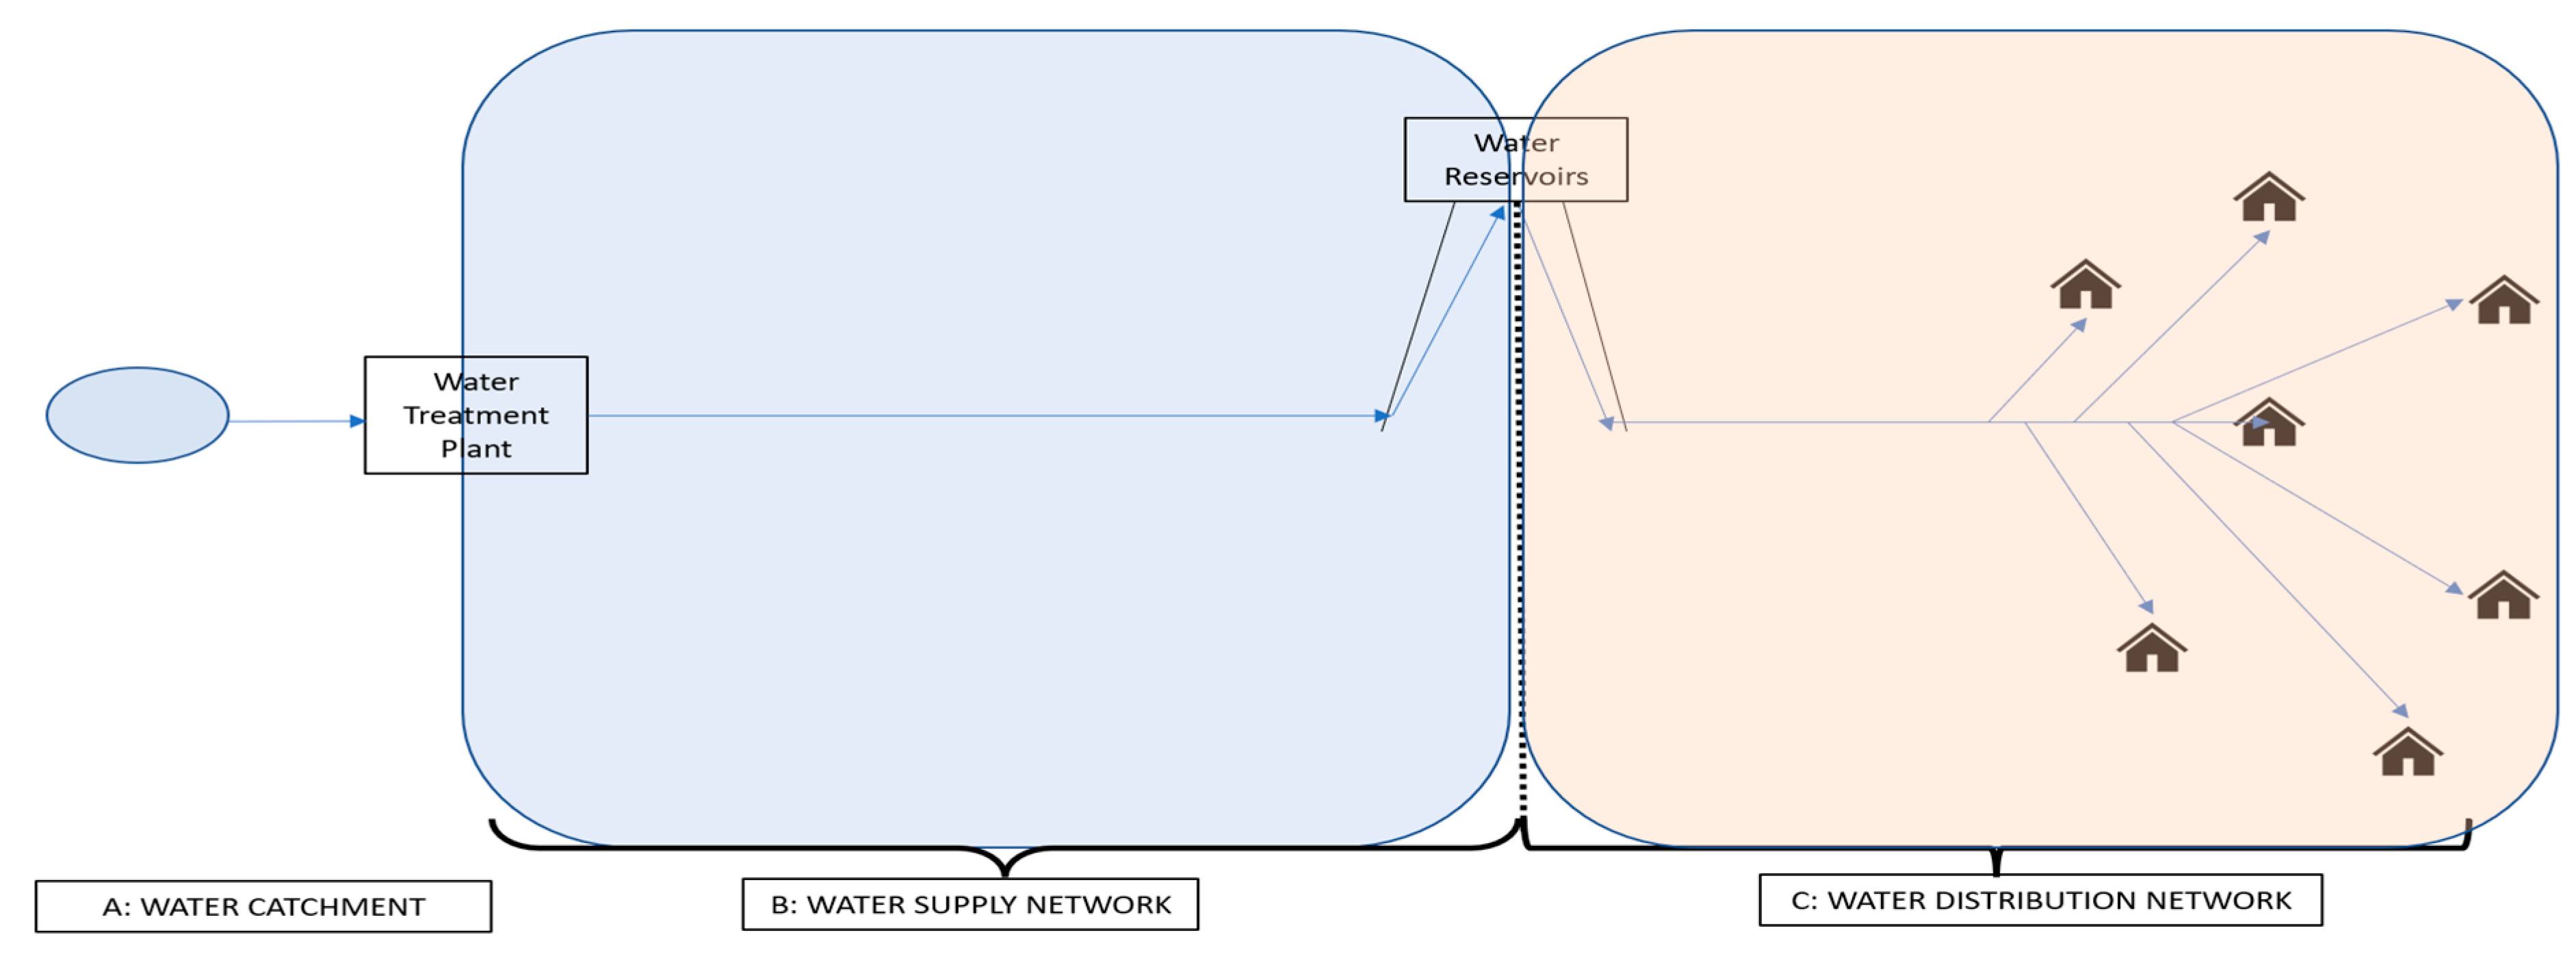
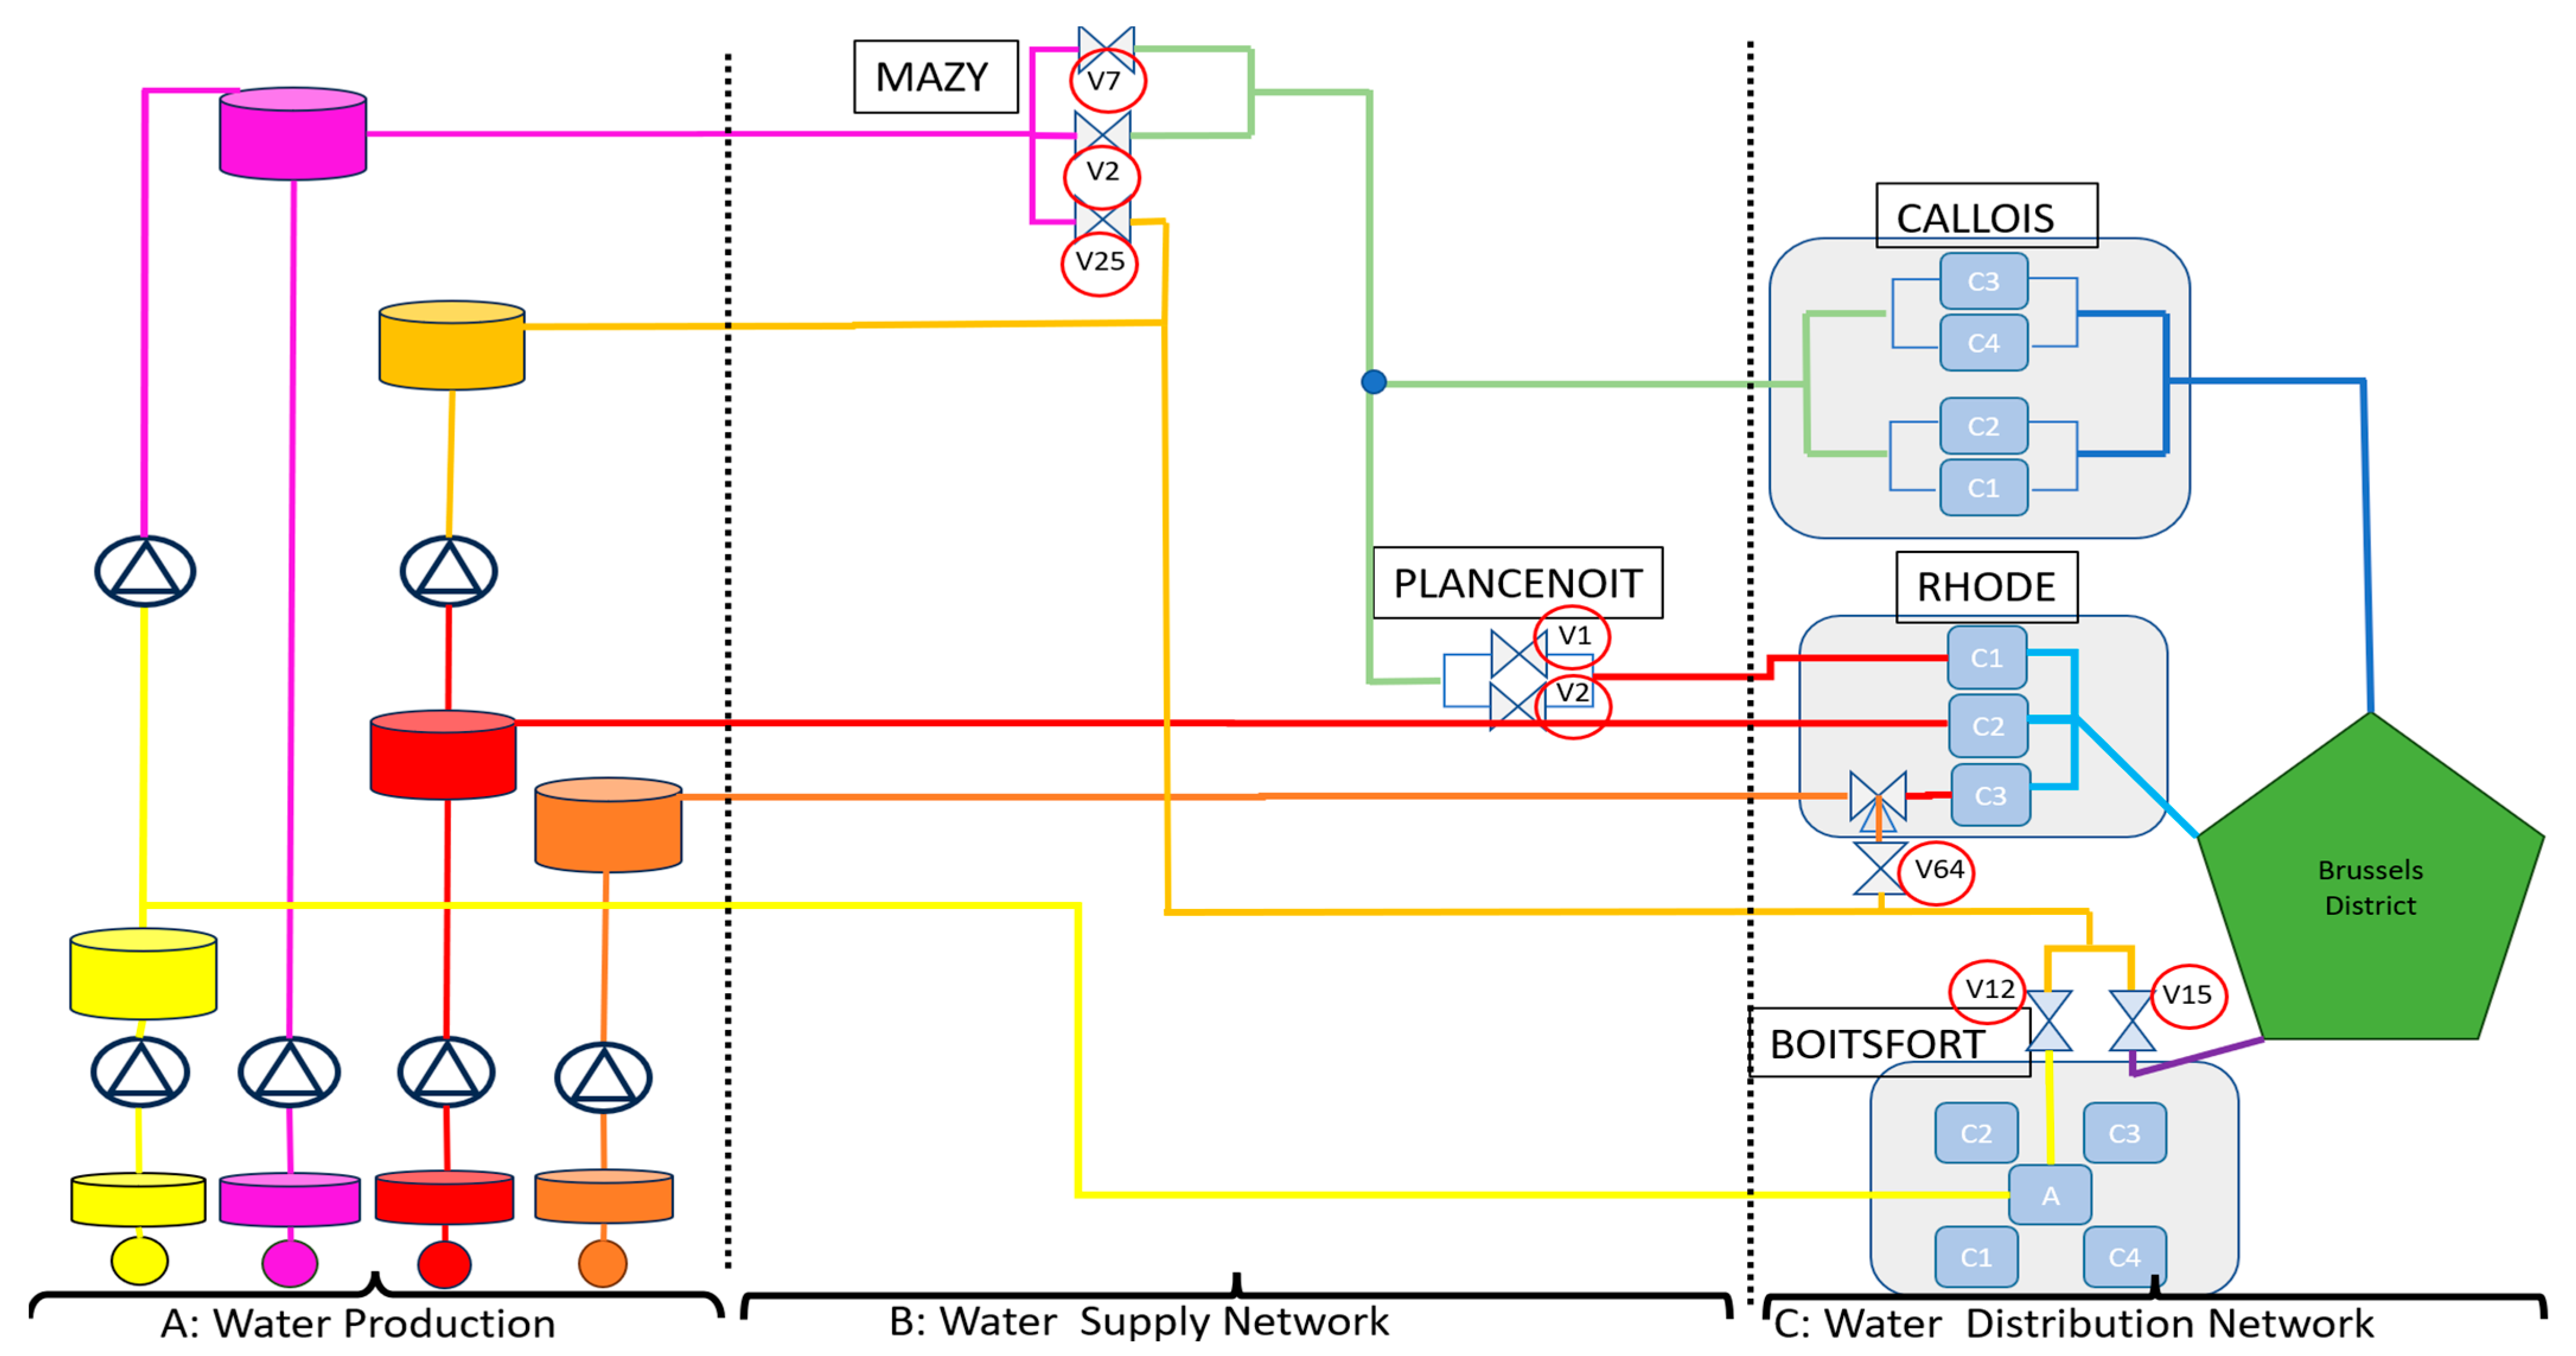
represents the water intake, i.e., the place where the water is pumped out (river, cave, or mine); Energies 18 03777 i002 represents the water treatment plant, i.e., the place where the water is treated to make it drinkable; Energies 18 03777 i003 
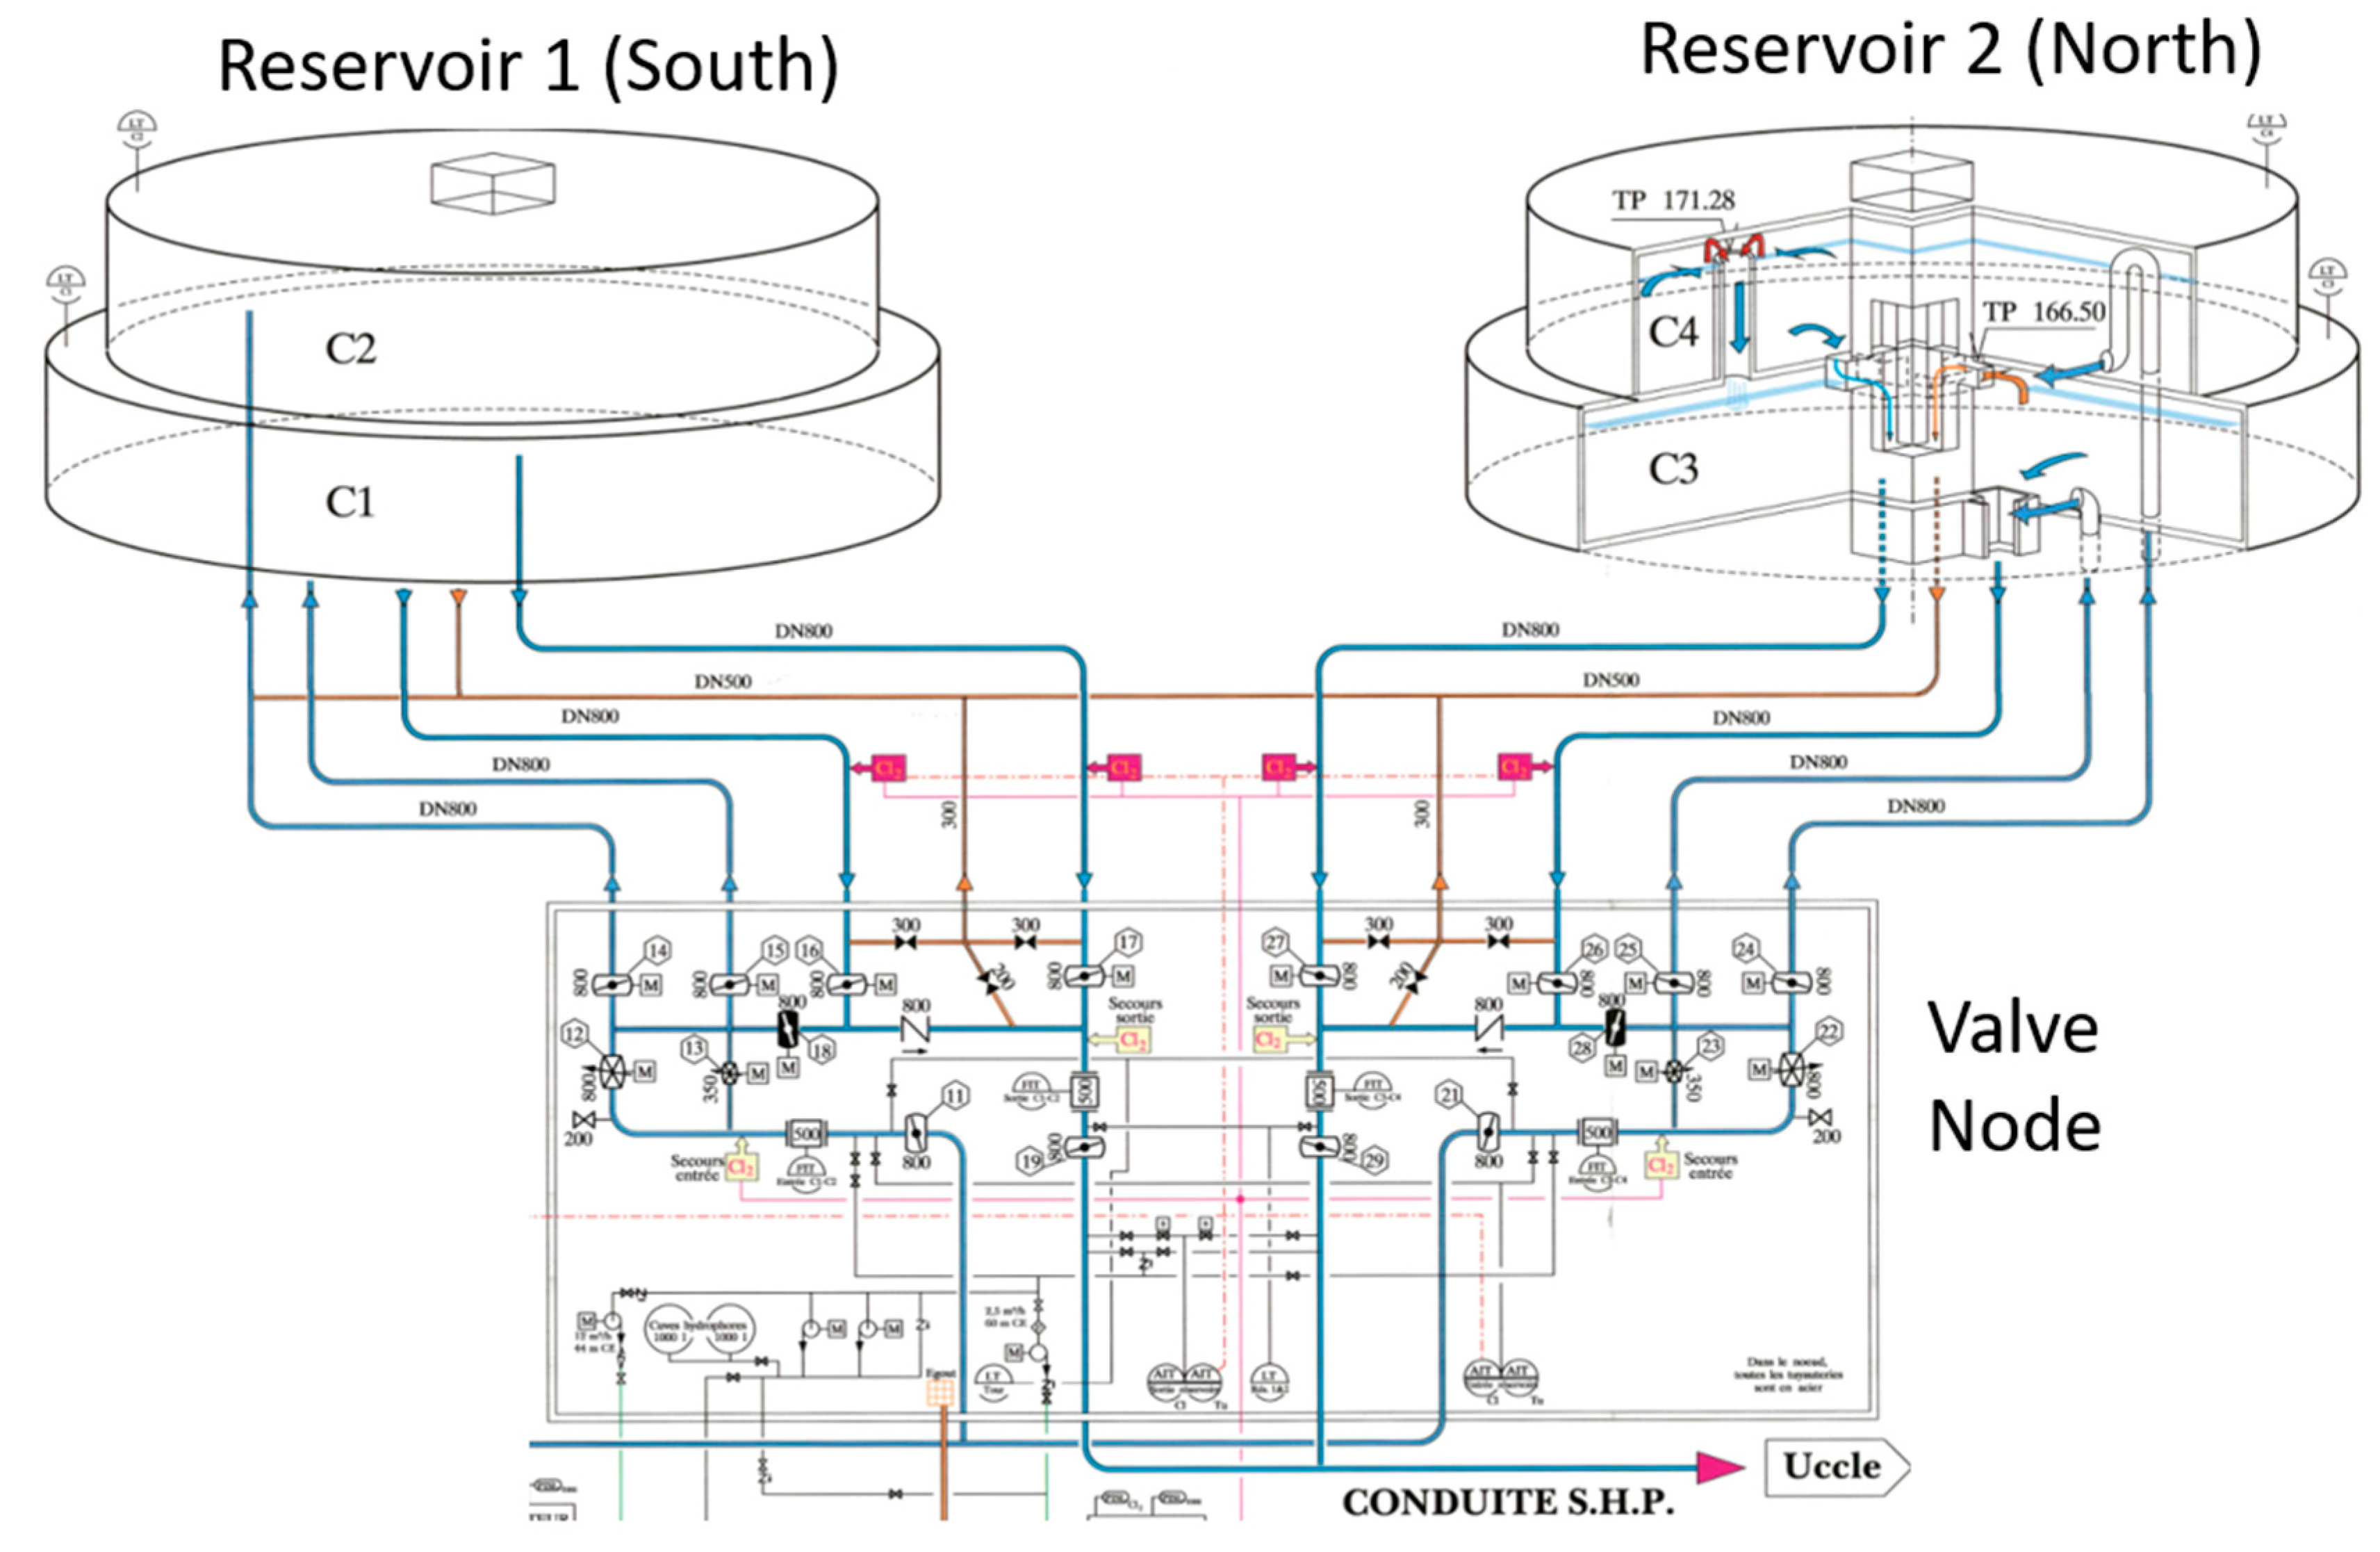
represents the node of the network, i.e., the place where the WSN subdivides into other branches; and Energies 18 03777 i004 represents the reservoirs of the network, i.e., the place where the water is stored.
Energies 18 03777 g006
Figure 8. Brussels’ Water Distribution Network by pressure level (https://www.vivaqua.be/content/uploads/2021/06/VIVAQUA-rapport-annuel-2020-1.pdf accessed on 15 May 2020).
Energies 18 03777 g008
Figure 9. P&ID of Brussels’ WSDN.
Energies 18 03777 g009
Figure 10. Data Maestro description.
Energies 18 03777 g010
Figure 11. Power curves of the Mazy station WSN [kW] (Jan 2019–April 2022.
Energies 18 03777 g011
Figure 12. ΔP variation at the Mazy station WSN [m of water height] (Jan 2019–April 2022).
Energies 18 03777 g012
Figure 13. Day-ahead market prices evolution [Euro/MWh] (Jan 2019–April 2022).
Energies 18 03777 g013
Figure 14. Power curves of the Plancenoit station WSN [kW] (Jan 2019–April 2022).
Energies 18 03777 g014
Figure 15. ΔP (m) variation at the Mazy and Plancenoit PRVs (WSN).
Energies 18 03777 g015
Figure 16. Valve node and reservoirs at the Callois station (source: Vivaqua internal technical documentation).
Energies 18 03777 g016
Figure 17. Power curves of the Rhode station WDN [kW] (Jan 2019–April 2022).
Energies 18 03777 g017
Figure 18. Power curves of the Boistfort station WDN [kW] (Jan 2019–April 2022).
Energies 18 03777 g018
Figure 19. Comparison between flows in WDN (V64, V12, V15), and ΔP in WSN (V25) (Jan 2019–April 2022).
Energies 18 03777 g019
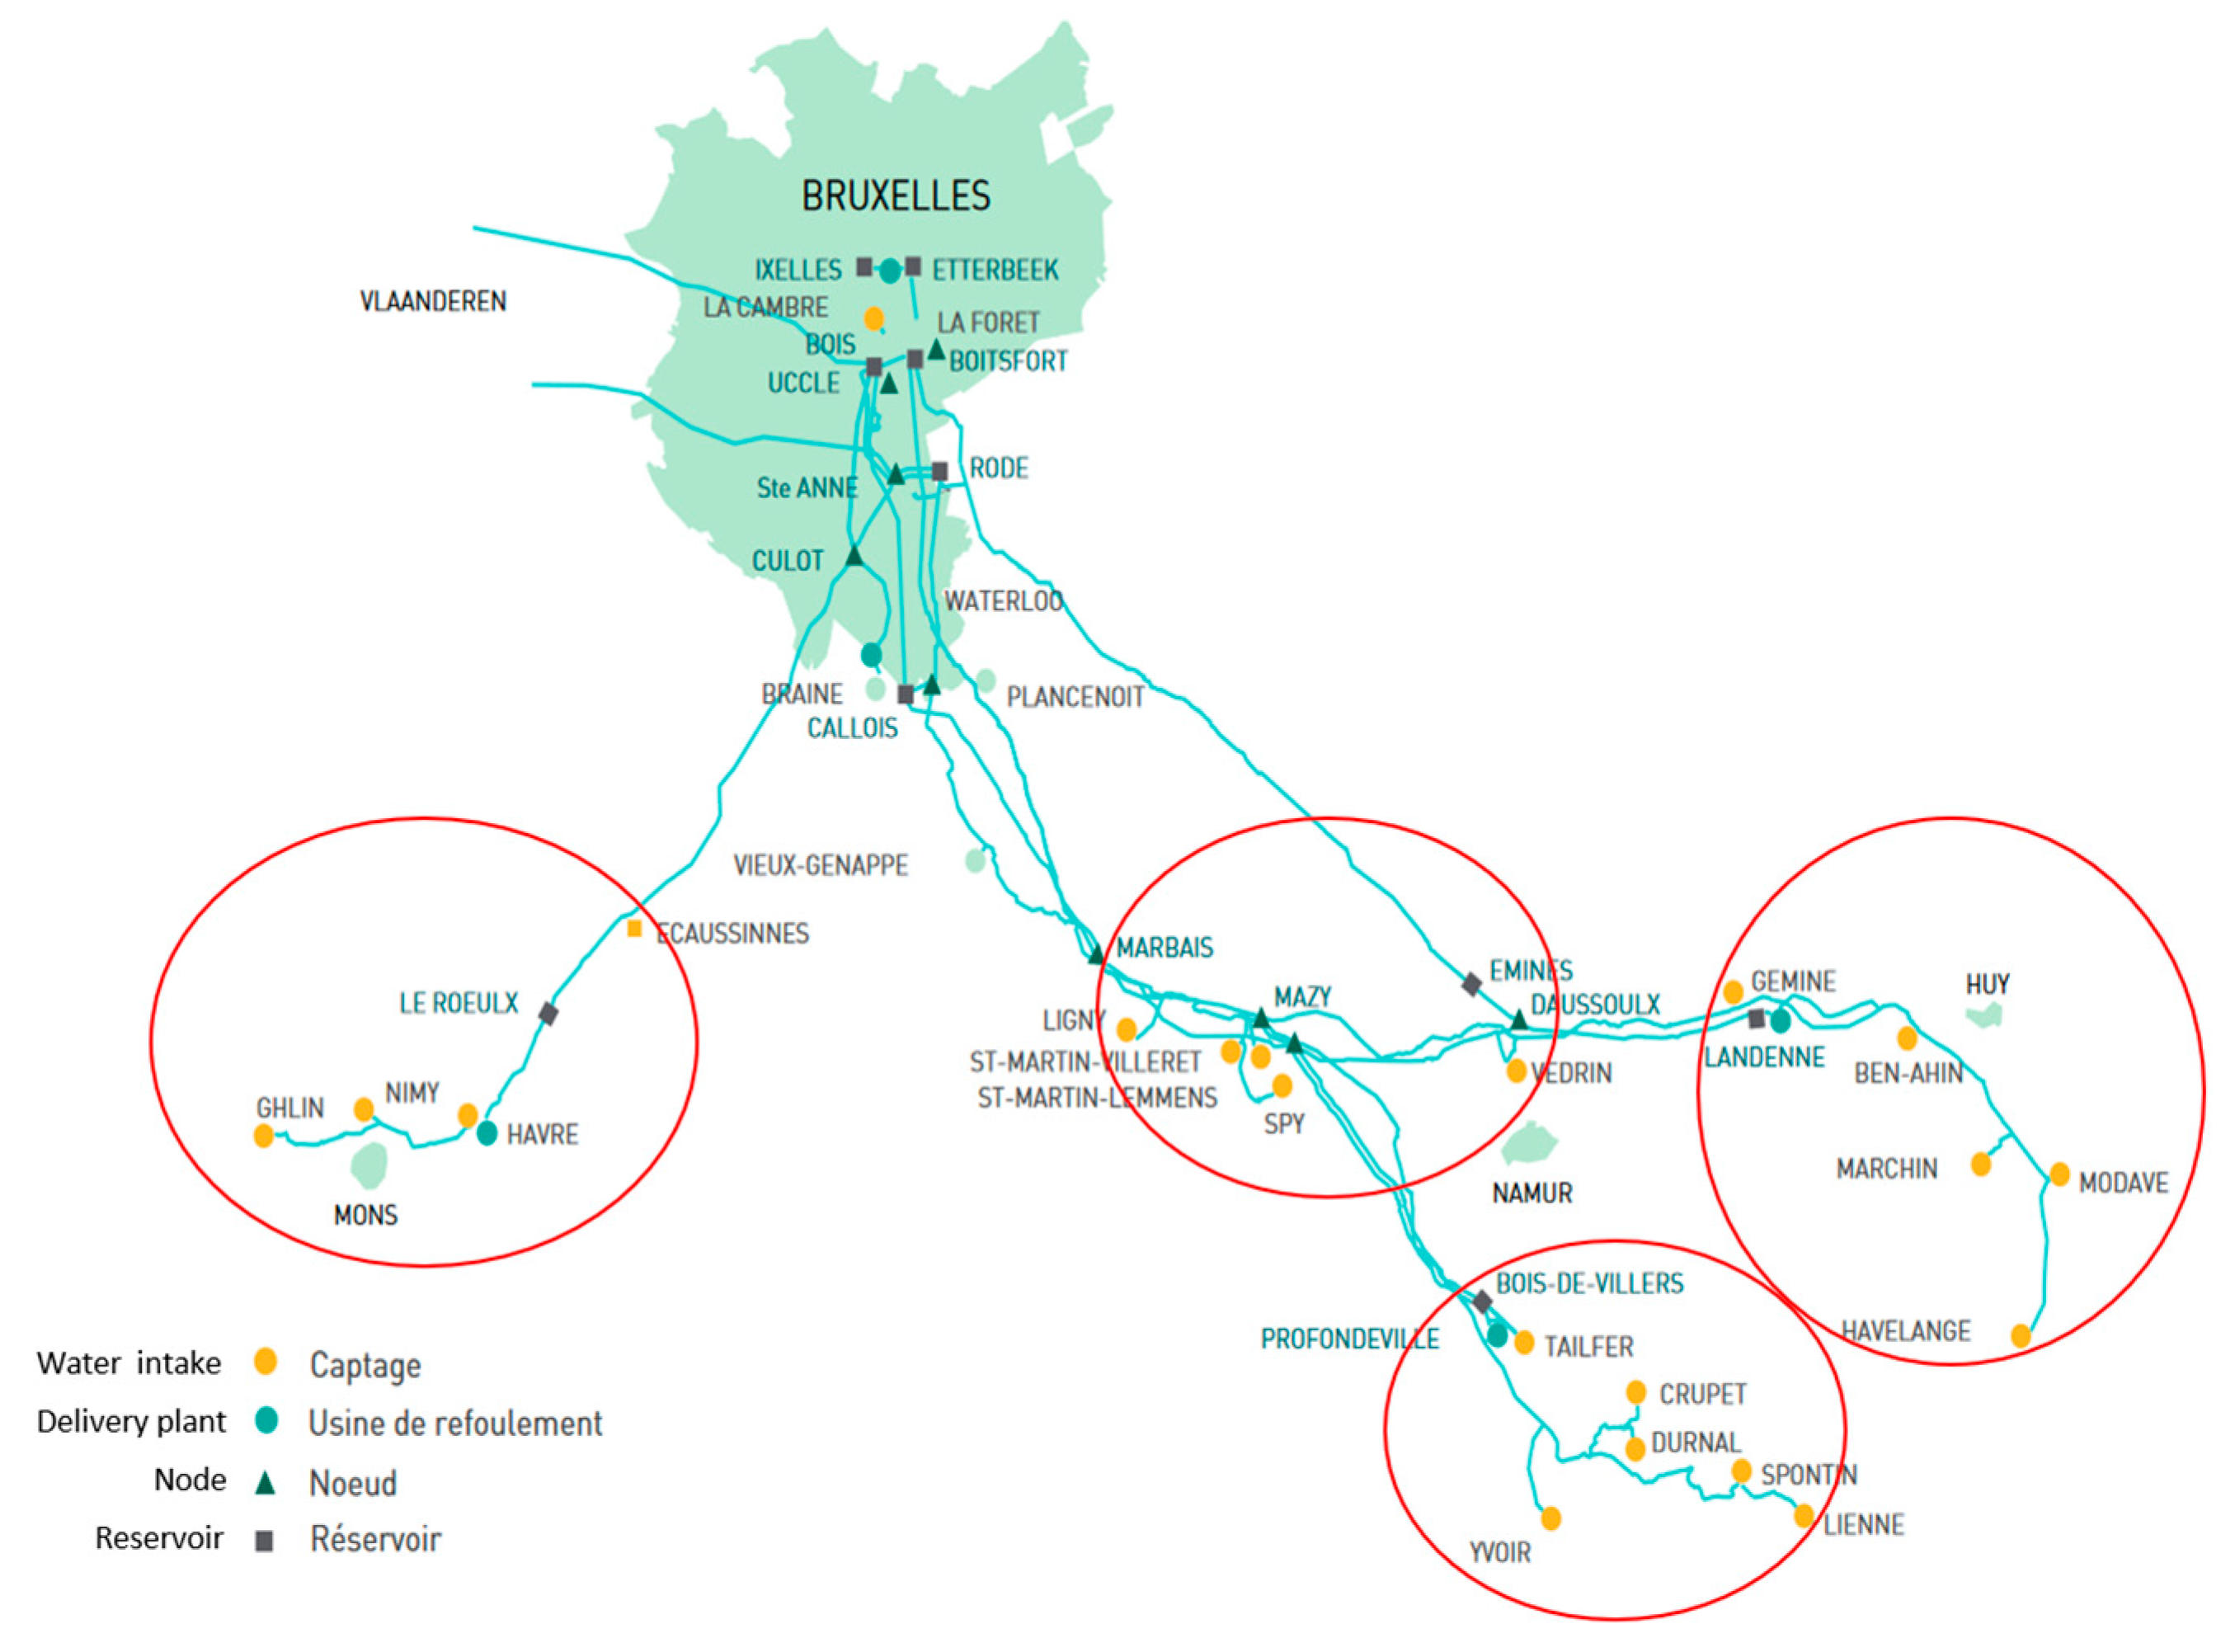
Disclaimer/Publisher’s Note: The statements, opinions and data contained in all publications are solely those of the individual author(s) and contributor(s) and not of MDPI and/or the editor(s). MDPI and/or the editor(s) disclaim responsibility for any injury to people or property resulting from any ideas, methods, instructions or products referred to in the content.

