Article

Research on an Algorithm of Power System Node Importance Assessment Based on Topology–Parameter Co-Analysis

1
School of Electrical and Electronic Engineering, Shandong University of Technology, Zibo 255000, China
2
State Grid Shandong Electric Power Company Zibo Power Supply Company, Zibo 255000, China
*
Author to whom correspondence should be addressed.
Energies 2025, 18(14), 3778; https://doi.org/10.3390/en18143778
Submission received: 13 May 2025 / Revised: 17 June 2025 / Accepted: 4 July 2025 / Published: 17 July 2025

Abstract

As power grids continue to expand in scale, the occurrence of cascading failures within them can lead to significant economic losses. Therefore, assessing the criticality of grid nodes is crucial for ensuring the secure and stable operation of power systems and for mitigating losses when cascading failures occur. The classical Local Link Similarity (LLS) algorithm in complex networks evaluates the importance of network nodes from a neighborhood topology perspective, but it suffers from issues such as the excessive weighting of node degrees and the neglect of electrical parameters. Based on the classical algorithm, this paper first develops the Improved Local Link Similarity (ILLS) algorithm by substituting alternative similarity metrics and comparatively evaluating their performance. Building upon the ILLS, we then propose the Electrical LLS (ELLS) algorithm by integrating node power flow and electrical coupling connectivity as multiplicative factors, with optimal combinations determined via simulation experiments. Compared to classical approaches, ELLS demonstrates superior adaptability to power grid contexts and delivers enhanced accuracy in power system node importance assessments. These algorithms are applied to rank the node importance in the IEEE 300-bus system. Their performance is evaluated using the loss-of-load-size metric, comparing ELLS, ILLS, and the classical algorithm. The results demonstrate that under the loss-of-load-size metric, the ELLS algorithm achieves approximately 25% higher accuracy compared to both the ILLS and the classical algorithm, validating its effectiveness.

1. Introduction

In recent years, major blackout incidents have occurred frequently worldwide, resulting in significant social and economic losses [1,2]. Studies indicate that such large-scale power grid failures are often triggered by cascading failures originating from the malfunction of a few critical nodes [3]. With the continuous expansion of China’s power grid, system uncertainties have increased, elevating the risk of cascading failures and imposing stricter requirements for power system stability [4]. Enhancing the accuracy of grid node criticality assessments and implementing targeted protection measures for critical nodes holds significant practical implications for improving the power system’s operational stability and mitigating cascading failure risks [5].
Current research on critical node assessment predominantly adopts a complex network perspective, quantifying node criticality through the algorithmic computation of individual node scores, where the selection of algorithms proves pivotal to evaluation accuracy. The selection of algorithms is crucial to ensuring assessment accuracy. Classical approaches typically rely on topological features such as degree centrality, which asserts that a node’s importance depends on the number of connected branches. A higher number of connections implies greater network disruption if the node is removed. Betweenness centrality, which measures node importance using the fraction of all shortest paths passing through the node, is also used. The failure of high-betweenness nodes forces extensive rerouting of shortest paths, potentially triggering cascading failures. Ref. [6] applied the betweenness concept to identify critical nodes in the North American, Italian, Dutch, and eastern Chinese power grids, demonstrating its effectiveness through case studies.
Existing studies have established the correlation between node importance and network topology. However, in power systems, node importance depends not only on topology but also on electrical parameters such as node power flow and electrical distance. Ref. [7] incorporates processed node power flow data as weights in its model, enhancing physical alignment and achieving higher accuracy. However, solely considering power flow neglects hub nodes that are critical for network connectivity despite moderate power flows, compromising comprehensive assessment efficacy. Ref. [8] proposes an electrical betweenness algorithm integrating Kirchhoff’s laws with betweenness centrality. While improving physical relevance, simulation results indicate limited performance enhancement from electrical betweenness alone. Ref. [9] develops an electrical coupling connectivity metric based on electrical distance, combining power flow parameters to holistically capture grid operational states. Nevertheless, it fails to investigate individual parameter contributions or account for topological significance. Ref. [10] adapts the SALSA algorithm into E-SALSA, evaluating node importance via metrics like maximum subgroup size and loss of load size. Although computationally efficient, it inadequately addresses the local topological characteristics of power systems. Refs. [11,12,13] enhance accuracy through multi-metric fusion. Ref. [11] combines local influence (neighbor average degree) and global influence (network-wide shared neighbors), outperforming classical methods but ignoring operational states; Ref. [12] introduces an efficacy-based importance matrix integrating neighbor degrees, efficacy values, and grid reactance. This multi-criteria approach surpasses single metrics and reveals neighborhood criticality yet lacks mechanistic explanations. Ref. [13] proposes the local link similarity (LLS) algorithm, boosting accuracy by fusing node degrees with link redundancy in neighborhood topology while maintaining computational efficiency. Its strength in large-scale networks is, however, undermined by the following two flaws: that the scoring function’s squared degree term disproportionately amplifies degree effects and its inability to incorporate grid physical contexts. Collectively, these studies demonstrate that neither topological features nor electrical parameters alone suffice for accurate node criticality assessment. A synergistic integration of topological characteristics with contextually appropriate electrical parameters is essential to develop assessment methodologies aligned with practical grid operations.
This paper proposes an electrical local link similarity (ELLS) algorithm through the refinement of the LLS algorithm’s principles and the systematic integration of grid-specific parameters, adopting a topology–parameter co-analysis framework. The ELLS algorithm integrates nodal degree and neighborhood-link redundancy from a topological perspective while also synthesizing node power flow and electrical coupling connectivity through electrical parameters, enabling a more comprehensive and accurate identification of critical nodes in power systems. These algorithms were applied to identify the top 10% of critical nodes in the IEEE 300-bus system. Subsequent targeted attacks on these nodes generated loss-of-load-size curves for each algorithm, enabling performance comparisons. Top-performing variants were further benchmarked against the electrical betweenness algorithm and the HITS method. The key differences between the proposed ELLS and classical LLS algorithms are summarized in Table 1. Experimental results demonstrate that the ELLS algorithm, enriched with electrical parameters, outperforms both the classical LLS algorithm and the two baseline methods, confirming its effectiveness and superiority.

2. Local Link Similarity Algorithm (LLS)

Node similarity serves as the foundation of the classical LLS algorithm, quantifying the structural irreplaceability of nodes within the network topology. However, for two nodes with identical local topological structures, their node importance also depends on injected power flow and electrical coupling connectivity. Nodes with higher injected power flow or stronger electrical coupling connectivity exhibit greater importance. This section introduces node similarity, local link similarity, and the aforementioned electrical parameters.

2.1. Node Similarity

Consider an undirected simple network G(V,E), where V represents a set of n nodes and E denotes a set of b branches. Self-loops and multiple edges between the same node pair are prohibited. For any pair of nodes i and j, a similarity score can be calculated to measure their topological resemblance, referred to as node similarity. This section introduces five node similarity metrics [14]. A brief overview of each metric is provided below.

2.1.1. Jaccard Index

The Jaccard index is defined as follows:
s i m . J a c ( i , j ) = | n ( i ) n ( j ) | | n ( i ) n ( j ) |

2.1.2. Salton Index

The Salton index is defined as follows:
s i m . S a l ( i , j ) = | n ( i ) n ( j ) | k i × k j
where ki and kj denote the degrees of nodes i and j, respectively, representing the number of directly connected nodes.

2.1.3. Sørensen Index

The Sørensen index is defined as follows:
s i m . S o r ( i , j ) = 2 | n ( i ) n ( j ) | k i + k j

2.1.4. Hub Promoted Index (HPI)

The HPI is defined as follows:
s i m . H P I ( i , j ) = | n ( i ) n ( j ) | min ( k i , k j )

2.1.5. Hub Depressed Index (HDI)

The HDI is defined as follows:
s i m . H D I ( i , j ) = | n ( i ) n ( j ) | max ( k i , k j )

2.2. Local Link Similarity

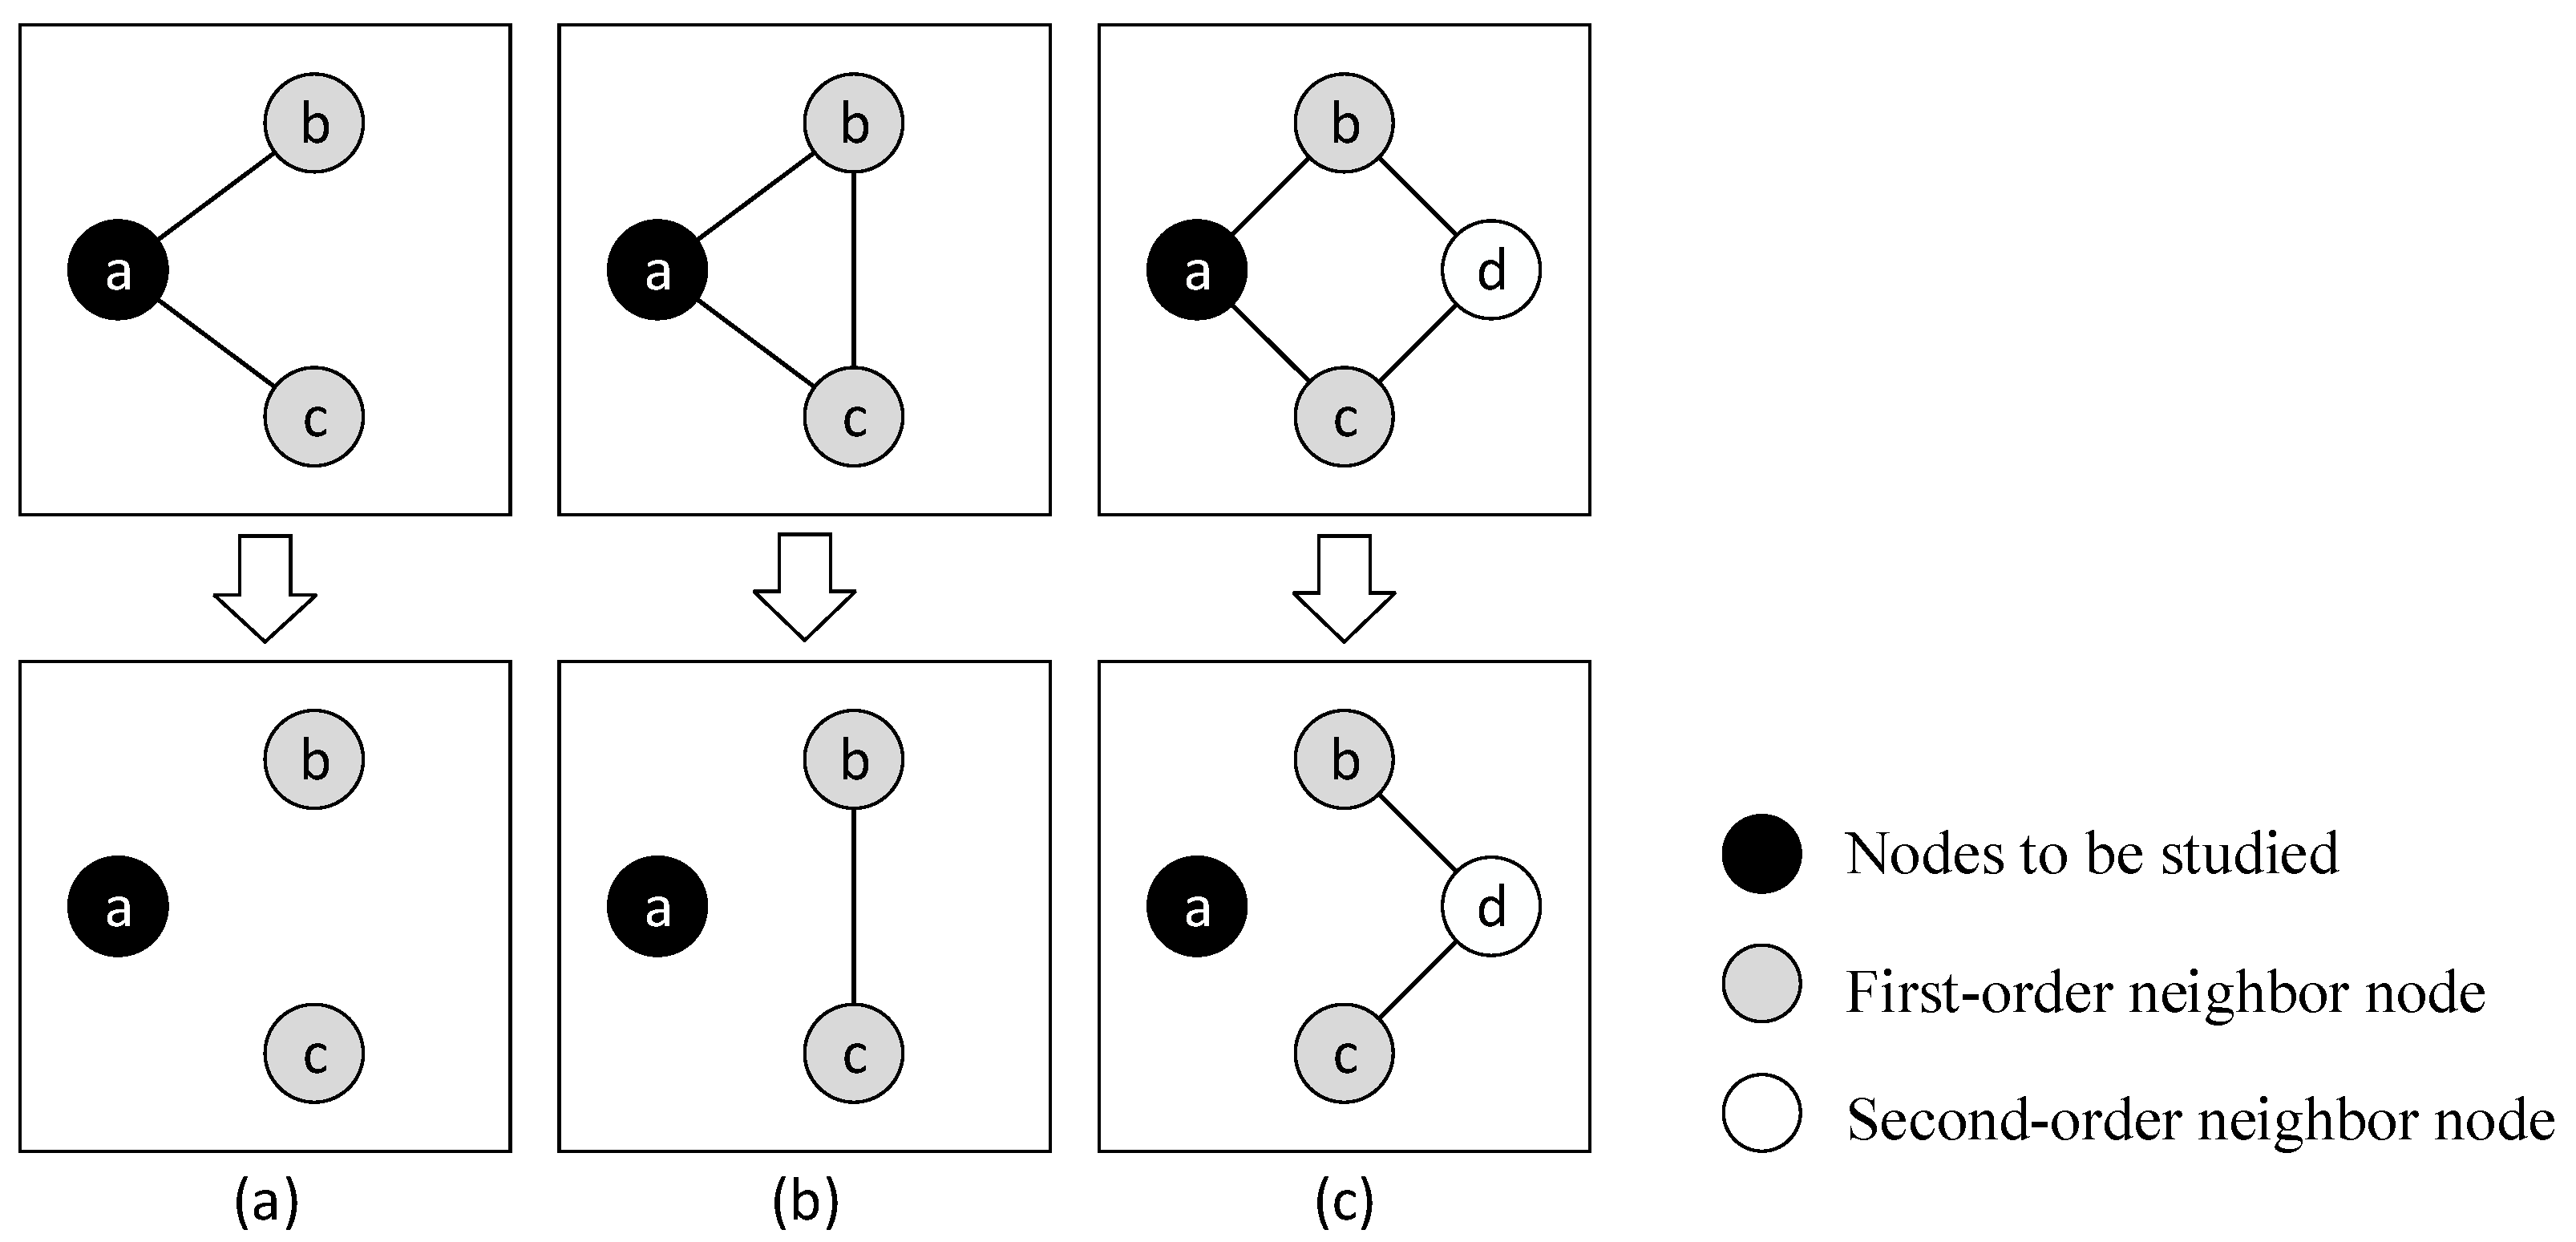
The importance of a node in a network depends not only on its own degree but also on the dependency of its neighboring nodes, specifically its first-order neighboring nodes [13]. As illustrated in Figure 1a, node a has a smaller degree than its neighbors b and c. However, from a topological perspective, an attack on node a would disintegrate the network into three isolated subnetworks, causing maximal structural damage. Moreover, from an information propagation standpoint, any communication between nodes from different subnetworks must traverse node a, underscoring its critical role in network-wide information flow. In contrast, Figure 1b shows that if neighboring nodes b and c share direct or indirect connections (e.g., through shared neighbors), the network remains largely connected even if node a is compromised. This enhances the network’s robustness and resilience. Such connectivity between neighbors diminishes the importance of the hub node a.
The impact of neighborhood topology on node importance is further demonstrated in Figure 2. Furthermore, in Figure 2a nodes b and c lack direct edges or shared neighbors (excluding a). Removing a fragments the network. In Figure 2b, nodes b and c are directly connected. The network remains intact after a’s removal. In Figure 2c, nodes b and c share neighbors other than a. The network retains connectivity post-a’s removal. These cases reveal two mechanisms by which neighborhoods influence node importance: direct connections between neighboring nodes (Figure 2b) and indirect connections through shared nodes (Figure 2c).
Node similarity serves as the foundation of local link similarity. The classical local link similarity algorithm employs the Jaccard index for direct computation. The classical local link similarity is defined as follows:
L L S ( i ) = b , c n ( i ) [ 1 s i m . J a c ( b , c ) ] = k i ( k i 1 ) b , c n ( i ) s i m . J a c ( b , c )
where LLS(i) represents the local link similarity of node i, where ki denotes the degree of node i, and sim.Jac(b, c) is the node similarity score between nodes b and c under the Jaccard index. Specifically, if there is a direct connection between nodes b and c, sim.Jac(b, c) equals 1. The importance of node i based on local link similarity, denoted as LLS(i), is calculated by averaging the similarity scores of all neighbor pairs within its neighborhood, normalized by its degree ki.

2.3. Electrical Parameter

We select node power flow and electrical distance as the electrical parameters for assessment.

2.3.1. Node Power Flow

Node power flow describes the magnitude of power passing through a node. The definition of node power flow is as follows:
W ( i ) = j n ( i ) W i j
where Wij represents the magnitude of power flow transmitted from node i to node j.

2.3.2. Electrical Coupling Connectivity

Electrical coupling connectivity is determined by the electrical distance between a node and other nodes, characterizing the node’s position within the power grid. A higher electrical coupling connectivity indicates a relatively higher critical position of the node [15]. The electrical coupling connectivity is defined as follows:
D e ( i ) = 1 j = 1 , j i N d i j
d i j = X i i + X j j 2 X i j
where dij denotes the shortest electrical distance between nodes i and j. In high-voltage power grids, resistance is negligible compared to reactance and can thus be ignored. Therefore, the electrical coupling connectivity is calculated using reactance values. Xij, Xjj, and Xii are elements of the node impedance matrix. Electrical coupling connectivity quantifies the strength of a node’s electrical interconnection with the system. From the perspective of power system structural parameters, a node with higher electrical coupling connectivity occupies a more critical position and faults occurring at such nodes are more likely to trigger cascading failures.

3. Electrical Local Link Similarity Algorithm (ELLS)

Based on the above analysis, we refine the local link similarity method through the following two approaches: replacing node similarity indices and integrating distinct electrical parameters. The flowcharts of these improved methods are illustrated in the figure below (Figure 3).
In this section we introduce five classical methods corresponding to the aforementioned indices, along with their improved variants and electrically augmented methods incorporating different electrical parameters, totaling 25 methods. These will be systematically compared in the following chapter.

3.1. ILLS

The classical local link similarity algorithm calculates the similarity between every pair of neighboring nodes for node ii, resulting in an importance score that incorporates a squared degree term. This leads to an excessive weighting of node degrees in the importance score, thereby compromising the reliability of the assessment. To mitigate the disproportionate influence of node degrees during importance weighting, the following refinement is applied to the local link similarity-based importance metric:
I L L S ( i ) = 1 + 1 k i L L S ( i ) = k i 1 k i j = 1 n l = 1 , l j n A i j A l i s i m . J a c ( l , j )
From Equation (10), it can be observed that the importance of a node based on local link similarity is jointly determined by its degree and local link similarity. A higher degree implies more connected paths for the node, leading to greater importance. Conversely, a higher local link similarity indicates that the node’s role becomes more replaceable, thereby reducing its importance.
Additionally, the classical local link similarity algorithm directly employs the Jaccard index for computation, neglecting other node similarity metrics. In this study, we replaced the Jaccard index with alternative similarity metrics to calculate local link similarity, deriving four additional definitions of local link similarity.
The improved local link similarity based on the Salton index is defined as follows:
I L L S . S a l ( i ) = 1 + 1 k i b , c n ( i ) [ 1 s i m . S a l ( b , c ) ]
The improved local link similarity based on the Sørensen index is defined as follows:
I L L S . S o r ( i ) = 1 + 1 k i b , c n ( i ) [ 1 s i m . S o r ( b , c ) ]
The improved local link similarity based on the HPI is defined as follows:
I L L S . H P I ( i ) = 1 + 1 k i b , c n ( i ) [ 1 s i m . H P I ( b , c ) ]
The improved local link similarity based on the HDI is defined as follows:
I L L S . H D I ( i ) = 1 + 1 k i b , c n ( i ) [ 1 s i m . H D I ( b , c ) ]
For simplicity, the term ILLS will hereafter represent any improved local link similarity algorithm corresponding to a specific node similarity index.

3.2. ELLS

Building upon the improved local link similarity algorithm developed in the preceding section, we further integrate the effects of node power flow (W) and electrical coupling connectivity (De). Specifically, we extend the improved algorithm by incorporating multiplier terms for the following:
  • Power flow W,
  • Electrical coupling connectivity De,
  • The product of both (W·DeW·De).
Thus, we derive the following three groups of ELLS algorithms:
E L L S . W ( i ) = I L L S ( i ) W ( i )
E L L S . D e ( i ) = I L L S ( i ) D e ( i )
E L L S . W . D e ( i ) = I L L S ( i ) W ( i ) D e ( i )
In summary, we have established all algorithms required for investigation.

3.3. Evaluation Metrics for Algorithms

To evaluate whether the node importance assessment algorithms derived in the previous section are suitable for power grids, we select the loss of load size as the evaluation metric [16]. The loss of load size quantifies the magnitude of load loss in the power grid after node removal. Its calculation method is described as follows:
Δ L i = D i C i D i > C i 0 D i < C i
L O L = 1 D i = 1 s Δ L i
where Equation (18) calculates the load loss in subsystem i after node removal, where Ci and Di represent the generation capacity and load demand of subsystem i, respectively. Equation (19) computes the loss of load size, where D denotes the total load demand of the entire power system in its initial state and ss represents the number of subsystems after node removal. The loss of load size quantifies the reduction in the power system’s supply capability post-node removal. A larger loss of load size indicates that the attacked node is more critical.

4. Case Study

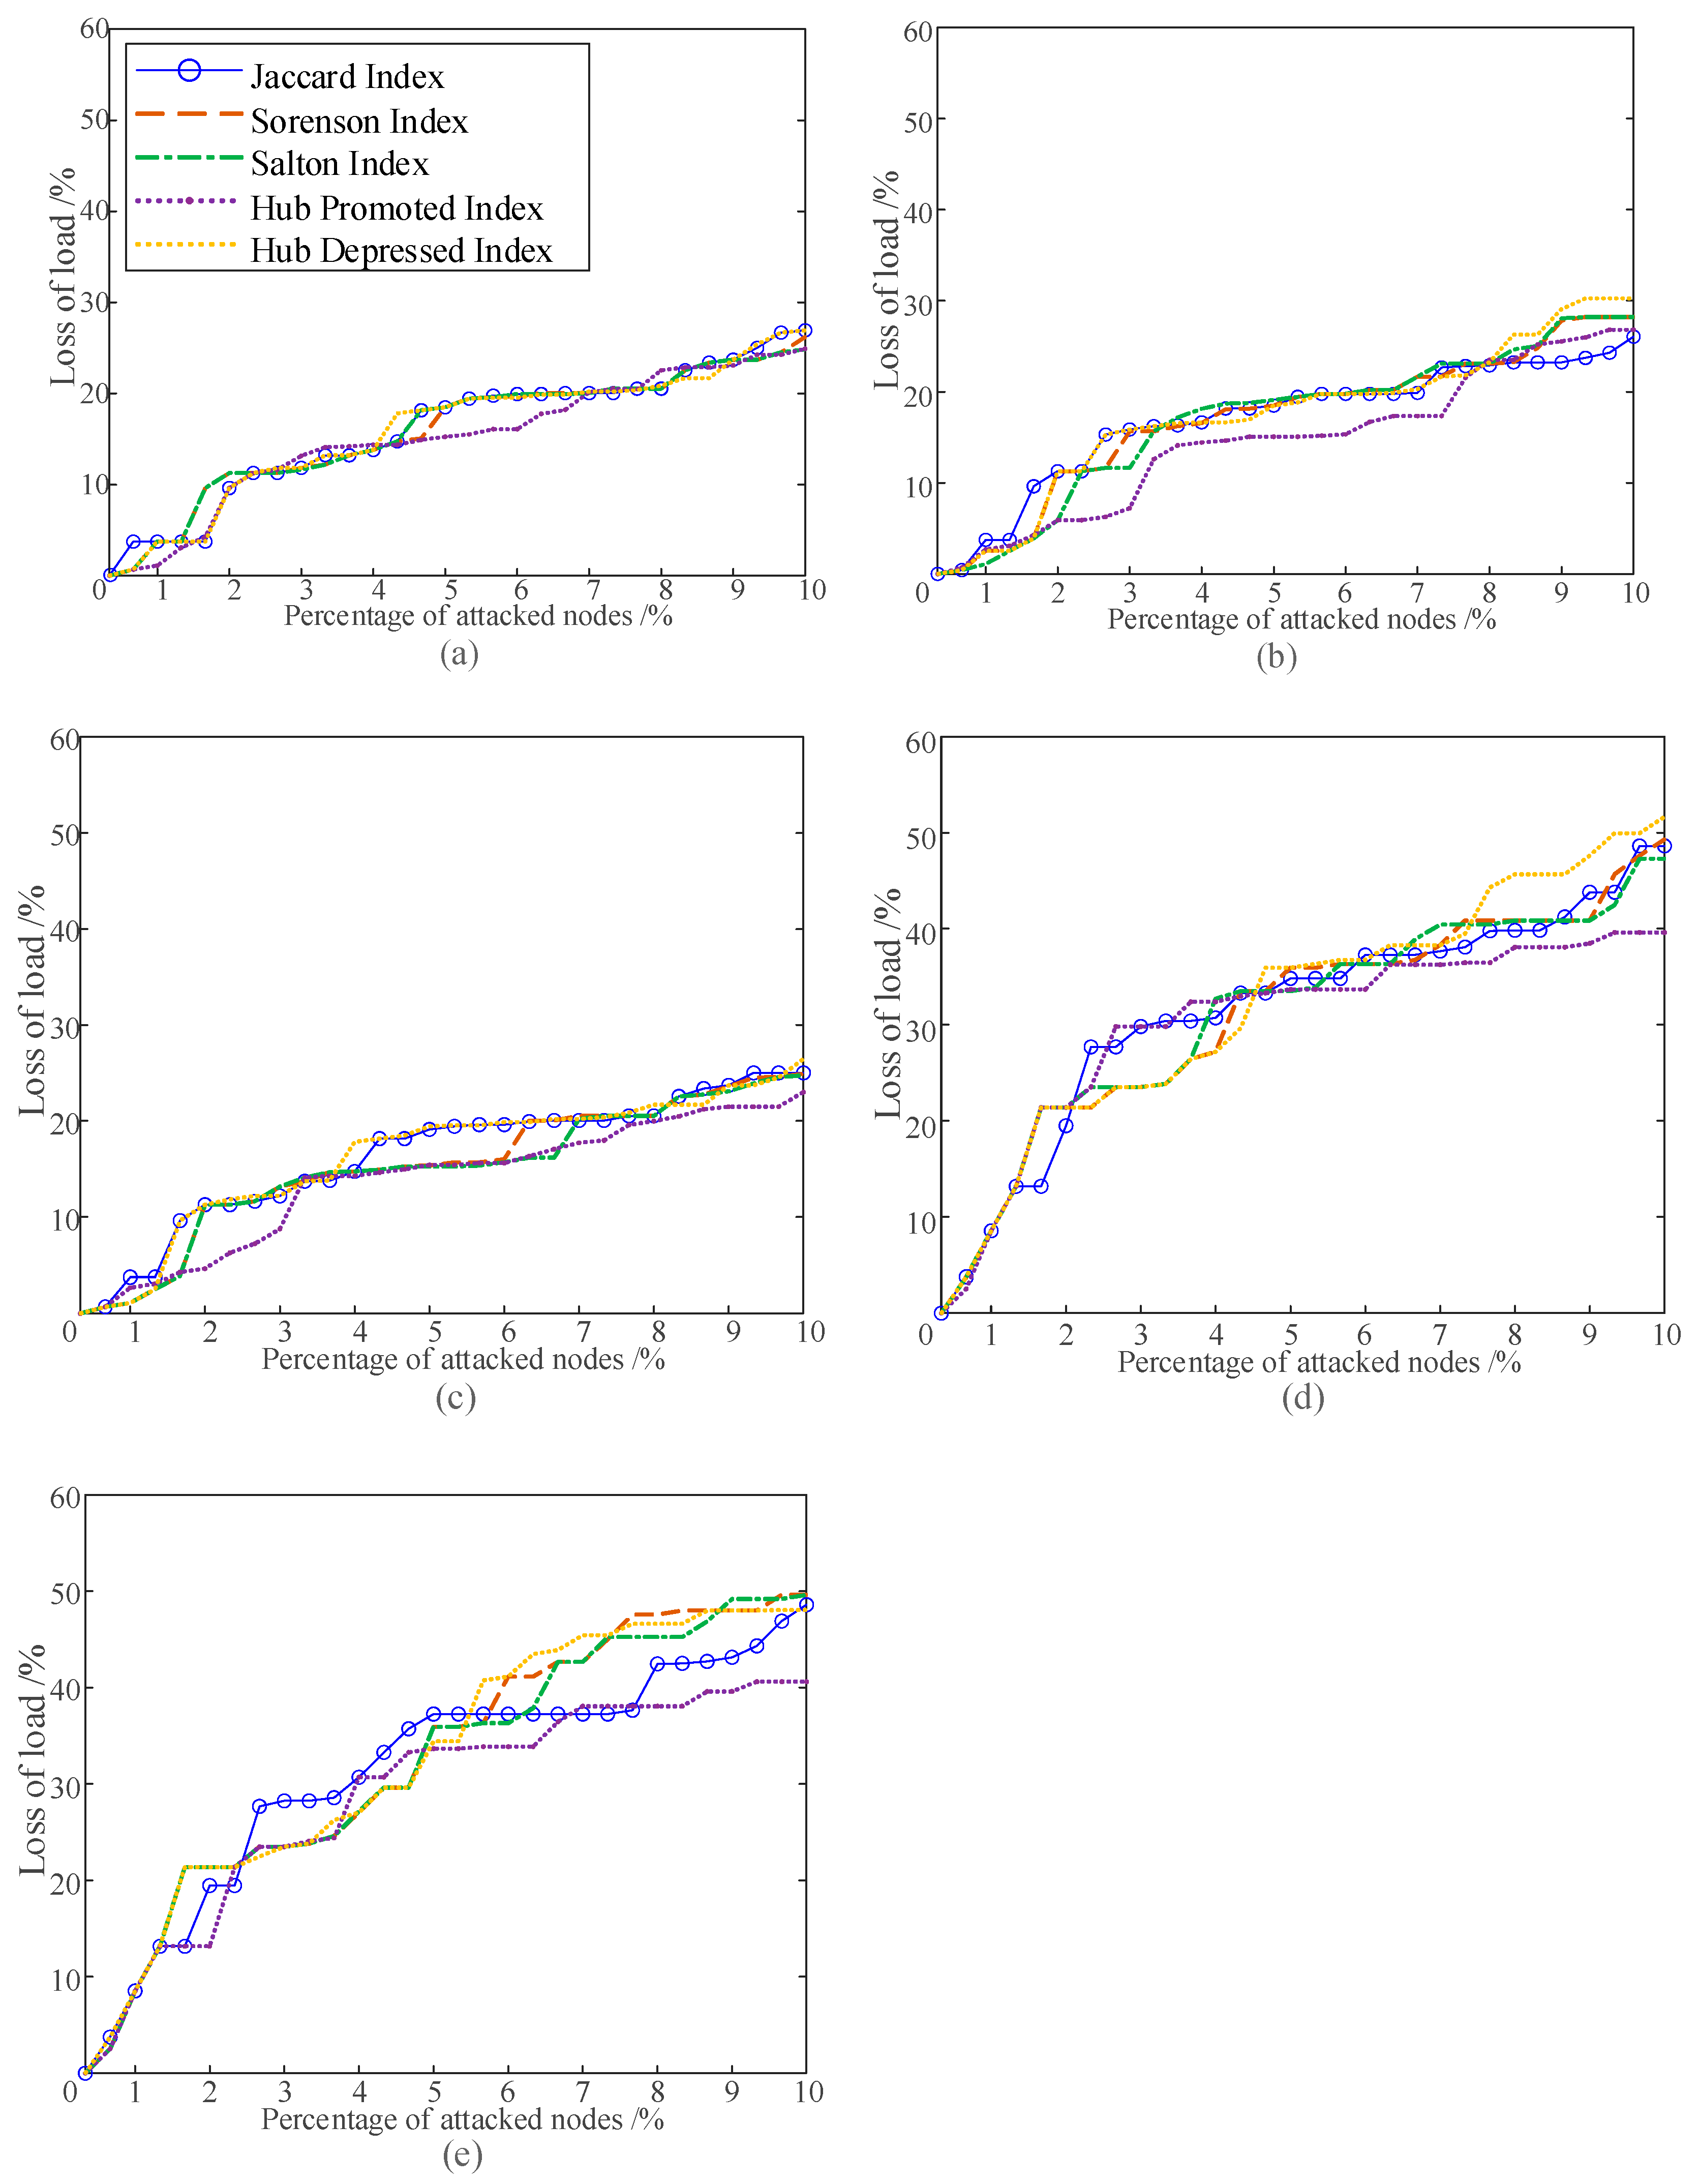
Following the ranking order generated by each algorithm, we sequentially attack the top 10% of nodes in the IEEE 300-bus system based on their importance scores, obtaining the corresponding loss-of-load-size curves for each method. These curves are compared by grouping methods either row-wise or column-wise in Figure 1 to investigate which improvements are more effective. The selected methods are then benchmarked against classical approaches, such as the electrical betweenness algorithm and the MBCC-HITS algorithm, to validate the rationality and superiority of the proposed methodology.

4.1. Comparative Analysis of Algorithms Using Different Metrics

The following is shown in Figure 4 and Table 2:
  • Algorithms using the HDI yield the largest loss of load size when the top 10% of nodes are attacked.
  • The Jaccard index consistently achieves the best performance in evaluating the top 1% critical nodes.
  • For nodes beyond the top 1%, the performance differences among the Jaccard, Salton, Sørensen, and HDI indices are negligible.
  • The HPI generally underperforms, except for a segment between 2% and 5% in Figure 4d.
These findings demonstrate that, among the five indices studied, the Jaccard index is the most suitable metric for assessing power node importance—particularly for identifying the top 1% critical nodes—while the HPI is the least appropriate for this purpose.

4.2. Comparative Analysis of Algorithms with Different Improvements

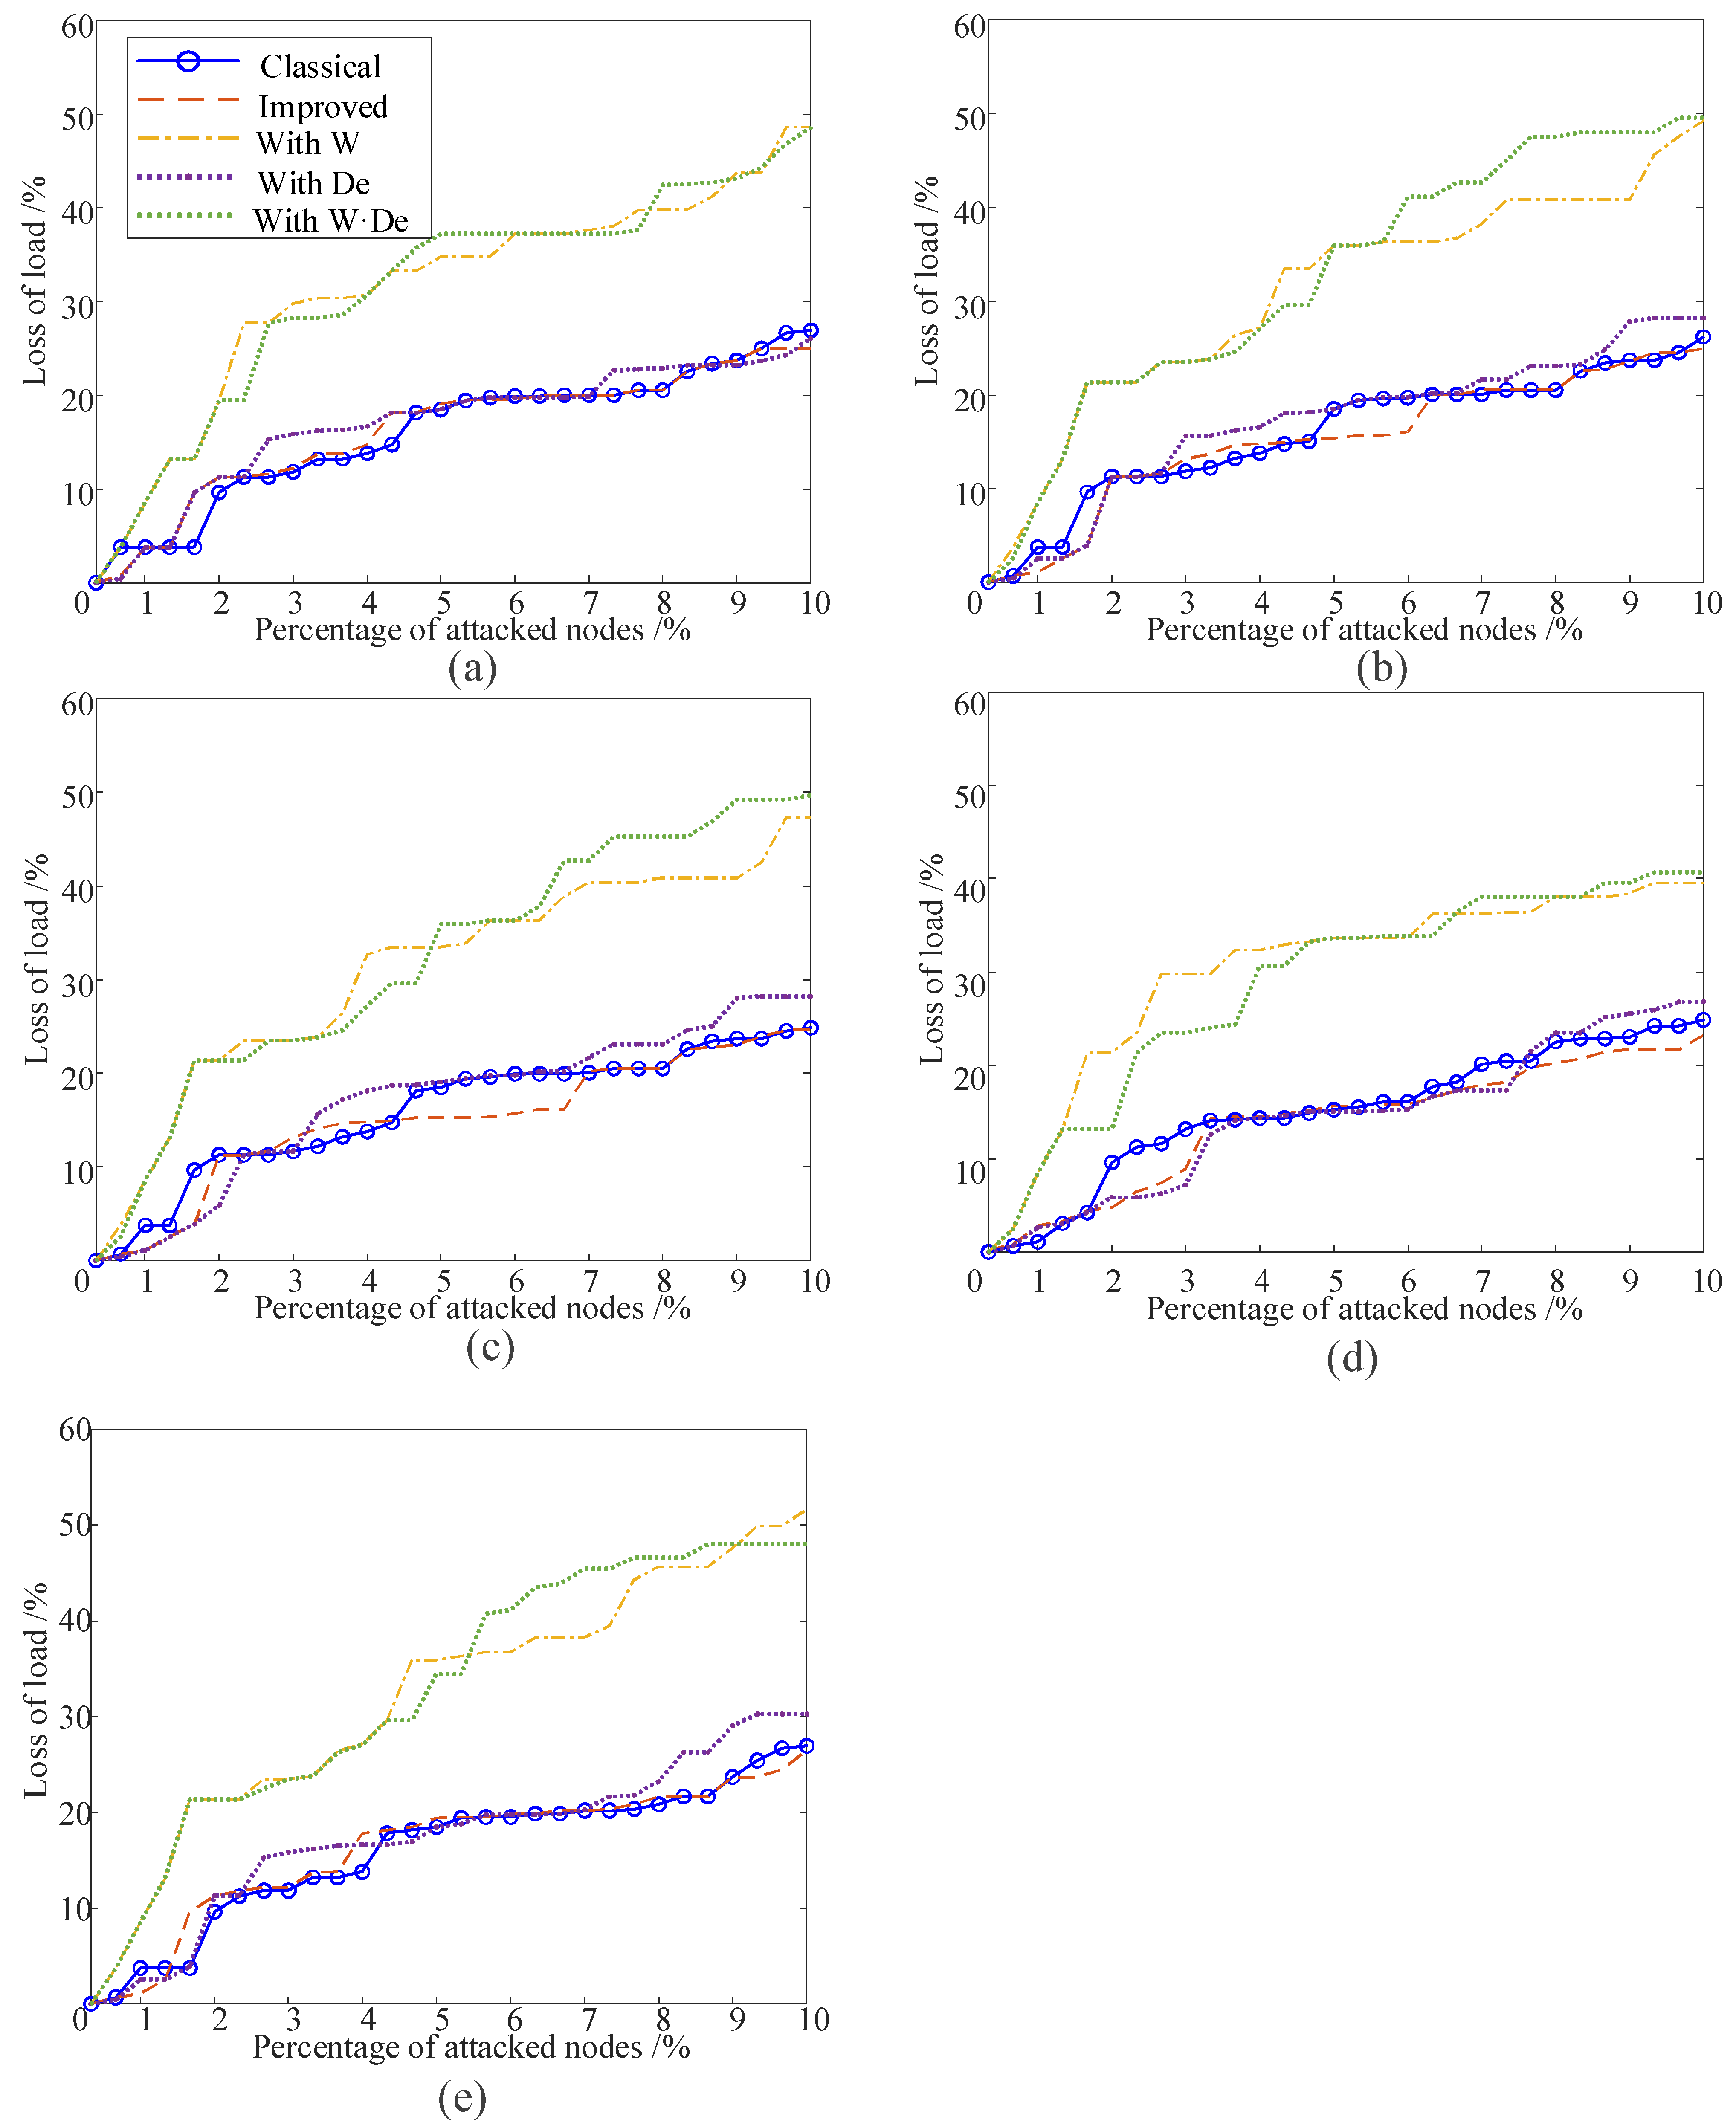
The following is shown in Figure 5 and Table 3:
  • ELLS with W and ELLS with W·De demonstrate significant improvements over classical algorithms, while improved algorithms and ELLS with De show only marginal gains.
  • It can be seen from the two lines of ELLS with W and ELLS with W·De in Figure 5 that there is a demarcation point at about 5%. ELLS with W achieves optimal performance in evaluating the top 5% critical nodes, whereas ELLS with W·De excels in assessing nodes ranked 5–10% in importance.
These results validate the effectiveness of the proposed improvements to classical algorithms. A hybrid approach combining ELLS with W and ELLS with W·De can provide a comprehensive evaluation of power node importance.

4.3. Comparative Analysis of the Proposed Algorithm and Classical Algorithms

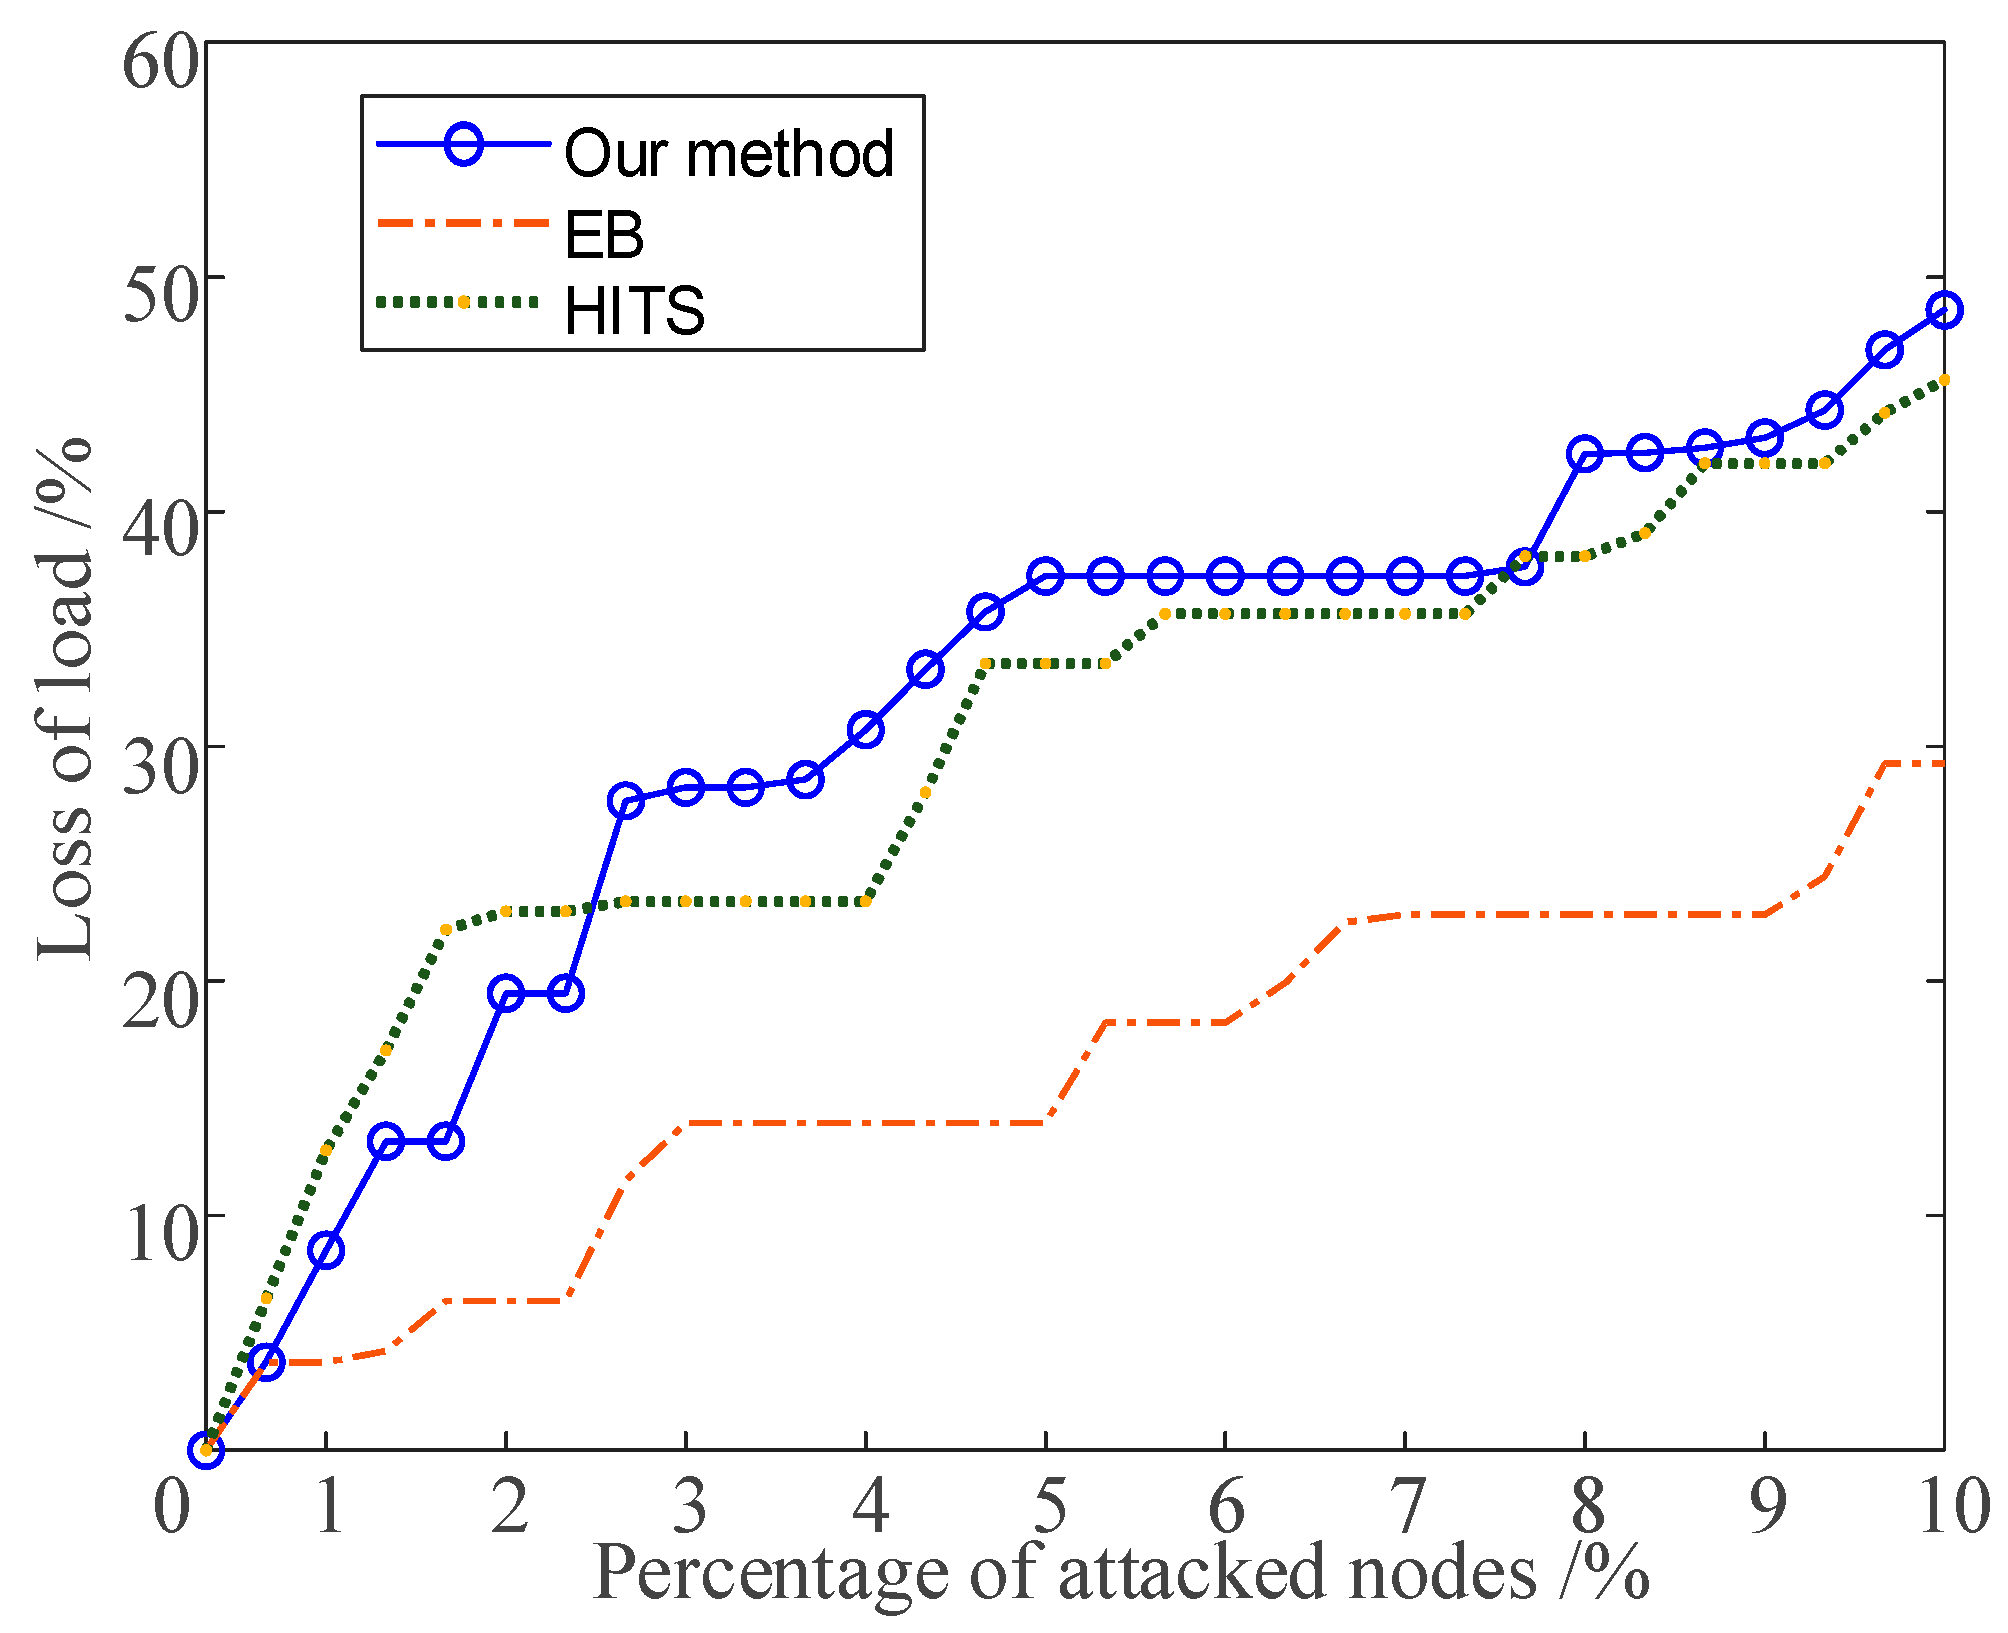
As shown in Figure 6, in the evaluation of the top 10% critical nodes our method outperforms the electrical betweenness algorithm on 22 nodes and surpasses the HITS algorithm across all nodes, demonstrating notable superiority.

5. Conclusions

This study addresses the limitation of the classical LLS algorithm in adapting to power grid physical contexts by proposing a novel node importance assessment metric that integrates local link similarity, node power flow, and electrical coupling connectivity. Validated through simulations on the IEEE 300-bus system, the main research findings are as follows:
  • The Jaccard index-based algorithm achieves optimal performance in evaluating the top 1% critical nodes, highlighting its reliability in assessing topological redundancy.
  • The electrically augmented ELLS algorithms (e.g., ELLS with W and ELLS with W·De) significantly outperform traditional topology-only methods. Specifically, ELLS with W exhibits the highest accuracy for the top 5% nodes, while ELLS with W·De excels in evaluating nodes ranked 5–10%.
  • Compared to classical methods such as electrical betweenness and HITS, the proposed hybrid strategy (combining W and W·De) demonstrates comprehensive superiority in global node importance ranking. The loss-of-load-size curves further validate its effectiveness in cascading failure prevention.
  • As shown in Figure 6, the top 10% of nodes identified by our method demonstrate superior loss-of-load metrics compared to the electrical betweenness (EB) algorithm. This indicates that our approach more accurately assesses critical nodes in power systems than EB. Furthermore, excluding the top 7 most critical nodes, our method outperforms the HITS algorithm in evaluating significant nodes, as evidenced by its improved loss-of-load-metrics performance across the remaining top 10%.
This study confirms that incorporating power grid-specific parameters (e.g., power flow distribution, electrical distance) significantly enhances the engineering applicability of node criticality models. These models can now identify nodes with the potential to trigger cascading failures with reasonable accuracy—providing actionable insights for power system vulnerability analysis and protection strategy optimization.

Author Contributions

Conceptualization, G.S. and J.G.; methodology, G.S.; software, G.S.; validation, G.S., X.S. and G.H.; formal analysis, X.S.; investigation, G.S.; resources, G.S. and J.G.; data curation, G.S.; writing—original draft preparation, G.S.; writing—review and editing, X.S.; visualization, G.S.; supervision, X.S. and J.G.; project administration, G.S.; funding acquisition, G.S. and X.S. All authors have read and agreed to the published version of the manuscript.

Funding

This research received no external funding.

Data Availability Statement

The original contributions presented in this study are included in the article. Further inquiries can be directed to the corresponding author.

Conflicts of Interest

Author Junqi Geng was employed by the State Grid Shandong Electric Power Company Zibo Power Supply Company. The remaining authors declare that the research was conducted in the absence of any commercial or financial relationships that could be construed as a potential conflict of interest.

Abbreviations

The following abbreviations are used in this manuscript:
LLSLocal Link Similarity Algorithm
ILLSImproved Local Link Similarity Algorithm
ELLSElectrical Local Link Similarity Algorithm

References

  1. Sun, H.; Xu, T.; Guo, Q.; Li, Y.; Lin, W.; Yi, J.; Li, W. Analysis on blackout in Great Britain power grid on August 9th, 2019 and its enlightenment to power grid in China. Proc. CSEE 2019, 39, 6183–6192. [Google Scholar]
  2. Wang, W.; Lin, W.; He, G.; Shi, W.; Feng, S. Enlightenment of 2021 Texas blackout to the renewable energy development in China. Proc. CSEE 2021, 41, 4033–4043. [Google Scholar]
  3. Chen, S.; Liang, S.; Li, S.; Zhou, Y.; Yu, X. Power grid vulnerability evaluation based on electrical centrality indicators. Distrib. Util. 2021, 38, 70–76. [Google Scholar]
  4. Li, Q.; Li, T.; Lin, D. Planning method of measurement terminals in active distribution networks based on node vulnerability. Distrib. Util. 2021, 38, 35–40. [Google Scholar]
  5. Feng, H.; Li, H.; Wang, Y. Comprehensive Vulnerability Assessment Method for Nodes Considering Anti-interference Ability and Influence. Proc. CSU-EPSA 2017, 29, 91–96. [Google Scholar]
  6. Albert, R.; Albert, I.; Nakarado, G.I. Structural vulnerability of the North American power grid. Phys. Rev. E 2004, 69, 025103. [Google Scholar] [CrossRef] [PubMed]
  7. Dai, J.; Wang, W. Importance Evaluation of Complex Power Network Nodes Based on TOPSIS. J. Univ. South China (Sci. Technol.) 2022, 36, 94–100. [Google Scholar]
  8. Wang, K.; Zhang, B.; Zhang, Z.; Yin, X.; Wang, B. An electrical betweenness approach for vulnerability assessment of power grids considering the capacity of generators and load. Phys. A Stat. Mech. Appl. 2011, 390, 4692–4701. [Google Scholar] [CrossRef]
  9. Liu, H.; Niu, J.; Liu, B.; Zhang, S. Research on identification method of critical node and countermeasures inlarge scale interconnected power grids. J. Electr. Power Sci. Technol. 2020, 35, 115–121. [Google Scholar]
  10. Geng, J.; Sun, X.; Song, H.; Qu, Y. Important node evaluation algorithm for electrical power systeminspired by internet thinking. J. Natl. Univ. Def. Technol. 2023, 45, 211–218. [Google Scholar]
  11. Zhu, G.; Wang, X.; He, R.; Tian, M.; Dai, D.; Zhang, Q. Identification of Vital Node in Power Grid Based on Importance Evaluation Matrix. High Volt. 2016, 42, 3347–3353. [Google Scholar]
  12. Guo, L.; Liu, Y.; Lin, S.; Liu, Y.; Zhang, M.; Hu, J. Distribution grid evaluation system and control strategy based on power supply reliability. Electr. Eng. 2023, 11, 79–82+87. [Google Scholar]
  13. Ruan, Y.; Lao, S.; Wang, J. Node importance measurement based on neighborhood similarity in complex network. Acta Phys. Sin. 2017, 66, 038902. [Google Scholar] [CrossRef]
  14. Zhou, T.; Lv, L.; Zhang, Y.-C. Predicting missing links via local information. Eur. Phys. J. B 2009, 71, 623–630. [Google Scholar] [CrossRef]
  15. Hua, H.E.; Jun, L.; Yanan, S.; Fan, C.; Ganyun, L.; Xiaolian, Z. Heuristic Method Island Partition of Distribution Network Based on Node Electrical Coupling Connectivity. Electrotech. Electric. 2017, 10, 7–11. [Google Scholar]
  16. Sheng, J.; Dai, J.; Wang, B.; Duan, G.; Long, J.; Zhang, J.; Guan, K.; Hu, S.; Chen, L.; Guan, W. Identifying influential nodes in complex networks based on global and local structure. Physical A 2020, 541, 123262. [Google Scholar] [CrossRef]
Figure 1. Network after attack on node a in different neighborhood cases. (a) The neighborhoods of node a are not linked. (b) The neighborhoods of node a are linked.
Energies 18 03778 g001
Figure 2. Three neighborhood cases after attacking node a. (a) Nodes b and c have no link or common neighbor. (b) Nodes b and c have a link. (c) Nodes b and c have a common neighbor.
Energies 18 03778 g002
Figure 3. Flow chart of the improved methods.
Energies 18 03778 g003
Figure 4. Loss-of-load-size curves of the first 10% important nodes attacked. (a) Classical algorithm; (b) improved algorithm; (c) electrical algorithm with De; (d) electrical algorithm with W; (e) electrical algorithm with W and De.
Energies 18 03778 g004
Figure 5. Loss-of-load-size curves of the first 10% important nodes attacked. (a) Jaccard index; (b) Sorenson index; (c) Salton index; (d) HPI; (e) HDI.
Energies 18 03778 g005
Figure 6. Loss-of-load-size curves of the first 10% important nodes attacked.
Energies 18 03778 g006
Table 1. The difference between the classical algorithm and the.
Classical AlgorithmProposed Algorithm
1. Select the Jaccard index as the node similarity index.1. Comparing a variety of node similarity indexes, from which the best performance is selected.
2. Evaluation of node importance only from the perspective of topology.2. Considering both the network topology and different electrical parameters and selecting the better one.
Table 2. Loss of load size of the first 10% nodes attacked of each algorithm with a different index.
Loss of Load SizeJaccardSorensonSaltonHPIHDI
Classical algorithm26.93326.205 24.853 24.912 26.933
Improved algorithm25.007 24.904 24.739 23.011 26.463
Electrical algorithm with W48.617 49.308 47.288 39.596 51.646
Electrical algorithm with De26.052 28.206 28.206 26.805 30.247
Electrical algorithm with W and De48.603 49.62649.62640.618 48.054
Bold values in the table indicate the maximum value in each row.
Table 3. Loss of load size of the first 10% of nodes attacked of different algorithms with the same index.
Loss of Load SizeClassicalImprovedWith WWith DeWith W and De
Jaccard26.93325.00748.61726.05248.603
Sorenson26.20524.90449.30828.20649.626
Salton24.85324.73947.28828.20649.626
HPI24.91223.01139.59626.80540.618
HDI26.93326.46351.64630.24748.054
Bold values in the table indicate the maximum value in each row.
Disclaimer/Publisher’s Note: The statements, opinions and data contained in all publications are solely those of the individual author(s) and contributor(s) and not of MDPI and/or the editor(s). MDPI and/or the editor(s) disclaim responsibility for any injury to people or property resulting from any ideas, methods, instructions or products referred to in the content.