Article

Preparation and Electrochemical Performance of Zinc-Doped Copper Fluoride

1
EVE Energy Co., Ltd., Huizhou 516006, China
2
School of Materials Science and Engineering, Wuhan University of Technology, Wuhan 430070, China
*
Author to whom correspondence should be addressed.
Energies 2025, 18(14), 3752; https://doi.org/10.3390/en18143752
Submission received: 4 June 2025 / Revised: 29 June 2025 / Accepted: 3 July 2025 / Published: 15 July 2025

Abstract

To enhance the specific energy and rate performance of lithium primary batteries, the development of advanced cathode materials with superior electrochemical properties is essential. Fluorides, composed of light fluorine elements and multivalent cations, exhibit multi-electron reaction characteristics, possess a high theoretical voltage, and demonstrate high discharge-specific energy. However, owing to fluorine’s high electronegativity, which leads to the formation of strong ionic bonds with other elements, most fluorides exhibit poor electronic conductivity, thereby constraining their electrochemical performance when used as cathode materials. Copper fluoride (CuF2) exhibits a high theoretical specific capacity and discharge voltage but is constrained by its large bandgap, poor electronic conductivity, and difficulties in synthesizing anhydrous CuF2 materials, which significantly limit its electrochemical activity. In this study, zinc (Zn) was chosen as a dopant for copper fluoride. By combining theoretical calculations with experimental validation, the impacts of Zn doping on the structural stability and electrochemical performance of copper fluoride were comprehensively analyzed. The resultant highly active Zn-doped copper fluoride achieved a discharge specific capacity of 528.6 mAh/g at 0.1 C and 489.1 mAh/g at 1 C, showcasing superior discharge-specific energy and good rate performance. This material holds great potential as a promising cathode candidate for lithium batteries, providing both high specific energy and power density.

1. Introduction

Lithium primary batteries with lithium metal as the anode have garnered significant attention due to their high energy density, wide operating temperature range, long storage life, and maintenance-free characteristics. These batteries have been widely utilized in various fields, including defense and military, aerospace, smart healthcare, Internet of Things, etc. [1,2,3,4]. As devices that convert chemical energy into electrical energy, lithium primary batteries are mainly classified based on different cathode systems, such as lithium/thionyl chloride (Li/SOCl2), lithium/manganese dioxide (Li/MnO2), lithium/sulfur dioxide (Li/SO2), and lithium/iron disulfide (Li/FeS2) batteries. Since the anodes of lithium primary batteries are predominantly lithium metal, the specific energy and rate performance of these batteries are primarily determined by the cathode active materials. For example, Li/SOCl2 batteries exhibit high specific energy but suffer from extremely low discharge rates (typically less than 0.01 C); Li/MnO2 batteries demonstrate good discharge rates but possess relatively low energy density. To meet the demands of future electrical devices for longer battery life, lighter weight, and higher power, there is an urgent need to develop cathode material systems for lithium primary batteries with a higher specific energy and superior rate performance.
Fluorides, composed of the light element fluorine and multivalent cations, are capable of undergoing multi-electron redox reactions, thereby achieving higher energy densities compared to conventional single-electron systems. They represent one of the key pathways for developing next-generation high-specific-energy batteries [5,6]. For instance, carbon fluoride batteries have received considerable attention in recent years due to their high mass-specific energy. Copper fluoride (CuF2) also possesses a high theoretical mass-specific energy (1874 Wh kg−1) and volume-specific energy (7870 Wh L−1). Moreover, unlike other metal fluorides, CuF2 has a high theoretical discharge voltage (3.55 V), showing great potential for the development of high-specific-energy electrochemical energy storage devices [7,8,9,10]. However, similar to most metal fluorides, CuF2 is limited by its large bandgap and poor electronic conductivity, which stem from its strong ionic bonding characteristics, typically leading to low electrochemical activity [11,12,13,14]. In the last century, research on CuF2 cathode materials has been relatively scarce. This is because lithium ions diffuse slowly within CuF2, the insulating lithium fluoride formed during the reaction hinders electron transport, active substances inside the material often fail to undergo electrochemical reactions and thus contribute to capacity, and synthesizing high-purity anhydrous CuF2 remains challenging. Additionally, there is insufficient understanding regarding how to obtain anhydrous CuF2 with a high electrochemical activity, and the products frequently contain impurities, such as CuF2·H2O and CuOHF, resulting in discharge specific capacities and voltages that are significantly lower than theoretical values.
Based on the above, this study focuses on the synthesis of highly electroactive CuF2 materials. By doping to modulate the band structure and microstructure of CuF2, both electron and ion transport rates are significantly enhanced, thereby effectively improving its electrochemical activity. The transition metal Zn was selected as the dopant, and the effects of Zn doping on the structural and electrochemical properties of CuF2 were systematically investigated to develop high-specific-energy fluoride cathode materials with excellent electrochemical activity.

2. Experimental Methods

2.1. Material Preparation

Copper nitrate (Cu(NO3)2·3H2O) and zinc nitrate (Zn(NO3)2) were accurately weighed and dissolved in anhydrous ethanol under stirring until complete dissolution, forming a homogeneous mixed solution. Ammonium fluoride (NH4F) was separately dissolved in anhydrous methanol to prepare a clear solution. Subsequently, the NH4F solution was slowly added dropwise into the mixed solution under continuous stirring. After standing for a sufficient period, the resulting precipitate was collected by centrifugation, washed thoroughly with anhydrous ethanol, and dried at an appropriate temperature to obtain the precursor. The precursor was then subjected to heat treatment under a controlled atmosphere. After cooling to room temperature, the Zn-doped CuF2 material (ZnxCu1-xF2) was successfully synthesized.

2.2. Battery Assembly

The active material (ZnxCu1-xF2), conductive carbon black, and polyvinylidene fluoride (PVDF) binder were mixed in a weight ratio of 8:1:1 in N-methylpyrrolidone (NMP) solvent to form a homogeneous slurry. The slurry was uniformly coated onto aluminum foil using a doctor blade or similar method, and dried in a vacuum drying oven at a controlled temperature to completely remove the NMP solvent. The coated aluminum foil was subsequently rolled to enhance electrode density and punched into circular cathode sheets of appropriate size. The cathode sheets were further vacuum-dried at an elevated temperature to ensure the complete removal of residual moisture before use. Button-type simulated batteries were assembled in an argon-filled glove box with water and oxygen concentrations maintained below 10 ppm. Lithium metal sheets served as the anode, and 1 M LiCF3SO3 in an appropriate solvent was used as the electrolyte.

2.3. Material and Battery Testing

The microstructure of the prepared samples was characterized using a Zeiss Ultra Plus field emission scanning electron microscope (SEM, ZEISS, Obernkchen, Germany). Phase analysis of the samples was performed using a X’Pert PRO X-ray diffractometer (XRD, PANalytical B.V., Almelo, Netherlands) with a Cu Kα1 radiation source, over a diffraction angle range of 10°~80°. The microstructural analyses of the materials were conducted using a JEM-1400Plus transmission electron microscope (TEM, Japan Electronics Corporation, Tokyo, Japan). The ICP tests were conducted on the Prodigy 7 from LEEMAN LABS INC. Elemental distribution in the doped samples was analyzed using an ESCALAB-250Xi X-ray photoelectron spectrometer (XPS, Thermo Fisher, USA). The electrochemical performance of the button batteries was evaluated using a Land CT2001A battery testing system from Wuhan Land. Cyclic voltammetry (CV) and electrochemical impedance spectroscopy (EIS) measurements were carried out using a CHI760D electrochemical workstation (Chenhua, Shanghai, China). EIS measurements were performed in the frequency range of 100 kHz to 100 mHz, with an amplitude of 5 mV.

3. Results and Analysis

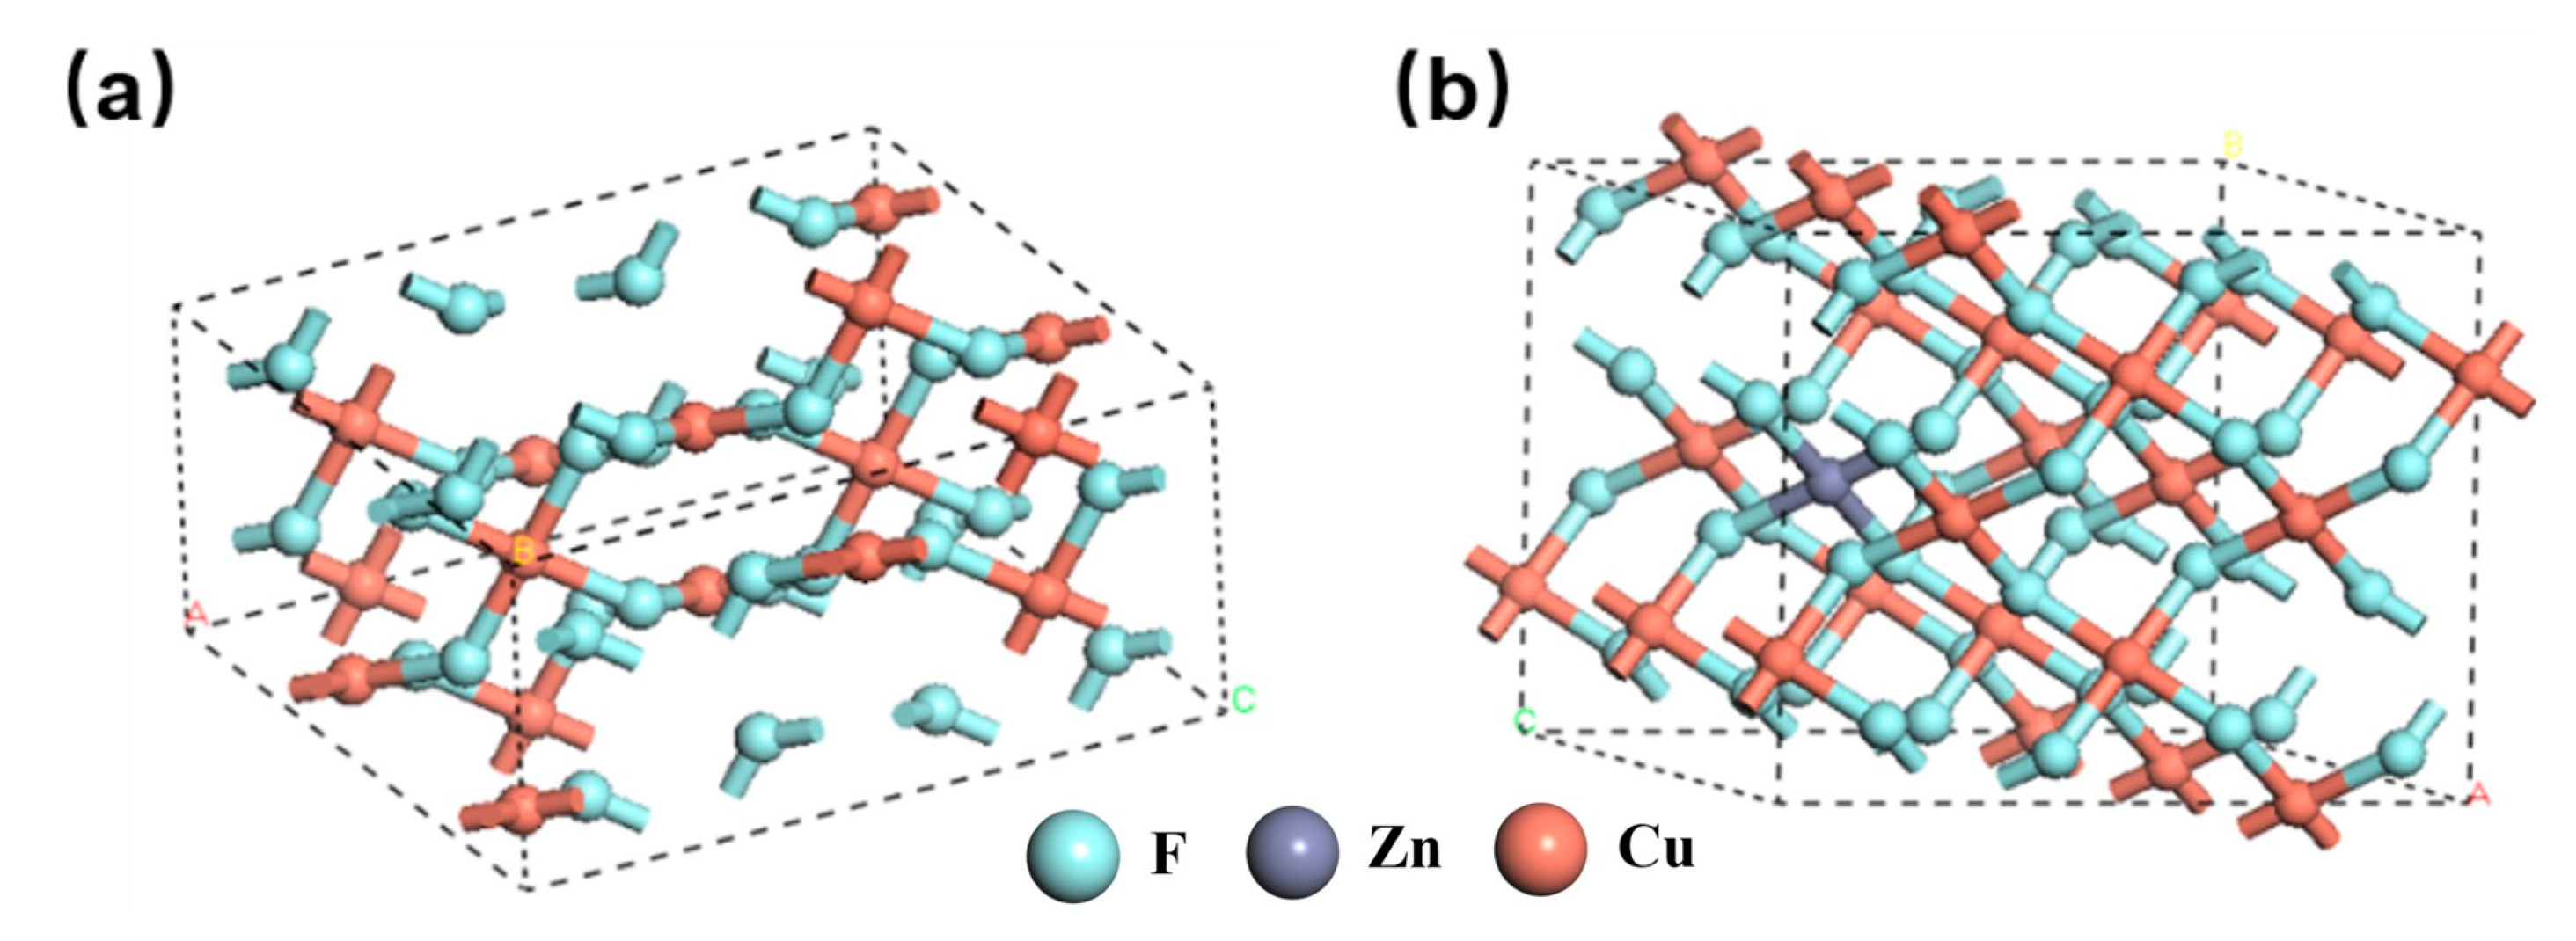
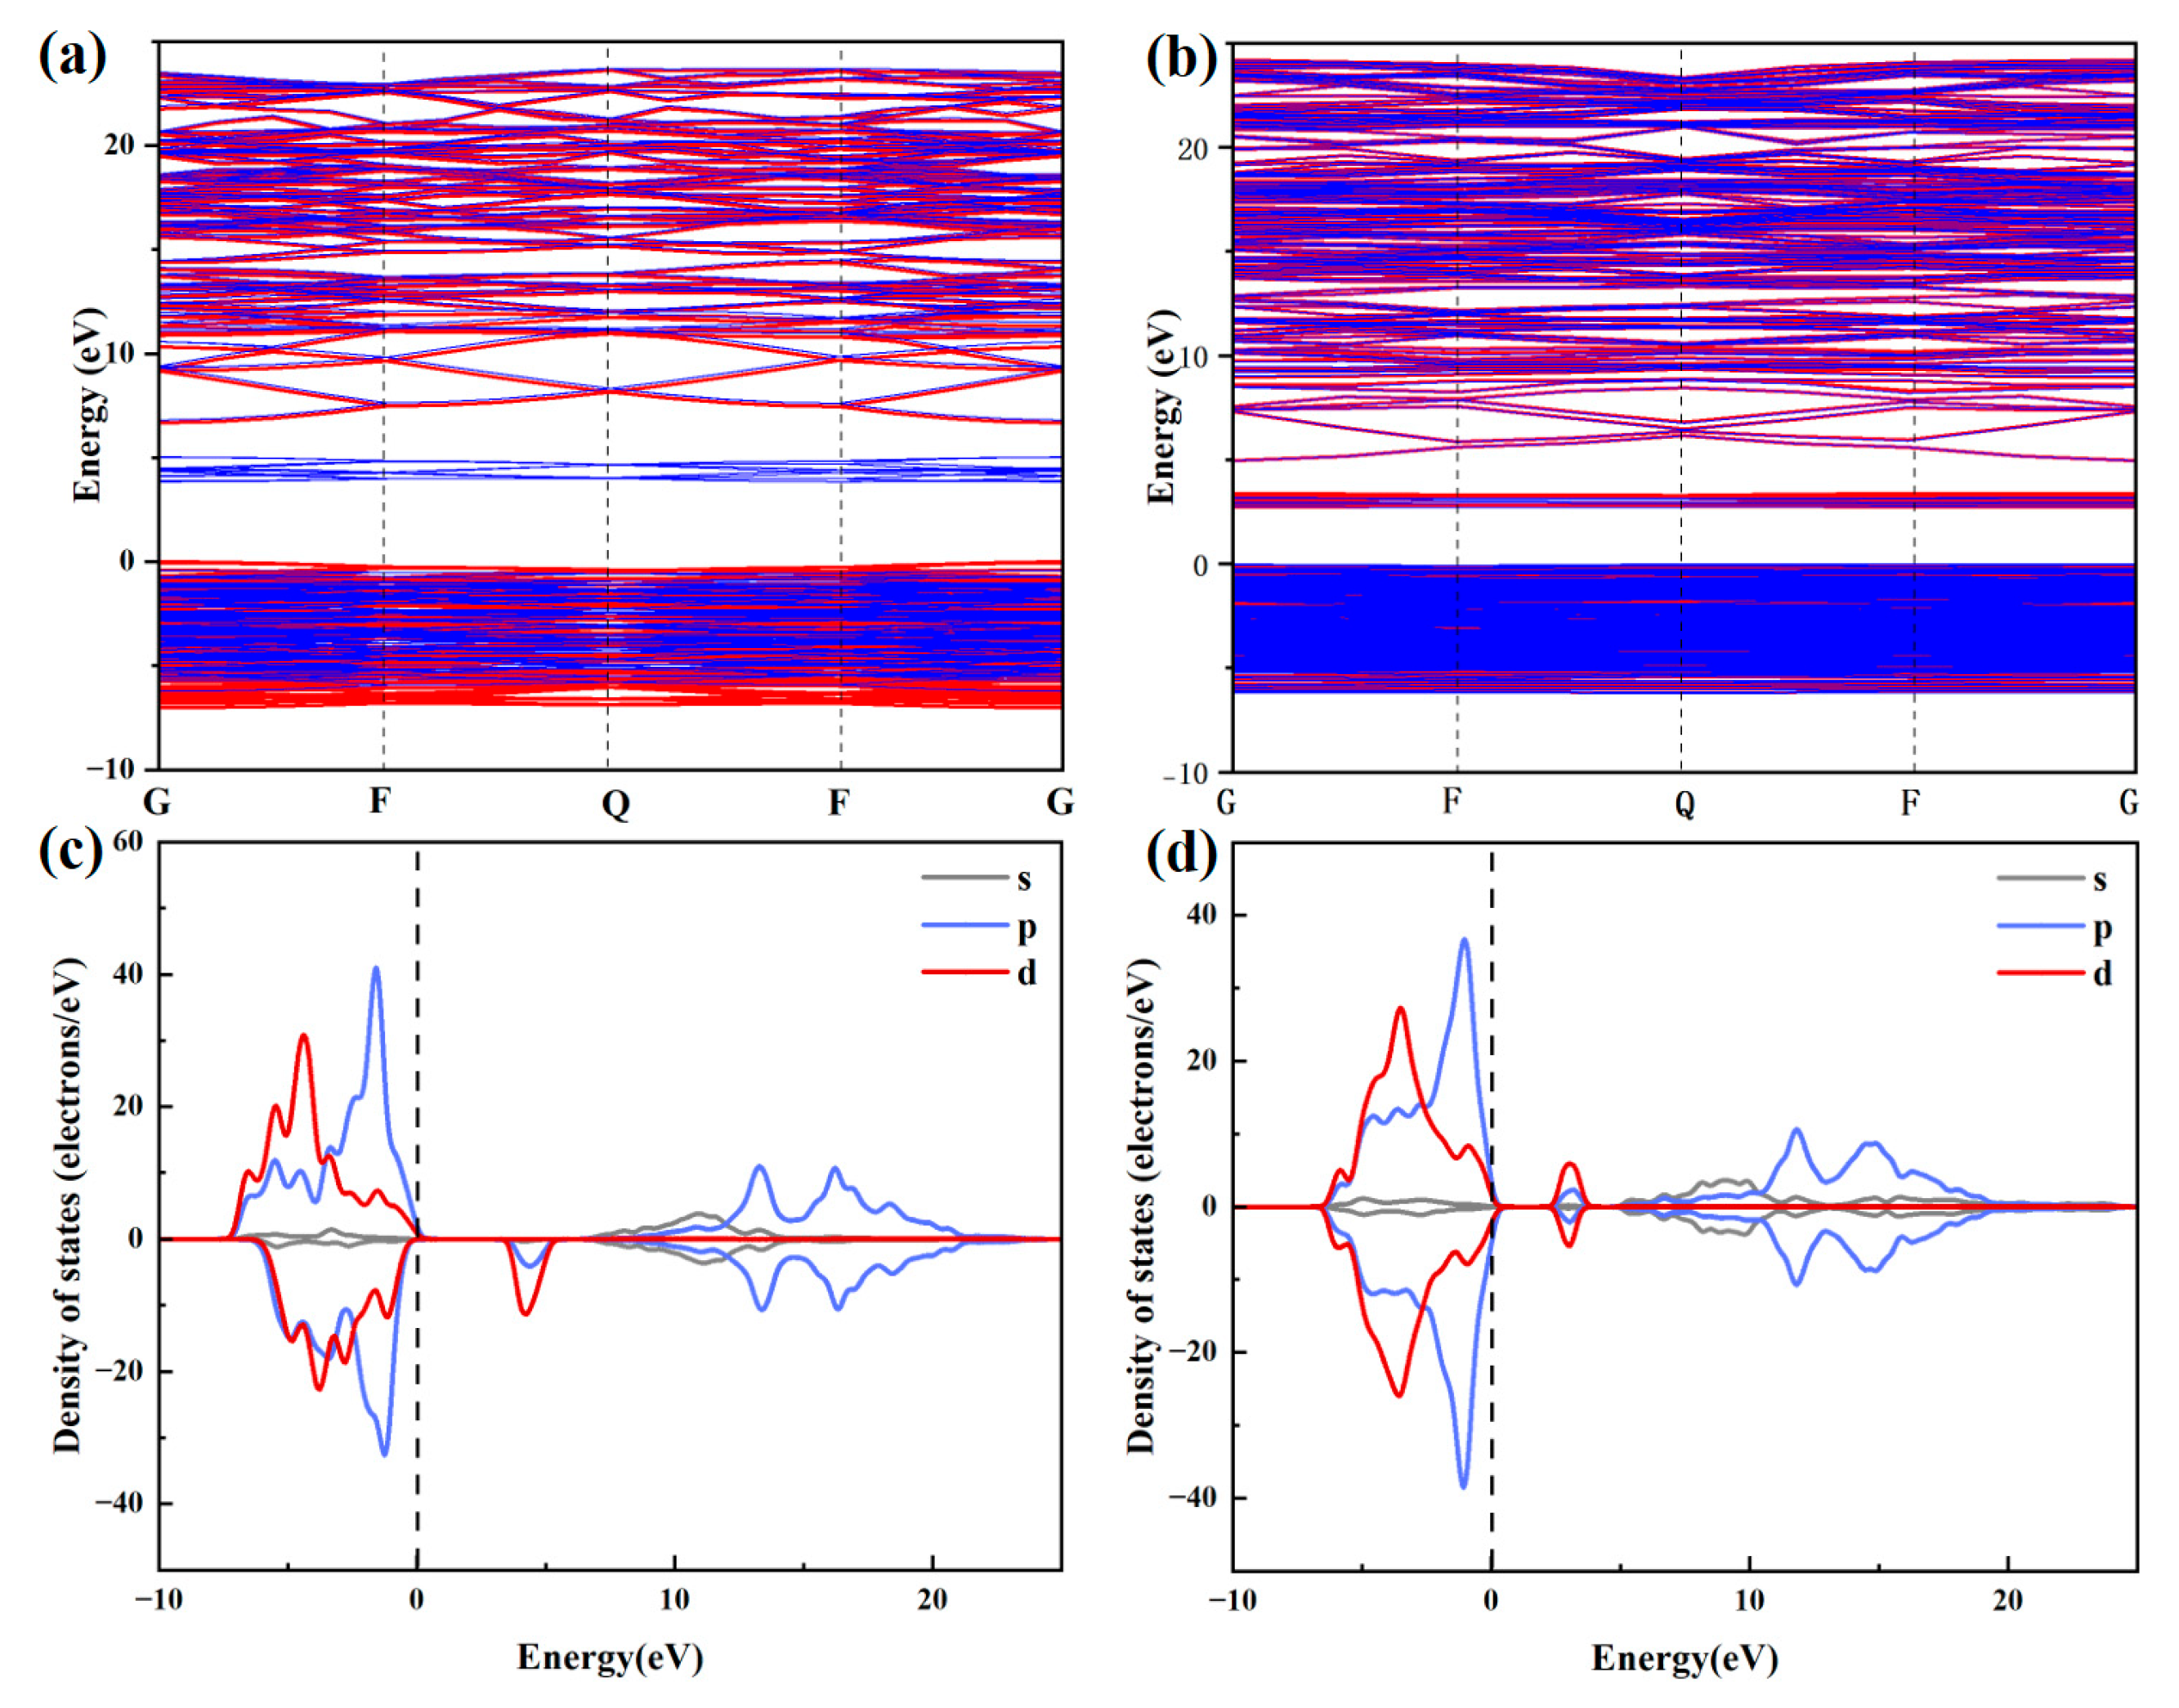
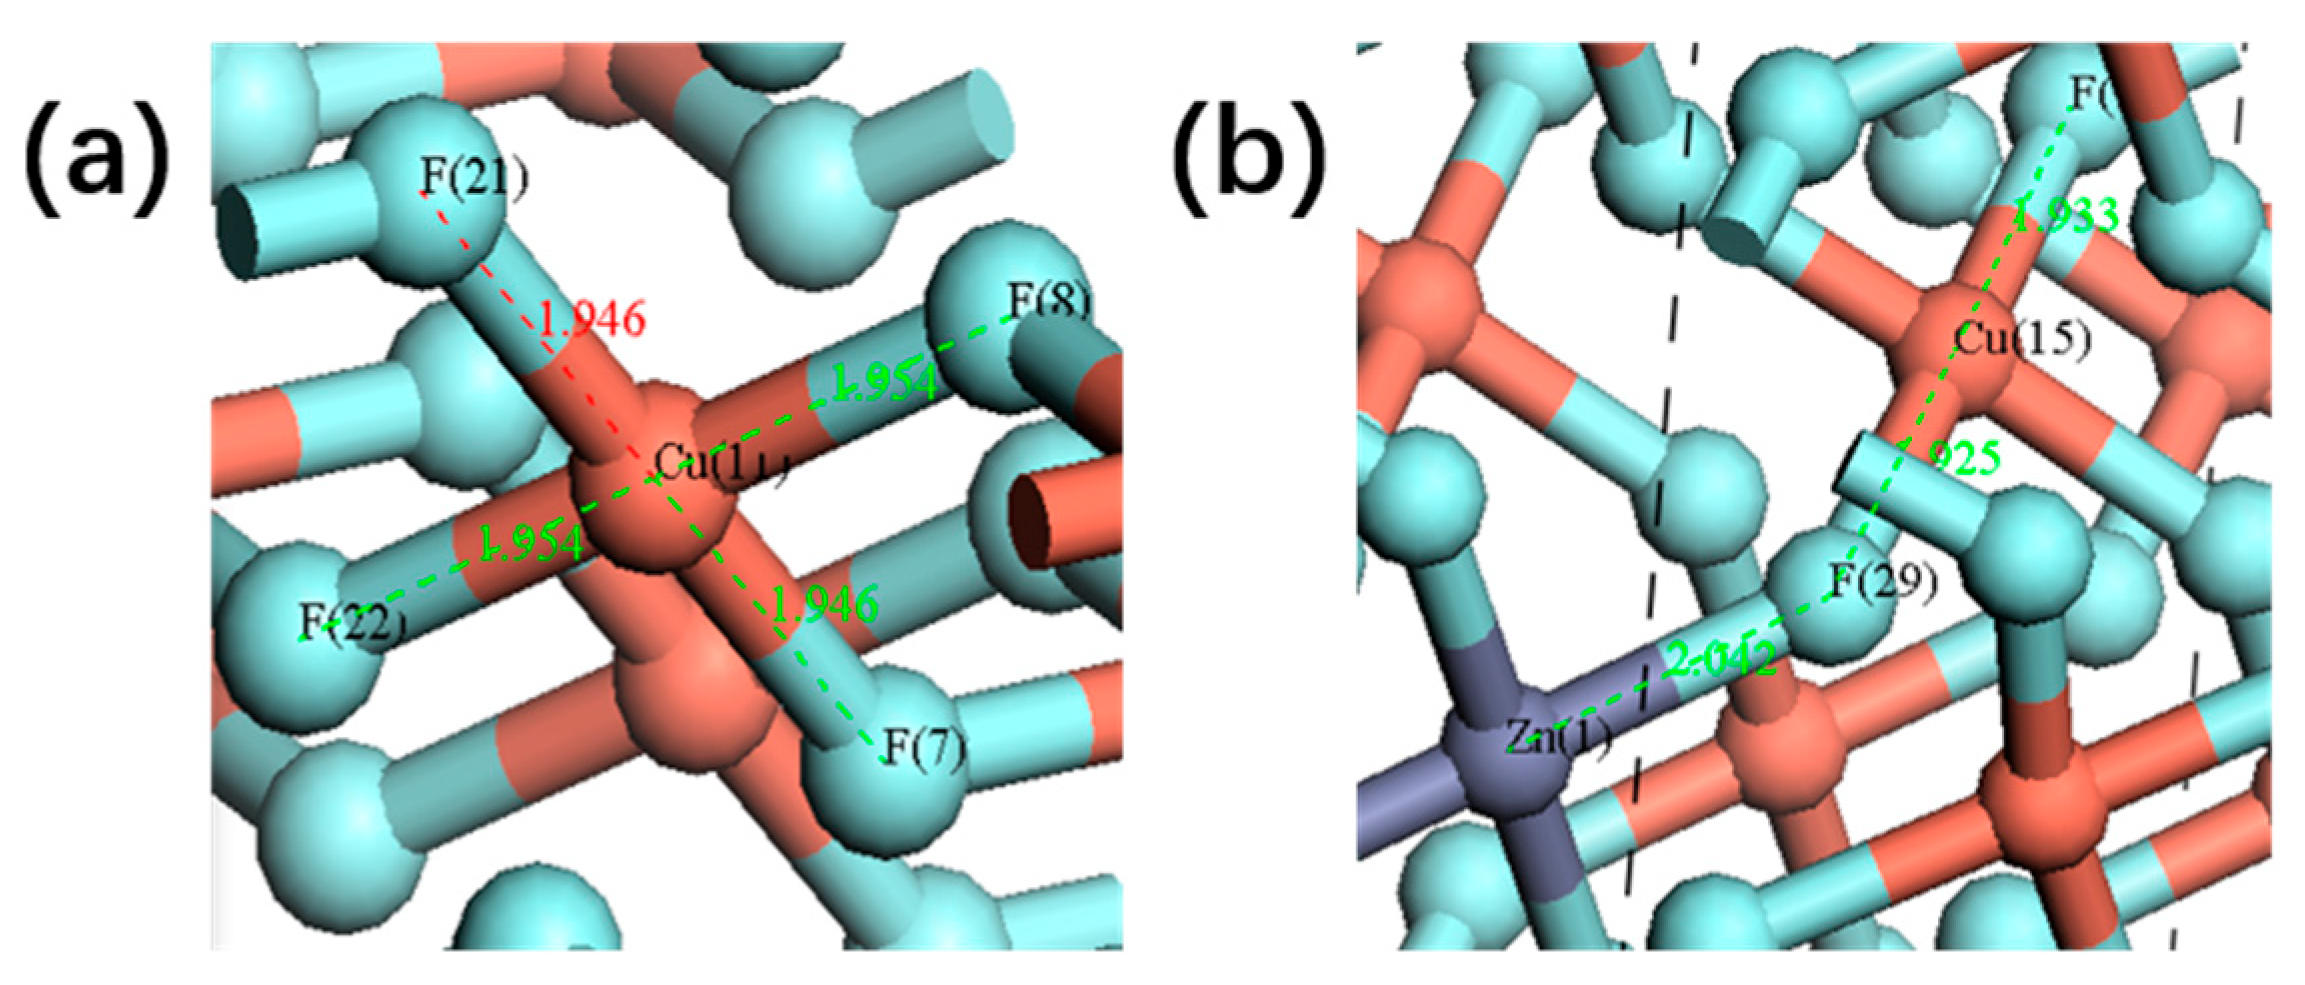
3.1. Theoretical Investigation of Zn-Doped CuF2

The electrical conductivity of CuF2 is closely related to its energy gap structure and valence bond characteristics. To gain insights into the effects of Zn doping, a theoretical investigation was conducted using the first-principles method. This study employed density functional theory (DFT) with the CASTEP program (2016.01) for calculations [15]. Electron exchange and correlation energies were evaluated within the generalized gradient approximation (GGA). Self-consistent field (SCF) calculations were performed with a convergence criterion of less than 10−6 eV in the root mean square change of electron density. Geometric optimization of the structure was carried out at the PBE (Perdew-Burke-Ernzerhof) level, with convergence criteria set at a force tolerance of 0.001 eV/Å and a maximum displacement of 0.001 Å. A 5 × 5 × 1 k-point grid was used for sampling the first Brillouin zone of all structures. Dispersion corrections were applied using the TS (Tkatchenko-Scheffler) method for DFT-D correction. After structural optimization, the space group of pure copper fluoride was identified as P21/C, with unit cell parameters of a = 3.3928 Å, b = 4.5973 Å, and c = 5.3925 Å. The supercell models of pure CuF2 and Zn-doped CuF2 are presented in Figure 1.
The electronic structure modulation induced by 15% Zn doping was investigated through density functional theory calculations. As evidenced by the PDOS (Partial Density of States) analysis (Figure 2), two prominent modifications were observed. The bandgap experienced a significant reduction from 3.845 eV to 2.72 eV (29.2% decrease), and distinctive spin-up polarized states emerged near the Fermi level. This electronic structure engineering can be attributed to the hybridization between Zn-3d orbitals and host matrix states, where the newly formed impurity levels effectively narrow the charge transition barrier.
Based on the above electronic structure analysis, we further calculated the formation energy of Zn doping using the following formula:
Ef = Etotal − ECuF2 − nEZn + nECu
where Ef represents the formation energy, Etotal is the total energy of the Zn-doped system, ECuF2 is the energy of pristine CuF2, EZn and ECu denote the chemical potentials of the Zn and Cu atoms, respectively, and n is the number of substituted atoms. The calculated formation energies are −0.462 eV for 5% doping and −0.643 eV for 15% doping, indicating that Zn doping is energetically favorable.
In first-principles calculations, population analysis is widely utilized to quantify and allocate the charge distribution of each atom in the system, referred to as the “local charge”. This analysis plays a critical role in understanding the chemical properties, electronic structure, and interatomic interactions of materials. Bond population can be used to evaluate the covalent and ionic characteristics of bonds. Typically, a high bond population indicates a strong covalent nature, whereas a low bond population suggests a dominant ionic interaction [16]. Table 1 summarizes the bond population distributions for pure CuF2 and Zn-doped CuF2, where Zn-F represents the bond between the Zn atom and its nearest neighboring F atom, Cu-F1 denotes the Cu-F bond closest to the Zn atom, and Cu-F2 refers to the Cu-F bond relatively farther from the Zn atom. As shown in Figure 3, the bond population of Zn-F is the smallest (0.19), while the introduction of Zn increases the bond populations of Cu-F1 and Cu-F2 to 0.24 and 0.22, respectively, which are higher than that of the Cu-F bond in undoped CuF2. This indicates that trace Zn doping can modify the covalency of the Cu-F bond, potentially leading to a reduction in the working voltage of CuF2.

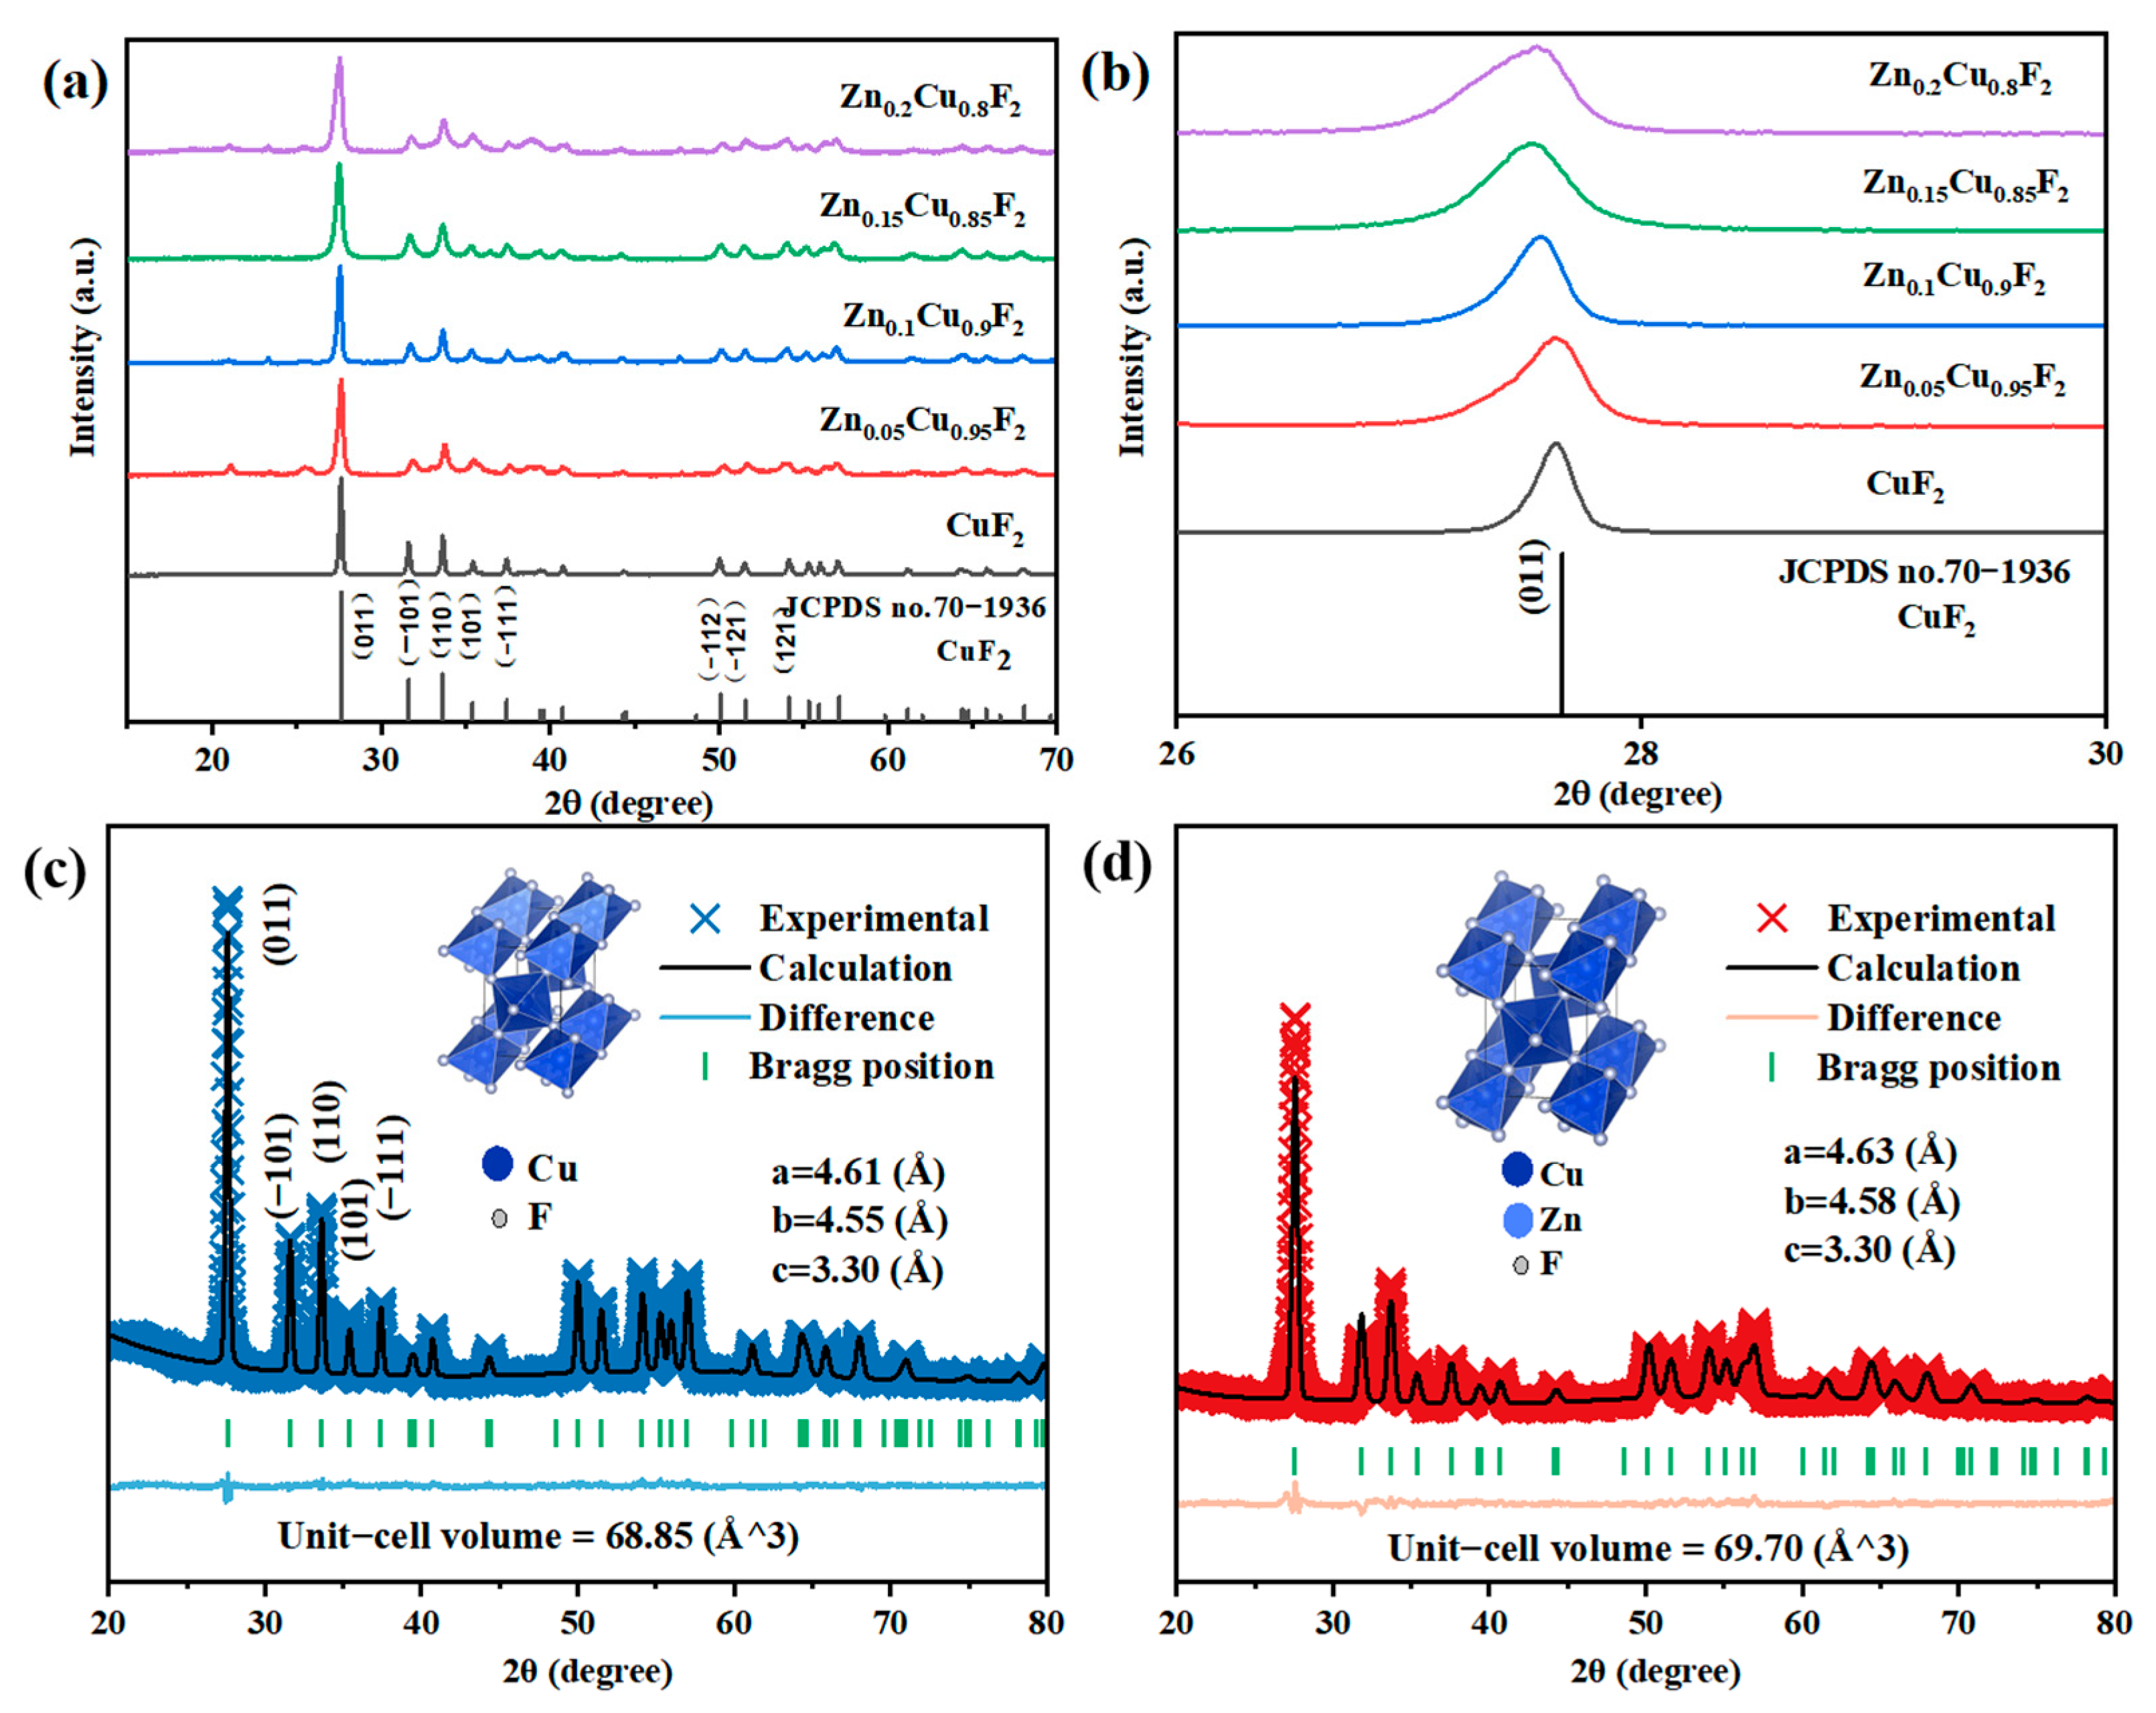
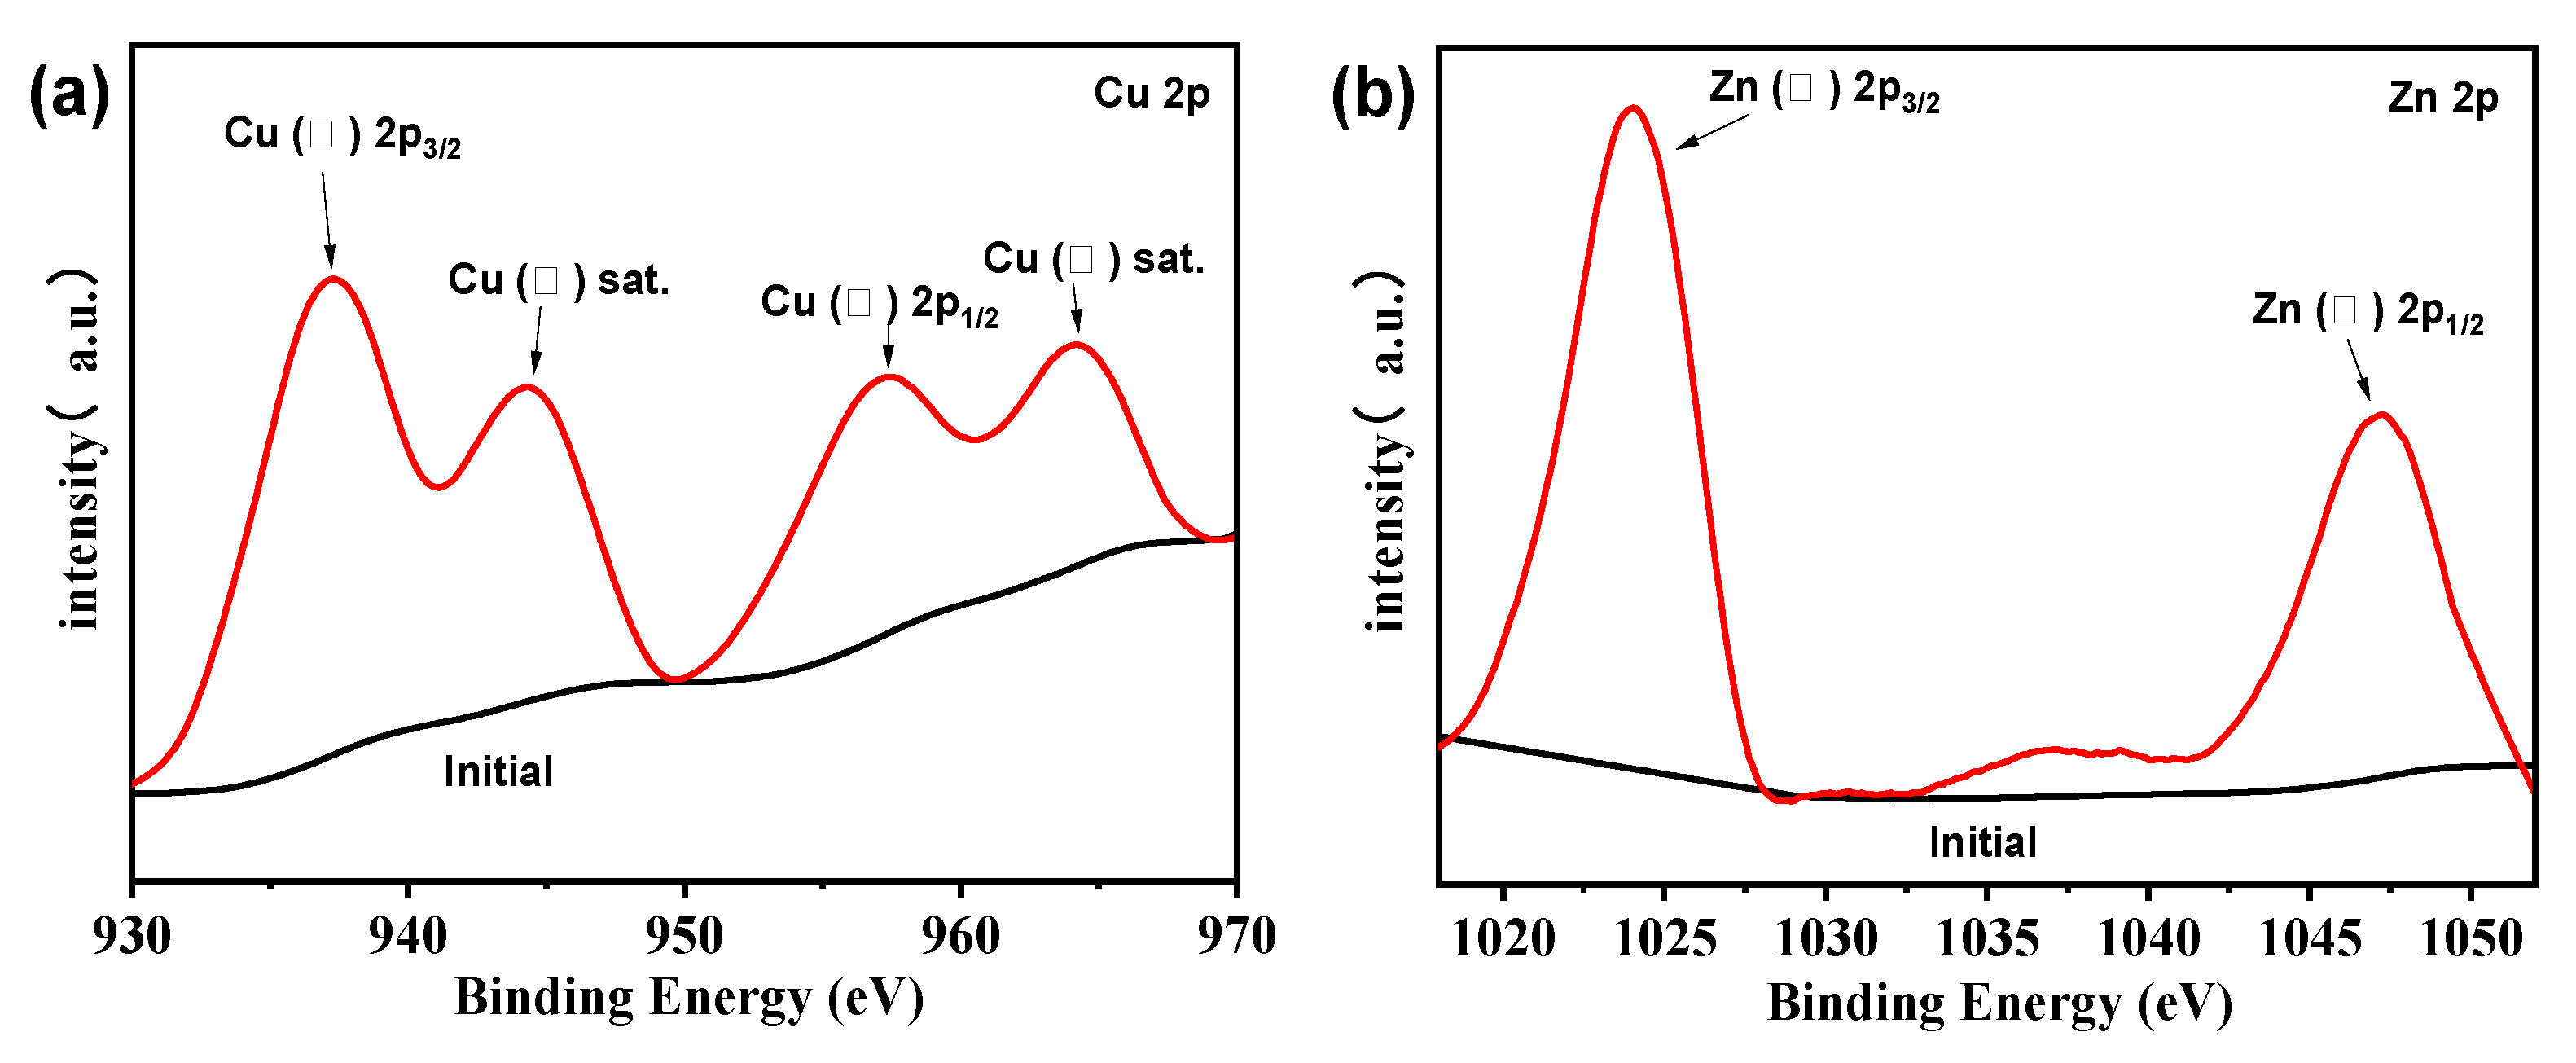
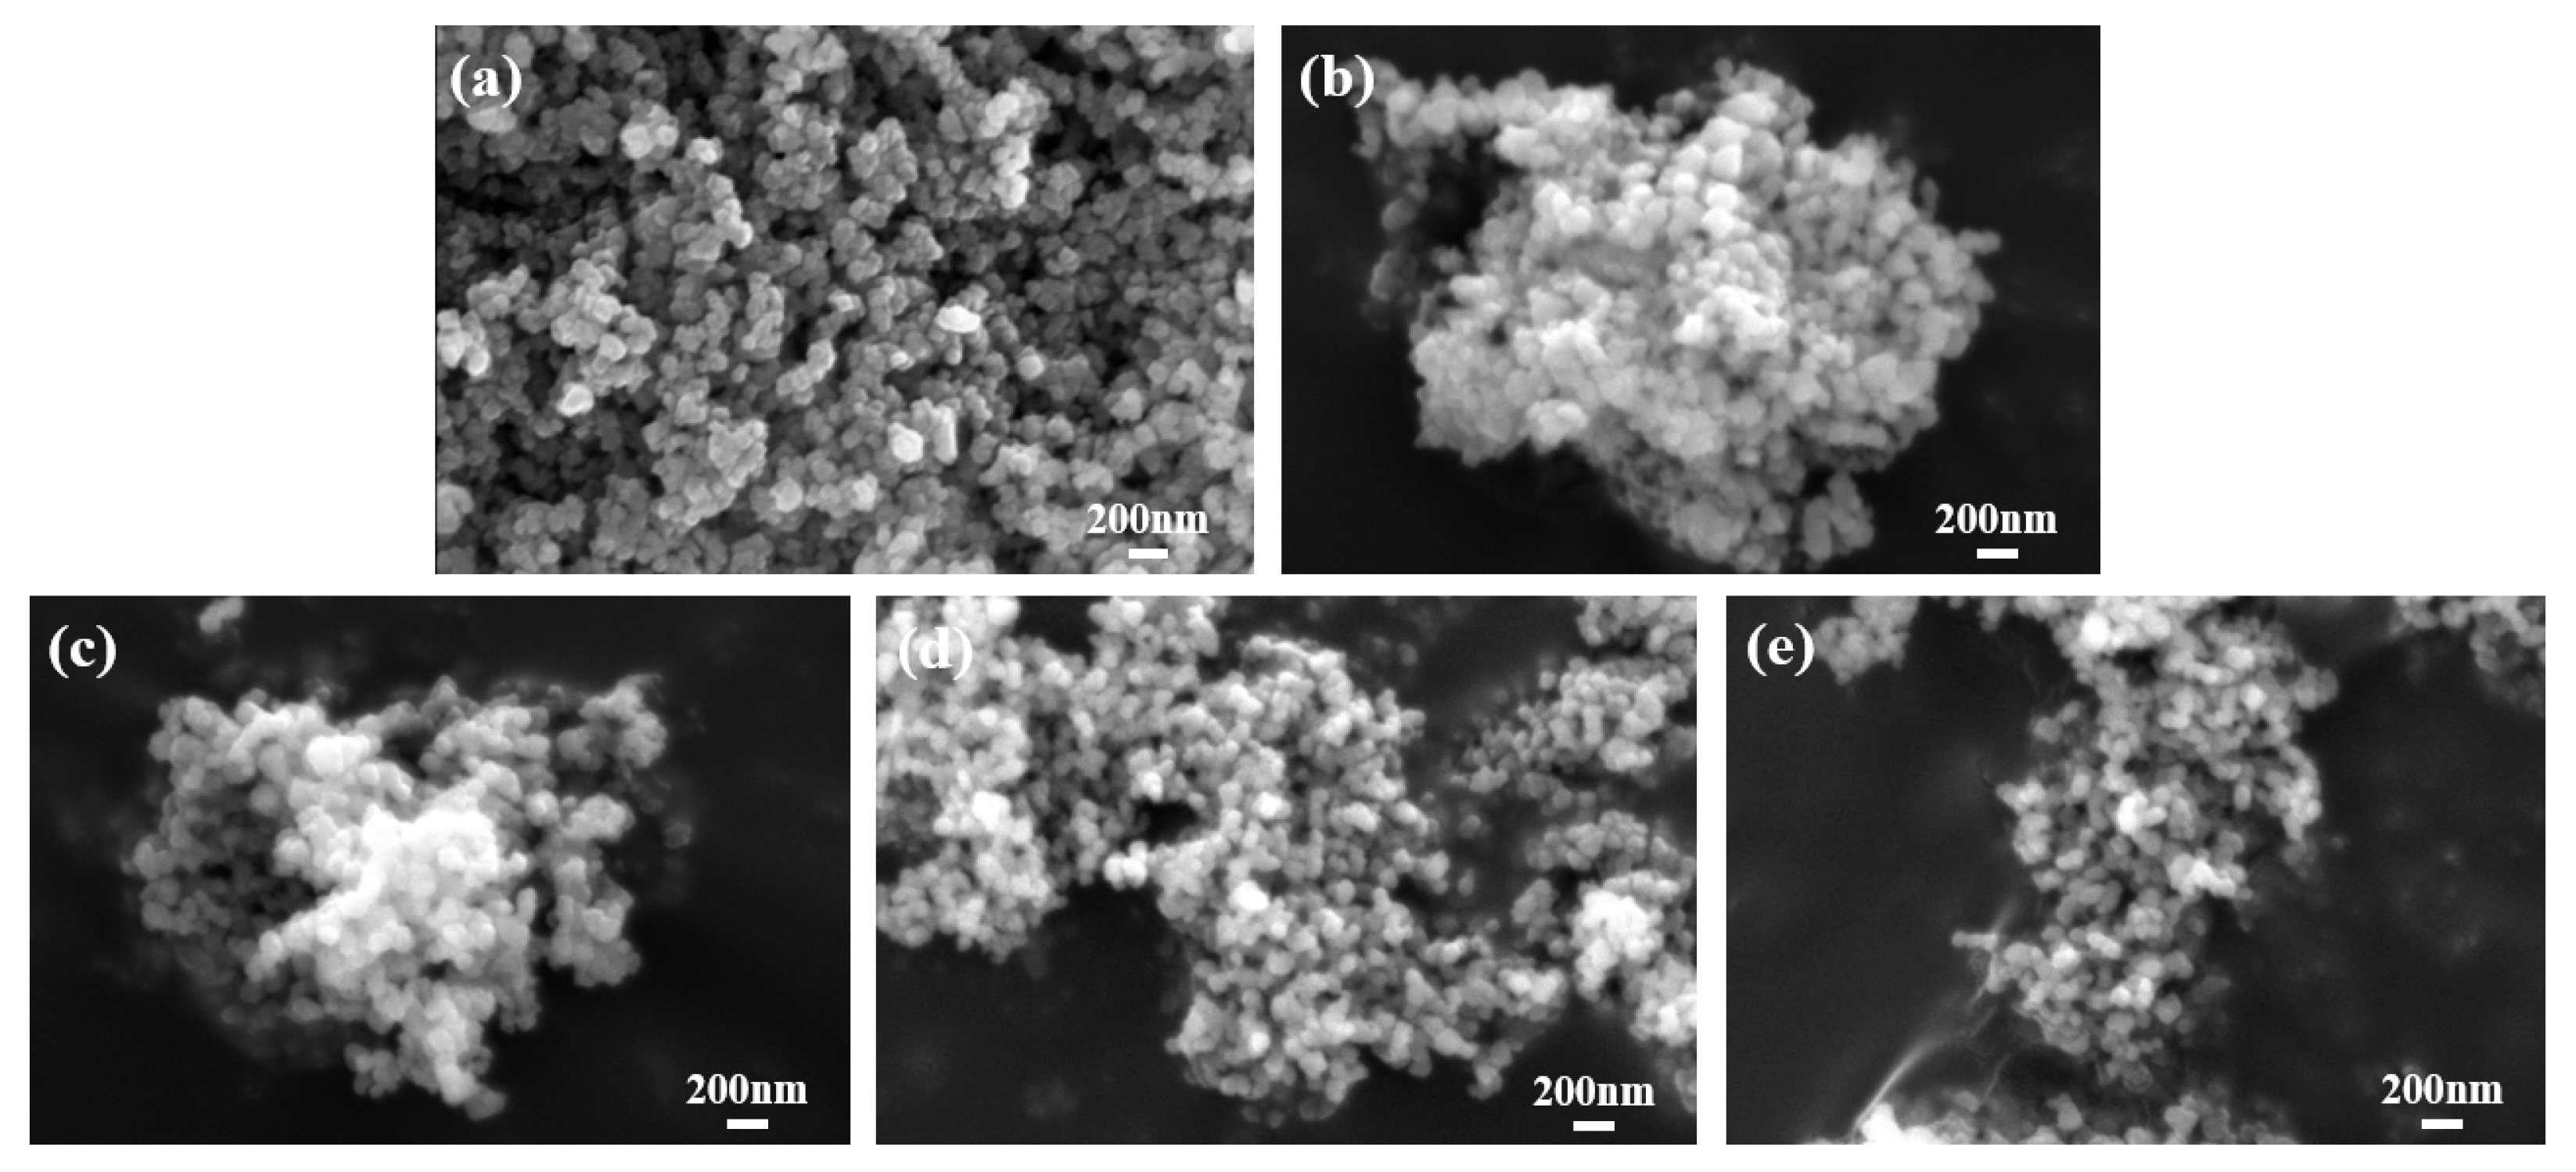
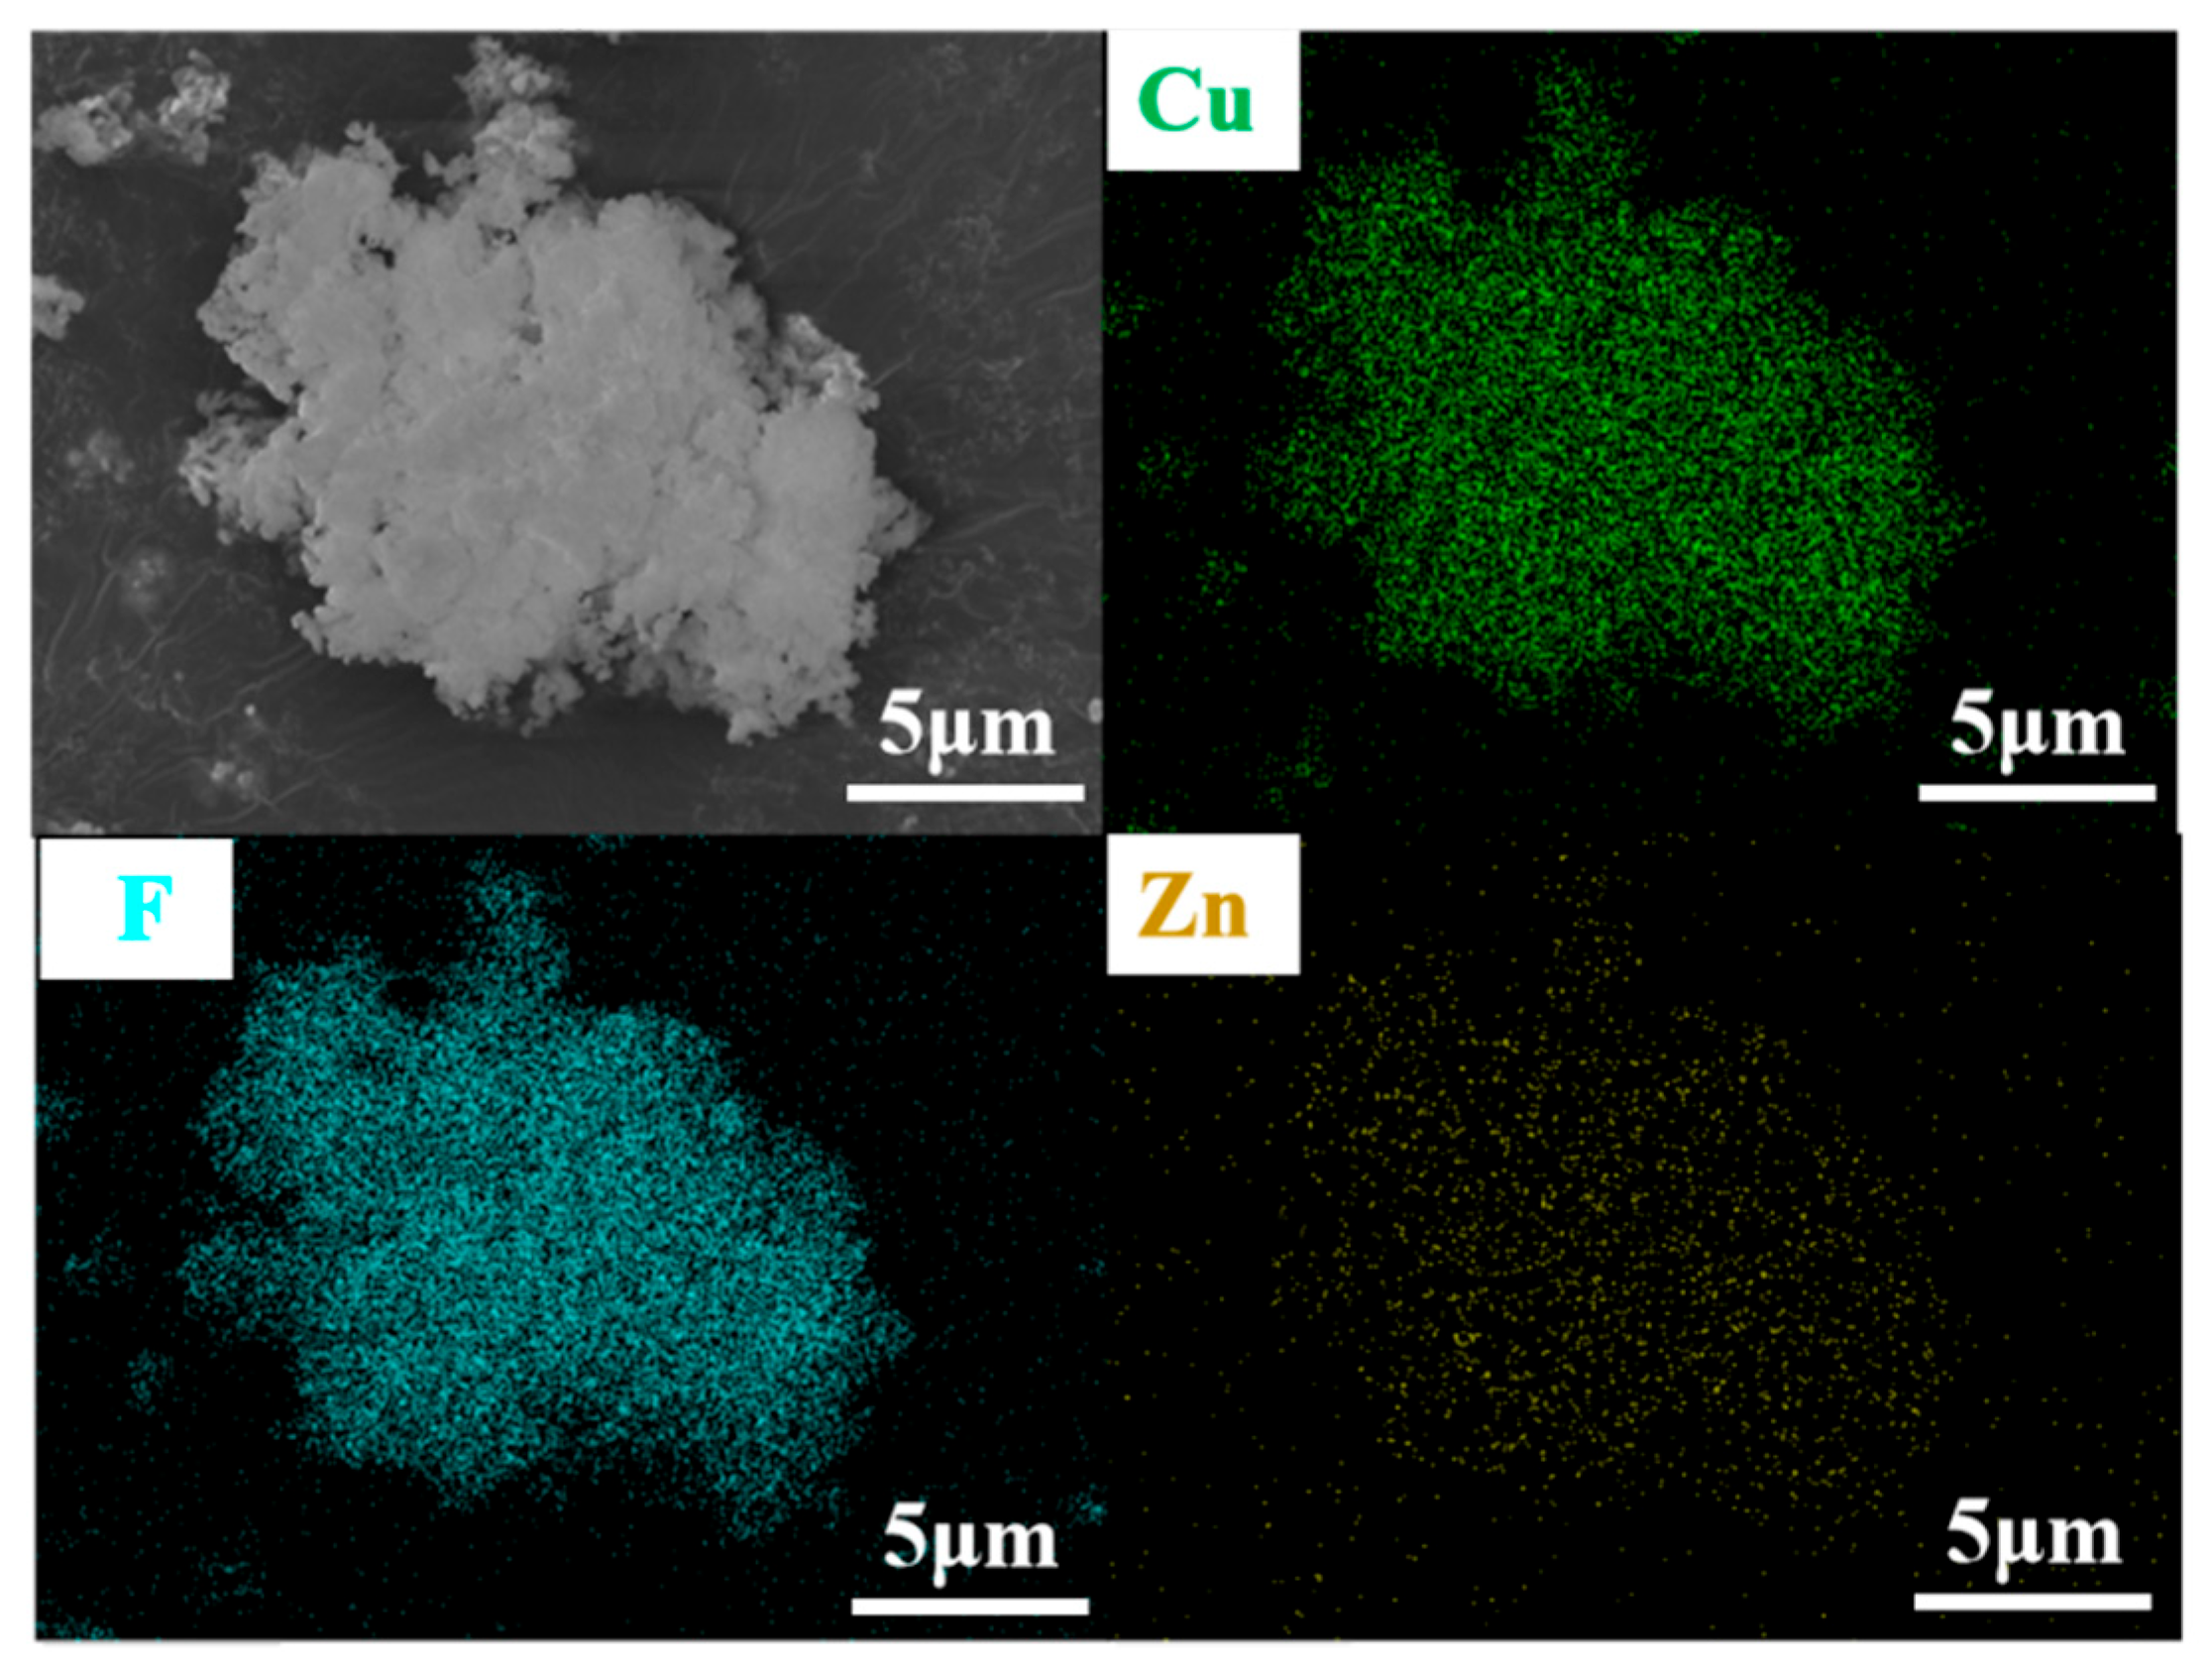
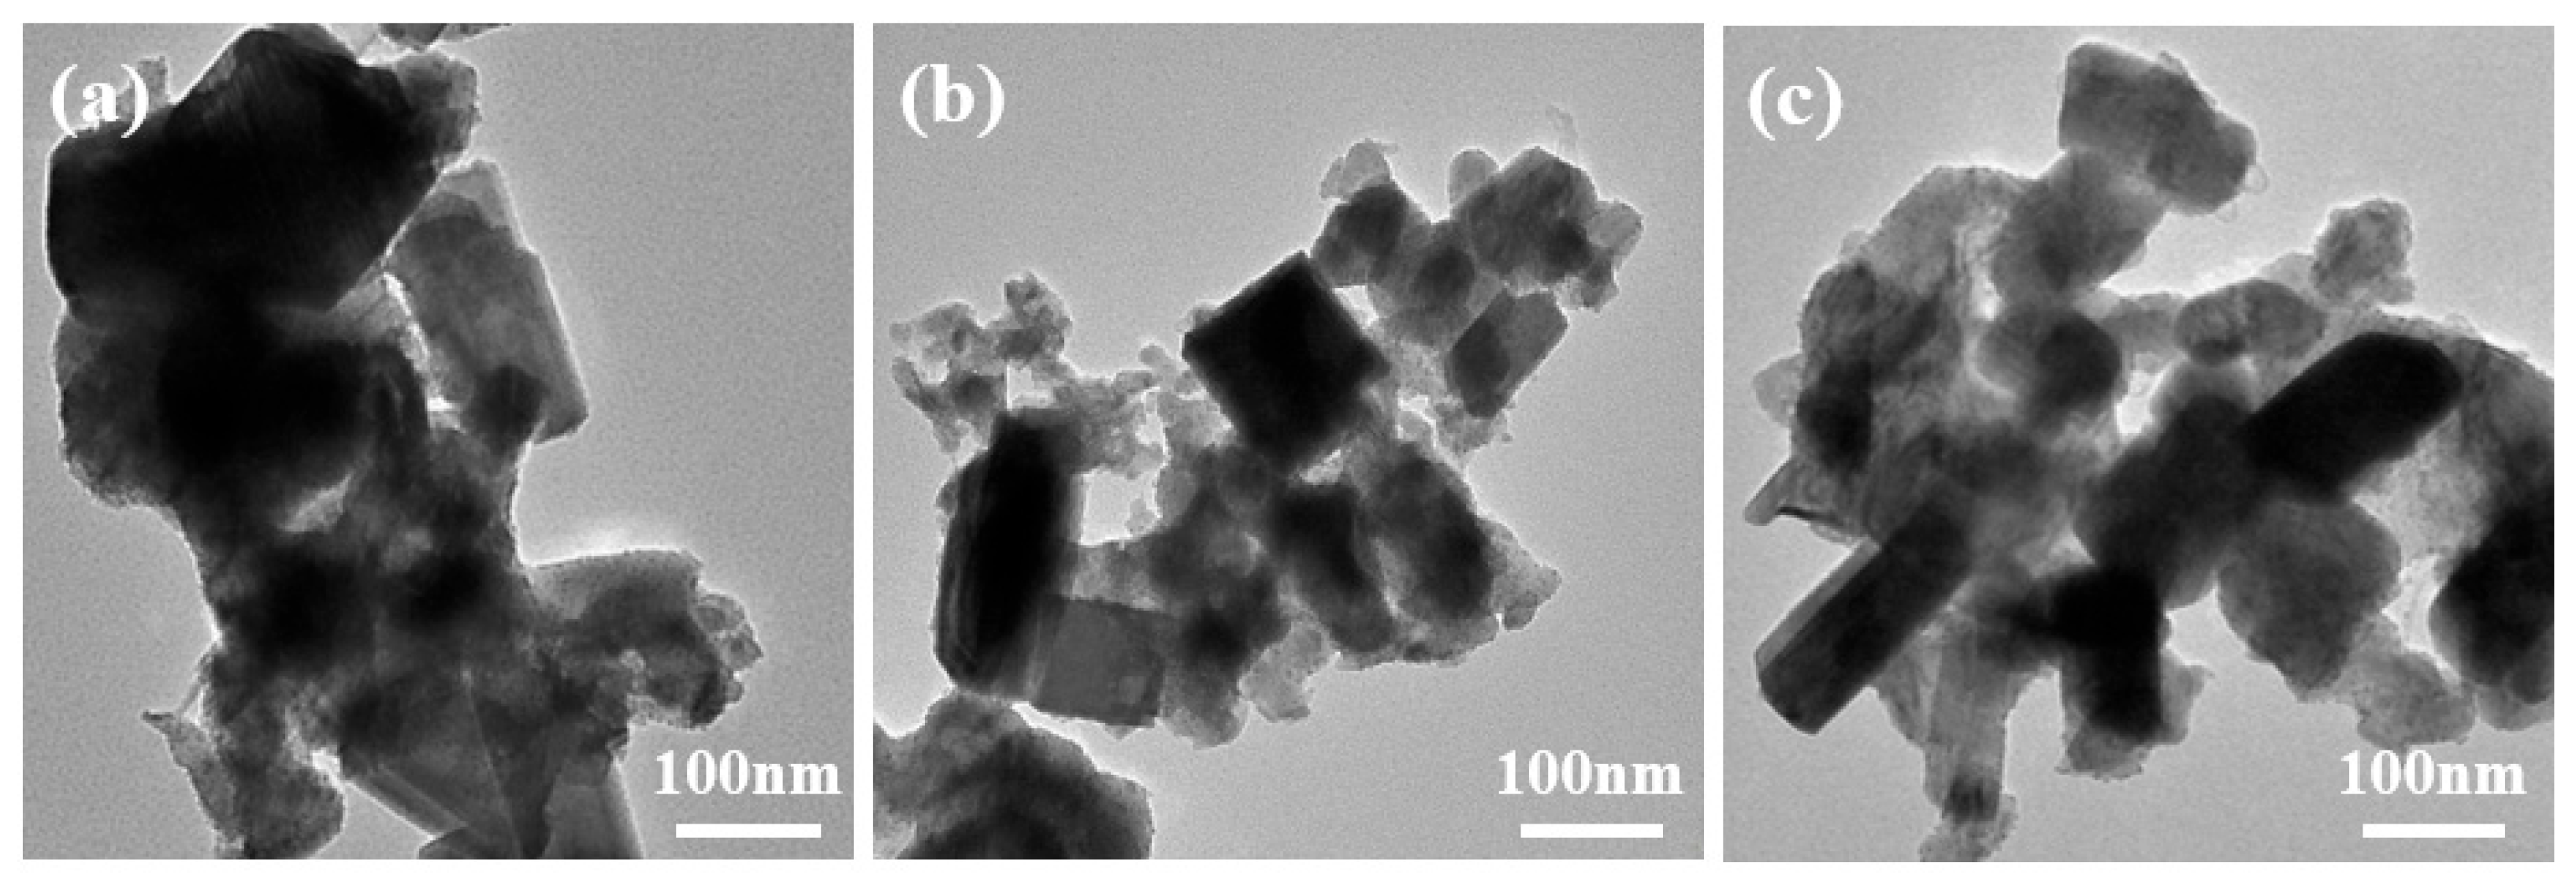
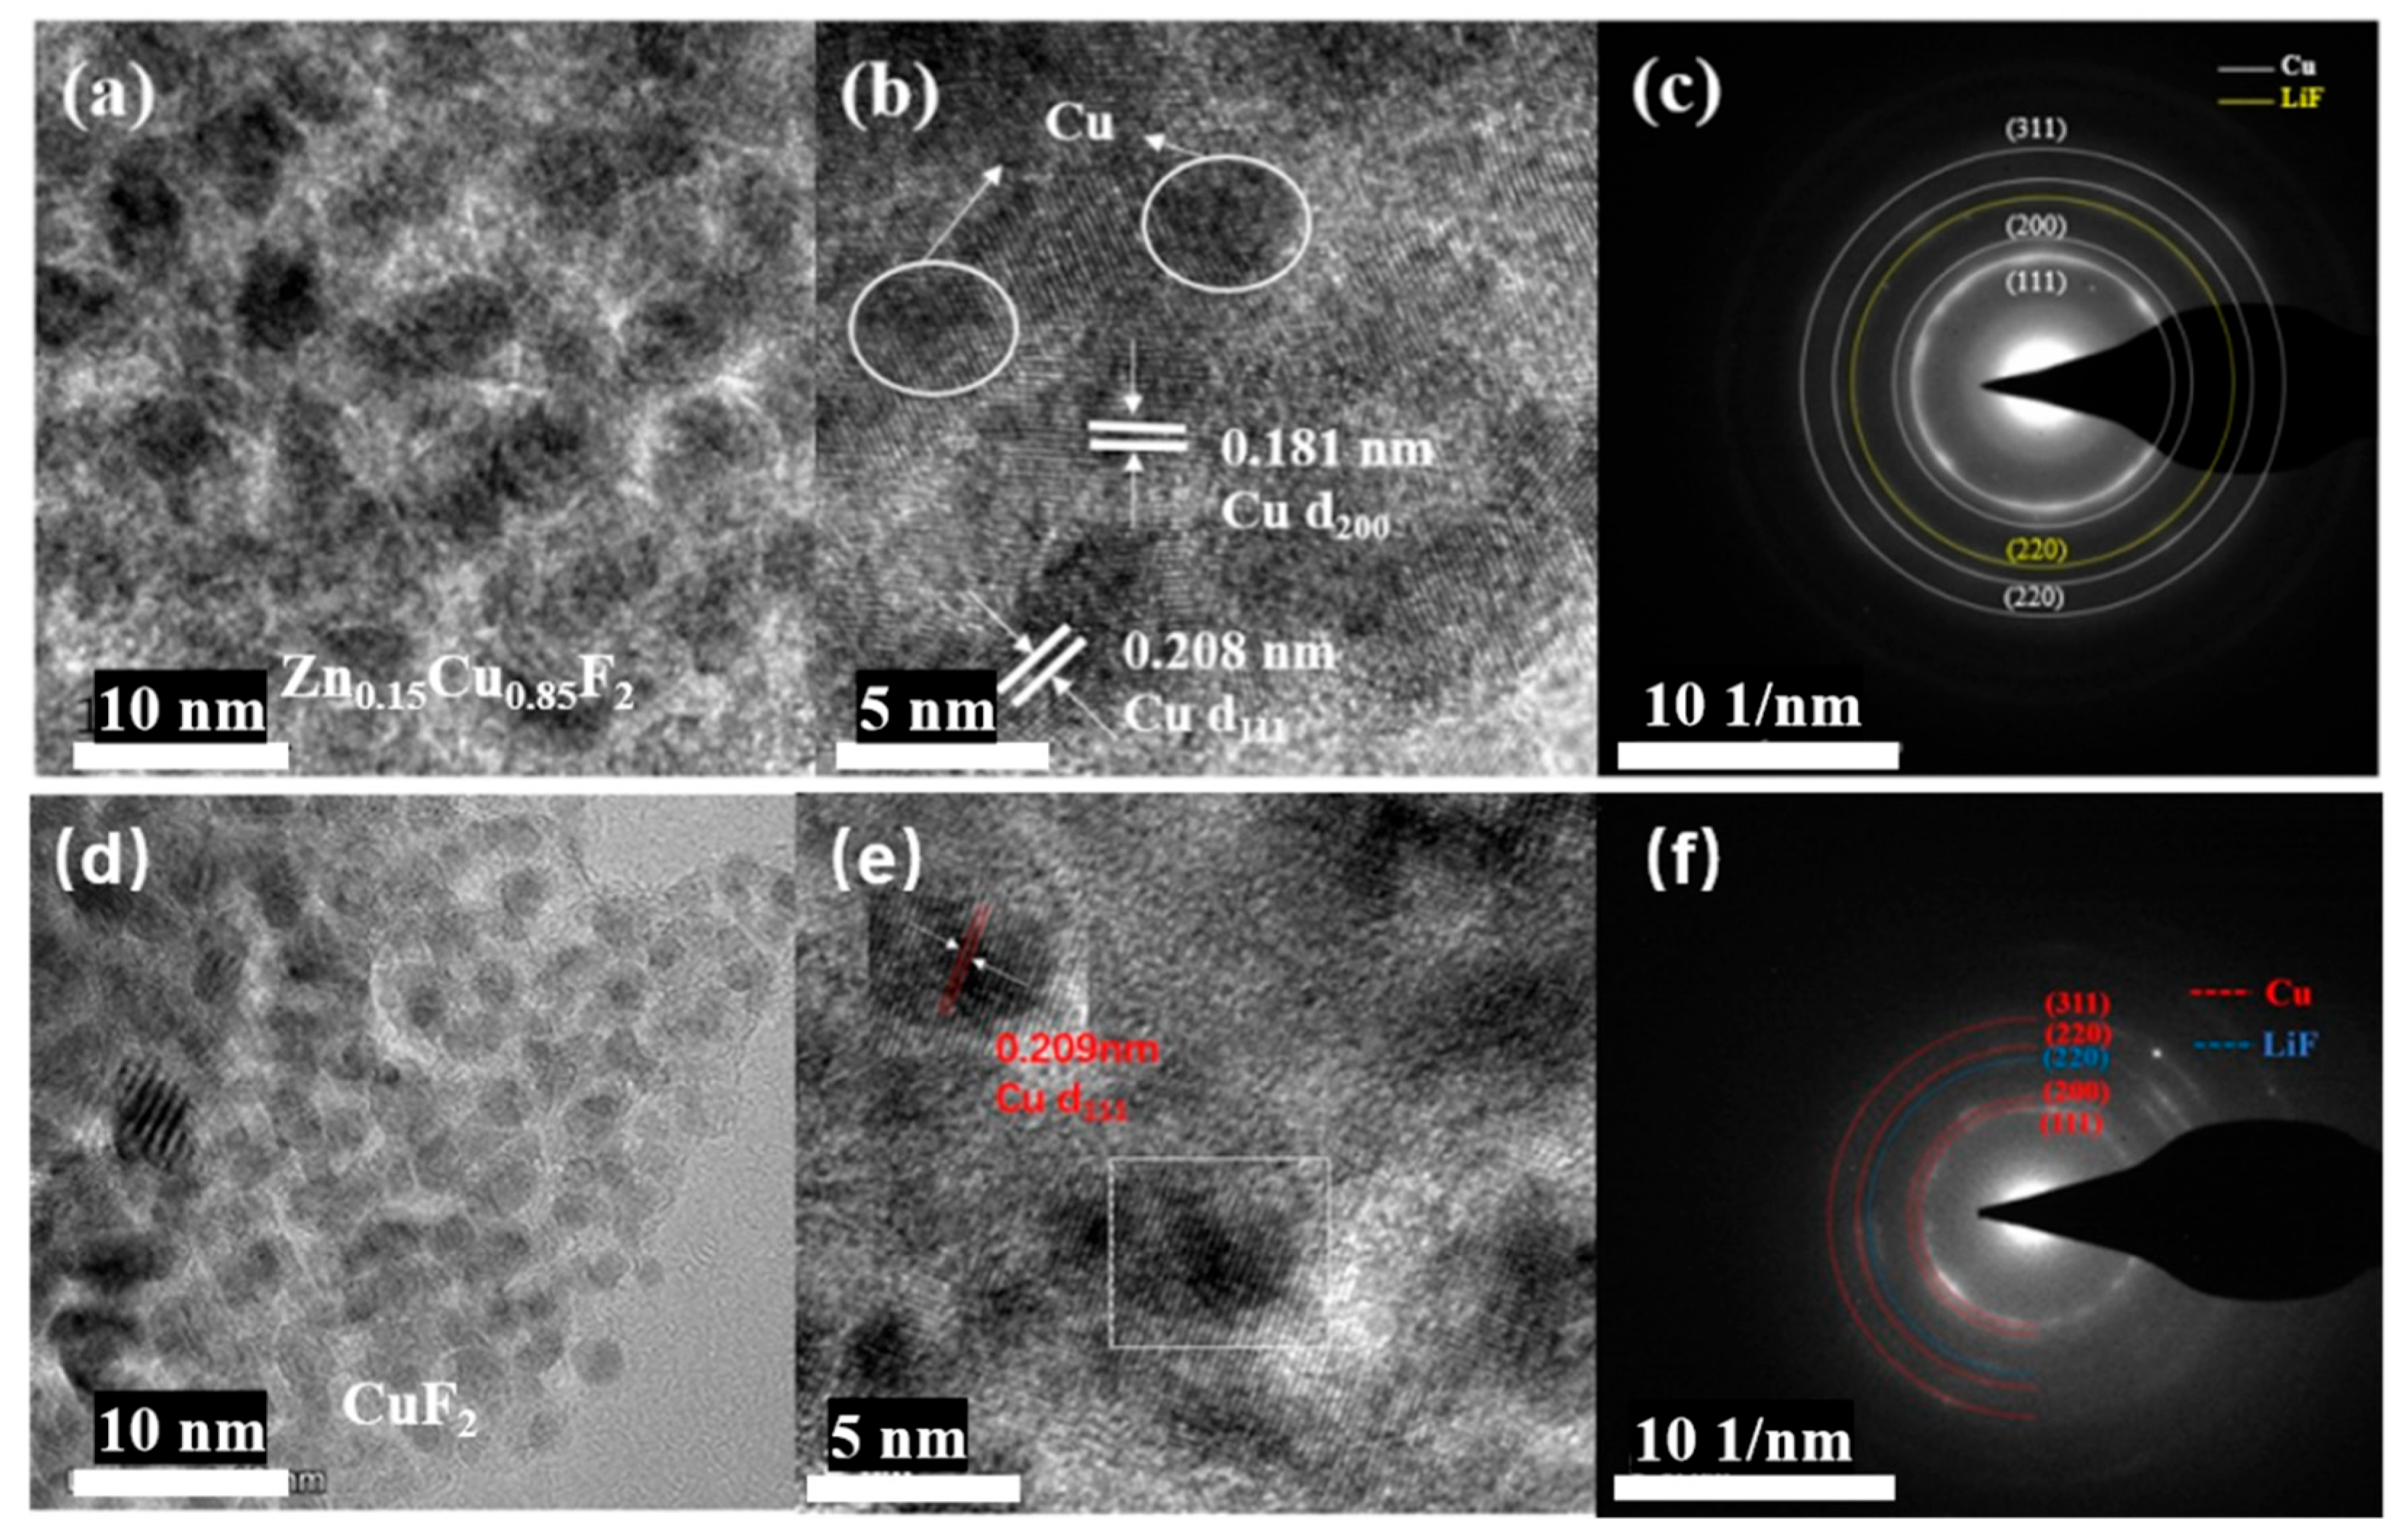
3.2. The Influence of Zn Doping on the Structure and Morphology of CuF2

Figure 4 displays the XRD patterns of the ZnxCu1-xF2 (x = 0, 0.05, 0.1, 0.15, 0.2) series samples. As shown in Figure 4a, the main diffraction peaks of all samples are in good agreement with the characteristic peaks of CuF2 (JCPDS no. 70-1936), and no diffraction peaks corresponding to ZnF2 were observed. This indicates that no secondary phase of ZnF2 was formed in the products. In the magnified view of 2θ = 26°~30° presented in Figure 4b, it can be seen that as the Zn doping concentration increases, the strongest peak of CuF2 at 2θ = 27.658° gradually shifts to a lower angle. This phenomenon may be attributed to the fact that the ionic radius of Zn is 74 pm, which is slightly larger than that of Cu (73 pm). The incorporation of larger ions leads to an increase in the interplanar spacing of the crystal lattice, resulting in the observed shift of the diffraction peak to a lower angle. Figure 4c–d show the results of Rietveld refinement for selected samples of bare CuF2 and Zn0.1Cu0.9F2, the initial unit cell parameters of bare copper fluoride are a = 4.61 Å, b = 4.55 Å, and c = 3.30 Å, and the unit cell volume is 68.85 Å3. The lattice parameters of Zn-doped CuF2 are a = 4.63 Å, b = 4.58 Å, and c = 3.30 Å, and the lattice volume increases to 69.70 Å3. These results confirm that Zn2+ has been successfully incorporated into the CuF2 lattice, forming a solid solution. Simultaneously, ICP results show that Zn contents for the selected sample of Zn0.1Cu0.9F2 and Zn0.15Cu0.85F2 are about 9.71% and 14.94%, indicating that the synthesis method in this paper can successfully prepare samples with the designed stoichiometric ratios.
To further investigate the existence states of Zn2+ and Cu2+ in the sample, XPS was carried out on the Zn0.15Cu0.85F2 sample, and the results are presented in Figure 5. In the Cu 2p spectrum, the peaks at 937.6 eV and 957.7 eV are assigned to the Cu 2p3/2 and Cu 2p1/2 orbitals of Cu2+, respectively, while the peaks at 944.6 eV and 964.3 eV correspond to the satellite peaks of Cu2+ [9]. In the Zn 2p spectrum, the peaks at 1023.8 eV and 1047.0 eV are attributed to the Zn 2p3/2 and Zn 2p1/2 orbitals of Zn2+, respectively. These findings confirm that, in the Zn0.15Cu0.85F2 sample, the incorporation of Zn2+ does not alter the valence state of Cu2+, and Zn remains in the form of divalent ions.
SEM was employed to examine the microscopic morphology and particle size of the ZnxCu1-xF2 (x = 0, 0.05, 0.1, 0.15, 0.2) series samples at a magnification of 30,000. The results are presented in Figure 6. All samples exhibited relatively uniform particle sizes and regular shapes, with no evidence of abnormal particle growth. However, varying degrees of agglomeration were observed in the particles of the Zn0.05Cu0.95F2 and Zn0.1Cu0.9F2 samples, whereas no significant agglomeration was detected in the Zn0.15Cu0.85F2 and Zn0.2Cu0.8F2 samples. These samples showed dispersion levels comparable to those of the original material, with individual particle sizes generally below 50 nm. To further analyze the elemental distribution on the sample surface, energy-dispersive X-ray spectroscopy (EDS) mapping was performed on the Zn0.15Cu0.85F2 sample using a field emission scanning electron microscope. The results, shown in Figure 7, indicate that Cu, F, and Zn are homogeneously distributed across the sample surface, with no distinct regions of CuF2 or ZnF2 observed.
To further investigate the microstructural characteristics of the ZnxCu1-xF2 series samples, TEM analysis was conducted on three representative samples: CuF2, Zn0.05Cu0.95F2, and Zn0.15Cu0.85F2. The results are shown in Figure 8. For the undoped CuF2 sample, the particles exhibit significant aggregation and stacking, which makes it challenging to identify their specific morphologies. In contrast, the Zn-doped samples (with 5% and 15% Zn doping) demonstrate better dispersion, smaller particle sizes, and irregular or strip-like shapes. These structural features are advantageous for enhancing lithium ion diffusion and transport.

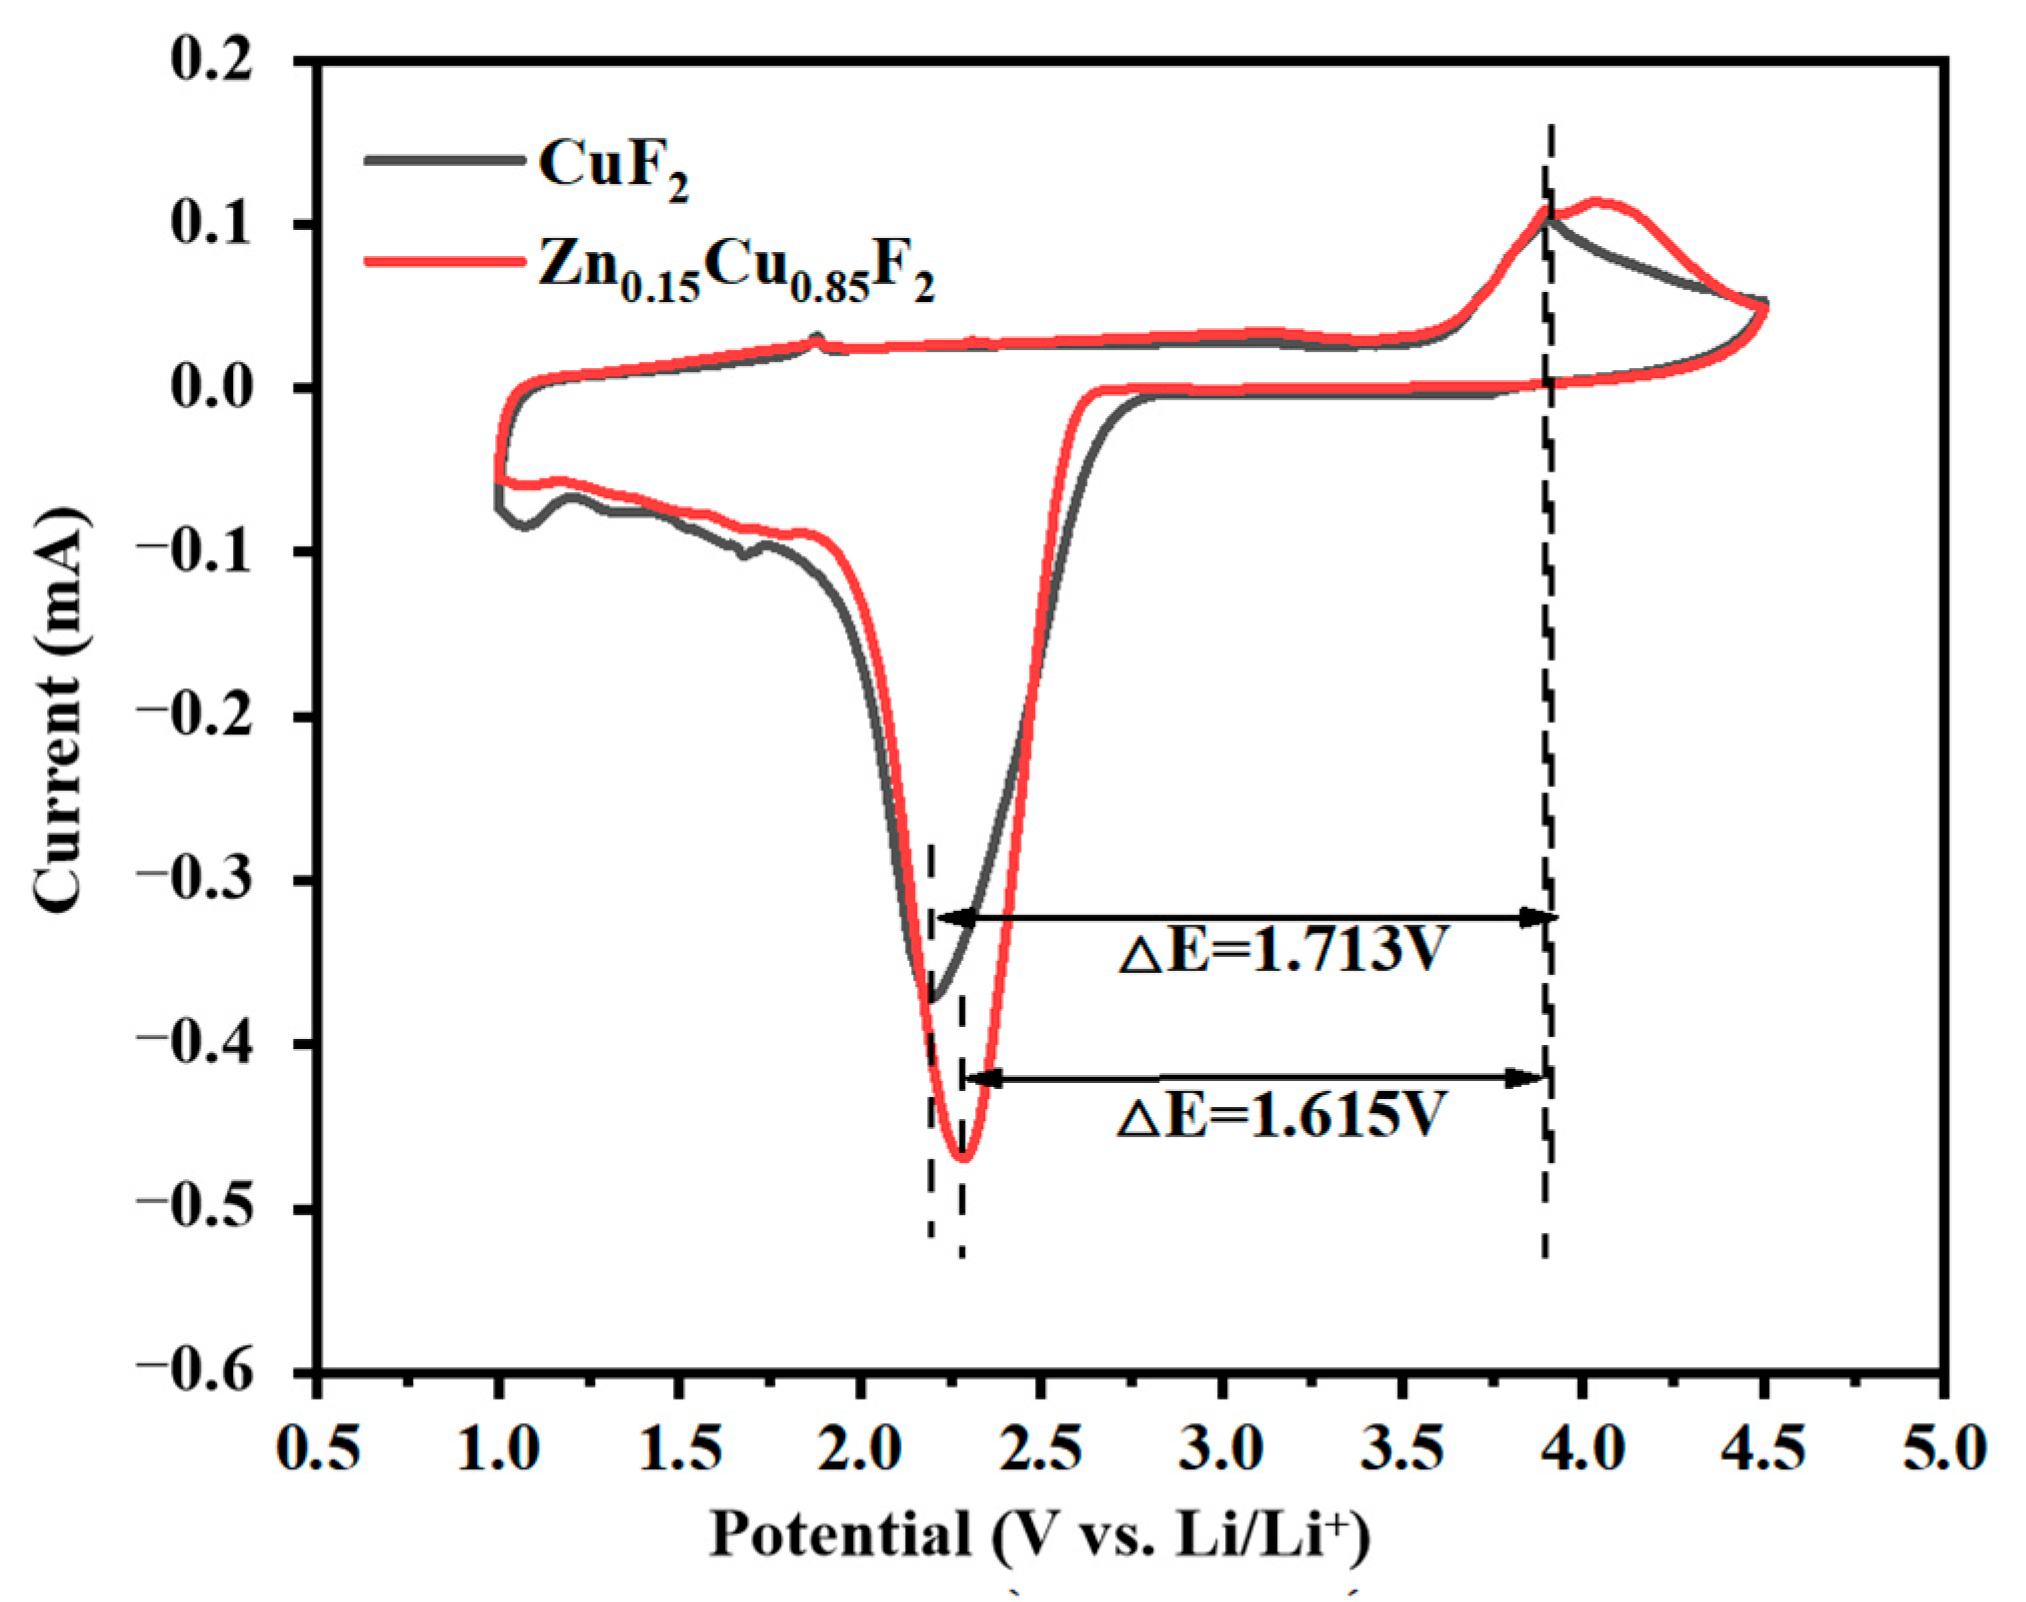
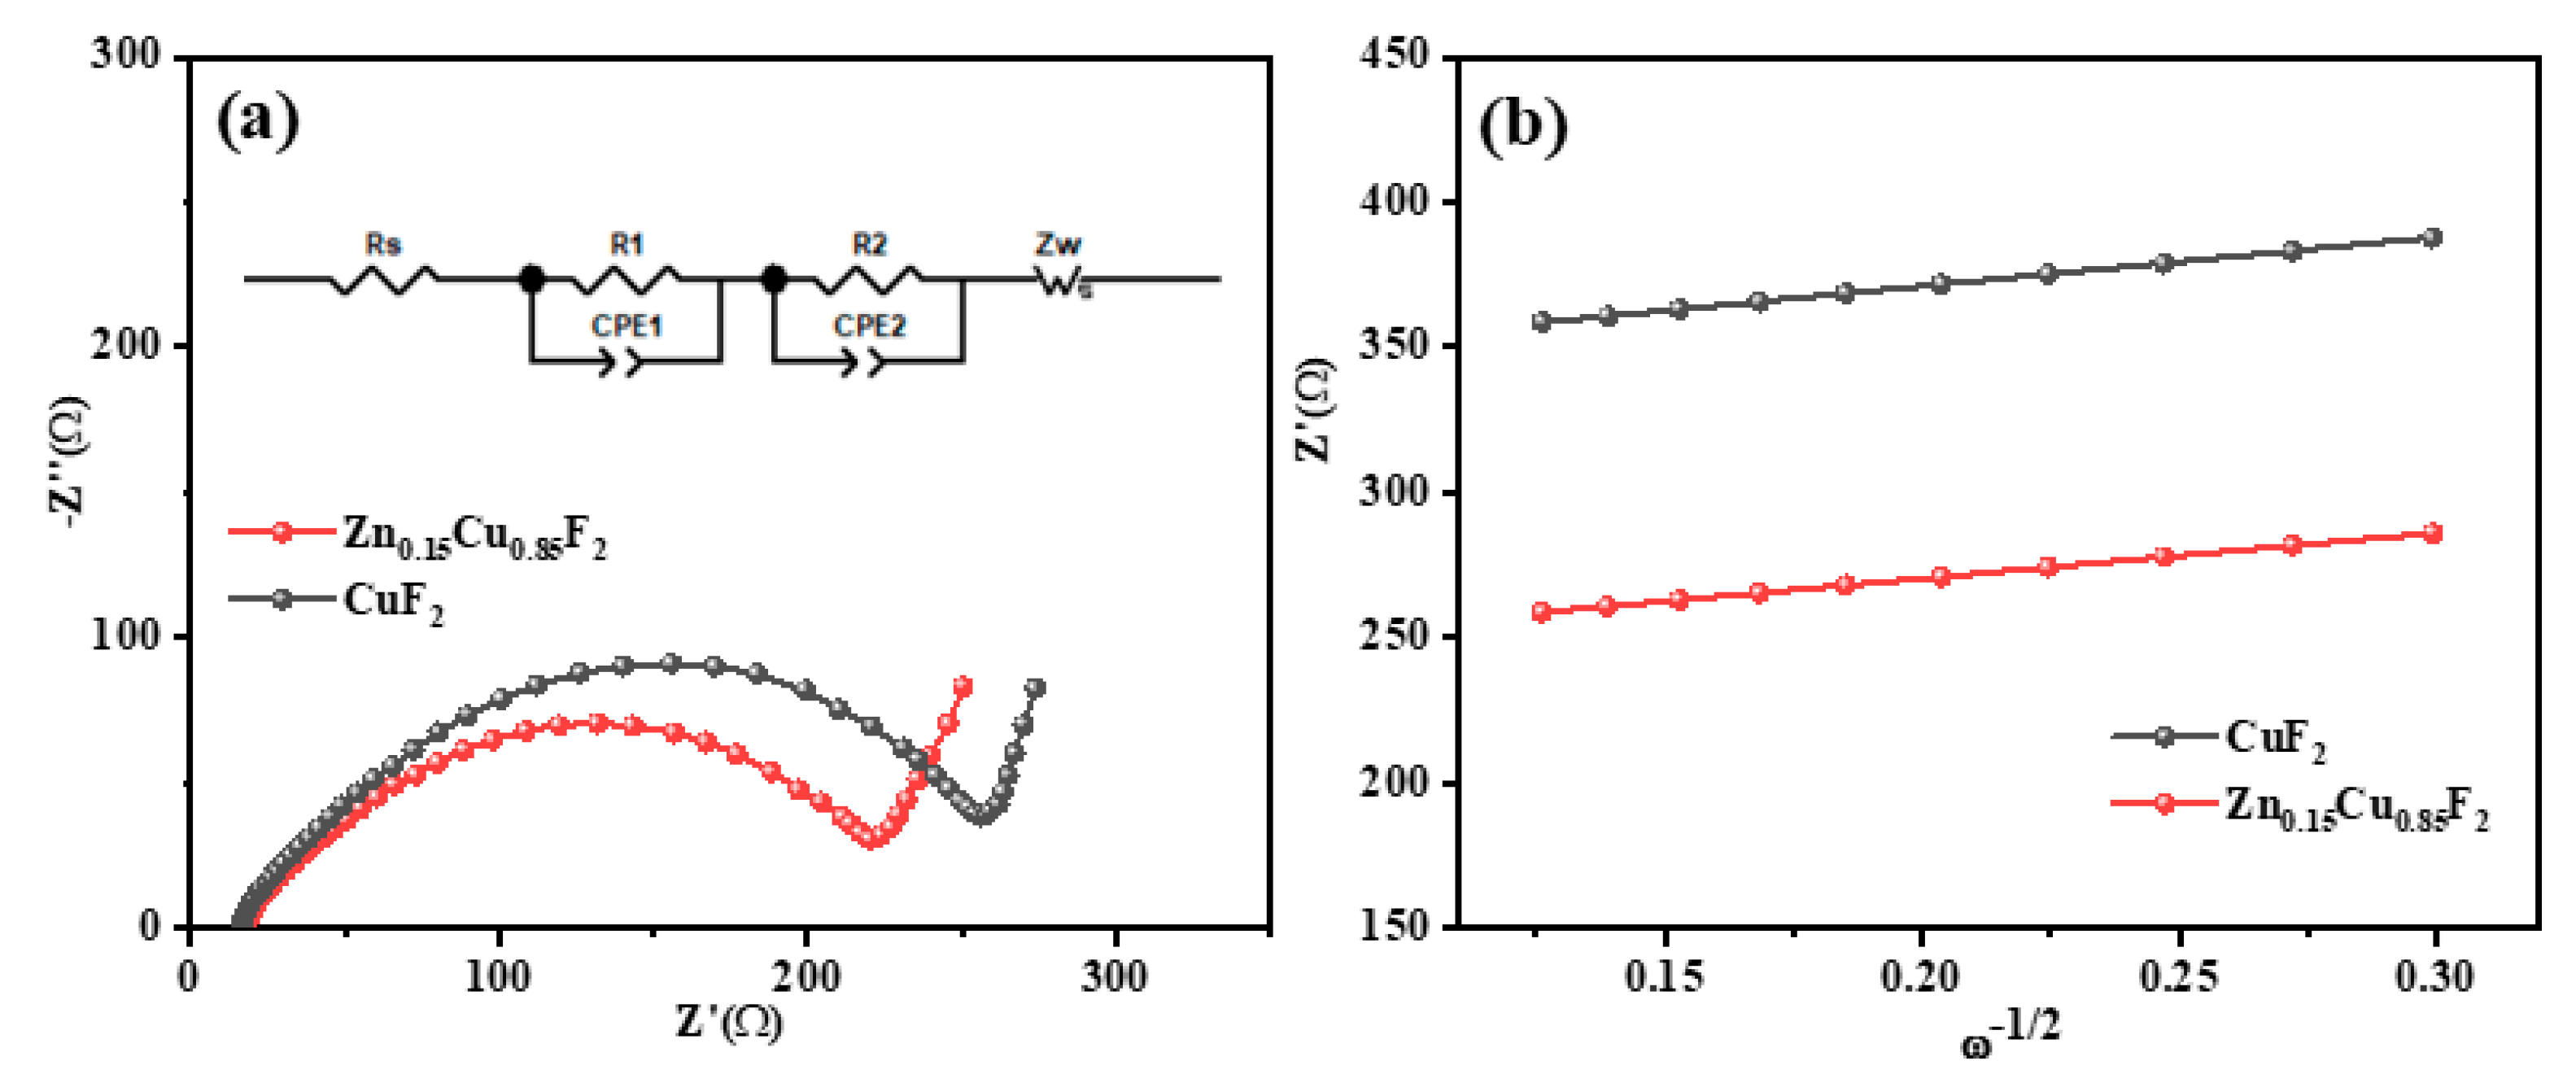
3.3. The Impact of Zn Doping on the Electrochemical Properties of CuF2

The ZnxCu1-xF2 (x = 0, 0.1, 0.15, 0.2) series samples were fabricated into CR2025 coin cells. Electrochemical tests were conducted at an ambient temperature of 30 °C under charge–discharge rates of 0.1 C, 0.2 C, 0.5 C, and 1 C (1 C = 528 mA g−1), with a voltage range of 1.5 V–4.2 V. The test results are presented in Figure 9. At 0.1 C, the initial discharge specific capacities of CuF2, Zn0.1Cu0.9F2, Zn0.15Cu0.85F2, and Zn0.2Cu0.8F2 were 501.4 mAh g−1, 446.6 mAh g−1, 528.6 mAh g−1, and 479.2 mAh g−1, respectively; the corresponding initial charge specific capacities were 232.2 mAh g−1, 249.9 mAh g−1, 301.48 mAh g−1, and 261.6 mAh g−1, respectively. The initial coulombic efficiencies were 46.3%, 56.0%, 57.0%, and 54.6%, respectively. Among these, Zn0.15Cu0.85F2 exhibited the highest discharge capacity at this rate, surpassing the undoped material by 27.2 mAh g−1. In contrast, the other doped samples showed lower capacities compared to the undoped sample. As the Zn doping level increased, the initial coulombic efficiency gradually improved, increasing by more than 10%, which indicates enhanced initial reversibility of the electrode materials.
At a higher charge-discharge rate of 0.2 C, Zn0.15Cu0.85F2 still demonstrated the highest discharge specific capacity among the series samples, reaching 513.2 mAh g−1. The discharge capacity trends of the other samples were consistent with those observed at 0.1 C. Notably, the initial coulombic efficiency of pure CuF2 remained below 50% (45.2%), while the efficiencies of Zn0.1Cu0.9F2, Zn0.15Cu0.85F2, and Zn0.2Cu0.8F2 were significantly higher, at 54.1%, 53.6%, and 53.2%, respectively.
At a charge–discharge rate of 0.5 C, the initial discharge specific capacities of CuF2, Zn0.1Cu0.9F2, Zn0.15Cu0.85F2, and Zn0.2Cu0.8F2 were 421.2 mAh g−1, 367.0 mAh g−1, 503.1 mAh g−1, and 429.47 mAh g−1, respectively; the corresponding initial charge specific capacities were 167.6 mAh g−1, 184.6 mAh g−1, 229.0 mAh g−1, and 190.6 mAh g−1, respectively. Compared to the undoped sample, the reversible specific capacities of the three doped samples increased by 17 mAh g−1, 61.4 mAh g−1, and 23 mAh g−1, respectively. The trends in the initial discharge curves at 1 C were similar to those observed at all previous rates. For the three samples with doping levels less than 15%, the charge curve trends were comparable, while the charge voltage platform of Zn0.15Cu0.85F2 was notably elevated, achieving an energy density of 543.2 Wh kg−1, which is 96.9 Wh kg−1 higher than that of the original material.
Although the charge specific capacity of Zn0.2Cu0.8F2 was slightly lower than that of Zn0.15Cu0.85F2, its charge energy density was comparable to that of Zn0.15Cu0.85F2 and significantly exceeded that of CuF2. It is worth noting that despite the lower discharge capacity of Zn0.2Cu0.8F2 compared to the original material across all tested rates, its charging performance was markedly superior to that of the undoped sample, as evidenced by the elevated charging voltage and capacity. Additionally, during the initial charging process, the charging voltage of Zn0.2Cu0.8F2 was higher than that of Zn0.15Cu0.85F2.
All samples exhibited varying degrees of capacity attenuation and voltage drop with increasing current density, indicating that the electrochemical polarization within the battery increased as the rate rose. Compared to CuF2, Zn0.1Cu0.9F2 demonstrated improved rate performance, with the capacity difference decreasing from 127.3 mAh g−1 to 100.7 mAh g−1, and the voltage drop also reduced. Furthermore, the charging rate performance of this sample was significantly enhanced at this point, and the differences in charging voltage drops across various rates were minimized. When the Zn doping level was increased to 15%, the discharge capacities of Zn0.15Cu0.85F2 at 0.1 C, 0.2 C, 0.5 C, and 1 C were 528.6 mAh g−1, 513.2 mAh g−1, 503.1 mAh g−1, and 489.1 mAh g−1, respectively. The capacity retention rates reached 97.1%, 95.2%, and 92.5%, and the capacity loss from 0.1 C to 1 C was only 39.5 mAh g−1, less than 50% of the undoped sample. The charge and discharge voltage drops of Zn0.15Cu0.85F2 at different rates were also improved, particularly with a noticeable reduction in voltage drop at high current densities. For Zn0.2Cu0.8F2, the discharge capacities at different rates were 479.2 mAh g−1, 441.8 mAh g−1, 429.3 mAh g−1, and 413.0 mAh g−1, respectively. The discharge capacities at 0.2 C, 0.5 C, and 1 C were 92.2%, 89.6%, and 86.2% of the 0.1 C value, with a total capacity loss of 66.2 mAh g−1. Although the discharge capacities of Zn0.2Cu0.8F2 at all rates were lower than those of the undoped sample, its capacity retention rate and charge–discharge voltage drop performance were superior to those of the undoped sample. These results indicate that an appropriate amount of Zn doping can enhance the rate performance of the CuF2 electrode, particularly improving its charge and discharge performance at high current densities.
The comparison of the initial discharge capacities of the sample Zn0.15Cu0.85F2 in this work and that of some other fluoride and manganese oxide cathode materials studied in previous literature are listed in Table 2. It can be found that, compared with some fluoride and manganese oxide cathodes reported in the literature, the Zn-doped CuF2 cathode material synthesized in this paper shows obvious performance advantages. However, CuF2 is unstable in high humidity and easily forms hydration products, resulting in a decrease in its energy density. Therefore, improving the air stability of CuF2 is a research direction worthy of future attention, which is of great significance for its practical application.
Figure 10 shows the cyclic voltammetry (CV) curves of CuF2 and Zn0.15Cu0.85F2, tested over a voltage range of 1.0 V to 4.5 V at a scan rate of 0.1 mV/s in the reverse direction. The CV curves of both samples were similar, featuring a distinct reduction peak near 2.3 V, corresponding to the discharge process of Cu2+ reduction to Cu, and an oxidation peak near 3.9 V, corresponding to the charging process of Cu to Cu2+. The reduction/oxidation peak potentials for CuF2 were 2.199 V and 3.912 V, respectively, with ΔE = 1.713 V, while those for Zn0.15Cu0.85F2 were 2.284 V and 3.899 V, respectively, with ΔE = 1.615 V. During the reduction process, the reduction peak area of the Zn0.15Cu0.85F2 electrode was significantly larger than that of CuF2, reflecting higher electrochemical activity and a higher discharge capacity. The reduction peak current for Zn0.15Cu0.85F2 was 0.469 mA, compared to 0.371 mA for CuF2, suggesting a more intense battery reaction. During the oxidation process, the peak area of Zn0.15Cu0.85F2 was also larger than that of CuF2, confirming its higher charging capacity, which is consistent with the previous test results.
To investigate the intrinsic effects of Zn2+ doping on the electrochemical kinetics of CuF2, AC (Alternating Current) impedance measurements were conducted on the CuF2 and Zn0.15Cu0.85F2 electrodes. The Nyquist plots are shown in Figure 11a, with the corresponding equivalent circuit diagrams presented in the inset of Figure 11a. The Rs values for both electrodes are nearly identical, at 18.15 Ω and 16.44 Ω, respectively, indicating that the external conditions of the battery system are similar. The Nyquist curves exhibit two semicircles spanning the high-frequency and mid-frequency regions. The R1 value associated with the high-frequency semicircle is attributed to the electrode/electrolyte interface resistance, while the R2 value related to the mid-frequency semicircle reflects the charge transfer resistance [24]. For the electrode doped with 15% Zn ions, both R1 and R2 are smaller than those of the undoped CuF2 electrode. The reduction in R1 may result from the refinement of active material particles caused by Zn2+ doping, which increases the contact area between the electrode and electrolyte. Furthermore, the charge transfer resistance (R2) of the Zn0.15Cu0.85F2 electrode is significantly lower than that of the CuF2 electrode, suggesting that the solid solution material exhibits enhanced kinetic properties during the charge transfer process. This improvement can be attributed to the formation of a specialized microstructure that facilitates efficient charge transport through the electrode to CuF2.
D Li + = R 2 T 2 2 n 4 A 2 C 2 F 4 σ 2
The lithium ion diffusion coefficients for the CuF2 and Zn0.15Cu0.85F2 electrodes were determined using Equation (1), where R, T, n, A, C, F, and σ represent the gas constant, absolute temperature (K), the number of electrons transferred per unit in the conversion reaction, the electrode surface area, the molar concentration of Li+, the Faraday constant, and the Warburg coefficient associated with Z’, respectively. Figure 8b illustrates the linear relationship between Z’ and ω−1/2, with σ being calculated as the slope of the straight line. According to Equation (1), the lithium ion diffusion coefficients of the CuF2 and Zn0.15Cu0.85F2 electrodes were estimated to be 1.6 × 10⁻²¹ m2/s and 2.24 × 10⁻²¹ m2/s, respectively. These results indicate that the incorporation of Zn2+ effectively expanded the unit cell size of CuF2, leading to an improvement in the lithium ion diffusion coefficient of the electrode.
To investigate the transformation mechanism during the discharge process of Zn-doped CuF2, the discharge products of CuF2 and Zn0.15Cu0.85F2 were characterized using TEM. Figure 12d–f displays the TEM images and selected-area electron diffraction (SAED) patterns of the products after CuF2 was discharged to 1.0 V. As observed in these figures, the discharge products of CuF2 consist of nanoscale particles with relatively uniform sizes, approximately 4 nm in diameter. The lattice fringe spacing in the dark region of the magnified image (Figure 12e) is approximately 0.209 nm, corresponding to the (111) plane of Cu (JCPDS no. 70-3038), confirming that the particles in this region are Cu nanoparticles. The diffraction rings in the SAED pattern (Figure 12f) align perfectly with the crystal planes of Cu, further verifying the presence of Cu nanoparticles in the discharge products of CuF2. Additionally, the diffraction ring corresponding to the (220) plane of LiF was detected, indicating the formation of LiF in the products. These findings confirm that the transformation reaction during the discharge process of CuF2 follows the equation CuF2 + 2Li → Cu + 2LiF, which is consistent with previous studies [25,26].
Figure 12a–c presents the TEM images and SAED patterns of the products after Zn0.15Cu0.85F2 was discharged to 1.0 V. From Figure 12a,b, it can be seen that the lattice fringe spacings of 0.181 nm and 0.208 nm correspond to the (200) and (111) planes of Cu, respectively. In the SAED pattern (Figure 12c), the innermost diffraction ring originates from the (111) plane of Cu, while the remaining rings correspond to the crystal planes of Cu and LiF. Notably, no diffraction rings belonging to CuF2 or ZnF2 were observed, indicating that the discharge products consist of LiF and Cu. Since the discharge voltage exceeds the conversion voltage of ZnF2, no Zn formation was detected, suggesting that the conversion processes of Zn and Cu do not occur simultaneously.

4. Conclusions

Owing to its strong ionic bond characteristics, CuF2 exhibits a large bandgap and poor electronic conductivity, leading to low electrochemical activity and an actual capacity and voltage significantly lower than theoretical values. This study primarily investigates the effect of Zn doping on regulating the band structure and microstructure of CuF2. Through theoretical calculations and experimental validation, it demonstrated that Zn doping effectively reduces the bandgap width and particle size of CuF2, enhances the material’s electronic and lithium ion transport properties, and does not alter the conversion mechanism of CuF2 during discharge. When the Zn doping level is 15%, the synthesized Zn0.15Cu0.85F2 material exhibits superior electrochemical activity, achieving a discharge specific capacity of 528.6 mAh g−1 at 0.1 C and maintaining 489.1 mAh g−1 at 1 C, thereby showcasing excellent discharge specific energy and rate performance. This material holds promise as a novel lithium battery cathode material with both high specific energy and power.

Author Contributions

Conceptualization, Data curation, writing—original draft, P.D., project administration and formal analysis, writing—review and editing, P.L., methodology, software and validation, Z.Y. All authors have read and agreed to the published version of the manuscript.

Funding

This research received no external funding.

Data Availability Statement

The original contributions presented in this study are included in the article. Further inquiries can be directed to the corresponding author.

Conflicts of Interest

Authors Peng Dou, Pengcheng Liu were employed by the company EVE Energy Co., Ltd, Huizhou, China. The author Zhiyong Yu declares that the research was conducted in the absence of any commercial or financial relationships that could be construed as a potential conflict of interest.

References

  1. Scrosati, B.; Garche, J. Lithium batteries: Status, prospects and future. J. Power Sources 2010, 195, 2419–2430. [Google Scholar] [CrossRef]
  2. Majeed, M.; Hussain, A.; Hussain, G.; Majeed, M.U.; Ashfaq, M.Z.; Iqbal, R.; Saleem, A. Interfacial Engineering of Polymer Solid-State Lithium Battery Electrolytes and Li-Metal Anode: Current Status and Future Directions. Small 2024, 20, 2406357. [Google Scholar] [CrossRef] [PubMed]
  3. Jalees, S.; Hussain, A.; Iqbal, R.; Raza, W.; Ahmad, A.; Saleem, A.; Majeed, M.K.; Faheem, M.; Ahmad, N.; Ur Rehman, L.N.; et al. Functional PBI membrane based on polyimide covalent organic framework for durable lithium metal battery. J. Energy Storage 2024, 101, 113985. [Google Scholar] [CrossRef]
  4. Saleem, A.; Iqbal, R.; Majeed, M.K.; Hussain, A.; Akbar, A.R.; Hussain, Z.; Zabar, J.; Rauf, Z.; Shaw, L.L. Boosting lithium-ion conductivity of polymer electrolyte by selective introduction of covalent organic frameworks for safe lithium metal batteries. Nano Energy 2024, 128, 109848. [Google Scholar] [CrossRef]
  5. Lin, J.; Zhu, L.; Chen, S.; Li, Q.; He, Z.; Cai, Z.; Cao, L.; Yuan, Z.; Liu, J. Self-Templated Formation of Hollow Yolk-Like Spheres Iron Fluoride as Cathode Material for High-Performance Li-Ion Batteries. J. Electrochem. Soc. 2019, 166, A2074–A2082. [Google Scholar] [CrossRef]
  6. Lin, J.; Chen, S.; Zhu, L.; Yuan, Z.; Liu, J. Soft-template fabrication of hierarchical nanoparticle iron fluoride as high-capacity cathode materials for Li-ion batteries. Electrochim. Acta 2020, 364, 137293. [Google Scholar] [CrossRef]
  7. Badway, F.; Mansour, A.N.; Pereira, N.; Al-Sharab, J.F.; Cosandey, F.; Plitz, I.; Amatucci, G.G. Structure and electrochemistry of copper fluoride nanocomposites utilizing mixed conducting matrices. Chem. Mater. A Publ. Am. Chem. Soc. 2007, 19, 4129–4141. [Google Scholar] [CrossRef]
  8. Liu, X.M.; Wang, X.Y.; Wu, W.; Wang, X.; Wang, G.B.; Yang, S.Y. Effects of MoO3 encapsulating on performances of CuF2 cathode material for application of lithium primary batteries. Chin. J. Nonferrous Met. 2010, 20, 288–292. [Google Scholar]
  9. Thieu, D.T.; Fawey, M.H.; Bhatia, H.; Diemant, T.; Chakravadhanula, V.S.K.; Behm, R.J.; Kübel, C.; Fichtner, M. CuF2 as Reversible Cathode for Fluoride Ion Batteries. Adv. Funct. Mater. 2017, 27, 1701051. [Google Scholar] [CrossRef]
  10. Hua, X.; Eggeman, A.S.; Castillo-Martínez, E.; Robert, R.; Geddes, H.S.; Lu, Z.; Pickard, C.J.; Meng, W.; Wiaderek, K.M.; Pereira, N.; et al. Revisiting metal fluorides as lithium-ion battery cathodes. Nat. Mater. 2021, 20, 841–850. [Google Scholar] [CrossRef]
  11. Hu, Q.; Yu, Z.; Tian, L.; Zhao, Y.; Liu, H.; Lai, C.; Yuan, Z. Porous anhydrous CuF2 with a micro-nano-hierarchical structure as high-performance cathode material for Li-ion battery. J. Mater. Sci. 2023, 58, 10120–10130. [Google Scholar] [CrossRef]
  12. Hu, Q.; Yu, Z.; Tian, L.; Zhao, Y.; Liu, H.; Lai, C.; Yuan, Z. Porous CuF2 integrated with a three-dimensional conductive network of CNTs as cathode materials for lithium-ion batteries. J. Mater. Sci. Mater. Electron. 2023, 34, 1076. [Google Scholar] [CrossRef]
  13. Ji, E.; Huang, J.; Yu, Z.; Hu, Q.; Liu, H.; Lai, C.; Yuan, Z. Electrochemical characterization of CuF2/CNTs cathode materials prepared by a coprecipitation method. Funct. Mater. Lett. 2022, 15, 2251036. [Google Scholar] [CrossRef]
  14. Xu, H.; Yu, Z.; Tian, L.; Du, S.; Zhao, Y.; Cheng, J.; Liu, H.; Yuan, Z. Porous CuF2 derived from MOFs as cathode materials for Li-ion batteries. Funct. Mater. Lett. 2025, 18, 2551026. [Google Scholar] [CrossRef]
  15. Liu, Y.; Li, L.; Li, X.; Xu, Y.; Wu, D.; Sakthivel, T.; Guo, Z.; Zhao, X.; Dai, Z. Asymmetric tacticity navigates the localized metal spin state for sustainable alkaline/sea water oxidation. Sci. Adv. 2025, 11, ads0861. [Google Scholar] [CrossRef]
  16. Zheng, Y.; Zhang, P.; Wu, S.Q.; Wen, Y.H.; Zhu, Z.Z.; Yang, Y. First-principles studies on the structural and electronic properties of Li-ion battery cathode material CuF2. Solid State Commun. 2012, 152, 1703–1706. [Google Scholar] [CrossRef]
  17. Krahl, T.; Wnkelmann, F.; Martin, A.; Pinna, N.; Kemnitz, E. Novel Synthesis of Anhydrous and Hydroxylated CuF2 Nanoparticles and Their Potential for Lithium Ion Batteries. Chem. A Eur. J. 2018, 24, 7177–7187. [Google Scholar] [CrossRef]
  18. Omenya, F.; Zagarella, N.; Rana, J.; Zhang, H.; Siu, C.; Zhou, H.; Wen, B.; Chernova, N.A.; Piper, L.F.J.; Zhou, G.; et al. Intrinsic challenges to the electrochemical reversibility of the high energy density copper (II) fluoride cathode material. ACS Appl. Energy Mater. 2019, 2, 5243–5253. [Google Scholar] [CrossRef]
  19. Wang, F.; Kim, S.; Seo, D.; Kang, K.; Wang, L.; Su, D.; Vajo, J.J.; Wang, J.; Graetz, J. Ternary metal fluorides as high-energy cathodes with low cycling hysteresis. Nat. Commun. 2015, 6, 6668. [Google Scholar]
  20. Ding, J.; Zhou, X.; Luo, C.; Wang, X.; Yao, H.; Fu, H.; Yang, J.; Tang, J. First-principles calculations and experimental study of Al-doped Fe1-xAlxF3·0.33H2O/C cathodes for Li-ion batteries. Ionics 2022, 28, 3127–3137. [Google Scholar] [CrossRef]
  21. Villa, C.; Kim, S.; Lu, Y.; Dravid, V.P.; Wu, J. Cu-substituted NiF2 as a cathode material for Li-ion batteries. ACS Appl. Mater. Interfaces 2018, 11, 647–654. [Google Scholar] [CrossRef]
  22. Tang, C.; Gao, Y.; Zhu, K.; Cao, D. Preparation of high performance MnO2 cathode for lithium primary battery through uniform particle size and crystal modulation. J. Power Sources 2025, 633, 236368. [Google Scholar] [CrossRef]
  23. Rivera-Lugo, Y.; Félix-Navarro, R.; Trujillo-Navarrete, B.; Reynoso-Soto, E.A.; Silva-Carrillo, C.; Cruz-Gutiérrez, C.A.; Quiroga-González, E.; Calva-Yáñez, J.C. Flower-like δ-MnO2 as cathode material of Li-ion batteries of high charge-discharge rates. Fuel 2021, 287, 119463. [Google Scholar] [CrossRef]
  24. Liu, W.; Ma, S.; Li, Y.; Wan, B.; Wu, C.; Ma, S.; Guo, R.; Pei, H.; Xie, J. Electrochemical impedance spectroscopy analysis for lithium carbon fluorides primary battery. J. Energy Storage 2023, 68, 107699. [Google Scholar] [CrossRef]
  25. Hua, X.; Robert, R.; Du, L.S.; Wiaderek, K.M.; Leskes, M.; Chapman, K.W.; Chupas, P.J.; Grey, C.P. Comprehensive Study of the CuF2 Conversion Reaction Mechanism in a Lithium Ion Battery. J. Phys. Chem. C 2014, 118, 15169–15184. [Google Scholar] [CrossRef]
  26. Hua, X.; Robert, R.; Grey, C.; Wang, F.; Graetz, J. Study of the Conversion Reaction Mechanism of Carbon Copper Fluoride Nanocomposites as Cathode Materials in Li-ion Batteries. ECS Meet. Abstr. 2011, 26, 326–336. [Google Scholar] [CrossRef]
Figure 1. Schematic illustrations of the supercells for CuF2 (a) and Cu0.95Zn0.05F2 (b).
Energies 18 03752 g001
Figure 2. Band structure and density of states of CuF2 (a,c) and Cu0.85Zn0.15F2 (b,d).
Energies 18 03752 g002
Figure 3. Schematic representation of the bond population distribution in the supercell models of CuF2 (a) and Cu0.95Zn0.05F2 (b).
Energies 18 03752 g003
Figure 4. XRD profiles of ZnxCu1−xF2 (x = 0, 0.05, 0.1, 0.15, 0.2) samples, with diffraction angles ranging from 15° to 70° (a); 26° to 30° (b); Rietveld refinement patterns of the XRD data for the CuF2 (c) and Zn0.1Cu0.9F2 (d).
Energies 18 03752 g004
Figure 5. XPS spectra of Zn0.15Cu0.85F2 Cu 2p spectra (a) and Zn 2p spectra (b).
Energies 18 03752 g005
Figure 6. SEM images of CuF2 (a), Zn0.05Cu0.95F2 (b), Zn0.1Cu0.9F2 (c), Zn0.15Cu0.85F2 (d), and Zn0.2Cu0.8F2 (e).
Energies 18 03752 g006
Figure 7. SEM images and mapping images of the Cu, F, and Zn elements of Zn0.15Cu0.85F2.
Energies 18 03752 g007
Figure 8. TEM images of CuF2 (a), Zn0.05Cu0.95F2 (b), and Zn0.15Cu0.85F2 (c).
Energies 18 03752 g008
Figure 9. The initial charge–discharge curves of ZnxCu1-xF2 (x = 0, 0.1, 0.15, 0.2) under various rates (0.1 C, 0.2 C, 0.5 C, and 1 C), namely CuF2 (a), Zn0.1Cu0.9F2 (b), Zn0.15Cu0.85F2 (c), and Zn0.2Cu0.8F2 (d).
Energies 18 03752 g009
Figure 10. Cyclic voltammetry curves of CuF2 and Zn0.15Cu0.85F2.
Energies 18 03752 g010
Figure 11. EIS results of CuF2 and Zn0.15Cu0.85F2.(a), The linear relationship between Z’ and ω−1/2 (b).
Energies 18 03752 g011
Figure 12. TEM images and SAED patterns of the discharge products of the electrodes: Zn0.15Cu0.85F2 (ac) and CuF2 (df).
Energies 18 03752 g012
Table 1. Bond population distribution of Zn-doped CuF2.
Pure CuF25% Zn
BondPLPL
Zn-F --0.192.042
Cu-F1 0.221.9460.241.925
Cu-F2 0.211.9540.231.933
Note: P stands for population, L for length.
Table 2. Comparison of capacity and voltage between Zn0.15Cu0.85F2 and other fluoride and manganese oxide cathodes.
No.CathodesCurrentVoltage(V)Capacity (mAh/g)References
1CuF20.1 C2.7413[17]
2CuF2/MoO30.1 C2.5483[8]
3Cu0.5Fe0.5F25 mAg −12.55475[18]
4Cu0.5Fe0.5F20.02 C2.65485[19]
5Fe0.92Al0.08F3·0.33H2O/C40 mA g−13.0200[20]
6Cu0.1Ni0.9F2C/101.75548[21]
7MnO2 0.1 C2.9245.7[22]
8MnO220 mA g−12.8235.5[23]
9Zn0.15Cu0.85F20.1 C2.75528.6This work
Disclaimer/Publisher’s Note: The statements, opinions and data contained in all publications are solely those of the individual author(s) and contributor(s) and not of MDPI and/or the editor(s). MDPI and/or the editor(s) disclaim responsibility for any injury to people or property resulting from any ideas, methods, instructions or products referred to in the content.

