
Technical and Economic Analysis of a Newly Designed PV System Powering a University Building


Abstract
1. Introduction
2. Materials and Methods
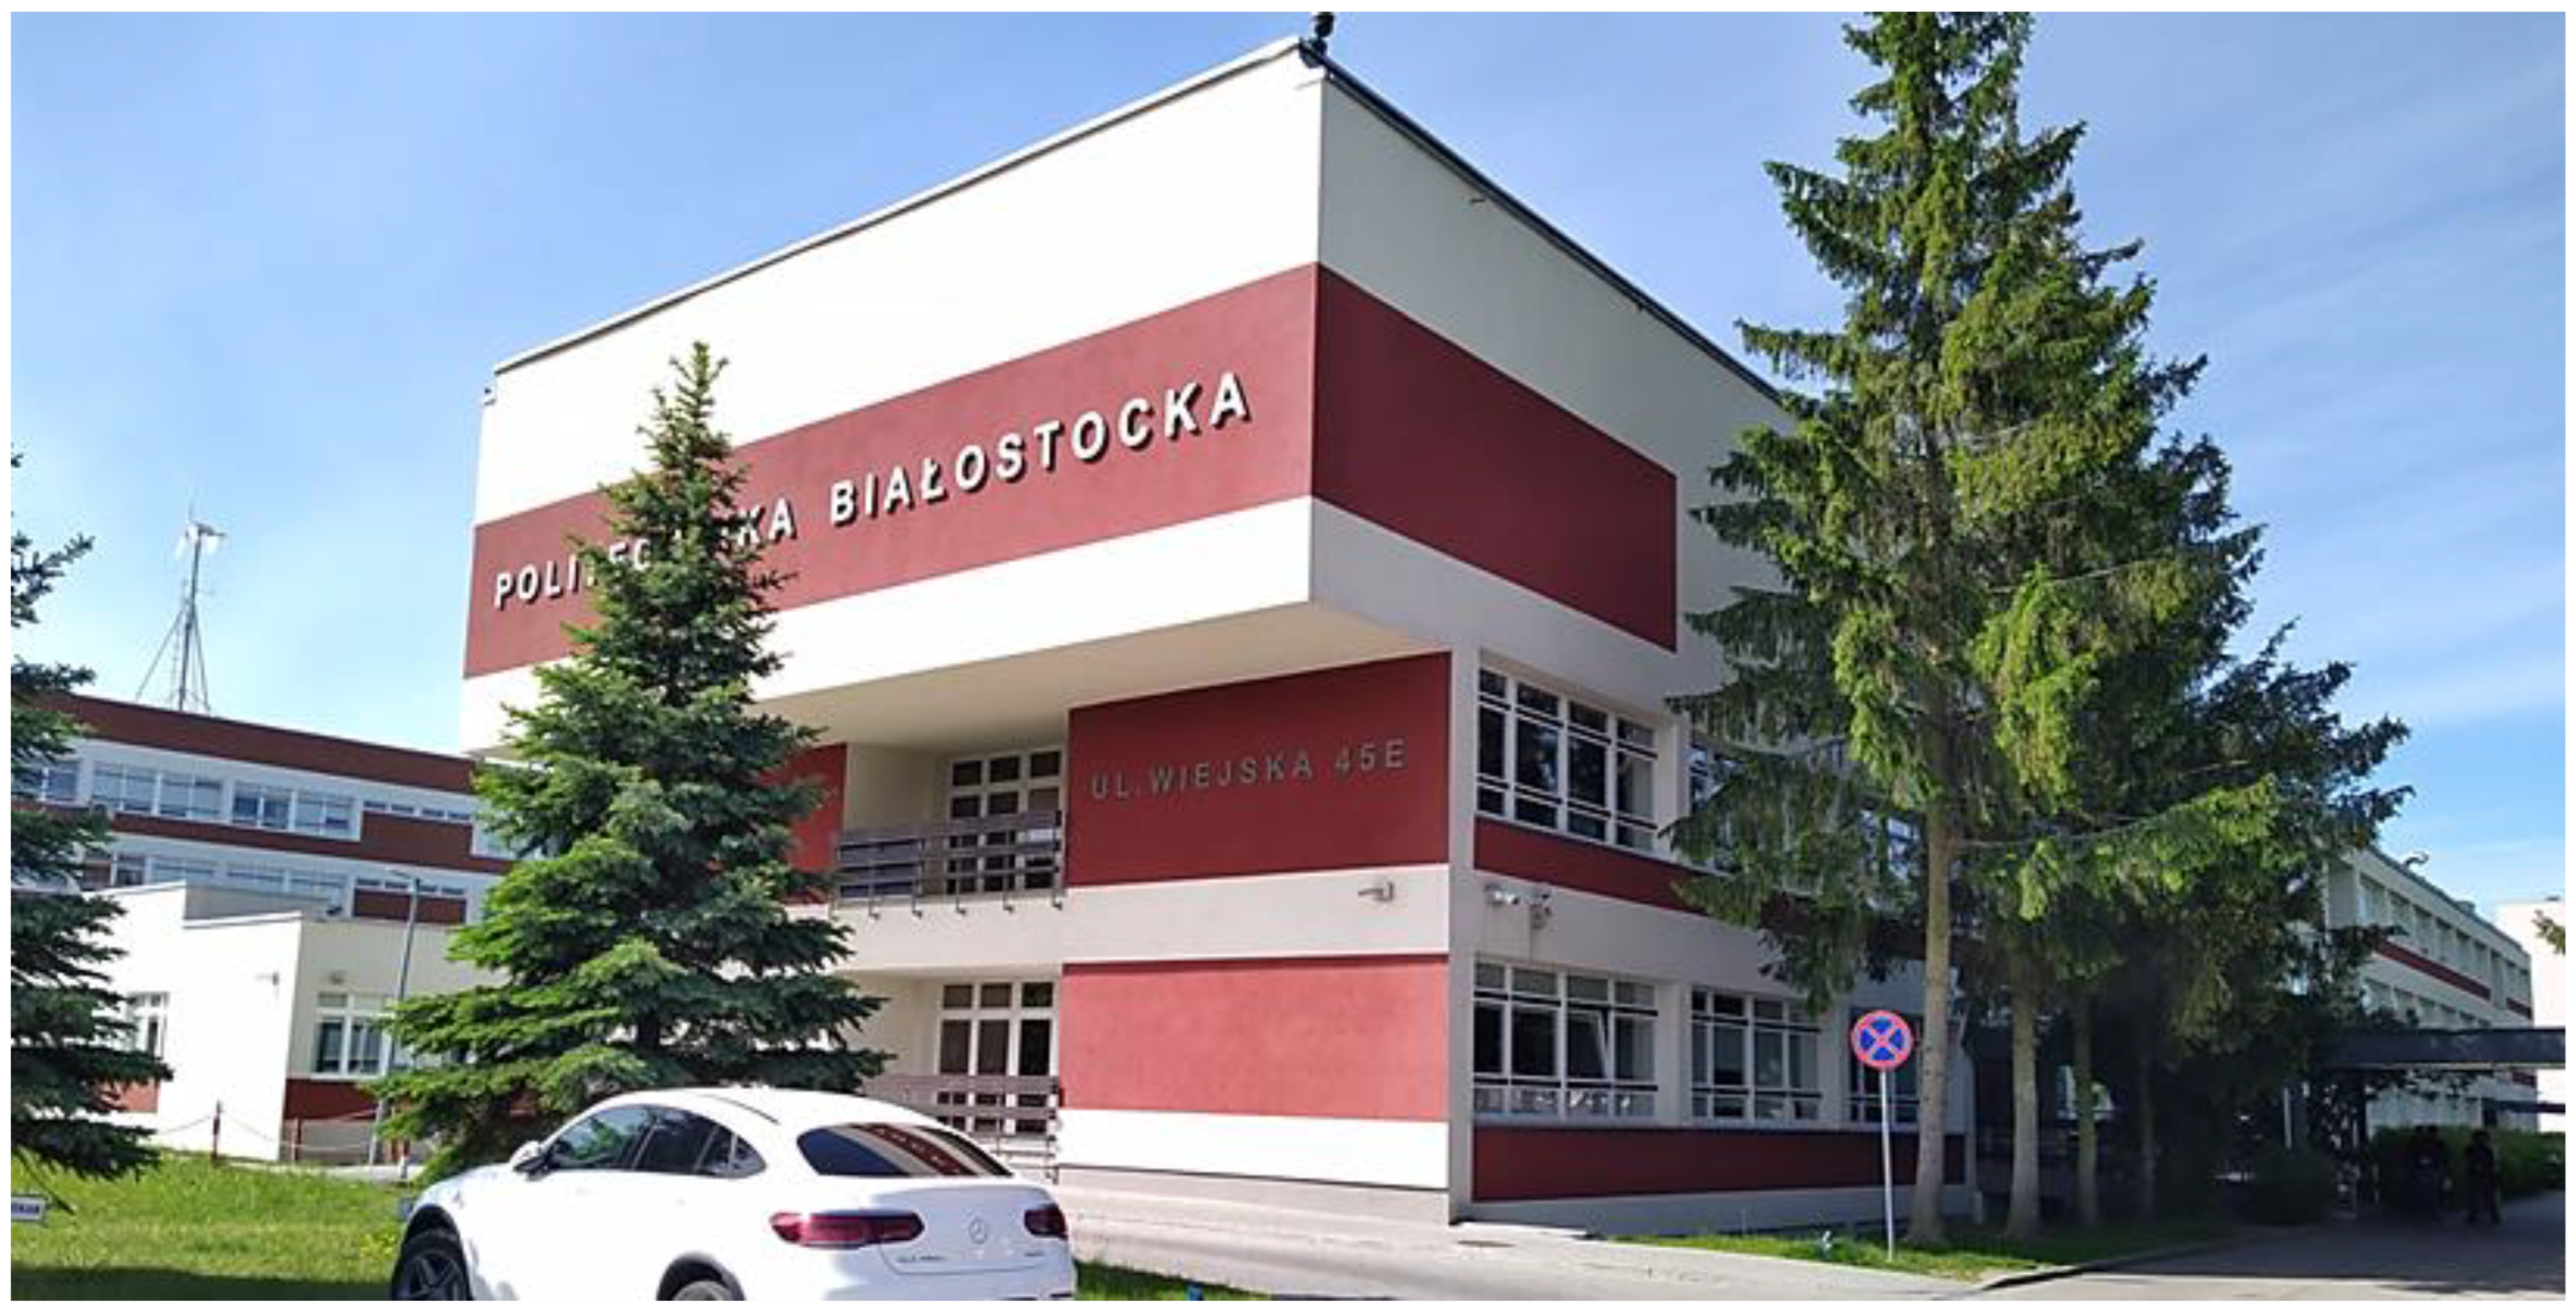
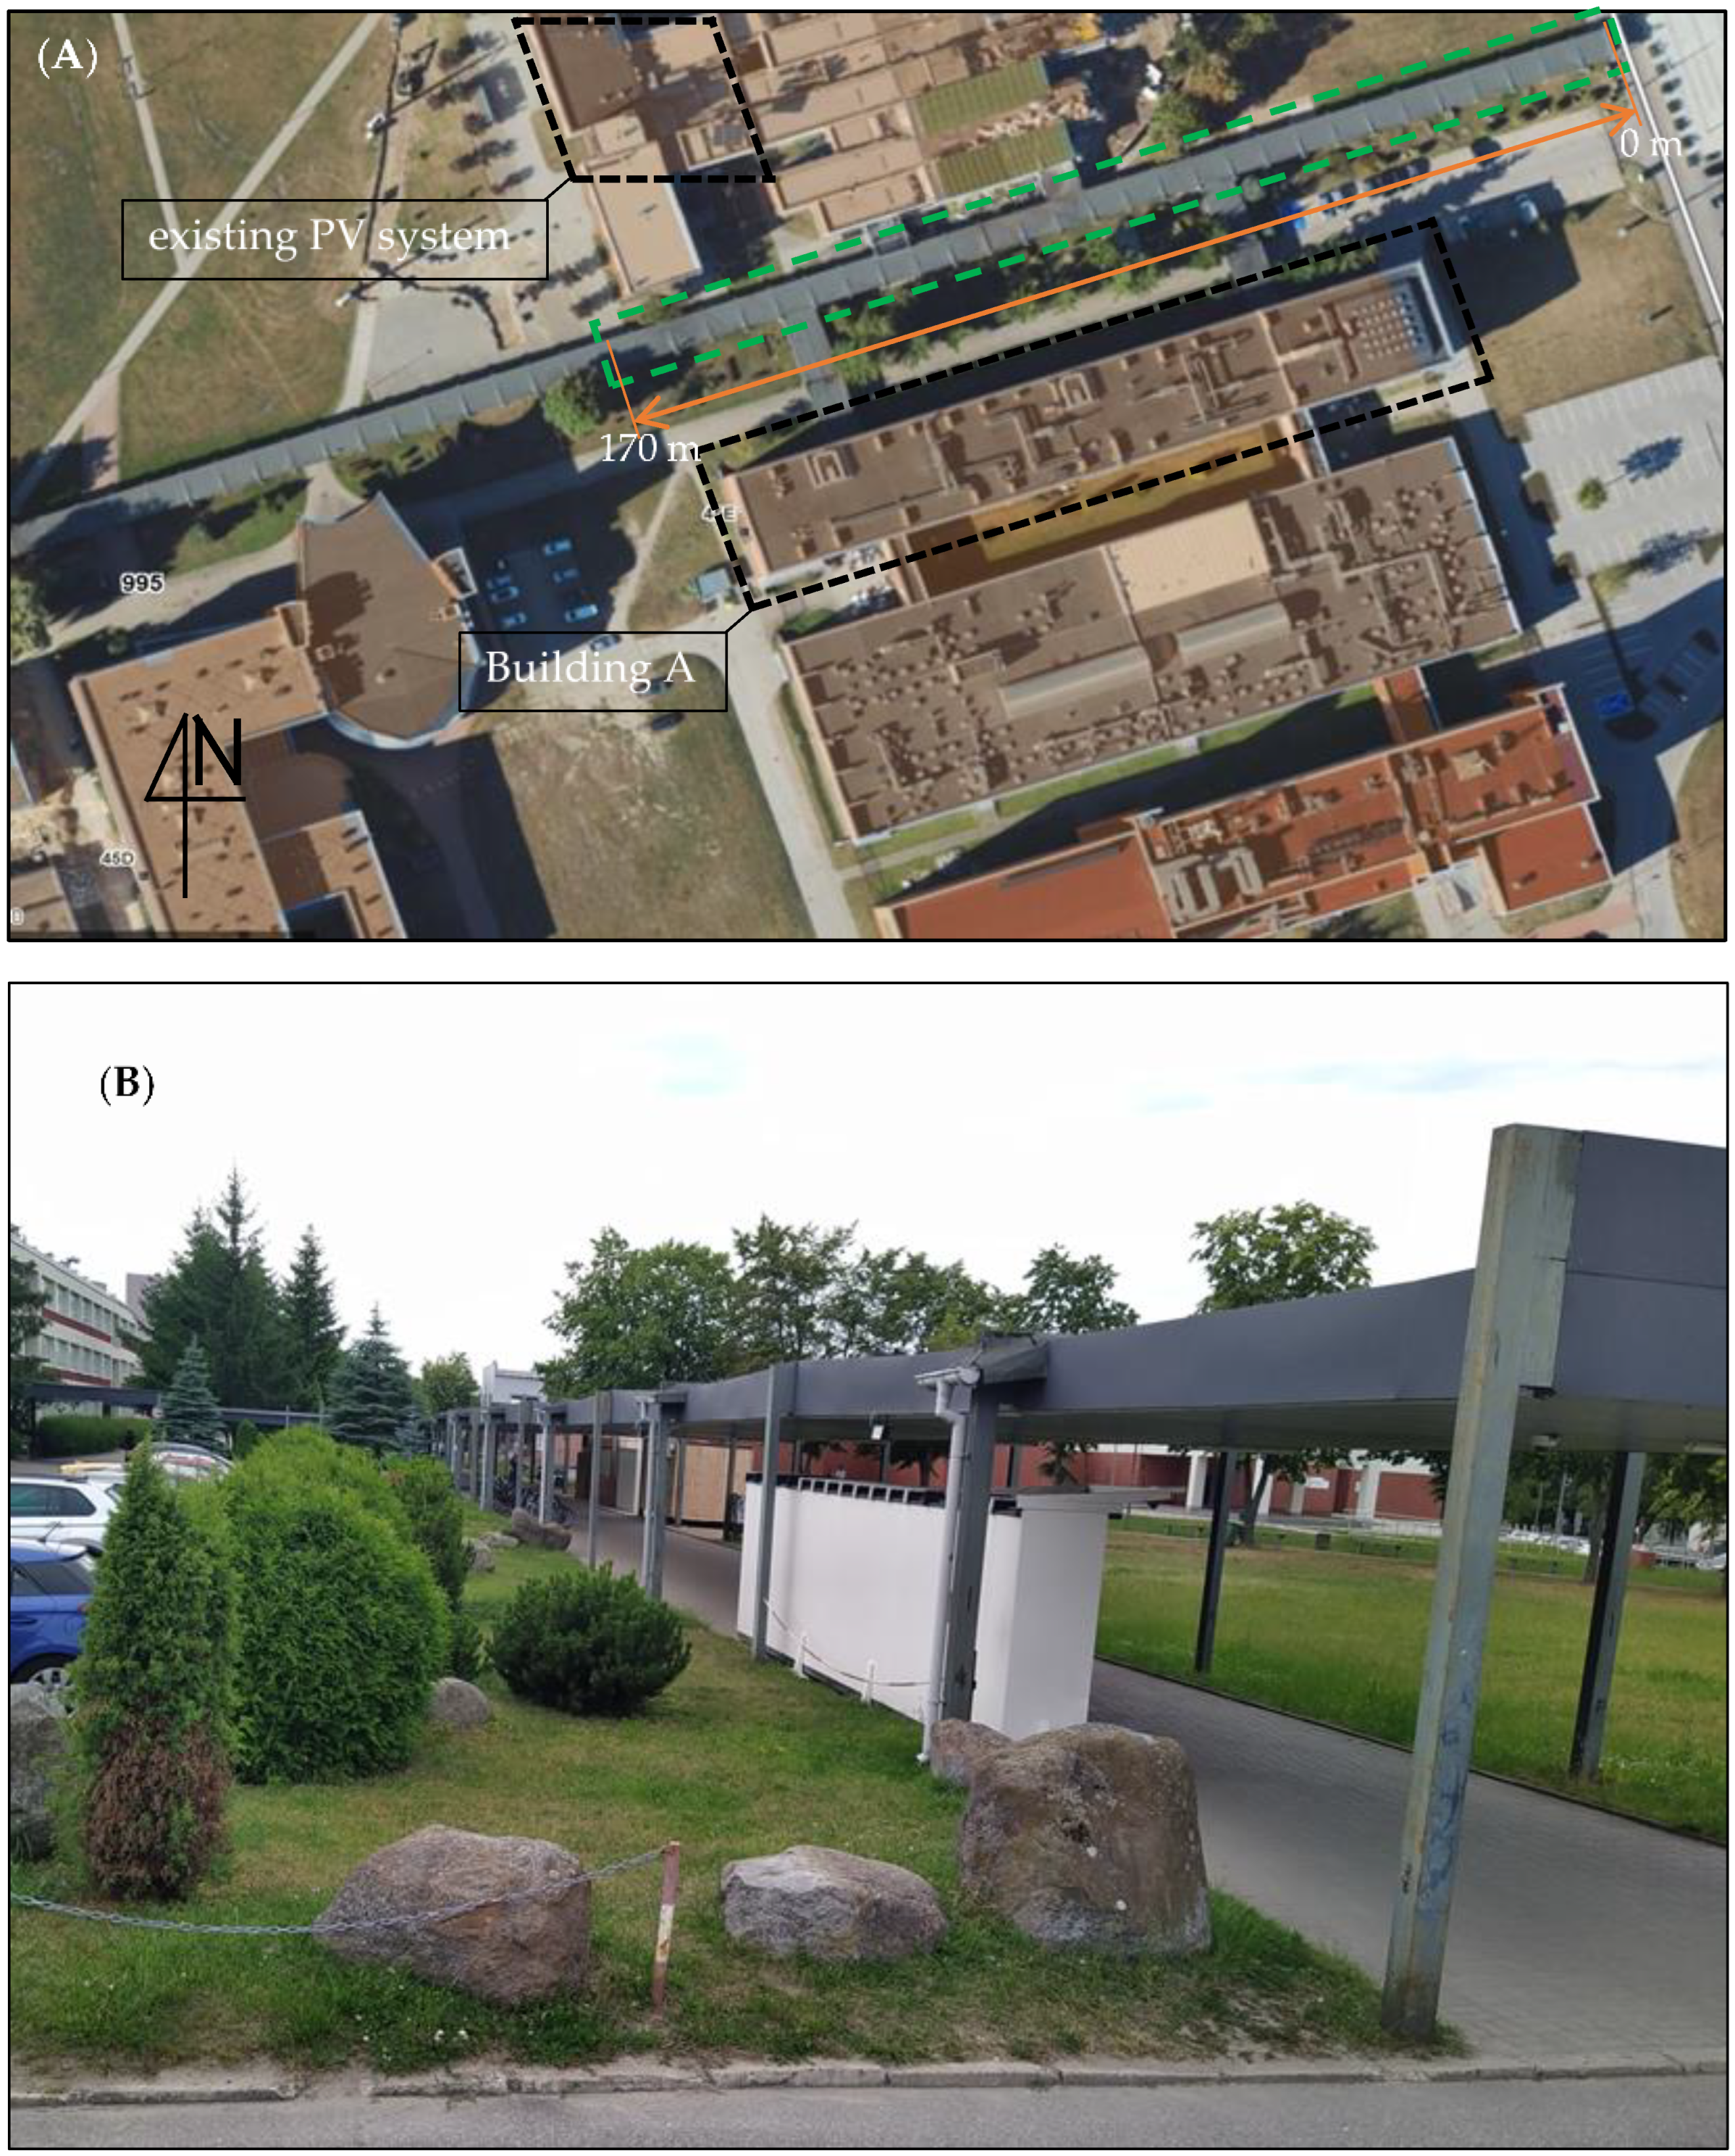
2.1. Description of the Site Where the New PV System Can Be Located
2.2. Energy Modelling Assumptions
- Photovoltaic performance [27]—used to determine solar radiation and performance of the PV system.
- Solar radiation [28]—used to calculate the value of solar radiation and the efficiency of PV panels.
- Typical meteorological year [29]—used to generate climate parameters in a typical meteorological year for a selected period.
2.3. Basic Assumptions of Financial Cost Analysis
- IC—initial capital cost of investment, including the cost of design, equipment, transportation, and installation of the system and infrastructure [EUR/kWp];
- CF—cost flows related to the annual cost reduction resulting from the use of energy from the PV system [EUR/kWp];
- CO&M—annual cost resulting from the operation and maintenance of the entire system [EUR/kWp];
- CR—annual cost resulting from the need to replace worn-out components of the PV system [EUR/kWp];
- T—life cycle period [year];
- r—discount rate [%].
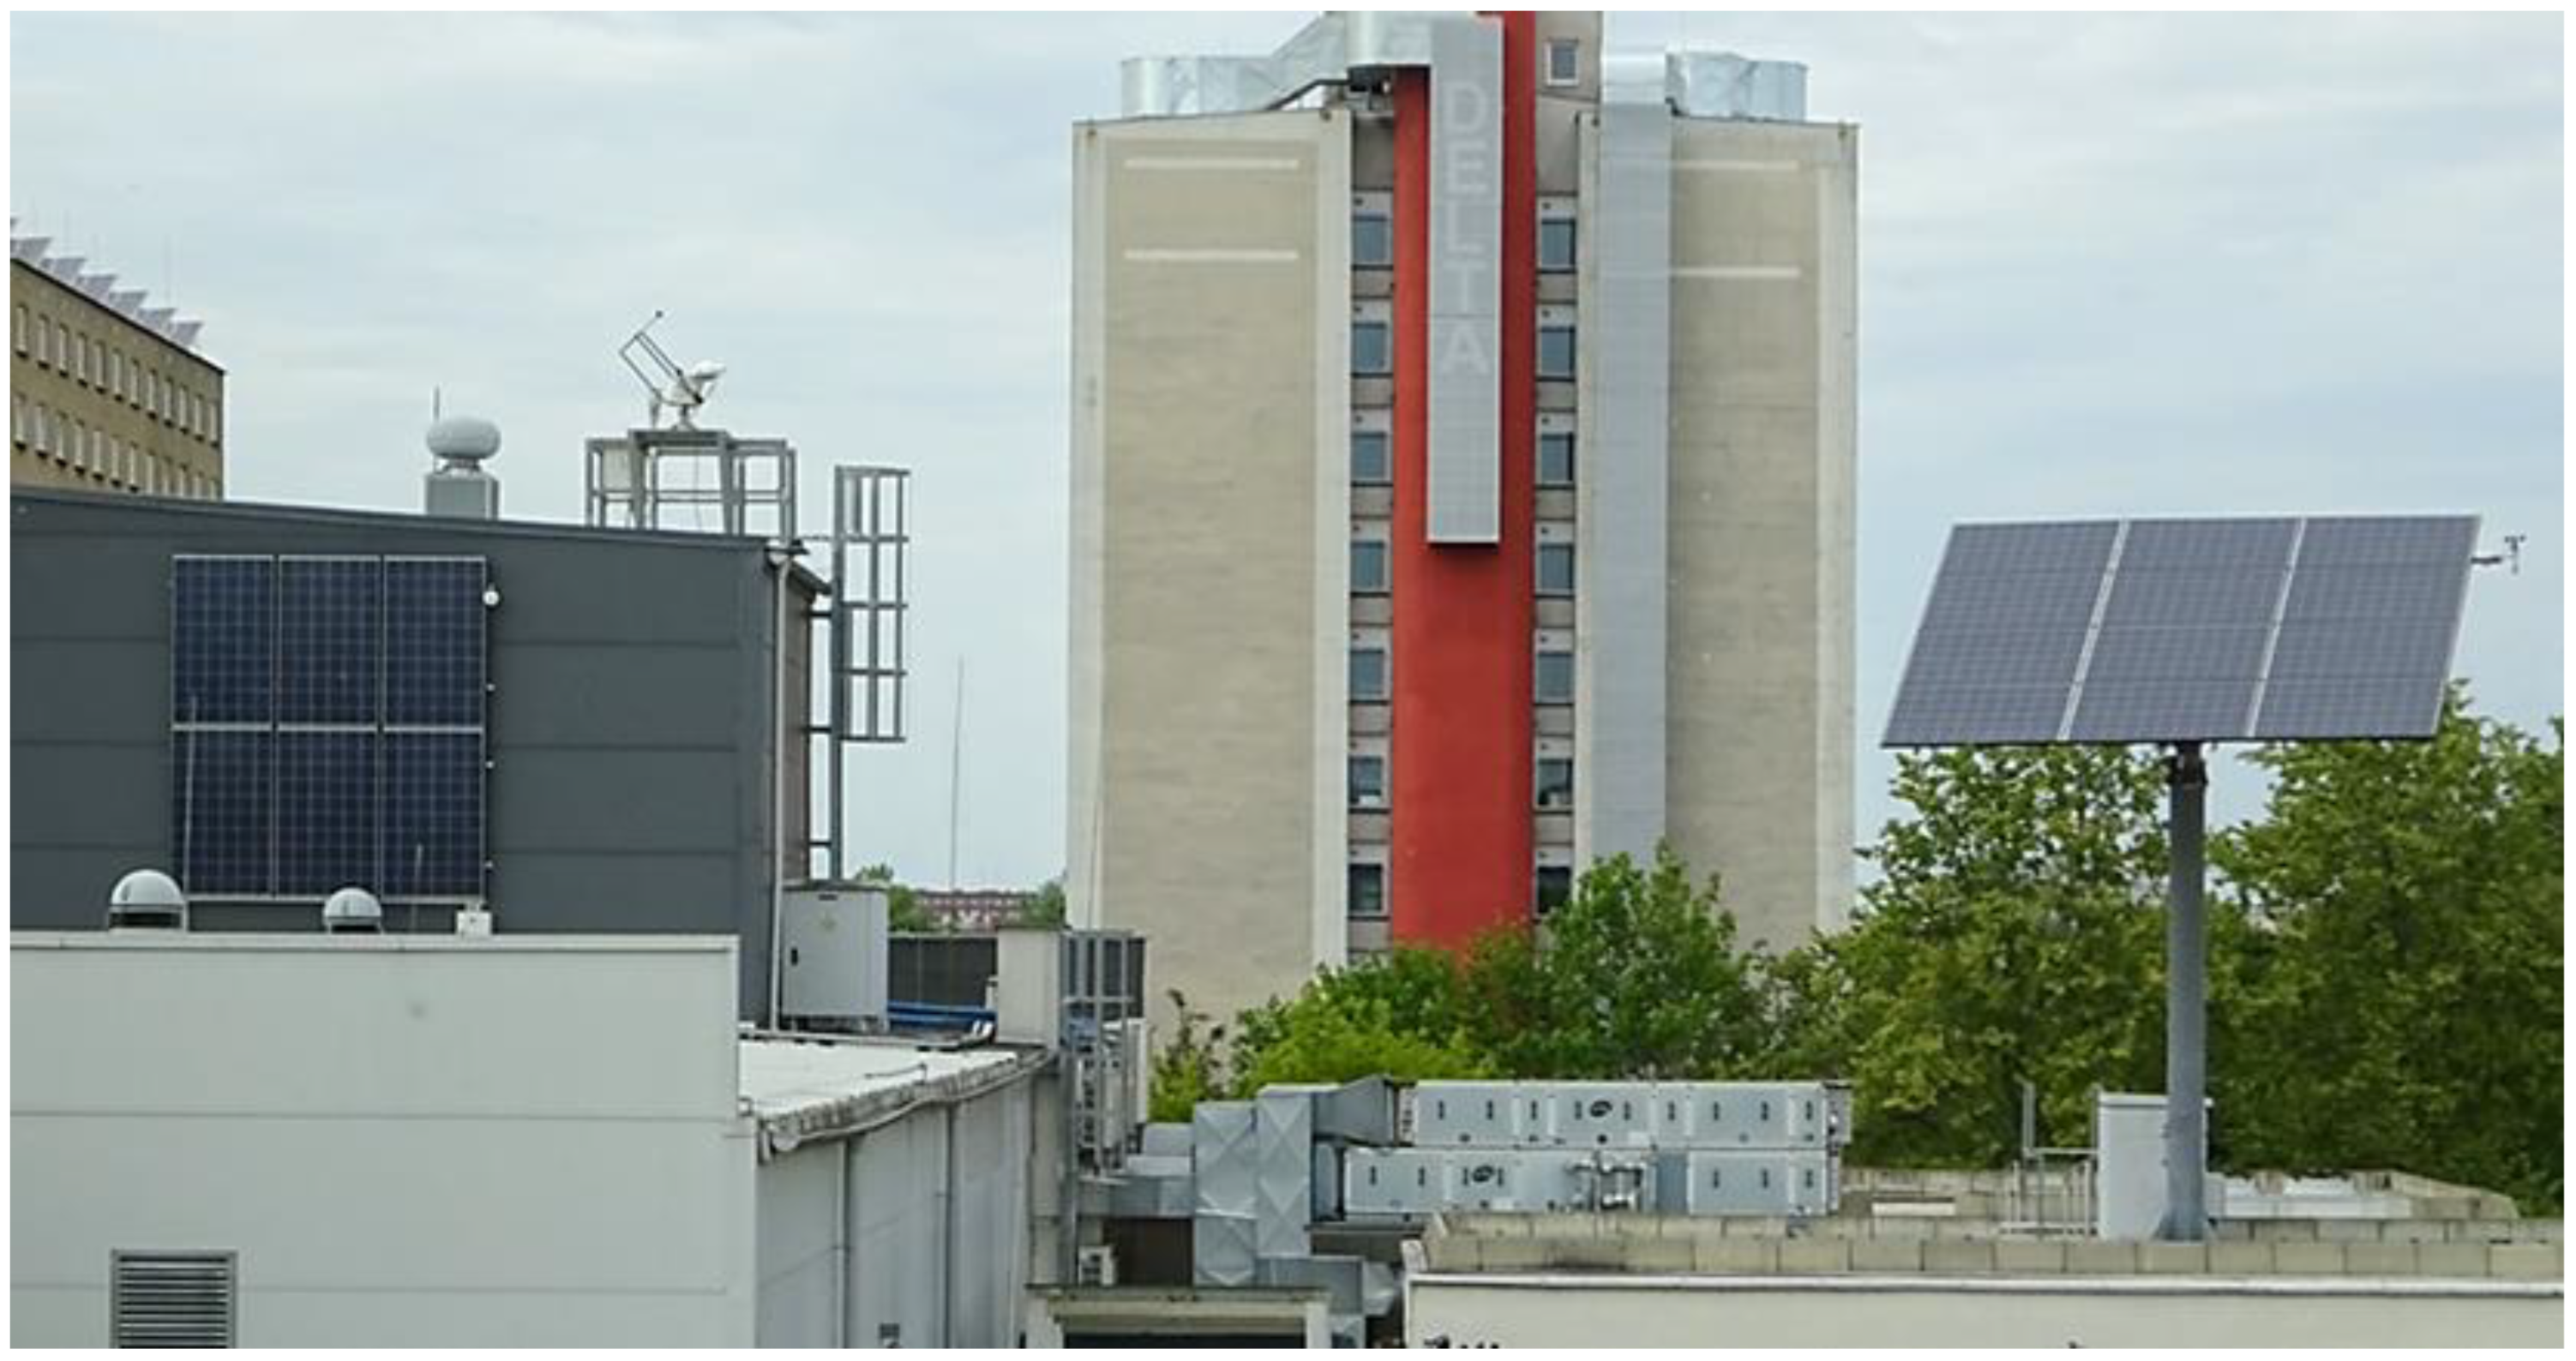
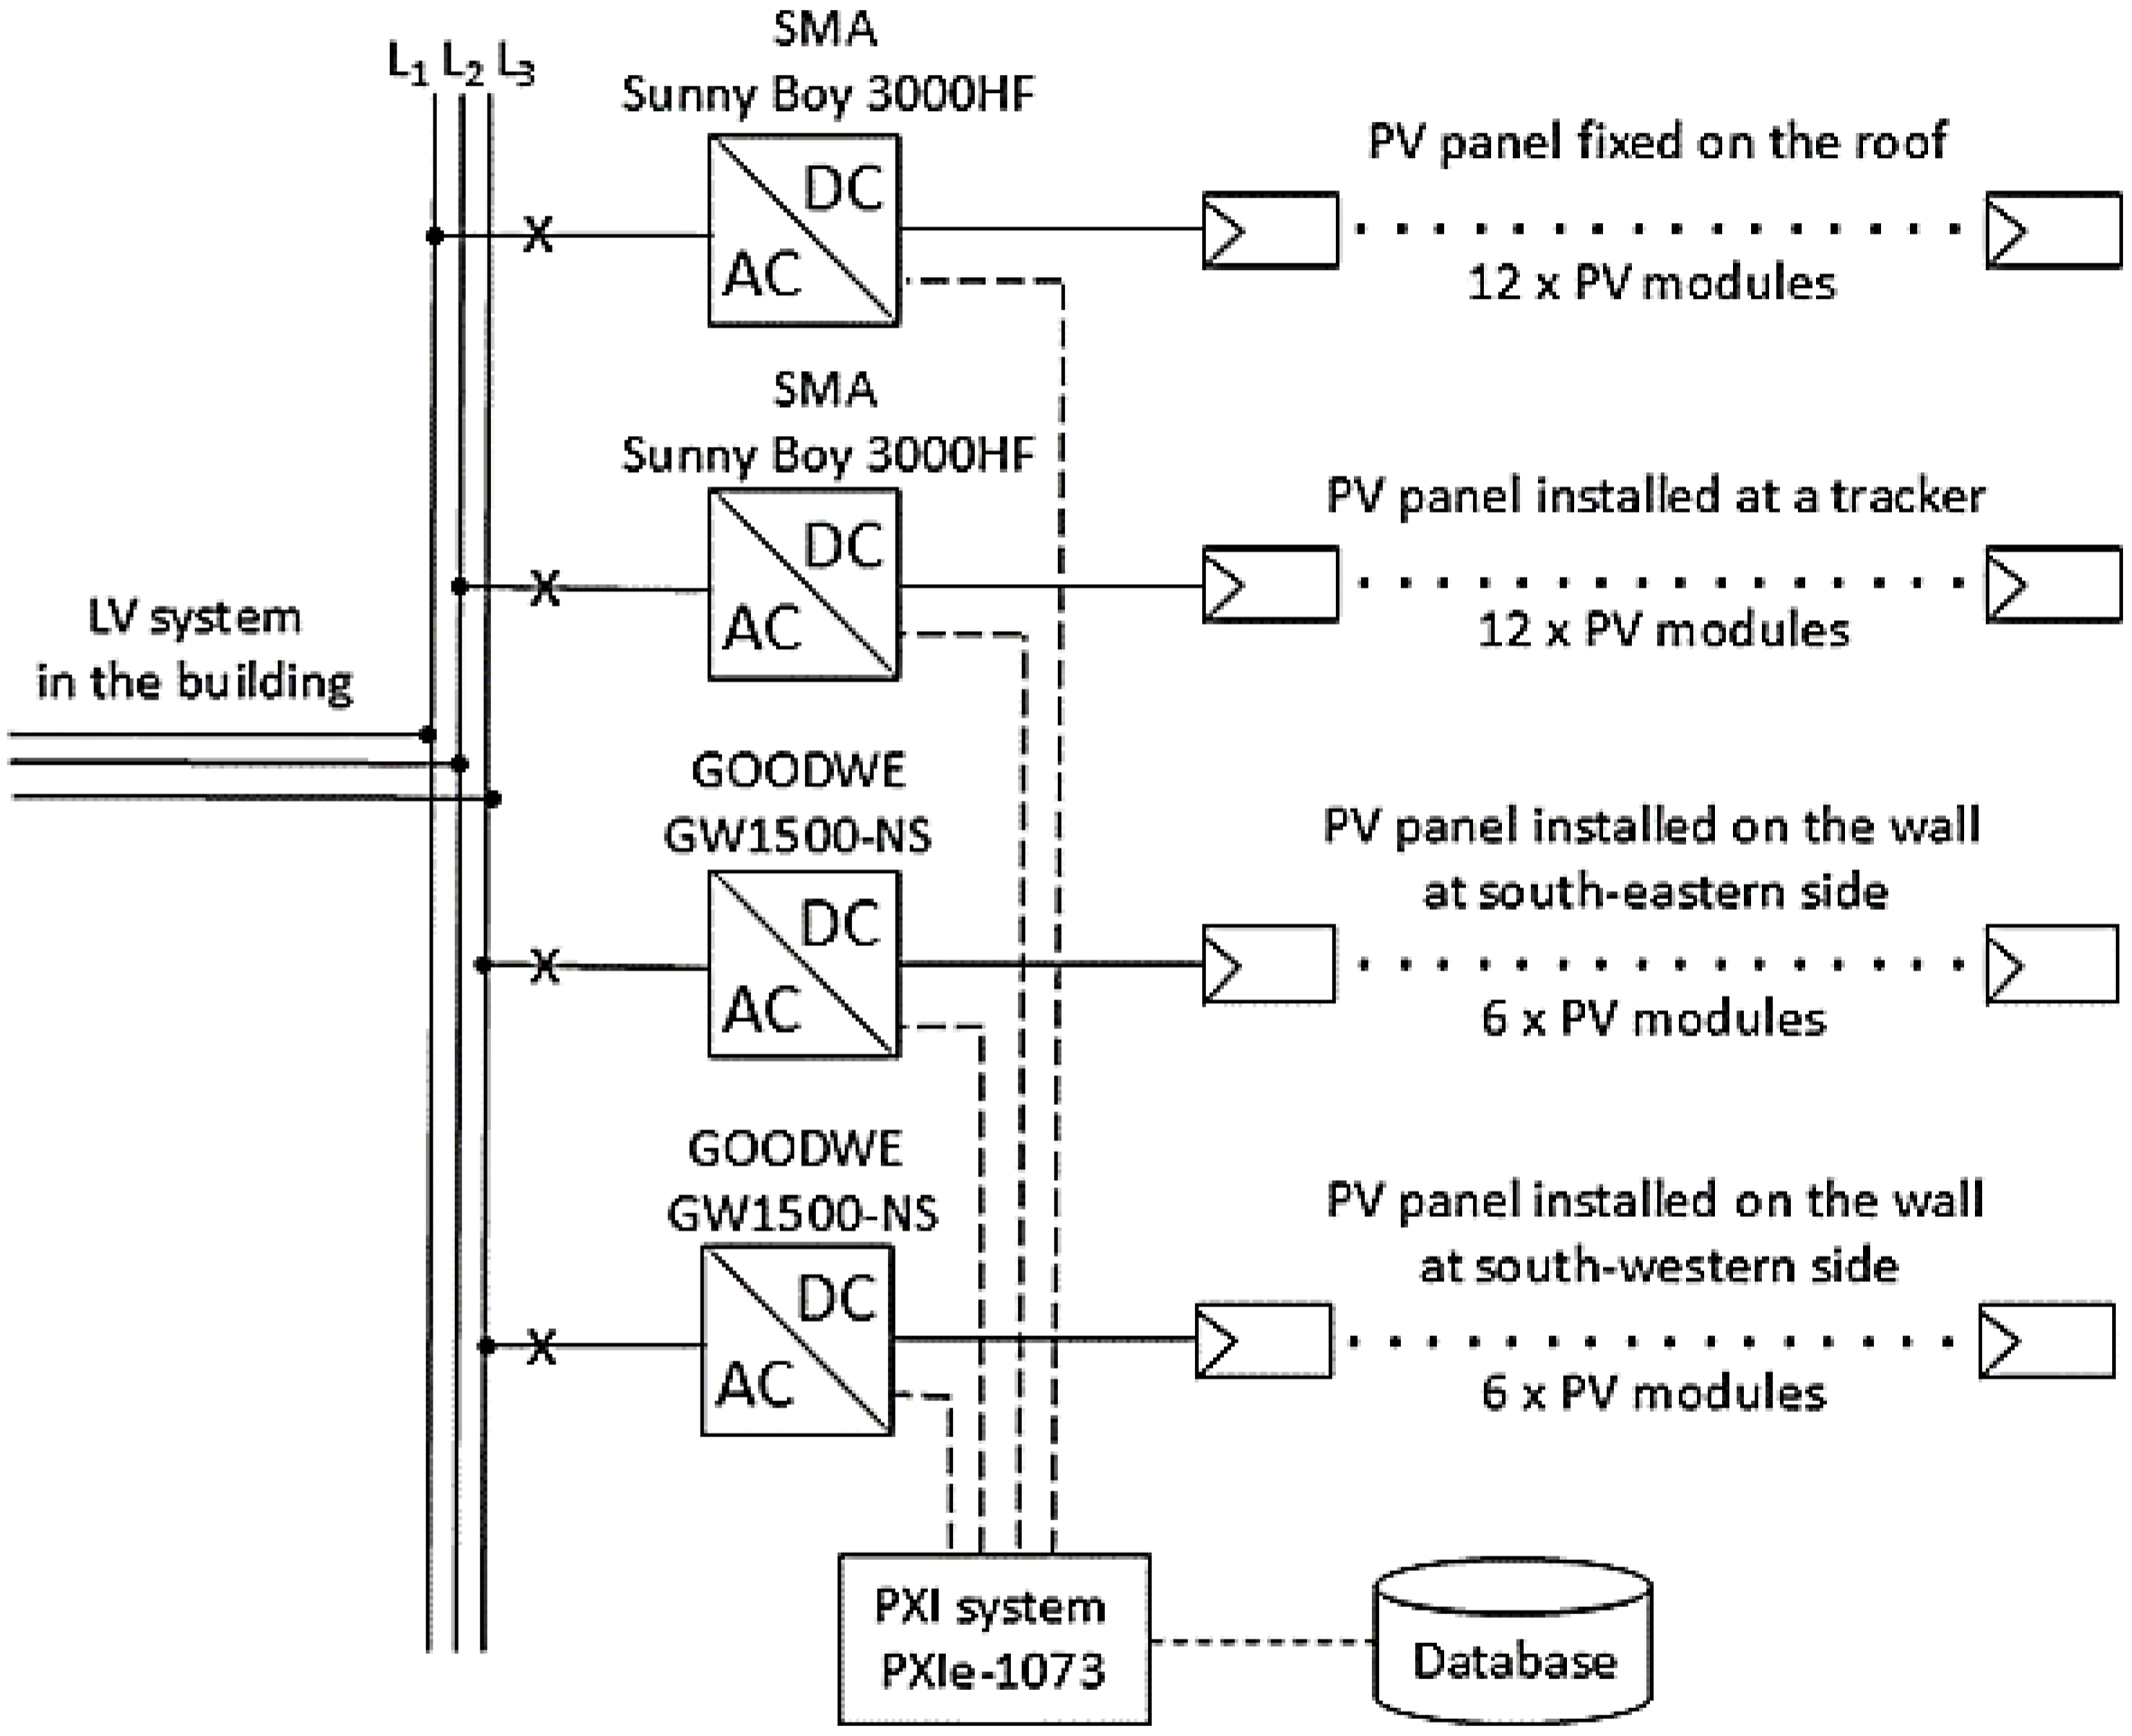
2.4. Characteristics of the Measurement System
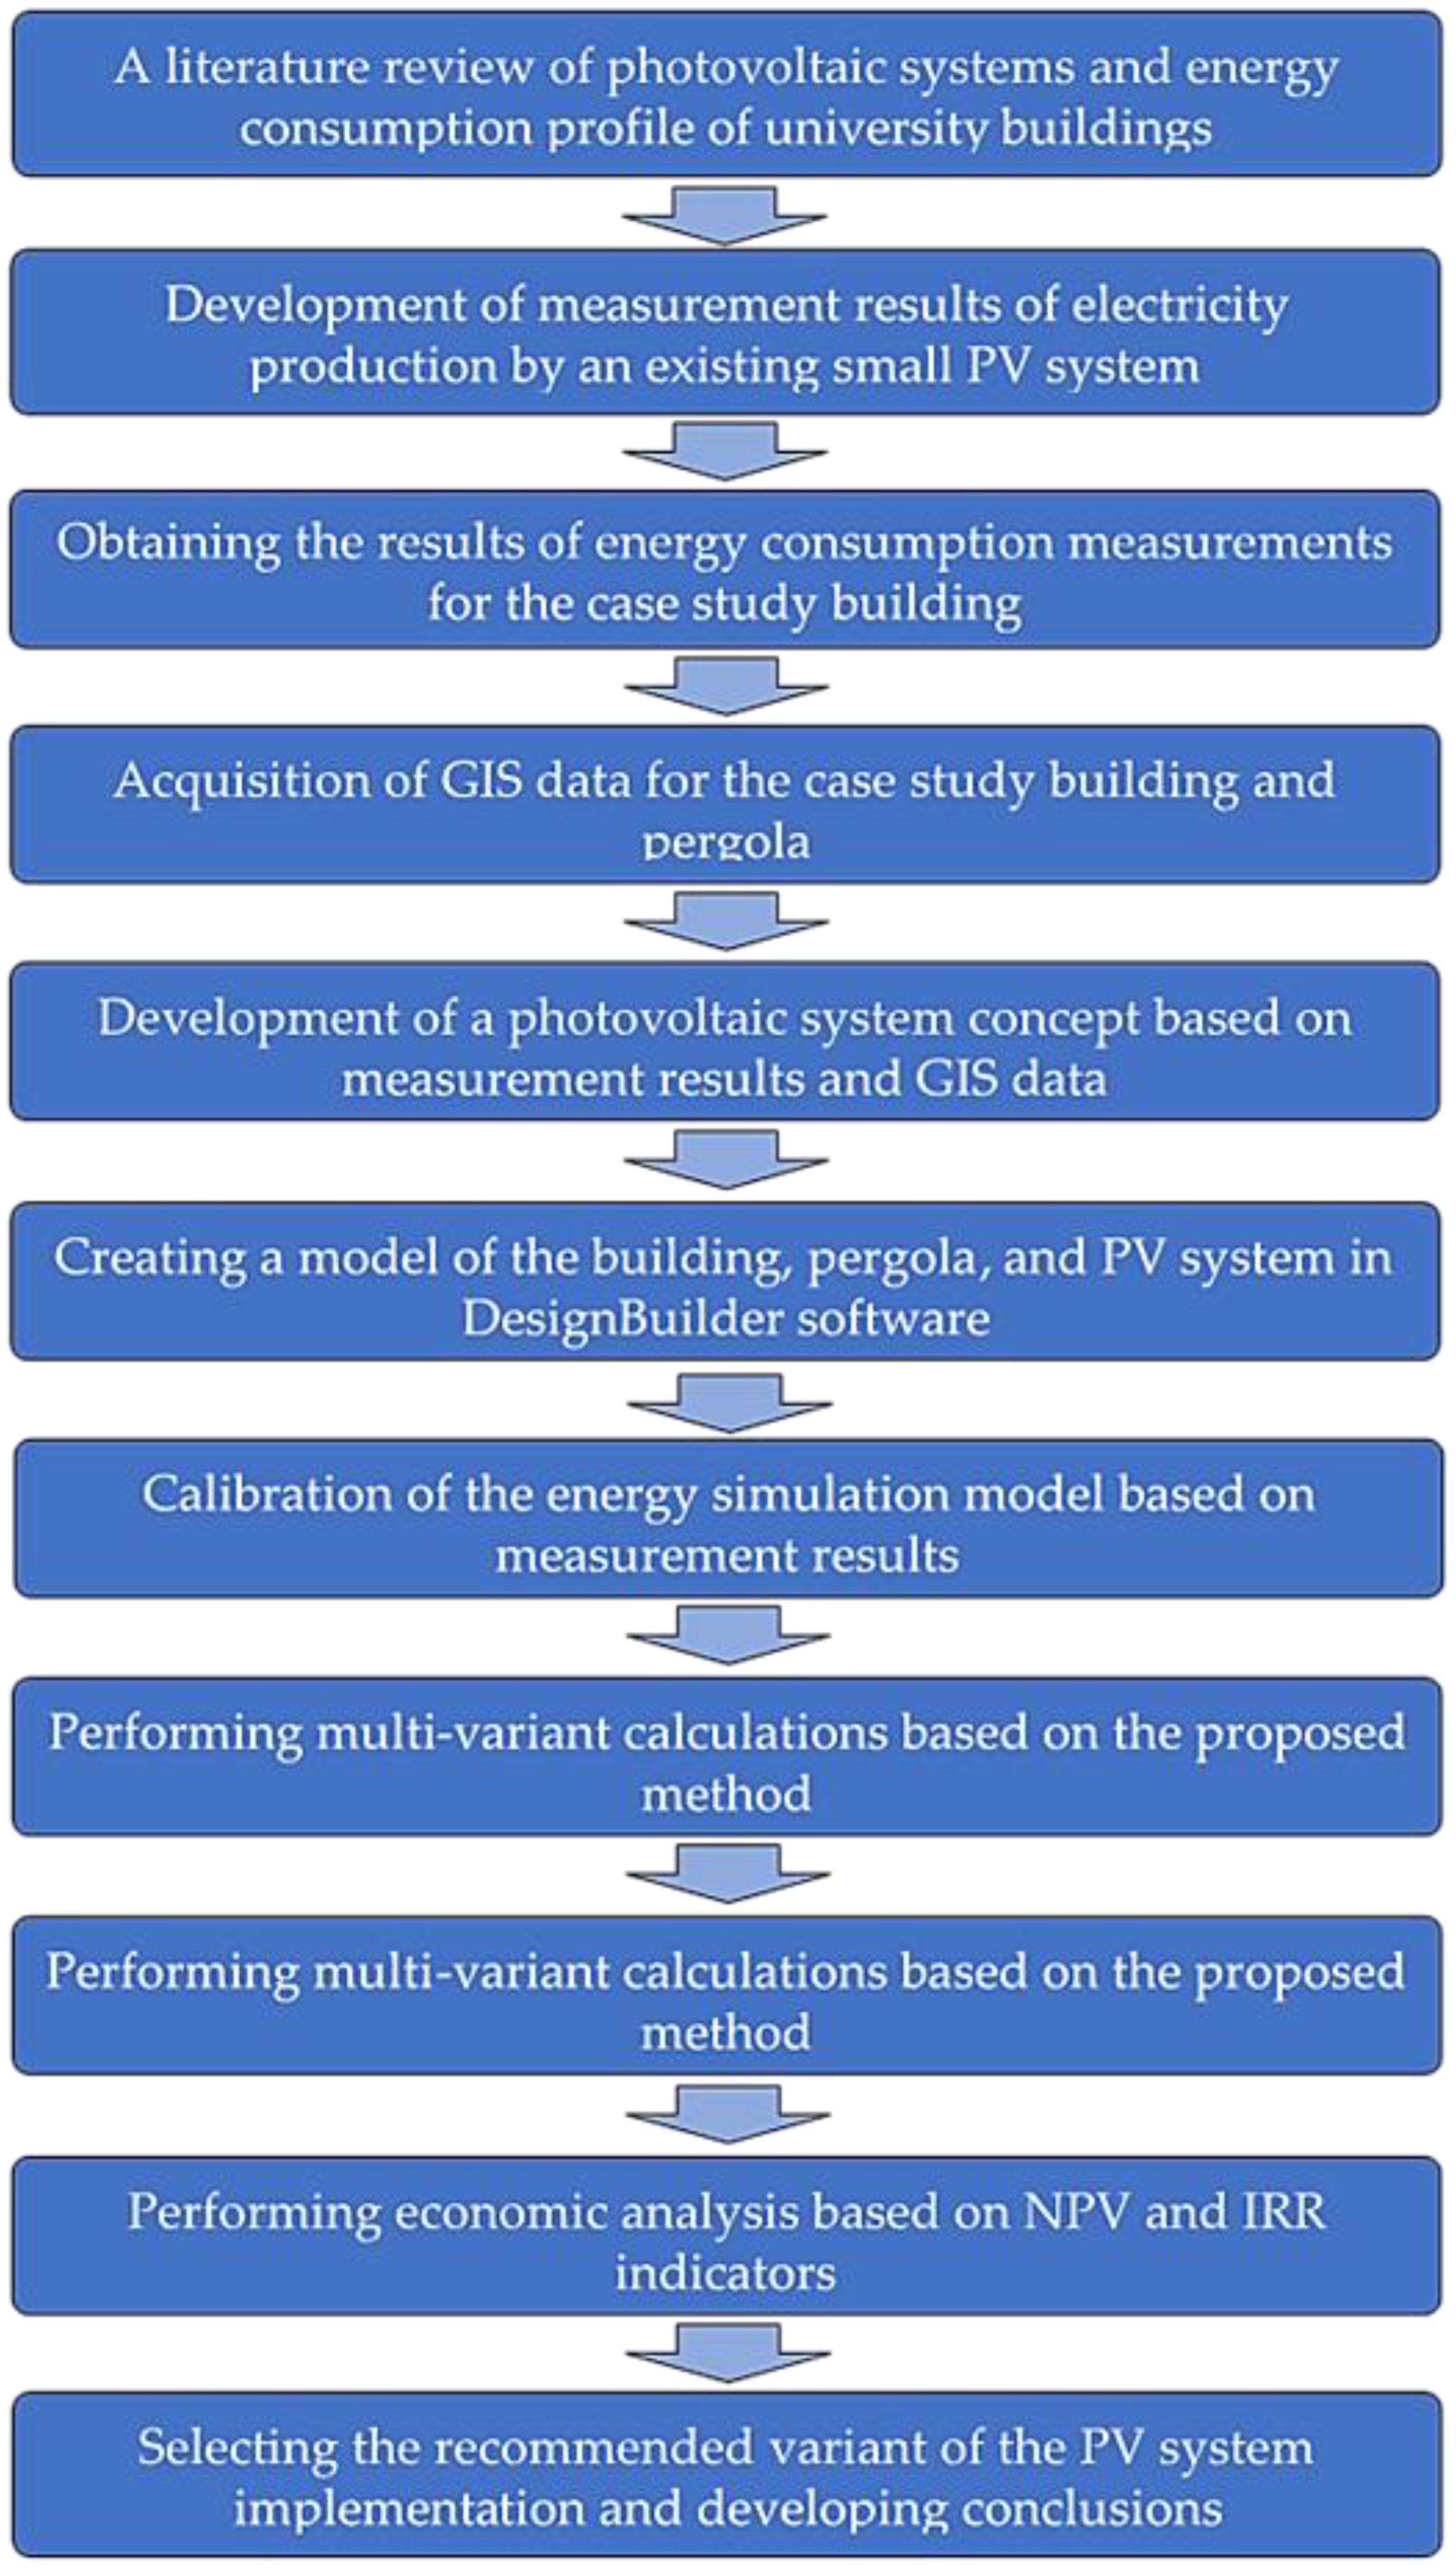
3. Hybrid Method for Estimating PV System Performance
- I.
- In the first stage, the efficiency of PV modules should be calculated using dedicated energy simulation software. We do not model the entire PV system, but only perform calculations at selected and characteristic zones/places of the installation. The result of simulation calculations is the relationship between the amount of energy produced and the location of the panel or group of panels.
- II.
- Then, using the regression method, we develop a polynomial equation (preferably of the third degree) that analytically describes the calculation results (Equation (1)).where a, b, c, d—polynomial coefficients; x—distance [m].
- III.
- In the third and final step of this method, we calculate the amount of energy produced by the entire PV system. One way to obtain the final result could be to integrate the polynomial equation over the region under consideration.
4. Results and Discussion
4.1. Measurement Results of the Energy Output of the Existing PV System
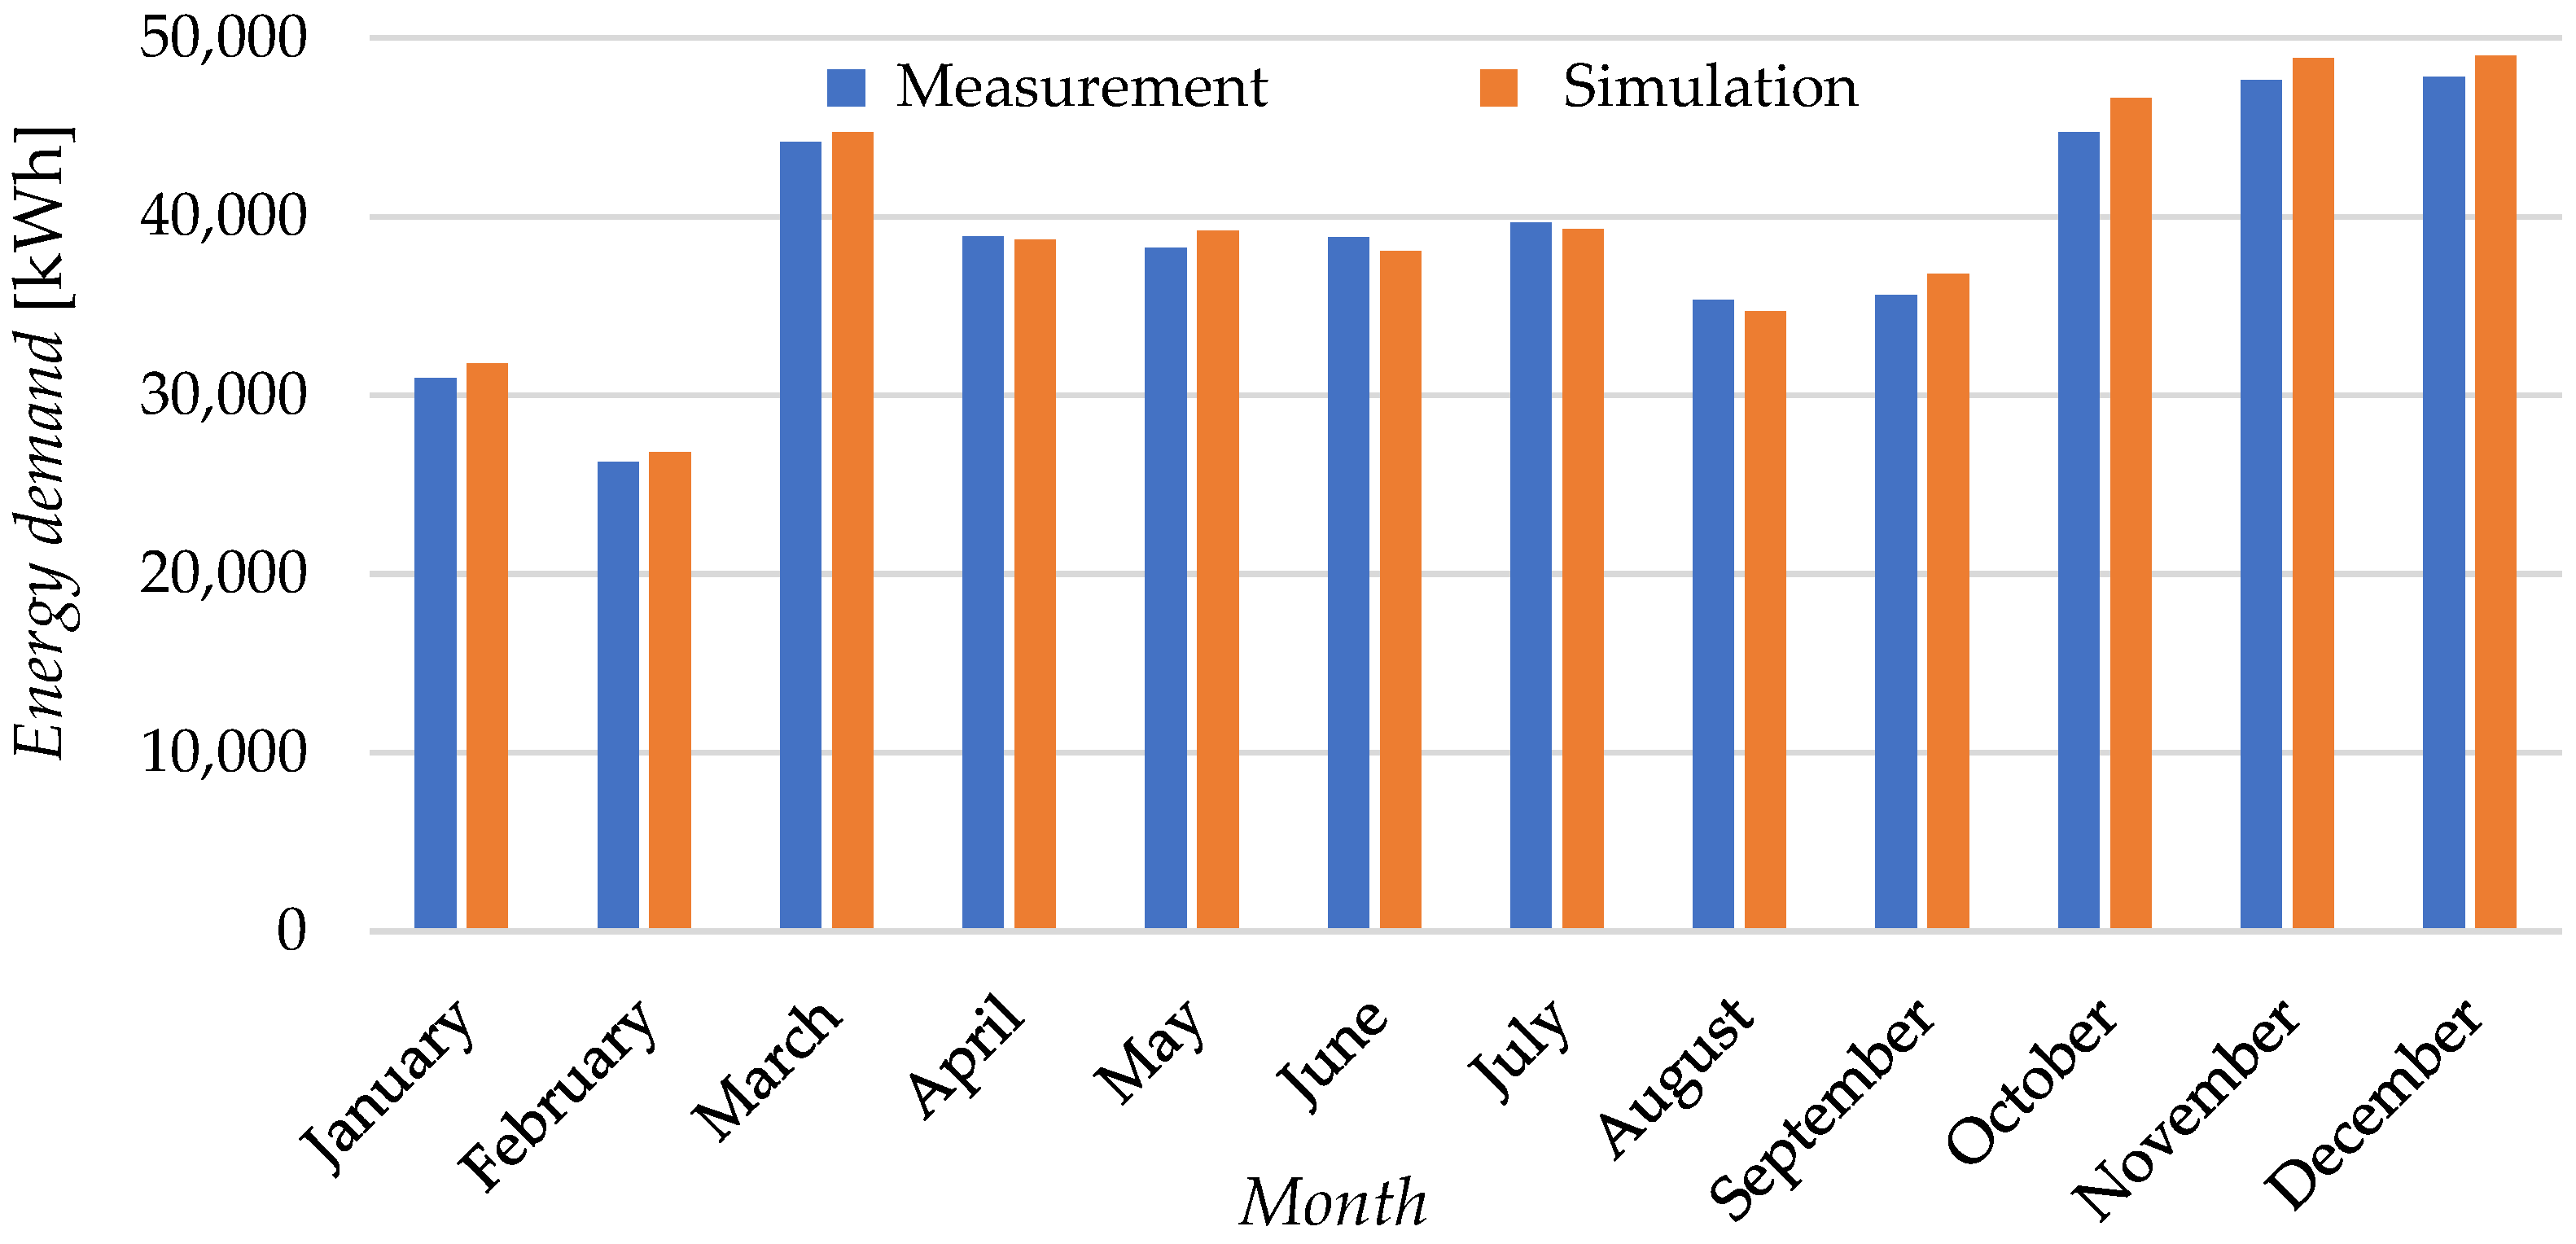
4.2. Determination of Energy Demand
4.3. Assessment of Solar Radiation Energy Potential
4.4. Identification of Suitable Locations for PV System Installation
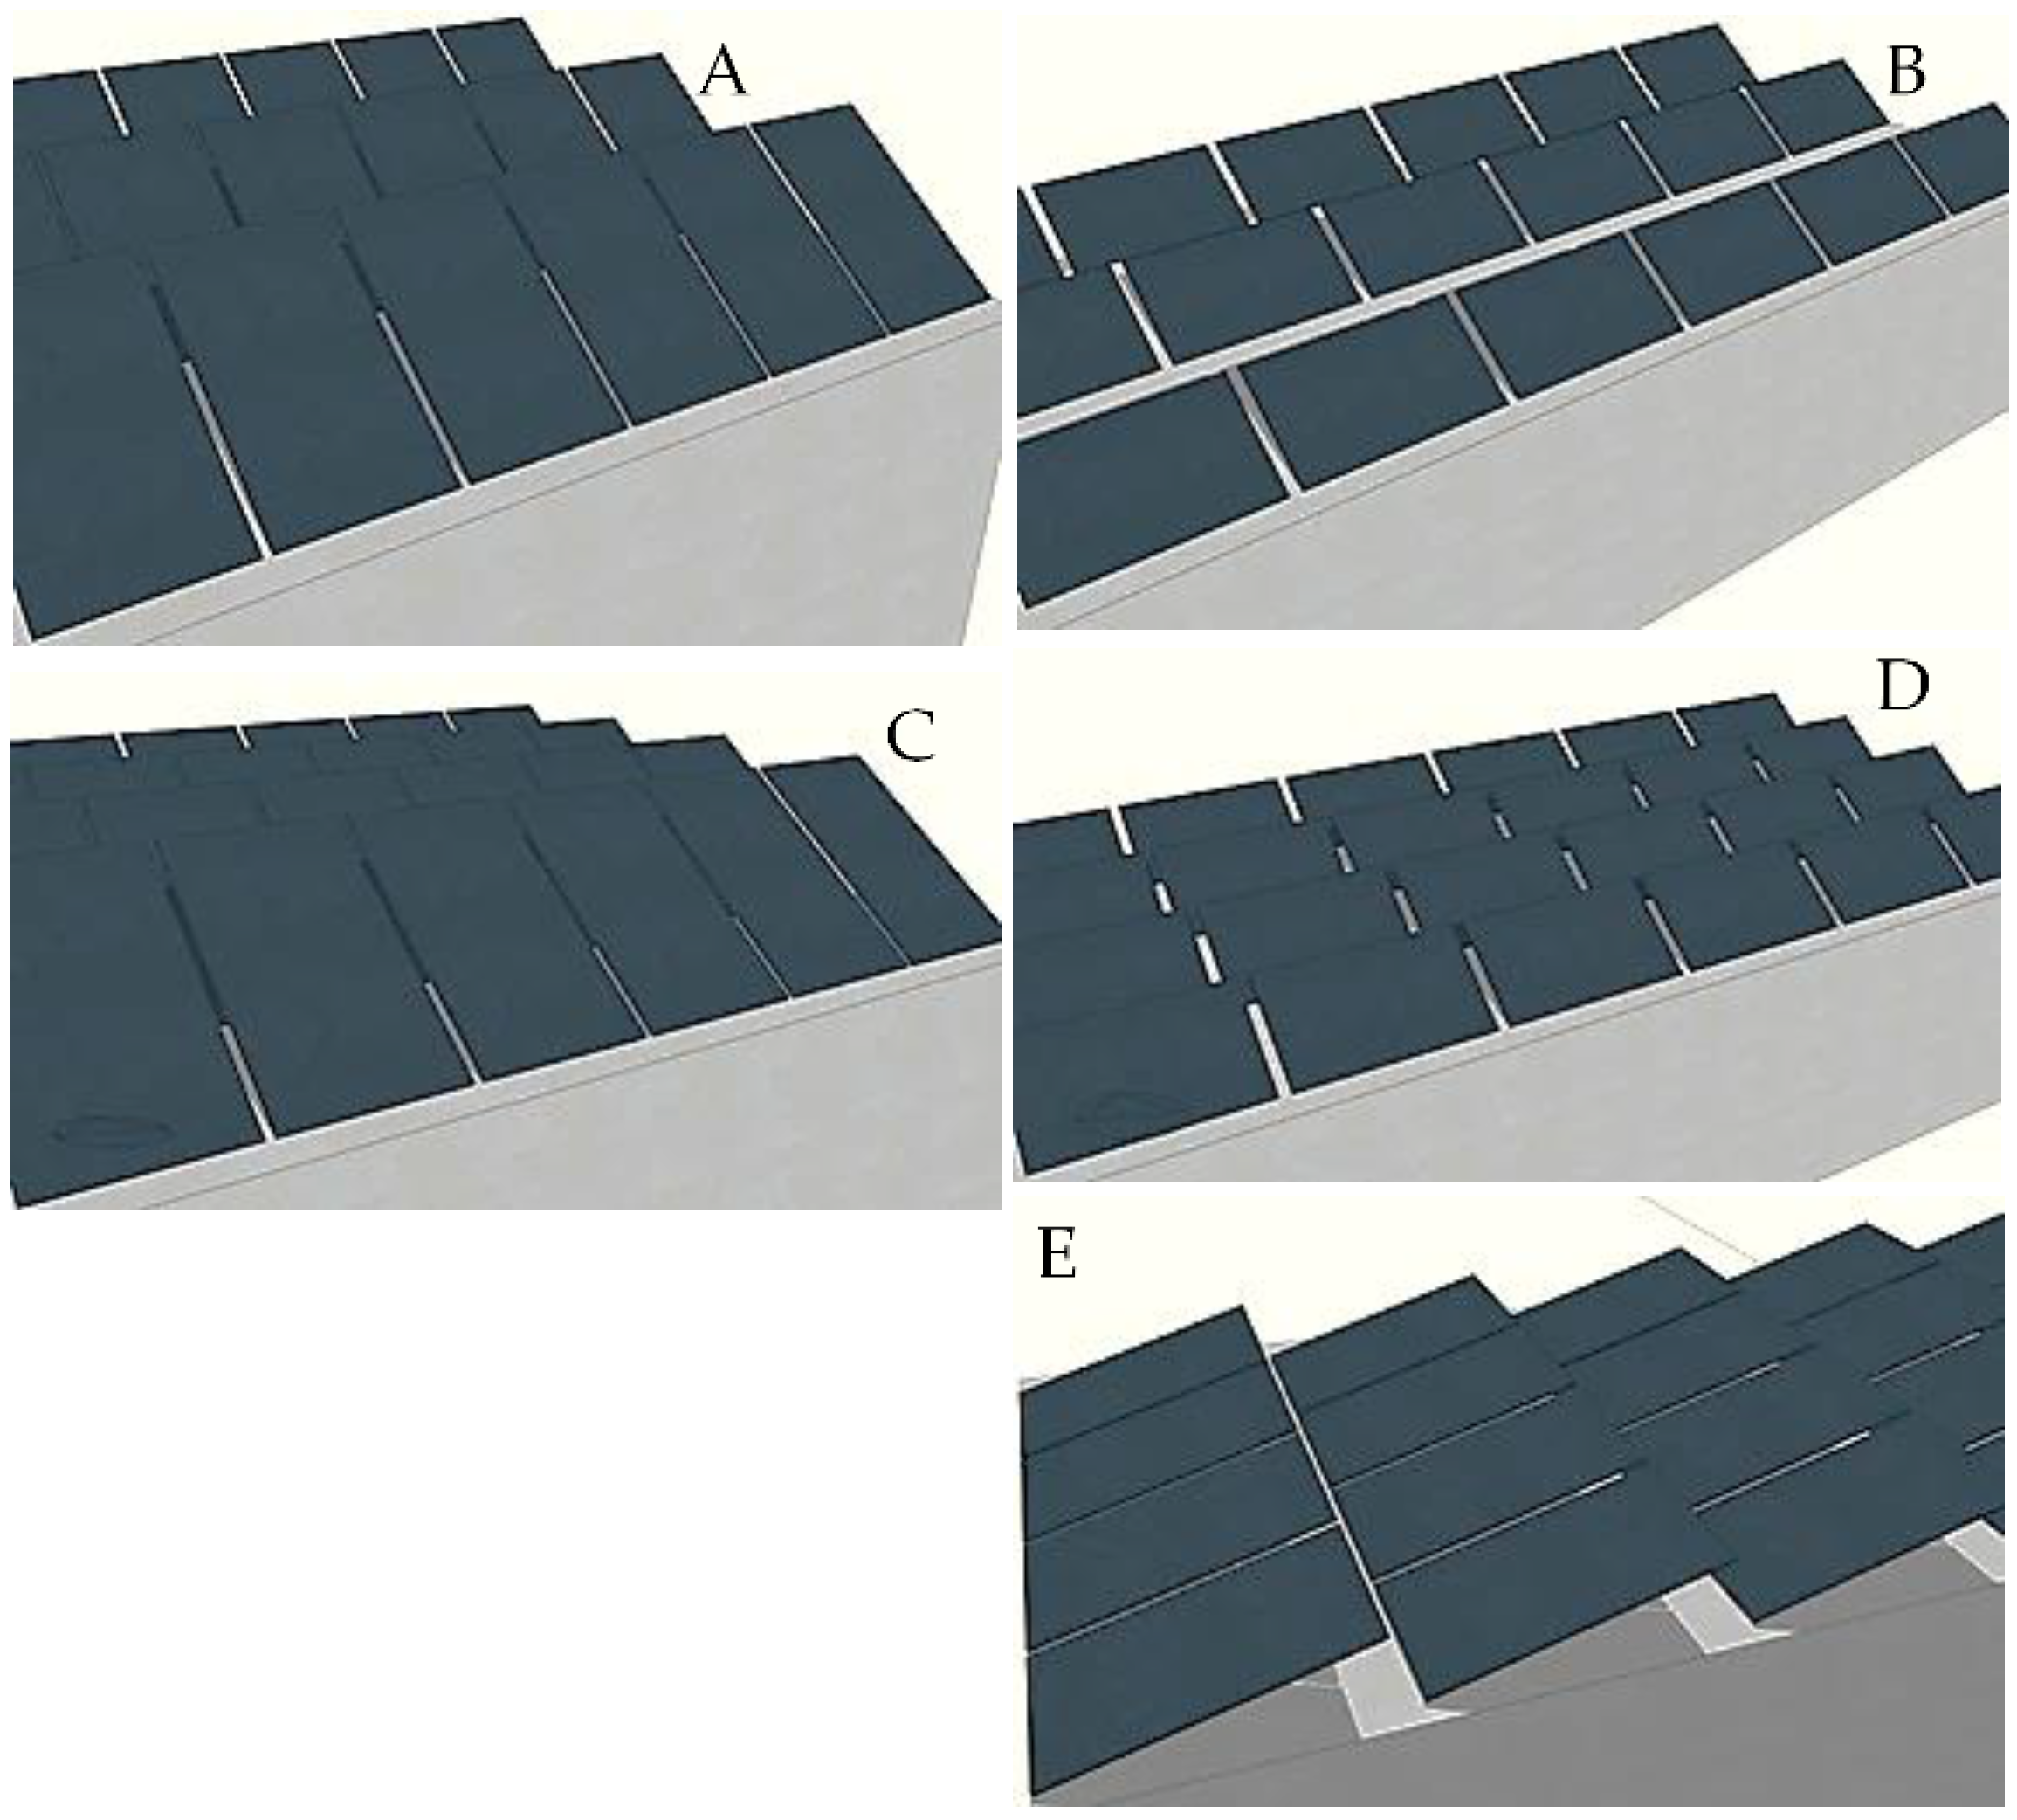
4.5. A PV System Arrangement
- Variant 3_SV—three rows of panels along the pergola, vertical position, azimuth 19°, (Figure 9A).
- Variant 3_SH—three rows of panels along the pergola, horizontal position, azimuth 19° (Figure 9B).
- Variant 4_SV—four rows of panels along the pergola, vertical position, azimuth 19°, (Figure 9C).
- Variant 4_SH—four rows of panels along the pergola, horizontal position, azimuth 19° (Figure 9D).
- Variant 4_E—panels along the pergola, azimuth 109° (Figure 9E).
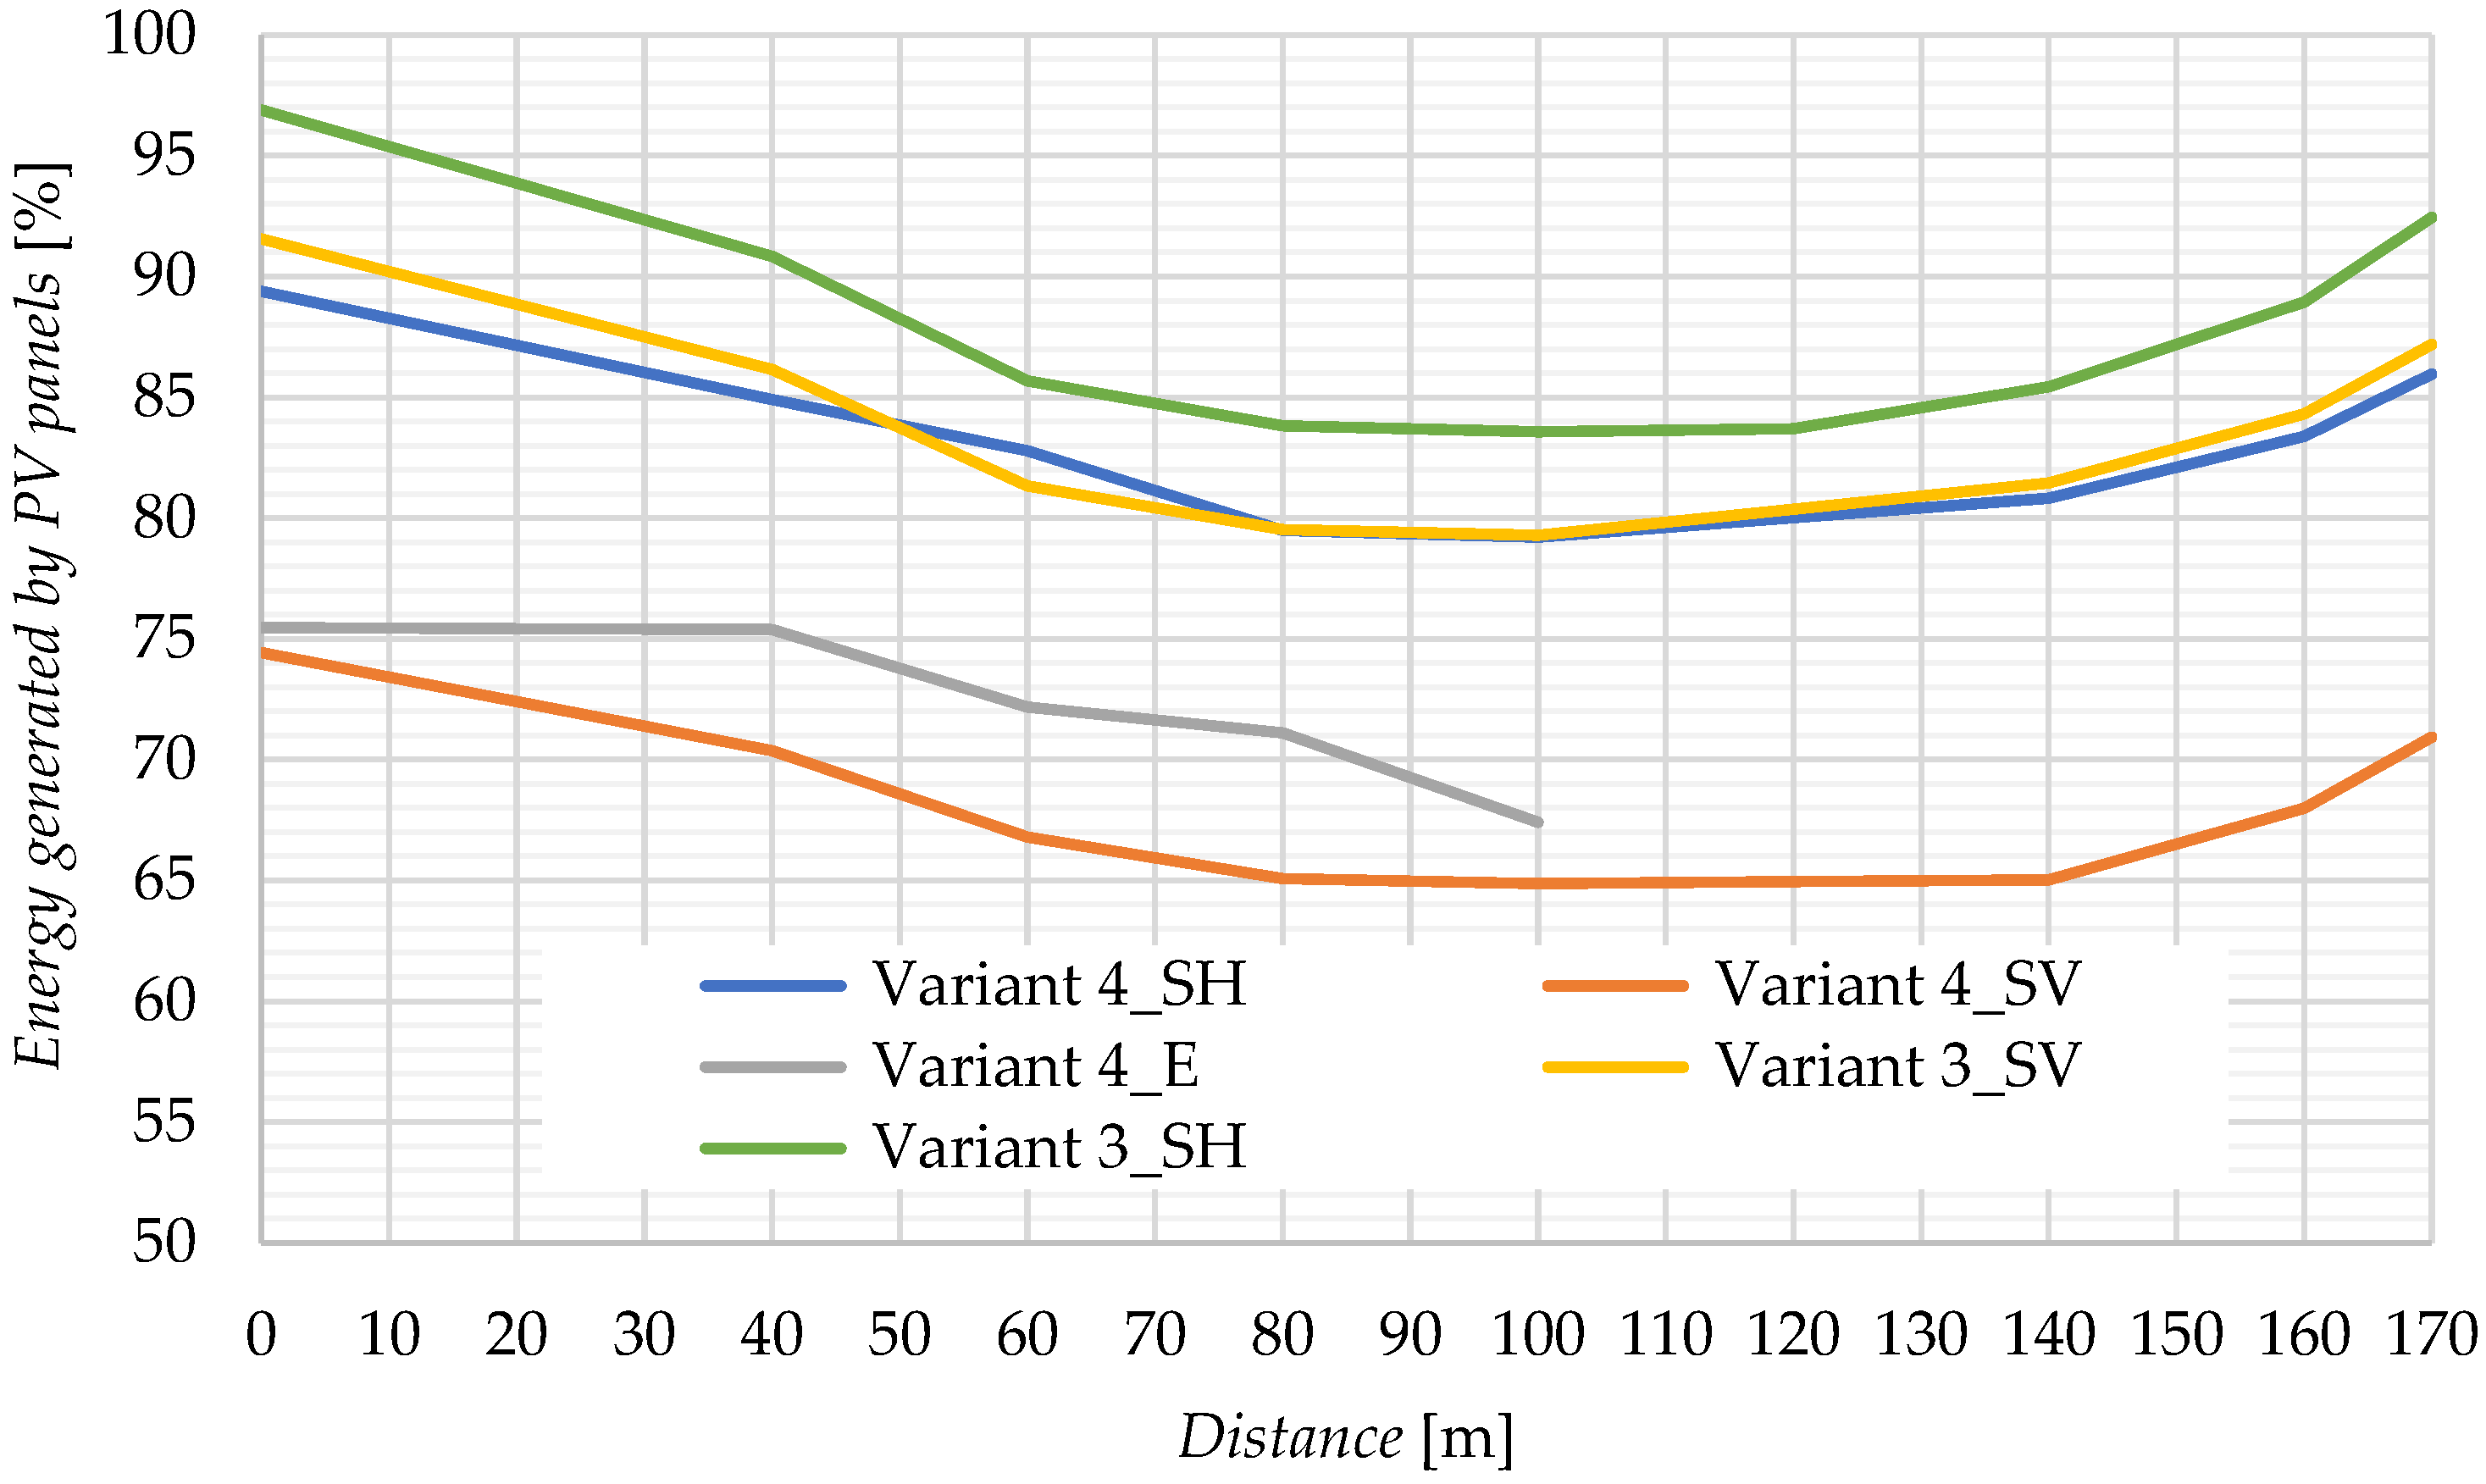
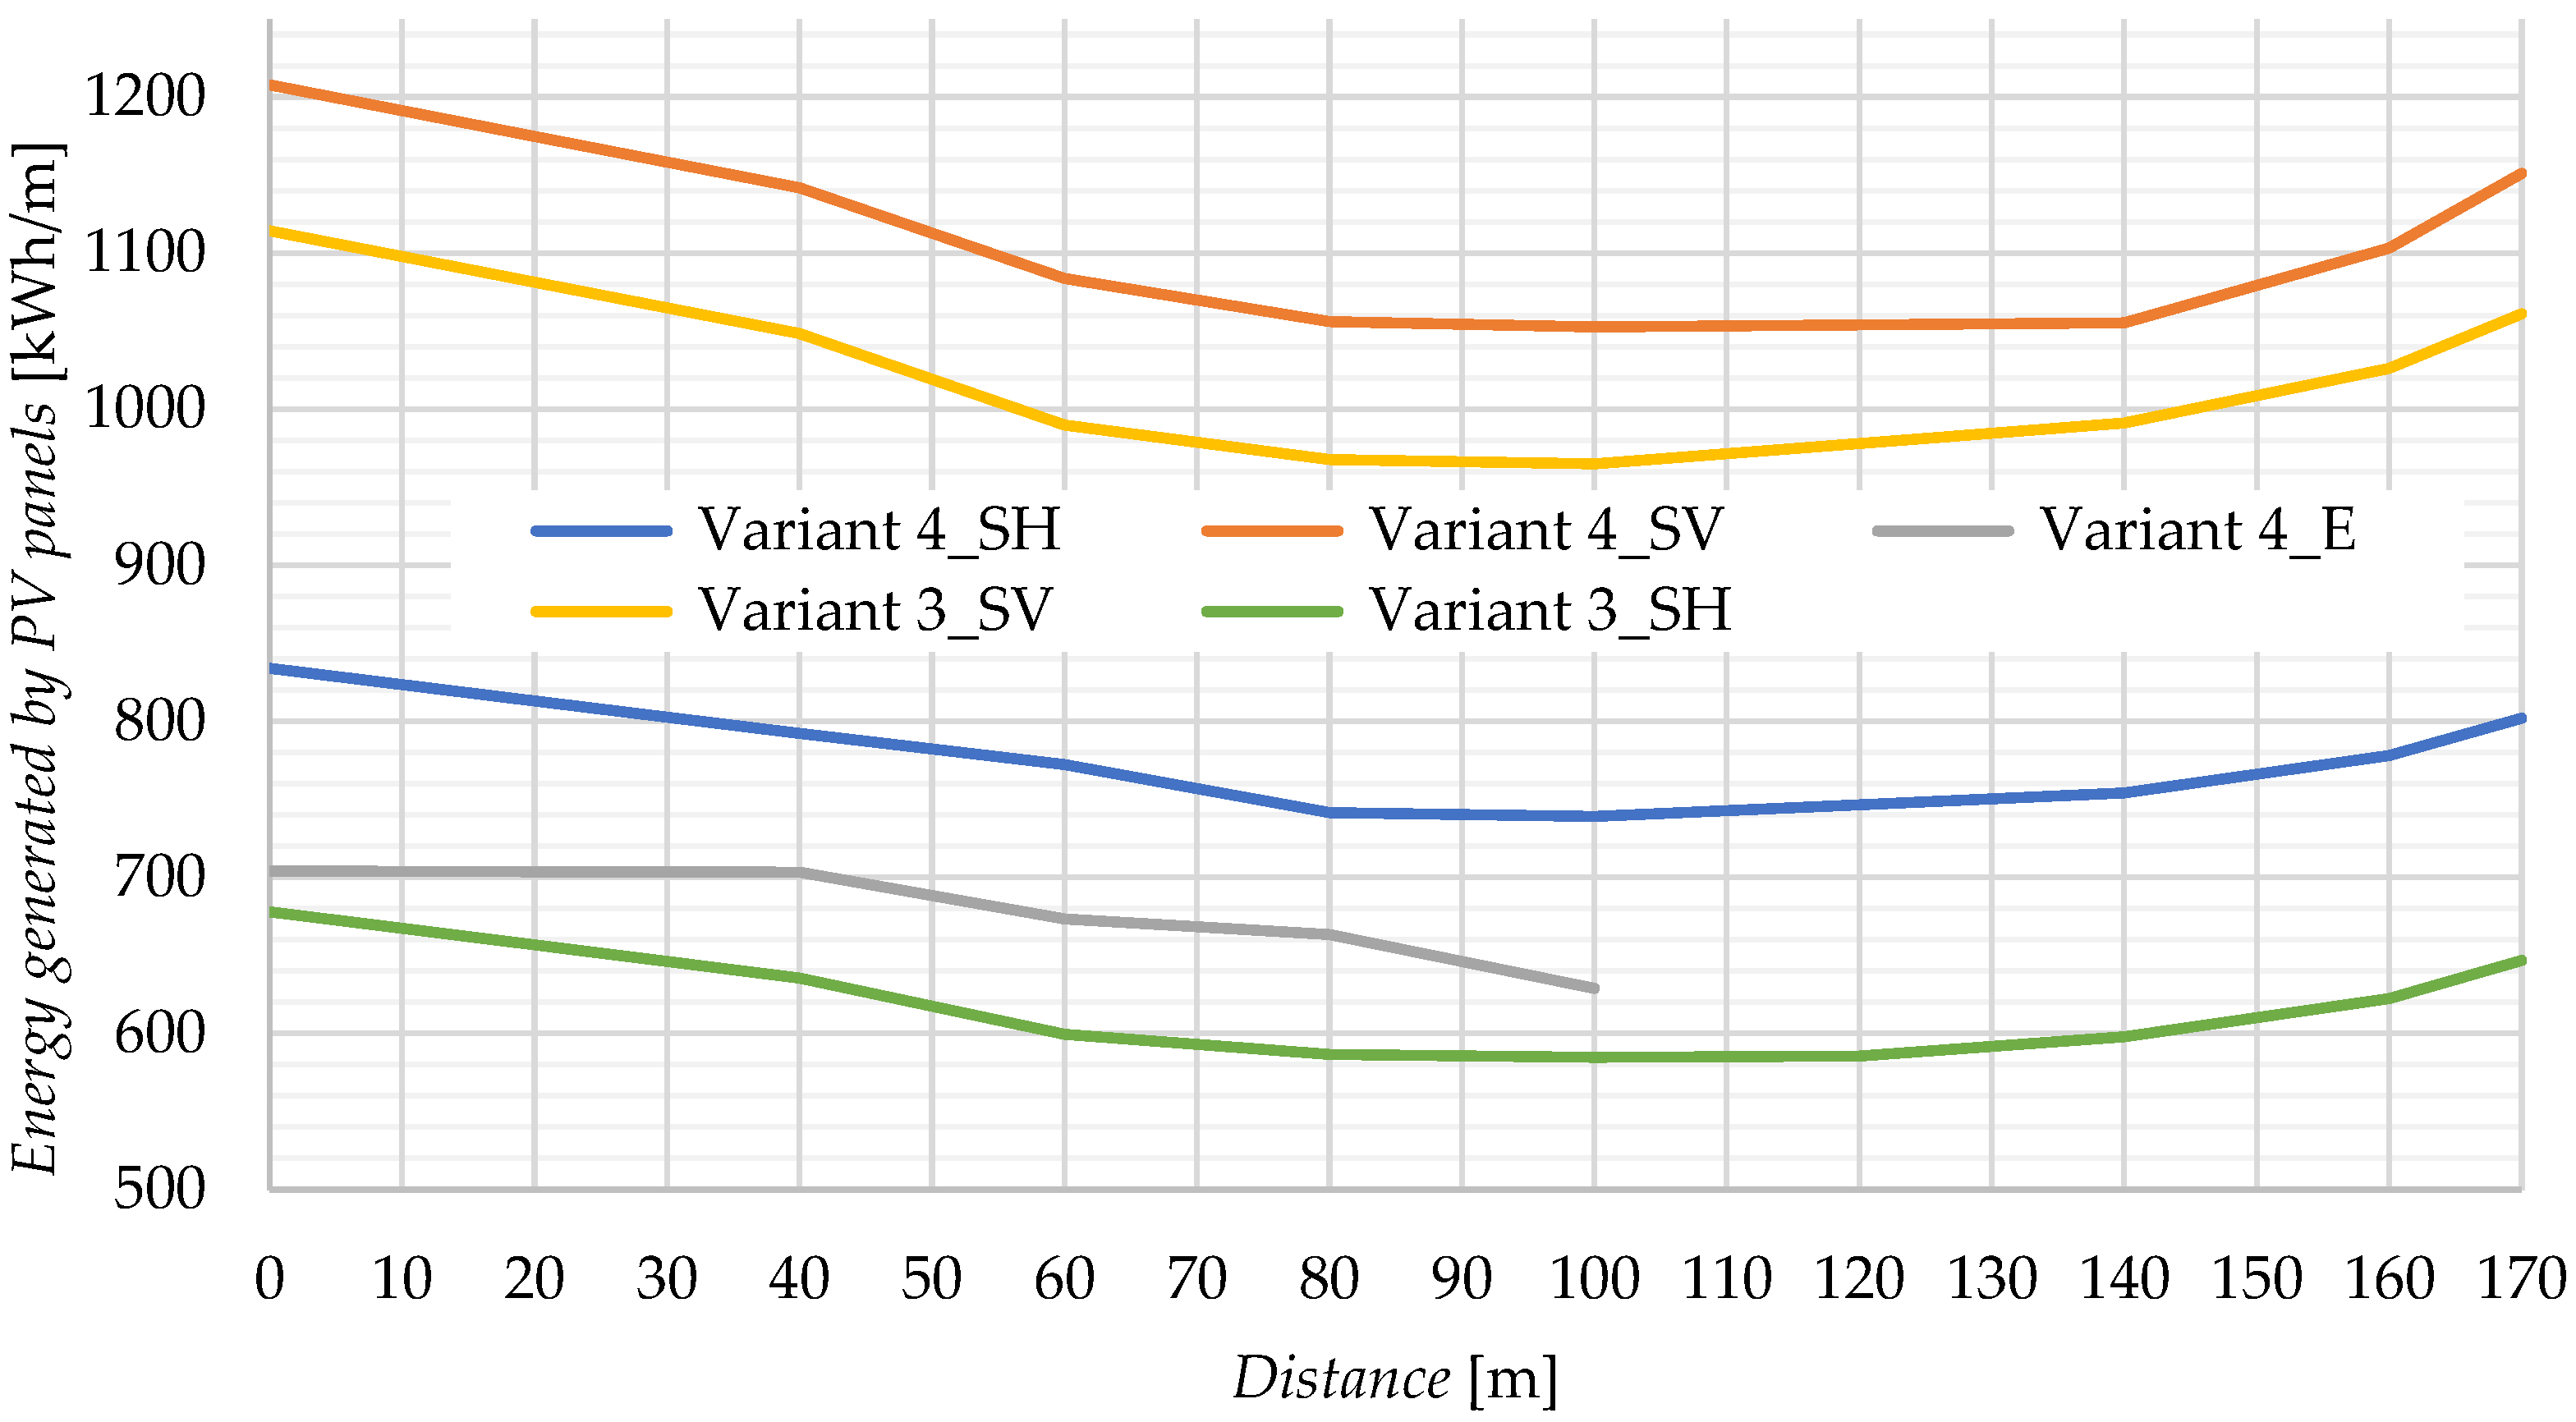
4.6. Assessment of Energy Efficiency of Individual Arrangement Variants
4.7. Economic Analysis of the Studied Cases
5. Summary and Conclusions
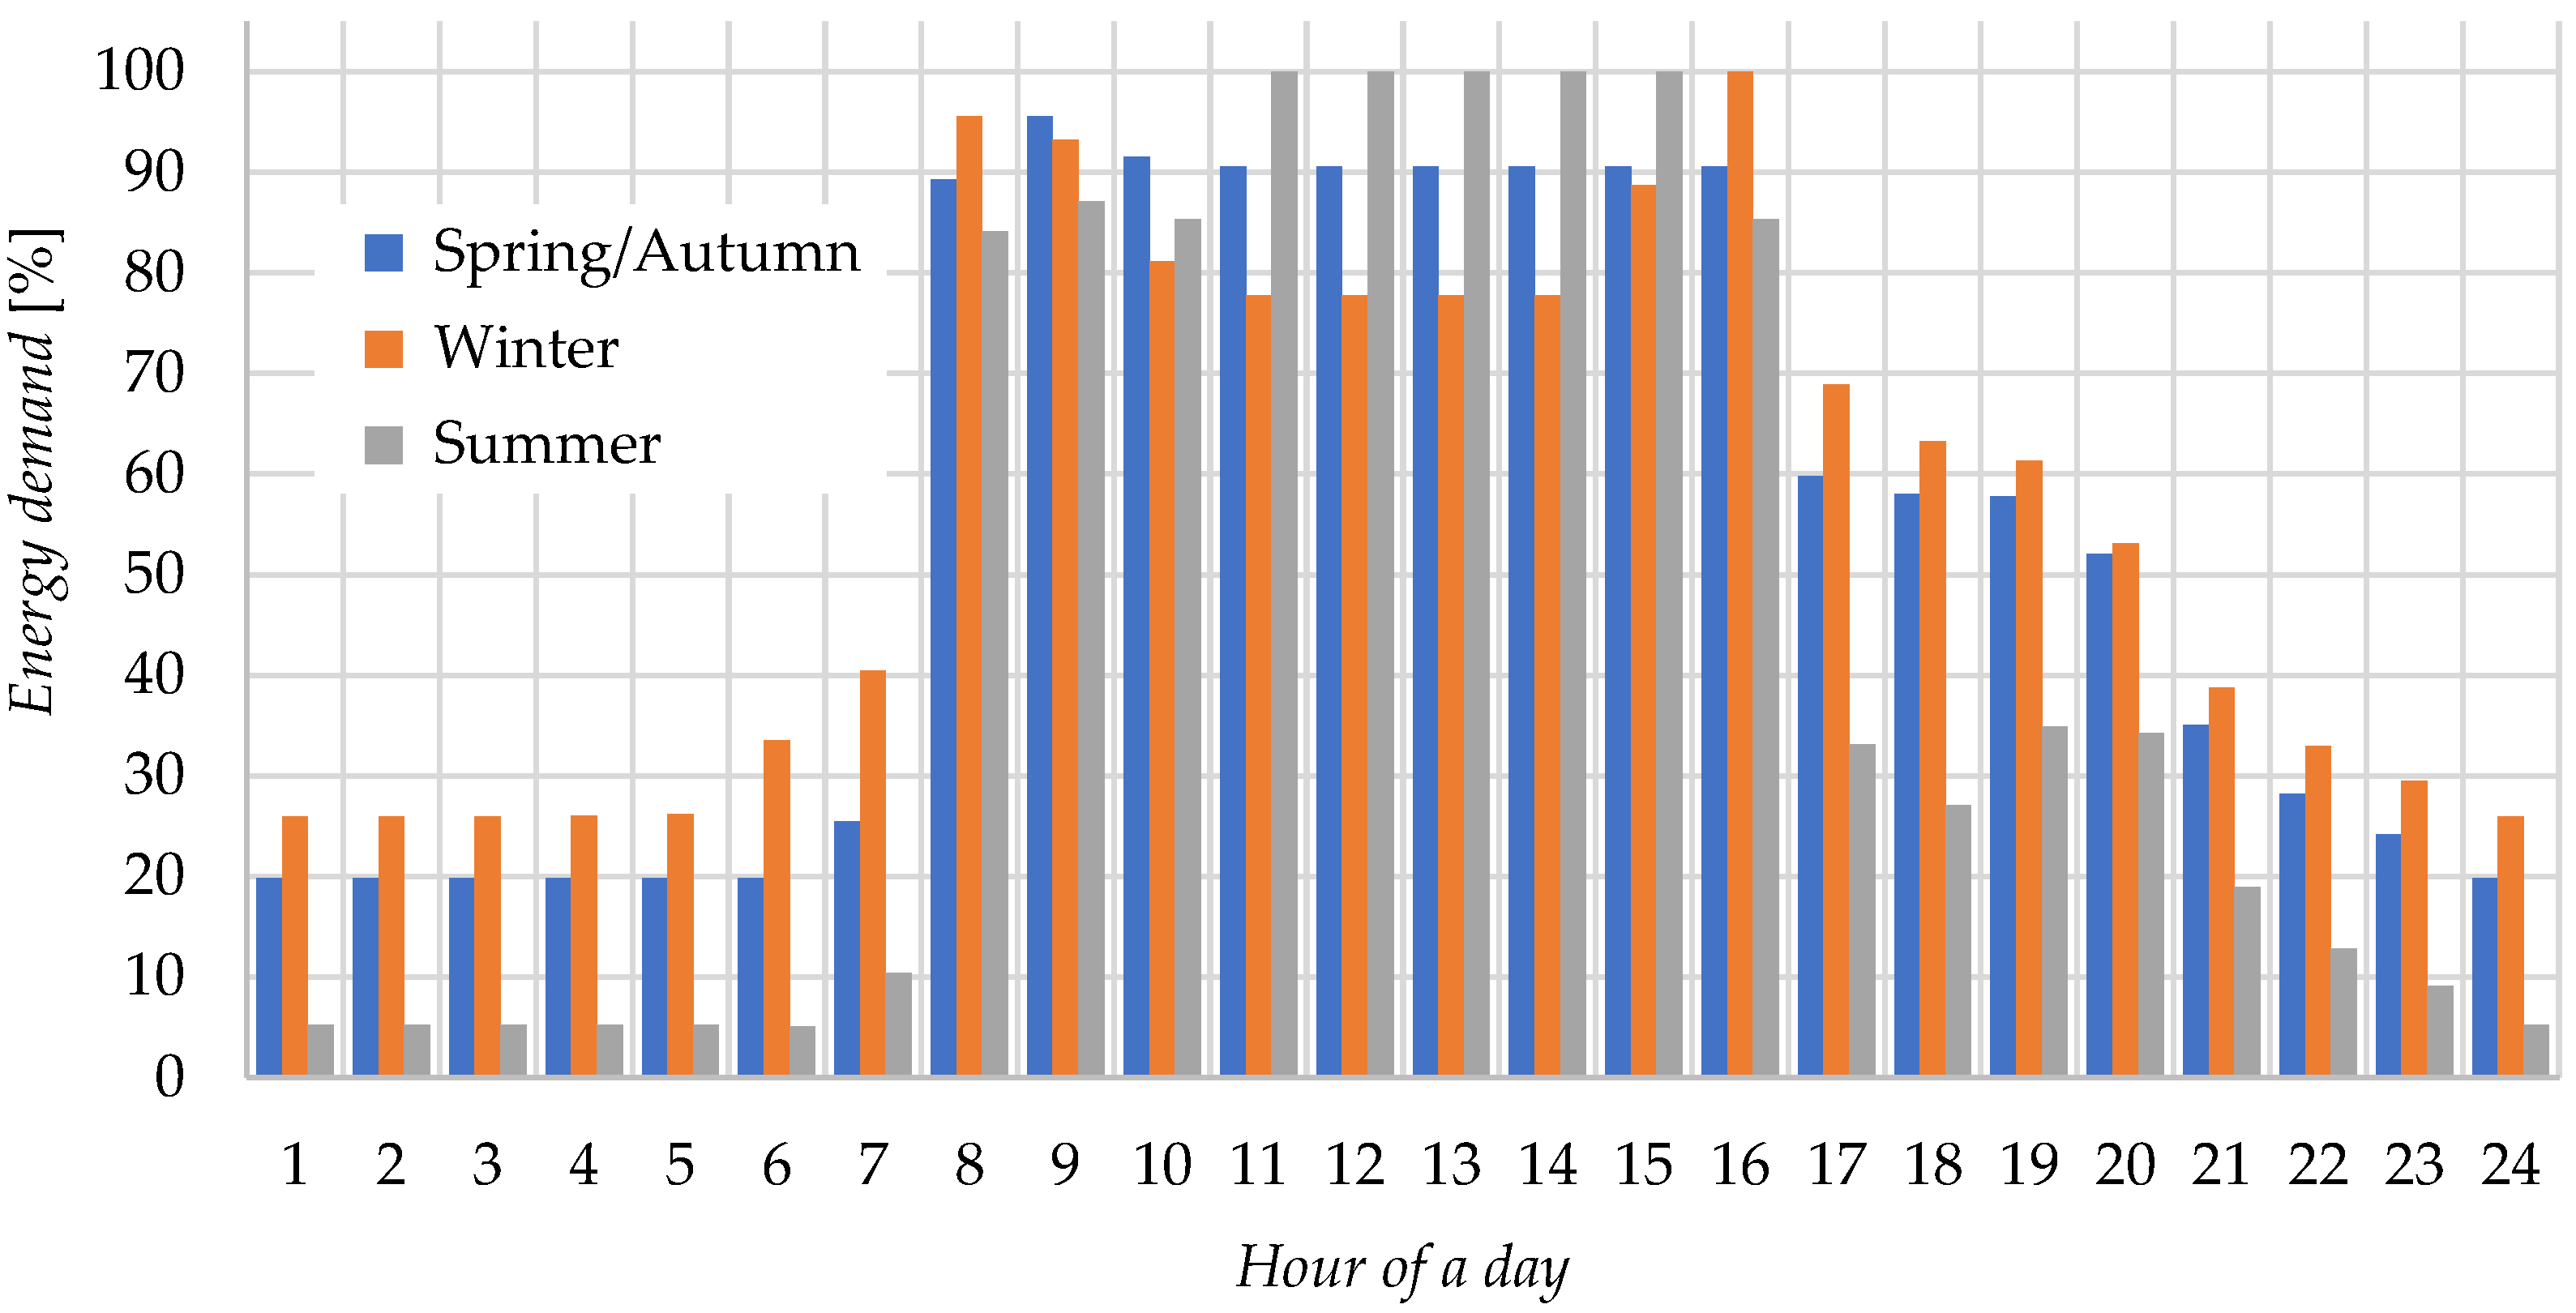
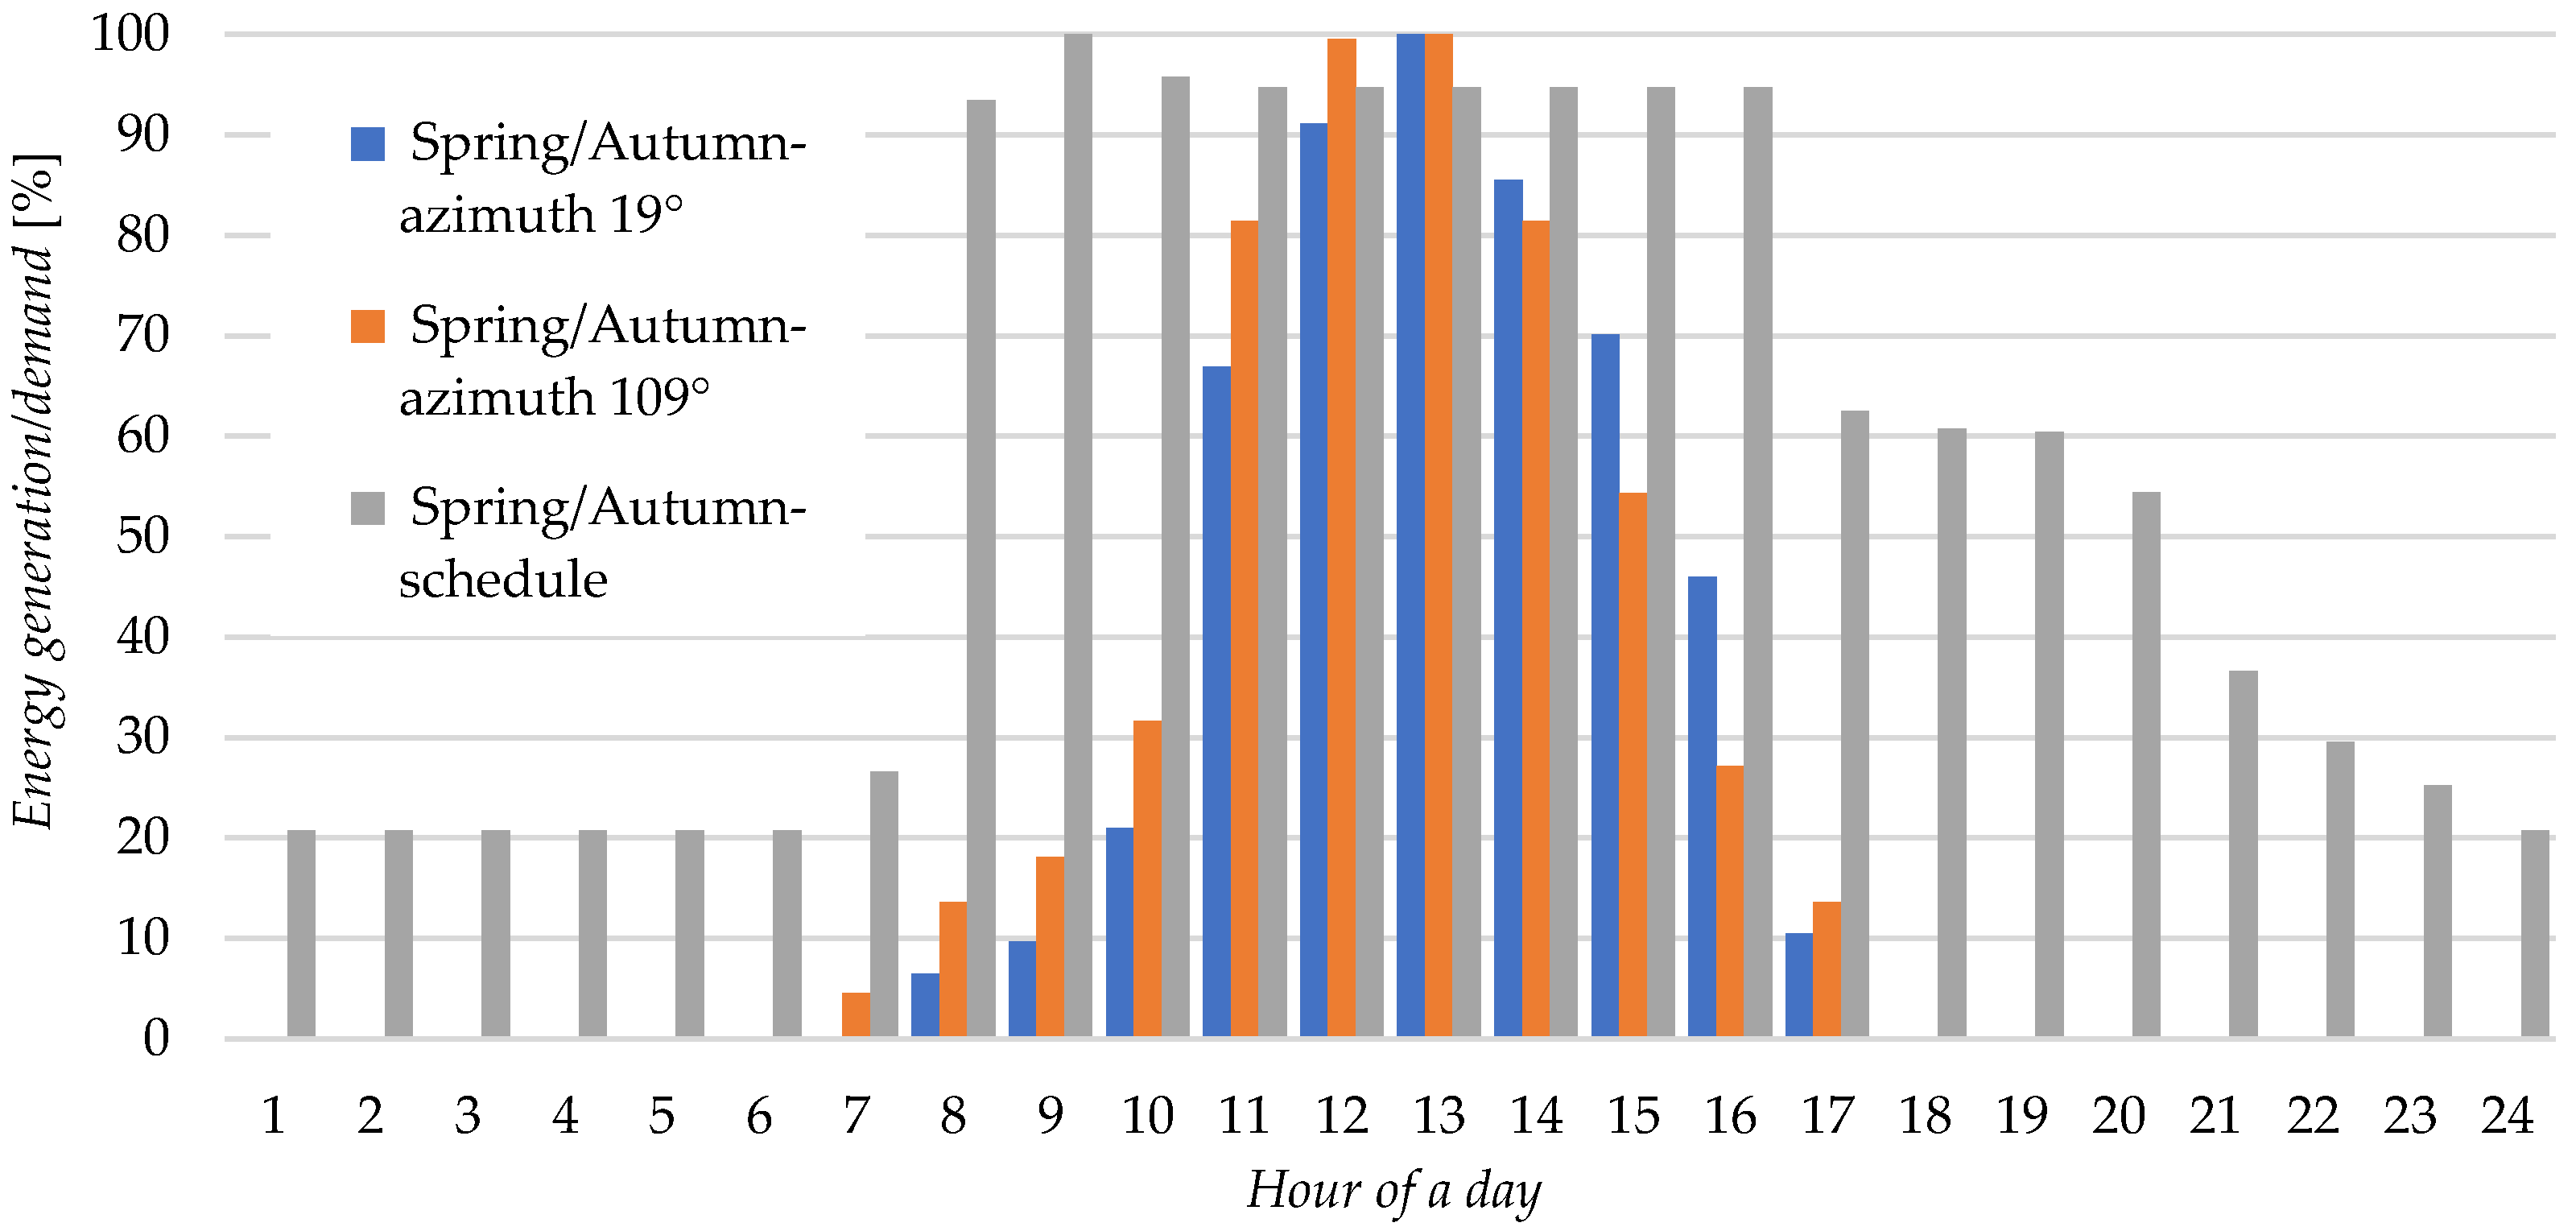
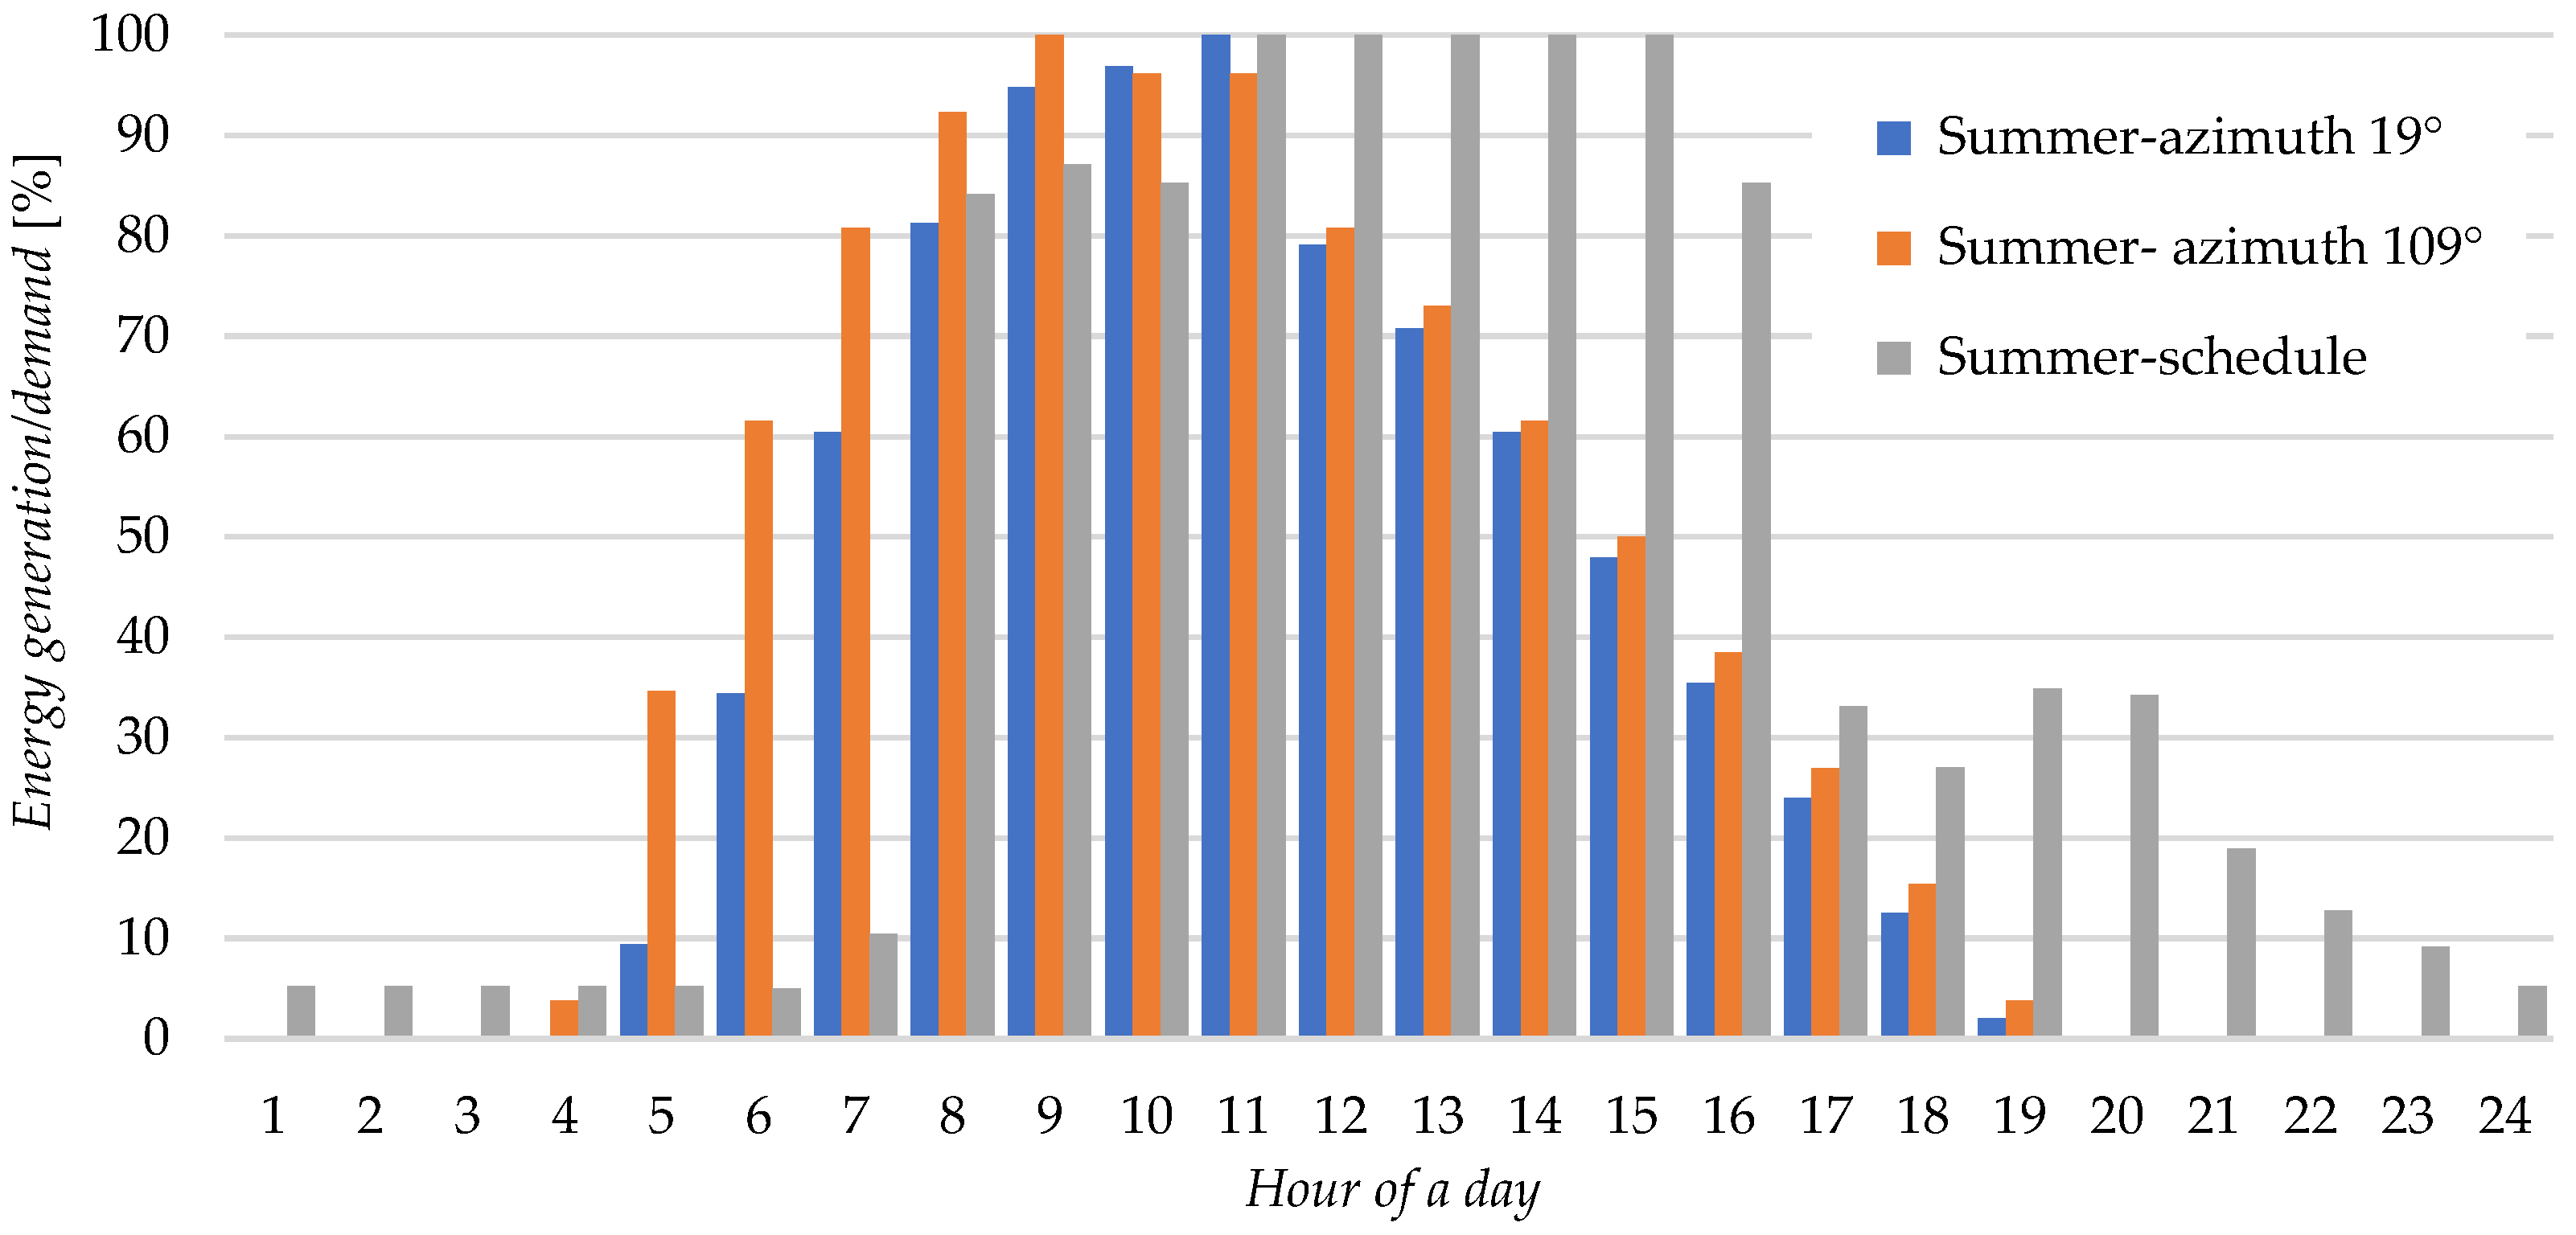
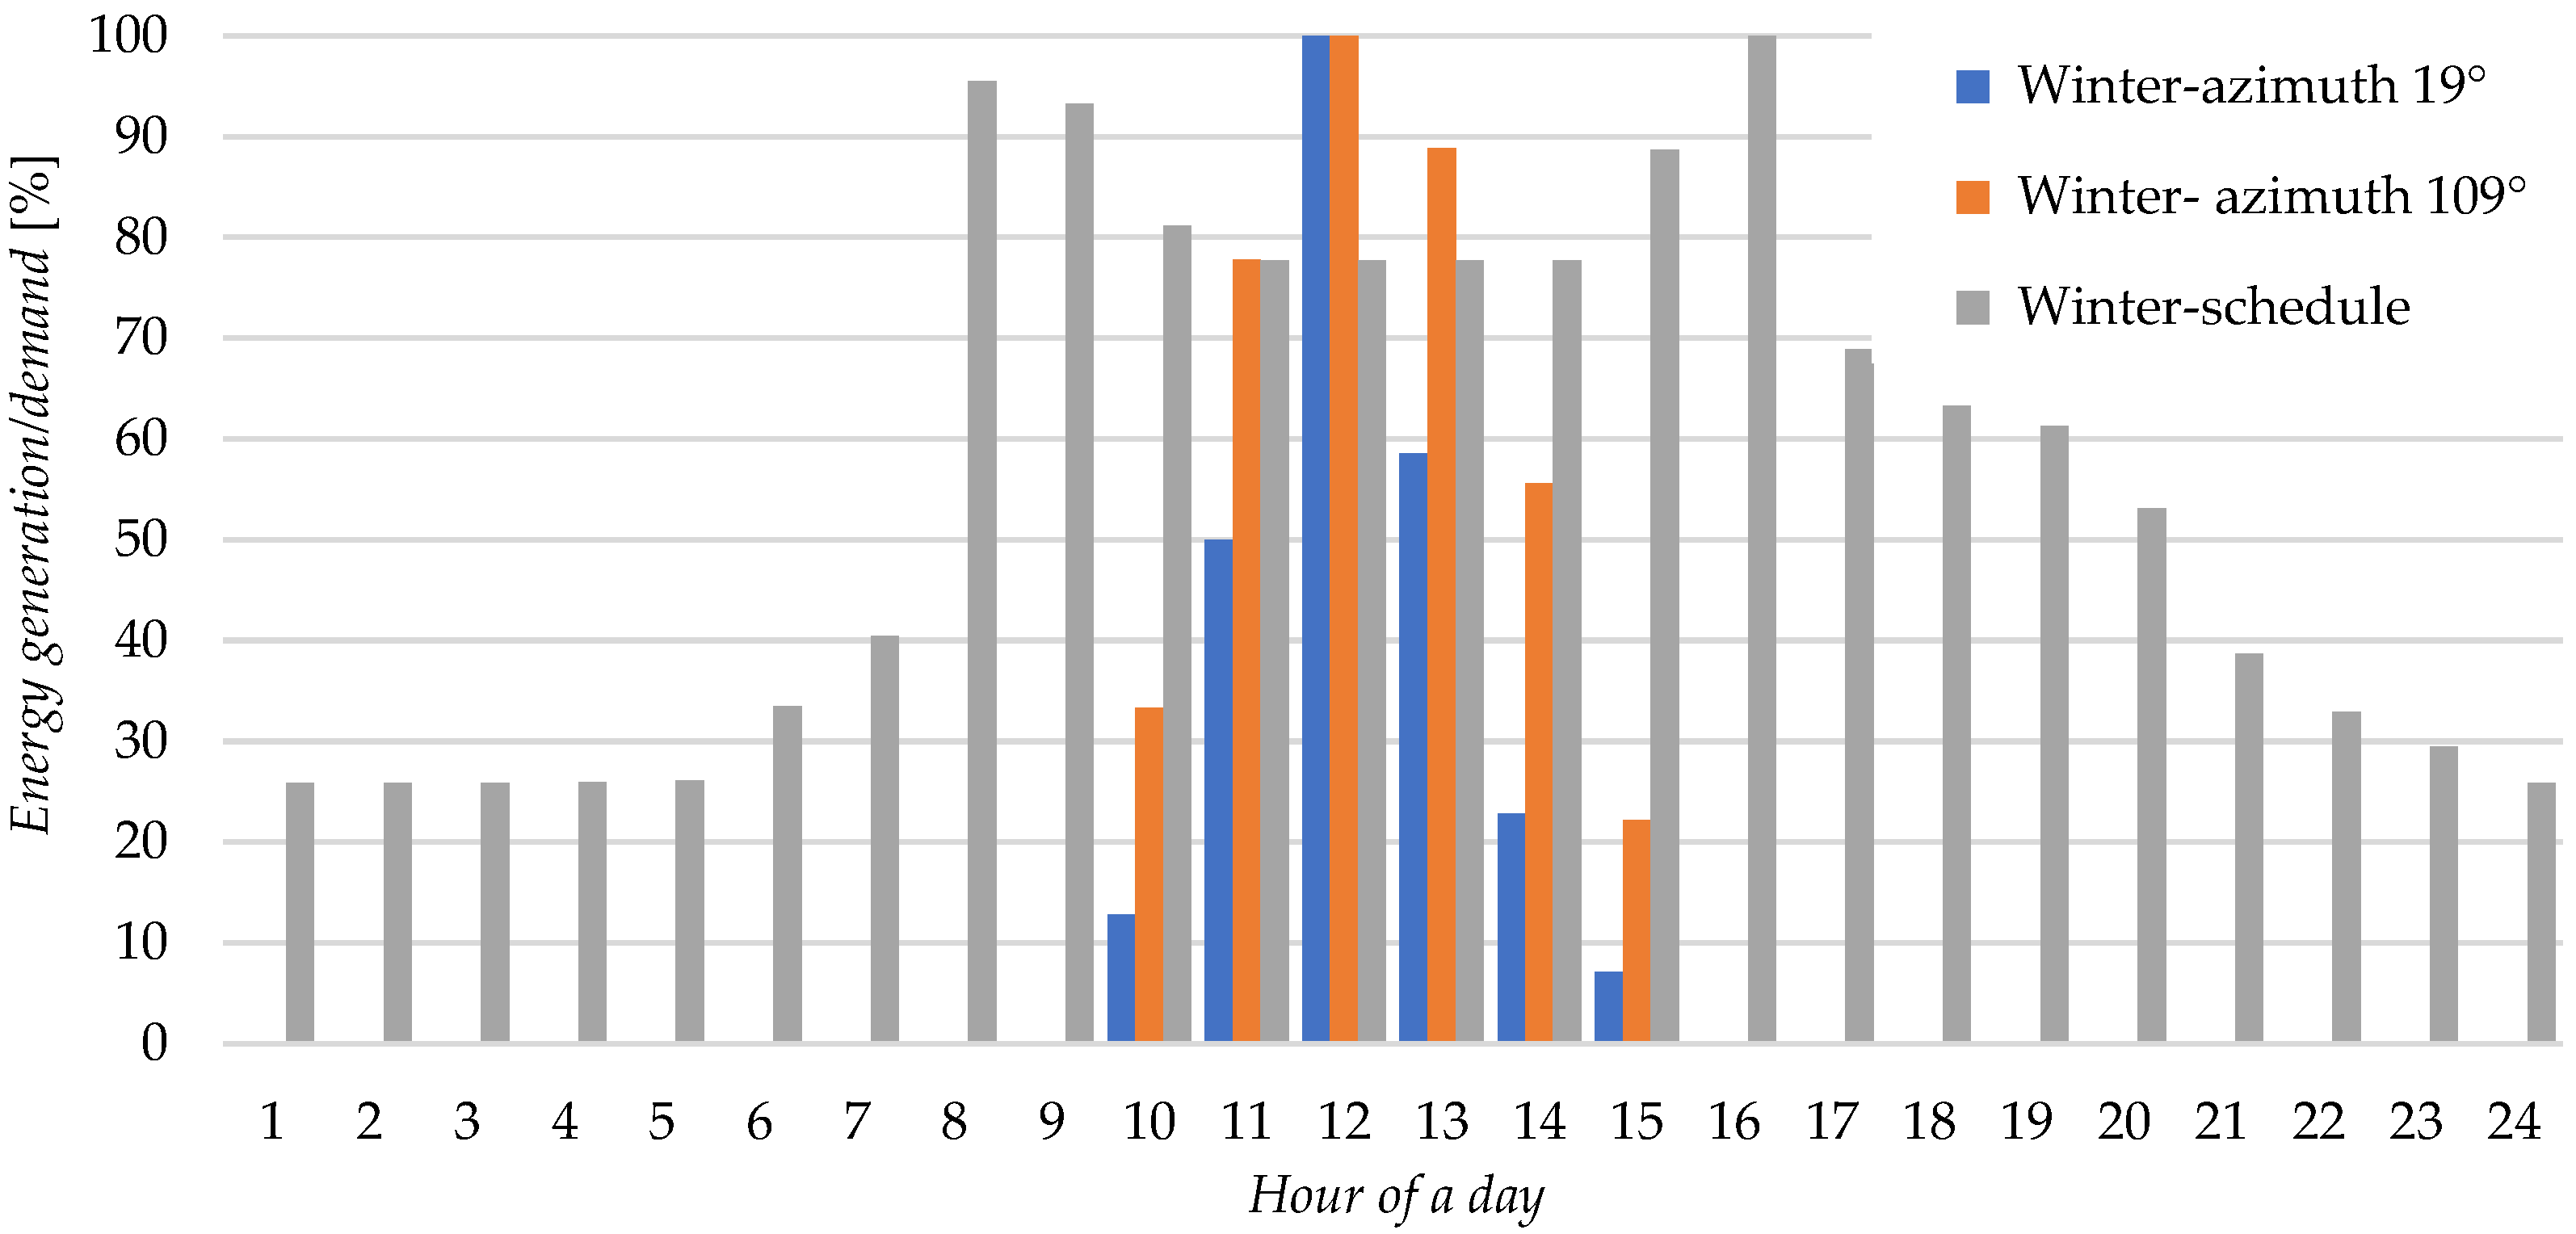
- In this article, we proposed, as a novelty item, a profile of hourly energy consumption for a typical university building in Poland, linking teaching, research, and administrative functions for students (Figure 10, Figure 11 and Figure 12). Such seasonal schedules can be implemented to create activity schedules for building models in an energy simulation software.
- Ten years of measurements of meteorological parameters on the BUT campus allowed to determination of the average value of solar radiation falling on a flat surface of 1078 kWh/m2. It turned out that the same parameter for a typical meteorological year used for energy simulations was only 2% higher. Thanks to this, it can be expected that the results obtained from numerical modelling will be close to the values obtained in real operating conditions.
- This paper introduces a novel, hybrid approach for determining the amount of energy produced from the conversion of solar radiation into heat or electricity. It utilises energy simulation techniques to estimate energy output at specific, representative locations within the system. Subsequently, a regression method is employed, preferably using third-degree polynomials, to establish the relationship between the amount of electricity or heat generated and the position of the solar collector or set of collectors. The final step involves integrating these polynomial functions using Equations (6) and (7). The required value is then derived from the relationship given in Equation (8). This approach is especially advantageous when modelling large systems, as it requires modelling only a part of the solar conversion system.
- In order to determine the optimal configuration of photovoltaic panels, the authors used the method described above and a typical economic analysis. The PV panels that are arranged in three rows in a vertical orientation and tilted at an angle of 37° proved to be the recommended setup for the selected company installing this system. The power plant in this configuration consists of 438 modules with a total peak power of 210 kWp and can produce 166,392 kWh of energy. The NPV and IRR of this investment after 30 years of operation will be 679,506 EUR and over 38%, respectively. This proves the potentially high profitability of this project. The energy demand coverage in this variant is approximately 36%. Energy consumption profiles are similar to its production, so the PV system can operate in off-grid mode without the need for batteries. The initial cost of the selected investment is relatively low and amounts to 447 EUR/kWp.
Author Contributions
Funding
Data Availability Statement
Conflicts of Interest
Abbreviations
| BIM | Building Information Modelling |
| BMS | Building Management Systems |
| BUT | Bialystok University of Technology |
| FCEES | Faculty of Civil Engineering and Environmental Sciences |
| IRR | internal rate of return |
| MV | medium voltage |
| NPV | net present value |
| PV | photovoltaic |
| PVGIS | photovoltaic geographical information system |
| RES | renewable energy sources |
| TMY | typical meteorological year |
References
- Al-Saegh, S.; Kourgiozou, V.; Korolija, I.; Tang, R.; Tahmasebi, F.; Mumovic, D. Investigating building stock energy and occupancy modelling approaches for district-level heating and cooling energy demands estimation in a university campus. Energy Build. 2025, 329, 115269. [Google Scholar] [CrossRef]
- Guan, J.; Nord, N.; Chen, S. Energy planning of university campus building complex: Energy usage and coincidental analysis of individual buildings with a case study. Energy Build. 2016, 124, 99–111. [Google Scholar] [CrossRef]
- Tsantili, A.; Koronaki, I.; Polydoros, V. Maximizing Energy Performance of University Campus Buildings through BIM Software and Multicriteria Optimization Methods. Energies 2023, 16, 2291. [Google Scholar] [CrossRef]
- Poczekajło, P.; Suszyński, P.; Antosz, A. Verification and optimization of electrical energy consumption in university buildings. Int. J. Electron. Telecommun. 2025, 71, 519–526. [Google Scholar] [CrossRef]
- Muñoz-Rodríguez, F.J.; Gómez, P.; Fernández-Carrasco, J.I.; Tina, G.M.; Jiménez-Castillo, G. A new approach to analyse from monitored data the performance, matching capability and grid usage of large Rooftop Photovoltaic systems. Case of study: Photovoltaic system of 1.05 MW installed at the campus of University of Jaén. Renew. Energy 2025, 239, 121947. [Google Scholar] [CrossRef]
- Franco, A.; Crisostomi, E.; Leccese, F.; Mugnani, A.; Suin, S. Energy Savings in University Buildings: The Potential Role of Smart Monitoring and IoT Technologies. Sustainability 2025, 17, 111. [Google Scholar] [CrossRef]
- Jafarinejad, T.; Erfani, A.; Fathi, A.; Shafii, M.B. Bi-level energy-efficient occupancy profile optimization integrated with demand-driven control strategy: University building energy saving. Sustain. Cities Soc. 2019, 48, 101539. [Google Scholar] [CrossRef]
- Chihib, M.; Salmerón-Manzano, E.; Manzano-Agugliaro, F. Benchmarking Energy Use at University of Almeria (Spain). Sustainability 2020, 12, 1336. [Google Scholar] [CrossRef]
- Hasapis, D.; Savvakis, N.; Tsoutsos, T.; Kalaitzakis, K.; Psychis, S.; Nikolaidis, N.P. Design of large scale prosuming in Universities: The solar energy vision of the TUC campus. Energy Build. 2017, 141, 39–55. [Google Scholar] [CrossRef]
- Furukakoi, M.; Nakadomari, A.; Uehara, A.; Krishnan, N.; Hemeida, A.M.; Senjyu, T. Optimization of PV and battery systems in university campuses: A combined planning and operation approach under uncertainties. Energy Build. 2025, 335, 115512. [Google Scholar] [CrossRef]
- Chedid, R.; Sawwas, A.; Fares, D. Optimal design of a university campus micro-grid operating under unreliable grid considering PV and battery storage. Energy 2020, 200, 117510. [Google Scholar] [CrossRef]
- Hurtado-P, E.; Bastida-Molina, P.; Aparisi-Cerdá, I.; Alfonso-Solar, D.; Rodríguez Fernández, A. Multicriteria solar photovoltaic potential evaluation for high educational buildings. Case study of Polytechnic University of Valencia, Spain. Renew. Energy 2024, 227, 120560. [Google Scholar] [CrossRef]
- Sim, M.; Suh, D. A heuristic solution and multi-objective optimization model for life-cycle cost analysis of solar PV/GSHP system: A case study of campus residential building in Korea. Sustain. Energy Technol. Assess. 2021, 47, 101490. [Google Scholar] [CrossRef]
- Mokhtara, C.; Negrou, B.; Settou, N.; Bouferrouk, A.; Yao, Y. Optimal design of grid-connected rooftop PV systems: An overview and a new approach with application to educational buildings in arid climates. Sustain. Energy Technol. Assess. 2021, 47, 101468. [Google Scholar] [CrossRef]
- He, Y.; Zhang, Y.; Zhao, Z.; Sun, X.; Zhang, X.; Li, S.; Deng, Q.; Sun, J. Electrical characteristics and economic study of PV-BESS teaching building based on spatial and temporal distribution of personnel. Renew. Energy 2025, 241, 122343. [Google Scholar] [CrossRef]
- Teah, H.S.; Yang, Q.; Onuki, M.; Teah, H.Y. Incorporating External Effects into Project Sustainability Assessments: The Case of a Green Campus Initiative Based on a Solar PV System. Sustainability 2019, 11, 5786. [Google Scholar] [CrossRef]
- Huang, Y.; Masrur, H.; Shigenobu, R.; Hemeida, A.M.; Mikhaylov, A.; Senjyu, T. A Comparative Design of a Campus Microgrid Considering a Multi-Scenario and Multi-Objective Approach. Energies 2021, 14, 2853. [Google Scholar] [CrossRef]
- Ahmed, A.; Nadeem, T.B.; Naqvi, A.A.; Siddiqui, M.A.; Khan, M.H.; Zahid, M.S.B.; Ammar, S.M. Investigation of PV utilizability on university buildings: A case study of Karachi, Pakistan. Renew. Energy 2022, 195, 238–251. [Google Scholar] [CrossRef]
- Marchwiński, J.; Kurtz-Orecka, K. Influence of photovoltaic installation on energy performance of a nursery building in Warsaw (Central European conditions). J. Build. Eng. 2020, 32, 101630. [Google Scholar] [CrossRef]
- Dobrzycki, A.; Kurz, D.; Mikulski, S.; Wodnicki, G. Analysis of the Impact of Building Integrated Photovoltaics (BIPV) on Reducing the Demand for Electricity and Heat in Buildings Located in Poland. Energies 2020, 13, 2549. [Google Scholar] [CrossRef]
- Wciślik, S.; Kotrys-Działak, D. Thermal building upgrade with off-grid PV system: A Polish case. Energy Effic. 2021, 14, 70. [Google Scholar] [CrossRef]
- Woroniak, J. The Photovoltaic Installation Application in the Public Utility Building. Ecol. Chem. Eng. S 2017, 24, 517–538. [Google Scholar] [CrossRef]
- Davybida, L.; Wyczałek, I.; Plichta, A. Using GIS and SDSS Tools in the Design of a Photovoltaic System for a Built-up Roof. Geomat. Environ. Eng. 2022, 16, 31–58. [Google Scholar] [CrossRef]
- Żołądek, M.; Filipowicz, M.; Sornek, K.; Figaj, R.D. Energy performance of the photovoltaic system in urban area—Case study. In Proceedings of the IOP Conference Series: Earth and Environmental Science, International Conference on the Sustainable Energy and Environmental Development, Krakow, Poland, 14–17 November 2017; Volume 214. [Google Scholar]
- Vellingiri, M.; Rawa, M.; Alghamdi, S.; Alhussainy, A.A.; Althobiti, A.S.; Calasan, M.; Micev, M.; Ali, Z.M.; Abdel Aleem, S.H.E. Non-Linear Analysis of Novel Equivalent Circuits of Single-Diode Solar Cell Models with Voltage-Dependent Resistance. Fractal Fract. 2023, 7, 95. [Google Scholar] [CrossRef]
- EnergyPlus Weather Data. All Regions—Europe (WMO Region 6)—Poland. Available online: https://energyplus.net/weather-location/europe_wmo_region_6/POL/POL_Bialystok.122950_IMGW (accessed on 9 June 2025).
- Photovoltaic Performance. Available online: https://re.jrc.ec.europa.eu/pvg_tools/en/ (accessed on 9 June 2025).
- Solar Radiation. Available online: https://re.jrc.ec.europa.eu/pvg_tools/en/#MR (accessed on 9 June 2025).
- Typical Meteorological Year. Available online: https://re.jrc.ec.europa.eu/pvg_tools/en/#TMY (accessed on 9 June 2025).
- Bolinger, M.; Seel, J. Utility Scale Solar 2015. In An Empirical Analysis of Project Cost, Performance, and Pricing Trends in the United States; Lawrence Berkeley National Laboratory: Berkeley, CA, USA, 2016. [Google Scholar]
- Zukowski, M. Multi-aspect analysis of measures to reduce the building’s energy demand. J. Build. Eng. 2024, 91, 109758. [Google Scholar] [CrossRef]

| Parameters | Parameter Value |
|---|---|
| Active area (m2) | 2.0 |
| Outside width [m] | 1.9 |
| Outside length [m] | 1.1 |
| Cells type | N-type monocrystalline |
| Rated power [W] | 480 |
| Module heat loss coefficient (W/(m2K)) | 30 |
| Peak-power voltage [V] | 35.38 |
| Peak-power current [A] | 13.57 |
| Open circuit voltage [V] | 42.71 |
| Short circuit current [A] | 14.31 |
| Temperature coefficient of short circuit current (A/K) | 0.0064 |
| Temperature coefficient of open circuit voltage [V/K] | −0.105 |
| Energy Generated [kWh] by: | ||||
|---|---|---|---|---|
| Year | PV Panel Fixed on the Roof | PV Panel Installed on a Tracker | PV Panel Installed on the Wall at the Southeastern Side | PV Panel Installed on the Wall at the Southwestern Side |
| 2016 | 2823 | 4072 | 1110 | 890 |
| 2017 | 2616 | 3744 | 998 | 871 |
| 2018 | 3184 | 4552 | 1209 | 996 |
| 2019 | 3235 | 4655 | 1219 | 1034 |
| 2020 | 3050 | 4340 | 1133 | 941 |
| 2021 | 2833 | 4156 | 1145 | 923 |
| 2022 | 3022 | 4370 | 1180 | 952 |
| 2023 | 2961 | 3508 | 1104 | 922 |
| 2024 | 2749 | 2951 | 1006 | 872 |
| Energy generated by PV panels [kWh] per 1 m2 of panel area within the period 2016–2024 | ||||
| 2016–2024 | 1572 | 2125 | 1192 | 978 |
| Energy generated by PV panels [kWh] per 1 m2 of panel area per year | ||||
| 2016–2024 | 175 | 236 | 133 | 109 |
| Time | Spring/Autumn | Summer | Winter | |||
|---|---|---|---|---|---|---|
| Azimuth 19° | Azimuth 109° | Azimuth 19° | Azimuth 109° | Azimuth 19° | Azimuth 109° | |
| 4 | 0 | 0 | 0 | 19 | 0 | 0 |
| 5 | 0 | 0 | >100 | >100 | 0 | 0 |
| 6 | 0 | 0 | >100 | >100 | 0 | 0 |
| 7 | 0 | 4 | >100 | >100 | 0 | 0 |
| 8 | 9 | 4 | 86 | 29 | 0 | 0 |
| 9 | 13 | 5 | 97 | 30 | 0 | 0 |
| 10 | 29 | 9 | >100 | 30 | 10 | 4 |
| 11 | 95 | 23 | 89 | 26 | 39 | 9 |
| 12 | >100 | 28 | 71 | 21 | 79 | 11 |
| 13 | >100 | 28 | 63 | 19 | 46 | 10 |
| 14 | >100 | 23 | 54 | 16 | 18 | 6 |
| 15 | 99 | 15 | 43 | 13 | 5 | 2 |
| 16 | 65 | 8 | 37 | 12 | 0 | 0 |
| 17 | 22 | 6 | 65 | 22 | 0 | 0 |
| 18 | 0 | 0 | 41 | 15 | 0 | 0 |
| 19 | 0 | 0 | 5 | 0 | 0 | 0 |
| Case Name | Polynomial Coefficients | R2 [-] | EPV | |||
|---|---|---|---|---|---|---|
| a | b | c | d | [kWh] | ||
| Variant 3_SV | 0.00006 | 0.0012 | −2.2575 | 1119.8 | 0.9759 | 166,392 |
| Variant 3_SH | 0.00000011 | −0.000067 | −0.1622 | 340.215 | 0.9849 | 93,171 |
| Variant 4_SV | 0.0001 | −0.0098 | −1.7008 | 1209.9 | 0.9799 | 179,732 |
| Variant 4_SH | 0.00006 | −0.0048 | −1.0319 | 835.08 | 0.9833 | 127,255 |
| Variant 4_E | 0.00003 | −0.0137 | 0.3393 | 703.99 | 0.9726 | 67,927 |
| Case Name | IC [EUR] | CF for 1 Year [EUR] | CO&M for 1 Year [EUR] | CR in 15th Year [EUR] | Peak Power [kWp] |
|---|---|---|---|---|---|
| Variant 3_SV | 94,033 | 35,312 | 4702 | 13,645 | 210.24 |
| Variant 3_SH | 54,101 | 19,700 | 2705 | 5888 | 120.96 |
| Variant 4_SV | 125,377 | 36,952 | 6269 | 22,741 | 280.32 |
| Variant 4_SH | 72,135 | 26,995 | 3607 | 7850 | 161.28 |
| Case Name | NPV [EUR] | IRR-3 Years [%] | IRR-5 Years [%] | IRR-10 Years [%] | IRR-30 Years [%] |
|---|---|---|---|---|---|
| Variant 3_SV | 679,506 | 6.73 | 26.32 | 36.88 | 38.65 |
| Variant 3_SH | 378,679 | 5.06 | 24.81 | 35.62 | 37.51 |
| Variant 4_SV | 668,468 | −5.49 | 15.22 | 27.70 | 30.40 |
| Variant 4_SH | 521,657 | 6.54 | 26.15 | 36.73 | 38.53 |
Disclaimer/Publisher’s Note: The statements, opinions and data contained in all publications are solely those of the individual author(s) and contributor(s) and not of MDPI and/or the editor(s). MDPI and/or the editor(s) disclaim responsibility for any injury to people or property resulting from any ideas, methods, instructions or products referred to in the content. |
© 2025 by the authors. Licensee MDPI, Basel, Switzerland. This article is an open access article distributed under the terms and conditions of the Creative Commons Attribution (CC BY) license (https://creativecommons.org/licenses/by/4.0/).
Share and Cite
Zukowski, M.; Sobolewski, R.A. Technical and Economic Analysis of a Newly Designed PV System Powering a University Building. Energies 2025, 18, 3742. https://doi.org/10.3390/en18143742
Zukowski M, Sobolewski RA. Technical and Economic Analysis of a Newly Designed PV System Powering a University Building. Energies. 2025; 18(14):3742. https://doi.org/10.3390/en18143742
Chicago/Turabian StyleZukowski, Miroslaw, and Robert Adam Sobolewski. 2025. "Technical and Economic Analysis of a Newly Designed PV System Powering a University Building" Energies 18, no. 14: 3742. https://doi.org/10.3390/en18143742
APA StyleZukowski, M., & Sobolewski, R. A. (2025). Technical and Economic Analysis of a Newly Designed PV System Powering a University Building. Energies, 18(14), 3742. https://doi.org/10.3390/en18143742