Abstract
Driven by the environmental benefits associated with reduced greenhouse gas emissions, oil companies have intensified research efforts into reassessing the strategies used to meet the electrical demands of offshore production platforms. Among the various alternatives available, the deployment of onshore–offshore interconnections via High-Voltage Direct Current (HVDC) transmission systems has emerged as a promising solution, offering both economic and operational advantages. In addition to reliably meeting the electrical demand of offshore facilities, this approach enables enhanced operational flexibility due to the advanced control and regulation capabilities inherent to HVDC converter stations. Based on the use of interconnection through an HVDC link, aiming to evaluate the operation of the electrical system as a whole, this study focuses on evaluating dynamic events using the PSCAD software version 5.0.2 to analyze the direct online starting of a large induction motor and the sudden loss of a local synchronous generating unit. The simulation results are then analyzed to assess the effectiveness of both Grid-Following (GFL) and Grid-Forming (GFM) control strategies for the converters, while the synchronous generators are evaluated under both voltage regulation and constant power factor control operation, with a particular focus on system stability and restoration of normal operating conditions in the sequence of events.
1. Introduction
In recent decades, energy systems have undergone significant transformation in terms of their design concepts, operational strategies, and facility maintenance. Emerging technologies have been developed to address critical demands related to climate change mitigation, sustainability, energy efficiency, and supply security, among other factors. Within this context of energy transition, substantial investment has been directed towards innovative solutions aimed at reducing CO2 emissions and optimizing the operational costs associated with oil and gas extraction and storage platforms [1]. According to [2], natural gas turbines used on FPSO for electricity generation typically have greenhouse gas emission values ranging from 500 to 1000 kg/MWh.
Consequently, numerous offshore platform electrification projects have been implemented globally. Countries have sought to meet their internal energy demands by interconnecting these platforms with continental transmission networks, thereby significantly reducing emissions [3]. Among such pioneering installations, the electrification of the Troll A platform, situated off the coast of Norway, is particularly noteworthy. This arrangement utilizes a High-Voltage Direct Current (HVDC) interconnection via a 70 km submarine cable, supplying a power demand of approximately 88 MW [4]. Another prominent example is the electrification of the Utsira High field, comprising a complex of four platforms powered through a distribution hub located at Johan Sverdrup [5,6]. The operational results from these installations indicate substantial emission reductions, achieving CO2 emissions as low as 0.67 kg/bbl—markedly lower than the Norwegian coastal average of 9 kg/bbl and significantly below the global average of approximately 15 kg/bbl [7].
Motivated by these environmental benefits, similar initiatives have been undertaken at various facilities internationally, with a focus on revising conventional strategies to meet the electrical energy demands of offshore production platforms. In Brazil, Petrobras has committed to reducing its emissions by 25% by 2030 compared to 2015 levels [8]. To achieve this target, significant research and development efforts are being dedicated to the electrification of production unit equipment via electrical interconnections with mainland grids [8]. This strategy is further justified by Brazil’s national energy matrix, which comprises roughly 80% renewable sources. To fulfill the outlined objectives, several technical approaches for onshore–offshore interconnections have been identified, including High-Voltage Alternating Current transmission (HVAC) systems operating at 50/60 Hz [9], High-Voltage Direct Current transmission (HVDC) [10,11,12], and Low-Frequency Alternating Current transmission (LFAC) [13]. Additionally, emerging strategies include the direct connections of offshore production units to wind farms or harnessing tidal energy resources [14,15,16].
Although various technological possibilities exist, this paper focuses specifically on Direct Current transmission solutions. Such configurations utilize Voltage Source Converter (VSC)-based HVDC systems, adopting a Modular Multilevel Converter (MMC) topology within AC-DC conversion substations [17]. This approach not only meets the requisite power demands but also offers inherent operational advantages provided by converter control capabilities. These advantages include power factor regulation of the AC grid connection, precise control of voltage levels on both the AC and DC sides of the converters, active power management under steady-state and dynamic operating conditions, and frequency regulation, among other operational features [18,19,20].
Building upon the described control properties, this article presents a computational assessment of operational control techniques applied to onshore–offshore electrical interconnections, emphasizing the regulation of operational conditions imposed on the installations. To achieve this, a detailed electrical network model was developed using the PSCAD software, following the modeling guidelines specified in CIGRE Brochure B4.57 “Guide for the Development of Models for HVDC Converters in an HVDC Grid” [21].
The remainder of this paper is structured as follows: Section 2 outlines the proposed electrical network and HVDC controls. Section 3 describes operational scenarios and simulation cases. Section 4 presents the results and discussions obtained from dynamic analysis. Finally, Section 5 summarizes the main conclusions of this study.
2. HVDC-VSC-MMC Interconnection Modeling and Control Strategies
The topological arrangement for the interconnection between the targeted electrical areas is illustrated in Figure 1. The onshore configuration comprises an electrical system integrating the HVDC-VSC-MMC rectifier station to the continental grid via a transmission line. The HVDC scheme employs a symmetrical monopole topology connecting the rectifier and inverter stations through submarine DC cables. The inverter station, located on the Floating, Production, Storage, and Offloading (FPSO) platform, satisfies local electrical demands through a combination of power from the HVDC interconnection and local synchronous generation provided by gas-based turbines. It is worth highlighting that the supply of electrical energy in a hybrid form to the production unit, through local synchronous generation and HVDC interconnection, is justified due to the thermal demand of the FPSO, which is met by the gas turbines that drive the generators. This is a proposed scenario of partial electrification of a brownfield distant from shore when HVAC transmissions are not feasible. In this case, compact and modular HVDC-VSC systems emerge as a solution to reduce emissions at the post-peak production period. Thus, aside from the specific characteristics inherent to the HVDC system, other components of the electrical network are represented using widely recognized computational models. As such, subsequent discussions will primarily be limited to AC-DC and DC-AC converter modeling and their respective operational control strategies.
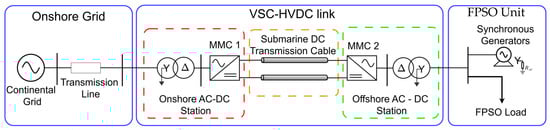
Figure 1.
Single-line diagram of the HVDC onshore–offshore interconnection system.
The HVDC models employed in this study align with CIGRE Brochure B4.57—Guide for the Development of Models for HVDC Converters in an HVDC Grid [21], which is a standardized reference for generic modeling approaches without manufacturer-specific details. According to the brochure, such operational modeling includes MMC-VSC-HVDC converters, operational control techniques, DC cables, VSC-HVDC system protection schemes, and standard test systems for VSC-HVDC models. In these guidelines, CIGRE establishes seven computational modeling strategies to represent MMC-based converters:
- Type 1—Full Physics-Based Models: Detailed representation of individual IGBTs and diodes using differential equations or equivalent circuits.
- Type 2—Full Detailed Models: Individual modeling of each converter submodule.
- Type 3—Simplified Switchable Resistance Models: Individual submodule representation with IGBT/diodes modeled as equivalent resistances.
- Type 4—Detailed Equivalent Circuit Models: Submodule circuits aggregated into Thévenin/Norton equivalents per converter arm.
- Type 5—Average-Value Models (AVMs): Switching function-based representation using controlled voltage/current sources.
- Type 6—Simplified Average-Value Models: Omitting detailed switching mathematical functions, utilizing simplified voltage/current signals.
- Type 7—RMS Load-Flow Models: Frequency domain-based simulations intended for load-flow studies.
To assess operational performance in steady-state, dynamic, electromagnetic transient, and short-circuit analyses, this study adopted the Type 4 modeling approach. This method, presented in Figure 2, significantly reduces computational efforts by simplifying electrical network equations via aggregated Thévenin/Norton equivalent representations of converter arms.
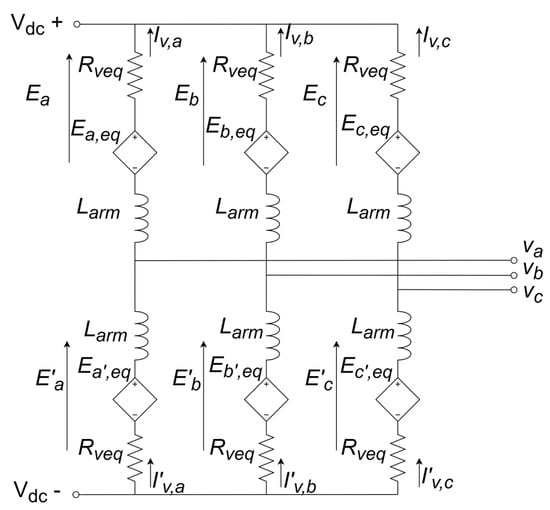
Figure 2.
Type 4 MMC-VSC-HVDC converter model. Adapted from [21].
In line with the established modeling strategy, it is worth highlighting that the equivalent three-phase voltages of the MMC individual arms, represented here by Eabc, is given by (1), (2), and (3). These quantities correspond to the composition of the individual voltages of the N individual submodules connected in series.
In accordance with the established strategy, the relationship between the voltages at the inverter output terminals and those at the transformer’s primary side is given by (4).
where Va, Vb, and Vc are, respectively, phase voltages a, b, and c at the terminals on the transformer’s primary side; Ea, Eb, and Ec are the voltages generated at the inverter output terminals; ia, ib, and ic are the currents flowing between the inverter and the power grid; and Rarm and Larm represent, respectively, the total resistance and inductance of the output filter.
Applying the Park Transformation to (4) yields Equations (5) and (6), which represent the voltage balance at the inverter output terminals in the dq0 reference frame.
where Vd and Vq are the direct-axis and quadrature-axis voltages at the transformer’s primary side, respectively; Ed and Eq are the direct-axis and quadrature-axis voltages generated by the inverter; Id and Iq are the direct-axis and quadrature-axis currents circulating within the system; and ω denotes the angular frequency of the electrical grid.
Based on these considerations, components Vd and Vq are defined according to (7) and (8), respectively. Consequently, the instantaneous active (p) and reactive (q) powers are expressed by (9) and (10), respectively.
In accordance with the hierarchical control structure outlined in CIGRE B4.57, the converter units are governed by the following:
- Dispatch Controls: These implement commands from the dispatch center to achieve specific operational goals.
- Upper-Level Controls: These manage rectifier and inverter stations to meet assigned targets, such as power demand, AC/DC voltage regulation, power factor management, and frequency control. Upper-level controls are categorized into Grid-Following (GFL) and Grid-Forming (GFM) operational modes.
- Lower-Level Controls: These determine submodule switching to synthesize converter terminal AC voltages for fulfilling higher-level control directives.
Regarding the Grid-Following control mode, Figure 3 illustrates the available control strategies for converter stations. A PLL technique is employed to synchronize the converter-generated voltages with the AC grid, obtaining the phase angle at the point of coupling, thus enabling precise control of the current injected into the grid. This configuration supports two primary control modules: The first module allows either the dispatch of fixed active power (P Control) or regulation of the DC link voltage (VDC Control). The second module facilitates either fixed reactive power exchange with the AC grid (Q Control), voltage regulation at a specified grid busbar (VAC Control), or the maintenance of a constant power factor at the converter station’s AC terminals (PF Control). These control functionalities are applicable to both rectifier and inverter stations, and their selection depends on the operational requirements defined by the installation project.
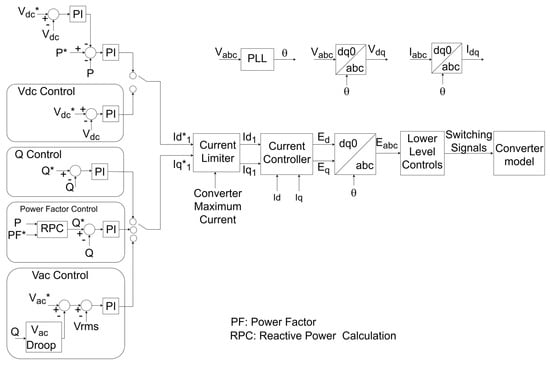
Figure 3.
Control loops for converter stations operating in Grid-Following Mode. Adapted from [21]. The * indicates a reference value for the control system.
Additionally, for inverter stations operating in Grid-Forming mode (GFM), Figure 4 illustrates control strategies designed to regulate the AC frequency and voltage at the offshore production unit. In this operational mode, the inverters function as voltage sources, establishing the system frequency and voltage downstream of the HVDC interconnection by balancing the active and reactive power delivered to the offshore grid. A commonly adopted control technique for achieving this objective is droop control [22,23], which facilitates synchronization and load sharing among multiple generation units. Alternative GFM inverter control methodologies have also been proposed in the literature to replicate dynamic responses similar to those exhibited by synchronous machines [24].
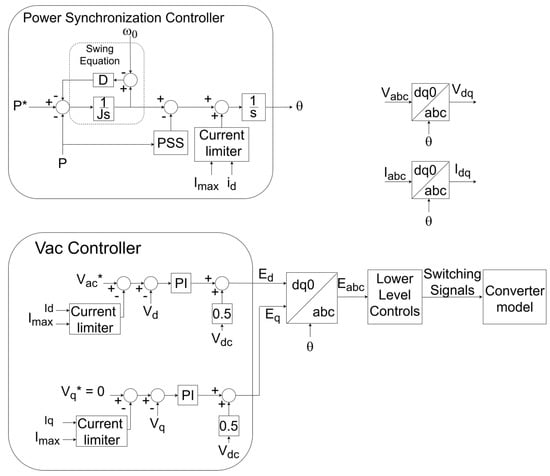
Figure 4.
Control loops for converter stations operating in Grid-Forming Mode. Adapted from [24]. The * indicates a reference value for the control system.
The lower-level controllers are responsible for synthesizing the converter AC voltages by determining the triggering pulses for the submodules, based on the three-phase reference voltage inputs provided by the higher-level controllers. Concerning the switching techniques, the literature identifies several modulation methods commonly employed in MMC-VSC-HVDC converters, including Phase-Disposition Pulse-Width Modulation (PD-PWM), Phase-Shift Pulse-Width Modulation (PS-PWM), Space-Vector Pulse-Width Modulation (SV-PWM), Selective Harmonic Elimination (SHE), and Nearest Level Control (NLC). In this study, the PS-PWM modulation strategy was adopted to realize switching equalization on the MMC submodules [25], and it aligns with this study’s primary objective of analyzing the performance of the electric power system. Furthermore, this modulation strategy was incorporated into the benchmark system linked to CIGRE Brochure B4.57 [21].
3. The Test System and Case Studies
To assess the dynamic performance of the onshore–offshore interconnection, the test system was implemented in the PSCAD software version 5.0.2 package using the topological configuration illustrated in Figure 5.
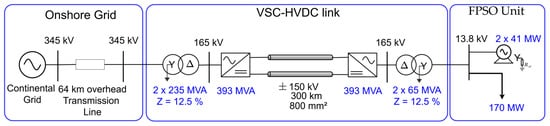
Figure 5.
Single-line diagram of the onshore–offshore interconnection employing an HVDC transmission system.
The evaluated system comprised a ±150 kV symmetrical monopolar HVDC-VSC-MMC interconnection, integrating the continental grid with an FPSO platform through submarine cables spanning 300 km. The imported power from the onshore network provides 120.0 MW to the FPSO, supplemented by synchronous generators installed on the platform with an aggregate generation capacity of 81 MW.
The remaining parameters for the electrical system’s components are provided in Table 1.

Table 1.
Parameters of the onshore–offshore electrical interconnection.
Typically, the components comprising the topological structure of the arrangement are readily modeled within PSCAD software, requiring only parameterization. However, due to their unique characteristics, submarine cables necessitated specific models, which were integrated following the guidelines in [26].
The FPSO’s electrical load amounts to 170 MW, supplied through 13.8 kV feeders. The main loads comprise three-phase induction motors directly connected to a 13.8 kV busbar, rated at 11 MW and 5.7 MW; these were modeled following the guidelines in [27]. Supplementary low-voltage electrical loads are represented by constant power models. For local synchronous generation, the platform utilizes two turbo-generator units, each with a 41 MW rating, whose models incorporate their respective speed and voltage control systems as detailed in [28].
As for the dynamic studies, two typical operational situations were selected from numerous field possibilities. These situations, detailed below, are both associated with events occurring on the FPSO’s 13.8 kV network:
- Direct online starting of an 11 MW three-phase induction motor;
- Outage of a single synchronous generation unit on the FPSO platform.
The dynamic performance assessment of the installation, under the specified transient events, was based on the operational selection of control modes assigned to the converter stations, as detailed subsequently. In this context, referring to the control structure illustrated in Figure 3, the converters adopt the following operational modes:
- Rectifier Station: In both investigated cases, the rectifier is tasked with regulating the DC link voltage, maintaining a constant ±150 kV at the DC line terminals on the sending side. Additionally, the rectifier ensures a fixed power factor of 0.98 at the 345 kV AC interconnection point with the continental power grid.
- Inverter Station: This station operates by regulating the voltage at the 165 kV busbar. Furthermore, depending on the selected operational scenario, the inverter manages either the active power flow or the operational frequency of the FPSO, consistent with the Grid-Following or Grid-Forming control modes, respectively.
Consequently, the conducted studies addressing the aforementioned operational conditions correspond to the case studies summarized in Table 2.
Table 2.
Case study summary.
In evaluating the adherence to recommended voltage standards during dynamic events within the facility, a comparative baseline was established using defined excursion limits. This approach conformed to IEC 61892—Mobile and fixed offshore units—Electrical installations [29], a standard that details reference values for transient voltage and frequency amplitude variations, including their required recovery times after an event.
4. Results and Discussion
In light of the selected disturbance scenarios and the corresponding control strategies assigned to the converter stations within the studied HVDC interconnection architecture, Figure 6 and Figure 7 present the system’s dynamic response for the two case studies: the direct start of a large induction motor and the disconnection of a synchronous generation unit. The dynamic behavior is illustrated through time-domain profiles of key electrical variables, with each subplot representing one of the four tested control strategies as defined by the converter operating modes. The results are organized as follows:
- (a)
- Active power output from the inverter station, measured at the 13.8 kV side of the 165/13.8 kV transformer;
- (b)
- Reactive power output from the inverter station, measured at the 13.8 kV side of the 165/13.8 kV transformer;
- (c)
- Active power generated by the local synchronous generator on the FPSO;
- (d)
- Reactive power generated by the same synchronous generator;
- (e)
- Frequency of the FPSO-side distribution network;
- (f)
- Voltage at the 13.8 kV FPSO busbar;
- (g)
- Active power delivered by the National Interconnected System (SIN) to the rectifier station, measured at the 345 kV side of the 345/165 kV transformer;
- (h)
- Reactive power at the rectifier station, also measured at the 345 kV side;
- (i)
- Voltage at the sending terminal of the HVDC submarine cable;
- (j)
- Voltage at the receiving terminal of the HVDC submarine cable.
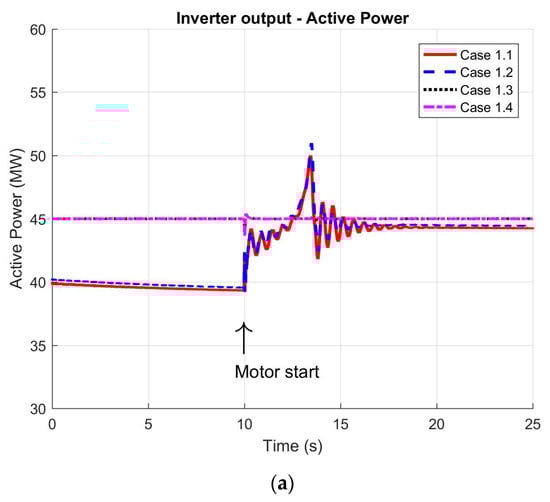
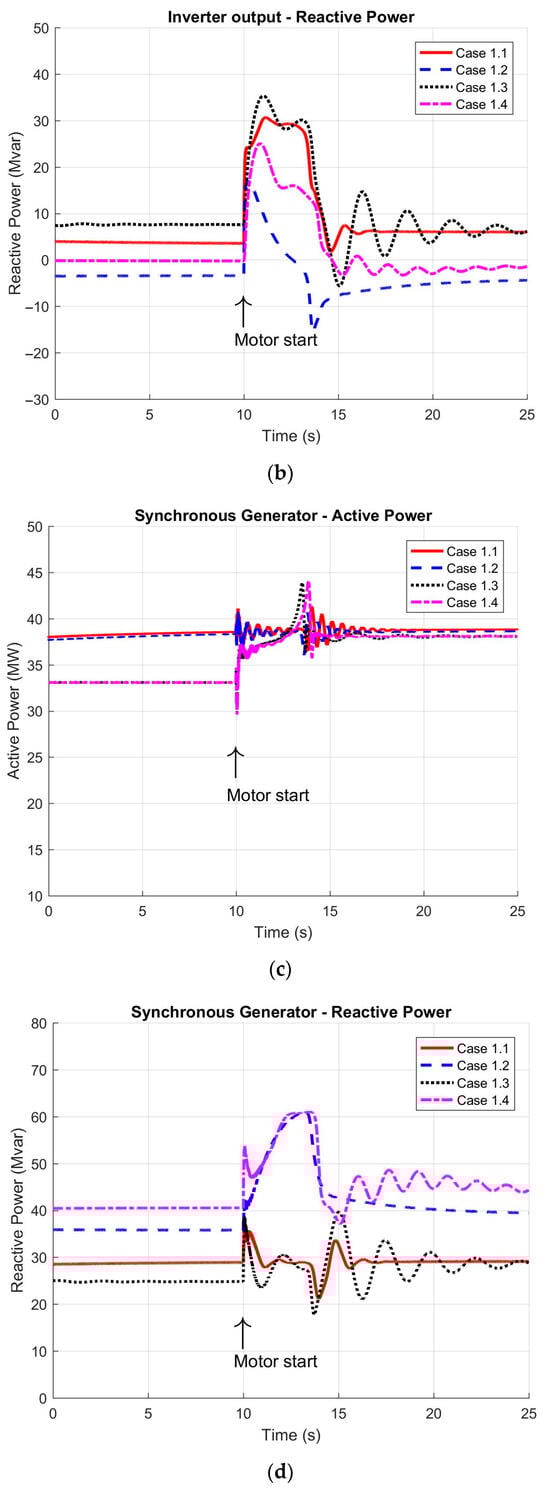
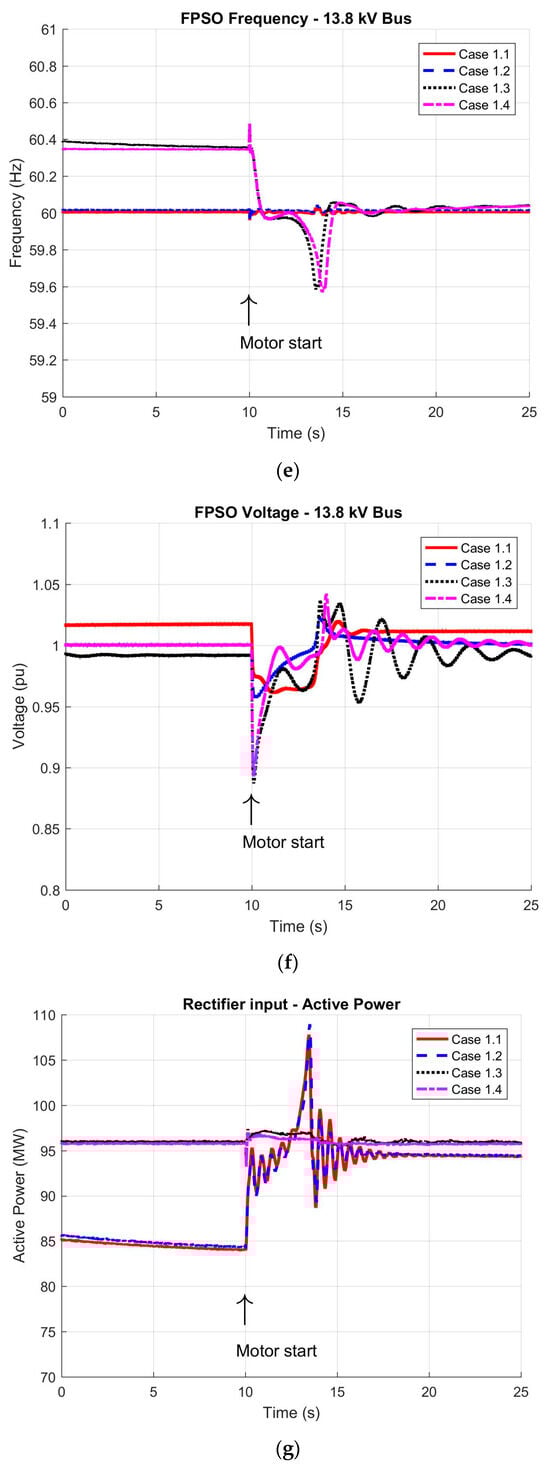
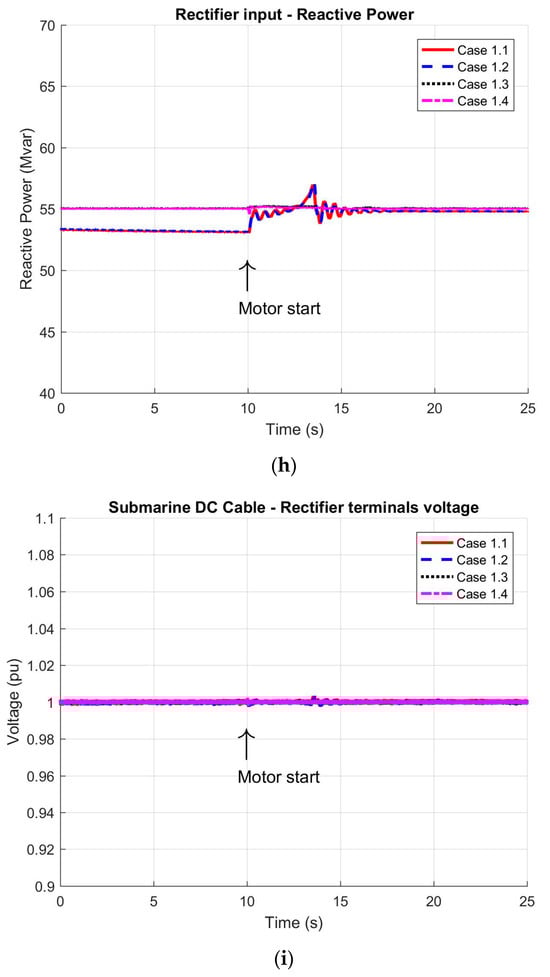
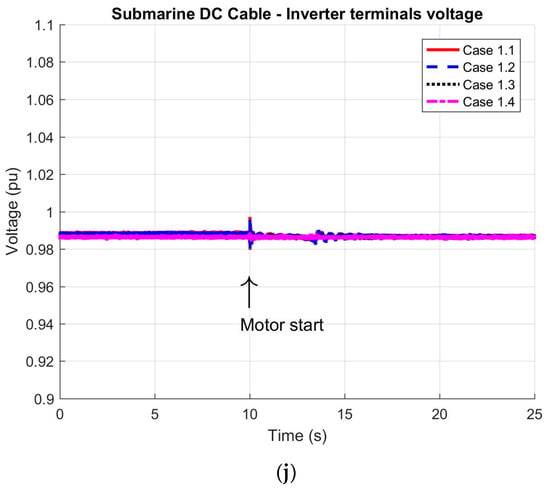
Figure 6.
Dynamic response of the HVDC system during the direct online starting of the 11 MW induction motor: (a) active power delivered by the inverter station; (b) reactive power generated by the inverter; (c) active power output from the synchronous generator; (d) reactive power output from the synchronous generator; (e) FPSO grid frequency; (f) voltage at the 13.8 kV busbar; (g) active power supplied to the rectifier station; (h) reactive power at the rectifier station input; (i) DC voltage at rectifier output; and (j) DC voltage at inverter input.
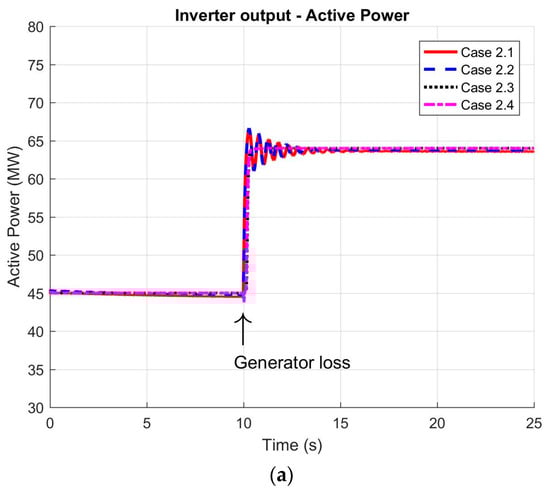
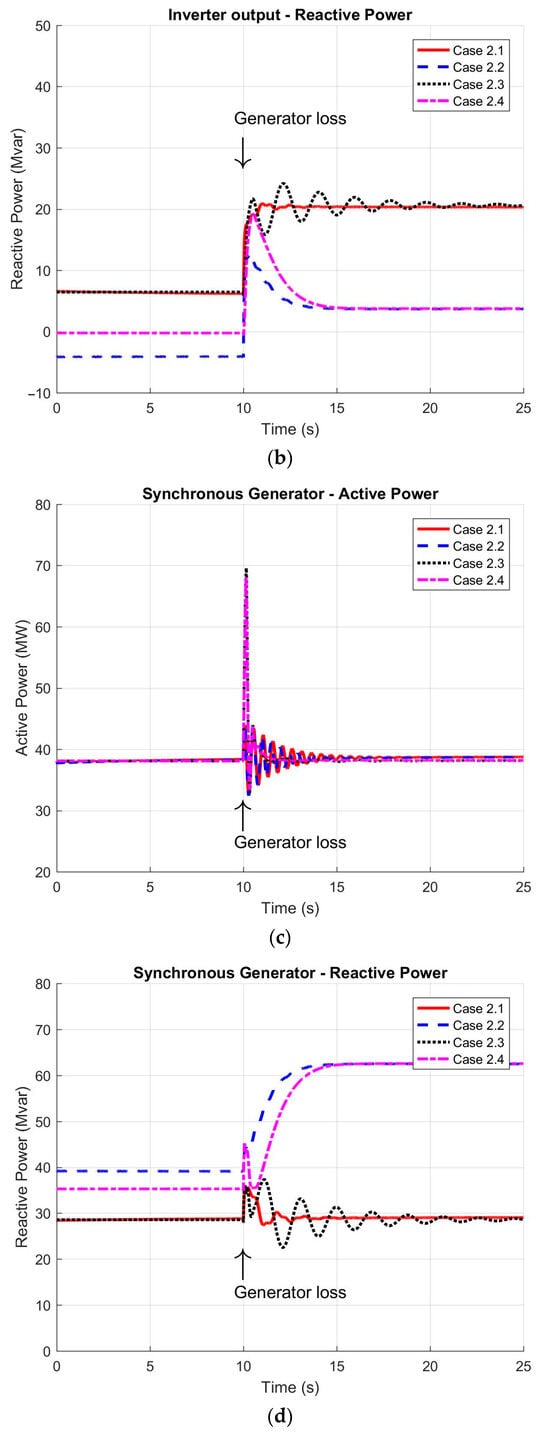
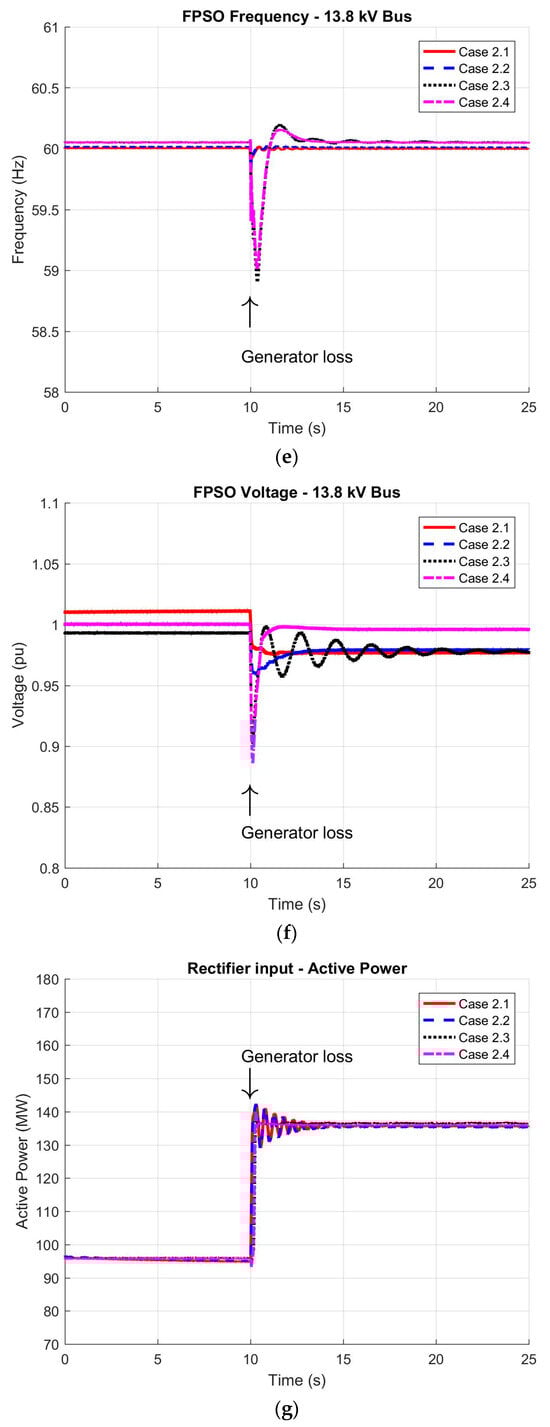
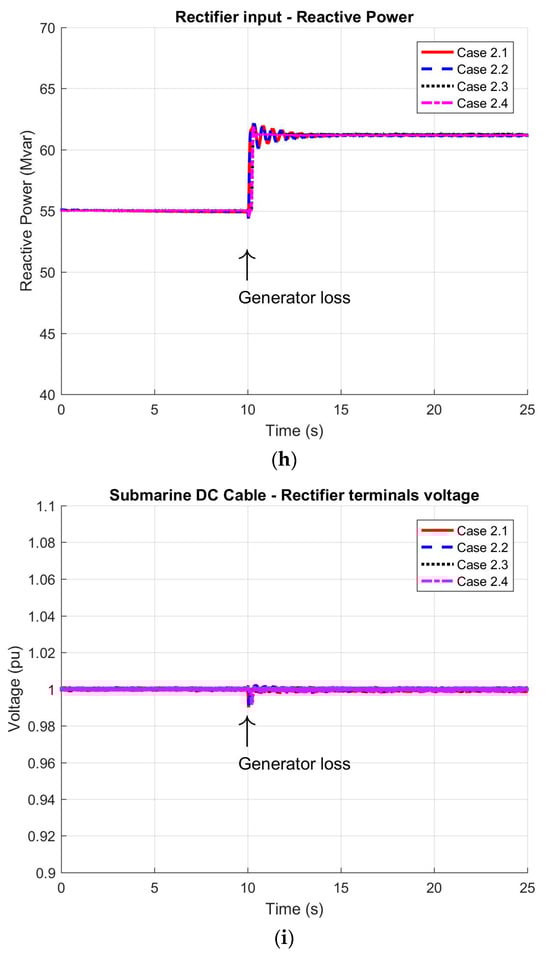
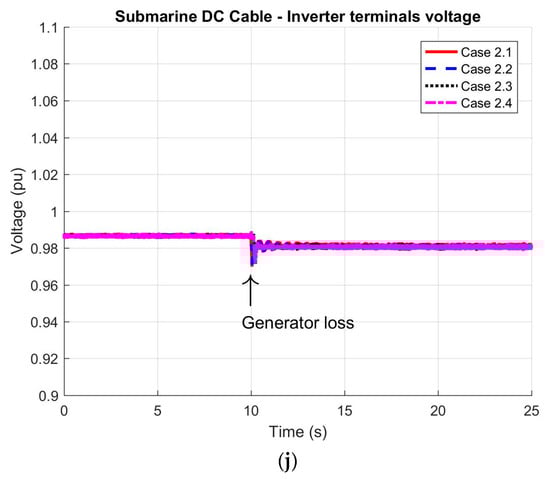
Figure 7.
Dynamic response of the HVDC system during a single synchronous generator loss on FPSO: (a) active power delivered by the inverter station; (b) reactive power generated by the inverter; (c) active power output from the remaining synchronous generator; (d) reactive power output from the remaining synchronous generator; (e) FPSO grid frequency; (f) voltage at the 13.8 kV busbar; (g) active power supplied to the rectifier station; (h) reactive power at the rectifier station input; (i) DC voltage at rectifier output; and (j) DC voltage at inverter input.
4.1. Case Study 1: Direct Start of an 11 MW Induction Motor
Having completed the dynamic performance studies related to the induction motor start-up, the time-domain profiles of key system variables are presented in Figure 6. These results reflect the system’s response under different combinations of converter control strategies, enabling a detailed evaluation of their impact on the interconnection’s ability to adapt to new load conditions.
The power values depicted in the figures correspond to the parallel operation of two transformers and two generators, such that each profile indicates 50% of the total power under the specified operating conditions. Before the motor start event at 10 s, the results for cases 1.1 and 1.2 demonstrate that the HVDC inverter station injects approximately 2 × 40 MW of active power into the FPSO distribution network, which is consistent with its constant-frequency control mode. In contrast, for cases 1.3 and 1.4, the inverter station is configured to supply a fixed active power of 2 × 45 MW, and the synchronous generators compensate for any additional platform load, as shown in Figure 6c.
Following the start of the 11 MW motor at 10 s, the responses of the active and reactive powers (and other key variables) highlight the system’s dynamic behavior. As shown in Figure 6a, after some brief oscillations, the system converges to a new operating point reflecting the established control modes. For cases 1.1 and 1.2, the inverter station’s active power rises in an oscillatory manner before settling at around 2 × 44 MW, indicating that the inverter station absorbs the total increase in power demand while the synchronous generators remain at their original operating levels (Figure 6c). Meanwhile, Figure 6e verifies that the system frequency is maintained at its rated value, confirming the effectiveness of the constant-frequency control scheme. By contrast, in cases 1.3 and 1.4, the inverter station operates in constant-power mode (unchanged from its pre-starting setpoint), thereby shifting the additional power demand to the synchronous generators (Figure 6c). In these latter cases, the frequency experiences a modest decrease from 60.4 Hz to approximately 60 Hz, demonstrating a stable response to the motor’s start. The frequency in these cases conformed to the reference values specified in Table 3.
Table 3.
Reference values for AC voltage and frequency variation.
On the rectifier side, as well as along the DC transmission line, the measured variables (Figure 6h–j) conform to the required power balance and voltage levels, both before and after the motor start event.
With respect to reactive power control strategies, the inverter station and the synchronous generators operate either in voltage regulation mode (at 13.8 kV on the FPSO side) or power factor control mode (for the generators). The rectifier station regulates its DC voltage and power factor at the connection point with the onshore system.
Prior to the motor’s start, the inverter station’s reactive power output (Figure 6b) differs significantly from its active power profiles due to the chosen control approach. Once the motor is running, the voltage and power factor control loops (for the inverter station and synchronous generators) adjust the reactive power flows to accommodate the new load conditions (Figure 6f). When the synchronous generator is set to power factor control mode, the inverter station primarily compensates for the required reactive power. Conversely, if the generator operates in voltage control mode, the synchronous generator’s automatic voltage regulator plays a predominant role in reactive power compensation, as reflected in the reactive power excursions. This situation exhibited a peak voltage variation of roughly 10% lasting about 0.5 s, which aligns with the values in Table 3.
4.2. Case Study 2: FPSO Synchronous Generator Loss
Following the same structure used for the motor start-up scenario, Figure 7 presents the system response in terms of power, voltage, and frequency for the case of a sudden outage of a synchronous generation unit (representing a 38 MW loss). This analysis provides insight into the restoration process of the offshore network under new operating conditions and highlights the influence of various control strategy combinations.
Figure 7a illustrates the active power supplied by the inverter station, measured at the 13.8 kV side of the corresponding interconnection transformer. The results clearly show that following the loss of 38 MW of local generation, the inverter compensates for the entire power deficit under both VF and PV control modes. When operating in PV mode, as outlined in the control block diagram in Figure 3, the inverter adjusts its power output in response to a change in the reference value of the control loop. This adjustment necessitates the presence of a centralized dispatch mechanism to reallocate the active power setpoint. In all four case studies, the inverter is responsible for supplying 128 MW, while the remaining synchronous generator maintains its pre-disturbance active power output. The increased oscillations observed in the active power profile can be attributed to the voltage disturbances induced by the event.
Regarding the FPSO system frequency shown in Figure 7e, the dynamic response is clearly influenced by the selected control mode. Notably, under the VF strategy, frequency restoration is achieved with lower oscillation magnitudes and faster settling times compared to the other configurations. Under these circumstances, both the frequency variation and the recovery time aligned with the reference values presented in Table 3. Similarly, the rectifier station’s active power demand, presented in Figure 7g, mirrors the increase in power delivered by the inverter station, demonstrating consistency across the interconnection.
Figure 7b presents the reactive power delivered by the inverter station, measured at the 13.8 kV side. In cases 2.1 and 2.2, where synchronous generators operate at a constant power factor, the inverter fully compensates for the reactive power loss resulting from the generator outage. The remaining synchronous unit maintains its reactive power output unchanged, consistent with its fixed power factor operation. In contrast, for cases 2.3 and 2.4—where generators operate in voltage regulation mode—the remaining generator assumes a significantly greater share of the reactive power (approximately 20 Mvar), operating near its MVA power limit, while the inverter contributes approximately 5 Mvar. As illustrated in Figure 7f, the voltage profile at the FPSO 13.8 kV bus is consistent with these reactive power dynamics and returns to nominal levels by the end of the transient. In all scenarios, the voltage aligned with the values presented in Table 3.
On the rectifier side, Figure 7h shows an increase of approximately 8 Mvar in reactive power following the rise in active power import from the continental system. This result is consistent with the rectifier’s constant power factor operation mode.
Finally, Figure 7i,j show the DC voltages at the sending and receiving terminals of the HVDC link, respectively. The sending end voltage remains constant due to the rectifier’s voltage regulation function, while the receiving end voltage exhibits a reduction consistent with the increased DC current required to supply the additional load on the offshore platform.
5. Conclusions
This paper presents a dynamic performance assessment of an HVDC-VSC-MMC interconnection to link the continental electrical grid system to an offshore Floating, Production, Storage, and Offloading (FPSO) platform. This study focused on a hybrid configuration in which local synchronous generators installed on the platform operate in parallel with an HVDC link, aiming to meet the energy demands of the production process while reducing greenhouse gas emissions. Considering the 120 MW power range, the feasibility studies conducted in this work estimate an emission reduction of 60 to 120 t/h. After developing representative computational models—highlighting the control strategies for converter stations as recommended by CIGRE—the system was implemented in the PSCAD simulation environment. Two critical disturbance scenarios were investigated: the direct online starting of a large induction motor and the sudden loss of a synchronous generation unit. For each event, the system’s dynamic response was evaluated based on the time-domain behavior of key electrical quantities, allowing for a detailed analysis of the interconnection’s stability and control effectiveness.
This study explored various combinations of converter and generator control strategies relevant to the application. For the inverter station, both Grid-Following (GFL) and Grid-Forming (GFM) control modes were considered, while the synchronous generators were evaluated under both voltage regulation and constant power factor strategies. The simulation results demonstrated physically consistent responses, with all configurations achieving post-disturbance system stability. Differences in the dynamic profiles of electrical quantities can primarily be attributed to the distinct combinations of control actions and their associated parameters (e.g., gains and time constants).
The evaluation of the dynamic performance during an 11 MW motor start-up and a generation unit loss reveals that, for the electrical arrangement, parameters, and control strategies considered herein, the GFM control strategy demonstrably improves the plant’s frequency and voltage stability, leading to oscillations with diminished amplitude and accelerated damping.
Author Contributions
Conceptualization, methodology, resources, writing—original draft, A.R., J.C.O. and C.A.V.G.; data curation, J.O.N., L.J.d.M. and M.R.d.P.J.; writing—review and editing, J.M.d.C.F.; Supervision, Resources, Writing—review and editing, V.Z.S., C.A.C.C. and J.M.T.M. All authors have read and agreed to the published version of the manuscript.
Funding
This research was funded by Petrobras, a Brazilian oil and gas company through Project N° 0050.0121196.22.9.
Data Availability Statement
Requests to access the datasets should be directed to alexreis@unb.br or jmaria@unifei.edu.br.
Acknowledgments
The authors would like to thank Brazilian oil and gas company Petrobras for supporting this research project.
Conflicts of Interest
Authors Vinicius Zimmermann Silva, Carlos Andre Carreiro Cavaliere and José Mauro Teixeira Marinho were employed by Petrobras. The remaining authors declare that the research was conducted in the absence of any commercial or financial relationships that could be construed as a potential conflict of interest. The funder was not involved in the study design, collection, analysis, interpretation of data, the writing of this article or the decision to submit it for publication.
References
- Ray, A.; Rajashekar, K. Electrification of Offshore Oil and Gas Production: Architectures and Power Conversion. Energies 2023, 16, 5812. [Google Scholar] [CrossRef]
- IPIECA. Open-Cycle Gas Turbines (2022). Available online: https://www.ipieca.org/resources/energy-efficiency-compendium/open-cycle-gas-turbines-2022#:~:text=Open%2Dcycle%20gas%20turbines%20(OCGTs,not%20recover%20any%20waste%20heat (accessed on 6 June 2025).
- Voldsund, M.; Reyes-Lúa, A.; Fu, C.; Ditaranto, M.; Nekså, P.; Mazzetti, M.J.; Brekke, O.; Bindingsbø, A.U.; Grainger, D.; Pettersen, J. Low carbon power generation for offshore oil and gas production. Energy Convers. Manag. X 2023, 17, 100347. [Google Scholar] [CrossRef]
- Troll, A. Available online: https://www.hitachienergy.com/news-and-events/customer-success-stories/troll-a (accessed on 31 March 2025).
- Ballari, A.; Østensen, J.S. Electrification of the Utsira formation—Electric System Requirements for a Power Distribution Platform. Master’s Thesis, University of Agder, Grimstad, Norway, June 2013. [Google Scholar]
- Dennetiere, S.; Rault, P.; Saad, H.; Fillion, Y.; Sharifabadi, K.; Johansson, J.H.; Krajisnik, N. Technical solutions to predict and mitigate inadvertent interaction of two parallel connected VSC-HVDC schemes feeding an islanded offshore Oil and Gas grid. In Proceedings of the 2020 CIGRE Paris Session, Paris, France, 23–28 August 2020. [Google Scholar]
- Plug-In Platforms: The Push for Offshore Electrification. Available online: https://jpt.spe.org/plug-in-platforms-the-push-for-offshore-electrification (accessed on 31 March 2025).
- Petrobras. Mudanças Climáticas e Transição para Baixo Carbono. Available online: https://petrobras.com.br/sustentabilidade/mudancas-climaticas (accessed on 31 March 2025).
- Antunes, T.A.; Castro, R.; Santos, P.J.; Pires, A.J. Technology Selection of High-Voltage Offshore Substations Based on Artificial Intelligence. Energies 2024, 17, 4278. [Google Scholar] [CrossRef]
- Stan, A.; Costinaș, S.; Ion, G. Overview and Assessment of HVDC Current Applications and Future Trends. Energies 2022, 15, 1193. [Google Scholar] [CrossRef]
- Antunes, T.A.; Castro, R.; Santos, P.J.; Pires, A.J. Power-from-Shore Optioneering for Integration of Offshore Renewable Energy in Oil and Gas Production. Energies 2024, 17, 151. [Google Scholar] [CrossRef]
- Flourentzou, N.; Agelidis, V.G.; Demetriades, G.D. VSC-Based HVDC Power Transmission Systems: An Overview. IEEE Trans. Power Electron. 2009, 24, 592–602. [Google Scholar] [CrossRef]
- Ruddy, J.; Meere, R.; O’Donnell, T. Low Frequency AC transmission for offshore wind power: A review. Renew. Sustain. Energy Rev. 2016, 56, 75–86. [Google Scholar] [CrossRef]
- Marvik, J.I.; Øyslebø, E.V.; Korpås, M. Electrification of offshore petroleum installations with offshore wind integration. Renew. Energy 2013, 50, 558–564. [Google Scholar] [CrossRef]
- Ferreira, C.; Almeida, C.F.M.; Fussuma, T.M.D. Análise dos Impactos da Implantação de Fonte de Energia Eólica Offshore Para a Descarbonização de Uma Unidade de Exploração de Petróleo e Gás na Bacia de Santos. In Proceedings of the 2024 IEEE Petroleum and Chemical Industry Conference Brasil (PCIC Brasil), Rio de Janeiro, Brazil, 16–18 April 2024. [Google Scholar]
- Haces-Fernandez, F.; Li, H.; Ramirez, D. Assessment of the Potential of Energy Extracted from Waves and Wind to Supply Offshore Oil Platforms Operating in the Gulf of Mexico. Energies 2018, 11, 1084. [Google Scholar] [CrossRef]
- Sharifabadi, K.; Harnefors, L.; Nee, H.; Norrga, S.; Teodorescu, R. Design, Control and Application of Modular Multilevel Converters for HVDC Transmission Systems; Wiley-IEEE Press: Chichester, UK, 2016. [Google Scholar]
- Muhtadi, A.; Pandit, D.; Nguyen, N.; Mitra, J. Distributed energy resources based microgrid: Review of architecture, control, and reliability. IEEE Trans. Power Electron. 2021, 57, 2223–2235. [Google Scholar] [CrossRef]
- Espina, E.; Llanos, J.; Burgos-Mellado, C.; Cardenas-Dobson, R.; Martinez-Gomez, M.; Saez, D. Distributed control strategies for microgrids: An overview. IEEE Access 2020, 8, 193412–193448. [Google Scholar] [CrossRef]
- Hu, J.; Shan, Y.; Cheng, K.W.; Islam, S. Overview of power converter control in microgrids—Challenges, advances, and future trends. IEEE Trans. Power Electron. 2022, 37, 9907–9922. [Google Scholar] [CrossRef]
- CIGRE Working Group B4.57. Guide for the Development of Models for HVDC Converters in a HVDC Grid; CIGRE: Paris, France, 2014. [Google Scholar]
- Ordono, A.; Sanchez-Ruiz, A.; Zubiaga, M.; Asensio, F.J.; Cortajarena, J.A. Current limiting strategies for grid forming inverters under low voltage ride through. Renew. Sustain. Energy Rev. 2024, 202, 114657. [Google Scholar] [CrossRef]
- Girona-Badia, J.; Prieto-Araujo, E.; Gomis-Bellmunt, O. Pairing grid-forming VSC filter topologies with voltage control structures. Int. J. Electr. Power Energy Syst. 2024, 155B, 109670. [Google Scholar] [CrossRef]
- Rodríguez-Amenedo, J.L.; Gómez, S.A.; Zubiaga, M.; Izurza-Moreno, P.; Arza, J.; Fernández, J.D. Grid-Forming Control of Voltage Source Converters Based on the Virtual-Flux Orientation. IEEE Access 2023, 11, 10254–10274. [Google Scholar] [CrossRef]
- Yin, J.; Dai, N. On Carrier-to-Fundamental Phase Displacement in Phase-Shifted PWM for Modular Multilevel Converters. IEEE Trans. Power Electron. 2024, 39, 8293–8305. [Google Scholar] [CrossRef]
- Passos, F.O.; Filho, J.M.C.; Oliveira, J.C.; Ogoulola, C.E.G.; Reis, A.; Marinho, J.M.T. Subsea DC power cable modelling and computational validation. Renew. Energy Power Qual. J. 2024, 22, 99–104. [Google Scholar] [CrossRef] [PubMed]
- Nivelo, J.J.O. Análise das Metodologias de Estudo de Partida de Motores de Grande Porte em Sistemas Elétricos Isolados. Master’s Thesis, Federal University of Itajubá, Itajubá, Brazil, 30 March 2022. [Google Scholar]
- Coello, J.A.C. Análise Através de Simulação em Tempo real do Sistema Elétrico de uma Plataforma Off-Shore para Produção de Petróleo. Master’s Thesis, Federal University of Itajubá, Itajubá, Brazil, 13 October 2021. [Google Scholar]
- IEC 61892-1; Mobile and Fixed Offshore Units—Electrical Installations—Part 1: General Requirements and Conditions. International Electrotechnical Commission: Geneva, Switzerland, 2019.
Disclaimer/Publisher’s Note: The statements, opinions and data contained in all publications are solely those of the individual author(s) and contributor(s) and not of MDPI and/or the editor(s). MDPI and/or the editor(s) disclaim responsibility for any injury to people or property resulting from any ideas, methods, instructions or products referred to in the content. |
© 2025 by the authors. Licensee MDPI, Basel, Switzerland. This article is an open access article distributed under the terms and conditions of the Creative Commons Attribution (CC BY) license (https://creativecommons.org/licenses/by/4.0/).