Article

Numerical Investigation on Flow and Thermal Characteristics of Spray Evaporation Process in Boiler Desuperheater

1
Zhejiang Academy of Special Equipment Science, Hangzhou 310018, China
2
Institute of Advanced Equipmentt, Zhejiang University, Hangzhou 310027, China
*
Author to whom correspondence should be addressed.
Energies 2025, 18(14), 3734; https://doi.org/10.3390/en18143734
Submission received: 2 June 2025 / Revised: 9 July 2025 / Accepted: 10 July 2025 / Published: 15 July 2025
(This article belongs to the Special Issue Computational Fluid Dynamics (CFD) for Heat Transfer Modeling)

Abstract

The spray evaporation process in the boiler desuperheater involves complex droplet behaviors and fluid–thermal coupling, and its temperature distribution characteristics greatly affect the performance and safety of industrial processes. To better understand the process characteristics and develop the optimal desuperheater design, computational fluid dynamics (CFDs) was applied to numerically investigate the flow and thermal characteristics. The Eulerian–Lagrangian approach was used to describe the two-phase flow characteristics. Both primary and secondary droplet breakup, the coupling effect of gas–liquid and stochastic collision and coalescence of droplets were considered in the model. The plain-orifice atomizer model was applied to simulate the atomization process. The numerical model was validated with the plant data. The spray tube structure was found to greatly affect the flow pattern, resulting in the uneven velocity distribution, significant temperature difference, and local reverse flow downstream of the orifices. The velocity and temperature distributions tend to be more uniform due to the complete evaporation and turbulent mixing. Smaller orifices are beneficial for generating smaller-sized droplets, thereby promoting the mass and heat transfer between the steam and droplets. Under the same operating conditions, the desuperheating range of cases with 21, 15, and 9 orifices is 33.7 K, 32.0 K, and 29.8 K, respectively, indicating that the desuperheater with more orifices (i.e., with smaller orifices) shows better desuperheating ability. Additionally, a venturi-type desuperheater was numerically studied and compared with the straight liner case. By contrast, discernible differences in velocity and temperature distribution characteristics can be observed in the venturi case. The desuperheating range of the venturi and straight liner cases is 38.1 K and 35.4 K, respectively. The velocity acceleration through the venturi throat facilitates the droplet breakup and improves mixing, thereby achieving better desuperheating ability and temperature uniformity. Based on the investigation of the spray evaporation process, the complex droplet behaviors and fluid–thermal coupling characteristics in an industrial boiler desuperheater under high temperature and high pressure can be better understood, and effective guidance for the process and design optimizations can be provided.

1. Introduction

Superheated steam, as an excellent medium for mass and heat transfer and power driving, plays an important role in industries such as petrochemicals, heat and power cogeneration, metallurgy, and fire power. Excessively high or unstable superheated steam temperature will cause negative impacts on the production processes and equipment safety. The desuperheaters are widely used in industrial applications to effectively regulate the steam temperature [1,2,3]. After the cooling water is injected into the desuperheater through the spray nozzle, the atomized droplets are formed due to the primary breakup process, and subsequently break up due to the secondary breakup process (Figure 1). The breakup of droplets and the turbulent mixing between the droplets and the superheated steam promote the evaporation process, effectively reducing the temperature of the superheated steam. Given that the desuperheaters are usually used in high-temperature and high-pressure processes, effectively predicting the desuperheating ability and the temperature distribution characteristics is of great significance for ensuring production safety and improving the economic benefits.
The characteristics of the spray evaporation process directly affect the desuperheater performance and efficiency. However, the spray evaporation process involves a multiphase system, phase change heat transfer, and multi-physic coupling issues; accurate analysis of the physical characteristics of the desuperheater is considerably challenging. Some scholars conducted relevant research. One-dimensional and two-dimensional mathematical models were established to predict the change in steam temperature [4]. The two-dimensional models established by Rahimi et al. [5] and Kouhikamali et al. [6] were applied to investigate the effects of initial droplet size and pipeline diameter on the droplet evaporation process. Their results illustrated that smaller initial droplets evaporate faster. Grich et al. [7] established a two-dimensional model and investigated the velocity and temperature distributions, evaporation rate, and the effect of volume fraction of cooling water on the temperature distribution. However, the droplet size was assumed to be monodisperse in this work, resulting in deviations from the actual droplet breakup behavior and droplet size distribution characteristics.
To achieve better predictions, some researchers considered the droplets’ breakup behavior. Cho et al. [8] carried out a one-dimensional simulation of the desuperheater. The secondary breakup model [9] was applied in their model. The velocity difference between steam and droplets was found to promote the droplet breakup, which benefited drop atomization and evaporation processes. Ebrahimian and Gorgi-Bandpy [10] predicted the droplet evaporation rate by a two-dimensional numerical model and found that the secondary breakup greatly affects the droplet evaporation process. The impact of the secondary breakup was considered in these studies; however, the initial size distribution of the atomized droplets, owing to the primary breakup, was neglected. Based on the previous research, Uruno et al. [11] took the effect of primary and secondary breakup into consideration in their simulation work. The influence of the desuperheater structure on the droplet size distribution and evaporation distance was studied. In addition, the atomization and evaporation process enhancement based on the structure optimization is of great significance and has attracted the attention of some researchers [12,13]. For instance, the static mixing elements are introduced into the desuperheater to improve the performance by Liang et al. [12]. It was found that the new desuperheater structure effectively increased the desuperheating ability and the temperature uniformity.
In general, simplifications were usually made in the numerical models in view of the complexity of the multi-physics process in the existing literature. Practically, the droplet breakup and collision behavior, two-phase turbulence effect, phase change process, and phase coupling effect are all important factors in the spray evaporation process, which will directly affect the temporal and spatial distribution characteristics of droplet size and the mass and heat transfer processes [9,14,15,16,17]. Compared to existing literature, these factors were taken into consideration, and fewer simplifications were made in this work to improve model accuracy. With the development of computational fluid dynamics and the improvement of computing performance, fully considering the influence of these factors in numerical models is realizable and conducive to clearly revealing the transport laws.
Last but not least, the problem of metal material failure and the need to improve production efficiency in the desuperheating system are common issues in industrial applications, which are related to the temperature distribution characteristics of the spray evaporation process. There is relatively little research on this issue in previous research. Therefore, the analysis and discussion of the spatial temperature distribution characteristics in the desuperheater is taken as an important part in this work.
The desuperheater used in an industrial circulating fluidized bed (CFB) boiler is selected for research in this work. Based on the research status and industrial needs, it is necessary and worth exploring to conduct in-depth research on the spray evaporation process under high temperature and high pressure, which benefits for better understanding of droplet breakup and collision behaviors and the characteristics of flow and temperature fields in the CFB boiler. A comprehensive CFD model was established, considering the coupling effect of gas–liquid two-phase and the complex behaviors of droplets (primary and secondary breakup, collision, and coalescence). The simulations were carried out under the operating conditions obtained from the running data of an industrial CFB boiler, and the numerical results were compared with the plant data to validate the model. The influence of structural parameters on velocity and temperature distribution characteristics was further analyzed.

2. Methods

2.1. Physical Models

The structure of the boiler desuperheater with a straight liner studied in this work is similar to that shown in Figure 1. The length of the flow domain between the two thermowells selected for the numerical research is 4.8 m. The diagram of the flow area and main dimensions of the desuperheater are presented in Figure 2. The diameter and the length of the thermal sleeve are 0.15 m and 4 m, respectively. The outer diameter of the spray tube is 0.042 m. As demonstrated in Figure 3, the spray tube has 21 orifices, each with a length of 5 mm and a diameter of 4 mm. The included angle between orifices is 45°.

2.2. Numerical Model Description

2.2.1. Continuous Phase Flow (Steam)

Computational fluid dynamics (CFDs) is applied to predict the flow and thermal characteristics through the finite volume method. The Eulerian–Lagrangian approach is applied to describe the steam-droplet two-phase flow characteristics. The numerical simulation of gas turbulence is carried out by Navier–Stokes equations combined with the standard k-ε model [18]. The governing equations of the continuous phase (superheated steam) are as follows:
( ρ u i ) x i = S m
( ρ u i u j ) x i = ρ g i p x i + x i μ ( u j x i + u i x j ) 2 3 μ δ i j ( u k x k ) + S mom
ρ u i E x i = p u i x i + x i ( i = 1 n h i J i ) + x i ( K e f f T s x j + u i ( τ i j ) e f f ) + S e
μ t = C μ ρ ( k 2 ε )
( ρ k ) t + ( ρ u i k ) x i = x j ( μ + μ t σ k ) k x j + G k + G b ρ ε + S k
( ρ ε ) t + ( ρ u i ε ) x i = x j ( μ + μ t σ ε ) ε x j + C 1 ε ε k ( G k + C 3 ε G b ) C 2 ε ρ ε 2 k + S ε
S m = Δ m d m d , 0 m · d , 0
S mom = F D ( u d u g ) + F o t h e r m · d Δ t
S e = m ¯ d m d , 0 c p , d Δ T + Δ m d m d , 0 ( h fg + T ref T d c p , i d T ) m · d , 0
S k = u d S ud ¯ u i S ud ¯
S ε = C ε 3 ε k S k
S ud ¯ = n i Δ ( m d , i u d , i ) + m d , i g ( 1 - ρ ρ d ) Δ t d , i / V j
where ρ is the density, ui, uj, and uk are the velocity components, xi, xj, and xk are the direction components, p is the pressure, g is the gravity acceleration, μ is the gas dynamic viscosity, δij is the mean strain tensor, E is the internal energy, hi is the sensible enthalpy of species i, Ji is the diffusion flux of species i, Ts is the steam temperature, Keff is the effective conductivity, (τij)eff is the stress tensor, Sm, Smom, and Se are mass source term, momentum source term and energy source term of droplet, respectively. μt is the turbulent viscosity coefficient, k is the turbulent kinetic energy, and ε is the dissipation term [19], Cμ is a constant with a value of 0.09, C1ε, C2ε, and C3ε are empirical coefficients with the values of 1.44, 1.92, and 0.99, respectively. σk and σε are turbulent Prandtl numbers with values of 1.0 and 1.3, respectively [20], Gk and Gb represent the generation of turbulence kinetic energy due to the mean velocity gradients and buoyancy, respectively. Sk and Sε are source terms that account for the turbulence–particle interaction [21,22], Sud is the momentum source term due to the turbulence–particle interaction, FD is drag force, ug is steam velocity, ud is droplet velocity, Fother is other interaction forces, Δm is evaporated droplet mass, m ˙ d is the mass flow rate of droplets, m ˙ d,0 is the initial mass flow rate of droplets, md,0 is the initial droplet mass, m ¯ d is average droplet mass in the control volume, Δt is time step, ρd is droplet density, hfg is the latent heat of water vaporization, ΔT is temperature difference, Cε3 is an empirical constant with the value of 1.6, cp,d is the constant pressure specific heat capacity of droplets, Td is the temperature of droplets, and Vj is volume of computational cell j.

2.2.2. Dispersed Phase Flow (Water Droplets)

In view of the small volume fraction of droplets in the desuperheater, the discrete phase model (DPM) is applied for the dispersed phase flow of droplets in the Lagrangian frame. The droplets are mainly affected by drag and gravity, other forces, such as virtual mass force, Saffman lift force, thermophoresis force, and pressure gradient force, are ignored [23,24]. The trajectory and momentum equations are as follows:
d x d t = u d
d u d d t = F D ( u g u d ) + g ( ρ d ρ g ) ρ d
where x is droplet displacement, ug is steam velocity, ud is droplet velocity, and FD is drag force, and is defined by the following equations. The dynamic drag model [25] is used to determine the drag coefficient CD.
F D = 18 μ ρ d d d 2 C D R e d 24
R e d = ρ d d d v R μ
C D = ( 1 + 2.632 δ ) C D , sphere
C D , sphere = 0.424 , R e d > 1000 24 R e d ( 1 + 1 6 R e d 2 / 3 ) , R e d 1000
where CD is the drag coefficient, CD,sphere is the number of spherical drag forces, dd is the droplet diameter, Red is the relative Reynolds number of gas droplets, vR is the relative velocity of the gas droplet two-phase, and δ is the deformation value of the droplet.
The initial droplet size distribution is determined by the primary breakup when the water is injected into the steam flow. This distribution is assumed to be a Rosin–Rammler distribution [26]. The secondary breakup occurs due to the drag force on the droplets generated by the velocity difference between the steam and the droplets. The Taylor analogy breakup (TAB) model is applicable to the calculation of droplet breakup with high calculation efficiency and good prediction accuracy in engineering sprays. Though the TAB model may underestimate the secondary breakup behavior of small droplets in high-speed steam, the flow characteristics and temperature distributions in the desuperheater can be predicted well in the simulations [24,27]. Thus, the TAB model is used to describe the droplet breakage.

2.2.3. Heat and Mass Transfer Model

At the initial stage, the atomized droplets absorb heat from the superheated steam without evaporation and mass transfer. The heating rate can be described as follows [28]:
h A d ( T s T d ) = m d c p , d d T d d t
where Ad is the droplet surface area and h is the convective heat transfer coefficient, which can be obtained as follows [29]:
N u = h d d λ g = 2 + 0.6 R e d 1 / 2 P r 1 / 3
where λg is the thermal conductivity of steam, Nu is the Nusselt number, and Pr is the Prandtl number of steam.
When the droplet temperature reaches the evaporation temperature but is less than the boiling temperature, the heat balance and evaporation rate can be described as follows [30]:
h A d ( T s T d ) = m d c p , d d T d d t + d m d d t h fg
d m d d t = A d M w , i k c R ( P sat ( T d ) T d P op T s )
S h = k c d d D i , m = 2 + 0.6 R e d 1 / 2 S c 1 / 3
where Mw,i is the molecular weight of evaporation component, kc is the mass transfer coefficient, R is the general gas constant, Psat (Td) is the saturation pressure under Td, Pop is the operating pressure, Sh is Sherwood number, Di,m is steam diffusion coefficient, Sc is Schmidt number. As the temperature of water droplets exceeds the boiling temperature, the heat and mass transfer rates increase rapidly, and the evaporation rate is as follows [31]:
d ( d d ) d t = 4 λ g ρ d c p , g d d ( 1 + 0.3 R e d 1 / 2 P r d 1 / 3 ) ln 1 + c p , g ( T s T d ) h fg

2.2.4. Simulation Strategy

A simplification was made for the physical model that is described in Section 2.1. The process of pressurized atomization of cooling water in the spray tube was neglected, while the shape of the spray tube was kept to take the influence of the tube structure on hydrodynamics into consideration. The plain-orifice atomizer model was used to simulate the atomization process.
The boundary conditions were set as follows: (1) The steam inlet and outlet boundary conditions are mass flow inlet and pressure outlet, respectively. (2) The walls are defined as adiabatic and non-slip walls. (3) For the droplet phase, the outlet boundary is set as “escape” and the wall boundary is set as “reflect”.
The coupling effect of gas–liquid two-phase and the influence of temperature on latent heat were considered. The stochastic collision and coalescence of droplets were also considered. The Discrete Random Walk model was applied to reflect the influence of turbulence on the randomness of droplet motion. Two-Way Turbulence Coupling was set in the simulation to include the effect of particles on turbulent quantities. The velocity and pressure fields were solved using the standard k-ε turbulence model and the Coupled method. The standard wall functions were applied for the near-wall treatment [23]. ANSYS Fluent software (version 2021 R1) was used to carried out the simulation processes. The velocity field was firstly simulated to obtain a stable flow field. Then the water droplets were added for further calculation.
The operating conditions in the simulations were obtained from the plant data, as listed in Table 1. The industrial circulating fluidized bed boiler participates in the peak regulation, making the operating parameters such as the combustion load, the steam flow rate, and temperature change continuously. The water flow rate also changes according to the need for desuperheating to meet the steam quality requirements for turbine power generation. The operating conditions in Table 1 were selected at different times, thus exhibiting irregularity. On the one hand, the comparison between simulation results and plant data can be carried out to verify the model. On the other hand, the performance of the industrial desuperheater can be studied, which can better reflect the desuperheater characteristics in actual operating conditions and provide effective guidance.
The physical properties have great effect on heat and mass transfer processes. It is not appropriate to use physical properties at normal atmospheric temperature. In this work, the physical properties of the superheated steam and the water droplets were set to the physical properties at their inlet temperatures. Taking case 1 as an example, the physical properties of steam at 721.55 K and those of water at 476.1 K are presented in Table 2 according to reference [32].

2.3. Grid Independence Test

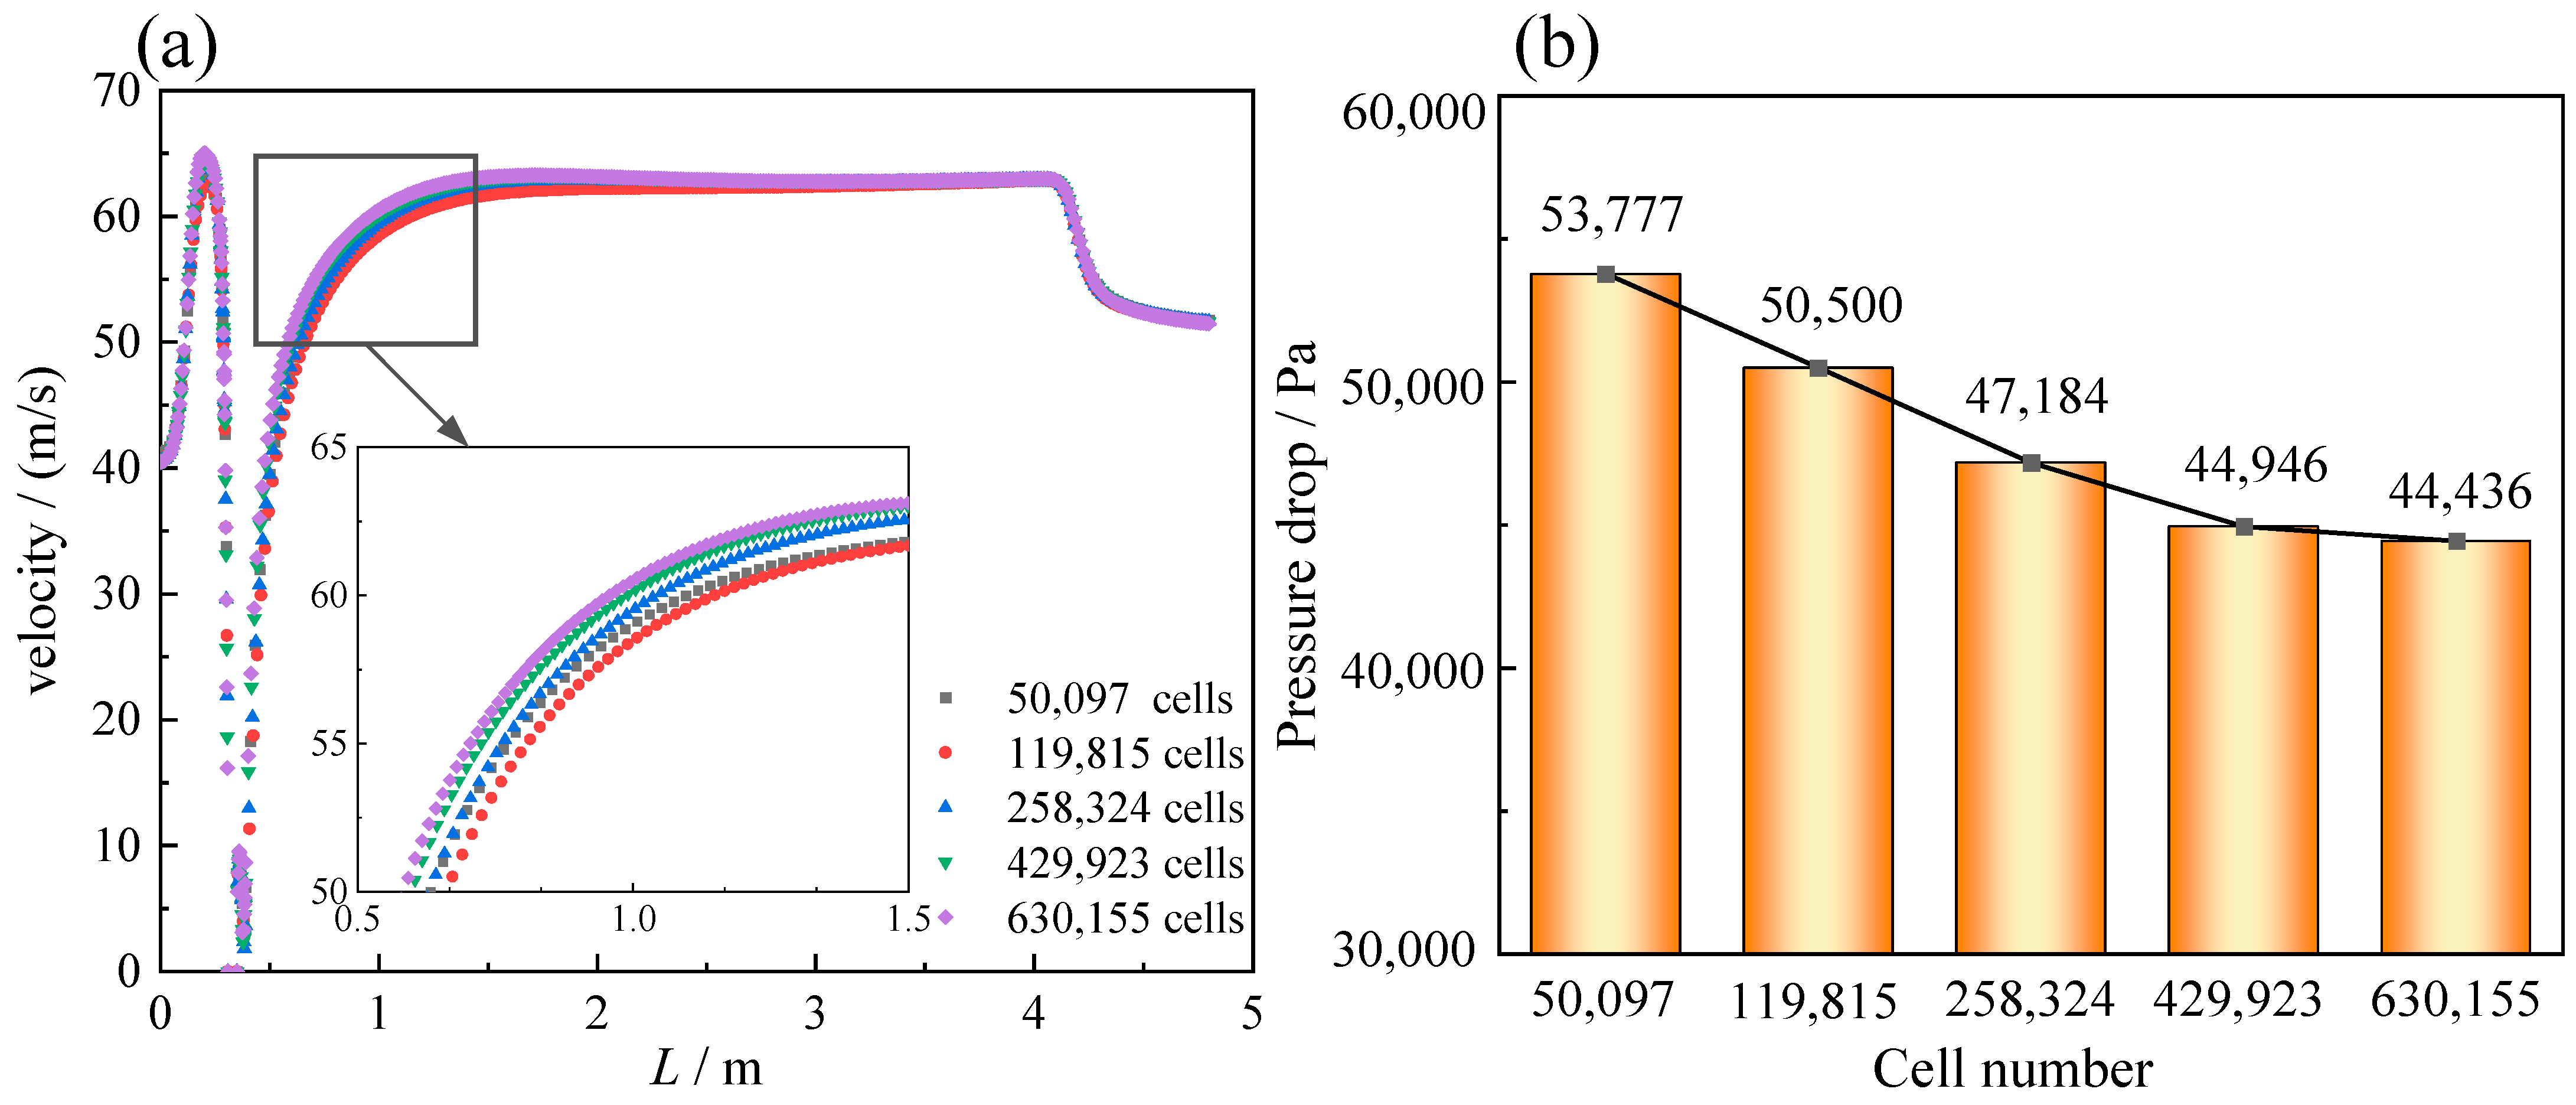
The flow domain was discretized by ANSYS meshing (version 2021 R1). As shown in Figure 4a, hexahedral and tetrahedral meshes were created in different flow regions to obtain high mesh quality and simulation accuracy. A grid independence test was applied to determine the optimal cell number for discretization. Cases with different cell numbers, including 50,097, 119,815, 258,324, 429,923, and 630,155 cells, were simulated under the operating conditions of case 1 in Table 1.
Figure 5a shows the velocity profiles of the central line (y = 0, z = 0, 0 ≤ x ≤ 4.8 m) calculated under different cell numbers. With the increase in cell number, more detailed information of the flow field can be captured. Cases with 429,923 cells and 630,155 cells provide similar velocity distributions. Additionally, as shown in Figure 5b, the pressure drop of cases with 50,097, 119,815, 258,324, 429,233, and 630,155 cells are 53,777 Pa, 50,500 Pa, 47,184 Pa, 44,946 Pa, and 44,436 Pa, respectively. Compared to case with 630,155 cells, the relative errors for cases with 50,097, 119,815, 258,324, and 429,233 cells are 21.0%, 13.6%, 6.2%, and 1.1%. In order to ensure the accuracy of the simulation results and save computing resources, the mesh with 429,923 cells is selected (Figure 4b). The maximum skewness of the generated mesh is 0.86 and the average skewness is 0.24.

2.4. Model Validation

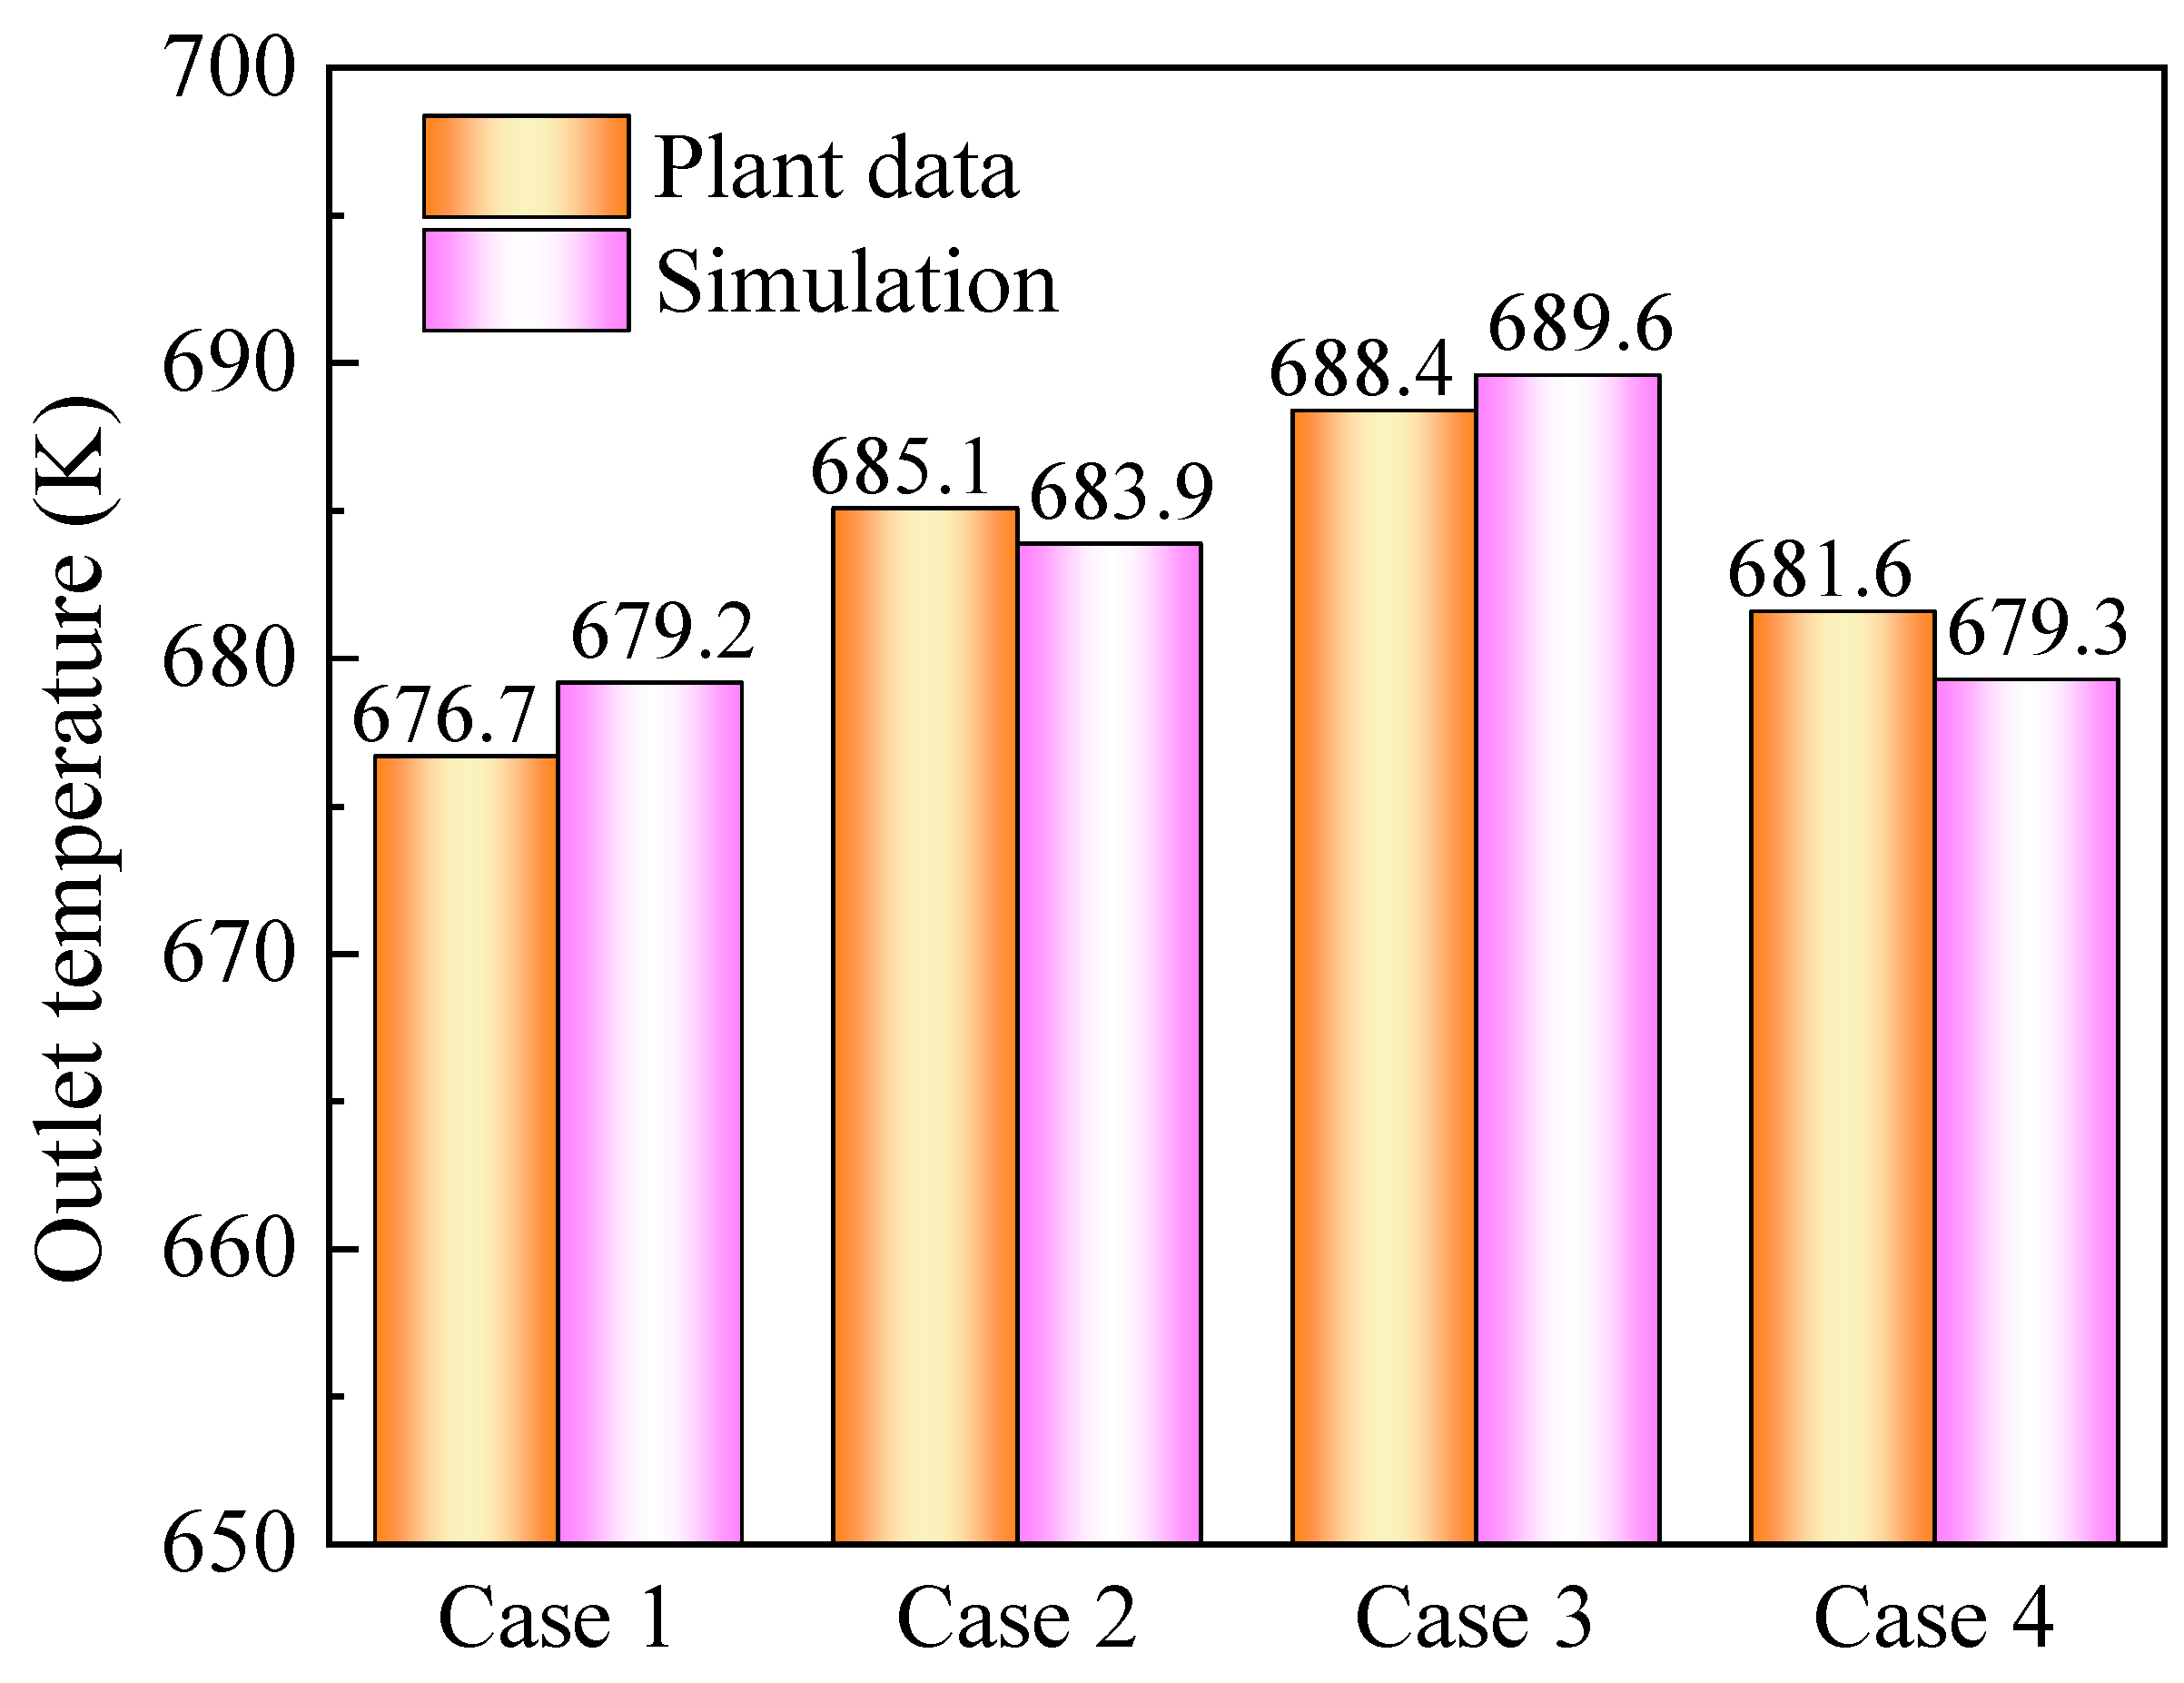
The results of outlet temperature obtained by the numerical simulation are compared with the plant data to verify the accuracy of the CFD model and numerical method for this work. As shown in Figure 6, the maximum temperature difference between plant data and simulation is 2.5 K in case 1, with the relative error of 0.37%. It is evident that the relative error is small and the predicted outlet temperature is reliable, which could prove that the numerical model and method used in this study are suitable.

3. Results and Discussion

3.1. Analysis on Simulation Results of Case 2

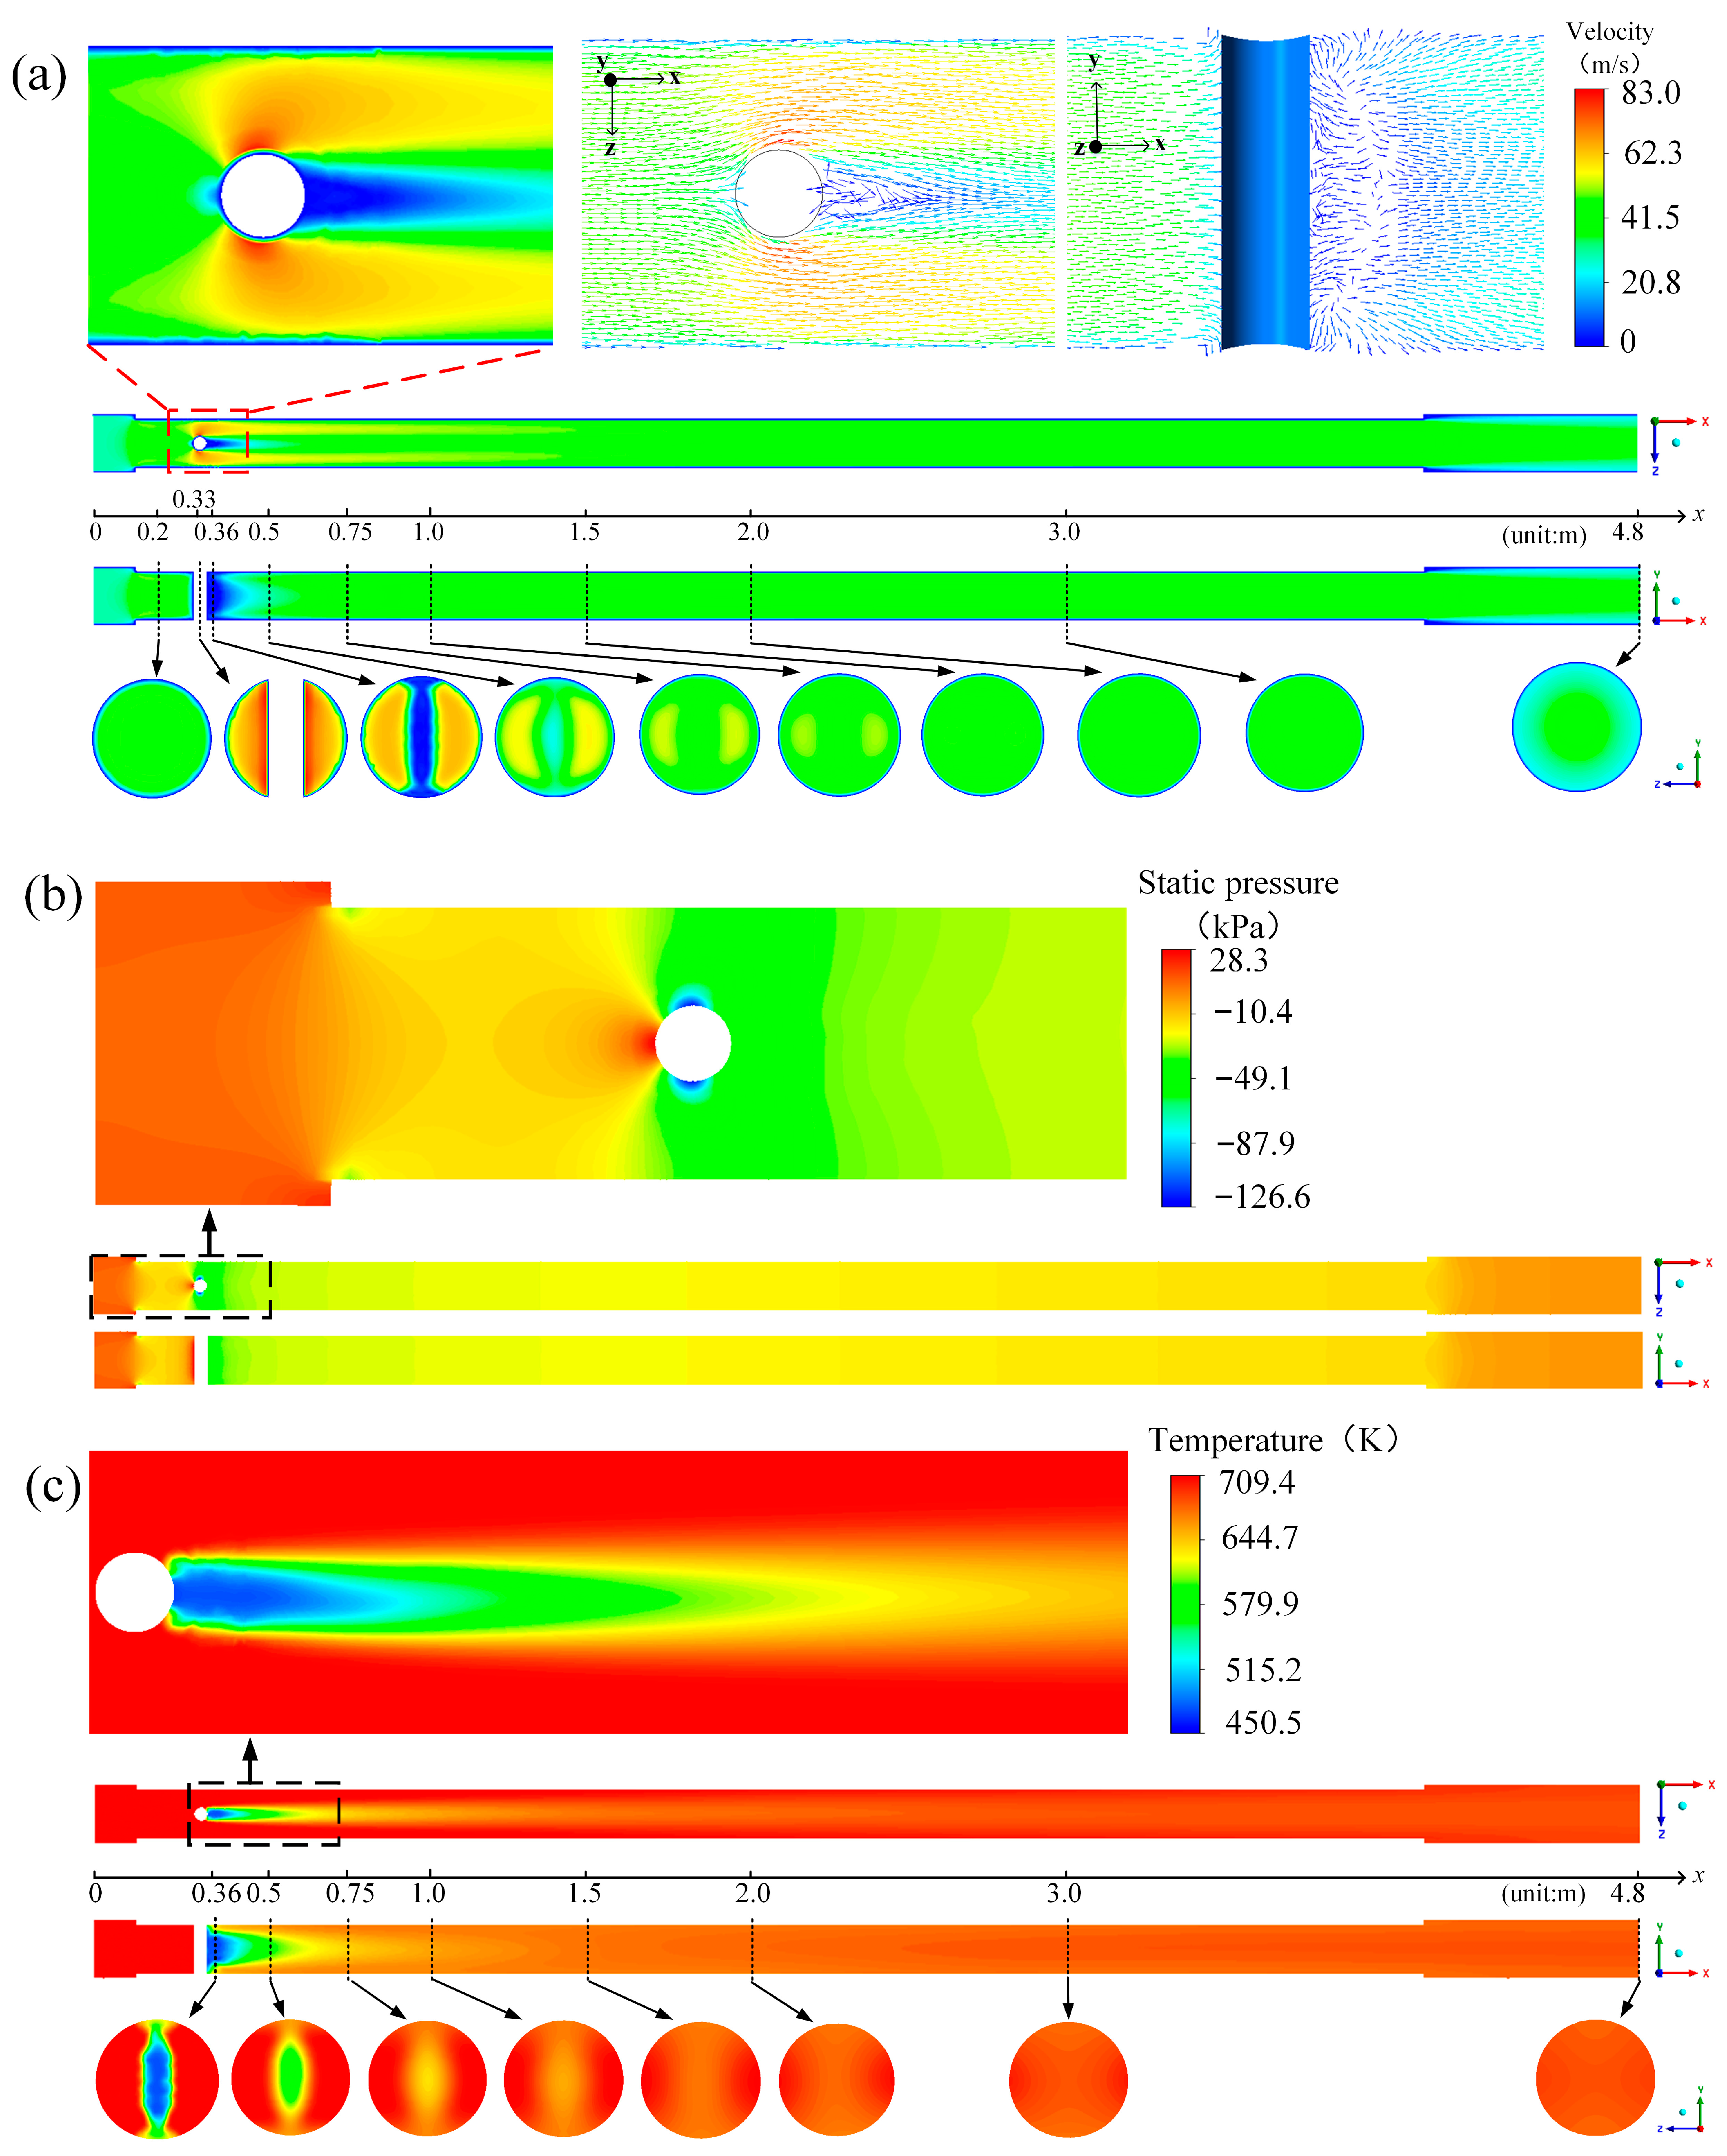
Figure 7 and Figure 8 show the simulation results of case 2. As illustrated in Figure 7a, the spray tube structure exhibits great influence on the flow characteristics, resulting in higher velocity on both sides of the spray tube and lower velocity behind the spray tube. The tube structure also causes a higher pressure drop near the spray tube (Figure 7b), leading to the reverse flow of the fluid behind the tube (shown in velocity vectors in Figure 7a). Consequently, the turbulence and the local reverse flow pattern increase the complexity of heat and mass transfer process between the steam and droplets. As the turbulent mixing progresses, the downstream velocity distribution of steam tends to be more uniform.
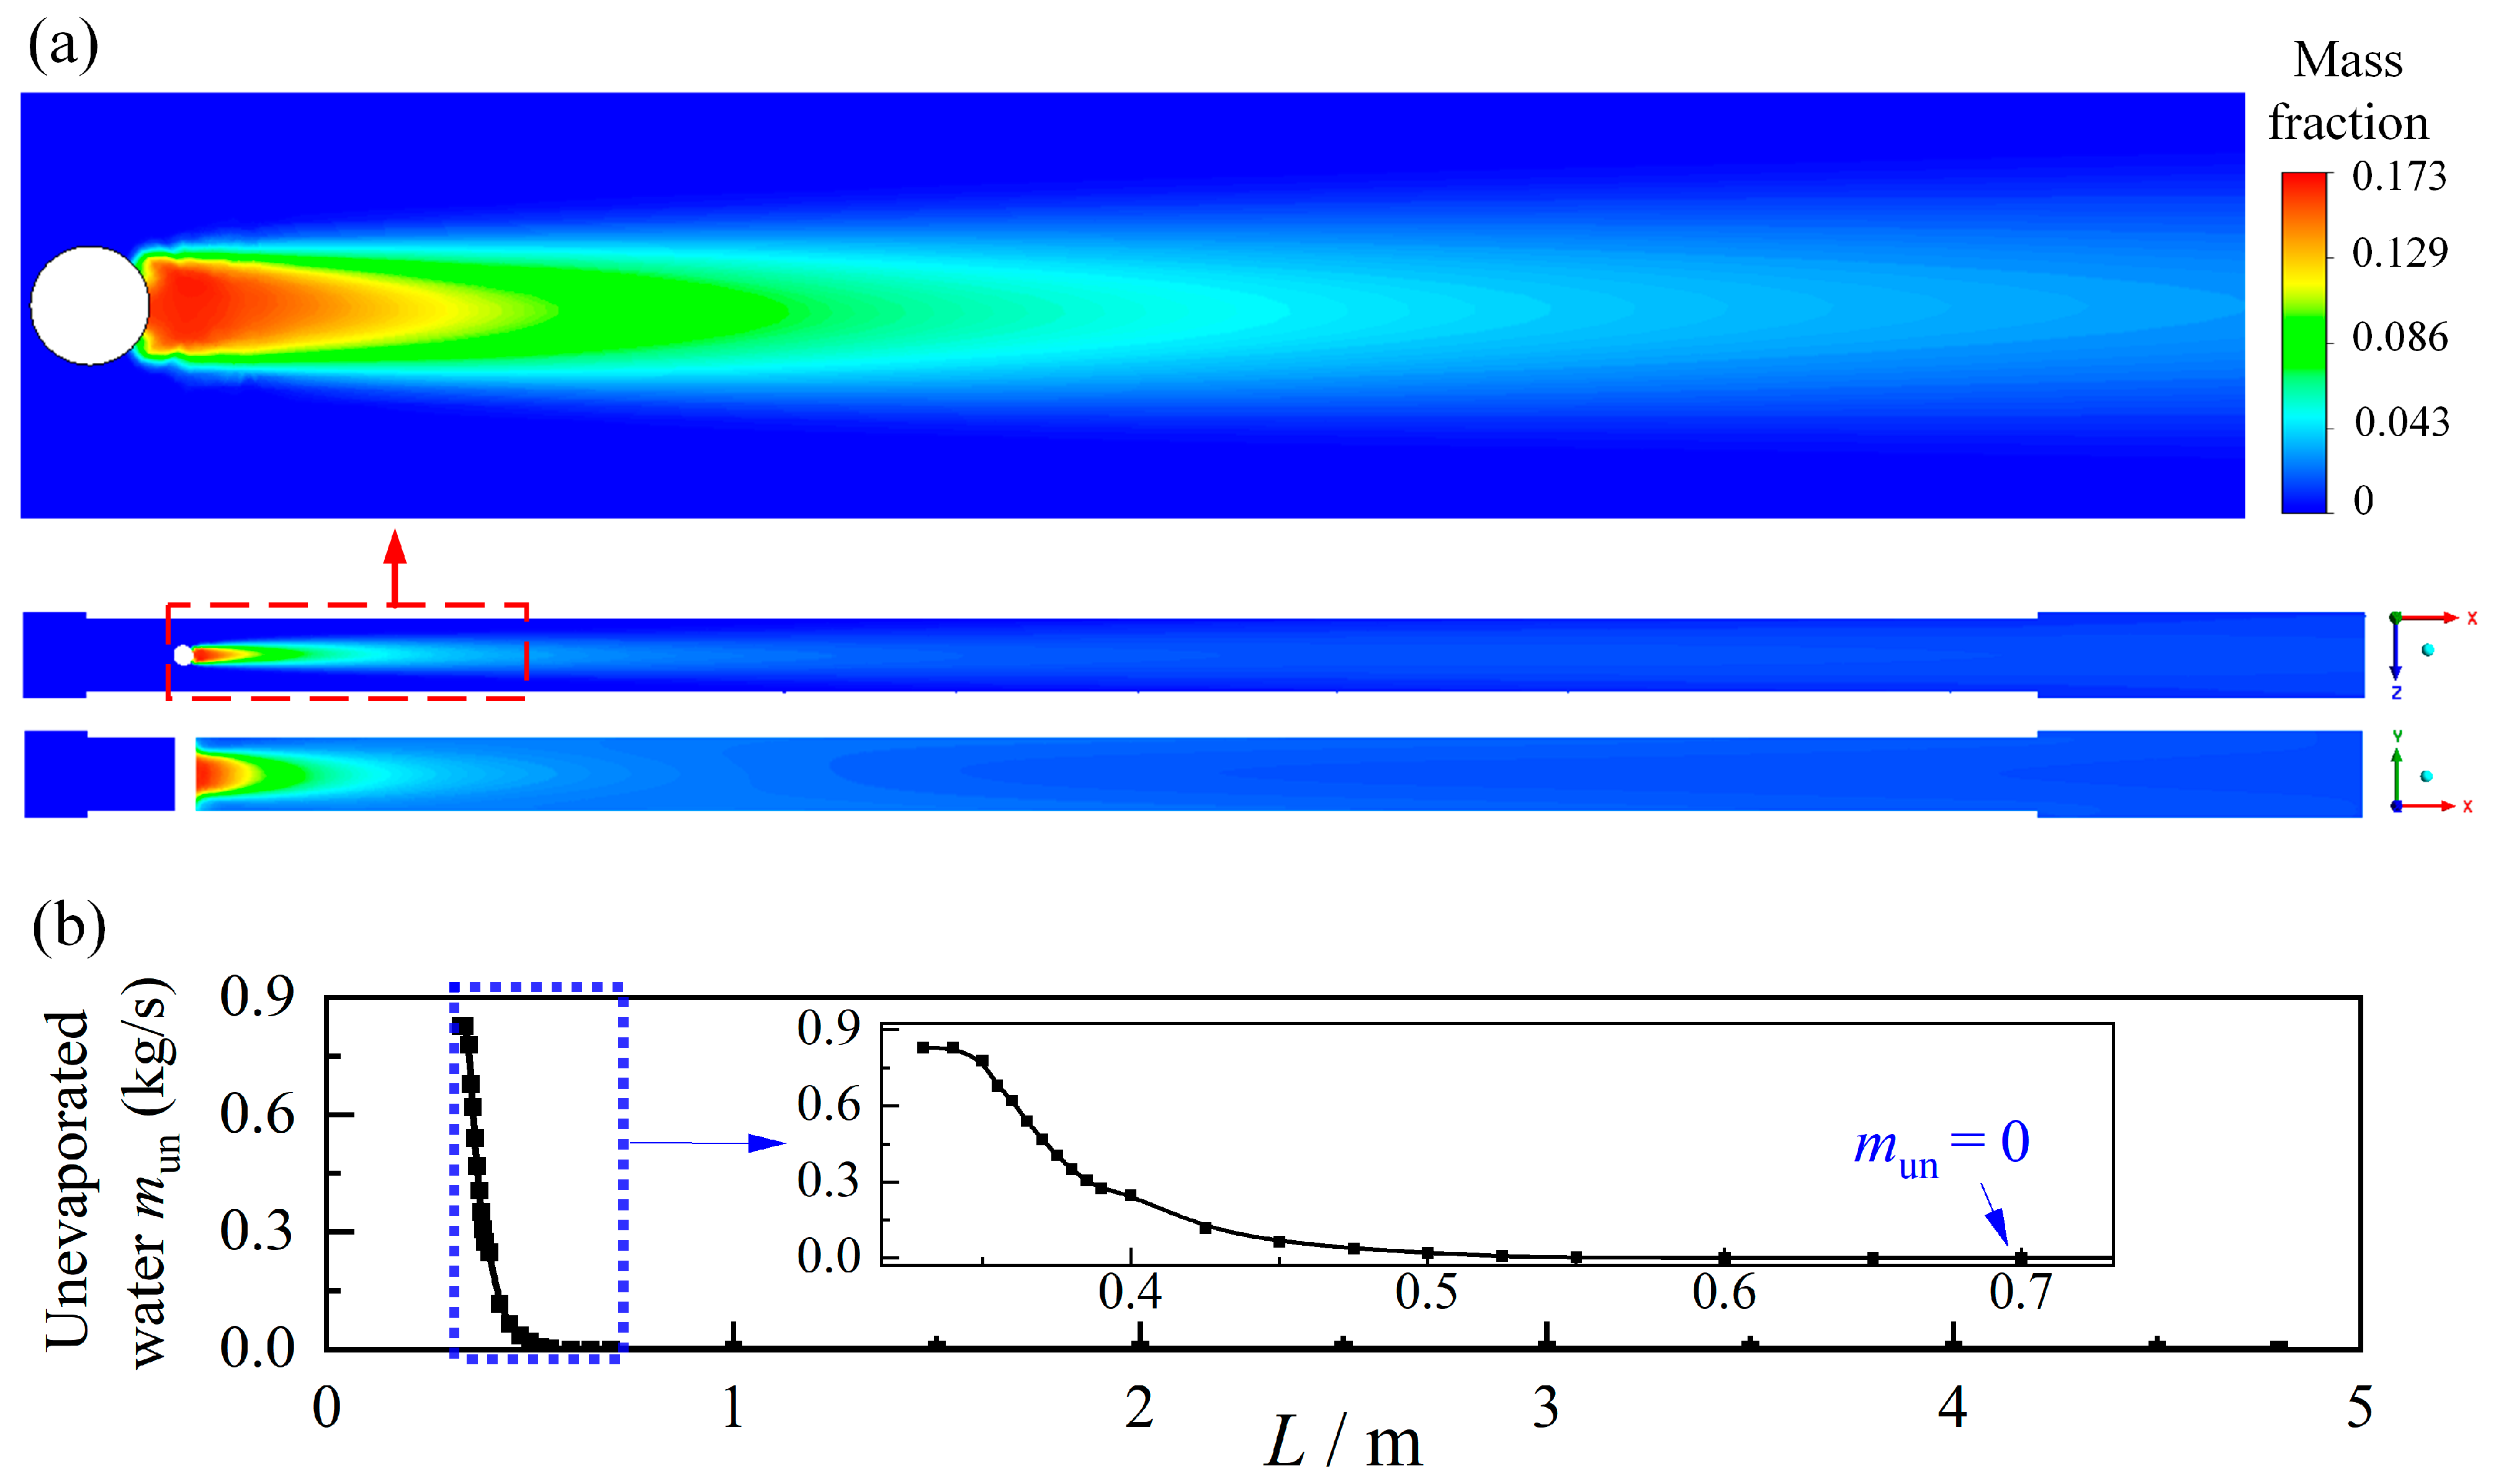
As shown in Figure 7c, the flow area behind the spray tube presents the lowest temperature and largest temperature gradient. Due to the turbulent mixing and evaporation processes, the cross-sectional temperature difference gradually decreases. The temperature is relatively uniform at the outlet. Figure 8a shows the contours of mass fraction of water vapor (H2O(g)) formed by evaporation, whose characteristic is particularly similar to the temperature distribution in Figure 7c. It is evident that the spray evaporation process corresponds to the cooling process of superheated steam.
The mass flow rate of water droplets decreases along the flow direction due to the evaporation process. The concentration of droplets is higher near the tube orifices than other parts of the flow domain, so that the H2O(g) mass fraction there is higher (Figure 8a), which is consistent with the results obtained by Ebrahimian V and Gorji-Bandpy M [10]. As shown in Figure 8b, the mass flow rate of unevaporated water (mun) gradually decreases owing to evaporation, and complete evaporation occurs around 3.5 m from the spray tube orifices.

3.2. Influence of Orifice Dimensions

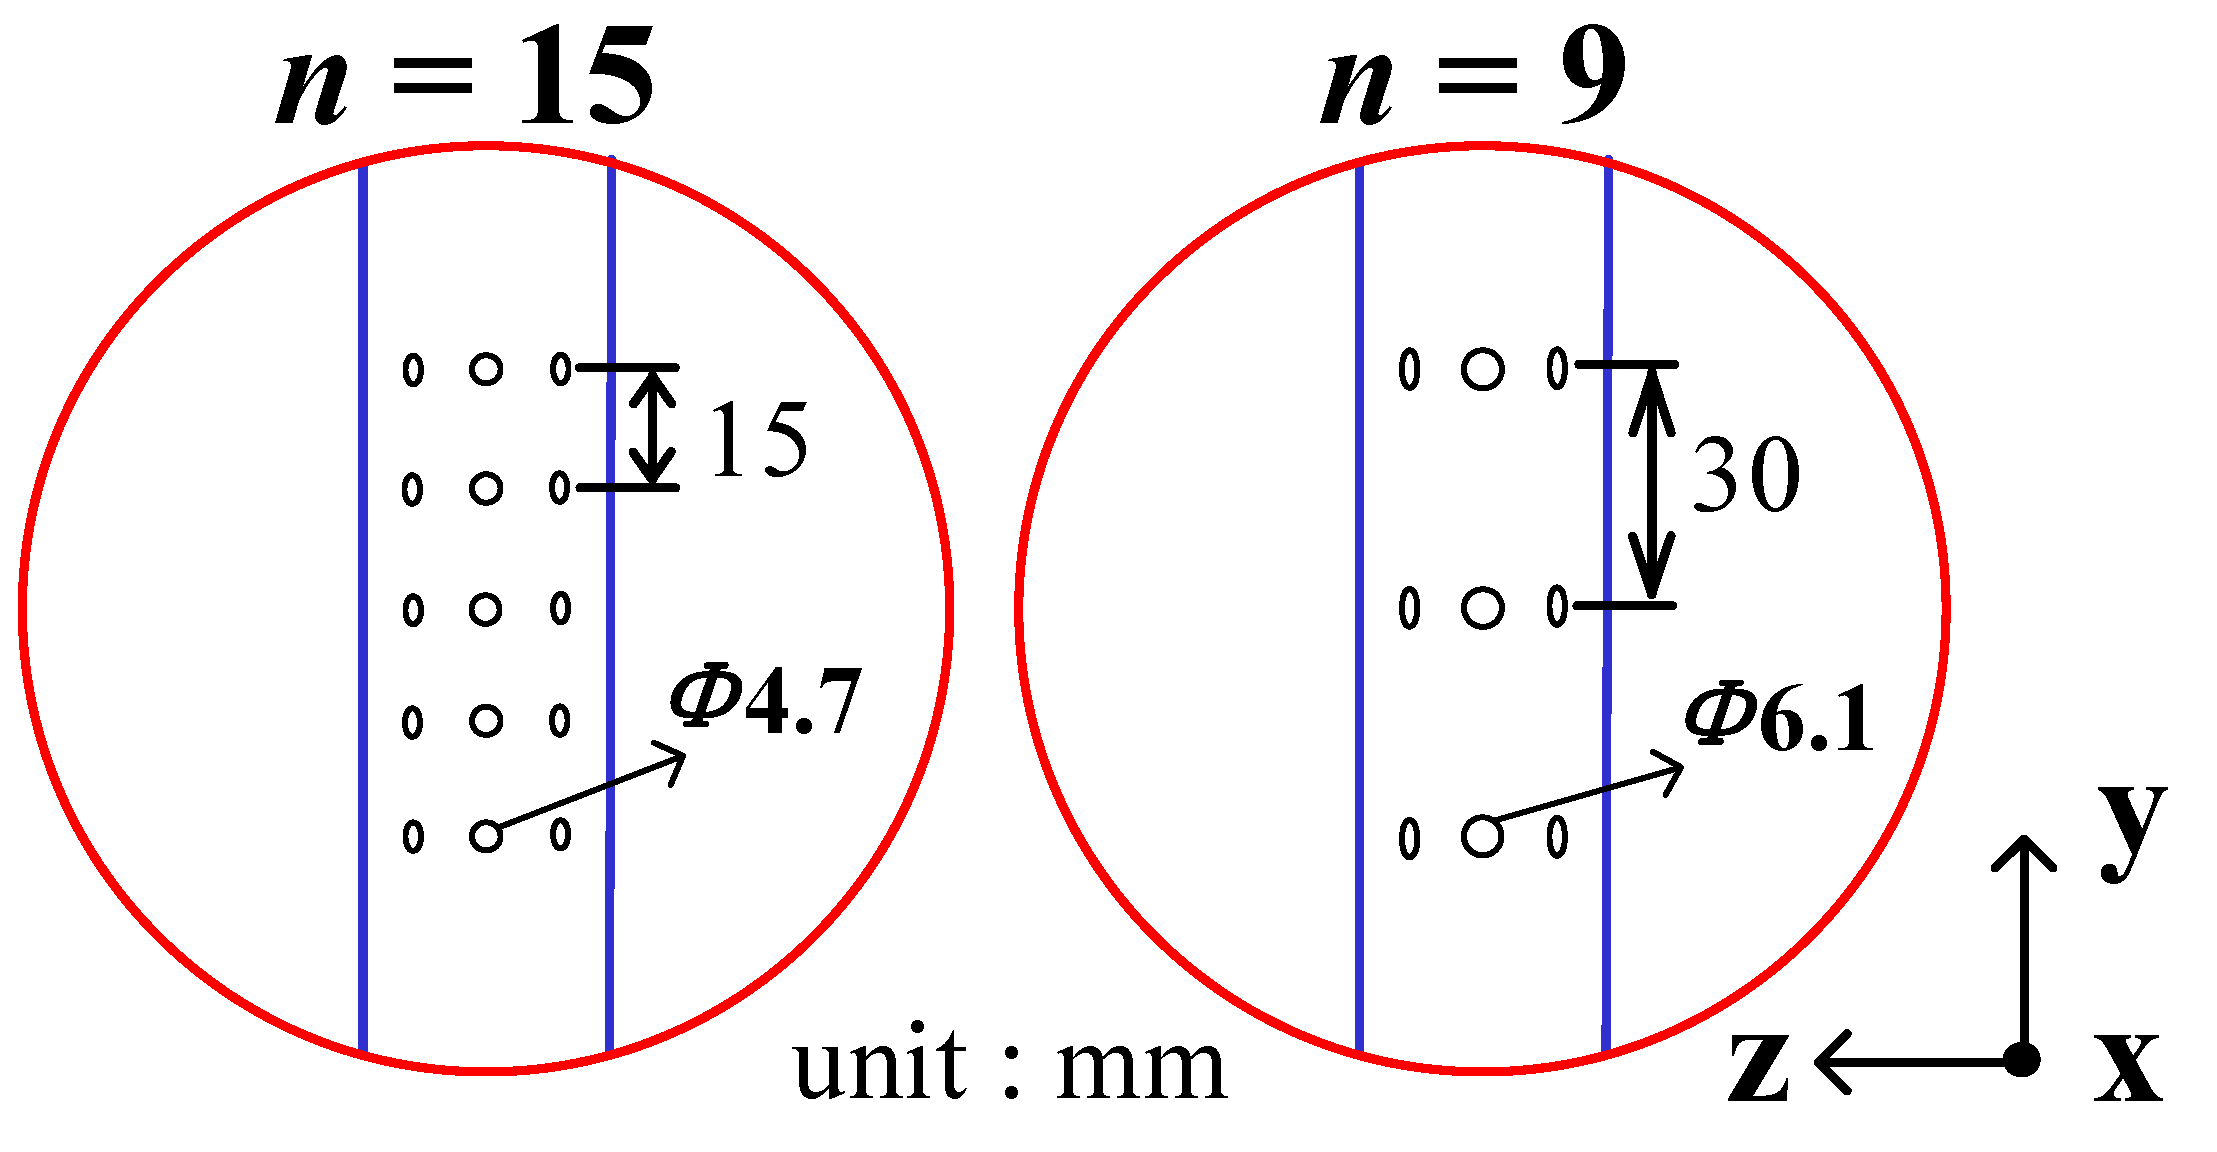
The models with different orifice dimensions were established, including 21 orifices with a diameter of 4 mm each (Figure 3), 15 orifices with a diameter of 4.7 mm each, and 9 orifices with a diameter of 6.1 mm each (Figure 9). The total opening area of the cases was the same to ensure the same initial injection speed of the water. The operating conditions are the same as case 3 in Table 1.
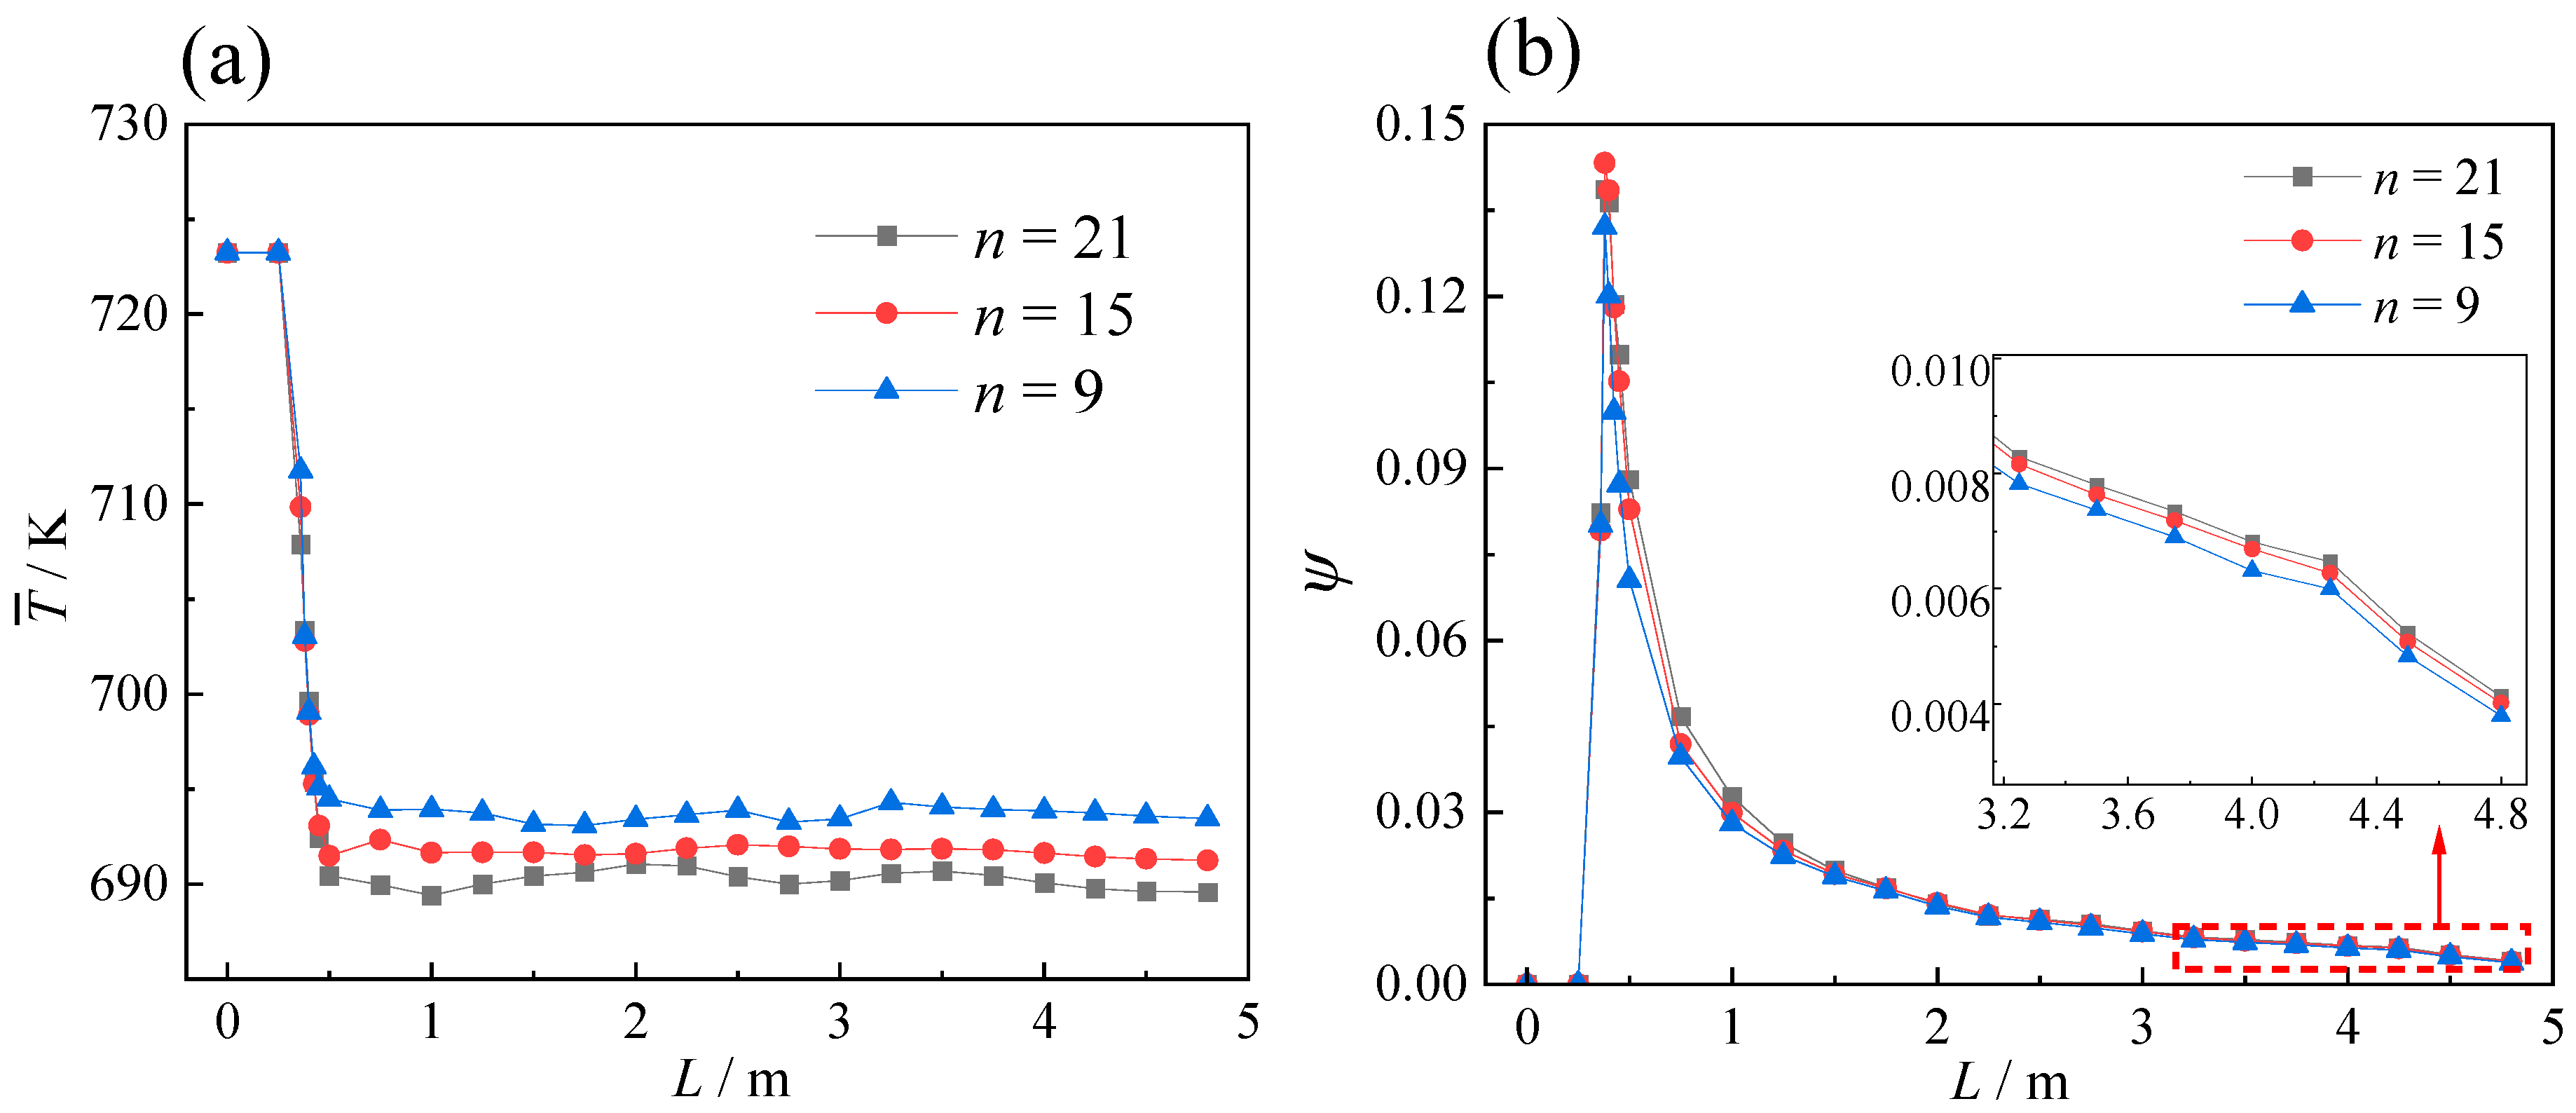
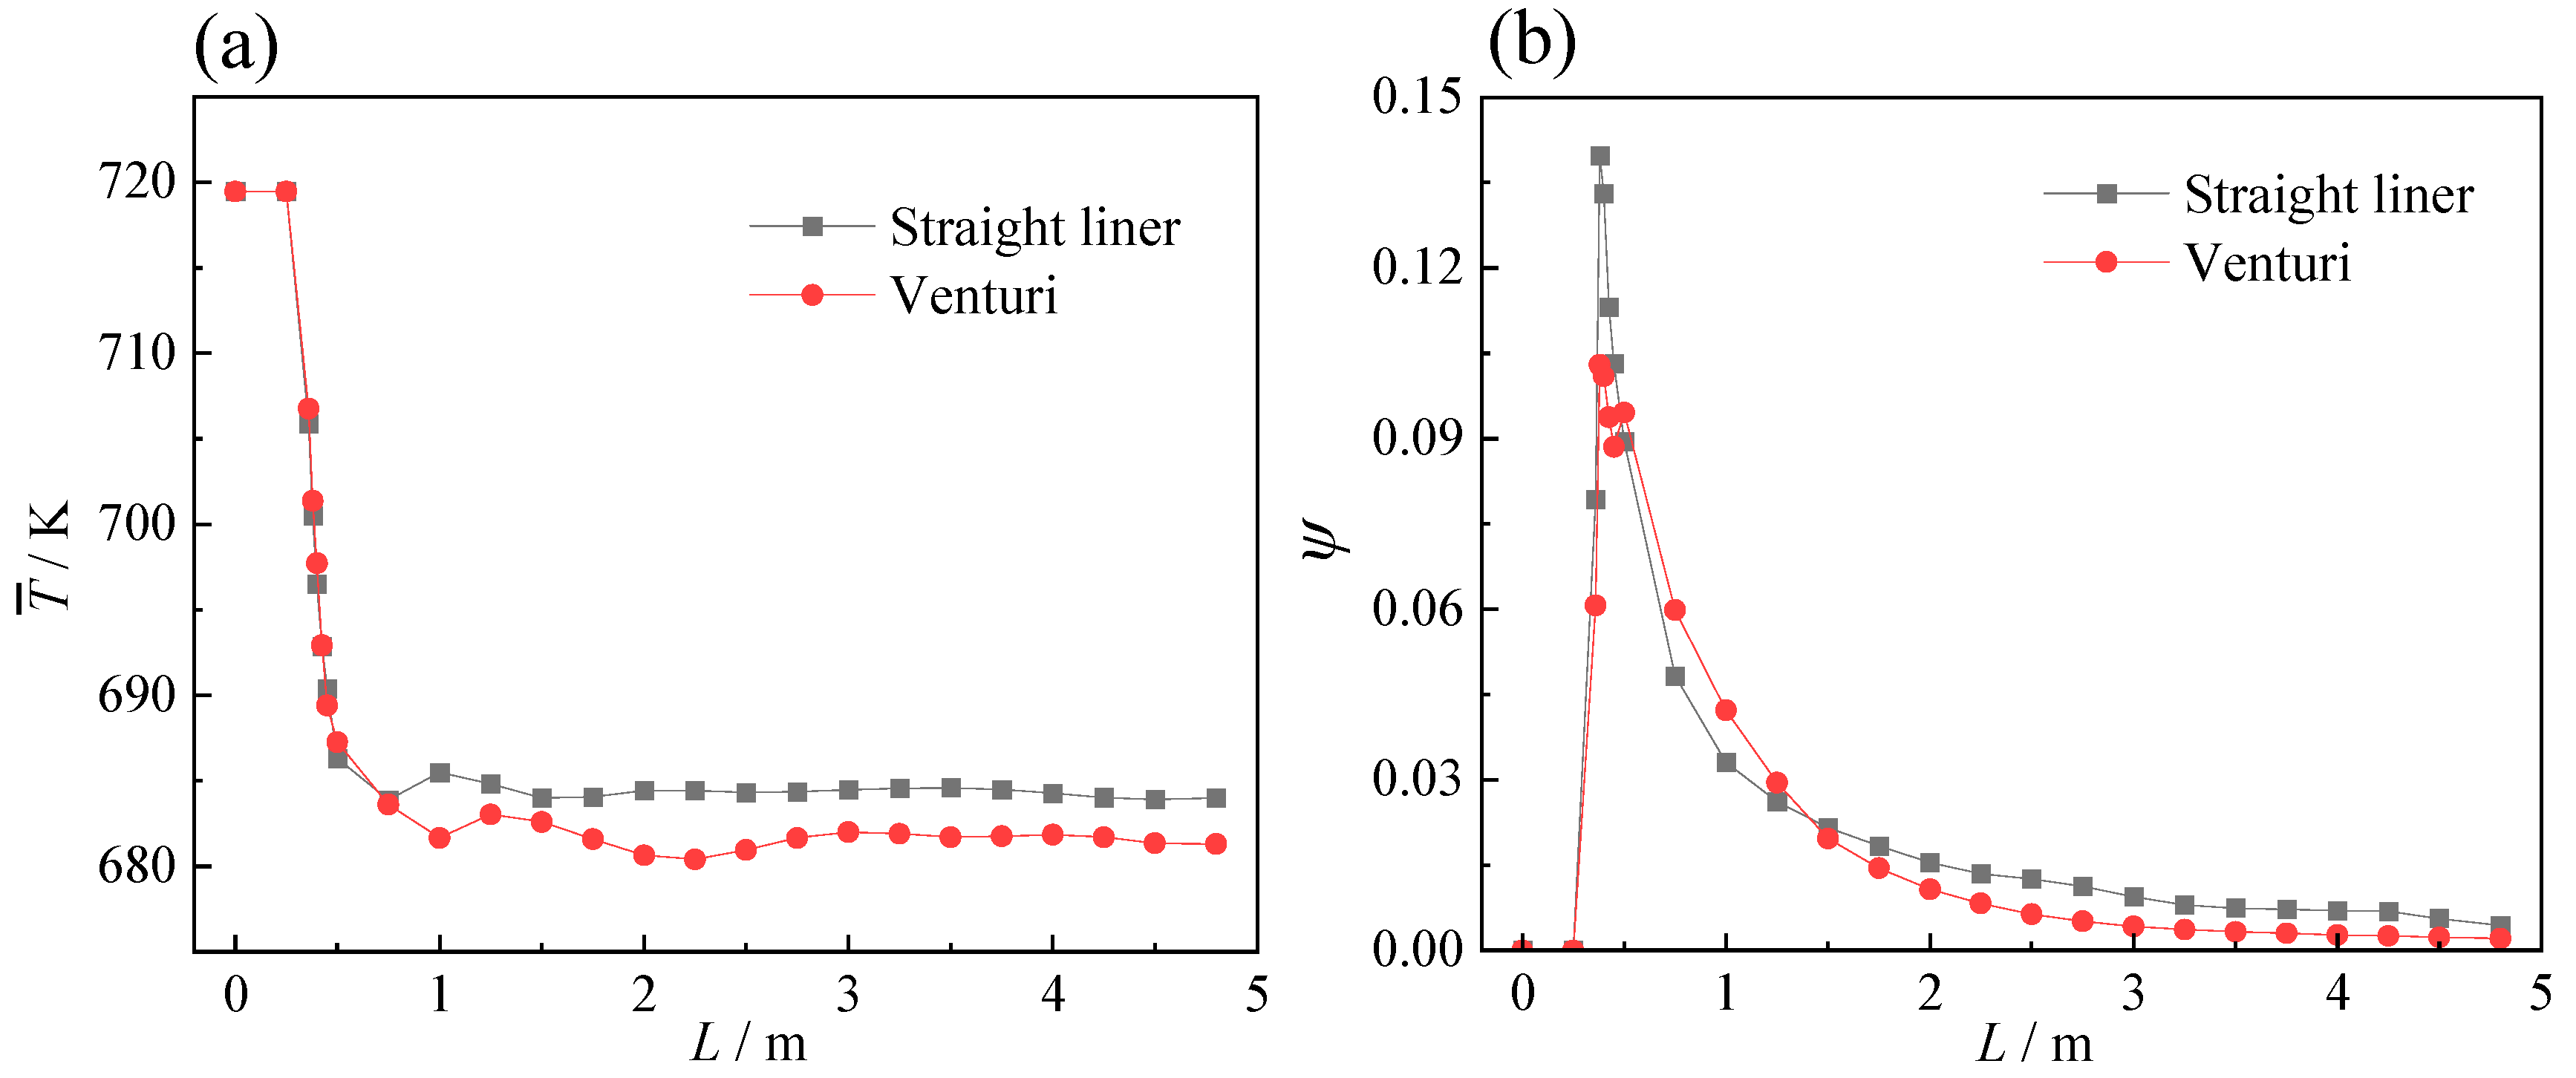
The temperature non-uniformity coefficient ψ is defined based on the deviation between the temperature of each sampling unit on the cross-section and the average temperature of the cross-section and defined as follows [11]:
ψ = i = 0 N T i T ¯ 2 N 1 / 2 / T ¯
where Ti is the sampling unit temperature, T ¯ is the cross-sectional average temperature, and N is the number of sampling units. The larger the value of ψ, the more uneven the temperature distribution.
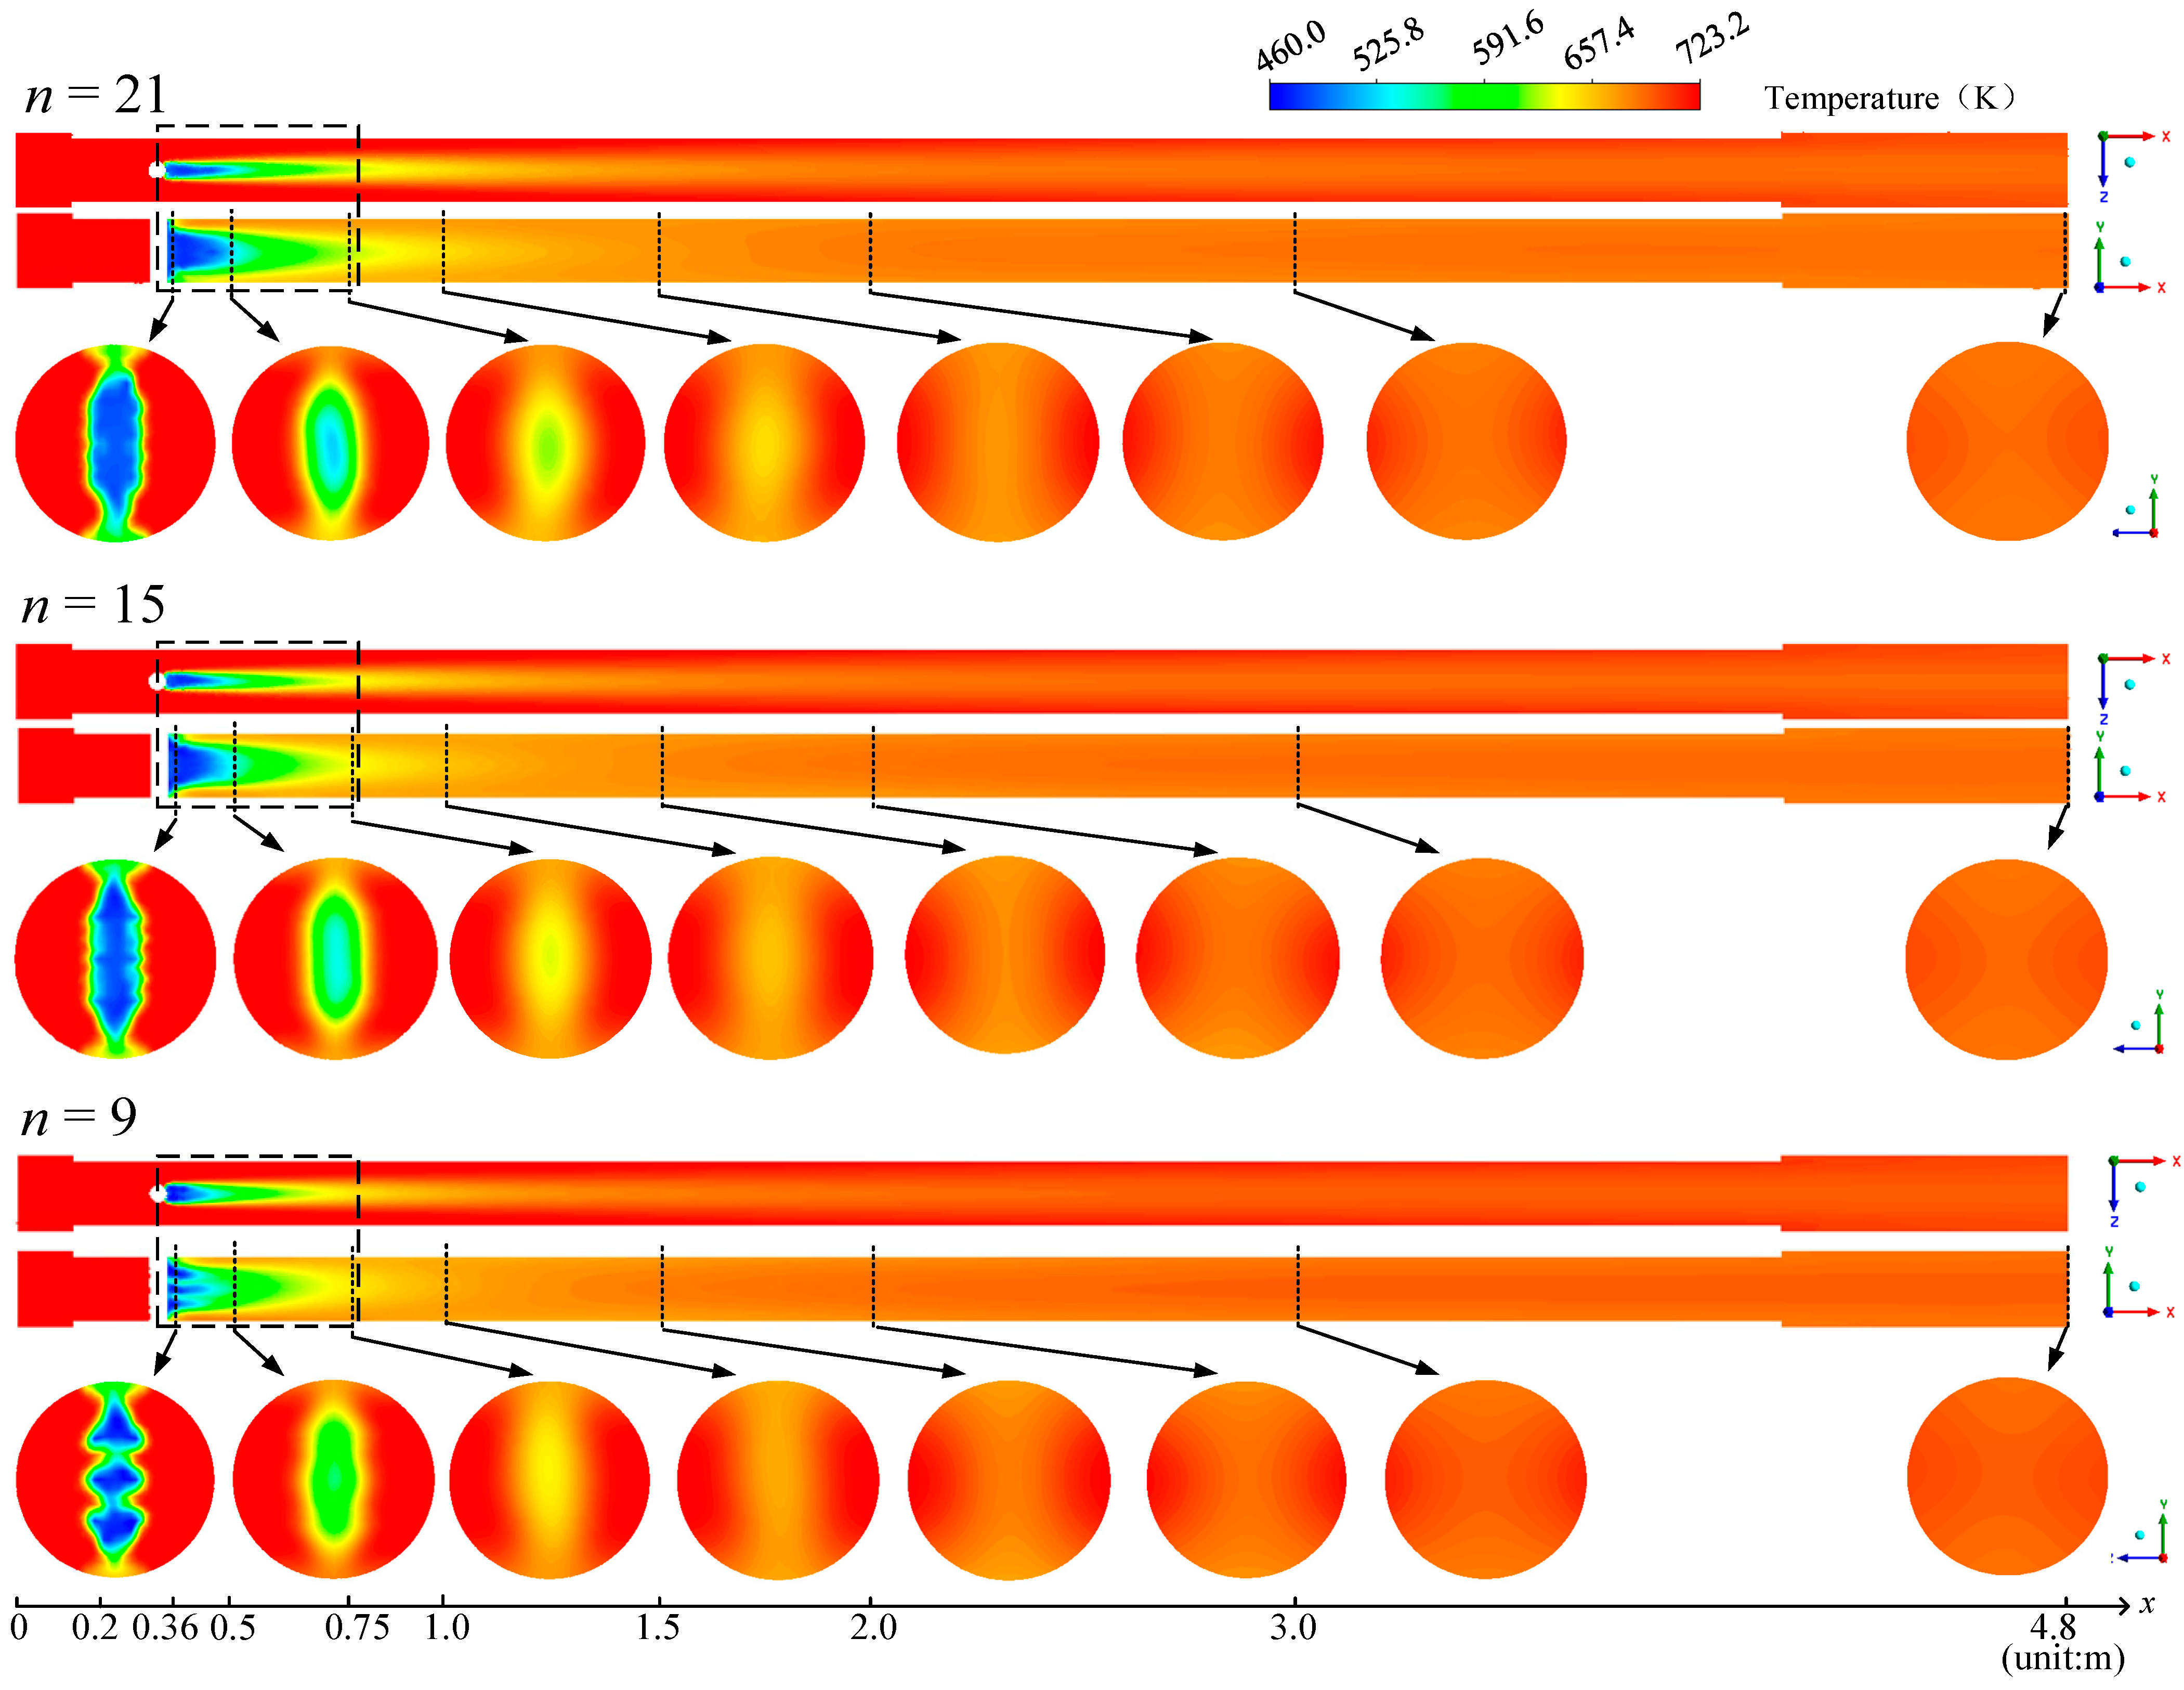
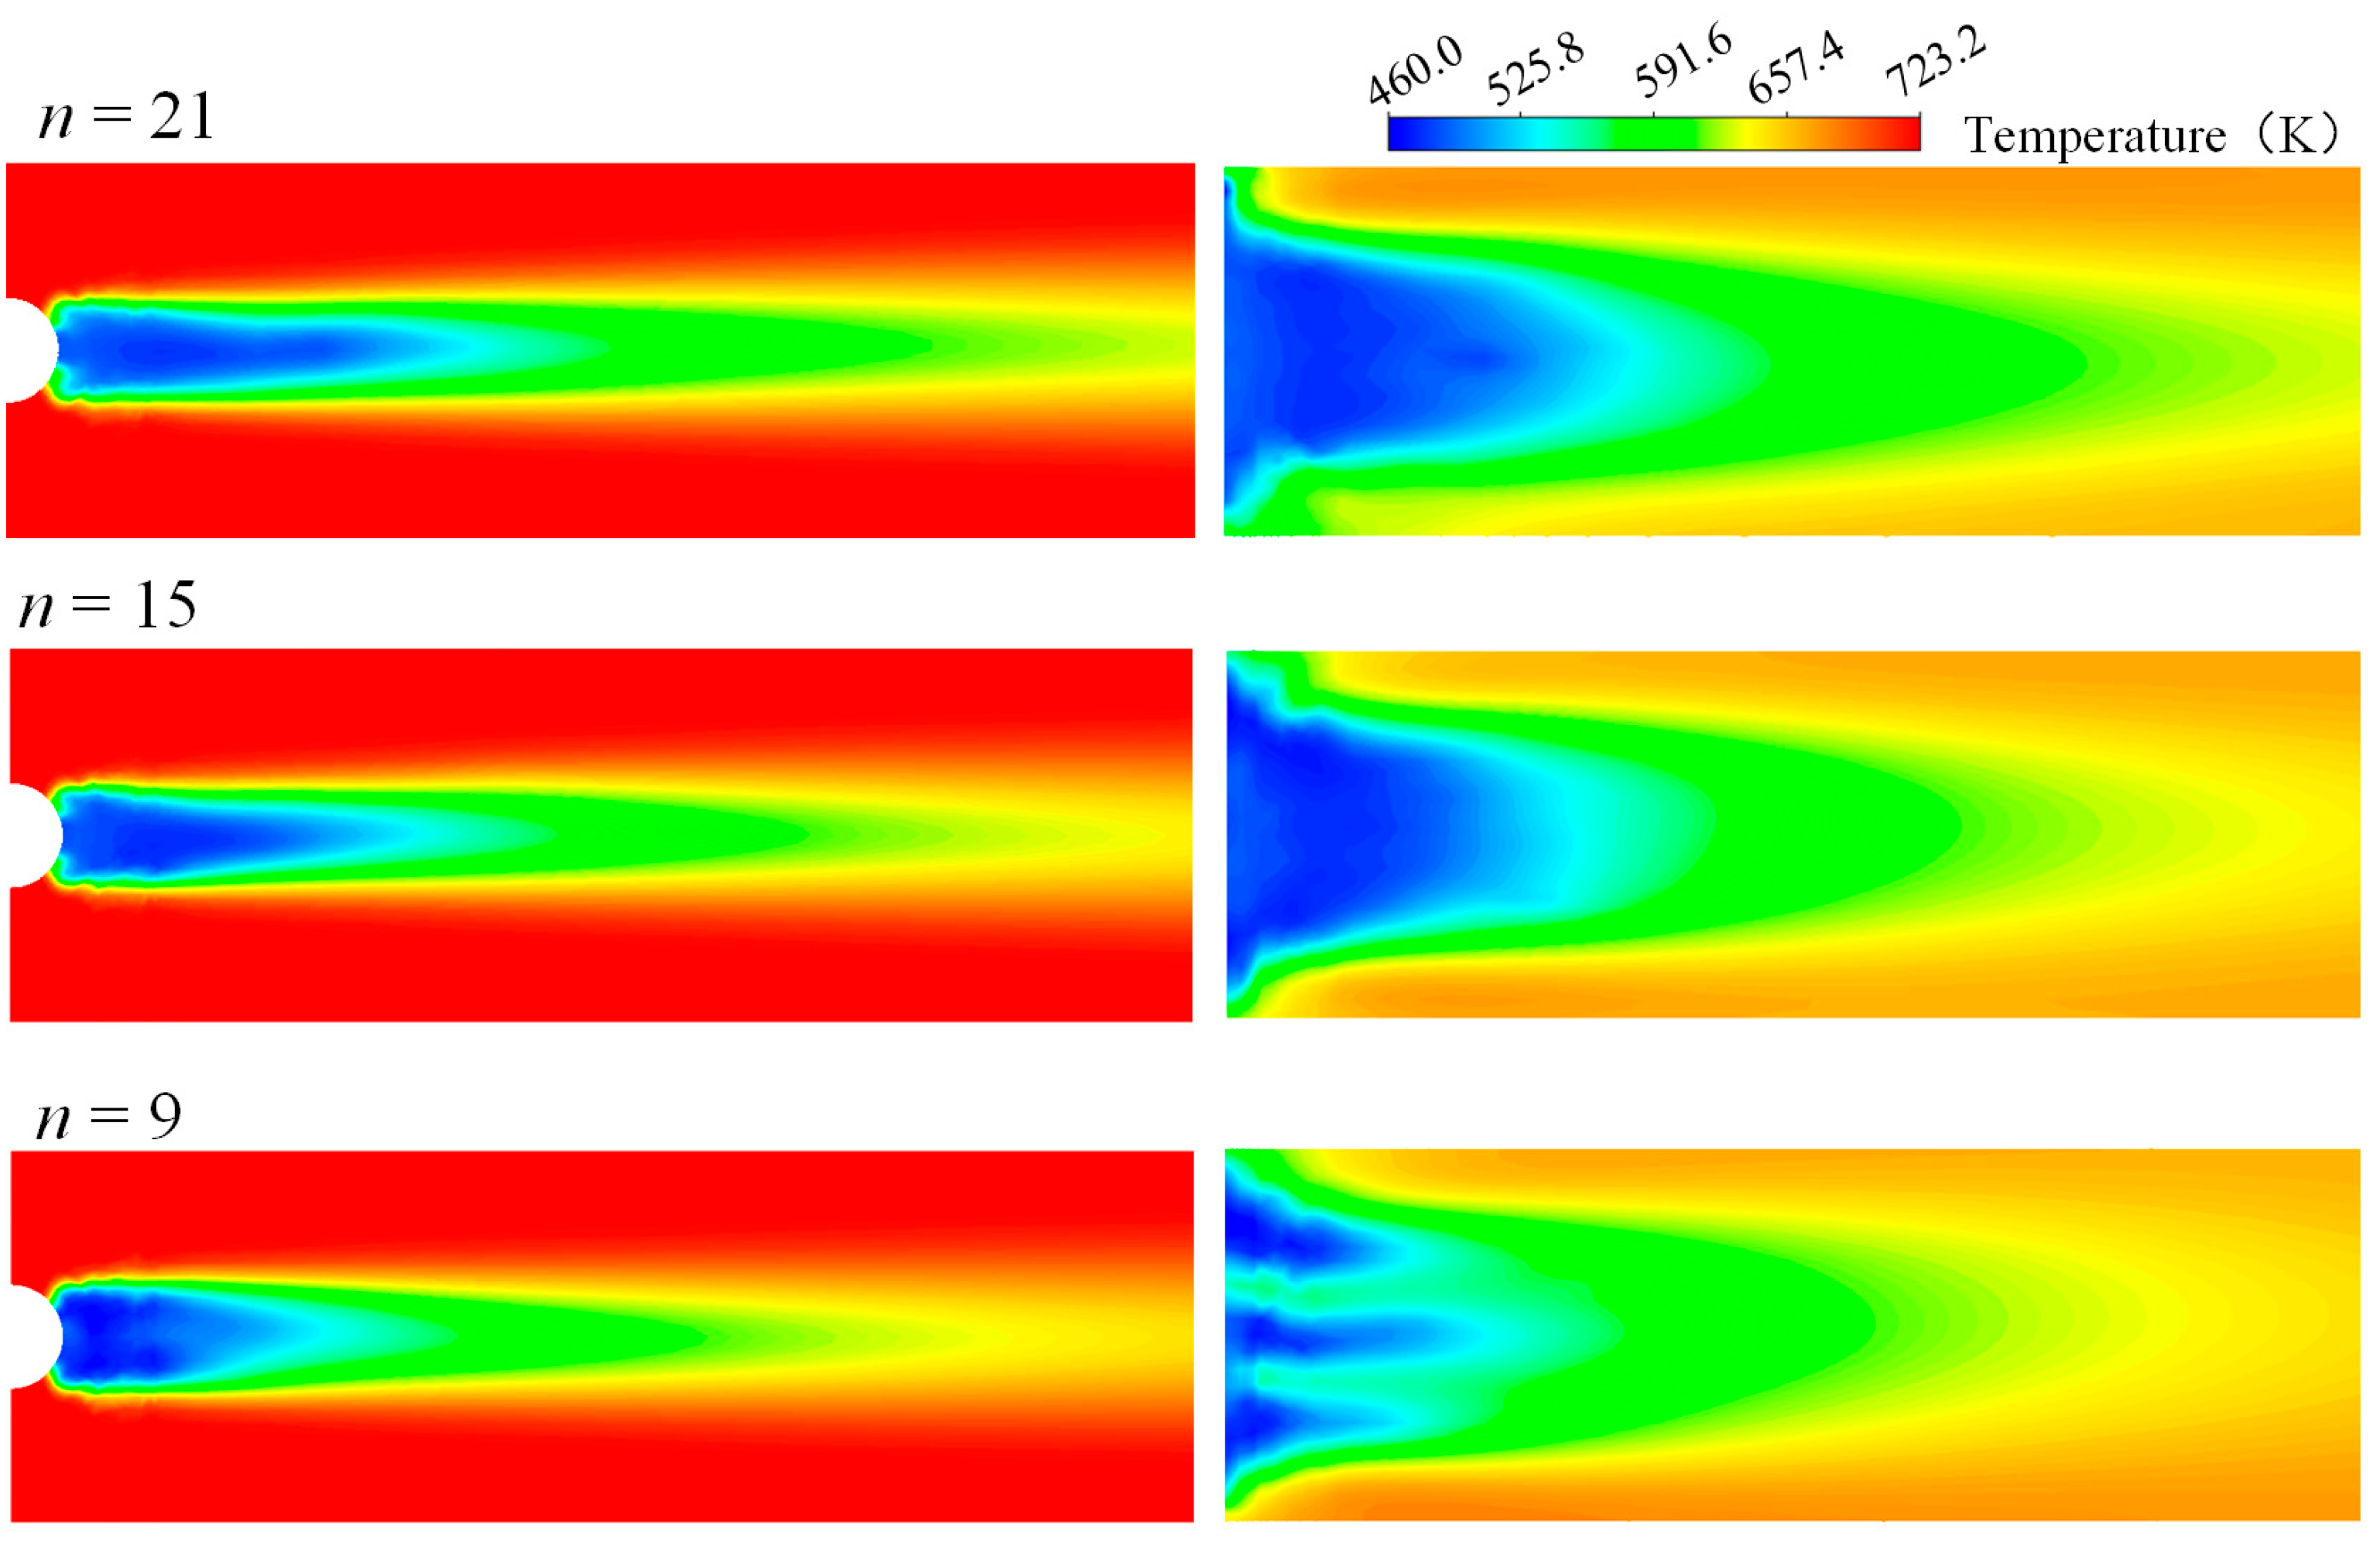
Figure 10 shows the temperature distributions at planes y = 0 and z = 0 and cross-sections along the flow direction under different orifice dimensions. Figure 11 shows the local temperature distributions around the spray tube. The temperature in the central area is lower owing to the droplet evaporation, while the temperature near the wall is higher. Due to the influence of orifice dimensions on the atomization process of the cooling water, the droplet size, droplet mass distribution, and droplet size distribution are different for the studied three cases. Therefore, particular distinctions occur at the regime close to the spray tube, though the downstream temperature contours of different orifice dimensions show similar distribution characteristics. As the turbulent mixing and evaporation proceed, the temperature distributions downstream of the desuperheater tend to be more uniform.
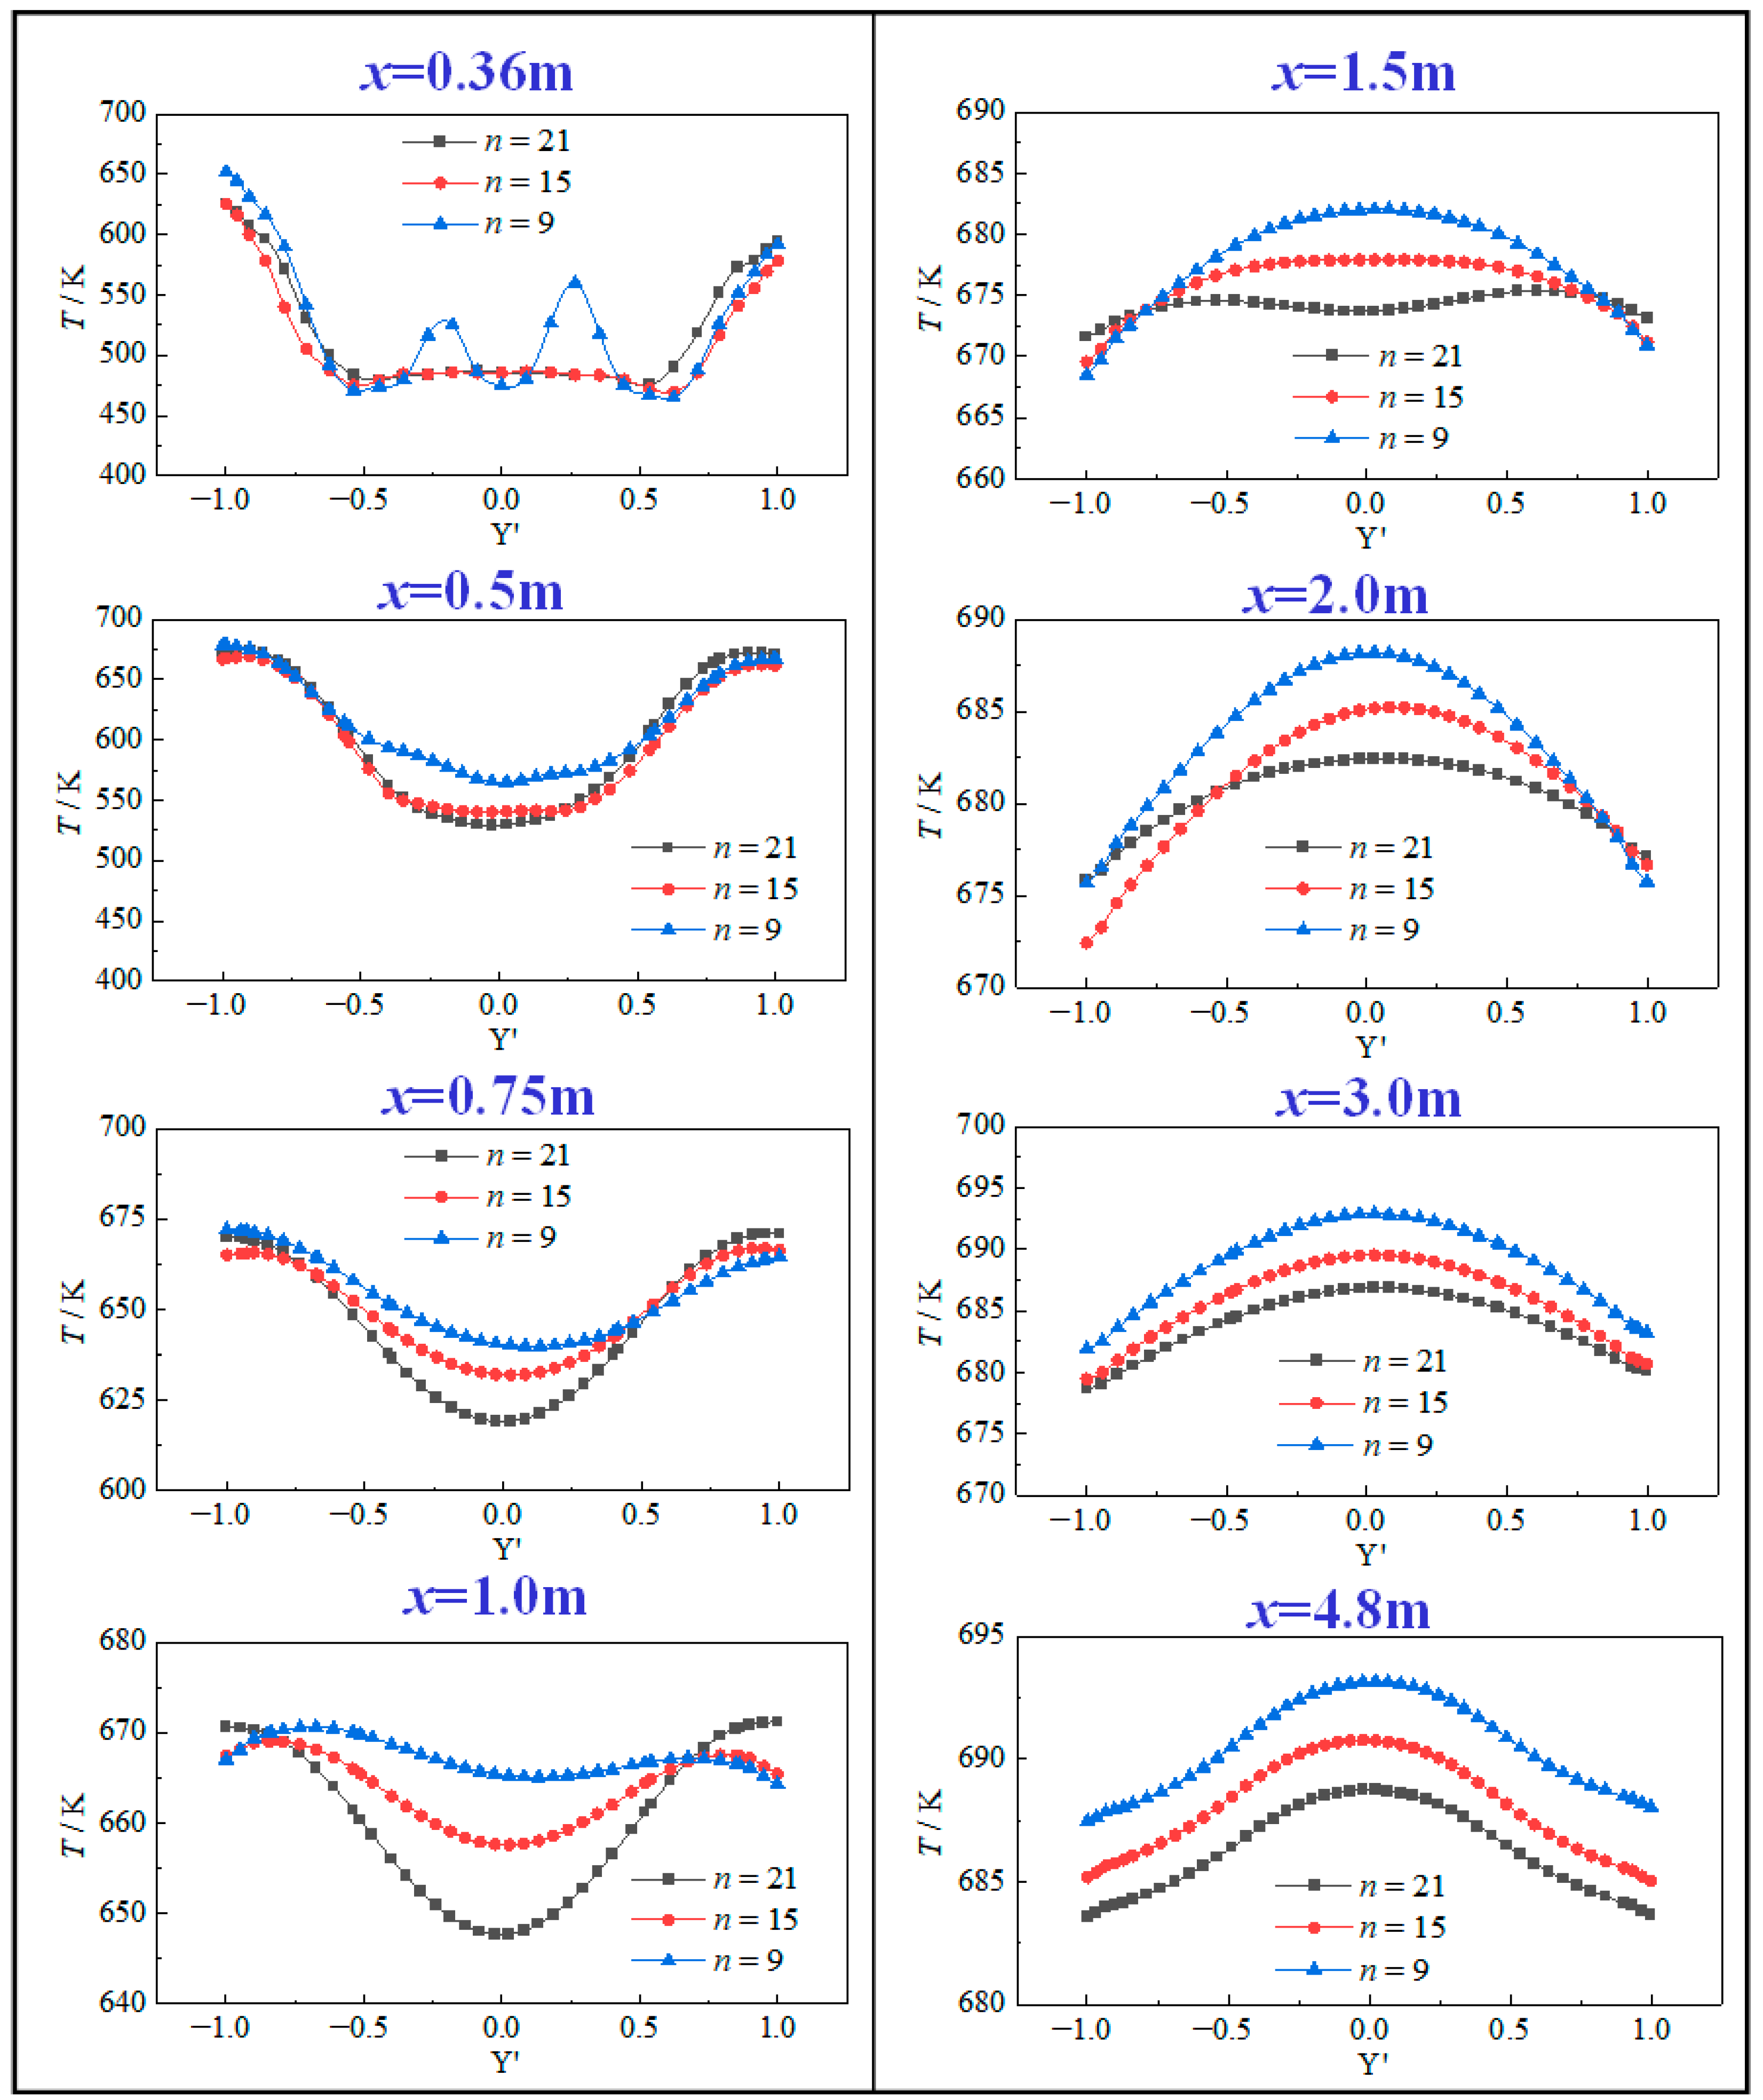
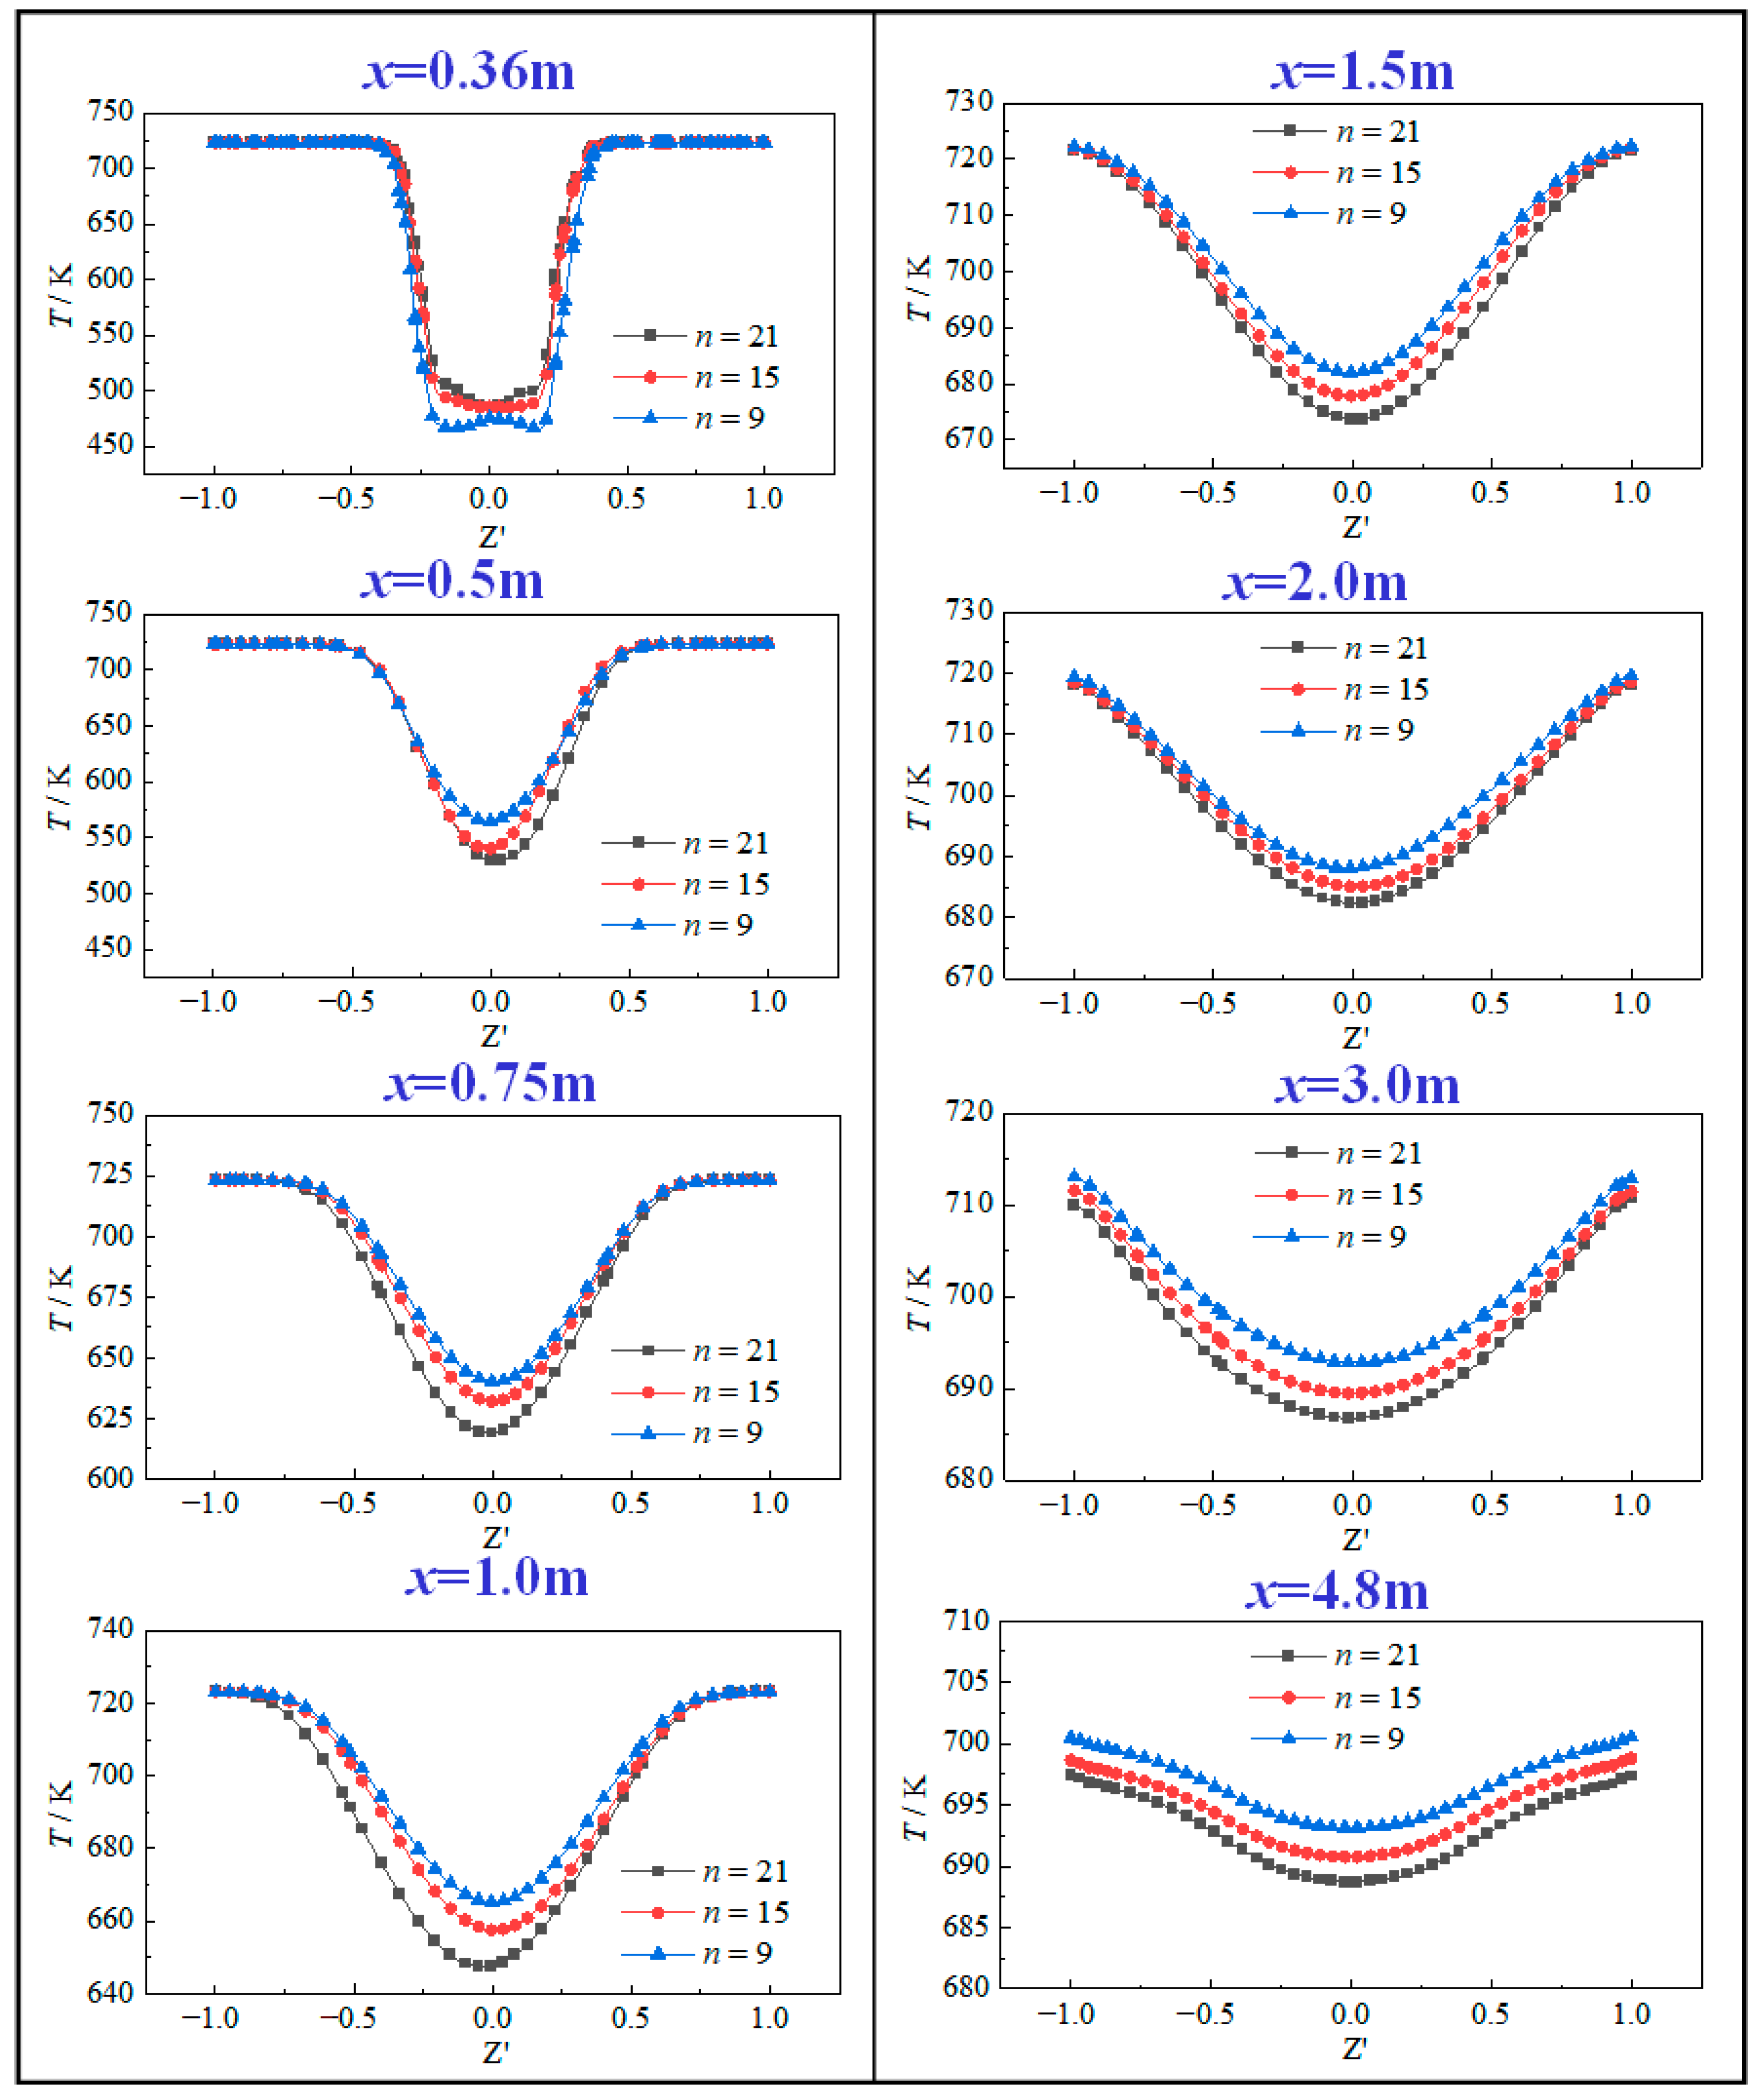
Detailed temperature profiles of the y-axis and z-axis center lines at different cross-sectional locations are presented in Figure 12 and Figure 13 to give a more intuitive and comprehensive understanding of the effect of orifice dimensions on the temperature distribution characteristics. Figure 14 presents the quantitative trends of cross-sectional average temperature and temperature non-uniformity coefficient. It can be inferred from the temperature distributions that the heat and mass transfer processes mainly occur in the central area, where most of the droplets are located. Under the same operating conditions, the more orifices (i.e., the smaller the orifice diameter), the smaller the initial droplet size, resulting in higher heat transfer efficiency. Thus, as illustrated in Figure 12 and Figure 13, the temperature of the central area in both the y-axis and z-axis directions is lower for the desuperheater with more orifices. Consequently, the average outlet temperature of the case with more orifices is lower (Figure 14a), indicating a better desuperheating ability.
It is worth noting that the temperature profile of the y-axis center line at plane x = 0.36 m for case n = 9, that is, the sub-figure in the upper left corner of Figure 12, appears uneven in the middle region. Under the same operating conditions, the vertical spacing and diameter of the orifices in the case of n = 9 are larger than those in the cases of n = 15 and n = 21 as illustrated in Figure 3 and Figure 9, resulting in a larger droplet mass in a single orifice area, and a larger vertical spacing between droplet clusters. Therefore, after a rapid heat transfer process between droplets and steam, the temperature in the area with more droplets close to the orifices is lower, while the temperature in the area with fewer droplets between the orifices in the vertical direction is higher. Therefore, significant change occurs in the temperature distribution of the y-axis center line at x = 3.6 for case n = 9. In contrast, in the cases of n = 15 and n = 21, due to the smaller spacing between the orifices and the smaller orifice diameter, the droplets distribute more uniformly, which is beneficial for more uniform temperature distributions.
For all cases in the y-axis direction, within 1.5 m from the inlet, the central temperature is lower than the temperature near the wall, but higher after 1.5 m from the inlet. For all cases in the z-axis direction, the central temperature at any cross-section downstream of the spray tube is lower than the temperature near the wall. Quantitatively comparing in the y-axis direction, for the case with n = 21, the maximum temperature difference between the central area and the wall in the y-axis direction at locations x = 1.5 m, x = 2 m, x = 3 m, and x = 4.8 m are 2.1 K, 6.6 K, 6.7 K, and 5.1 K, respectively. For the case with n = 9, the maximum temperature differences at the same locations are 13.5 K, 12.5 K, 11 K, and 5.7 K, respectively. It can be inferred that the y-axis temperature distribution tends to be more uniform for cases with more orifices after a distance of 1.5 m from the inlet. As for the z-axial temperature distribution, the temperature difference in all cases gradually decreases with the flow direction, indicating the effective mixing process. In addition, the temperature difference in the case of n = 21 is the largest in the z-axis direction due to the higher heat transfer efficiency. Overall speaking, as shown in Figure 14b, for the fluid near the spray tube, the temperature uniformity in the case with fewer orifices is slightly better than that with more orifices. With the development of droplet evaporation and mixing processes, the downstream temperature uniformity is improved, and the difference between the cases becomes negligible.

3.3. Influence of Structural Design

Given that geometric structure has a significant impact on the flow field characteristics [33], the influence of structural design on flow and temperature distribution characteristics in the desuperheater was evaluated. A comparison study was performed using a venturi-type desuperheater. As shown in Figure 15, the lengths of the venturi contraction section and the venturi diffuser are 0.1 m and 0.6 m, respectively. The diameter of the venturi throat is 0.08 m. Other dimensions are the same as the straight liner case. The operating conditions are the same as case 4 in Table 1.
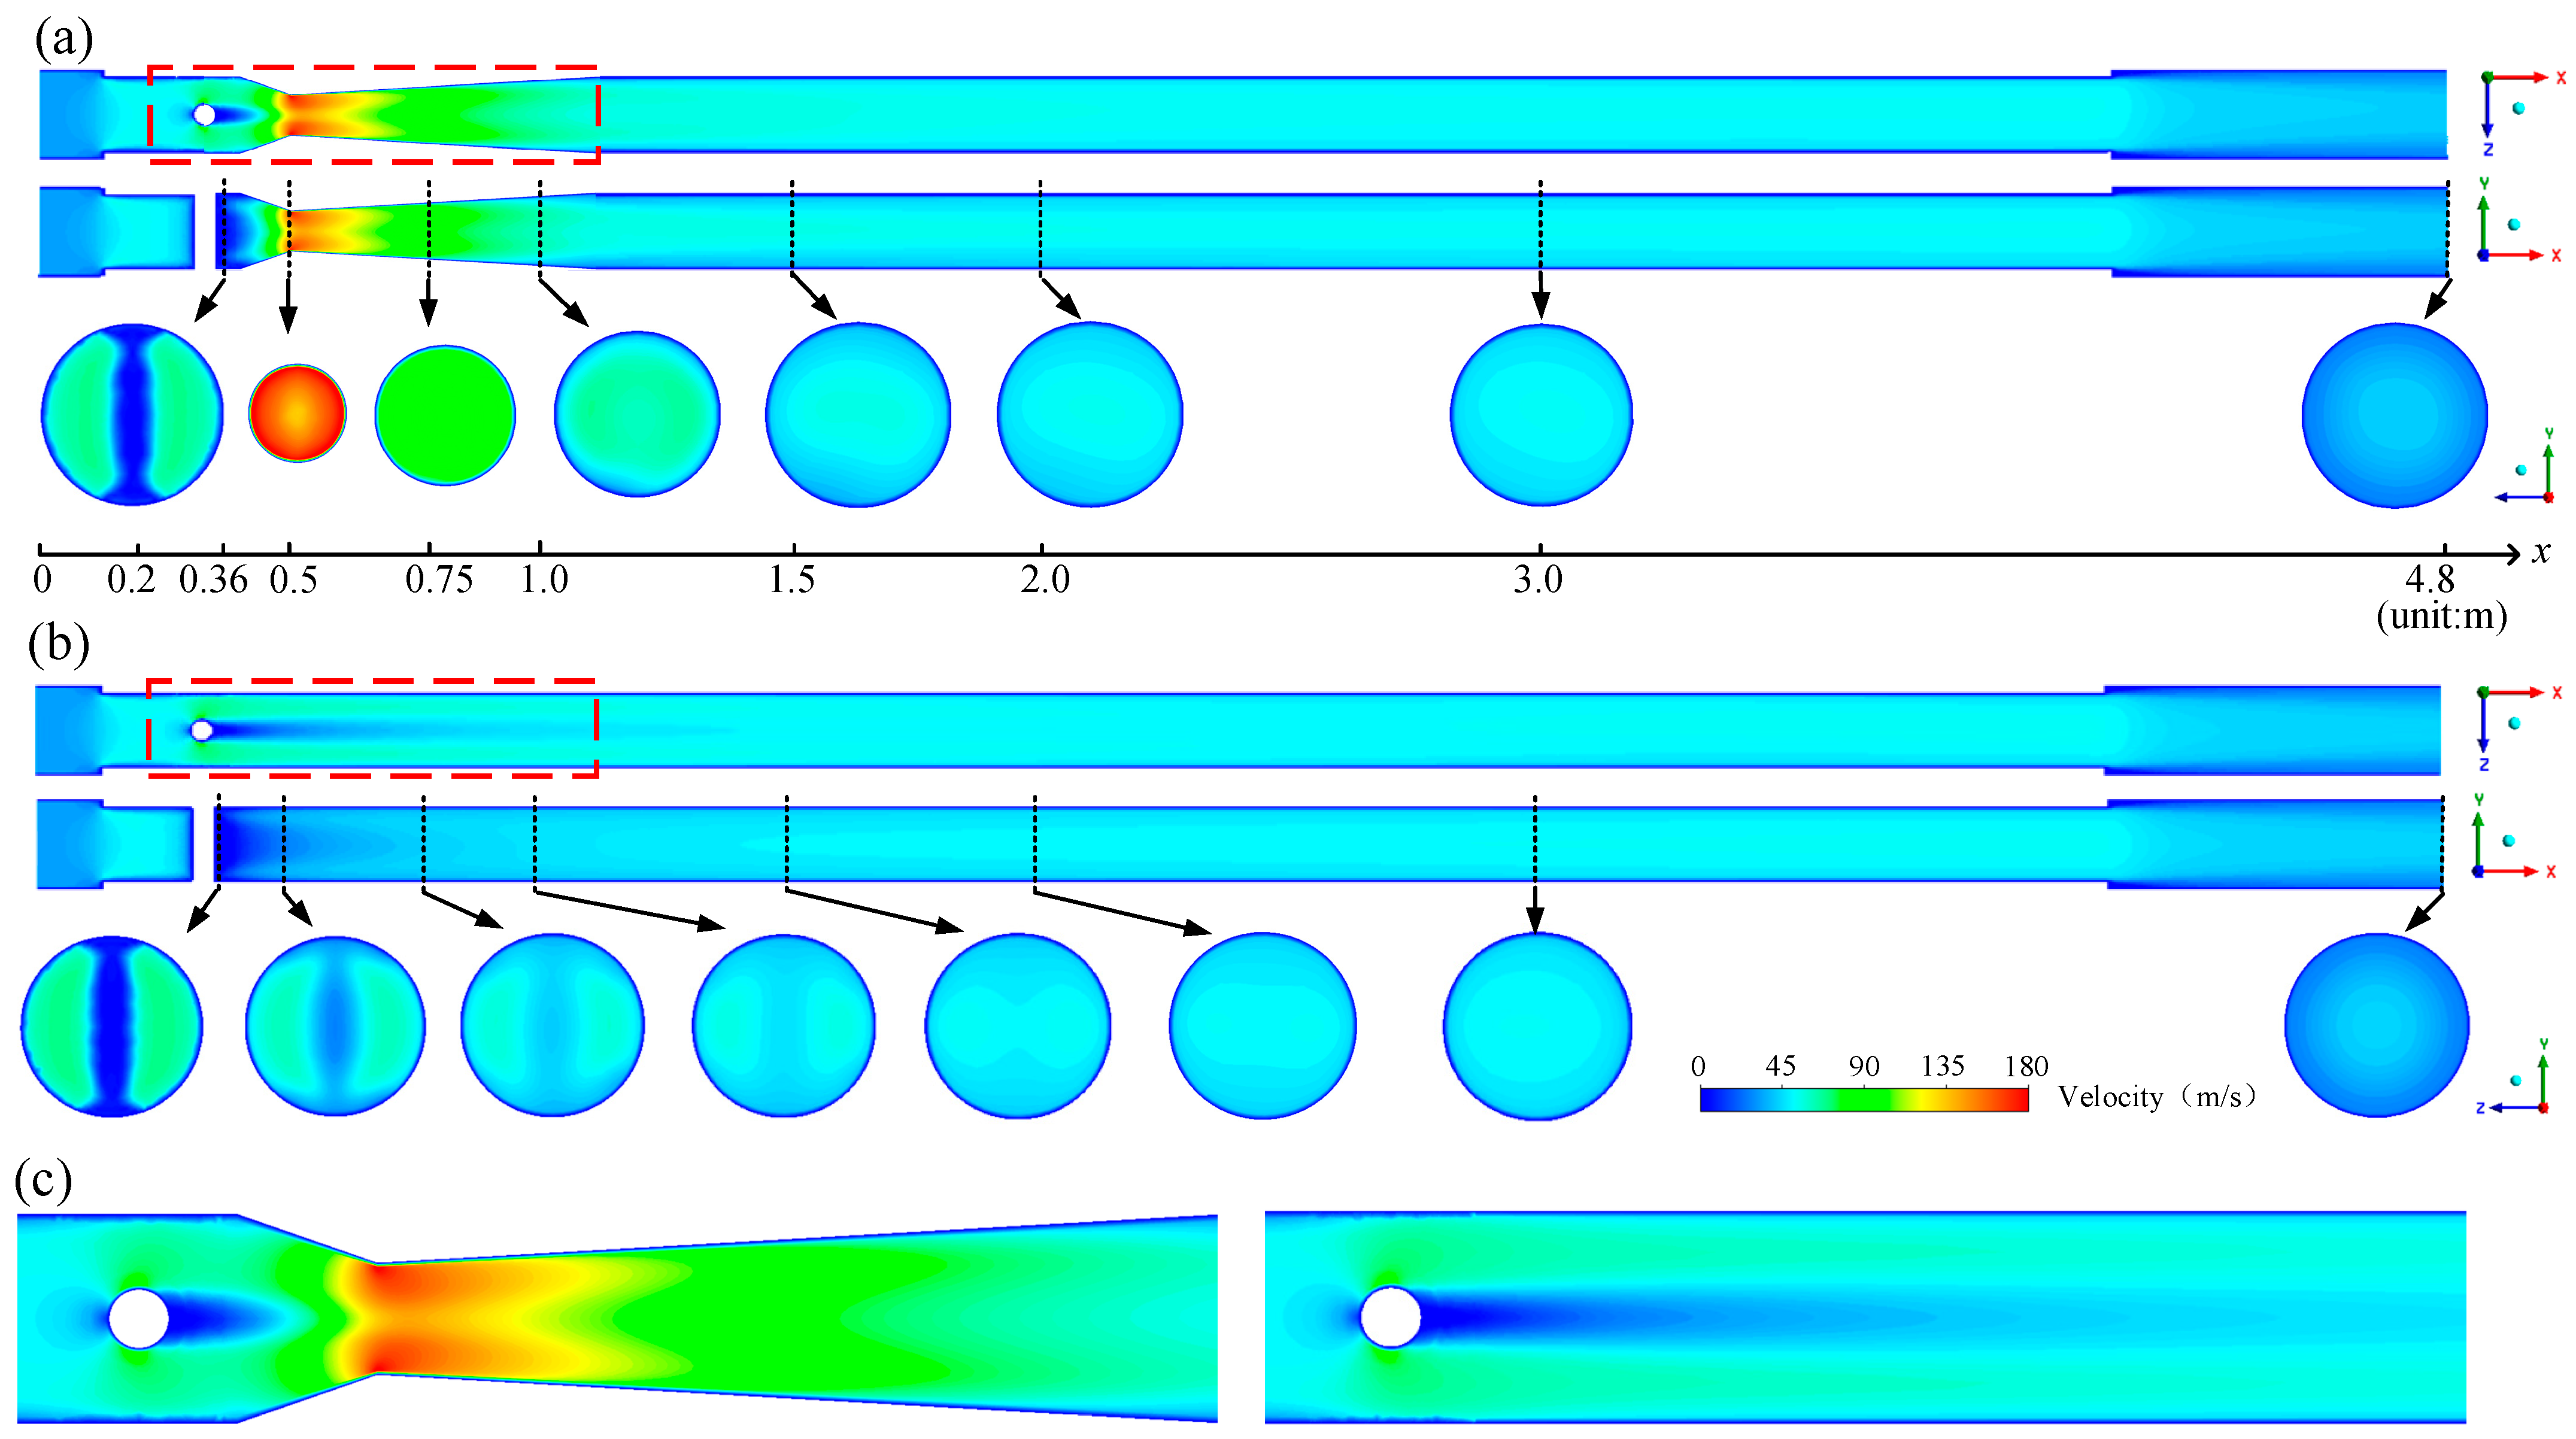
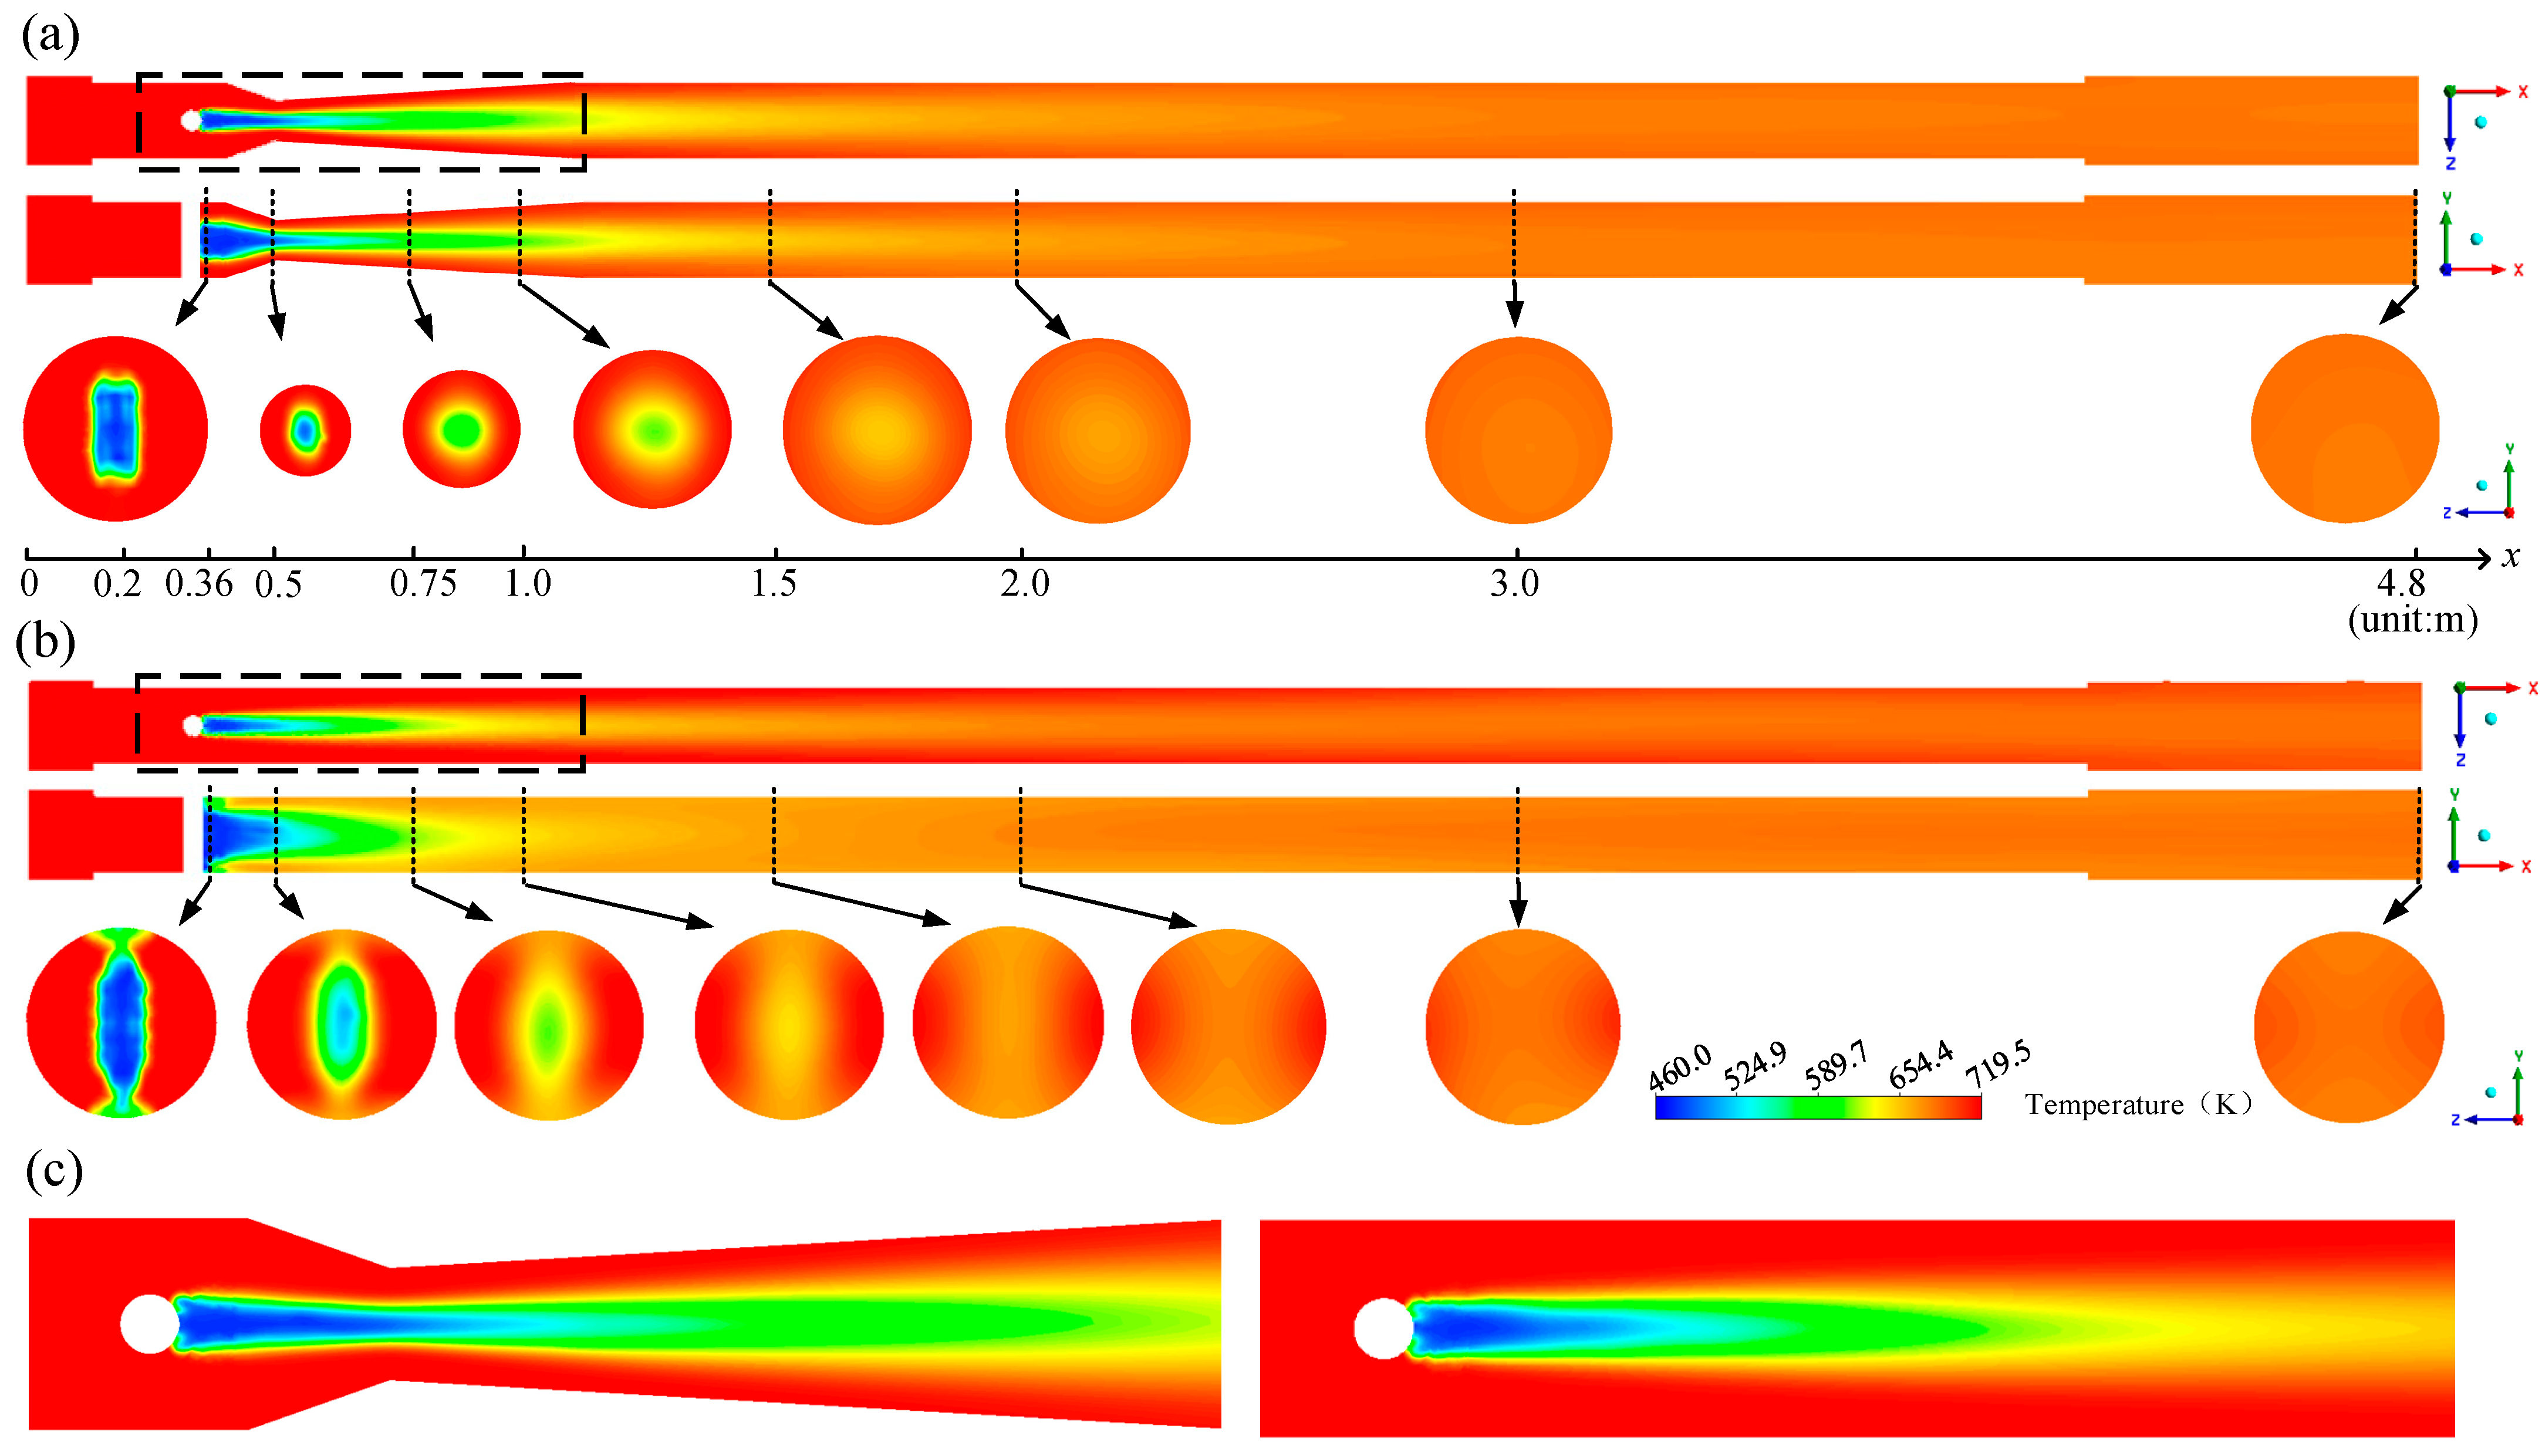
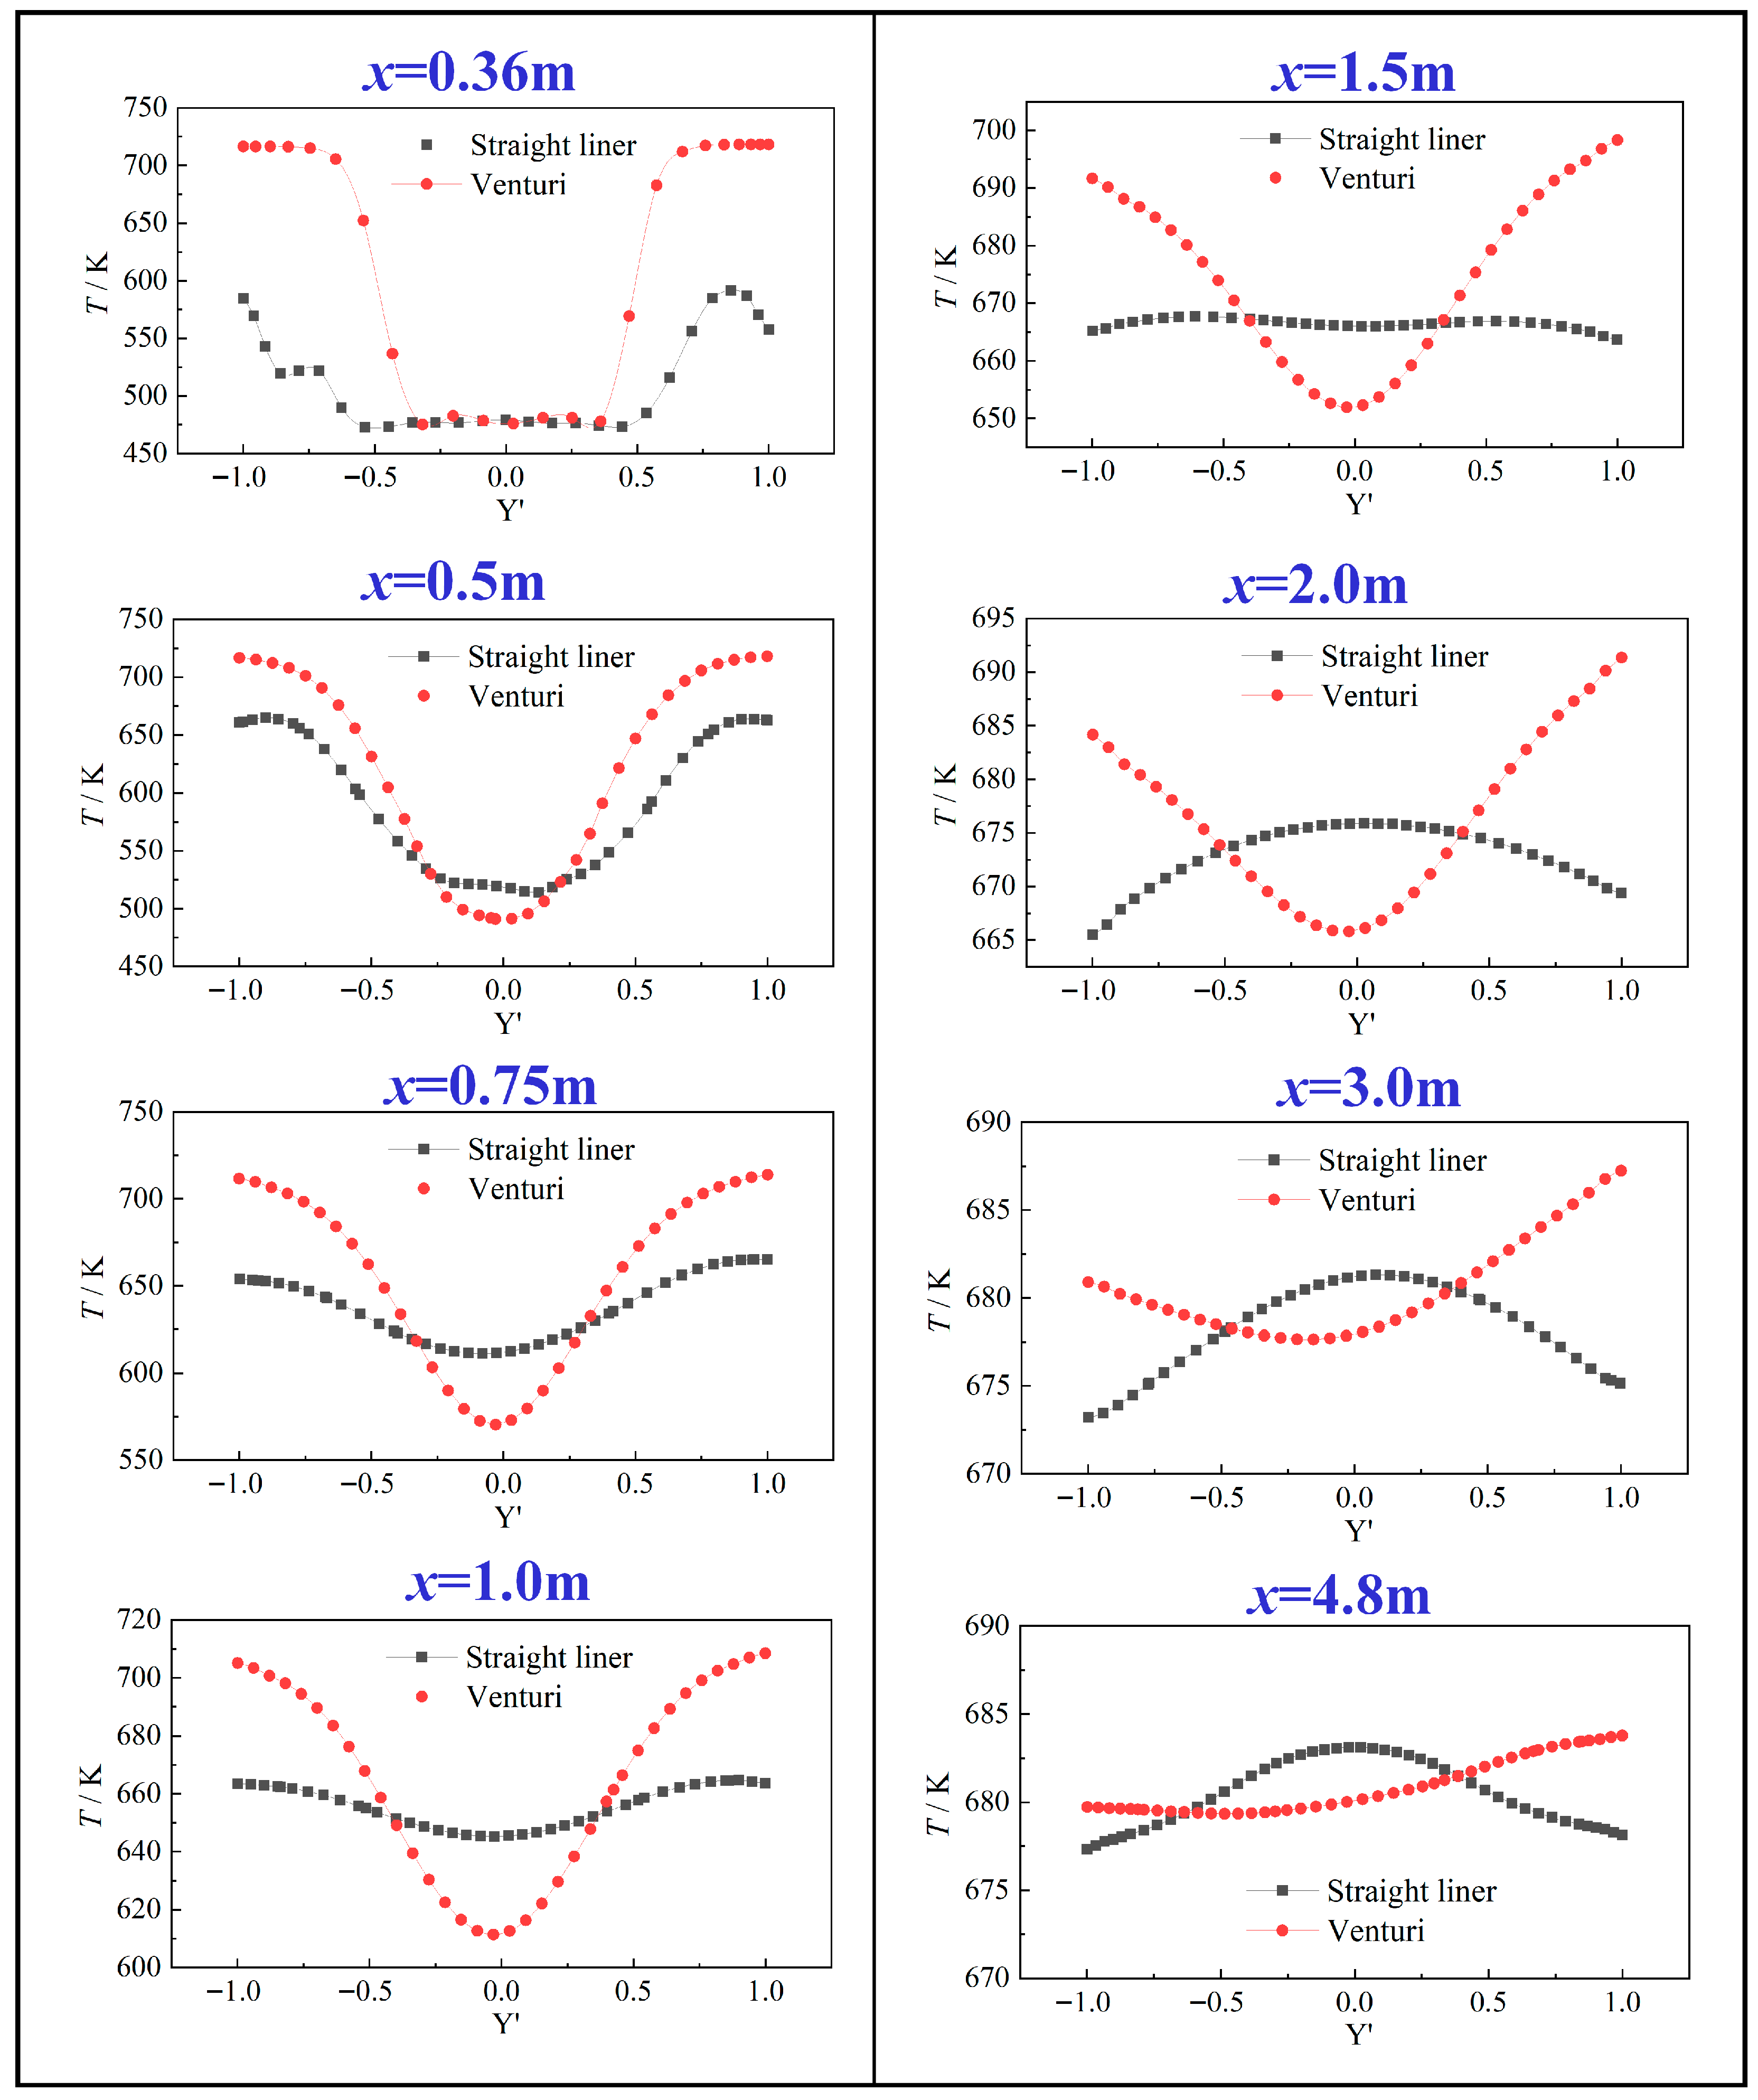
As shown in Figure 16, the steam velocity accelerates significantly across the venturi throat. Under the studied conditions, the maximum velocity in the venturi case is approximately twice that in the straight liner case. The velocity distribution in the venturi case is more uniform than that in the straight liner case downstream of the spray tube, but the velocity distributions of them are similar near the outlet due to the mixing process. In addition, the pressure drops of the venturi case and the straight liner case are 55,449 Pa and 66,076 Pa, respectively. In comparison, the pressure drop of the venturi case increases by approximately 19%. It can be inferred that the increase in pressure drop is acceptable in engineering applications, and the shape and dimensions of the venturi case are reasonable. Figure 17 compares the temperature contours of different sections. Affected by the venturi structure, the cross-sectional temperature distributions in the venturi case downstream of the spray tube tend to be centrosymmetric, while those in the straight liner case tend to be zygomorphic. The difference in the temperature distribution characteristics is related to the velocity differences and the non-uniformity of velocity distributions illustrated in Figure 16.
As shown in Figure 18 and Figure 19, the temperature profiles of the two cases in both the y-axis and z-axis directions exhibit certain discrepancies. As discussed earlier, for the straight liner case, the central temperature is higher than the wall temperature after 1.5 m from the inlet in the y-direction. However, this does not happen in the venturi case due to the effect of the venturi structure. In the venturi case, the velocity acceleration across the venturi throat makes the velocity difference between the droplets and the steam larger, which is beneficial for the droplet secondary breakup [11]. Larger droplets break into smaller droplets, leading to better heat and mass transfer processes. Therefore, as depicted in Figure 20a, the dusuperheating ability could be improved by the venturi structure. In addition, the temperature gradients in the y-axis and z-axis directions gradually decrease along the flow direction for the venturi case, and the temperature difference in the venturi case is smaller than that in the straight liner case, which can be inferred from Figure 18 and Figure 19. Thus, better temperature uniformity can be achieved in the venturi case (Figure 20b).

4. Conclusions

Computational fluid dynamics was applied to simulate the spray evaporation process in the desuperheater used in an industrial circulating fluidized bed boiler. The numerical results were in good agreement with the plant data.
It was found that the spray tube structure significantly affects the flow pattern, resulting in uneven velocity distribution, significant temperature difference, higher pressure drop, and local reverse flow in the flow region close to the spray tube, where most of the droplets are located and effective heat and mass transfer processes between the steam and droplets proceed. In case 2, complete evaporation occurs around 3.5 m from the spray tube orifices, and the temperature distribution tends to be uniform owing to the turbulent mixing.
Under the same operating conditions, orifices with a smaller diameter benefit from the formation of droplets with a smaller size, which is conducive for the evaporation process, and leads to a better desuperheating ability and a more uniform temperature distribution.
The comparative study between the straight liner case and the venturi case highlights the advantage of the venturi structure in improving the desuperheating ability and the temperature uniformity. Affected by the venturi structure, the cross-sectional temperature distributions in the venturi case downstream of the spray tube tend to be centrosymmetric, while those in the straight liner case tend to be zygomorphic. In addition, the steam velocity accelerates significantly across the venturi throat, making the velocity difference between the droplets and the steam larger, which is beneficial for the droplet secondary breakup.
In conclusion, the cases analyzed in this work could provide a guiding significance for the research on the process characteristics of desuperheaters in industrial applications. The model can be applied to optimize the process and design of the desuperheater in future research. For a specific desuperheater system, the appropriate cooling water flow rate and the arrangement of the spray tube can be determined to more accurately control the steam temperature and improve the temperature uniformity. In addition, the influence of the spray evaporation process on the material failure of the structural components of the desuperheater can be analyzed and discussed based on the fluid–thermal–solid coupling simulation.

Author Contributions

Conceptualization, J.W. and B.L. (Baoqing Liu); methodology, B.D.; software, J.W. and B.L. (Baoqing Liu); validation, J.W. and B.L. (Bohai Liu); formal analysis, K.W.; investigation, Q.L.; writing—original draft preparation, J.W.; writing—review and editing, J.W. and Q.L.; visualization, J.W. and M.C.; supervision, B.D.; project administration, J.W. All authors have read and agreed to the published version of the manuscript.

Funding

This research was supported by the China Postdoctoral Science Foundation under Grant number 2024M752894.

Data Availability Statement

All the data used are contained in the paper.

Conflicts of Interest

The authors declare no conflicts of interest.

References

  1. Sahajpal, S.; Shah, P.D. Thermal design of ammonia desuperheater-condenser and comparative study with HTRI. Procedia Eng. 2013, 51, 375–379. [Google Scholar] [CrossRef]
  2. Li, X.; Yu, X. Robust regulation for superheated steam temperature control based on data-driven feedback compensation. Appl. Energy 2022, 325, 119918. [Google Scholar] [CrossRef]
  3. Xu, Y.X.; Qian, J.Y.; Chen, L.L.; Jin, Z.J. The past, present and future of temperature and pressure reducing device. J. Mech. Electr. Eng. 2021, 38, 1081–1090, 1123. [Google Scholar]
  4. Schoonover, K.G.; Ren, W.M.; Ghiaasiaan, S.M.; Abdel-Khalik, S.I. Mechanistic modeling of desuperheater performance. ISA Trans. 1996, 35, 45–51. [Google Scholar] [CrossRef]
  5. Rahimi, E.; Torfeh, S.; Kouhikamali, R. Numerical study of counter-current desuperheaters in thermal desalination units. Desalination 2016, 397, 140–150. [Google Scholar] [CrossRef]
  6. Kouhikamali, R.; Hesami, H.; Ghavamian, A. Convective heat transfer in a mixture of cooling water and superheated steam. Int. J. Therm. Sci. 2012, 60, 205–211. [Google Scholar] [CrossRef]
  7. Grich, N.; Foudhil, W.; Harmand, S.; Ben Jabrallah, S. Numerical simulation of fog transport in a horizontal channel. MATEC Web Conf. 2020, 330, 01033. [Google Scholar] [CrossRef]
  8. Cho, B.; Choi, G.; Uruno, Y.; Kim, H.; Chung, J.; Kim, H.; Lee, K. One-dimensional simulation for attemperator based on commissioning data of coal-fired steam power plant. Appl. Therm. Eng. 2017, 113, 508–518. [Google Scholar] [CrossRef]
  9. Reitz, R.D. Modeling atomization processes in high-pressure vaporizing sprays. At. Spray Technol. 1987, 3, 309–337. [Google Scholar]
  10. Ebrahimian, V.; Gorji-Bandpy, M. Two-dimensional modeling of water spray cooling in superheated steam. Therm. Sci. 2008, 12, 79–88. [Google Scholar] [CrossRef]
  11. Uruno, Y.; Chung, J.; Kim, H.; Lee, K. Three-dimensional simulation of droplet breakup and evaporation in attemperator. Int. J. Heat Mass Transf. 2022, 196, 123300. [Google Scholar] [CrossRef]
  12. Liang, H.Z.; Zhao, B.; Huang, C.; Song, H.; Jiang, X. Numerical simulation study on performance optimization of desuperheater. Energy Rep. 2021, 7, 2221–2232. [Google Scholar] [CrossRef]
  13. Zheng, J.; Lin, Y.J.; Zhao, D.; Wei, X.; Xia, Y.Q. Structure design and simulation analysis of new desuperheater. Chem. Eng. Mach. 2023, 50, 92–97. [Google Scholar]
  14. Faeth, G.M.; Hsiang, L.P.; Wu, P.K. Structure and breakup properties of sprays. Int. J. Multiph. Flow. 1995, 21, 99–127. [Google Scholar] [CrossRef]
  15. Taskiran, O.O.; Ergeneman, M. Trajectory based droplet collision model for spray modeling. Fuel 2014, 115, 896–900. [Google Scholar] [CrossRef]
  16. O’Rourke, P.J. Collective Drop Effects on Vaporizing Liquid Spray; Princeton University: Princeton, NJ, USA, 1981. [Google Scholar]
  17. Birouk, M.; Gökalp, I. Current status of droplet evaporation in turbulent flows. Prog. Energy Combust. Sci. 2006, 32, 408–423. [Google Scholar] [CrossRef]
  18. Hong, M.; Xu, G.; Lu, P.; Chen, F.; Sheng, G.; Zhang, Q. Numerical simulation on gas-droplet flow characteristics and spray evaporation process in CFB-FGD tower. Adv. Powder Technol. 2023, 34, 104008. [Google Scholar] [CrossRef]
  19. Afridi, M.I.; Qasim, M.; Khan, N.A.; Hamdani, M. Heat transfer analysis of Cu-Al2O3-water and Cu-Al2O3-kerosene oil hybrid nanofluids in the presence of frictional heating: Using 3-stage Lobatto IIIA formula. J. Nanofluids 2019, 8, 885–891. [Google Scholar] [CrossRef]
  20. Launder, B.E.; Spalding, D.B. Lectures in Mathematical Models of Turbulence; Academic Press: London, UK, 1972. [Google Scholar]
  21. Faeth, G.M. Spray Atomization and Combustion; Technical Report 1986-136; American Institute of Aeronautics and Astronautics (AIAA): Reston, VA, USA, 1986. [Google Scholar] [CrossRef]
  22. Chang, K.C.; Yang, J.C.; Wang, M.R. Grid-averaged Lagrangian equations of dispersed phase in dilute two-phase flow. AIAA J. 2003, 41, 1292–1303. [Google Scholar] [CrossRef]
  23. Feng, S.; Xiao, L.; Ge, Z.; Yang, L.; Du, X.; Wu, H. Parameter analysis of atomized droplets sprayed evaporation in flue gas flow. Int. J. Heat Mass Transf. 2019, 129, 936–952. [Google Scholar] [CrossRef]
  24. Ansys Help 2021/Fluent/Theory Guide. Available online: https://ansyshelp.ansys.com/account/secured?returnurl=/Views/Secured/corp/v211/en/flu_th/flu_th.html (accessed on 26 January 2021).
  25. Jeng, S.; Deng, Z. Numerical simulation of deformed droplet dynamics and evaporation. Recent Adv. Spray Combust. Spray Combust. Meas. Model Simul. 1996, 2, 305–328. [Google Scholar]
  26. Lefebvre, A.H.; McDonell, V.G. Atomization and Sprays, 2nd ed.; CRC Press: Boca Raton, FL, USA, 2017. [Google Scholar]
  27. Turner, M.R.; Sazhin, S.S.; Healey, J.J.; Crua, C.; Martynov, S.B. A breakup model for transient Diesel fuel sprays. Fuel 2012, 97, 288–305. [Google Scholar] [CrossRef]
  28. Palaszewski, S.J.; Jiji, L.M.; Weinbaum, S. A three-dimensional air-vapor-droplet local interaction model for spray units. ASME J. Heat. Transfer. 1981, 103, 514–521. [Google Scholar] [CrossRef]
  29. Ranz, W.E.; Marshall, W.R. Evaporation from drops, Part I and Part II. Chem. Eng. Prog. 1952, 48, 173–180. [Google Scholar]
  30. Chaker, M.; Meher-Homji, C.B.; Mee, T., III. Inlet fogging of gas turbine engines: Part A-fog droplet thermodynamics, heat transfer and practical considerations. Turbo Expo Power Land Sea Air 2002, 36096, 413–428. [Google Scholar]
  31. Kuo, K.K.Y. Principles of Combustion; John Wiley and Sons: New York, NY, USA, 1986. [Google Scholar]
  32. Liu, G.Q.; Ma, L.X.; Liu, J. Chemistry and Chemical Industry Physical Data Handbook; Chemical Industry Press: Beijing, China, 2002. [Google Scholar]
  33. Lin, Q.; Li, Q.H.; Xu, P.; Zheng, R.Y.; Bao, J.J.; Li, L.; Tan, D.P. Transport mechanism and optimization design of LBM-LES coupling-based two-phase flow in static mixers. Processes 2025, 13, 1666. [Google Scholar] [CrossRef]
Figure 1. Schematic of the spray evaporation process in the desuperheater.
Energies 18 03734 g001
Figure 2. Diagram of flow area and dimensions of desuperheater.
Energies 18 03734 g002
Figure 3. Diagram and dimensions of spray tube and orifices.
Energies 18 03734 g003
Figure 4. (a) Composition of mesh shape and (b) generated mesh in the simulation domain.
Energies 18 03734 g004
Figure 5. Velocity profile (a) and pressure drop (b) under different cell numbers.
Energies 18 03734 g005
Figure 6. Comparison between plant data and simulation results.
Energies 18 03734 g006
Figure 7. Velocity contours and vectors of steam (a), static pressure contours of steam (b), temperature contours of steam (c) for case 2.
Energies 18 03734 g007
Figure 8. Velocity contours of mass fraction of water vapor formed by evaporation (a) and mass flow rate of unevaporated water (b) for case 2.
Energies 18 03734 g008
Figure 9. Diagrams of spray tube with different orifice dimensions.
Energies 18 03734 g009
Figure 10. Temperature distributions at plane y = 0, plane z = 0, and cross-sections along the flow direction under different orifice dimensions.
Energies 18 03734 g010
Figure 11. Local temperature distributions at planes y = 0 and z = 0 (black dashed box area in Figure 10) under different orifice dimensions.
Energies 18 03734 g011
Figure 12. Temperature profiles of the y-axis center lines at different cross-sectional locations.
Energies 18 03734 g012
Figure 13. Temperature profiles of the z-axis center lines at different cross-sectional locations.
Energies 18 03734 g013
Figure 14. Variation trends of cross-sectional average temperature (a) and temperature non-uniformity coefficient (b) under different orifice dimensions.
Energies 18 03734 g014
Figure 15. Diagram of flow domain and dimensions of a venturi-type desuperheater.
Energies 18 03734 g015
Figure 16. Velocity contours at plane y = 0, plane z = 0, and cross-sections along the flow direction of the venturi case (a) and straight liner case (b), local velocity contours of the venturi case and straight liner case (red dashed box area) (c).
Energies 18 03734 g016
Figure 17. Temperature contours at plane y = 0, plane z = 0, and cross-sections along the flow direction of the venturi case (a) and straight liner case (b), local temperature contours of the venturi case and straight liner case (black dashed box area) (c).
Energies 18 03734 g017
Figure 18. Comparison of temperature profiles of the y-axis center lines at different cross-sectional locations between the straight liner case and the venturi case.
Energies 18 03734 g018
Figure 19. Comparison of temperature profiles of the z-axis center lines at different cross-sectional locations between the straight liner case and the venturi case.
Energies 18 03734 g019
Figure 20. Variation trends of cross-sectional average temperature (a) and temperature non-uniformity coefficient (b) of the straight liner case and the venturi case.
Energies 18 03734 g020
Table 1. Operating conditions.
Operating Pressure (MPa)Mass Flow Rate (kg/s)Inlet Temperature (K)
SteamWaterSteamWater
Case 11029.331.50721.55476.10
Case 226.060.83709.38474.56
Case 328.991.23723.24496.75
Case 427.161.16719.45475.87
Table 2. Physical properties of steam and water in case 1.
ParametersSteamWater
Density/kg·m−334860
Specific heat capacity/J·(kg·K)−127604500
Thermal conductivity/W·(m·K)−10.0740.66
Viscosity/Pa·s2.75 × 10−51.35 × 10⁻⁴
Surface tense/N·m−1/0.037
Boiling point/K/584.15
Disclaimer/Publisher’s Note: The statements, opinions and data contained in all publications are solely those of the individual author(s) and contributor(s) and not of MDPI and/or the editor(s). MDPI and/or the editor(s) disclaim responsibility for any injury to people or property resulting from any ideas, methods, instructions or products referred to in the content.