
Application of a Phase-Change Material Heat Exchanger to Improve the Efficiency of Heat Pumps at Partial Loads


Abstract
1. Introduction
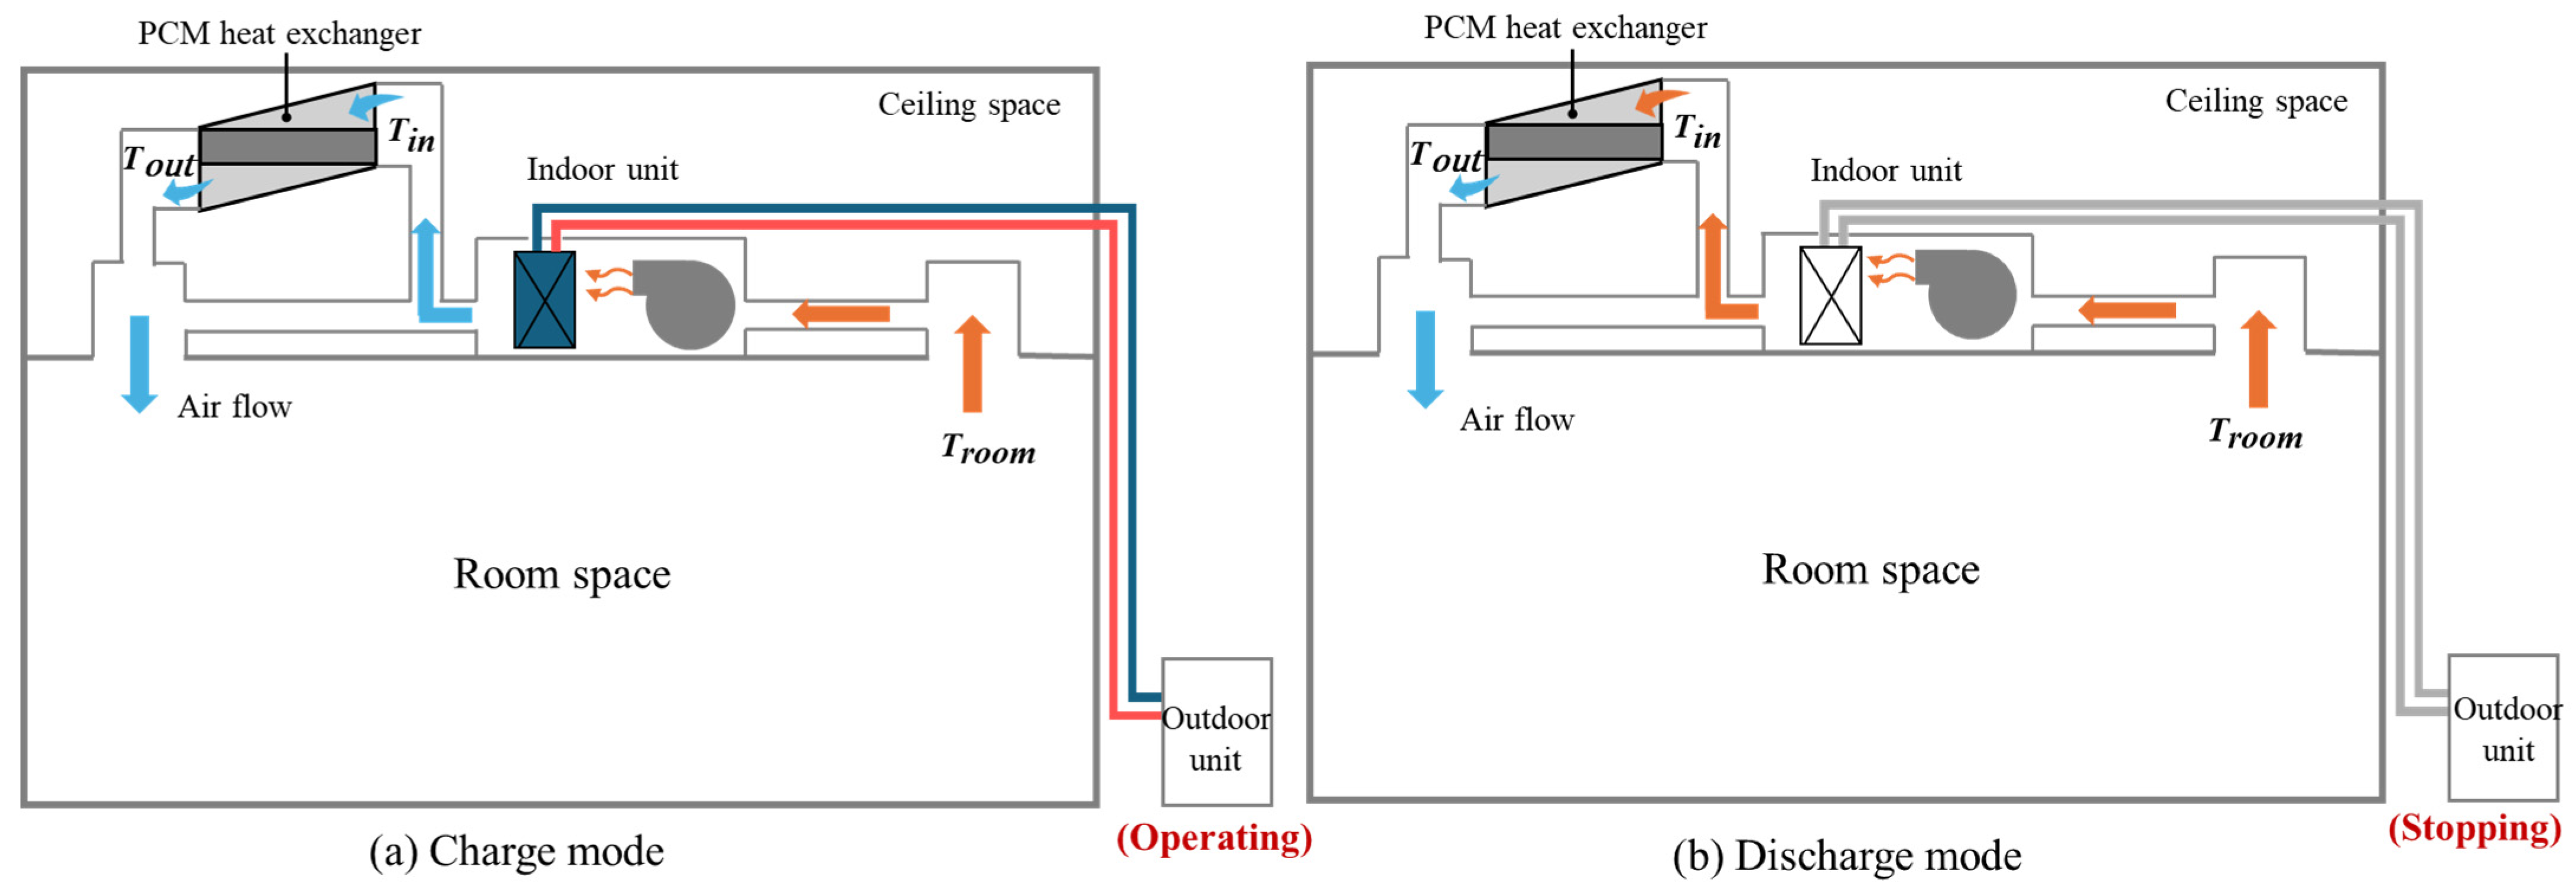
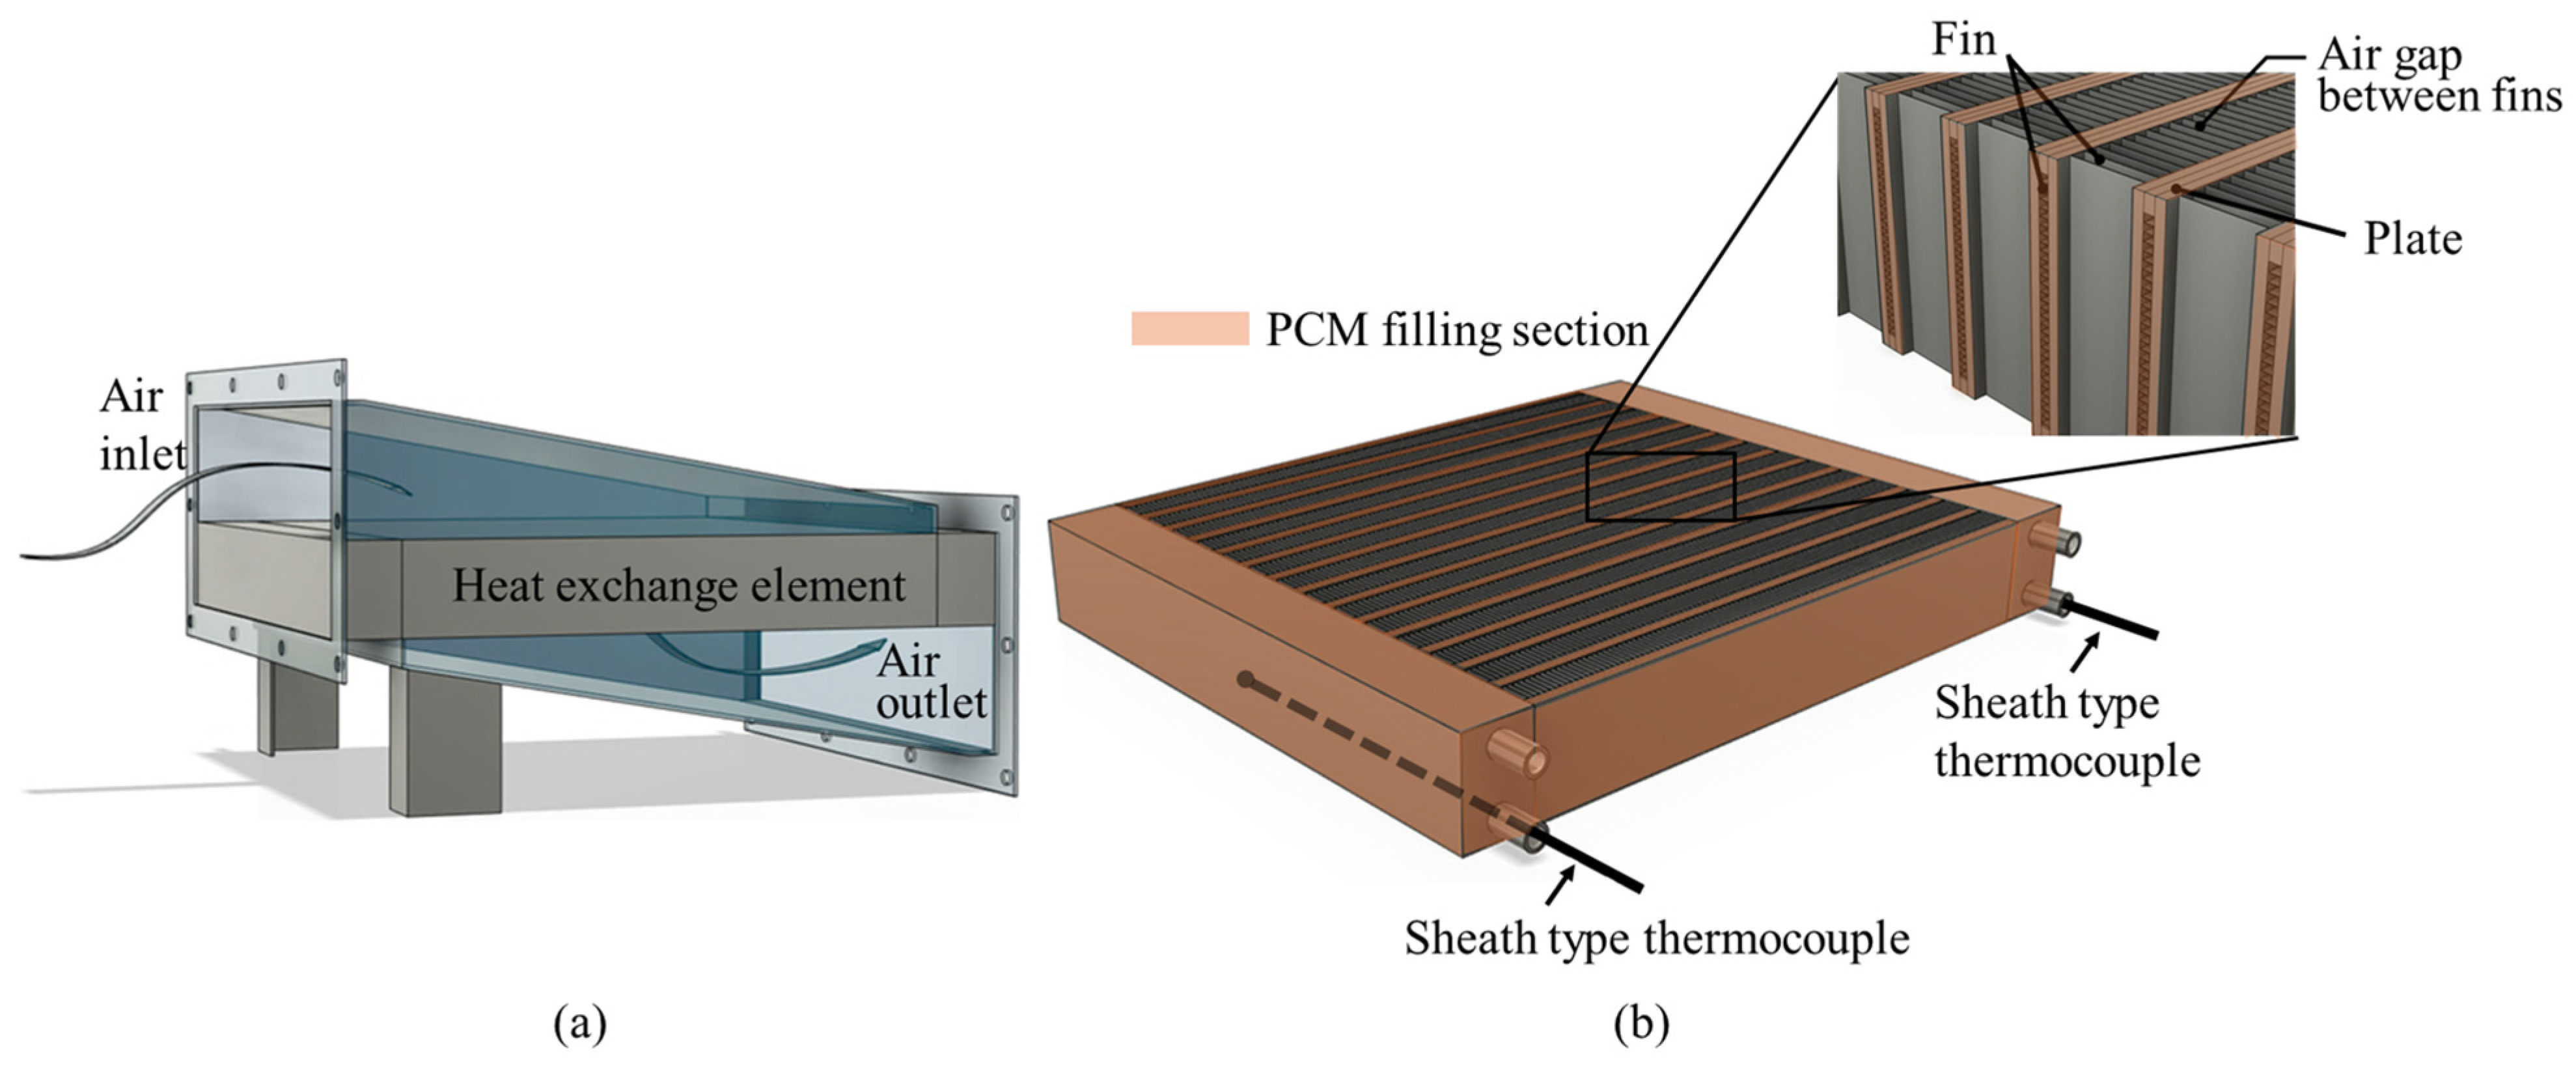
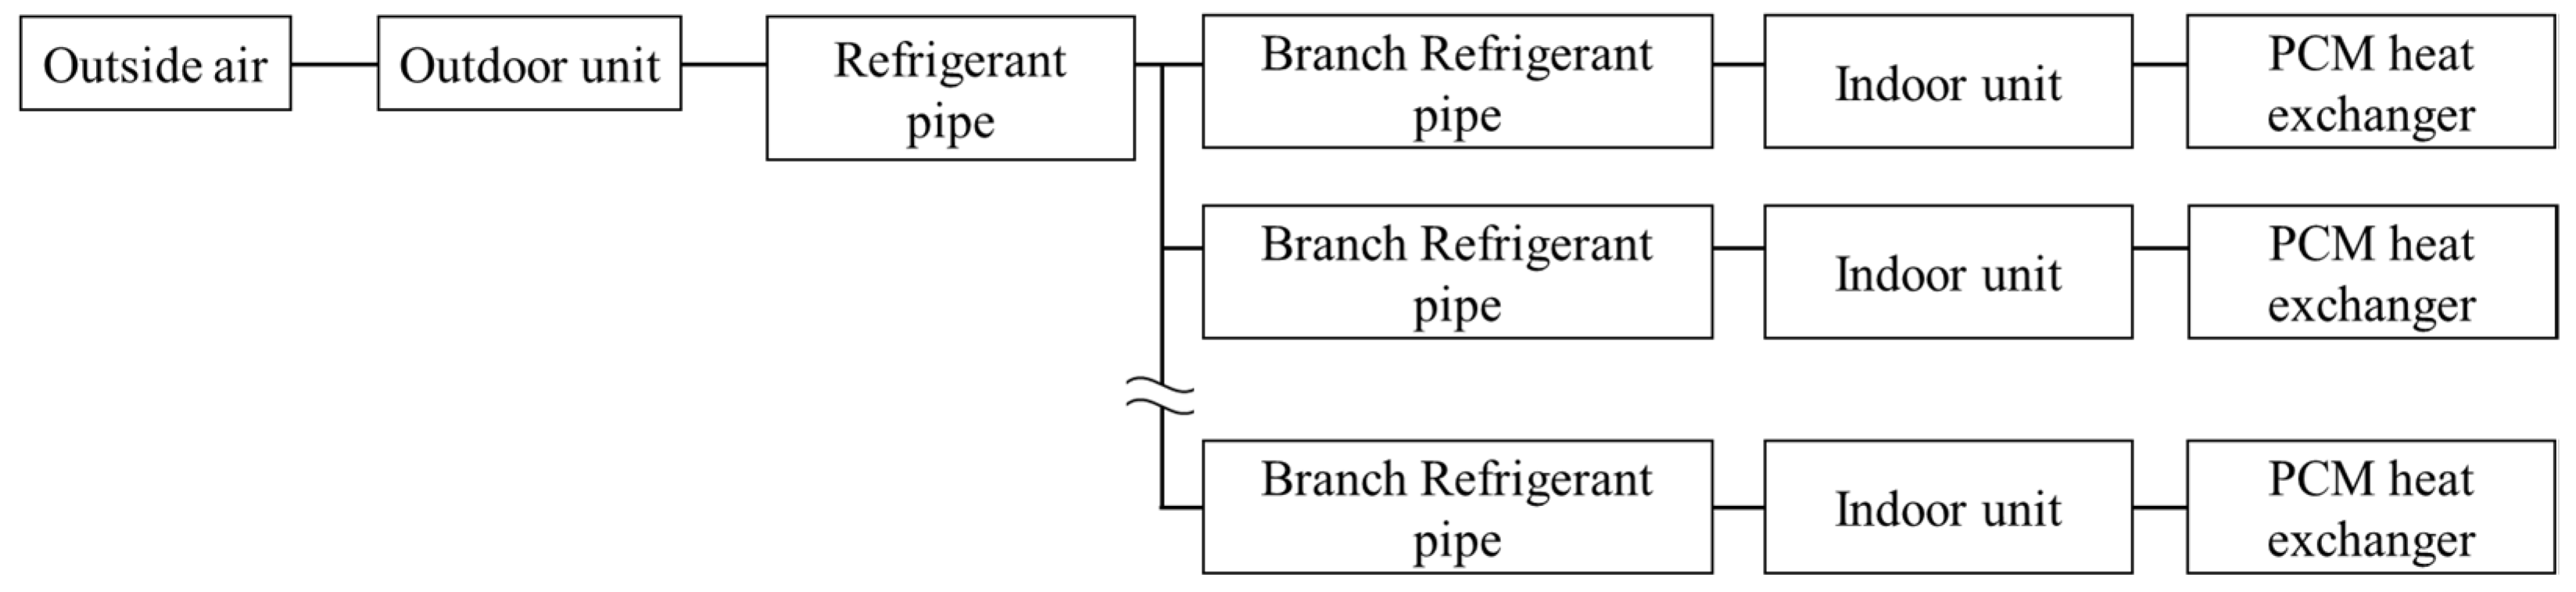
2. Design
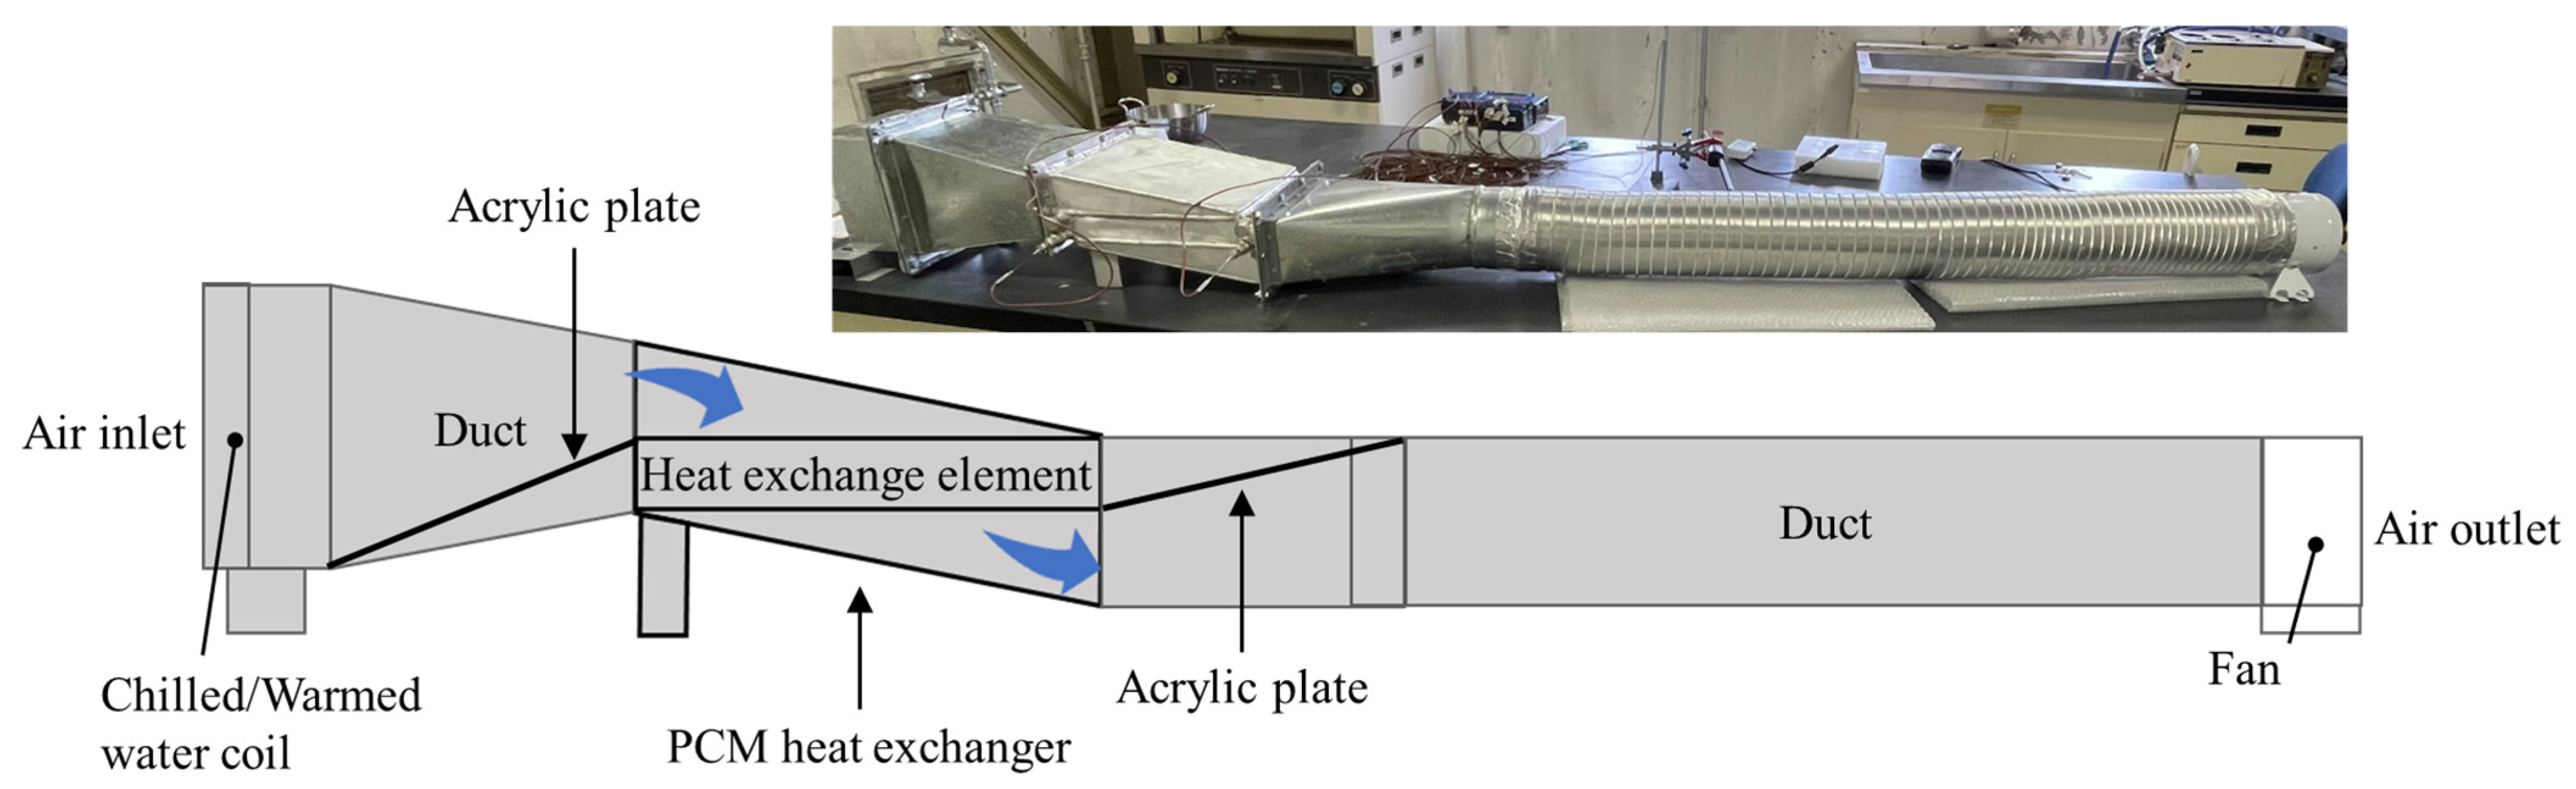
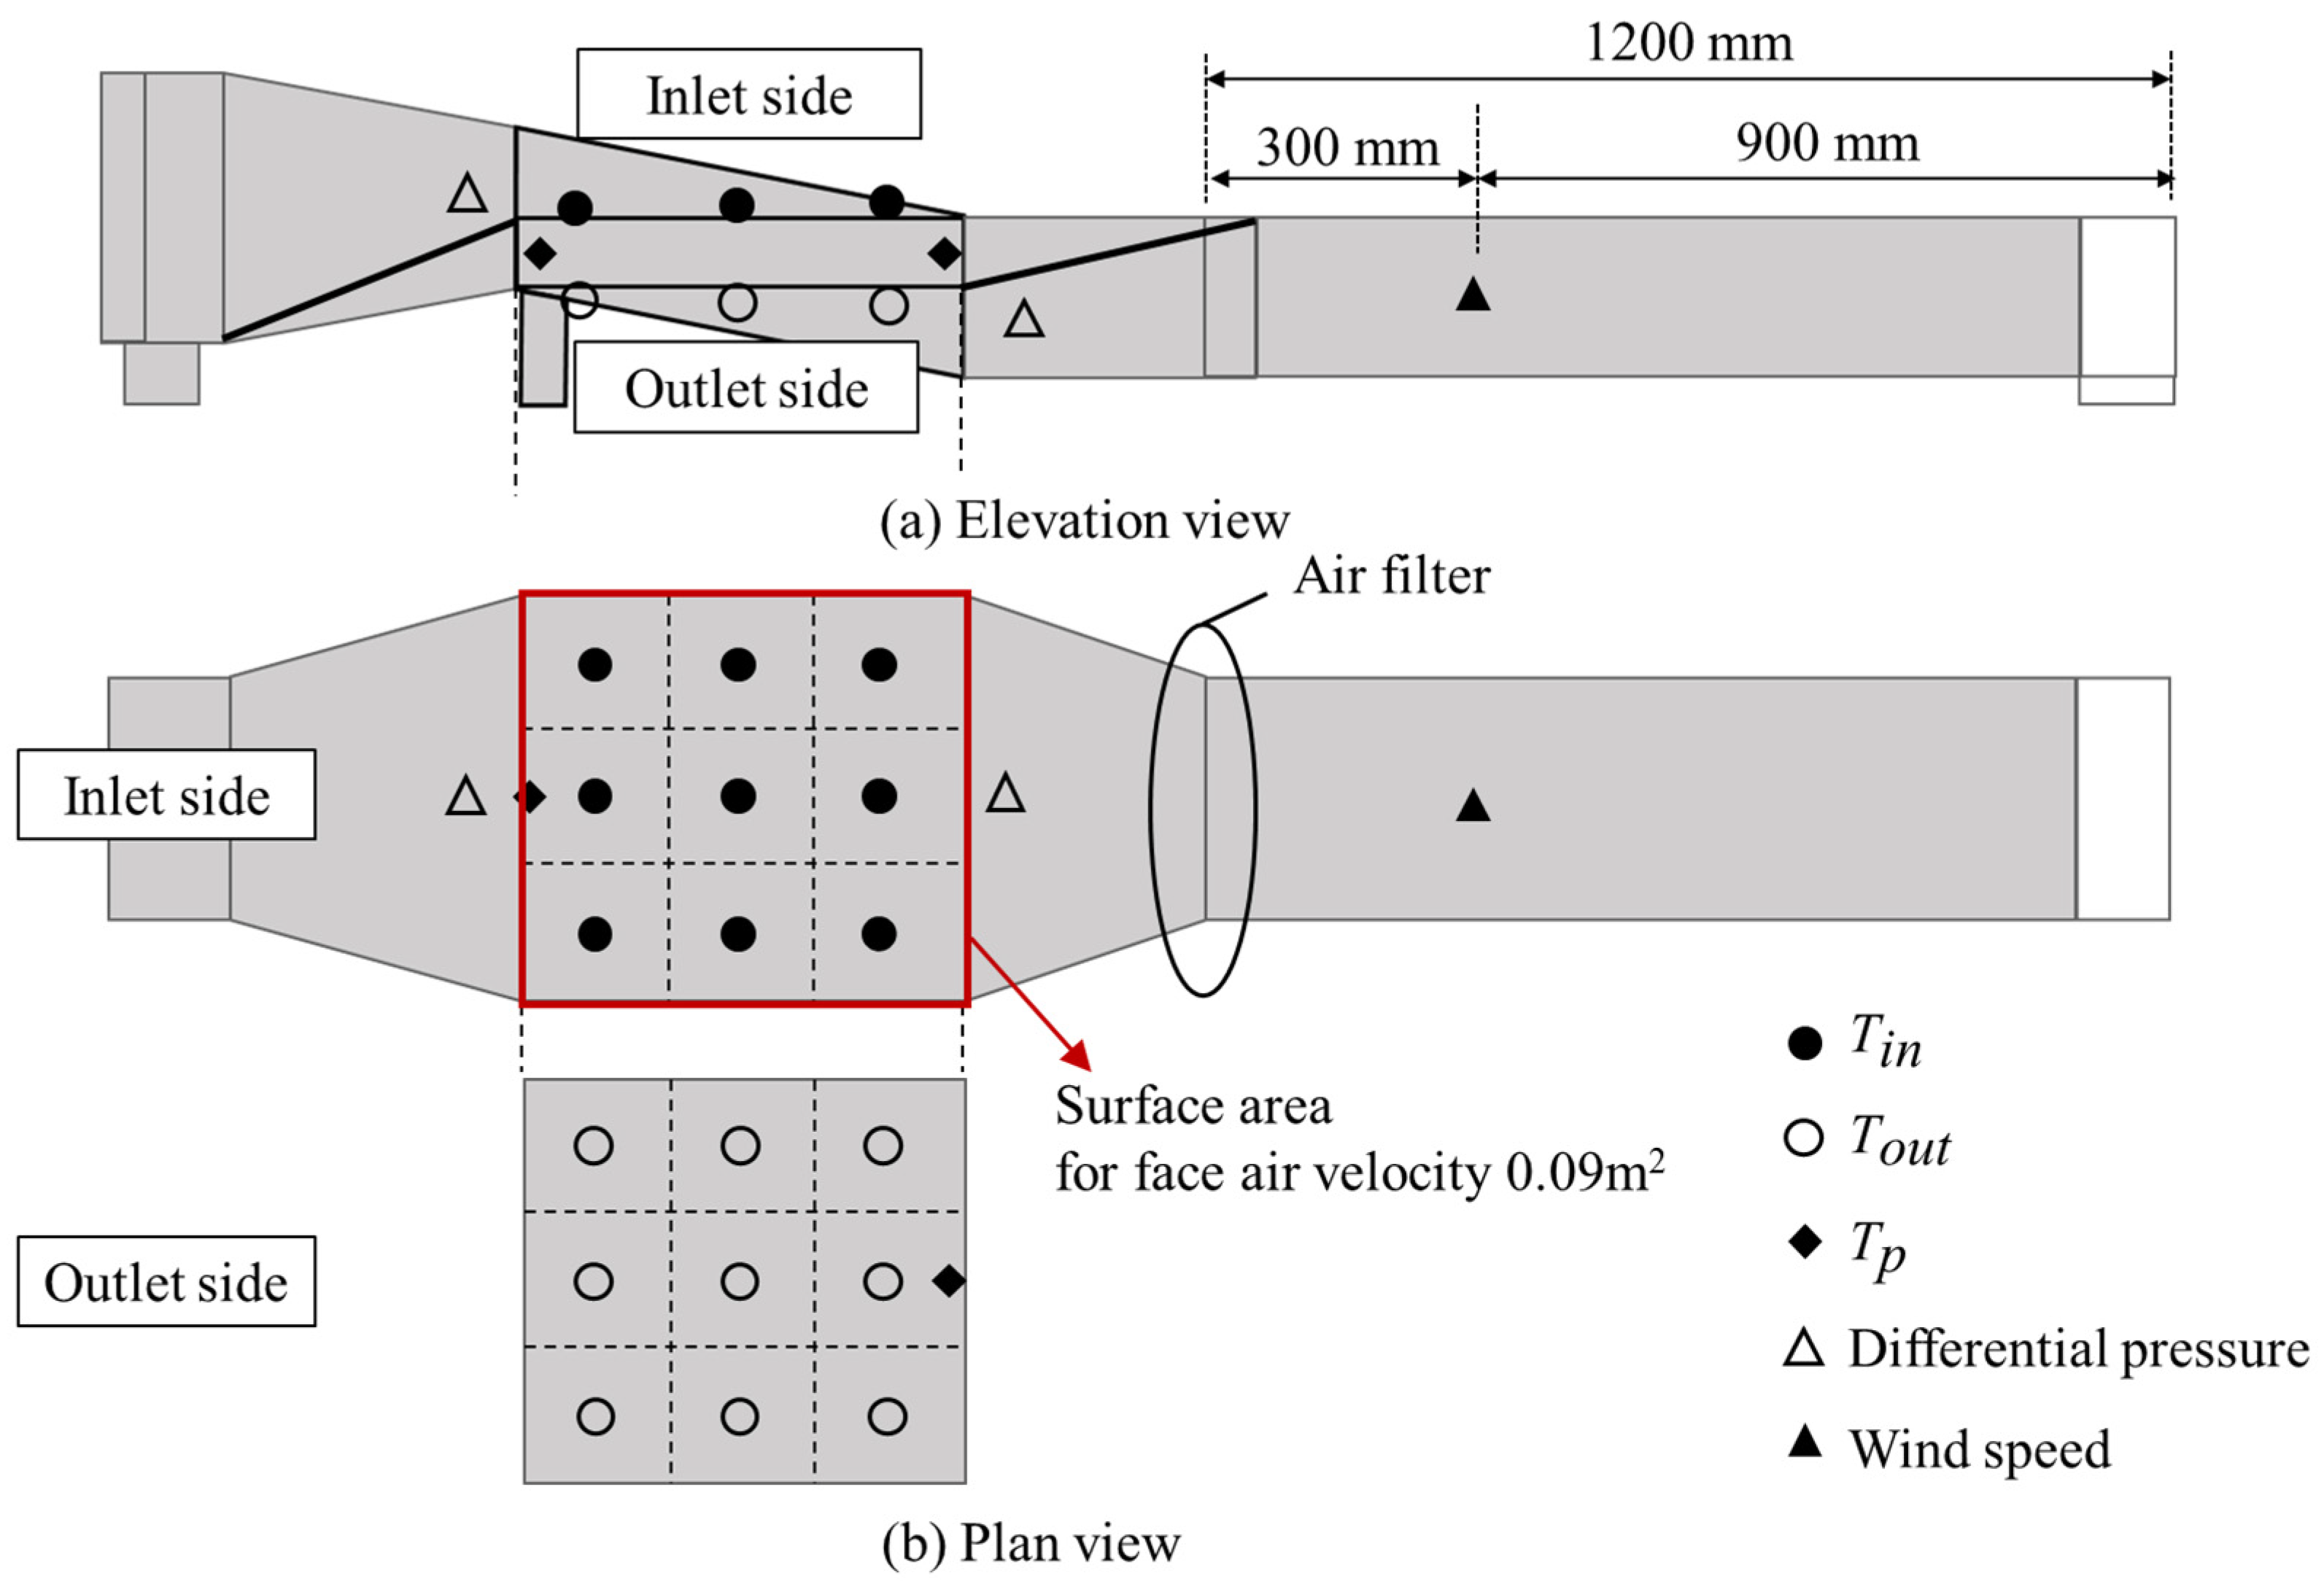
3. Experimental Setup
4. Experimental Results
- (1)
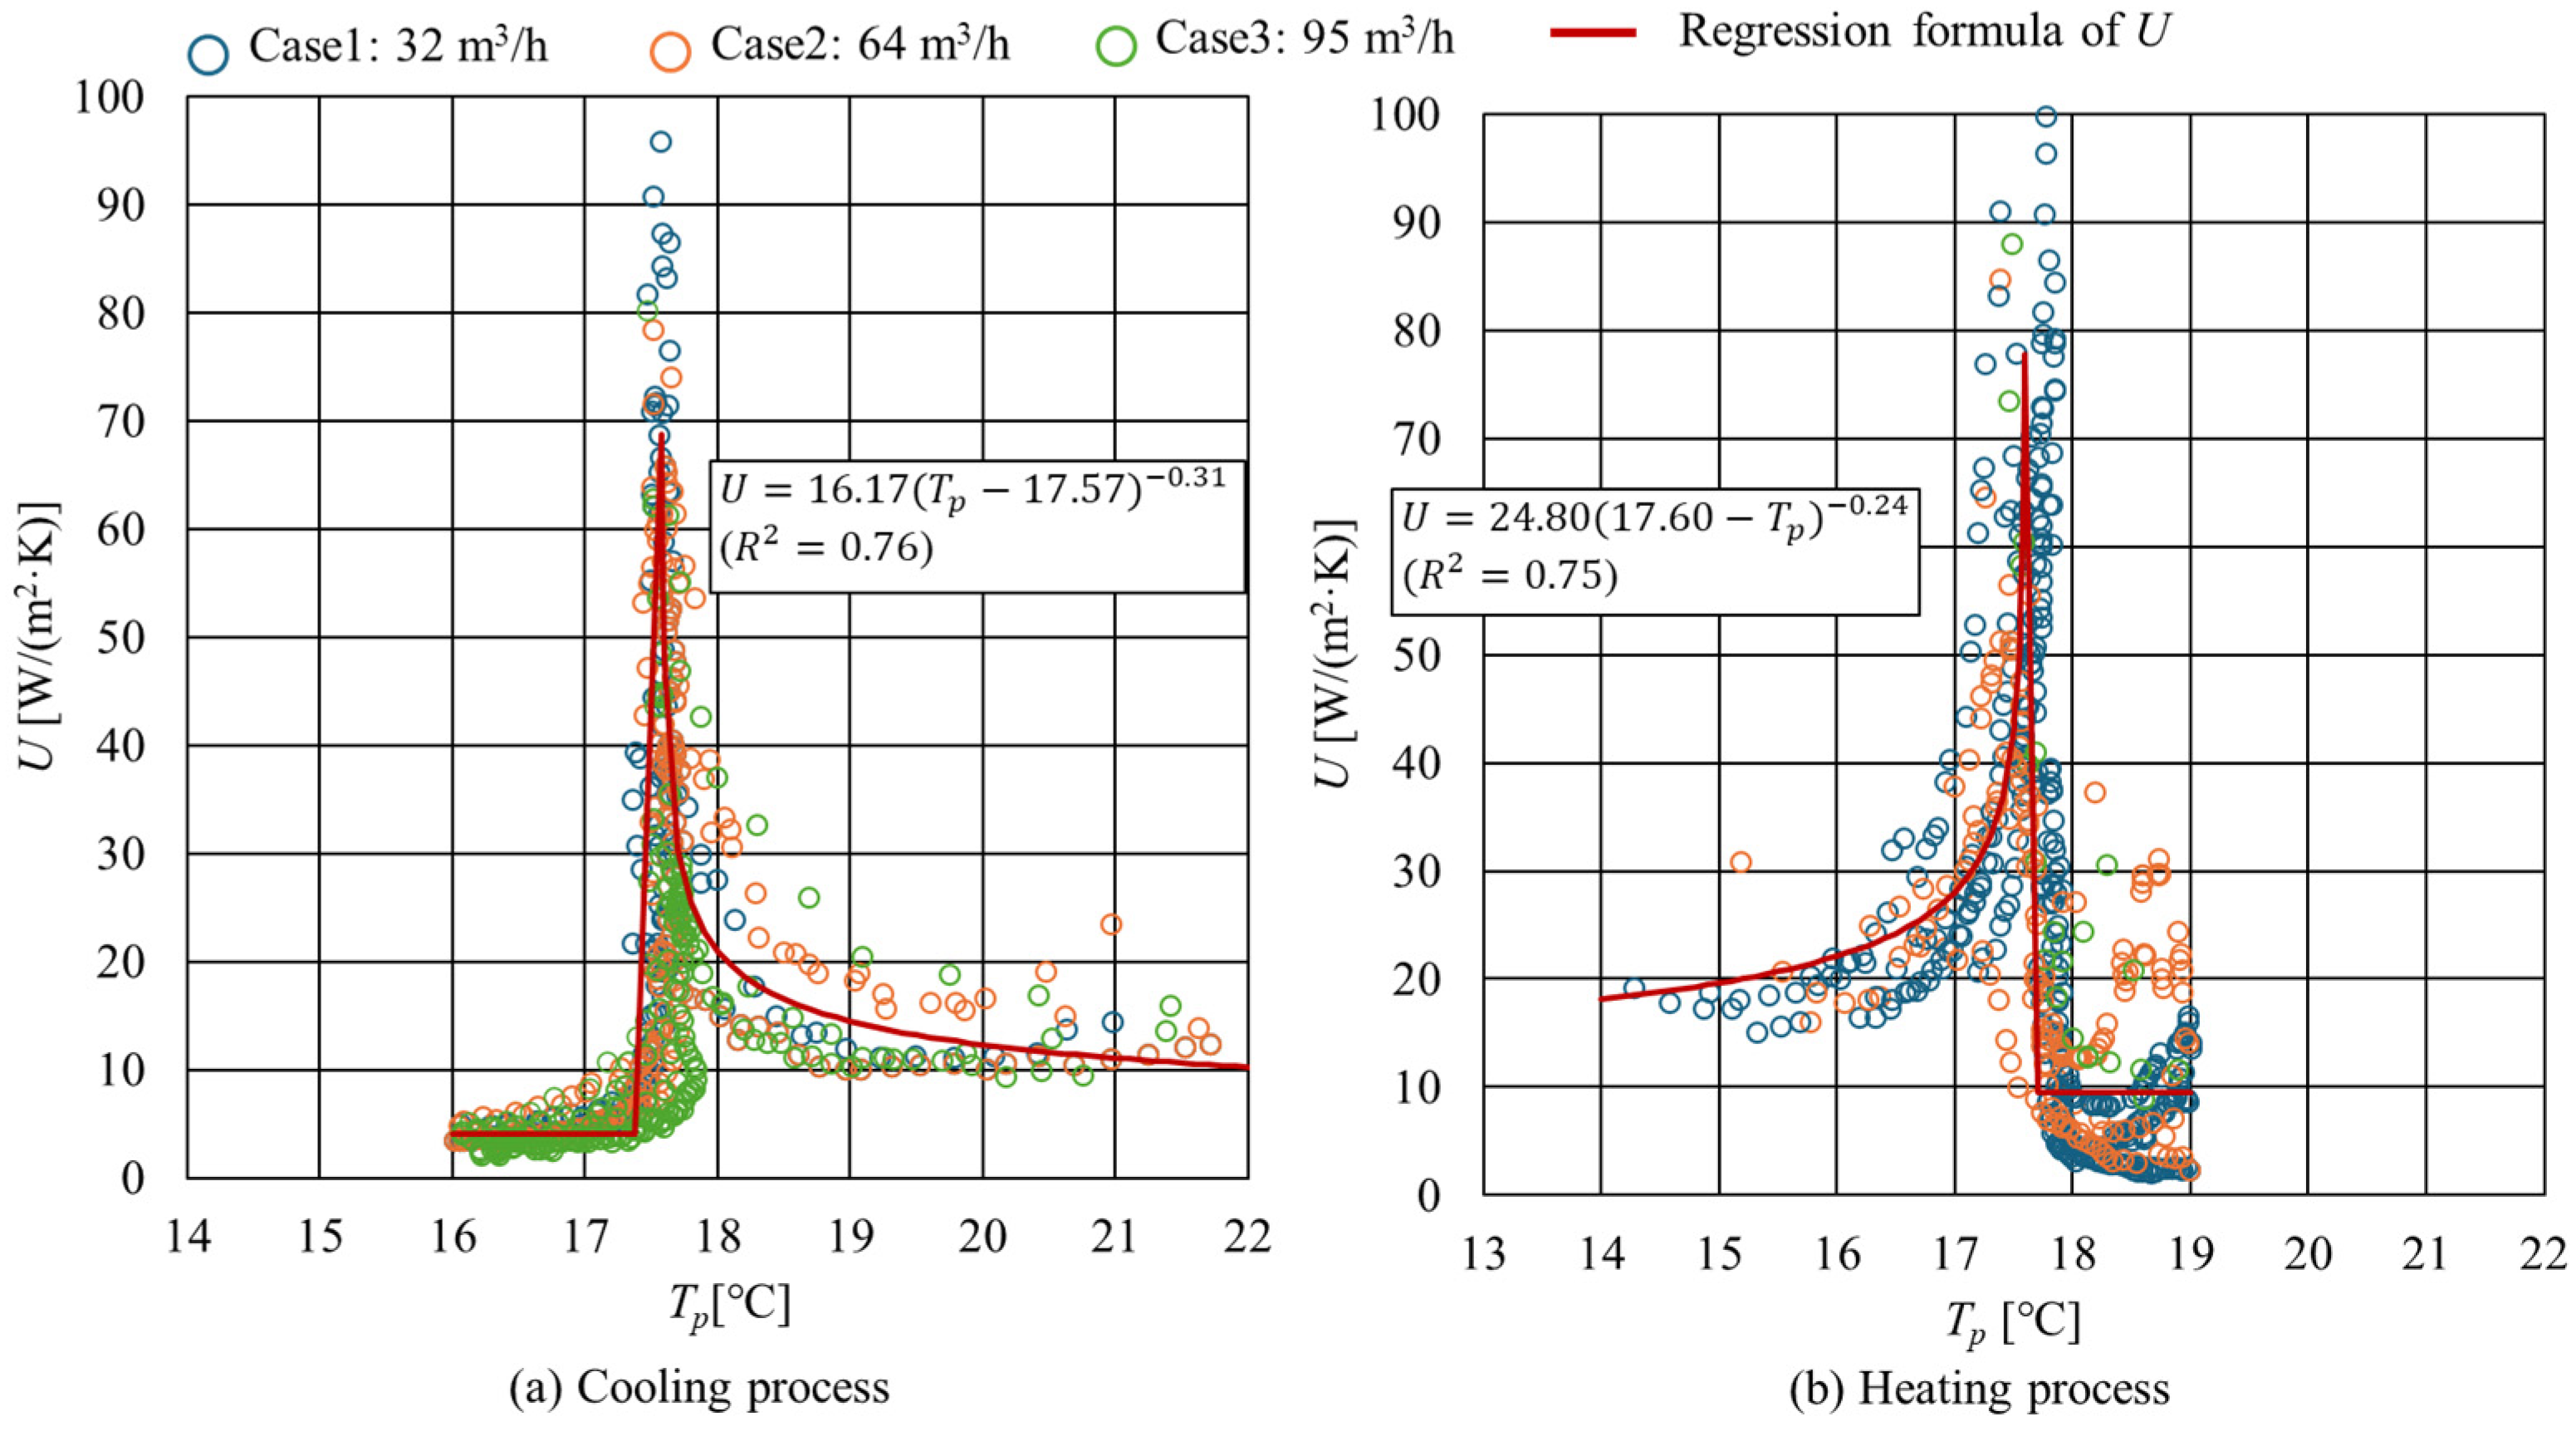
- The maximum U and corresponding Tp for each case were averaged to obtain U = 69 W/(m2·K) at Tp = 17.60 °C during the cooling process and U = 77 W/(m2·K) at Tp = 17.55 °C during the heating process.
- (2)
- During the phase change, the relationship between U and Tp can be approximated as a power law that asymptotically approaches 17.57 °C during the cooling process and 17.60 °C during the heating process, where a bi-square weighting function is applied to prevent the influence of outliers.
- (3)
- After the phase change, U decreased linearly from the maximum U value with a temperature difference of 0.2 K to constant values of 4.1 W/(m2·K) during the cooling process and 9.5 W/(m2·K) during the heating process, on average.
5. Numerical Model
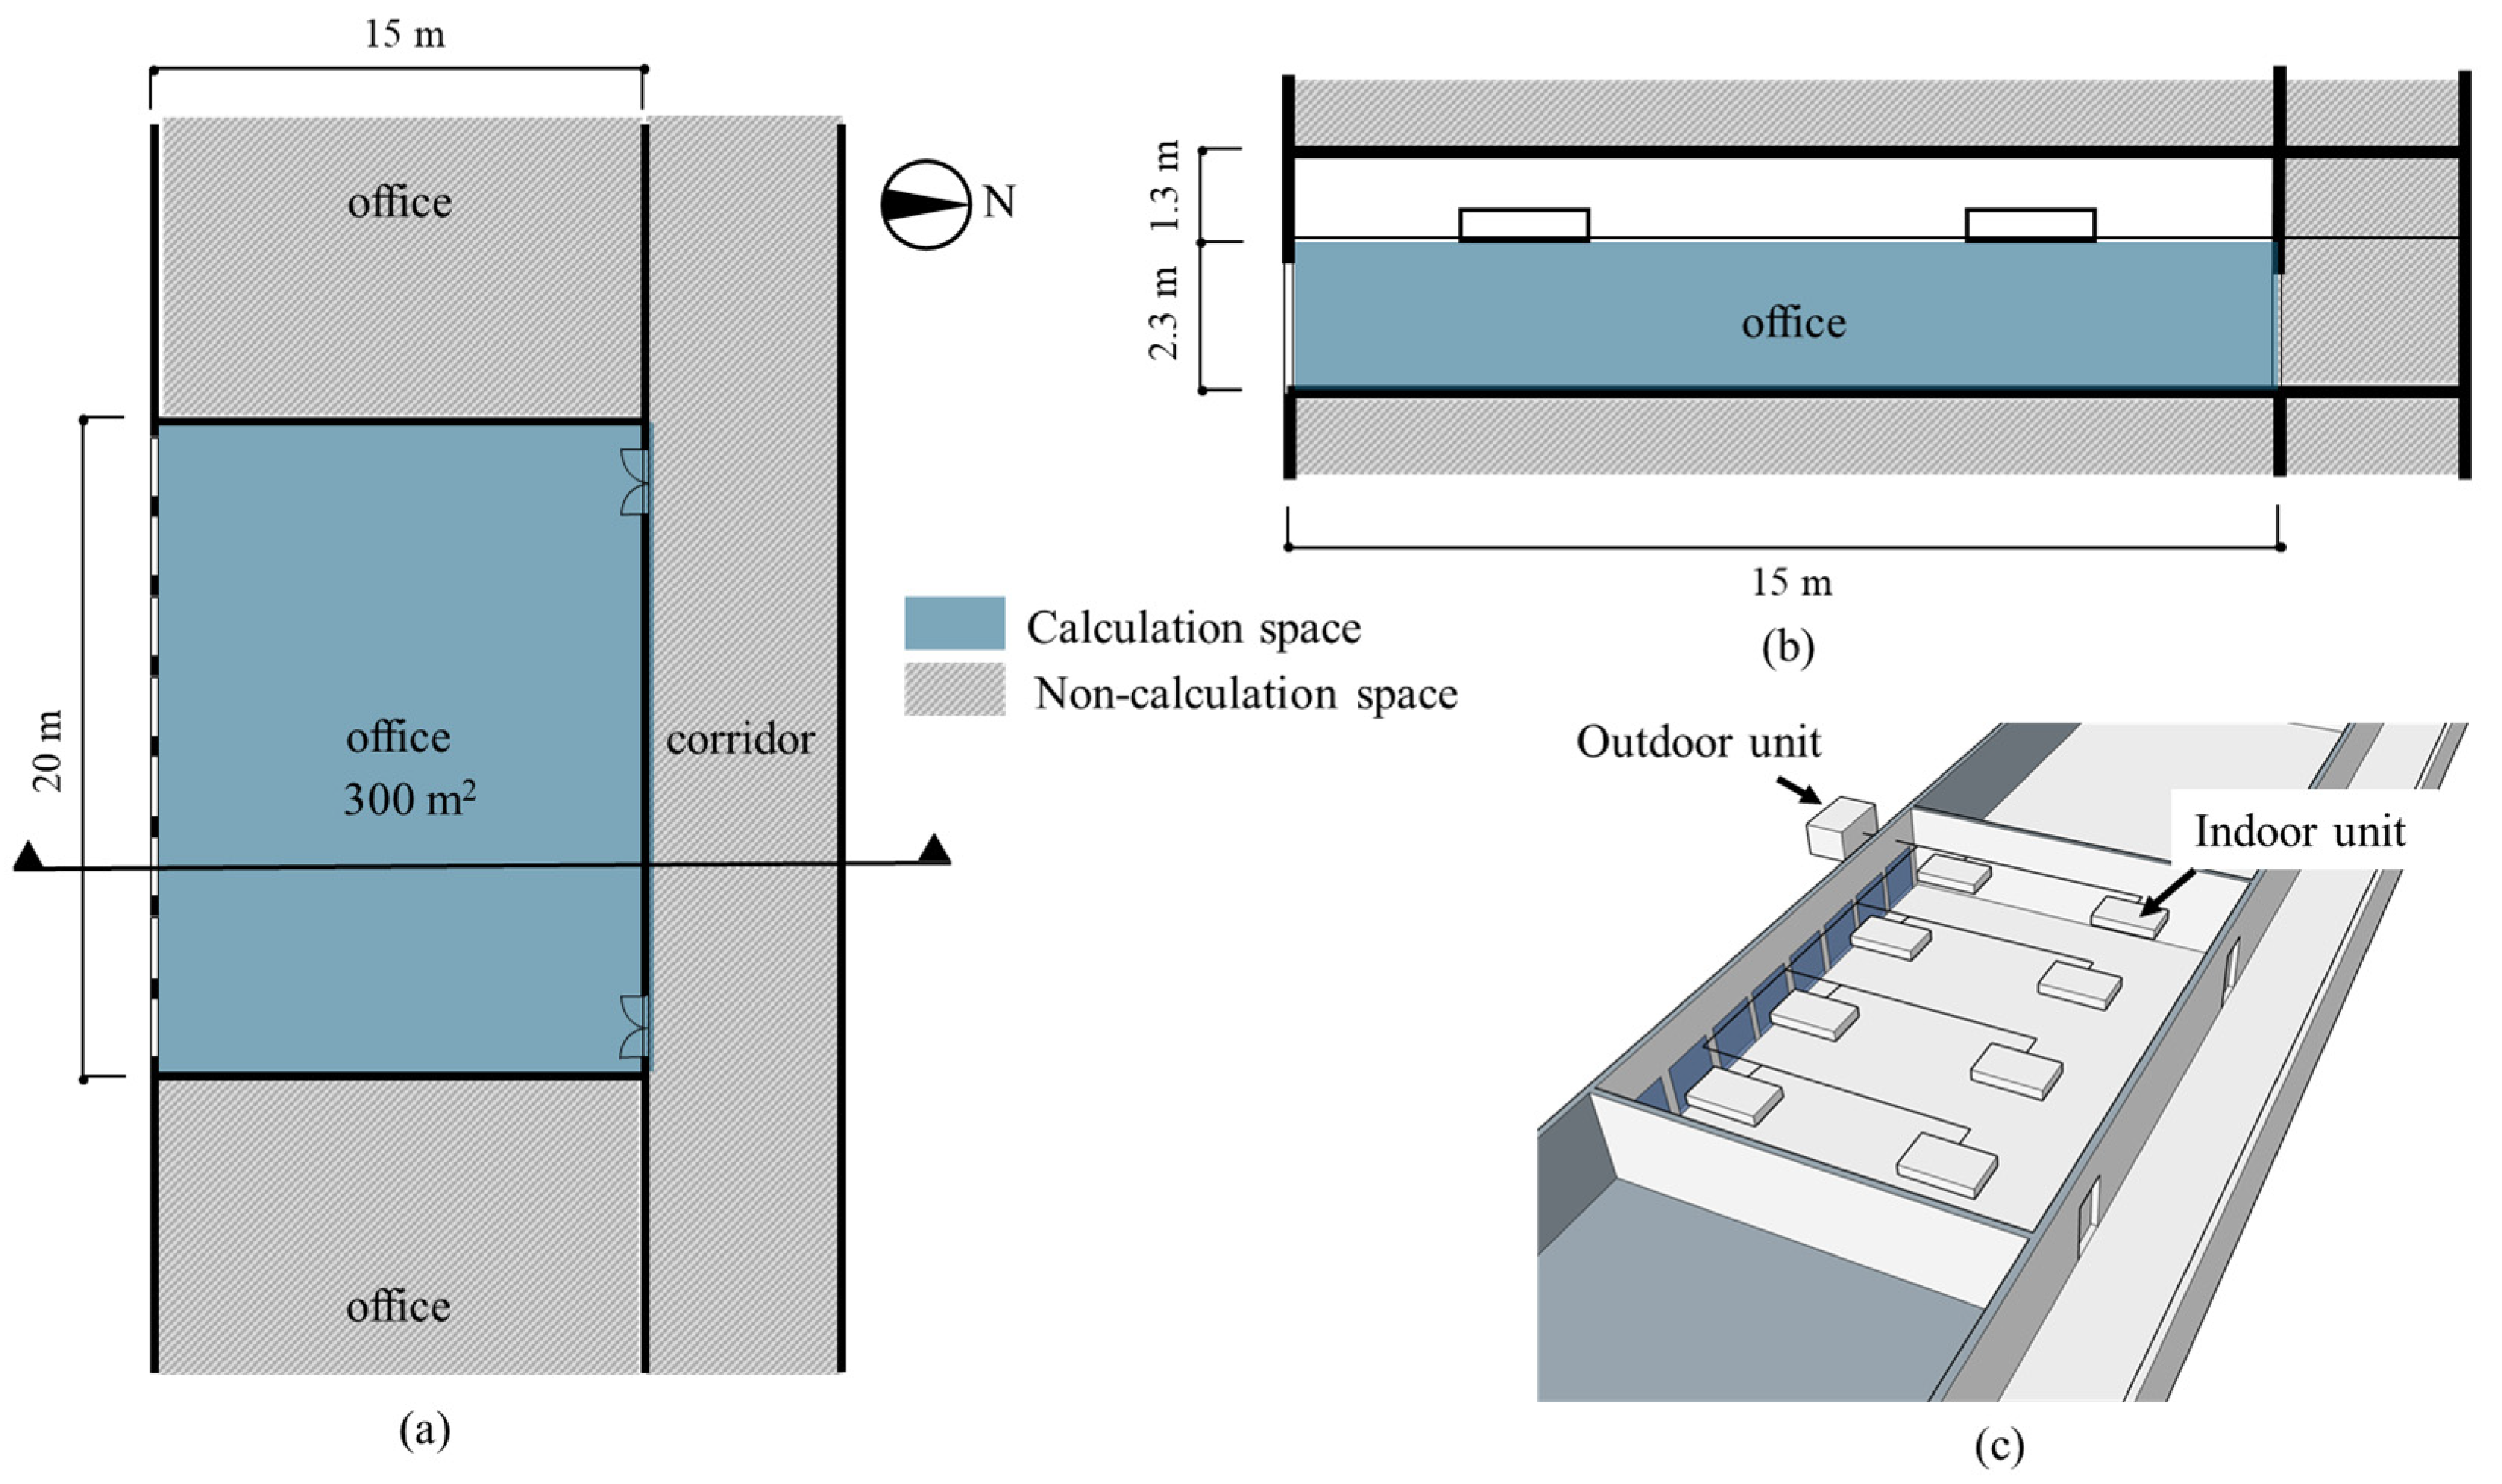
5.1. Setup
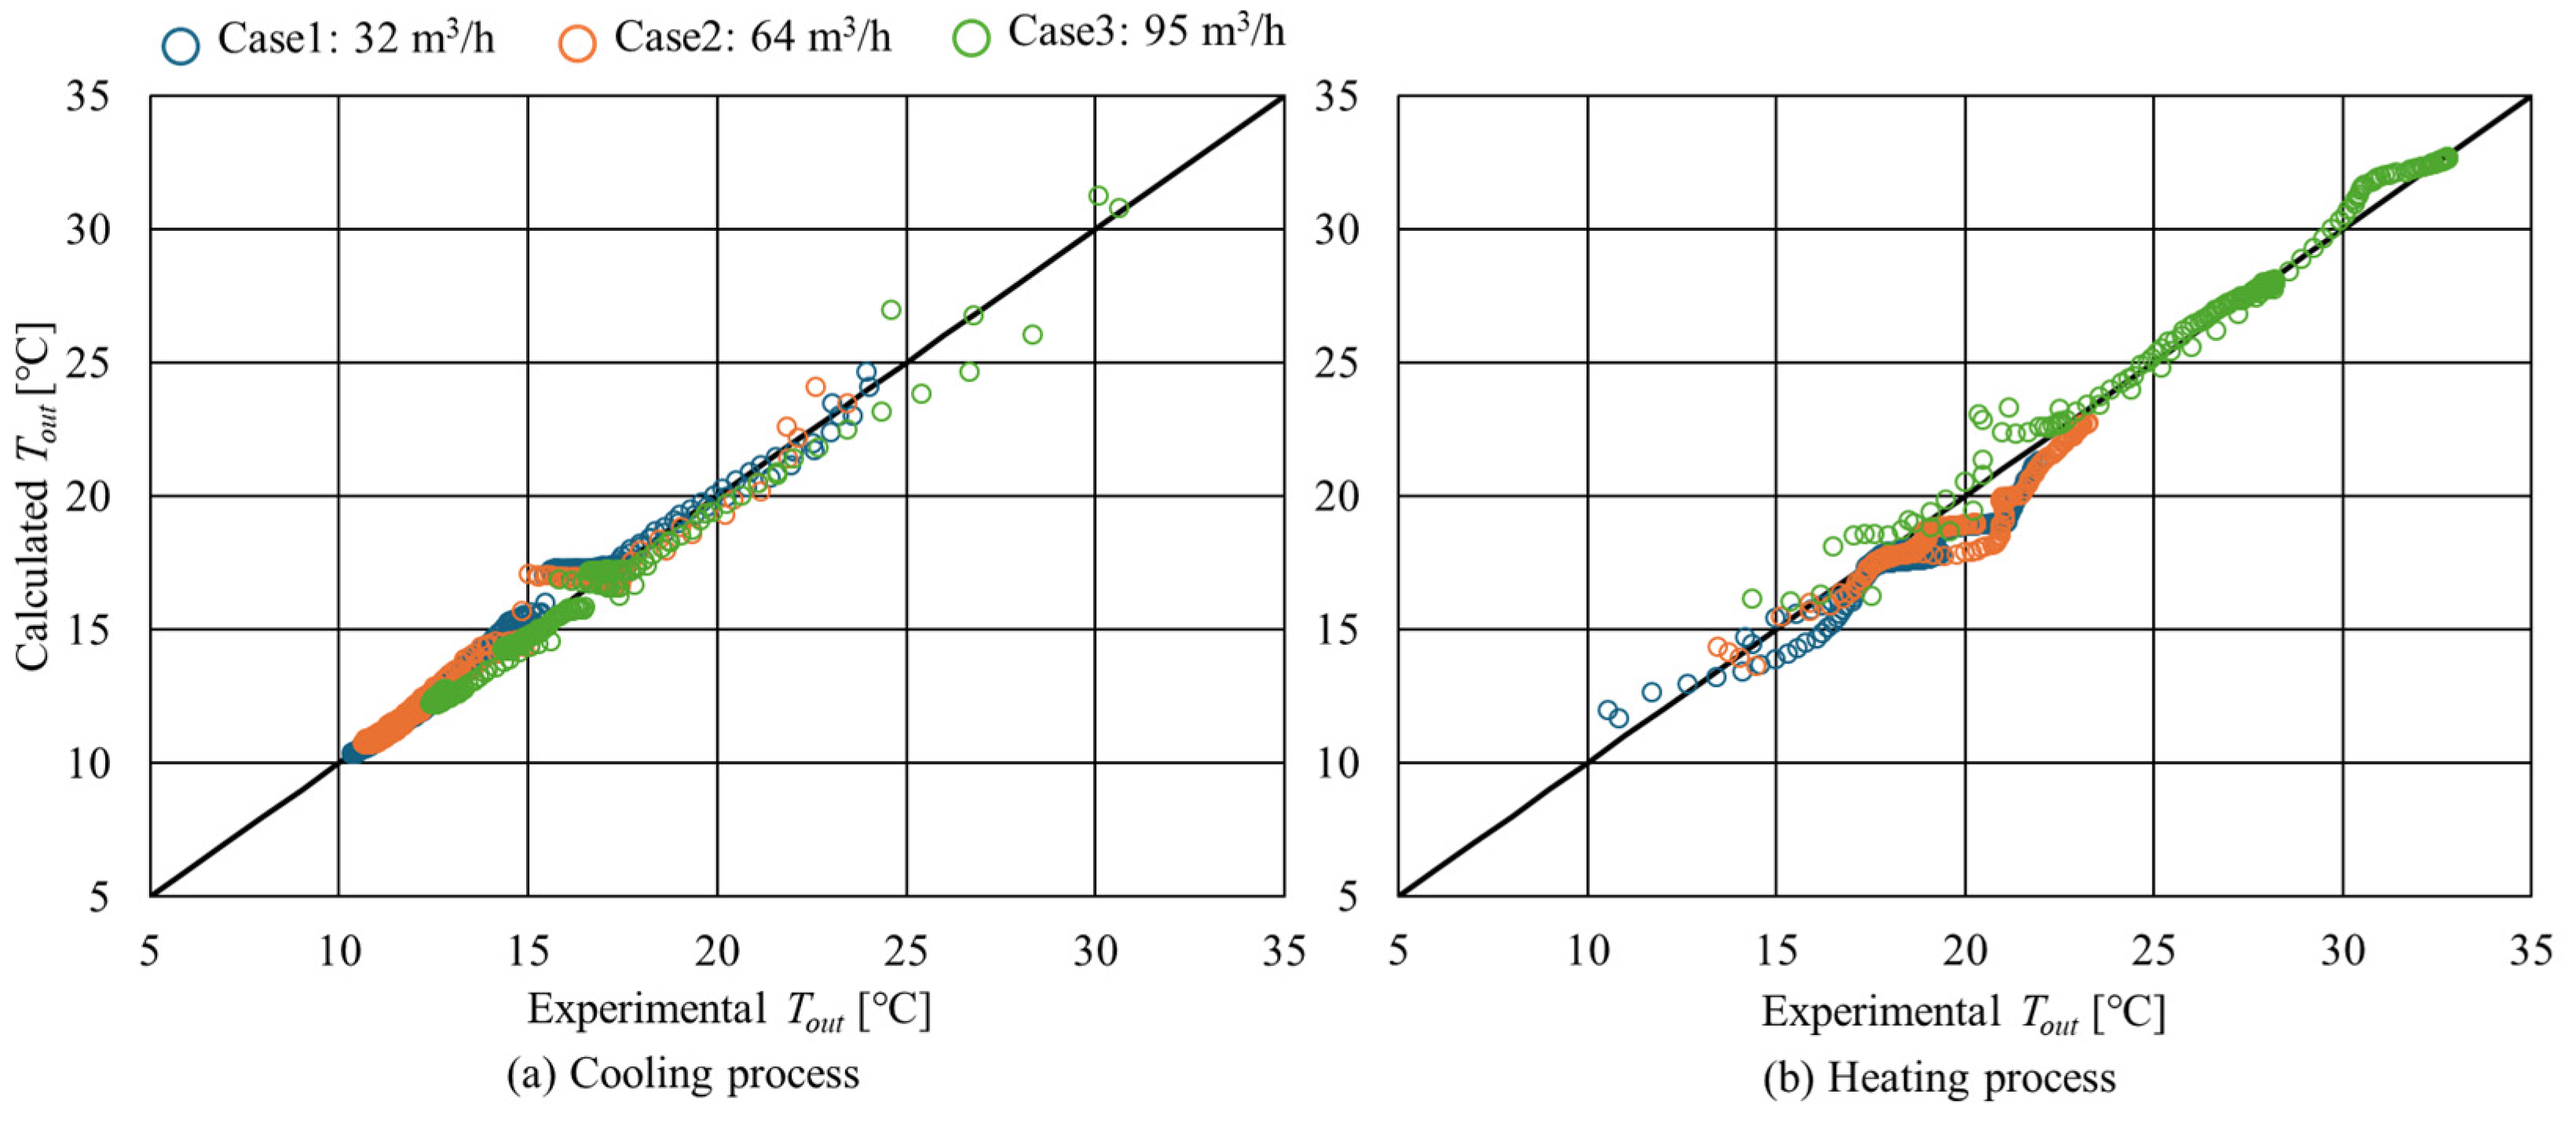
5.2. Verification
6. Simulations
6.1. Conditions
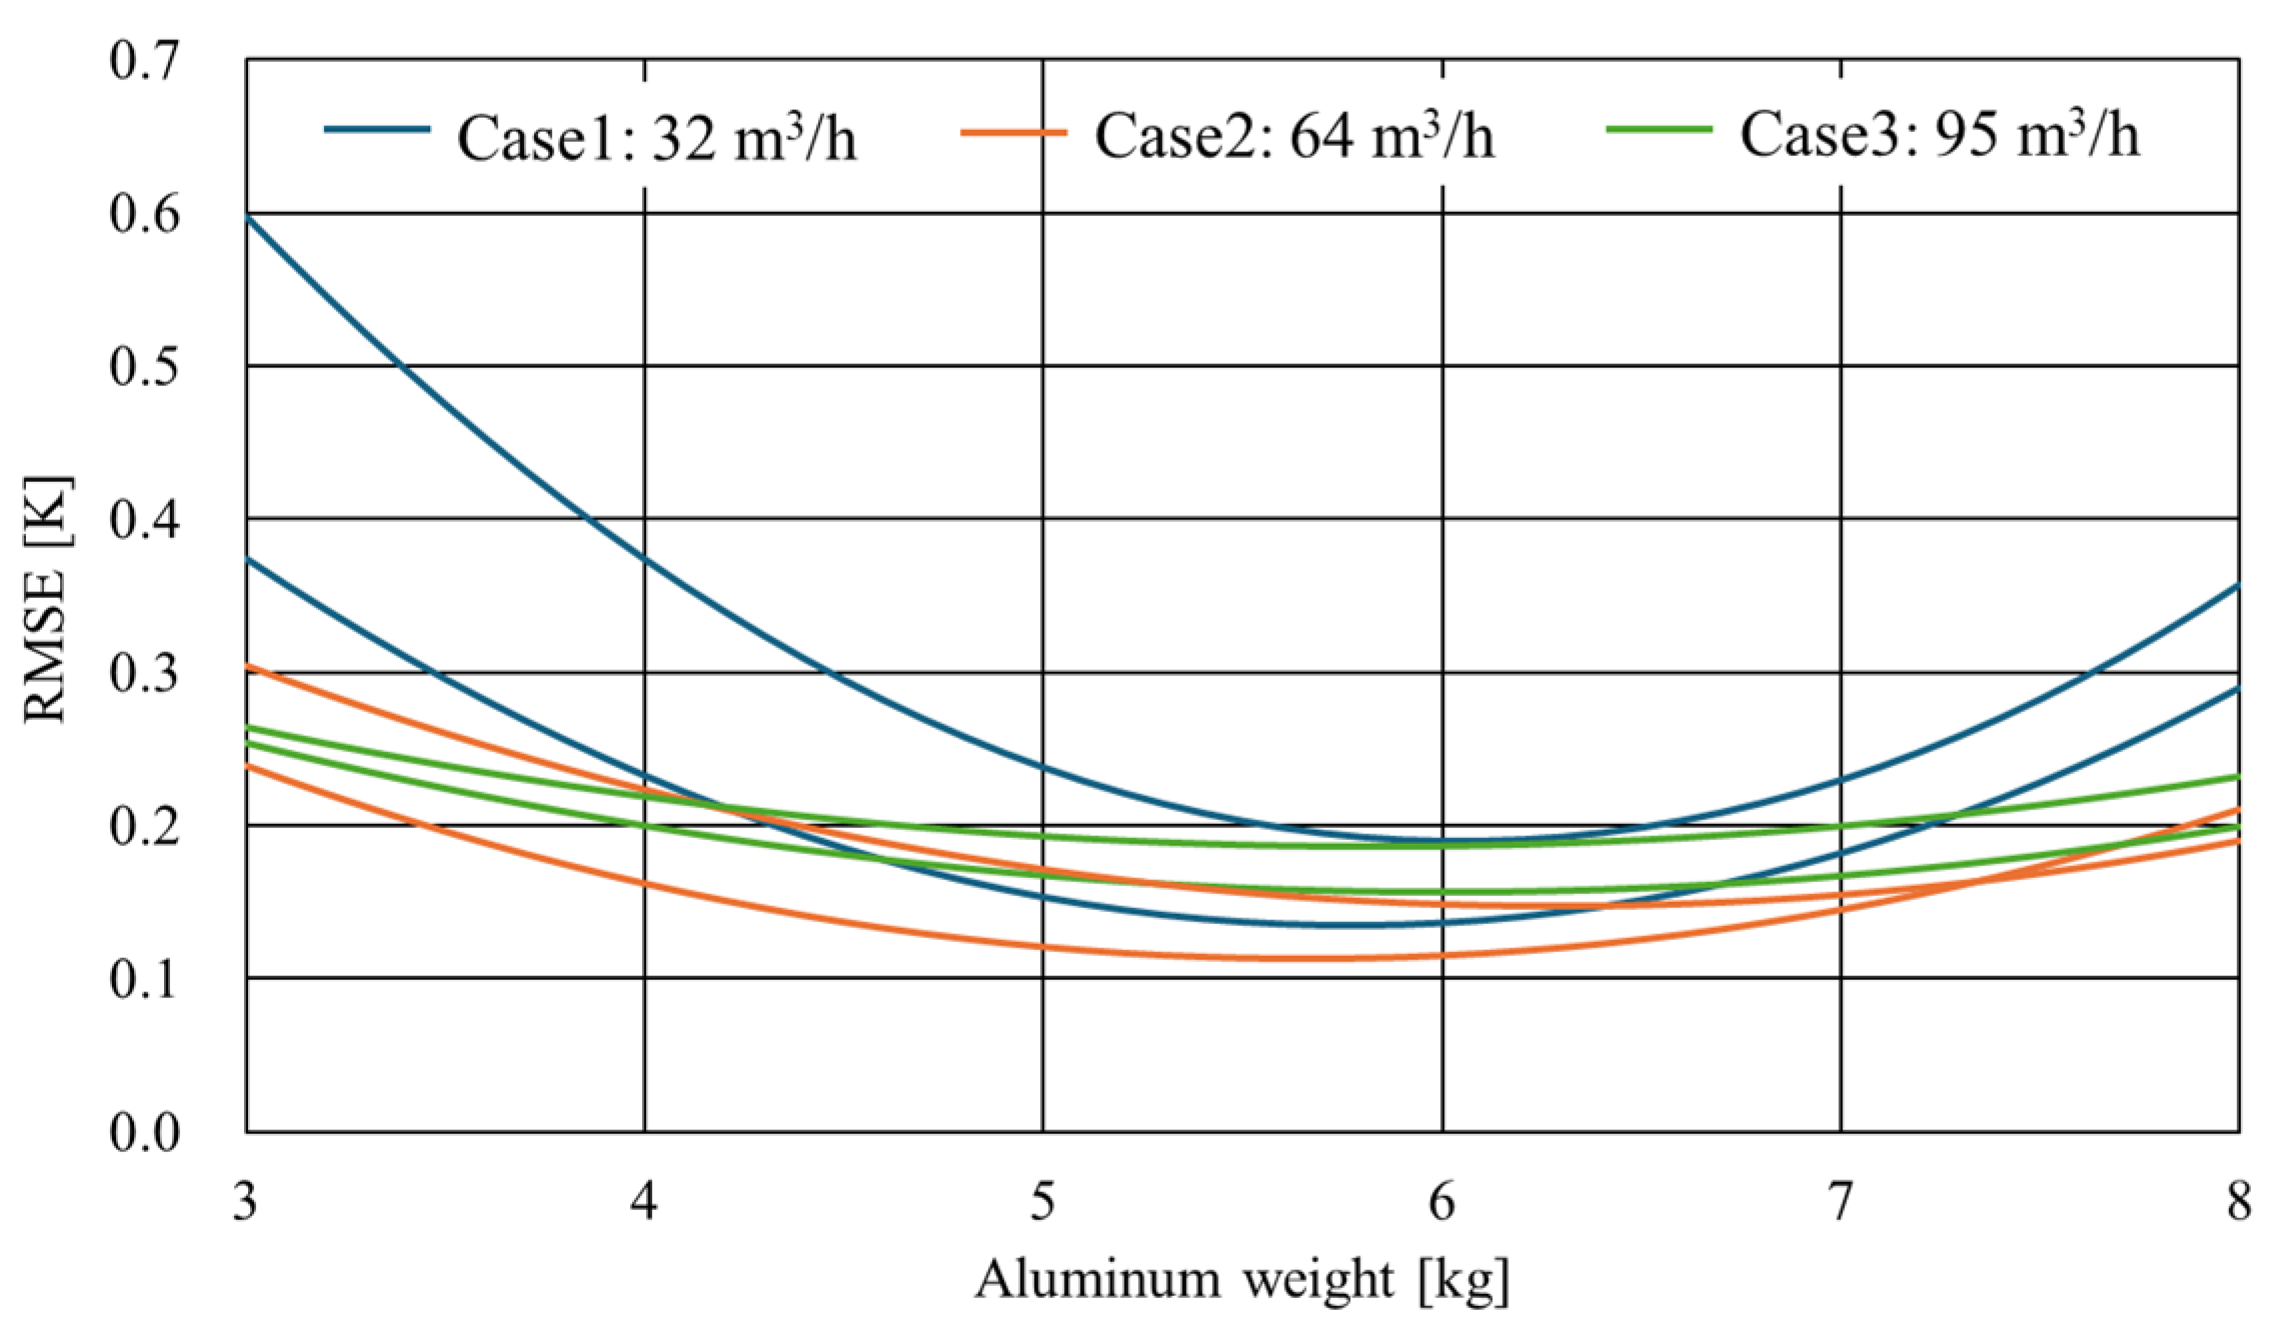
6.2. Optimization of the PCM Weight
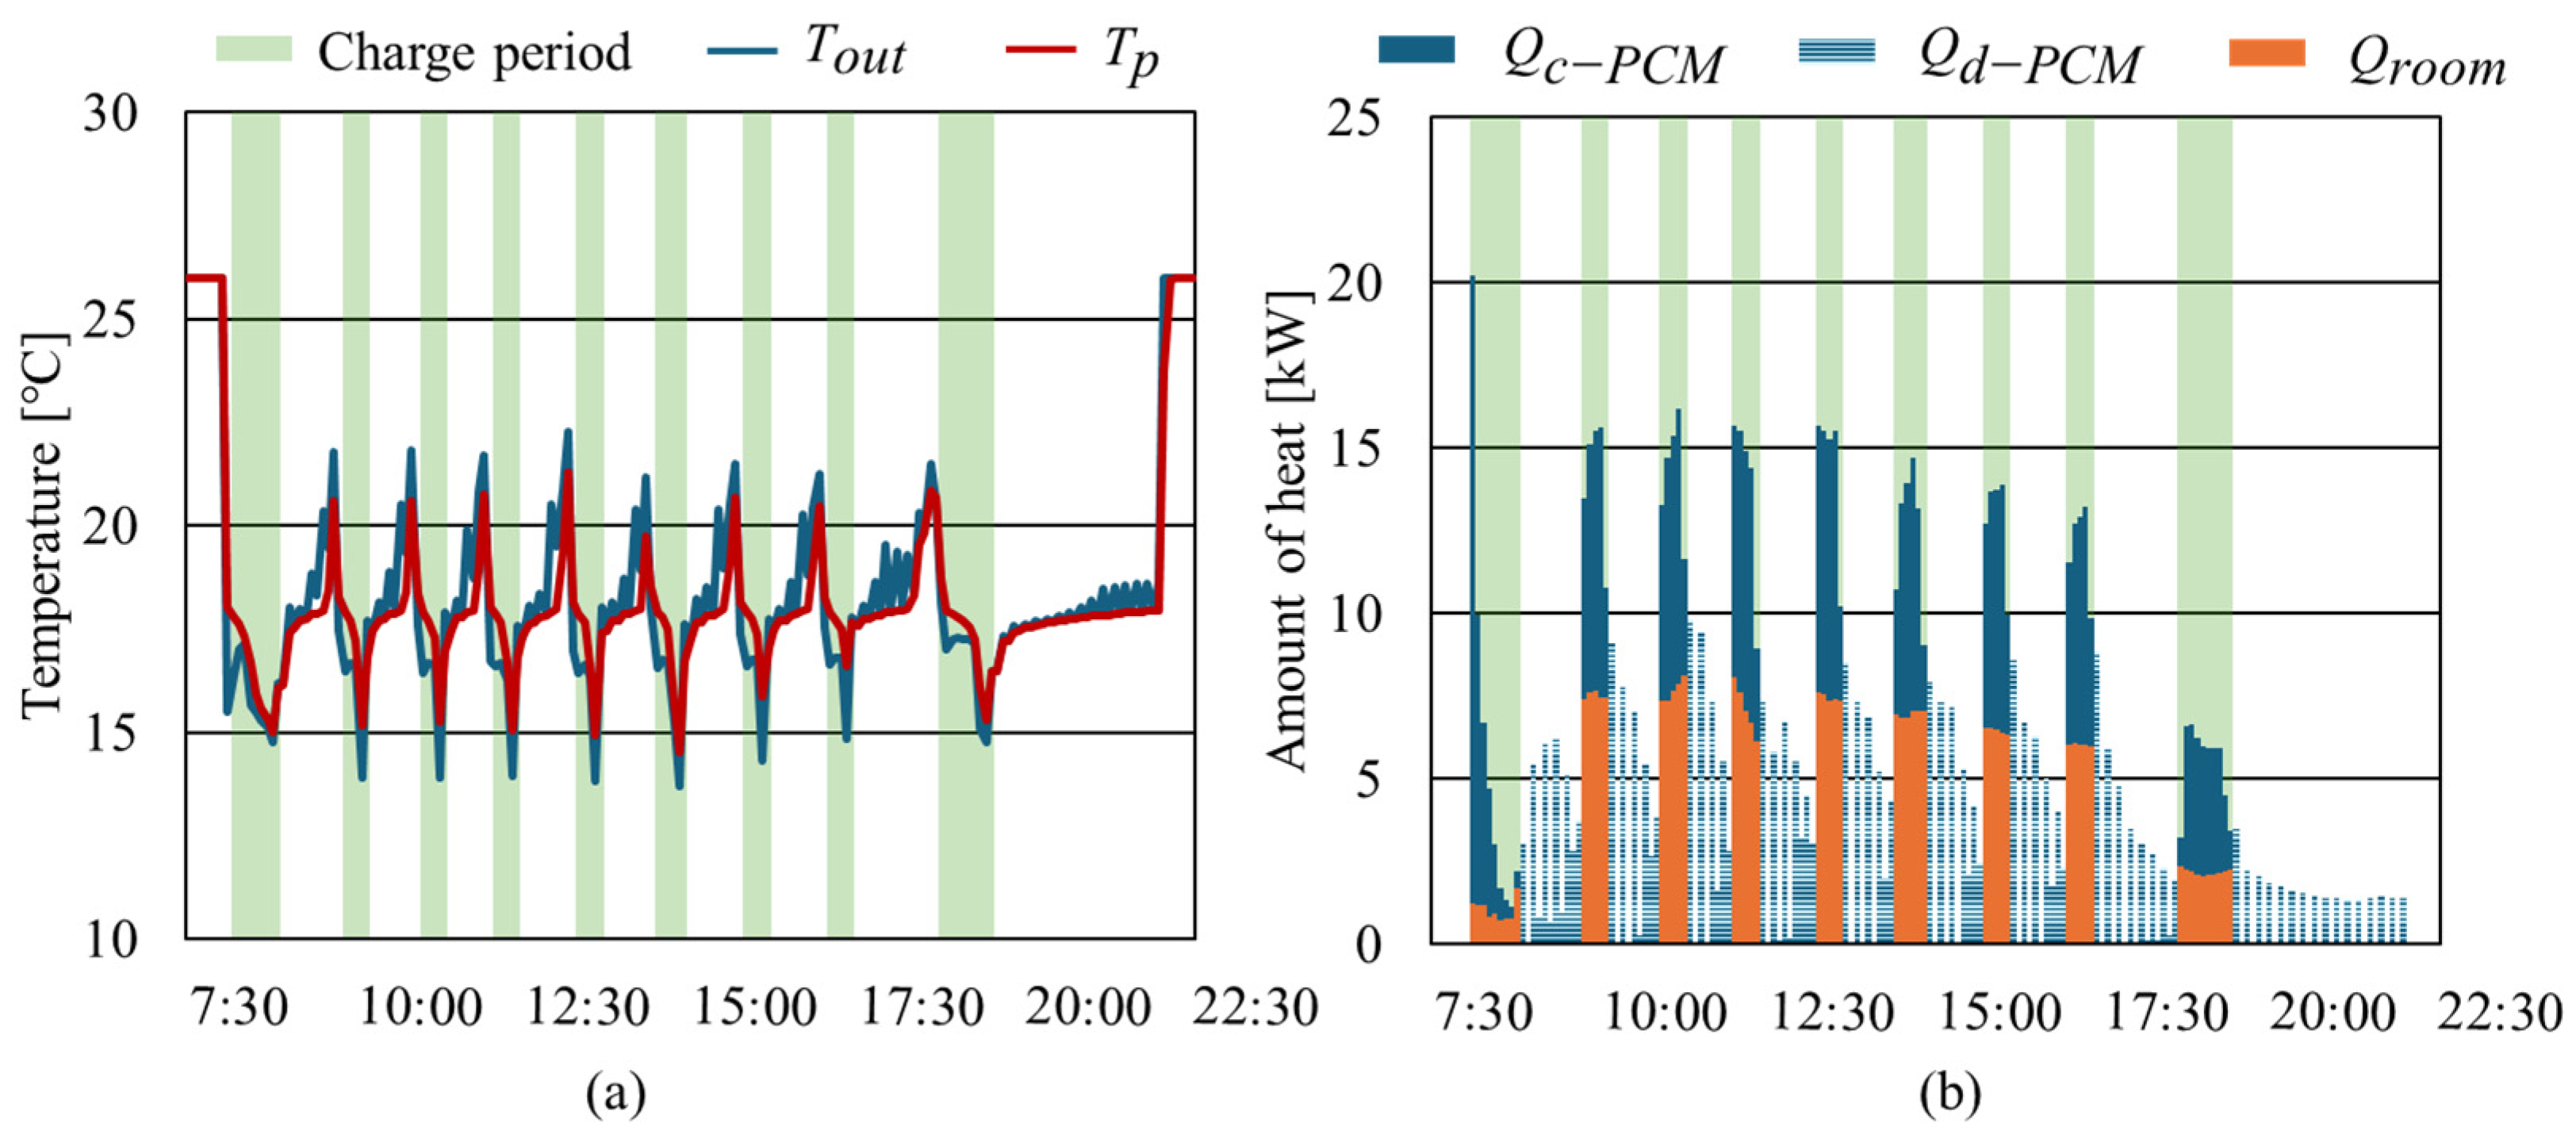
6.3. Thermal Behavior on a Representative Day
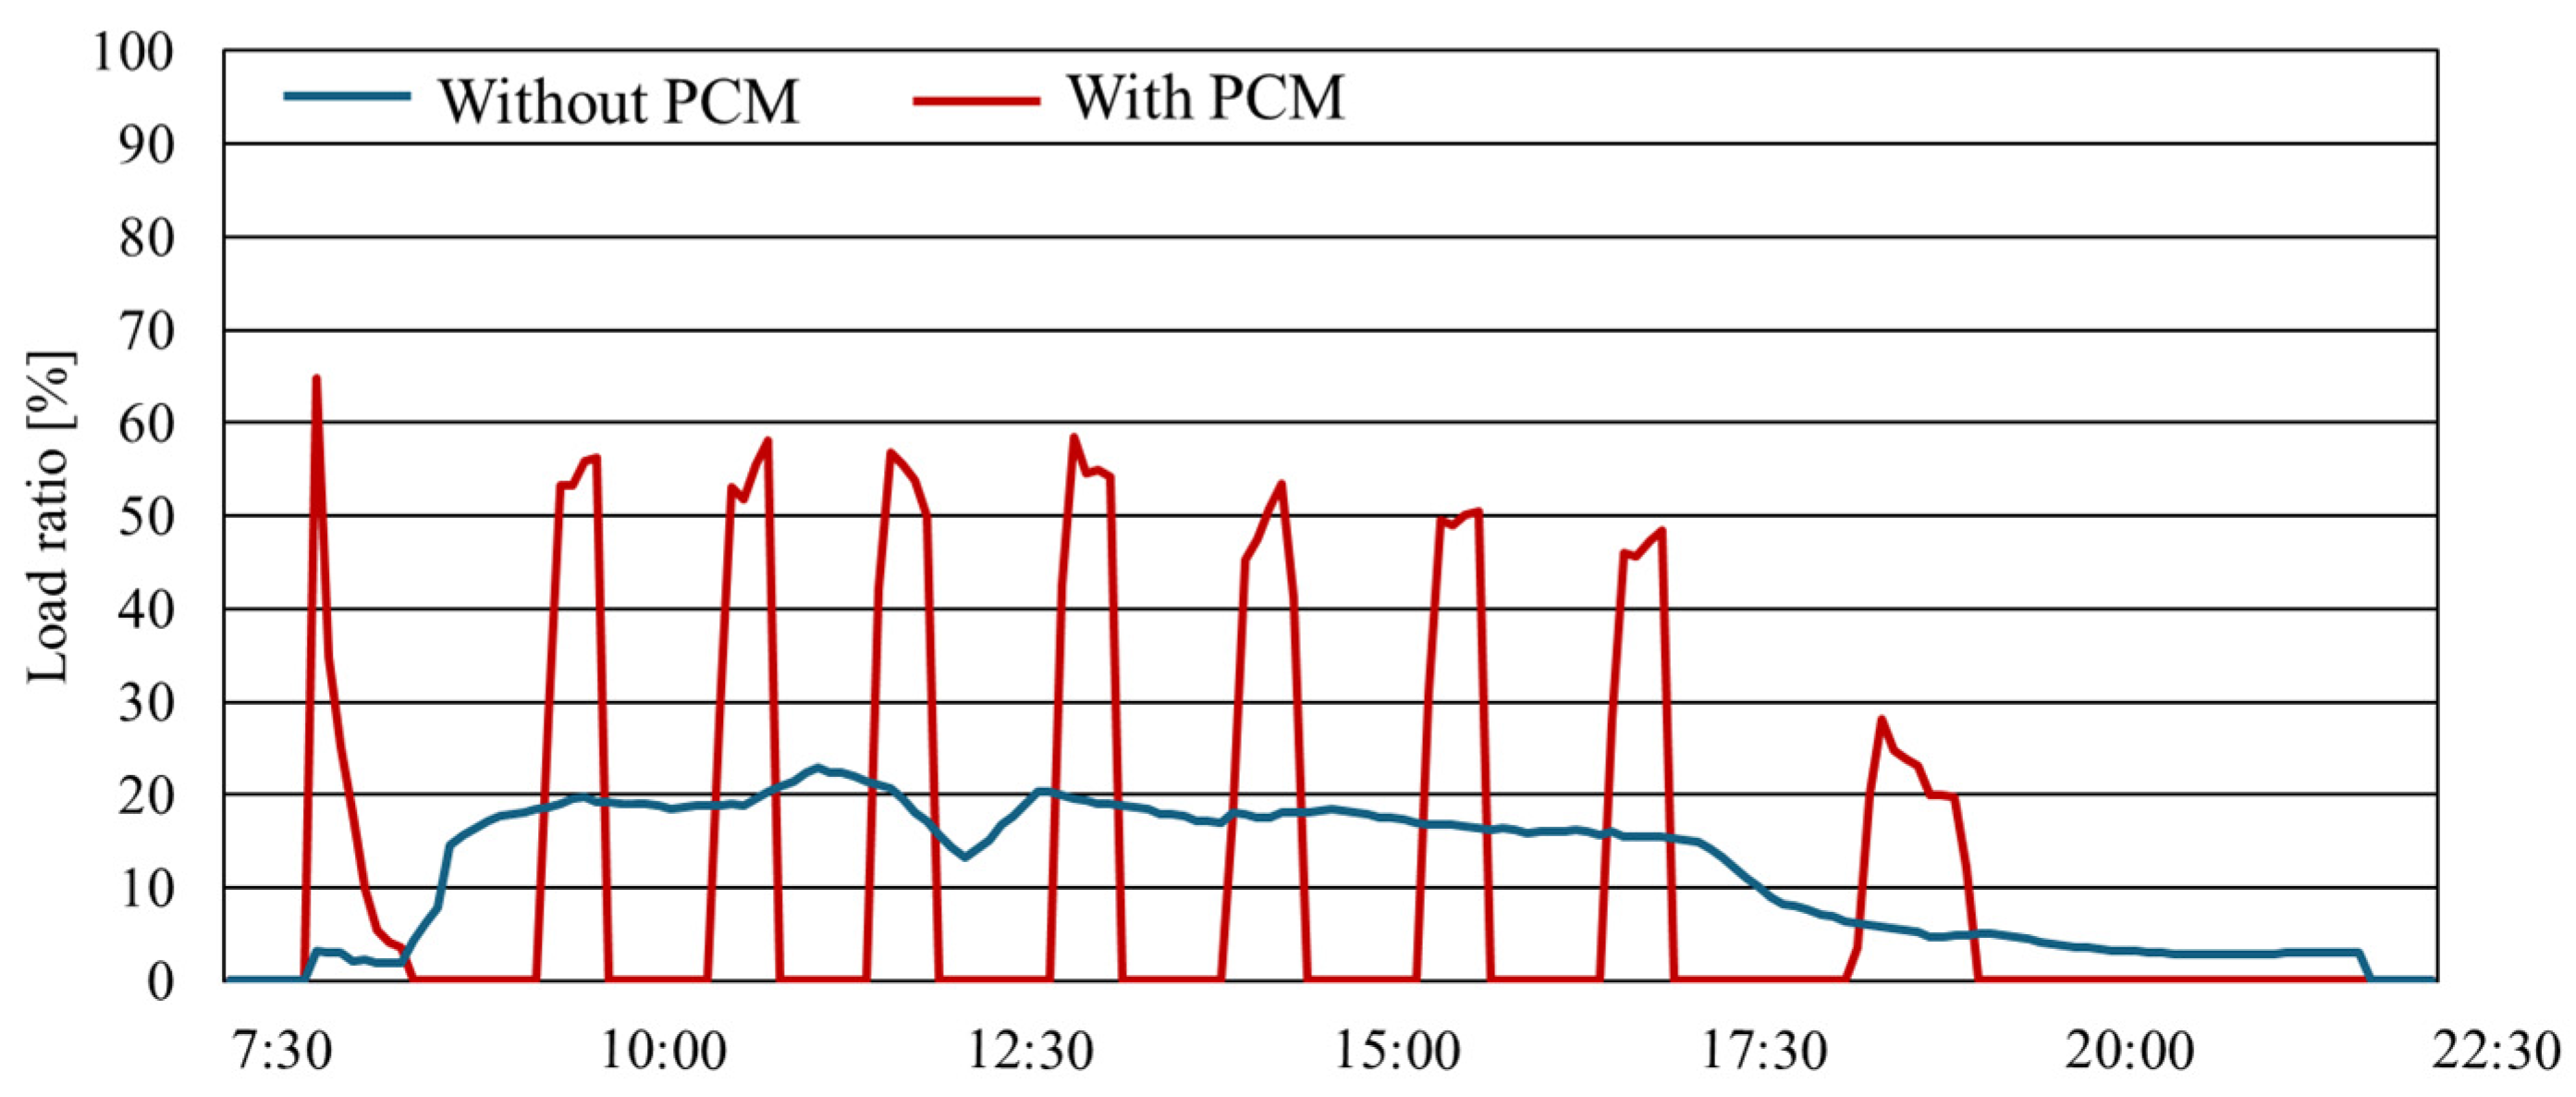
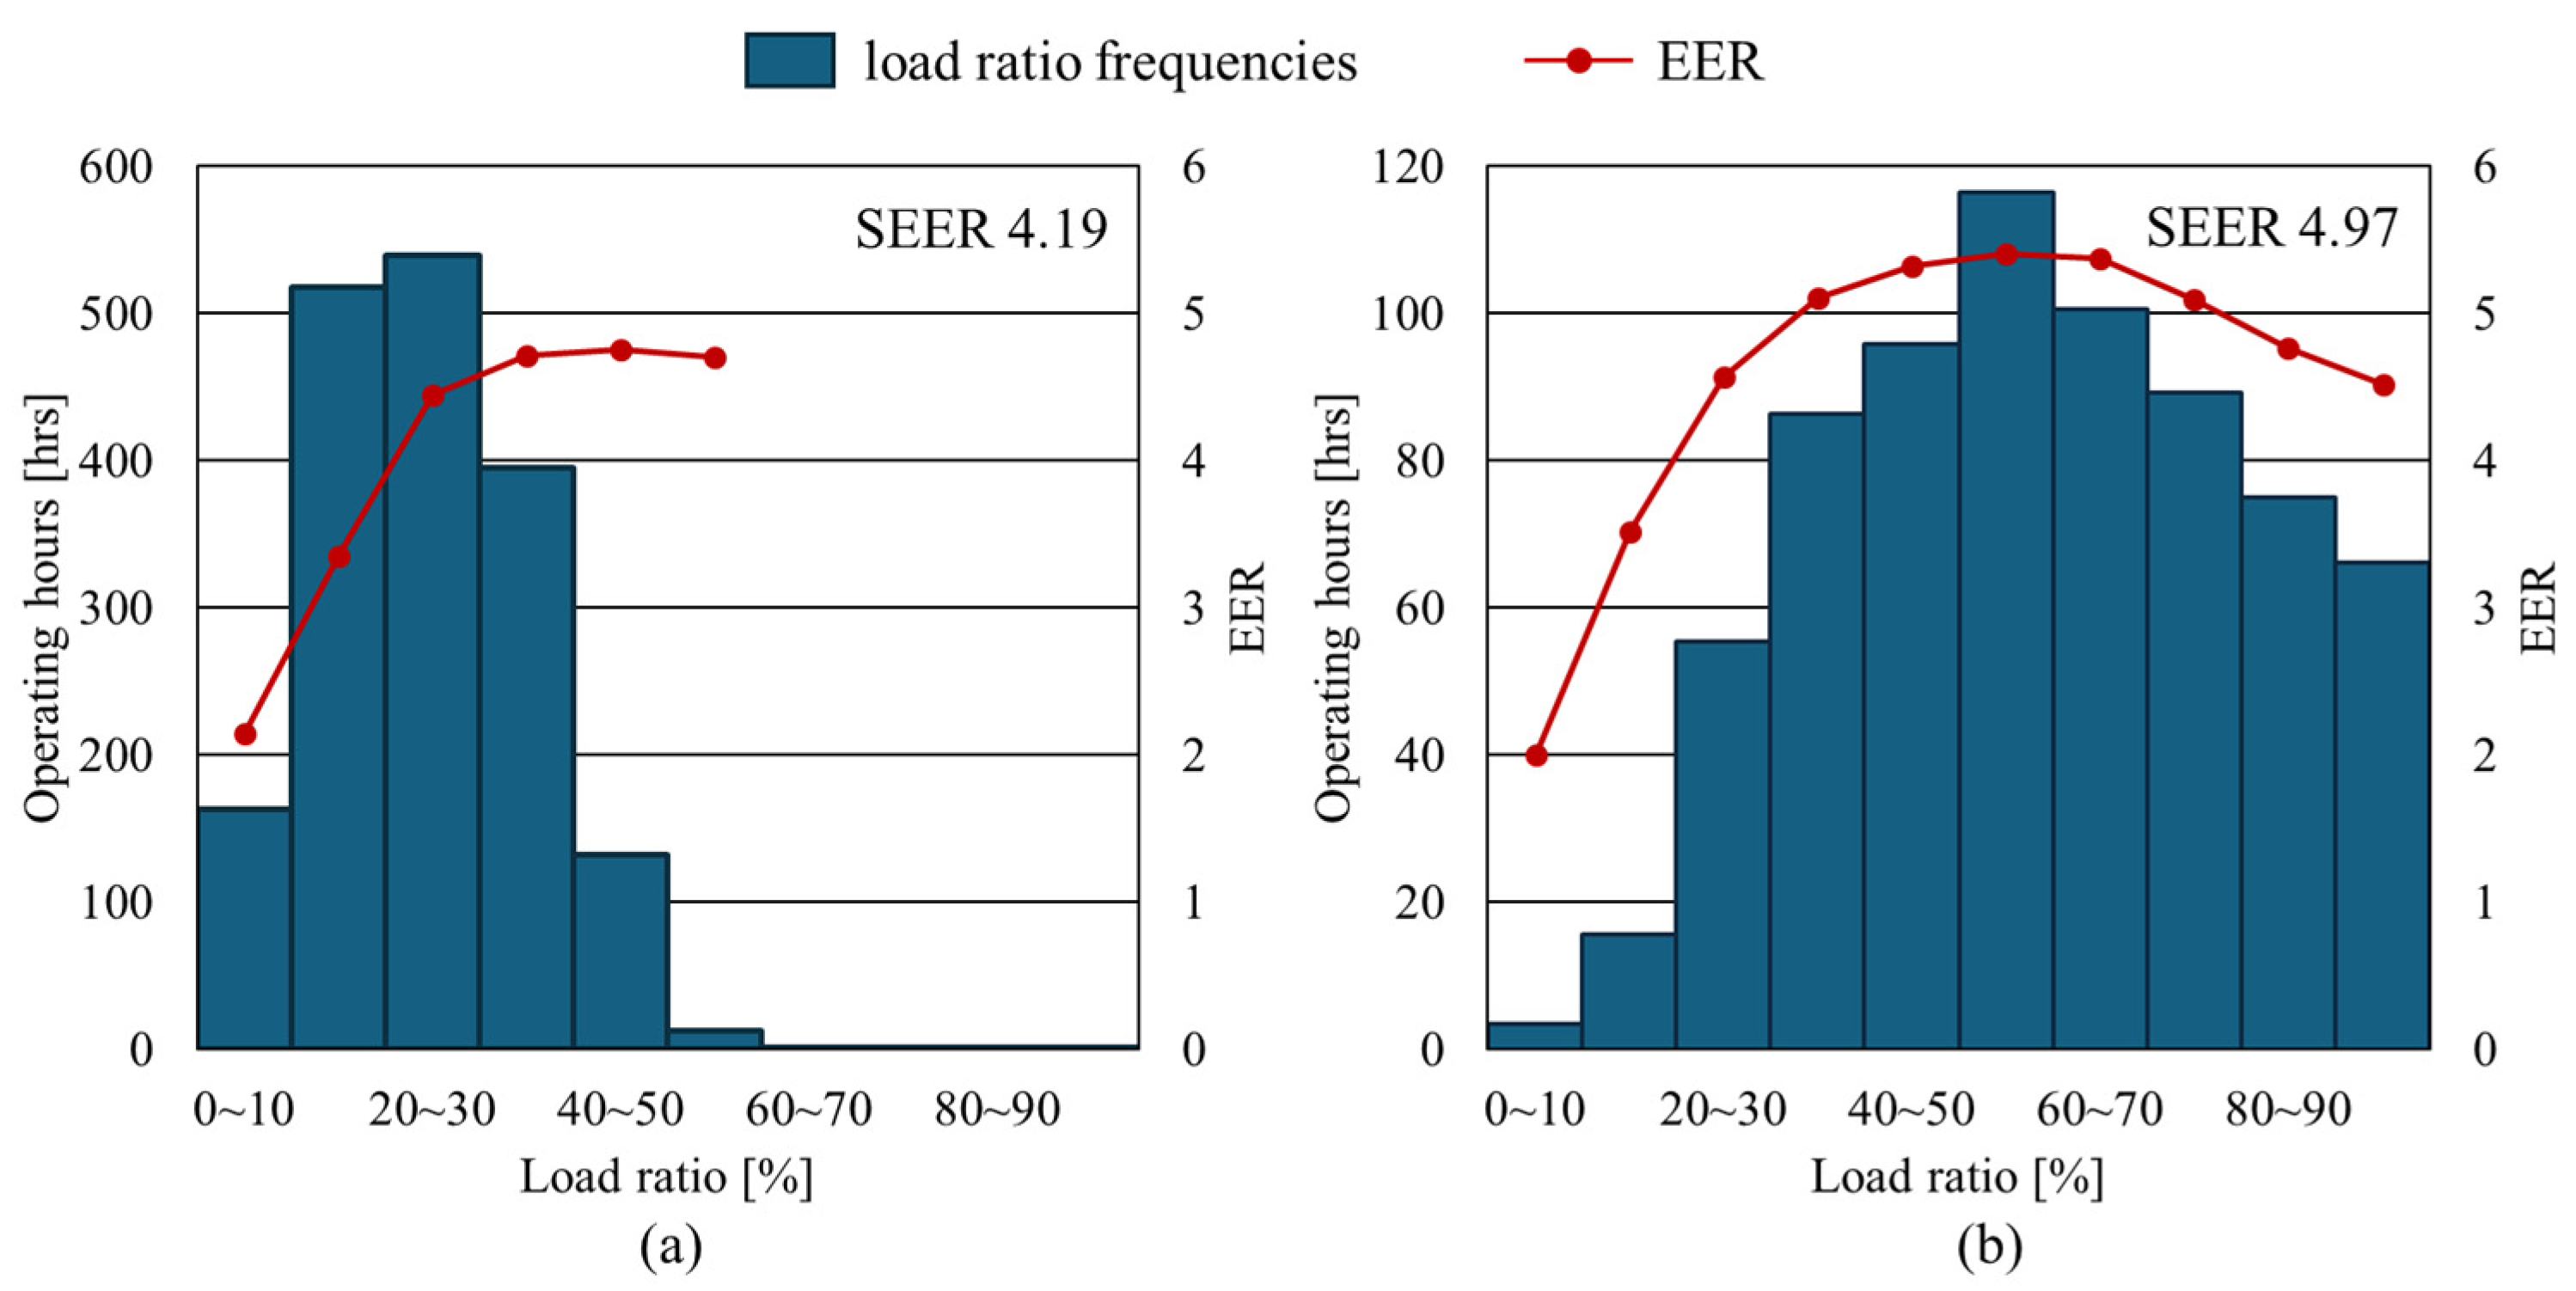
6.4. Effects of the PCM Heat Exchanger
7. Conclusions
Author Contributions
Funding
Data Availability Statement
Acknowledgments
Conflicts of Interest
Abbreviations
| AC | Air conditioning |
| EER | Energy efficiency ratio |
| PCM | Phase change material |
| SEER | Seasonal energy efficiency ratio |
| TES | Thermal energy storage |
References
- International Energy Agency. World Energy Outlook. 2023. Available online: https://www.iea.org/reports/world-energy-outlook-2023 (accessed on 18 April 2025).
- Heat Pump and Thermal Storage Technology Center of Japan. Improvement of Efficiency by Inverter Air-Conditioners. Available online: https://www.hptcj.or.jp/e/learning/tabid/364/Default.aspx (accessed on 18 April 2025).
- Conti, P.; Franco, A.; Bartoli, C.; Testi, D. A design methodology for thermal storages in heat pump systems to reduce partial-load losses. Appl. Therm. Eng. 2022, 215, 118971. [Google Scholar] [CrossRef]
- Kindaichi, S.; Kindaichi, T. Indoor thermal environment and energy performance in a central air heating system using a heat pump for a house with underfloor space for heat distribution. Build. Serv. Eng. Res. Technol. 2022, 43, 755–766. [Google Scholar] [CrossRef]
- Kindaichi, S.; Nishina, D.; Murakawa, S.; Ishida, M.; Ando, M. Analysis of energy consumption of room air conditioners: An approach using individual operation data from field measurements. Appl. Therm. Eng. 2017, 112, 7–14. [Google Scholar] [CrossRef]
- ASHRAE. 2020 ASHRAE Handbook HVAC Systems and Equipment; Chapter 50 Thermal Storage; ASHRAE: Peachtree Corners, GA, USA, 2020; pp. 50.1–50.4. [Google Scholar]
- Nazir, H.; Batool, M.; Osorio, F.J.B.; Isaza-Ruiz, M.; Xu, X.; Vignarooban, K.; Phelan, P.; Inamuddin; Kannan, A.M. Recent developments in phase change materials for energy storage applications: A review. Int. J. Heat Mass Transf. 2019, 129, 491–523. [Google Scholar] [CrossRef]
- de Gracia, A.; Cabeza, L.F. Phase change materials and thermal energy storage for buildings. Energy Build. 2015, 103, 414–419. [Google Scholar] [CrossRef]
- Iten, M.; Liu, S.; Shukla, A. A review on the air-PCM-TES application for free cooling and heating in the buildings. Renew. Sustain. Energy Rev. 2016, 61, 175–186. [Google Scholar] [CrossRef]
- Raj, V.A.A.; Velraj, R. Review on free cooling of buildings using phase change materials. Renew. Sustain. Energy Rev. 2010, 14, 2819–2829. [Google Scholar] [CrossRef]
- Faraj, K.; Khaled, M.; Faraj, J.; Hachem, F.; Castelain, C. Phase change material thermal energy storage systems for cooling applications in buildings: A review. Renew. Sustain. Energy Rev. 2020, 119, 109579. [Google Scholar] [CrossRef]
- Akeiber, H.; Nejat, P.; Majid, M.Z.A.; Wahid, M.A.; Jomehzadeh, F.; Famileh, I.Z.; Calautit, J.K.; Hughes, B.R.; Zaki, S.A. A review on a phase change material (PCM) for sustainable passive cooling in building envelopes. Renew. Sustain. Energy Rev. 2016, 60, 1470–1497. [Google Scholar] [CrossRef]
- Jamil, H.; Alam, M.; Sanjayan, J.; Wilson, J. Investigation of PCM as retrofitting option to enhance occupant thermal comfort in a modern residential building. Energy Build. 2016, 133, 217–229. [Google Scholar] [CrossRef]
- Fabiani, C.; Piselli, C.; Pisello, A.L. Thermo-optic durability of cool roof membranes: Effect of shape stabilized phase change material inclusion on building energy efficiency. Energy Build. 2020, 207, 109592. [Google Scholar] [CrossRef]
- Garg, H.; Pandey, B.; Saha, S.K.; Singh, S.; Banerjee, R. Design and analysis of PCM based radiant heat exchanger for thermal management of buildings. Energy Build. 2018, 169, 84–96. [Google Scholar] [CrossRef]
- Bogatu, D.I.; Kazanci, O.B.; Olesen, B.W. An experimental study of the active cooling performance of a novel radiant ceiling panel containing phase change material (PCM). Energy Build. 2021, 243, 110981. [Google Scholar] [CrossRef]
- Gholamibozanjani, G.; Farid, M. A comparison between passive and active PCM systems applied to buildings. Renew. Energy 2020, 162, 112–123. [Google Scholar] [CrossRef]
- Gholamibozanjani, G.; Farid, M. Application of an active PCM storage system into a building for heating/cooling load reduction. Energy 2020, 210, 118572. [Google Scholar] [CrossRef]
- Liu, J.; Liu, Y.; Yang, L.; Liu, T.; Zhang, C.; Dong, H. Climatic and seasonal suitability of phase change materials coupled with night ventilation for office buildings in Western China. Renew. Energy 2020, 147, 356–373. [Google Scholar] [CrossRef]
- Solgi, E.; Fayaz, R.; Kari, B.M. Cooling load reduction in office buildings of hot-arid climate, combining phase change materials and night purge ventilation. Renew. Energy 2016, 85, 725–731. [Google Scholar] [CrossRef]
- Solgi, E.; Kari, B.M.; Fayaz, R.; Taheri, H. The impact of phase change materials assisted night purge ventilation on the indoor thermal conditions of office buildings in hot-arid climates. Energy Build. 2017, 150, 488–497. [Google Scholar] [CrossRef]
- Türkakar, G. Design and optimization of PCM-air cold energy storage device to be used for peak electricity shaving. J. Therm. Sci. Technol. 2021, 41, 23–36. [Google Scholar] [CrossRef]
- Nagano, K.; Takeda, S.; Mochida, T.; Shimakura, K.; Nakamura, T. Study of a floor supply air conditioning system using granular phase change material to augment building mass thermal storage—Heat response in small scale experiments. Energy Build. 2006, 38, 436–446. [Google Scholar] [CrossRef]
- Chaiyat, N. Energy and economic analysis of a building air-conditioner with a phase change material (PCM). Energy Convers. Manage. 2015, 94, 150–158. [Google Scholar] [CrossRef]
- Yu, M.; Li, S.; Zhang, X.; Zhao, Y. Techno-economic analysis of air source heat pump combined with latent thermal energy storage applied for space heating in China. Appl. Therm. Eng. 2021, 185, 116434. [Google Scholar] [CrossRef]
- Tariq, S.L.; Ali, H.M.; Akram, M.A.; Janjua, M.M.; Ahmadlouydarab, M. Nanoparticles enhanced phase change materials (NePCMs)—A recent review. Appl. Therm. Eng. 2020, 176, 115305. [Google Scholar] [CrossRef]
- Sheikholeslami, M.; Jafaryar, M.; Shafee, A.; Li, Z. Simulation of nanoparticles application for expediting melting of PCM inside a finned enclosure. Phys. A Stat. Mech. Its Appl. 2019, 523, 544–556. [Google Scholar] [CrossRef]
- Sheikholeslami, M.; Shah, Z.; Shafee, A.; Khan, I.; Tlili, I. Uniform magnetic force impact on water based nanofluid thermal behavior in a porous enclosure with ellipse shaped obstacle. Sci. Rep. 2019, 9, 1196. [Google Scholar] [CrossRef]
- Mahdi, J.M.; Mohammed, H.I.; Hashim, E.T.; Talebizadehsardari, P. Solidification enhancement with multiple PCMs, cascaded metal foam and nanoparticles in the shell-and-tube energy storage system. Appl. Energy 2020, 257, 113993. [Google Scholar] [CrossRef]
- Li, Z.; Shahsavar, A.; Al-Rashed, A.A.A.A.; Talebizadehsardari, P. Effect of porous medium and nanoparticles presences in a counter-current triple-tube composite porous/nano-PCM system. Appl. Therm. Eng. 2020, 167, 114777. [Google Scholar] [CrossRef]
- Porto, T.N.; Delgado, J.M.P.Q.; Guimarȁes, A.S.; Magalhȁes, H.L.F.; Moreira, G.; Correia, B.B.; de Andrade, T.F.; de Lima, A.G.B. Phase change material melting process in a thermal energy storage system for applications in buildings. Energies 2020, 13, 3254. [Google Scholar] [CrossRef]
- Sheikholeslami, M.; Jafaryar, M.; Shafee, A.; Babazadeh, H. Acceleration of discharge process of clean energy storage unit with insertion of porous foam considering nanoparticle enhanced paraffin. J. Clean. Prod. 2020, 261, 121206. [Google Scholar] [CrossRef]
- Riahi, S.; Saman, W.Y.; Bruno, F.; Belusko, M.; Tay, N.H.S. Performance comparison of latent heat storage systems comprising plate fins with different shell and tube configurations. Appl. Energy 2018, 212, 1095–1106. [Google Scholar] [CrossRef]
- Kibria, M.A.; Anisur, M.R.; Mahfuz, M.H.; Saidur, R.; Metselaar, I.H.S.C. Numerical and experimental investigation of heat transfer in a shell and tube thermal energy storage system. Int. Commun. Heat Mass Transf. 2014, 53, 71–78. [Google Scholar] [CrossRef]
- Pu, L.; Zhang, S.; Xu, L.; Li, Y. Thermal performance optimization and evaluation of a radial finned shell-and-tube latent heat thermal energy storage unit. Appl. Therm. Eng. 2020, 166, 114753. [Google Scholar] [CrossRef]
- Souayfane, F.; Fardoun, F.; Biwole, P.H. Phase change materials (PCM) for cooling applications in buildings: A review. Energy Build. 2016, 129, 396–431. [Google Scholar] [CrossRef]
- Kasaeian, A.; Bahrami, L.; Pourfayaz, F.; Khodabandeh, E.; Yan, W.M. Experimental studies on the applications of PCMs and nano-PCMs in buildings: A critical review. Energy Build. 2017, 154, 96–112. [Google Scholar] [CrossRef]
- Dubovsky, V.; Ziskind, G.; Letan, R. Analytical model of a PCM-air heat exchanger. Appl. Therm. Eng. 2011, 31, 3453–3462. [Google Scholar] [CrossRef]
- Hashimoto, R.; Kindaichi, S.; Huang, H.; Nishina, D. Reducing energy consumption of heat pumps by introducing a thermal energy storage system. In Proceedings of the 11th International Conference on Indoor Air Quality, Ventilation & Energy Conservation in Buildings (IAQVEC 2023), Leeds, Japan, 20–23 May 2023; Volume 396, p. 03010. [Google Scholar] [CrossRef]
- Loem, S.; Deethayat, T.; Asanakham, A.; Kiatsiriroat, T. Study on phase change material thermal characteristics during air charging/discharging for energy saving of air-conditioner. Heat Mass Transf. 2020, 56, 2121–2133. [Google Scholar] [CrossRef]
- Morovat, N.; Athienitis, A.K.; Candanedo, J.A.; Dermardiros, V. Simulation and performance analysis of an active PCM-heat exchanger intended for building operation optimization. Energy Build. 2019, 199, 47–61. [Google Scholar] [CrossRef]
- Stathopoulos, N.; Mankibi, M.E.; Santamouris, M. Numerical calibration and experimental validation of a PCM-Air heat exchanger model. Appl. Therm. Eng. 2017, 114, 1064–1072. [Google Scholar] [CrossRef]
- Labat, M.; Virgone, J.; David, D.; Kuznik, F. Experimental assessment of a PCM to air heat exchanger storage system for building ventilation application. Appl. Therm. Eng. 2014, 66, 375–382. [Google Scholar] [CrossRef]
- Takeda, S.; Nagano, K.; Mochida, T.; Shimakura, K. Development of a ventilation system utilizing thermal energy storage for granules containing phase change material. Sol. Energy 2004, 77, 329–338. [Google Scholar] [CrossRef]
- Nagano, K.; Takeda, S.; Mochida, T.; Shimakura, K.; Nakamura, T. Study on floor supply air conditioning system storing cold energy for building structure and granules including phase change material: Part 1 Construction of a small-scale experimental system and the thermal characteristics. J. Environ. Eng. 2004, 69, 21–28. [Google Scholar] [CrossRef] [PubMed]
- ASHRAE. 2017 ASHRAE Handbook Fundamentals; Chapter 4 Heat Transfer; ASHRAE: Peachtree Corners, GA, USA, 2017; pp. 4–25. [Google Scholar]
- Government Buildings Department, MLIT. LCEM Tool Ver 3.10. Available online: https://www.mlit.go.jp/gobuild/sesaku_lcem_lcemtool_index.htm (accessed on 25 May 2025).
- Institute for Built Environment and Carbon Neutral for SDGs. The Best Program Sample Data for an 8-Zone Office on a Standard Floor. Available online: http://ibec.or.jp/best/english/program/pdf/manual/try_best20090801_2.pdf (accessed on 25 May 2025).


| Physical Properties | Value |
|---|---|
| Latent heat amount | 188 kJ/kg |
| Melting point | 17.8 °C |
| Freezing point | 17.0 °C |
| Measurement Item | Device | Sensors | Range | Accuracy |
|---|---|---|---|---|
| Air temperature | HIOKI data logger *1 | Thermocouples [Type T, Class1] | ~100 °C | ±0.5 °C |
| PCM temperature | HIOKI data logger *1 | Thermocouples sheath type | −200 to +300 °C | ±0.5 °C |
| Air velocity | Testo480 multifunction measuring instrument *2 | Testo Hot-wire anemometer | 0 to 20 m/s | ±0.03 m/s |
| Pressure loss | OMRON differential pressure station *3 | −500 to 500 Pa | ±0.2 Pa |
| Properties | Case 1 | Case 2 | Case 3 |
|---|---|---|---|
| Air velocity [m/s] | 0.5 | 1.0 | 1.5 |
| Air flow rate [m3/h] | 32 | 64 | 95 |
| (a) Outdoor Unit | (b) Indoor Units | ||
|---|---|---|---|
| Number of outdoor units | 1 | Number of indoor units | 8 |
| Rated cooling capacity [kW] | 65 | Rated cooling capacity [kW] | 7.3 |
| Rated power consumption [kW] | 17.8 | Rated power consumption [kW] | 0.3 |
| Rated COP | 3.64 | Rated air volume [m3/h] | 1170 |
Disclaimer/Publisher’s Note: The statements, opinions and data contained in all publications are solely those of the individual author(s) and contributor(s) and not of MDPI and/or the editor(s). MDPI and/or the editor(s) disclaim responsibility for any injury to people or property resulting from any ideas, methods, instructions or products referred to in the content. |
© 2025 by the authors. Licensee MDPI, Basel, Switzerland. This article is an open access article distributed under the terms and conditions of the Creative Commons Attribution (CC BY) license (https://creativecommons.org/licenses/by/4.0/).
Share and Cite
Tani, K.; Kindaichi, S.; Kawasaki, K.; Nishina, D. Application of a Phase-Change Material Heat Exchanger to Improve the Efficiency of Heat Pumps at Partial Loads. Energies 2025, 18, 3694. https://doi.org/10.3390/en18143694
Tani K, Kindaichi S, Kawasaki K, Nishina D. Application of a Phase-Change Material Heat Exchanger to Improve the Efficiency of Heat Pumps at Partial Loads. Energies. 2025; 18(14):3694. https://doi.org/10.3390/en18143694
Chicago/Turabian StyleTani, Koharu, Sayaka Kindaichi, Keita Kawasaki, and Daisaku Nishina. 2025. "Application of a Phase-Change Material Heat Exchanger to Improve the Efficiency of Heat Pumps at Partial Loads" Energies 18, no. 14: 3694. https://doi.org/10.3390/en18143694
APA StyleTani, K., Kindaichi, S., Kawasaki, K., & Nishina, D. (2025). Application of a Phase-Change Material Heat Exchanger to Improve the Efficiency of Heat Pumps at Partial Loads. Energies, 18(14), 3694. https://doi.org/10.3390/en18143694