Abstract
Fluid dispersion directly influences the transport, mixing, and efficiency of hydrogen storage in depleted gas reservoirs. Pore structure parameters, such as pore size, throat geometry, and connectivity, influence the complexity of flow pathways and the interplay between advective and diffusive transport mechanisms. Hence, these factors are critical for predicting and controlling flow behavior in the reservoirs. Despite its importance, the relationship between pore structure and dispersion remains poorly quantified, particularly under elevated flow conditions. To address this gap, this study employs pore network modeling (PNM) to investigate the influence of sandstone and carbonate structures on fluid flow properties at the micro-scale. Eleven rock samples, comprising seven sandstone and four carbonate, were analyzed. Pore network extraction from CT images was used to obtain detailed pore structure parameters and their statistical measures. Pore-scale simulations were conducted across 60 scenarios with varying average interstitial velocities and water as the injected fluid. Effluent hydrogen concentrations were measured to generate elution curves as a function of injected pore volumes (PV). This approach enables the assessment of the relationship between the dispersion coefficient and pore structure parameters across all rock samples at consistent average interstitial velocities. Additionally, dispersivity and n-exponent values were calculated and correlated with pore structure parameters.
1. Introduction
Understanding fluid flow and dispersion is crucial for hydrogen storage in depleted gas reservoirs. Particularly, the in situ mixing (or dispersion) of the injected hydrogen and resident gas strongly affects the quality hydrogen during its recovery stage and, thus, increases the cost of the surface purification of contaminated hydrogen. Unlike the simple flow paths in capillaries, the complex geometry of porous media leads to significant variations in velocity profiles, which in turn affect fluid dispersion [1,2,3]. These complexities make predicting fluid behavior in subterranean formation challenging, as the intricate pore structures result in non-uniform velocity fields and complex dispersion patterns.
Dispersion in porous media is governed by the following two primary mechanisms: mechanical dispersion and effective molecular diffusion [4]. Mechanical dispersion arises from the inherent variability in pore sizes and the complex pathways fluid particles navigate within a porous network. The effects of mechanical dispersion become increasingly significant at higher flow velocities, where the velocity contrasts amplify fluid front spreading [5,6]. Molecular diffusion describes the movement of particles from regions of higher concentration to regions of lower concentration, driven by concentration gradients [7]. In porous media, molecular diffusion is also influenced by the complex pore structures and flow dynamics [8,9]. Under high-velocity flow conditions, mechanical dispersion, driven by flow variability, typically dominates and overshadows the influence of diffusion. These interactions require an integrated model that accurately captures both dispersion and diffusion behavior in porous media [10].
Despite the significance of fluid dispersion mechanisms, much of the existing research relies on simplified assumptions or idealized models to study flow in porous media. The assumption of homogeneity or isotropy can lead to inaccuracies when predicting dispersion in realistic systems [11,12,13]. While molecular diffusion is effective in driving fluid mixing in both capillaries and porous media, the structural intricacies of porous media introduce additional complexity, particularly under varying flow velocities. The heterogeneity of porous media results in non-uniform flow velocities and diffusion behavior [14,15]. For instance, El-Zehairy et al. developed and validated a pore-network model (PNM) using X-ray computed tomography data to examine the impact of micro-scale heterogeneity on non-Darcy flow in porous media [16]. The results showed that heterogeneous porous media exhibit nonlinear flow at lower Reynolds numbers, primarily due to stagnant regions created by poorly connected zones, which reduce flow area and trigger inertial effects at lower pressure gradients.
This study addresses these limitations by focusing specifically on the influence of pore structures on mechanical dispersion that could strongly impact the in situ mixing between the injected hydrogen and resident gas during geologic hydrogen storage and recovery. Pore network modeling (PNM) was utilized to investigate fluid flow properties in sandstone and carbonate at the micro-scale. Unlike previous works, this study directly analyzes the microstructure of eleven rock samples (seven sandstone and four carbonate), each with dimensions of 600 × 600 × 600 μm. Five elevated velocities are examined, as follows: 0.001 m/s, 0.005 m/s, 0.010 m/s, 0.015 m/s, and 0.020 m/s These velocities yield the calculated experimental Peclet number of 261, 1305, 2610, 3915, and 5220, respectively. By correlating dispersion coefficients with varying average interstitial velocities, the study also derives dispersivity and n-exponent values for each sample, linking them directly to pore structure. This is a novel aspect not extensively explored in previous works [17,18,19,20].
2. Background
2.1. Pore Structure Parameters
Thorough examinations of pore volume, pore radius, throat radius, throat length, and pore coordination number are essential for quantifying the complex fluid flow within porous media. Figure A1 in Appendix A shows a schematic of the pore space characteristics evaluated in this study. Each of these parameters impacts the velocity distribution and mixing behavior of fluids, ultimately changing the overall dispersion process.
Pore volume influences dispersion behavior by affecting fluid accumulation and residence time [21]. Pore radius and throat radius affect fluid flow rates, with larger pores and throats enabling higher flow rates and smaller ones creating bottlenecks. Additionally, heterogeneity in pore size distribution results in complex flow patterns, where faster-moving fluids in larger pores coexist with slower-moving fluids in smaller pores [22,23]. Throat length, or the distance between adjacent pores, can increase resistance to flow, particularly in tortuous paths. This contributes to mechanical dispersion, as fluids take varying amounts of time to travel through different throats [24]. Lastly, the pore coordination number, which refers to the number of throats connected to a single pore, directly impacts the flow network’s complexity [25,26]. A higher coordination number indicates a more interconnected network, reducing stagnation and enhancing dispersion, while a lower coordination number may lead to preferential flow and less uniform dispersion.
The interplay between these pore structure parameters creates a highly complex environment where fluid dispersion is governed by both the geometric arrangement of pores and throats and the inherent heterogeneity of the medium. Recent studies have shown the importance of accurately characterizing these parameters to predict fluid flow and dispersion behavior more effectively [27,28,29].
2.2. Pore Structure Modelling
Recent advancements in imaging techniques, such as X-ray computed tomography (CT), coupled with advanced computational tools, have enabled the detailed quantification of these parameters. Pore network extraction was used to analyze three-dimensional CT images of porous materials to identify pore and throat characteristics. The process began with segmenting CT images to separate the solid matrix from the pore space. Algorithms then binarized and extracted the pore network to a simplified model with interconnected pores and throats [30,31]. PoreSpy was used for extracting and analyzing pore networks from volumetric images to quantify geometric properties, such as pore and throat size distribution and coordination number [32]. Then, OpenPNM simulated fluid flow and transport processes in pore networks, including single-phase flow and diffusive transport [33]. This integrated approach enabled a thorough analysis of how various pore structure parameters, such as pore volume, pore radius, throat radius, throat length, and pore coordination number, would influence dispersion coefficients.
2.3. Governing Equations
This study utilized OpenPNM to model fluid dispersion in porous media, which employed the advection–diffusion equation to simulate hydrogen transport in an incompressible flow. This equation accounts for both the advection of the hydrogen by the fluid flow and its diffusion due to concentration gradients. The dispersion process can be described by the 1D advective–dispersion equation [34], as follows:
where is the concentration of hydrogen, is the longitudinal dispersion coefficient, is the volume-averaged velocity, is the time, Q is the volumetric flow rate, A is the cross-sectional area perpendicular to the flow direction, and is the porosity of the porous medium. The dispersion coefficient is composed of an effective molecular diffusion, , and a mechanical dispersion term. The mechanical dispersion term is defined as the dispersivity, multiplied by the volume-averaged velocity raised to the power n. These parameters are used to characterize the impacts of dispersion in fluid mixing and is often expressed as follows:
Dispersivity quantifies the extent of mechanical dispersion due to variations in fluid velocity within pore spaces. Typically, more heterogeneous structures typically exhibit higher dispersivity due to complex flow paths and pronounced velocity variations. Additionally, the n-exponent describes the extent of non-linearity between the dispersion coefficient and the volume-averaged velocity. Since the effective molecular diffusion being absent in this work, the dispersion coefficient equation reduces to the following:
In this study, was determined by fitting the observed concentration profiles from the simulation results to the solution of the 1D advection–diffusion equation [9]. The dimensionless form is shown in Equation (5).
where is the inlet concentration, is the concentration at the given time at the outlet, is the dimensionless concentration defined as the ratio of to , is the characteristic length of the porous medium, is the experimental Peclet number, is the dimensionless length, and is the dimensionless time.
3. Methodology
The methodology began with micro-CT scans of 600 × 600 × 600 µm samples with a resolution of 2.25 µm per voxel for sandstone and 1 µm per voxel for carbonate. It is noted that no resolution sensitivity analysis was conducted due to the limited availability of micro-CT scan data. These images were processed and analyzed with PoreSpy to characterize pore structure (i.e., pore volume, pore radius, throat radius, throat length, and coordination number) and simplify the geometry of the pore space into a network of interconnected spheres and cylinders. Next, fluid transport simulations were conducted with OpenPNM through stokes flow and transient advection–diffusion algorithms. Then, dispersion coefficient, dispersivity, and the n-exponent were quantified for all samples and correlated to pore structure parameters.
4. Results and Discussion
4.1. Characterization of Pore Structure Parameters
Table 1 summarizes the pore structure parameters for the seven sandstone and four carbonate samples analyzed in this study, respectively. The results revealed distinct differences in the pore structure between sandstone and carbonate and how they may impact fluid dispersion. The sandstone samples displayed higher porosity, larger throat radii and lengths, and a lower pore coordination number. In sandstone, higher porosity and permeability may enable more uniform and efficient fluid flow. The larger pore and throat radii facilitated smoother fluid movement, which minimized velocity differentials and reduce mechanical dispersion. Furthermore, the longer throat lengths in sandstone provided more straightforward flow paths. Although sandstone tends to have a lower coordination number, which could mean less interconnected flow networks; this effect was mitigated by the overall homogeneity of the pore structure.

Table 1.
Pore structure summary for sandstone and carbonate samples used in this study.
The carbonate samples exhibited lower porosity and permeability. This can result in more constrained fluid flow and a higher potential for velocity variations. The smaller pore and throat radii in carbonate might create narrower pathways, which increases flow resistance and amplifying velocity differentials. Additionally, the higher pore coordination numbers suggested a more interconnected flow network. The combination of smaller pore and throat sizes, along with shorter throat lengths in carbonate, might lead to more complex flow patterns and greater dispersion behavior.
The following section analyzes the elution profiles and quantifies fluid dispersion across various rock samples at a consistent average interstitial velocity. This approach isolated the impact of varying pore structures on mechanical dispersion.
4.2. Impacts of Pore Structure Parameters on Dispersion Coefficient
Figure 1 and Figure 2 illustrate the elution curves for sandstone and carbonate, respectively, at the same average interstitial fluid velocity, , of 0.001 m/s, 0.005 m/s, 0.010 m/s, 0.015 m/s, and 0.020 m/s. This velocity is defined as follows:
where is the interstitial velocity, and is the volumetric flow rate in each pore. Despite the samples having the same average interstitial velocity, their volume-averaged velocities are different. This is because the volume-averaged velocity averages the flow rate over the entire cross-sectional area, including both the pore spaces and the solid matrix. As a result, it yields a lower overall velocity, since it considers the entire volume, including areas where fluid cannot flow.
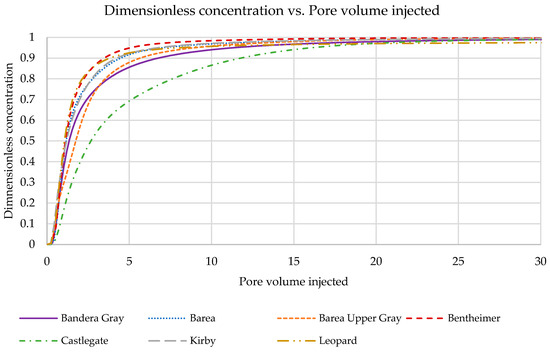
Figure 1.
Elution profiles for seven sandstone samples.
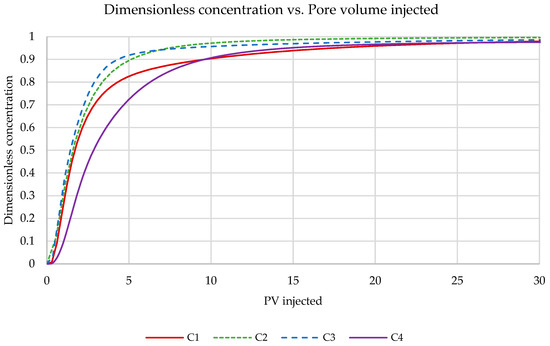
Figure 2.
Elution profiles for four carbonate samples.
The first observation is that all elution curves converged to a dimensionless concentration of 1. This shows that over the extended periods, all systems reached a state where the hydrogen was distributed throughout the porous medium, and the concentration in the effluent effectively reflected the concentration of hydrogen that was originally introduced into the system. However, the lack of overlap between these curves through the injection period, despite the identical average interstitial velocity, indicated the significant impact of rock heterogeneity on fluid flow behavior.
The dispersion coefficient increased with the mean coordination number, shown in Figure 3. Sandstone with lower coordination numbers, such as the Barea Upper Gray and Kirby samples, tended to have lower dispersion coefficients. Moreover, sandstone with higher coordination number, such as the Bandera Gray and Castlegate sample, exhibited higher dispersion coefficients. This is because a higher coordination number indicates a greater number of pore throats connected to each pore. As fluid particles have more pathways to traverse, the overall mixing and spreading of the fluid within the porous medium become more pronounced. Figure A2 in Appendix A shows the correlations between pore structure parameters and the dispersion coefficient for the sandstone at the same average interstitial velocity. Evidently, no clear trends were observed for porosity, permeability, mean pore radius, mean throat radius, or mean throat length.
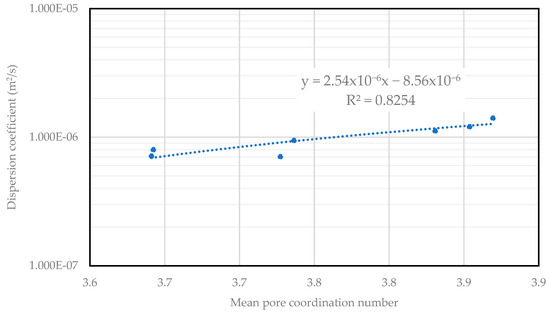
Figure 3.
Dispersion coefficient versus mean pore coordination number for seven sandstone samples at a fixed average interstitial velocity of 0.01 m/s.
Figure A3 in the Appendix A shows the correlation between pore structure parameters and dispersion coefficient across four carbonate samples, where no clear trends were observed. This absence of an obvious correlation in relation to the dispersion coefficient may be attributed to several factors. First, these parameters describe the average characteristics of the pore network but do not fully capture the complexity of fluid flow paths. The dispersion coefficient is influenced by the detailed spatial distribution and arrangement of pores and throats, which these average parameters alone may not represent adequately. Second, the heterogeneity within the pore structure of these carbonate samples can overshadow trends, as variations in both pore size and connectivity can affect dispersion in ways not reflected by a single parameter. For example, high porosity might be offset by poor pore connectivity, leading to inconsistent effects on dispersion. Additionally, the interactions between these influencing factors and their collective impact on fluid flow dynamics may also contribute to the lack of a clear trend for a singular relationship.
4.3. Impacts of Pore Structure Parameters on Dispersivity and n-Exponent
The differences in dispersivity and n-exponent across the samples evaluated in this work demonstrates the role of pore structure in controlling fluid mixing. In media with high dispersivity and n-exponent, fluid mixing is more efficient, leading to more thorough fluid component transport. However, in porous media with lower dispersivity and n-exponent, fluid flow is more predictable and controlled. Figure 4 and Figure 5 show the correlations for seven sandstone and four carbonate samples. The results indicate that as fluid velocity increases, the spreading of hydrogen within the porous medium also expands and mechanical mixing intensifies.
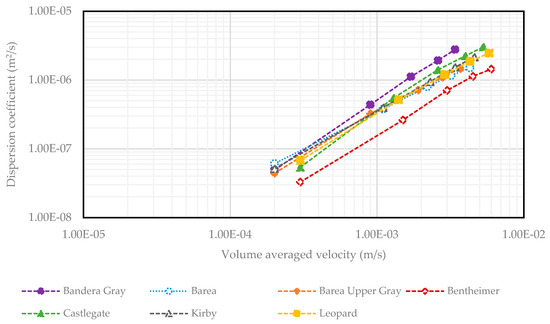
Figure 4.
Dispersion coefficients versus volume-averaged velocities for sandstone samples.
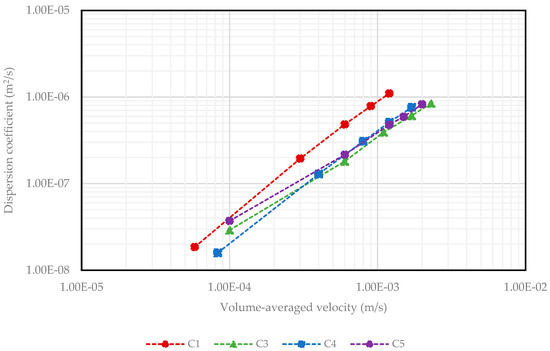
Figure 5.
Dispersion coefficients versus volume-averaged velocities for carbonate samples.
A power law function was applied to determine the dispersivity and n-exponent, as shown in Figure A4 and Figure A5 and summarized in Table A3 and Table A4 in Appendix A. Amongst the sandstone samples, Bandera Gray exhibited the highest dispersivity and n-exponent, which indicates a pronounced tendency to mix and spread hydrogen. This behavior can be directly related to its pore structure parameters, as Bandera Gray exhibited the smallest pore radius, throat radius, throat length, and moderate pore coordination number among the sandstone samples. Smaller pore and throat radii restrict fluid flow to narrower channels, which enhances dispersion by intensifying the velocity gradients. Additionally, the shorter throat lengths reduced the distance over which the fluid maintains a consistent flow velocity, leading to more frequent changes in flow direction. These structural characteristics collectively create a more dynamic flow environment within the Bandera Gray sample, which caused the heightened dispersivity and the steep velocity dependence of dispersion. Hence, the dispersion behavior is more sensitive to both pore structure and velocity variations. This behavior aligns with previous studies on dispersion in porous media, which have shown that increased heterogeneity and pore structure complexity lead to higher dispersivity and more non-linear dispersion characteristics [35,36]. Conversely, the low dispersivity and n-exponent values observed in Barea suggest that fluid dispersion in this sample was less influenced by variations in pore structure and flow velocity. This behavior could be attributed to Barea’s larger pore radius, throat radius, and throat length, which create wider and more uniform pathways for fluid flow. Additionally, Barea’s lower pore coordination number further limited the complexity of the flow network by inhibiting interactions between fluid streams at pore junctions.
Figure 6 and Figure A6 in Appendix A shows the correlations between pore structure parameters, dispersivity, and the n-exponent for sandstone samples. The analysis reveals that both dispersivity and the n-exponent increase with pore coordination number (Figure 6). This observation reinforces the idea that more interconnected pore structures lead to greater non-linearity in dispersion as fluid velocity changes. However, no significant trends were observed between dispersivity, the n-exponent, and other pore structure parameters, such as porosity, permeability, pore radius, throat radius, and throat length, shown in Figure A6. This suggests that while these parameters may influence fluid flow, they do not have a consistent or direct impact on dispersion behavior in this set of sandstone samples.
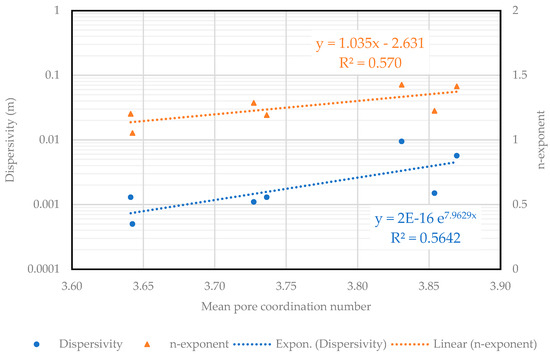
Figure 6.
Correlations between pore mean pore coordination number to dispersivity and n-exponents for seven sandstone samples.
Figure A7 in the Appendix A shows the correlations between pore structure parameters, dispersivity, and the n-exponent for carbonate samples. For these samples, no clear trend was observed between dispersivity, the n-exponent, and any of the pore structure parameters. Despite the interrelationship among these parameters, the lack of a consistent trend with dispersion suggests that other factors, or perhaps a combination of these factors, may play a more significant role in determining the dispersion behavior.
5. Conclusions
This study utilized pore network modeling (PNM) to investigate how pore geometries influence fluid dispersion at the microscale. A key aspect of this research is its direct examination of the relationship between pore structure parameters and dispersion across a range of average interstitial velocities. Eleven rock samples, each measuring 600 × 600 × 600 μm, were analyzed. Pore-scale simulations and hydrogen concentration data were used to generate elution curves, and dispersion coefficients were determined by fitting the 1D advection–diffusion equation. Then, dispersivity and the n-exponent values were also determined by employing a range of average interstitial velocities and repeating the analysis.
The results demonstrated that dispersion behavior in natural rocks is strongly influenced by pore structure characteristics, particularly pore coordination number. In sandstone, dispersivity (α) and the n-exponent (n) exhibited a positive correlation with coordination number. Bandera Gray, with a mean coordination number of 3.831, had the highest dispersivity (α = 0.0095) and n-exponent (n = 1.45268). In contrast, Barea, with a lower coordination number of 3.642, exhibited the lowest dispersivity (α = 0.0005) and n-exponent (n = 1.0535). The dispersion coefficient also increased with coordination number, as higher connectivity created more complex flow pathways, enhancing mixing and velocity-dependent dispersion. However, no significant trends were observed between the dispersion coefficient and other pore parameters, such as porosity (ϕ), permeability (k), mean pore radius, mean throat radius, or mean throat length. This indicates that bulk metrics alone do not fully capture dispersion behavior.
For carbonate samples, no clear relationships were observed between the dispersion coefficient, dispersivity, and n-exponent and any pore structure parameter. This lack of correlation is likely due to increased heterogeneity and variations in pore connectivity, which may have a stronger influence on dispersion. Additionally, the absence of a consistent trend suggests that additional factors, such as spatial variations in pore arrangement, may play a more significant role in controlling dispersion in these samples. While pore coordination number is a fundamental characteristic that directly impacts the pore network conductivity, its influence on the complexity of flow paths in natural rocks and in situ fluid mixing should be further investigated and validated with laboratory experiments on the same rocks in future work.
While this study provides valuable insights into the impact of pore structure parameters on fluid dispersion in rock samples, several limitations should be noted. First, the use of micro-CT scanning and subsequent image reconstruction introduces some resolution constraints. Although high-resolution scans (600 × 600 × 600 μm) were employed, certain microstructural details may still be missed, which could affect the accuracy of pore network extraction and characterization [37]. Second, the pore network model simplifies the complex geometry of natural porous media (i.e., irregular pore shape, surface roughness, and micro connected channels) into systems of ball-and-sticks. While this simplification is useful for quantitative analysis, it may not fully capture the intricacies of the actual pore spaces [31,38] that could significantly affect fluid dispersion. Furthermore, numerical simulations are subject to the inherent limitations of the computational models used. While PoreSpy and OpenPNM offer advanced capabilities for pore network modeling and fluid transport simulations, their accuracy depends on the assumptions and parameters chosen during the modeling process [33]. Finally, as macroscopic heterogeneity of reservoir rocks is the variations of micro-heterogeneity at different scales, the modelling of species spreading in a macroscopically heterogeneous reservoir requires an appropriate upscaling (i.e., averaging) of dispersion characteristics at the pore scale to an effective dispersion at the continuum scale.
Author Contributions
Conceptualization, T.P. and Q.P.N.; Methodology, T.P., Q.P.N. and R.F.; Validation, T.P., R.F. and Q.P.N.; Formal analysis, T.P., Q.P.N. and R.F.; Investigation, T.P.; Visualization, T.P. and R.F.; Data curation, T.P.; Writing—original draft, T.P.; Writing—review & editing, T.P., Q.P.N. and R.F.; Supervision, Q.P.N.; Funding acquisition, Q.P.N. All authors have read and agreed to the published version of the manuscript.
Funding
This research was funded by Shell Global Solutions International under the grant number UTA-10004489.
Data Availability Statement
The original contributions presented in the study are included in the article, further inquiries can be directed to the corresponding author.
Conflicts of Interest
The authors declare no conflicts of interest.
Appendix A
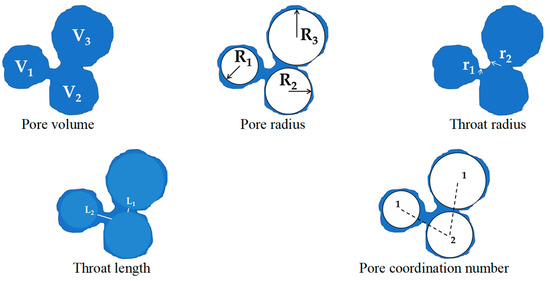
Figure A1.
Visualization of the pore space characteristics of a pore network model.
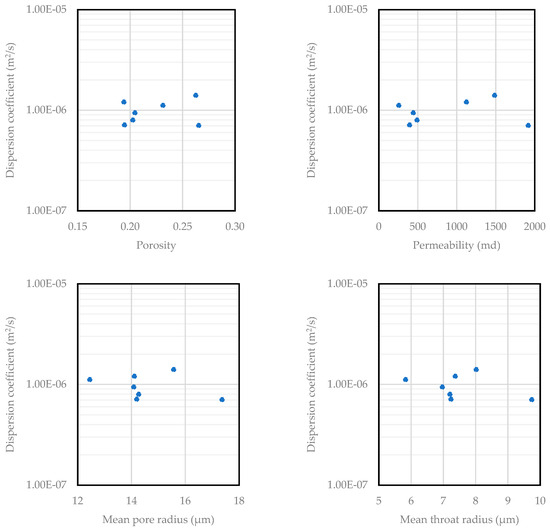
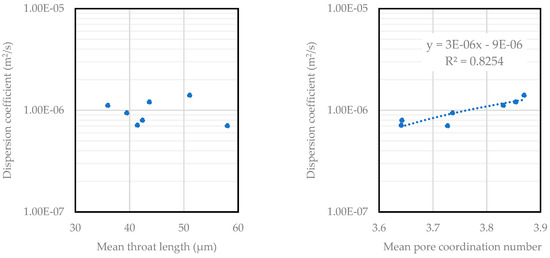
Figure A2.
Dispersion coefficient versus pore structure parameters for seven sandstone samples at a fixed average interstitial velocity of 0.01 m/s.

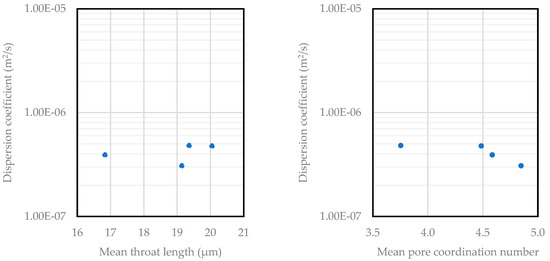
Figure A3.
Dispersion coefficient versus pore structure parameters for four carbonate samples at a fixed average interstitial velocity of 0.01 m/s.

Table A1.
Dispersion coefficient values at variable average interstitial velocities for sandstone.
Table A1.
Dispersion coefficient values at variable average interstitial velocities for sandstone.
| Name | Average Interstitial Velocity (m/s) | Peclet Number | Dispersion Coefficient (m2/s) |
|---|---|---|---|
| Bandera Gray | 0.001 | 120 | 4.93 × 10⁻⁸ |
| 0.005 | 540 | 4.38 × 10⁻⁷ | |
| 0.010 | 1020 | 1.12 × 10⁻⁶ | |
| 0.015 | 1560 | 1.92 × 10⁻⁶ | |
| 0.020 | 2040 | 2.77 × 10⁻⁶ | |
| Barea | 0.001 | 120 | 6.10 × 10⁻⁸ |
| 0.005 | 660 | 3.78 × 10⁻⁷ | |
| 0.010 | 1320 | 7.99 × 10⁻⁷ | |
| 0.015 | 1920 | 1.16 × 10⁻⁶ | |
| 0.020 | 2580 | 1.50 × 10⁻⁶ | |
| Barea Upper Gray | 0.001 | 120 | 4.41 × 10⁻⁸ |
| 0.005 | 540 | 3.25 × 10⁻⁷ | |
| 0.010 | 1140 | 7.14 × 10⁻⁷ | |
| 0.015 | 1680 | 1.10 × 10⁻⁶ | |
| 0.020 | 2220 | 1.48 × 10⁻⁶ | |
| Bentheimer | 0.001 | 180 | 3.29 × 10⁻⁸ |
| 0.005 | 900 | 2.62 × 10⁻⁷ | |
| 0.010 | 1800 | 7.05 × 10⁻⁷ | |
| 0.015 | 2700 | 1.13 × 10⁻⁶ | |
| 0.020 | 3600 | 1.44 × 10⁻⁶ | |
| Castlegate | 0.001 | 180 | 5.40 × 10⁻⁸ |
| 0.005 | 900 | 5.50 × 10⁻⁷ | |
| 0.01 | 1800 | 1.41 × 10⁻⁶ | |
| 0.015 | 2700 | 2.24 × 10⁻⁶ | |
| 0.020 | 3600 | 3.04 × 10⁻⁶ | |
| Kirby | 0.001 | 120 | 5.16 × 10⁻⁸ |
| 0.005 | 660 | 3.97 × 10⁻⁷ | |
| 0.010 | 1380 | 9.42 × 10⁻⁷ | |
| 0.015 | 2040 | 1.54 × 10⁻⁶ | |
| 0.020 | 2760 | 2.15 × 10⁻⁶ | |
| Leopard | 0.001 | 180 | 6.77 × 10⁻⁸ |
| 0.005 | 840 | 5.14 × 10⁻⁷ | |
| 0.010 | 1740 | 1.21 × 10⁻⁶ | |
| 0.015 | 2580 | 1.87 × 10⁻⁶ | |
| 0.020 | 3480 | 2.47 × 10⁻⁶ |

Table A2.
Dispersion coefficient values at variable average interstitial velocities for carbonate.
Table A2.
Dispersion coefficient values at variable average interstitial velocities for carbonate.
| Name | Average Interstitial Velocity (m/s) | Peclet Number | Dispersion Coefficient (m2/s) |
|---|---|---|---|
| C1 | 0.001 | 35 | 1.85 × 10⁻⁸ |
| 0.005 | 180 | 1.95 × 10⁻⁷ | |
| 0.010 | 360 | 4.83 × 10⁻⁷ | |
| 0.015 | 540 | 7.84 × 10⁻⁷ | |
| 0.020 | 720 | 1.10 × 10⁻⁶ | |
| C2 | 0.001 | 60 | 2.91 × 10⁻⁸ |
| 0.005 | 360 | 1.81 × 10⁻⁷ | |
| 0.010 | 660 | 3.92 × 10⁻⁷ | |
| 0.015 | 1020 | 6.08 × 10⁻⁷ | |
| 0.020 | 1380 | 8.46 × 10⁻⁷ | |
| C3 | 0.001 | 50 | 1.58 × 10⁻⁸ |
| 0.005 | 240 | 1.29 × 10⁻⁷ | |
| 0.010 | 480 | 3.08 × 10⁻⁷ | |
| 0.015 | 720 | 5.11 × 10⁻⁷ | |
| 0.020 | 1020 | 7.61 × 10⁻⁷ | |
| C4 | 0.001 | 60 | 3.71 × 10⁻⁸ |
| 0.005 | 360 | 2.15 × 10⁻⁷ | |
| 0.010 | 720 | 4.78 × 10⁻⁷ | |
| 0.015 | 900 | 5.91 × 10⁻⁷ | |
| 0.020 | 1200 | 8.25 × 10⁻⁷ |

Table A3.
Dispersivity and n-exponent values for sandstones.
Table A3.
Dispersivity and n-exponent values for sandstones.
| Name | Dispersivity (α) | n-Exponent |
|---|---|---|
| Bandera Gray | 0.0095 | 1.427 |
| Barea | 0.0005 | 1.054 |
| Barea Upper Gray | 0.0013 | 1.202 |
| Bentheimer | 0.0011 | 1.286 |
| Castlegate | 0.0057 | 1.414 |
| Kirby | 0.0013 | 1.192 |
| Leopard | 0.0015 | 1.225 |

Table A4.
Dispersivity and n-exponent values for carbonate.
Table A4.
Dispersivity and n-exponent values for carbonate.
| Name | Dispersivity (α) | n-Exponent |
|---|---|---|
| C1 | 0.0107 | 1.355 |
| C2 | 0.0006 | 1.079 |
| C3 | 0.0029 | 1.289 |
| C4 | 0.0005 | 1.033 |
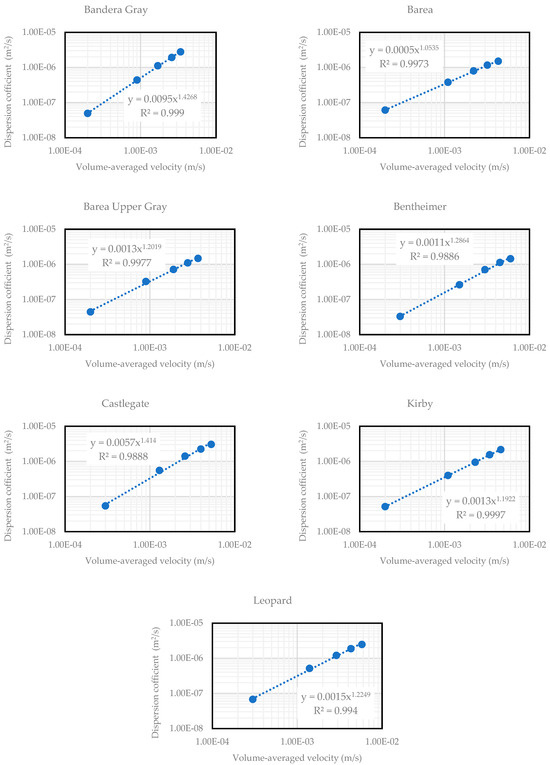
Figure A4.
Dispersion coefficient versus volume-averaged velocity trends for sandstone samples showing dispersivity and n-exponent.
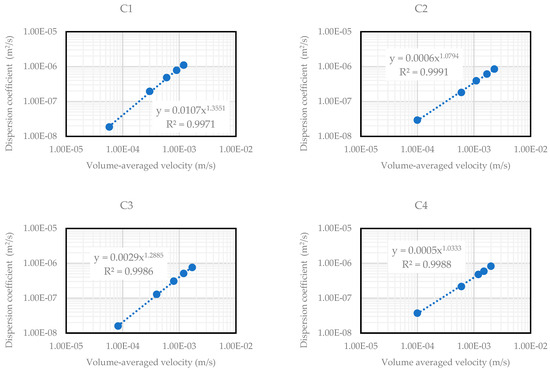
Figure A5.
Dispersion coefficient versus volume-averaged velocity trends for carbonate samples showing dispersivity and n-exponent.
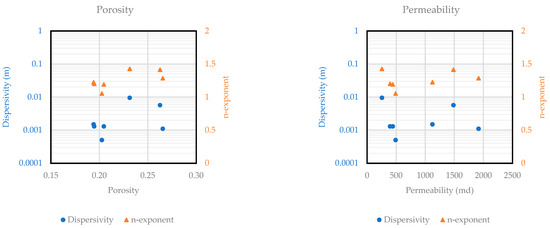
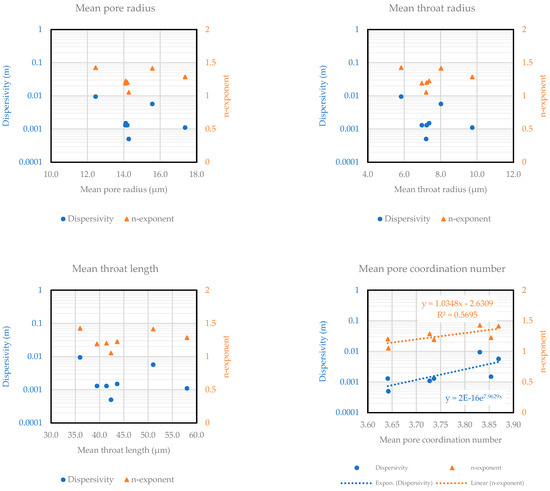
Figure A6.
Correlations for pore structure parameters to dispersivity and n-exponents for sandstone samples.

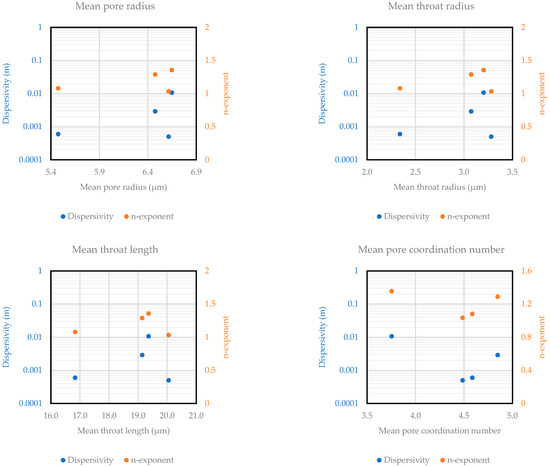
Figure A7.
Correlations for pore structure parameters to dispersivity and n-exponents for carbonate samples.
References
- Coats, K.H.; Whitson, C.H.; Thomas, L.K. Modeling Conformance as Dispersion. SPE Reserv. Eval. Eng. 2009, 12, 33–47. [Google Scholar] [CrossRef]
- Sahimi, M. Flow and Transport in Porous Media and Fractured Rock; Wiley: Hoboken, NJ, USA, 2011; ISBN 9783527404858. [Google Scholar]
- Bear, J. Dynamics of Fluids in Porous Media. J. Fluid Mech. 1973, 61, 206–208. [Google Scholar] [CrossRef]
- Dentz, M.; Icardi, M.; Hidalgo, J.J. Mechanisms of Dispersion in a Porous Medium. J. Fluid Mech. 2018, 841, 851–882. [Google Scholar] [CrossRef]
- Puyguiraud, A.; Gouze, P.; Dentz, M. Pore-Scale Mixing and the Evolution of Hydrodynamic Dispersion in Porous Media. Phys. Rev. Lett. 2021, 126, 164501. [Google Scholar] [CrossRef]
- Wang, Z.; Chauhan, K.; Pereira, J.-M.; Gan, Y. Disorder Characterization of Porous Media and Its Effect on Fluid Displacement. Phys. Rev. Fluids 2019, 4, 034305. [Google Scholar] [CrossRef]
- Fick, A. On Liquid Diffusion. Lond. Edinb. Dublin Philos. Mag. J. Sci. 1855, 10, 30–39. [Google Scholar] [CrossRef]
- Perkins, T.K.; Johnston, O.C. A Review of Diffusion and Dispersion in Porous Media. Soc. Pet. Eng. J. 1963, 3, 70–84. [Google Scholar] [CrossRef]
- Fried, J.J.; Combarnous, M.A. Dispersion in Porous Media. In Advances in Hydroscience; Elsevier: Amsterdam, The Netherlands, 1971; pp. 169–282. [Google Scholar]
- Nguyen, V.; Papavassiliou, D.V. Hydrodynamic Dispersion in Porous Media and the Significance of Lagrangian Time and Space Scales. Fluids 2020, 5, 79. [Google Scholar] [CrossRef]
- Kang, Q.; Zhang, D.; Chen, S.; He, X. Lattice Boltzmann Simulation of Chemical Dissolution in Porous Media. Phys. Rev. E 2002, 65, 036318. [Google Scholar] [CrossRef]
- Bijeljic, B.; Mostaghimi, P.; Blunt, M.J. Signature of Non-Fickian Solute Transport in Complex Heterogeneous Porous Media. Phys. Rev. Lett. 2011, 107, 204502. [Google Scholar] [CrossRef]
- De Paoli, M. Convective Mixing in Porous Media: A Review of Darcy, Pore-Scale and Hele-Shaw Studies. Eur. Phys. J. E 2023, 46, 129. [Google Scholar] [CrossRef] [PubMed]
- Joekar-Niasar, V.; Hassanizadeh, S.M. Analysis of Fundamentals of Two-Phase Flow in Porous Media Using Dynamic Pore-Network Models: A Review. Crit. Rev. Environ. Sci. Technol. 2012, 42, 1895–1976. [Google Scholar] [CrossRef]
- Joekar-Niasar, V.; Hassanizadeh, S.M.; Dahle, H.K. Non-Equilibrium Effects in Capillarity and Interfacial Area in Two-Phase Flow: Dynamic Pore-Network Modelling. J. Fluid Mech. 2010, 655, 38–71. [Google Scholar] [CrossRef]
- El-Zehairy, A.A.; Nezhad, M.M.; Joekar-Niasar, V.; Guymer, I.; Kourra, N.; Williams, M.A. Pore-Network Modelling of Non-Darcy Flow Through Heterogeneous Porous Media. Adv. Water Resour. 2019, 131, 103378. [Google Scholar] [CrossRef]
- Dentz, M.; de Barros, F.P.J. Dispersion Variance for Transport in Heterogeneous Porous Media. Water Resour. Res. 2013, 49, 3443–3461. [Google Scholar] [CrossRef][Green Version]
- Talon, L.; Ollivier-Triquet, E.; Dentz, M.; Bauer, D. Transient Dispersion Regimes in Heterogeneous Porous Media: On the Impact of Spatial Heterogeneity in Permeability and Exchange Kinetics in Mobile–Immobile Transport. Adv. Water Resour. 2023, 174, 104425. [Google Scholar] [CrossRef]
- Liu, Y.; Gong, W.; Xiao, H.; Wang, M. Non-Monotonic Effect of Compaction on Longitudinal Dispersion Coefficient of Porous Media. J. Fluid Mech. 2024, 988, R2. [Google Scholar] [CrossRef]
- Raoof, A.; Hassanizadeh, S.M. Saturation-dependent Solute Dispersivity in Porous Media: Pore-scale Processes. Water Resour. Res. 2013, 49, 1943–1951. [Google Scholar] [CrossRef]
- Saeibehrouzi, A.; Holtzman, R.; Denissenko, P.; Abolfathi, S. Solute Transport in Unsaturated Porous Media with Spatially Correlated Disorder. Adv. Water. Resour. 2024, 191, 104773. [Google Scholar] [CrossRef]
- Mascini, A.; Boone, M.; Van Offenwert, S.; Wang, S.; Cnudde, V.; Bultreys, T. Fluid Invasion Dynamics in Porous Media with Complex Wettability and Connectivity. Geophys. Res. Lett. 2021, 48, e2021GL095185. [Google Scholar] [CrossRef]
- Holtzman, R. Effects of Pore-Scale Disorder on Fluid Displacement in Partially-Wettable Porous Media. Sci. Rep. 2016, 6, 36221. [Google Scholar] [CrossRef]
- Hunt, A.G.; Sahimi, M. Flow, Transport, and Reaction in Porous Media: Percolation Scaling, Critical-Path Analysis, and Effective Medium Approximation. Rev. Geophys. 2017, 55, 993–1078. [Google Scholar] [CrossRef]
- Puyguiraud, A.; Uszes, P.; Dentz, M. The Role of Coordination Number and Pore Size Distribution on Flow Organization in Porous Media 2020. In Proceedings of the 22nd EGU General Assembly, Online, 4–8 May 2020. [Google Scholar]
- Ghanbarian, B.; Esmaeilpour, M.; Ziff, R.M.; Sahimi, M. Effect of Pore-Scale Heterogeneity on Scale-Dependent Permeability: Pore-Network Simulation and Finite-Size Scaling Analysis. Water Resour. Res. 2021, 57, e2021WR030664. [Google Scholar] [CrossRef]
- Liu, Q.; Li, J.; Liang, B.; Sun, W.; Liu, J.; Lei, Y. Microscopic Flow of CO2 in Complex Pore Structures: A Recent 10-Year Review. Sustainability 2023, 15, 12959. [Google Scholar] [CrossRef]
- Vasheghani Farahani, M.; Mousavi Nezhad, M. On the Effect of Flow Regime and Pore Structure on the Flow Signatures in Porous Media. Phys. Fluids 2022, 34, 115139. [Google Scholar] [CrossRef]
- Su, Y.; Zha, M.; Jiang, L.; Ding, X.; Qu, J.; Jin, J.; Iglauer, S. Pore Structure and Fluid Distribution of Tight Sandstone by the Combined Use of SEM, MICP and X-Ray Micro-CT. J. Pet Sci. Eng. 2022, 208, 109241. [Google Scholar] [CrossRef]
- Rabbani, A.; Jamshidi, S.; Salehi, S. An Automated Simple Algorithm for Realistic Pore Network Extraction from Micro-Tomography Images. J. Pet. Sci. Eng. 2014, 123, 164–171. [Google Scholar] [CrossRef]
- Yi, Z.; Lin, M.; Jiang, W.; Zhang, Z.; Li, H.; Gao, J. Pore Network Extraction from Pore Space Images of Various Porous Media Systems. Water Resour. Res. 2017, 53, 3424–3445. [Google Scholar] [CrossRef]
- Gostick, J.; Khan, Z.; Tranter, T.; Kok, M.; Agnaou, M.; Sadeghi, M.; Jervis, R. PoreSpy: A Python Toolkit for Quantitative Analysis of Porous Media Images. J. Open. Source Softw. 2019, 4, 1296. [Google Scholar] [CrossRef]
- Gostick, J.; Aghighi, M.; Hinebaugh, J.; Tranter, T.; Hoeh, M.A.; Day, H.; Spellacy, B.; Sharqawy, M.H.; Bazylak, A.; Burns, A.; et al. OpenPNM: A Pore Network Modeling Package. Comput. Sci. Eng. 2016, 18, 60–74. [Google Scholar] [CrossRef]
- Taylor, G. Dispersion of Soluble Matter in Solvent Flowing Slowly Through a Tube. Proc. R Soc. Lond. A Math Phys. Sci. 1953, 219, 186–203. [Google Scholar] [CrossRef]
- Iraji, S.; De Almeida, T.R.; Munoz, E.R.; Basso, M.; Vidal, A.C. The Impact of Heterogeneity and Pore Network Characteristics on Single and Multi-Phase Fluid Propagation in Complex Porous Media: An X-Ray Computed Tomography Study. Pet. Sci. 2024, 21, 1719–1738. [Google Scholar] [CrossRef]
- Bradley, J.; Singh, K.; Wang, L. Intrapore Geometry and Flow Rate Controls on the Transition of Non-Fickian to Fickian Dispersion. Water. Resour. Res. 2023, 59, e2022WR032833. [Google Scholar] [CrossRef]
- Wildenschild, D.; Sheppard, A.P. X-Ray Imaging and Analysis Techniques for Quantifying Pore-Scale Structure and Processes in Subsurface Porous Medium Systems. Adv. Water. Resour. 2013, 51, 217–246. [Google Scholar] [CrossRef]
- Arand, F.; Hesser, J. Accurate and Efficient Maximal Ball Algorithm for Pore Network Extraction. Comput. Geosci. 2017, 101, 28–37. [Google Scholar] [CrossRef]
Disclaimer/Publisher’s Note: The statements, opinions and data contained in all publications are solely those of the individual author(s) and contributor(s) and not of MDPI and/or the editor(s). MDPI and/or the editor(s) disclaim responsibility for any injury to people or property resulting from any ideas, methods, instructions or products referred to in the content. |
© 2025 by the authors. Licensee MDPI, Basel, Switzerland. This article is an open access article distributed under the terms and conditions of the Creative Commons Attribution (CC BY) license (https://creativecommons.org/licenses/by/4.0/).