Abstract
One of the methods for mitigating the duck curve phenomenon in photovoltaic (PV) energy systems is storing surplus energy in the form of hydrogen. However, there is a lack of studies focused on residential PV systems that assess the impact of hydrogen storage on the reduction of energy flow imbalance to and from the national grid. This study presents an analysis of hydrogen energy storage based on real-world data from a household PV installation. Using simulation methods grounded in actual electricity consumption and hourly PV production data, the research identified the storage requirements, including the required operating hours and the capacity of the hydrogen tank. The analysis was based on a 1 kW electrolyzer and a fuel cell, representing the smallest and most basic commercially available units, and included a sensitivity analysis. At the household level—represented by a single-family home with an annual energy consumption and PV production of approximately 4–5 MWh over a two-year period—hydrogen storage enabled the production of 49.8 kg and 44.6 kg of hydrogen in the first and second years, respectively. This corresponded to the use of 3303 kWh of PV-generated electricity and an increase in self-consumption from 30% to 64%. Hydrogen storage helped to smooth out peak energy flows from the PV system, decreasing the imbalance from 5.73 kWh to 4.42 kWh. However, while it greatly improves self-consumption, its capacity to mitigate power flow imbalance further is constrained; substantial improvements would necessitate a much larger electrolyzer proportional in size to the PV system’s output.
1. Introduction
1.1. Polish Energy Mix and Challenges
The growing share of renewable energy sources in the energy mix in Poland brings new challenges. Storing energy on a daily basis using batteries is not always a viable solution, as increasing storage capacity may lead to underutilization of the energy generated during daylight hours due to insufficient nighttime demand. Consequently, the capacity is not fully utilized the next day. This occurs because daily household energy consumption, especially in summer, is often less than the amount of energy stored (for increased storage capacity), resulting in storage not being emptied overnight. This indicates that the assumed storage capacity is insufficiently large compared to actual consumption. One potential solution is energy storage using hydrogen.
Both rising electricity prices and their variability on a daily and seasonal scale, as well as the need to introduce an increasing volume of energy from renewable sources, create favorable conditions for the development and application of energy storage systems, including the aforementioned hydrogen storage systems. The energy transformation in Poland forces the use of increasingly new solutions in this area [1,2]. An analysis of the use of various types of renewable energy in Polish households was made by Wróblewski and Niekurzak [3]. They accounted for the impact of using various types of renewable energy sources (RES) combined with financing methods on reducing CO2 emissions, specifically in the context of replacing old heating systems with new ones, while considering electricity generation from photovoltaic systems.
In Poland, the volume of energy produced from photovoltaics and wind is growing every year, despite the presence of many barriers to the development of these technologies and the seasonality of high energy production from these sources. Their seasonal excess affects both the national grid and the local scale and leads to various related problems. Locally, the problems are mainly related to photovoltaic micro-installations, because over 99% of micro-installations are photovoltaic systems [4]. The installed capacity of renewable energy sources has been increasing for several years, resulting in steadily rising energy production from these sources. From 2023, a temporary excess of energy that can be produced (on a daily scale) has led to the need to curtail some sources (mainly PV in 2024). At the same time, it is noticeable that wind energy predominantly generates in the winter period and photovoltaics in the spring and summer periods. Additionally, the scale of installed photovoltaic capacity is significant, mostly prosumer installations, of which there are currently about 1.5 million [4], while the installed wind power capacity consists only of large turbines. Support programs for smaller wind turbines on a household scale are only just emerging, but this is associated with high uncertainty in the annual productivity of these sources in various locations in the country, as shown, for example, by Kryzia et al. [5], but the local location system is also important.
The benefits and opportunities of energy storage at the level of households, enterprises, and local communities in Poland have also been analyzed [6,7]. From an economic point of view, without more than a 50% subsidy for energy storage, this type of installation is not profitable. To avoid the duck curve effect, energy storage facilities should be properly managed.
Currently, energy storage in battery storage and pumped storage power plants is a solution on a daily scale, as Olczak showed [8,9], but it is not a preferred solution on a household scale, because these households have a much higher energy surplus around noon than the maximum hourly energy demand at night. This trend intensifies with the increasing average power of photovoltaic micro-installations among prosumers: in 2021, this value was below 7 kWp, while in 2024, it was above 8 kWp [4]. Work is also being carried out (in the field of, among others, energy management systems) to increase the self-consumption rate in this type of household. This is, of course, purposeful and very necessary, but it is not possible to effectively utilize the additional several dozen kWh of energy on a household scale every day. There are simply no such energy needs [7,10], and even if there were, the size of the selected power of the PV installation would be worth considering. The introduction of dynamic tariffs may allow for an increase in energy consumption (around noon hours) also among those who do not use photovoltaics, which in the future will enable more efficient integration of energy into the grid by prosumers or photovoltaic farms. The occurrence of periods of even several days in a row with surpluses of energy from photovoltaics (around noon) contributes to the need for long-term storage of electricity for households. As Olczak showed, such storage would have to have large capacities, i.e., of the order of several megawatt hours for a household [11]. Therefore, partial storage of excess energy from photovoltaics into hydrogen is considered a viable option.
1.2. Literature Review
Kupecki et al. proposed a 10 kW power-to-gas system along with an assessment and analysis of the system’s effectiveness for stabilizing operation, among others, of the national grid (in the case of both large-scale power and a large number of micro-installations) [12]. A similar analysis for a 5 kWp photovoltaic home installation (a household in Switzerland) and hydrogen production, as well as hydrogen storage installation, was conducted by Hollmuller before 2000 [13]. However, it concerned a different purpose and was based on different technologies from over 20 years ago, and these have developed significantly in recent years [14,15,16].
Since then, several studies have utilized the HOMER software to explore hydrogen’s potential for energy storage in specialized applications. For example, Kalamaras et al. [17] used HOMER to simulate and calculate the feasibility of employing hydrogen for energy storage in specialized home installations, such as off-grid systems. As a result, they identified a configuration, including a 3.35 kW PV module, a 4.2 kW electrolyzer, a 40 kg hydrogen tank, and a 2.9 kW fuel cell, as enough combination to fulfill electrical and thermal load demand for an off-grid Greek island. Similarly, Lacko et al. [18] employed HOMER to analyze the use of hydrogen in a stand-alone renewable combined heat and power system. They included three scenarios of electricity and heat production using combinations of RES and fossil fuel to supply a reference household. Analyses were based on actual measured data and simulation. Kapen et al. [19], also using HOMER, evaluated the feasibility of integrating a hydrogen system to relieve the power system in Cameroon. They analyzed energy load and production, including a hydrogen tank (5000 kg) for three types of household electricity demand profiles. Attemene et al. [20] conducted optimization studies focused on system configuration, considering the total cost, including capital, maintenance, and replacement costs. Additionally, they analyzed energy reliability based on the Loss of Power Supply Probability (LPSP). Their research employed methods such as the Non-Dominated Sorting Genetic Algorithm II (NSGA-II) and included sensitivity analysis based on wind speed profiles and subsystem costs [20].
Budak and Devrim analyzed the system for a household. The methanol and water electrolyzers were designed for a 1.2 kW PEMFC hydrogen demand, which met the house-hold’s energy requirements. The analysis shows that the use of the methanol electrolyzer can be effective [21]. Hashimoto and Kawahara optimally selected the fuel cell (FC) and photovoltaic system for a single-family house [22]. Hassan carried out an optimization of the size of household devices in the field of hydrogen and renewable energy production [23]. Torok et al. developed a prototype solution for producing hydrogen for households [24].
The aging effects on the modeling and operation of a photovoltaic system with hydrogen storage over 10 years of operation were analyzed by Ceran et al. The analysis was based on experimental data, including photovoltaic modules, fuel cells, electrolyzers, hydrogen storage, and hydrogen backup systems [25]. The results showed that after 10 years of system operation, the electricity consumption per unit of hydrogen by the electrolyzer increases by at least 4.6%, while the hydrogen consumption per unit of electricity by the fuel cell increases by over 13%. Additionally, the energy efficiency of photovoltaic panels decreases. These factors, combined with the variability in production and energy demand caused by factors such as weather conditions, present challenges for selecting appropriate infrastructure for such systems.
Abdolmaleki and Berardi [26] studied hybrid renewable energy-based systems incorporating PV, fuel cell, and hydrogen. Among others, PV/hydrogen was compared using the HOMER software, available for major North American cities. They also investigated a hydrogen-fueled system for zero-energy buildings based on dynamic simulation with TRNSYS software [27]. Jahanbin et al. [28] analyzed integrating hybrid-battery hydrogen energy storage for academic buildings. As a result of integrating PV with gaseous hydrogen and metal hydride storage, the annual renewable factor increased to 22.6% (for PV alone, 14.4%).
Shao et al. [29] analyzed the use of a hydrogen-centered multi-energy microgrid for rural areas based on household application. They also conducted a risk analysis of using hydrogen in microgrids for rural areas. Zhuk et al. [30] investigated a fully automated hydrogen generator for domestic and mobile applications, and estimated the hydrogen cost at 5–8 USD/kg H2. Nastasi et al. [31] compared hydrogen and battery solutions for storing solar energy applications in five buildings. The optimal storage time (based on CAPEX and OPEX) was calculated as weekly or monthly storage, depending on the electricity demand profile.
The objective of this study is to determine the appropriate size of a hydrogen storage tank for a household-scale system, given specified power capacities of the fuel cell and electrolyzer, and to address the associated energy challenges. Numerous studies have explored the optimal sizing of energy storage systems, often from an economic perspective (e.g., utilizing tools such as HOMER software) or by analyzing technical requirements for storing energy from renewable sources. However, these studies typically focus on determining the appropriate capacity of hydrogen storage infrastructure and its potential impact on the national energy grid. The latter is achieved by quantitatively estimating the scope of solving the “duck curve” phenomenon by storing energy in hydrogen, which remains a complex and multifaceted challenge [8,32].
Section 2 provides an overview of the installation used as the basis for the calculations and details the methodologies employed in this study. Section 3 presents the results of the calculations, followed by a discussion of these findings in Section 4. Finally, Section 5 concludes the article with key takeaways and insights.
2. Materials and Methods
2.1. Research Object
A household facility located in Małopolska with energy consumption corresponding to 4–5 MWh per year was selected for the analysis, rather than households located in blocks of flats, as only those with slightly increased electricity demand consider such solutions. The selected installation (capacity PPV = 5.04 kWp) has already been analyzed in several articles regarding both photovoltaics [33] and energy storage, but never in terms of hydrogen production. Examples of energy consumption as well as energy production from PV are shown in Figure A1.
Approximately 850 h with energy consumption exceeding 1 kWh were recorded annually. For PV, 1780 and 1830 h in particular years with energy consumption exceeding 1 kWh were observed, and approximately 3500 h with energy production above 0.1 kWh.
Surprisingly, for the installation studied, an 8–10 kWh energy storage system proved as effective at storing annual energy as a system ten times larger [11]. Nonetheless, to achieve relative energy self-sufficiency, a substantially larger storage capacity of around 2 MWh is necessary, and even then, performance will fluctuate with yearly weather patterns. The EUR 1 million [11] cost of this storage facility is exorbitant compared to average annual household energy expenses of under EUR 2000. Therefore, the advantages of energy storage do not directly lead to significant savings or reducing energy costs.
2.2. Hydrogen Installation
The above-mentioned issues related to battery storage suggest exploring solutions in other technologies, hence, the proposal to store household energy in hydrogen—Figure 1, and the energy calculation algorithm—Figure 2.

Figure 1.
Proposed installation scheme with hydrogen storage. Symbols are explained in the equations below.
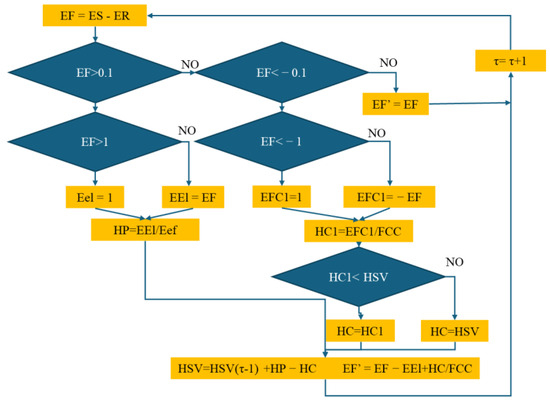
Figure 2.
Simplified calculation algorithm (without the influence of storage capacity)—please see also equations in Appendix A.
Hourly mass value of hydrogen production in the electrolyzer (HP):
Eef—electrolyzer energy consumption (for the production of 1 kg of H2): 50 [34], kWh/kg H2
EEl—please see Appendix A, kWh
Energy flow values after hydrogen system is installed (EF’):
The algorithm for calculating HSV and EF’ is shown in the figure below. The input capacity of the electrolyzer and the output capacity of the fuel cell were assumed to be PH = 1 kW.
2.3. Impact on Duck Curve Calculation Method
Additionally, the impact of energy storage in hydrogen on the unevenness of energy flow from installation to the external grid (EF) was demonstrated, expressed using the VDC unevenness index, as shown by [32], for installations without storage:
However, with a hydrogen storage system, the calculation is based on the following formula:
where:
- VDC—maximum daily difference in energy flow without storage, kWh
- VDC’—maximum daily difference in energy flow with hydrogen storage, kWh
- EF or EF’—energy flow without or with hydrogen storage, kWh
2.4. Self-Consumption Ratio and Self-Sufficiency Ratio
Hourly self-consumption energy with a hydrogen storage system was calculated by:
where:
- ESC’—self-consumed energy with hydrogen installation, kWh
- EPV—hourly PV energy production, kWh
- ES’—hourly energy sent to the grid from installation with hydrogen installation—Appendix A, kWh
- HSC0—hydrogen storage useful capacity—Appendix A, kg
3. Results
The results in the form of the amount of hydrogen produced in the electrolysis process and the amount of hydrogen consumed in the fuel cell, presented alongside the energy flow to and from the grid, are shown in Figure 3.
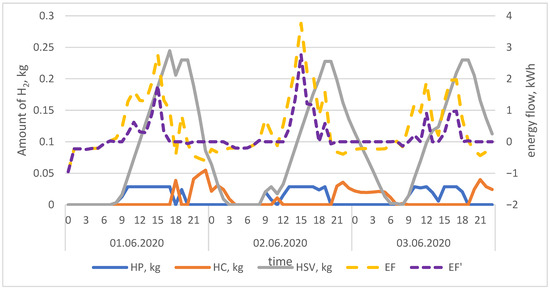
Figure 3.
Quantitative (mass) hydrogen production and consumption, state of charge of the hydrogen storage, and energy flows in the installation—example for the period from 1 June 2020 to 3 June 2020. HP—hourly hydrogen production, HC—hourly hydrogen consumption, HSV—amount of hydrogen stored, EF—energy flow in the analyzed installation without hydrogen system (right-scale), EF’—energy flow with the hydrogen system (right-scale).
On the first day (1 June 2020), the maximum hourly amount of hydrogen production was 28.6 g H2 (from 10 am to 5 pm), and the maximum hourly amount of hydrogen consumption was 54.9 g H2. During each day shown in Figure 3, the cumulative production of hydrogen reached nearly 0.25 kg H2/day. On the second day, the maximum value of EF was 3.76 kWh, and the minimum was −0.39 kWh (VDC = 4.15 kWh); with the hydrogen system, the values were 2.76 kWh and −0.20 kWh (VDC’ = 2.96 kWh). The excess energy from PV transferred to the electrolysis process was 9.4 kWh on the first day, 8.3 kWh on the second day, and 8.0 kWh on the third day.
However, the total value of energy delivered by the fuel cell was 2 kWh on the first day (practical operation began in the afternoon, as the hydrogen tank was first filled at 8 am), 2.1 kWh on the second day, and 2.8 kWh on the third day.
The total electricity directed to the electrolysis process was 1742 kWh in the first year and 1561 kWh in the second year—a total of 3303 kWh, which accounts for approximately 33% of the energy produced by the PV installation. The total electricity produced by the fuel cell was 546 kWh in the first year and 490 kWh in the second year.
The total hydrogen produced in the first year was 49.8 kg and in the second year, 44.6 kg, with the same amount of hydrogen consumed. The amount of energy allocated to the electrolysis process in relation to the total PV production is shown in Figure 4.
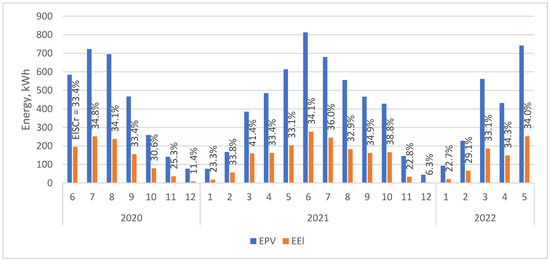
Figure 4.
PV energy production (EPV), electrolyzer energy consumption on a monthly scale (EEl), and PV self-consumption ratio including electrolyzer consumption (ElSCr) for the period June 2020–May 2022.
The maximum monthly value of PV energy production was recorded in June 2021: 813 kWh, and the minimum in December 2021: 44 kWh. For electrolyzer energy consumption, the values were 277 kWh and 3 kWh, respectively. The maximum value of PV self-consumption ratio, including electrolyzer consumption (ElSCr), was observed in July 2020: 34.8%, and the minimum in December 2021: 6.3%. In the autumn and winter period, a lower share of energy directed to the electrolyzer was noticeable due to the higher level of direct self-consumption (before storage installation) and lower energy surpluses. The charging status of the storage with no capacity limitations is presented in the figure below (Figure 5).
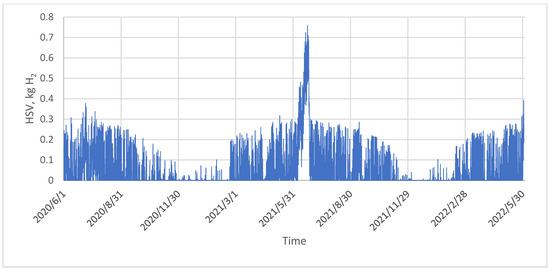
Figure 5.
Hydrogen storage level (HSV—amount of hydrogen stored in the tank, kg) over two years, assuming unlimited storage capacity.
Despite the assumption of unlimited hydrogen tank capacity, the amount of hydrogen stored in the analyzed installation never exceeded 0.8 kg. Therefore, it can be concluded that for almost the entire two-year analysis period, the hydrogen energy storage system operated in daily cycles—the entire amount of hydrogen produced during midday hours was consumed in the evening and at night. The only exception occurred in June 2021, when a larger amount of hydrogen accumulated over several consecutive days—details are presented in Figure A2 in the Appendix A. For 99% of the time, the amount of hydrogen stored in the tank did not exceed 0.3 kg. Thus, for an installation of this scale, a tank of such capacity would be sufficient, as illustrated in the figure below. The observed daily charging and discharging behavior of the hydrogen tank suggests, on the one hand, that the photovoltaic and electrolyzer capacities should be significantly increased. On the other hand, such scaling would lead to less efficient use of the infrastructure (e.g., in terms of electrolyzer operating hours) and would negatively affect energy flows to and from the grid (e.g., as expressed by the VDC indicator)—Figure 6.
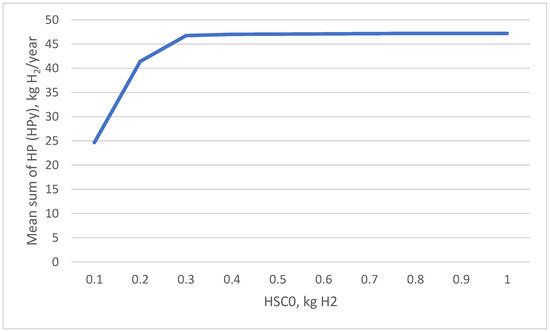
Figure 6.
Total mass of hydrogen produced as a function of the useful capacity of hydrogen storage.
In the presented case study (research object), over a two-year period, increasing the hydrogen storage capacity beyond 0.7 kg resulted in no change in the amount of hydrogen produced annually (HPy). Additionally, the influence of storage on the maximum differences in energy flows was demonstrated (Figure 7).
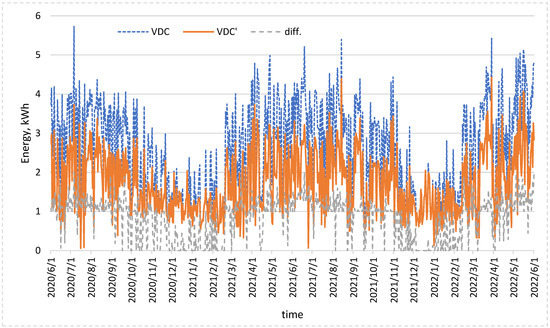
Figure 7.
VDC value curve over two years, corrected by hydrogen storage (VDC’), and the difference before and after the hydrogen storage system.
Using energy storage in hydrogen, the maximum VDC value was reduced from 5.7 kWh to 3.8 kWh (6 July 2020), while over the two-year period, the maximum unevenness occurred on 14 August 2021, 4.4 kWh. The maximum daily reduction was 1.96 kWh.
Over the two years, the total energy produced in the home PV installation was 9.86 MWh, energy consumed was 9.49 MWh, and the amount of energy sent to the grid was 6.90 MWh and received was 6.53 MWh. Adding hydrogen storage reduced the amount of energy sent to the grid to 3.60 MWh (over two years) and reduced the amount of energy drawn from the grid to 5.50 MWh. As a result of these changes, the self-consumption rate (SCr) increased from 30% to 63.5% while the self-sufficiency rate (SSr) increased from 31.2% to 42.1%.
4. Discussion
The main results of the study consist of determining the functional relationships regarding the tank capacity required to store hydrogen at household scale, in order to utilize surplus energy (partly at the household scale), while taking into account the conditions of energy consumption and production. For an installed power of 1 kW, the useful hydrogen storage capacity needed is 0.7 kg. This is important from an economic point of view because it saves costs, resources, and infrastructure for storing hydrogen [35,36]. Safety issues are also important [37], mainly regarding hydrogen storage (under pressure in homes) and transport [38,39]. In terms of saving resources, in addition to the tanks, the power level is also relevant—in this case 1 kW. This amount of power enabled 2183 h of operation in the first year and 2025 h in the second year.
The dependence on the power conversion number of hours would be smaller and by reducing the power, power utilization would be greater. The selected system with a power of 1 kW and a capacity of 0.7 kg is able to cover 11.8% and 10.1% of electricity demand in the first and second year, respectively, under actual production and consumption conditions.
However, 1 kW of output power could theoretically cover 7900 h of demand annually. In turn, full coverage of the power generated from PV was not a priority in this computational analysis due to the differences in installed power and its potential use of 1 kW in the electrolyzer and 5.04 kWp in PV. The most controversial issue is the cost of storing energy in the amount of 40–50 kg of hydrogen per year. In the analyzed case, an energy storage system with a capacity below 3 kWh has total investment costs of EUR 1000, while the cost of hydrogen infrastructure exceeds EUR 20,000. This amount would suffice for 100 kWh of storage capacity in lithium-ion batteries. The benefit of using both technologies will be a drop in prices, which will reduce investment outlays, but in the case of hydrogen, it will be difficult to eliminate operational service costs related to hydrogen technology, as well as failure rates, water purification, and compression requirements [40].
As shown in the literature analysis, this topic has been developed for over 25 years [13], and this potential will be greater with decreasing Levelized Cost of Electricity (LCOE) for new PV installations, as well as improved efficiencies, lower investment outlays, and reduced energy storage costs. Developing hydrogen technologies for vehicles is an opportunity, but it also carries certain risks (such as resources competition). It should be noted that until 2022, energy storage in micro-installations was practically unattractive for economic and technical reasons, primarily due to the net-metering support program [41]. Since then, things have improved in terms of battery storage due to support schemes. While some benefits of hydrogen technologies can be expected in the future, the economic feasibility and market conditions may outweigh these potential advantages. However, long-term benefits include a lower number of charge/discharge cycles, which negatively impacts economic viability.
An analysis of the sensitivity of the results presented in Figure 5, Figure 6 and Figure 7 was also conducted—see Figure 8.
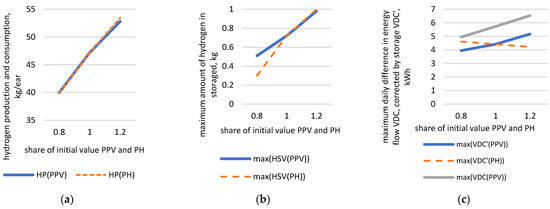
Figure 8.
Sensitivity analysis of the following results: (a) average annual hydrogen production and consumption, (b) the maximum amount of hydrogen in storage, (c) the maximum daily difference in energy flow without storage (VDC) and with hydrogen storage (VDC’) as a function of the share of the initial values PPV = 5.04 kWp and PH = 1 kW.
An increase or decrease in the power of the PV system, electrolyzer, and fuel cell similarly affects the amount of hydrogen produced and consumed in the storage system (Figure 8a). The difference in impact occurs when reducing the power of the electrolyzer and fuel cell compared to reducing the power of the PV system (Figure 8b). A 20% decrease in PH results in a greater reduction in the maximum amount of stored hydrogen (from 0.72 to 0.3 kg) than a decrease in the power of the PV system (from 0.72 to 0.51 kg). The reason for this is, among other things, that the power of the PV system (despite its 20% reduction) is more than sufficient to produce hydrogen with the maximum power of the electrolyzer during periods of high solar radiation intensity. On the other hand, any decrease in the power of the electrolyzer or fuel cell significantly limits the possibilities of hydrogen production. Additionally, the amount of stored hydrogen increased above typical values (up to approx. 0.3 kg H2—Figure 8) is relatively very sensitive to its occurrence (such a situation occurred only once in two years—Figure 8).
Sensitivity analysis for the calculated values of the largest unevenness of daily differences in energy flow to and from the installation on a yearly basis is based on the size of the PV installation, which determines the reference values of VDC ranging from 4.95 to 6.53 kWh (Figure 8c). These values refer to the day on which the largest unevenness in energy flows to and from the installation occurred over a 2-year period. In contrast, the maximum value obtained using hydrogen storage VDC’ ranged from 4.42 to 5.17 kWh, depending on the PPV value. The result obtained also indicates that increasing the power of the electrolyzer and fuel cell (from 80% to 120% of the reference PH value of 1 kW) leads to a reduction in the maximum value of VDC’, from 4.62 to 4.22 kWh. In this sensitivity range of energy flow unevenness, the maximum values for the analysis period (max VDC and max VDC’) were used, as these are particularly important for the stability of the power system. The obtained reduction in the maximum VDC value for PH = 1.2 kW is comparable to the reduction achieved using two electric energy storages with a capacity of 12 kWh [8].
5. Conclusions
The potential for energy storage using hydrogen technology (from electrolyzer to fuel cell) was analyzed, focusing on the needs of a typical household in Poland. The study used real data from an existing PV installation, including recorded values of hourly energy production and actual energy consumption for a house located in the Małopolskie region.
The proposed energy storage system was designed with a capacity of 1 kW for both the input power of the electrolyzer and the output power of the fuel cell, assuming an overall energy storage efficiency of 30%. The analysis revealed that the electrolyzer operated for 2183 h (1742 h at nominal power) in the first year and 2025 h (1562 h at nominal power) in the second year, producing 49.8 kg and 44.6 kg of hydrogen, respectively. For 99% of the days, a hydrogen tank capacity of 0.33 kg was sufficient, while covering 100% of the days over two years would require a tank capacity of 0.7 kg. The implementation of this infrastructure increased the PV self-consumption rate from 30% to over 63%. However, due to the low efficiency of hydrogen-based energy storage, the energy self-sufficiency ratio only increased from 31% to 42%.
Hydrogen storage contributed to reducing the daily energy flow imbalance in the analyzed micro-installation, from over 5.7 kWh to approximately 4.4 kWh. Despite the relatively low power ratings of the devices (electrolyzer and fuel cells), their capacity factor remained below 20% annually. Increasing device utilization is achievable by expanding the PV installation’s capacity; however, this would, in turn, increase the energy flow imbalance between the household and the power grid.
Additionally, the study highlights that the integration of hydrogen storage technology presents unique challenges and opportunities for decentralized energy systems. While the technology effectively increases self-consumption and reduces energy flow disparities, its scalability is hindered by high initial investment costs and low conversion efficiencies. Nevertheless, hydrogen’s long-term storage capability makes it a promising solution for addressing seasonal mismatches between energy supply and demand.
Furthermore, the implementation of hydrogen storage systems can contribute to the stabilization of the national grid by mitigating the “duck curve” phenomenon. By storing surplus energy during peak PV production periods and redistributing it during periods of high demand, hydrogen technology can support grid resilience and enable higher penetration of renewable energy sources.
Directions for further research:
- Analysis of alternative power ratings and larger household scales—extending the study to include different system sizes and a greater number of households.
- Considering the degradation of devices and their variable efficiency depending on the operating conditions, including load.
- Implementation of operational constraints—for example, preventing hydrogen storage discharge during periods of low electricity prices or at night (e.g., between 1:00 and 4:00 AM), as well as considering hydrogen storage charging at night.
- Estimation of water consumption—assessing water usage associated with electrolysis and other system processes.
- Assessment of thermal energy utilization—evaluating the potential for recovering and using heat generated during hydrogen storage processes, particularly from the fuel cell.
Author Contributions
Conceptualization, P.O. and D.M.; methodology, P.O.; formal analysis, P.O. and D.M.; investigation, P.O. and D.M.; software, P.O. and D.M.; visualization, P.O.; writing—original draft preparation, P.O. and D.M.; writing—review and editing, P.O. and D.M.; supervision, P.O.; project administration, P.O.; funding acquisition, P.O. and D.M. All authors have read and agreed to the published version of the manuscript.
Funding
This research was partially supported by the Ministry of Science and Higher Education, Poland, grant AGH number 16.16.210.476.
Data Availability Statement
The raw data supporting the conclusions of this article will be made available by the authors on request.
Conflicts of Interest
The authors declare no conflicts of interest.
Glossary
| Nomenclature | |
| AC | alternative current |
| CAPEX | capital expenditure |
| DC | direct current |
| DwPV | electricity demand in national grid scale, GWh |
| DwoPV | electricity demand in national grid scale minus electricity generated by photovoltaic, GWh |
| EC | hourly energy consumption in household installation, kWh |
| Eef | electrolyzer energy consumption, kWh/kg H2 |
| EEl | energy allocated to the electrolysis process, kWh |
| EF | value of hourly energy flow, kWh |
| EF’ | energy flow values after hydrogen system installed, kWh |
| EFC1 | energy obtained from the fuel cell as a first approximation |
| ElSCr | PV self-consumption ratio, including electorysel consumption |
| EPV | hourly energy production from PV, kWh |
| ER | hourly energy received from the grid to installation, kWh |
| ER’ | hourly energy received from the grid to installation with hydrogen installation, kWh |
| ES | hourly energy sent to the grid from installation, kWh |
| ES’ | hourly energy sent to the grid from installation with hydrogen installation, kWh |
| ESC | hourly energy self-consumed, kWh |
| ESC’ | self-consumed energy with hydrogen installation, kWh |
| FC | fuel cell |
| FCC | fuel cell unit consumption, kg H2/kWh |
| HC | hourly hydrogen consumption by fuel cell, kg H2 |
| HC1 | estimated hourly mass value of hourly hydrogen consumption from the tank, kg H2 |
| HP | hourly value of mass of hydrogen production in the electrolyzer, kg |
| HPy | annual value of mass of hydrogen production in the electrolyzer, kg |
| HSC0 | hydrogen storage useful capacity, kg |
| HSV | value of hydrogen storage in hydrogen tank, kg |
| LPSP | loss of power supply probability |
| NSGA-II | non-dominated sorting genetic algorithm II |
| OPEX | operating expense |
| PEMFC | proton exchange membrane fuel cell |
| PH | capacity of electrolyzer input and capacity of fuel cell output, kW |
| PPV | capacity of PV installation, kWp |
| PV | photovoltaic |
| RES | renewable energy source |
| SCr | self-consumption ratio |
| SCr’ | self-consumption ratio with hydrogen installation |
| SSr | self-sufficiency ratio |
| SSr’ | self-sufficiency ratio with hydrogen installation |
| VDC | maximum daily difference in energy flow without storage, kWh |
| VDC’ | maximum daily difference in energy flow with hydrogen installation, kWh |
| year1 | period from 06/2020 to 05/2021 |
| year2 | period from 06/2021 to 05/2022 |
| Greek | |
| τ | hour |
Appendix A
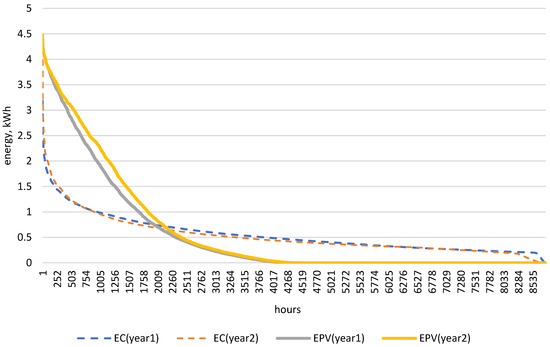
Figure A1.
Energy production from PV (EPV), energy consumption (EC) for the analyzed household installation—real data from two-year period (2020–2022).
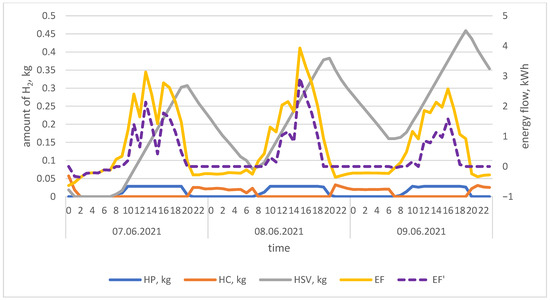
Figure A2.
Volume of mass hydrogen production and consumption over a period of several days during which the total demand is lower than the total production.
Appendix A.1. Additional Equations
The formula for surplus PV energy to be utilized is based on the amount measured by a bidirectional energy meter:
where:
- EF—hourly energy flow, kWh
- ES—energy sent to the grid (source: energy meter), kWh
- ER—energy received from the grid (source: energy meter), kWh
- τ—time hour
Energy self-consumed (ESC) is calculated using the following equation [18,42]:
where:
- EPV—hourly photovoltaic energy production, kWh
- ES—energy sent to the grid, kWh
Energy allocated to the electrolysis process (provided that the maximum storage capacity is not exceeded—so that the tank can accept an additional amount of hydrogen):
The total annual amount of hydrogen produced was determined according to the following formula:
Calculation of the energy obtained from the fuel cell as a first approximation of EFC1, based on the energy flow (EF):
On this basis, the first estimated hourly mass value of hourly hydrogen consumption from the tank can be calculated:
where:
- FCC—fuel cell unit consumption, kg H2/kWh
The correction of hourly hydrogen consumption according to the mass amount of hydrogen accumulated in the tank is as follows:
The stored mass amount of hydrogen in the tank is calculated according to the formula:
Conditions—correction due to hydrogen storage capacity:
Appendix A.2. Self Consumption Ratio and Self-Sufficiency Ratio
The energy sent to the grid with the hydrogen storage system was calculated by the following equation:
where:
- ES—hourly energy sent to the grid from installation, kWh
- EEl—hourly energy allocated to the electrolysis process, kWh
The energy received from the grid with the hydrogen storage system was calculated using the following equation:
where:
- ER—hourly energy received from the grid to installation, kWh
- HC—hourly hydrogen consumption by fuel cell, kg H2
- HSC0—hydrogen storage useful capacity, kg H2
- FCC—fuel cell unit consumption, kg H2/kWh
The PV self-consumption ratio including electrolyzer consumption (ElSCr) was calculated by following equation:
where:
- EEl—hourly energy allocated to the electrolysis process, kWh
- HSC0—hydrogen storage useful capacity, kg
The self-consumption ratio of energy over two years was calculated by the following:
where:
- ES—hourly energy sent to the grid from installation, kWh
- EPV—hourly PV energy production, kWh
The self-consumption ratio of energy with the hydrogen storage system was calculated using the following:
where:
- EPV—hourly PV energy production, kWh
- HSC0—hydrogen storage useful capacity, kg
- ES’—hourly energy sent to the grid from installation with hydrogen installation, kWh
The self-sufficiency ratio over two years was calculated by the following:
where:
- EC—hourly energy consumption in household installation, kWh
- ER—hourly energy received from the grid to installation, kWh
The self-sufficiency ratio over two years with the hydrogen storage system was calculated by the following:
where:
- HSC0—hydrogen storage useful capacity, kg
- EC—hourly energy consumption in household installation, kWh
- ER’—hourly energy received from the grid to installation with hydrogen installation, kWh
References
- Szczerbowski, R.; Ceran, B. Polityka Energetyczna Polski w Aspekcie Wyzwań XXI Wieku. Polityka Energ.-Energy Policy J. 2017, 20, 17–28. [Google Scholar]
- Zdonek, I.; Tokarski, S.; Mularczyk, A.; Turek, M. Evaluation of the Program Subsidizing Prosumer Photovoltaic Sources in Poland. Energies 2022, 15, 846. [Google Scholar] [CrossRef]
- Wróblewski, P.; Niekurzak, M. Assessment of the Possibility of Using Various Types of Renewable Energy Sources Installations in Single-Family Buildings as Part of Saving Final Energy Consumption in Polish Conditions. Energies 2022, 15, 1329. [Google Scholar] [CrossRef]
- PTPiREE. Micro-Installations in Poland. Available online: http://www.ptpiree.pl/energetyka-w-polsce/energetyka-w-liczbach/mikroinstalacje-w-polsce (accessed on 5 November 2023).
- Kryzia, D.; Olczak, P.; Wrona, J.; Kopacz, M.; Kryzia, K.; Galica, D. Dampening Variations in Wind Power Generation Through Geographical Diversification. IOP Conf. Ser. Earth Environ. Sci. 2019, 214, 012038. [Google Scholar] [CrossRef]
- Wróbel, J.; Sołtysik, M.; Rogus, R. Selected Elements of the Neighborly Exchange of Energy—Profitability Evaluation of the Functional Model. Polityka Energ. 2019, 22, 53–64. [Google Scholar] [CrossRef]
- Kaczmarzewski, S.; Matuszewska, D.; Sołtysik, M. Analysis of Selected Service Industries in Terms of the Use of Photovoltaics before and during the COVID-19 Pandemic. Energies 2022, 15, 188. [Google Scholar] [CrossRef]
- Olczak, P. Magazynowanie Energii Elektrycznej w Prosumenckich Mikroinstalacjach Fotowoltaicznych; Mokrzycki, E., Ed.; IGSMiE PAN: Kraków, Poland, 2022. [Google Scholar]
- Olczak, P.; Matuszewska, D. Energy Storage Potential Needed at the National Grid Scale (Poland) in Order to Stabilize Daily Electricity Production from Fossil Fuels and Nuclear Power. Energies 2023, 16, 6054. [Google Scholar] [CrossRef]
- Szablicki, M.; Rzepka, P.; Soltysik, M.; Czapaj, R. The Idea of Non-Restricted Use of LV Networks by Electricity Consumers, Producers, and Prosumers. E3S Web Conf. 2019, 84, 2014. [Google Scholar] [CrossRef]
- Olczak, P.; Koval, V.; Yanovska, V.; Lomachynska, I. The Use of Electricity Storage on the Path to Prosumer Energy Self-Sufficiency: Eastern Europe Case Study. In Green Energy and Technology; Springer: Cham, Switzerland, 2023; pp. 19–31. [Google Scholar] [CrossRef]
- Kupecki, J.; Motylinski, K.; Jagielski, S.; Wierzbicki, M.; Brouwer, J.; Naumovich, Y.; Skrzypkiewicz, M. Energy Analysis of a 10 kW-Class Power-to-Gas System Based on a Solid Oxide Electrolyzer (SOE). Energy Convers. Manag. 2019, 199, 111934. [Google Scholar] [CrossRef]
- Hollmuller, P.; Joubert, J.-M.; Lachal, B.; Yvon, K. Evaluation of a 5 KWp Photovoltaic Hydrogen Production and Storage Installation for a Residential Home in Switzerland. Int. J. Hydrogen Energy 2000, 25, 97–109. [Google Scholar] [CrossRef]
- Cader, J.; Koneczna, R.; Olczak, P. The Impact of Economic, Energy, and Environmental Factors on the Development of the Hydrogen Economy. Energies 2021, 14, 4811. [Google Scholar] [CrossRef]
- Lewis, N.S. Research Opportunities to Advance Solar Energy Utilization. Science 2016, 351, aad1920. [Google Scholar] [CrossRef] [PubMed]
- Koohi-Fayegh, S.; Rosen, M.A. A Review of Energy Storage Types, Applications and Recent Developments. J. Energy Storage 2020, 27, 101047. [Google Scholar] [CrossRef]
- Kalamaras, E.; Belekoukia, M.; Lin, Z.; Xu, B.; Wang, H.; Xuan, J. Techno-Economic Assessment of a Hybrid Off-Grid DC System for Combined Heat and Power Generation in Remote Islands. Energy Procedia 2019, 158, 6315–6320. [Google Scholar] [CrossRef]
- Lacko, R.; Drobnič, B.; Mori, M.; Sekavčnik, M.; Vidmar, M. Stand-Alone Renewable Combined Heat and Power System with Hydrogen Technologies for Household Application. Energy 2014, 77, 164–170. [Google Scholar] [CrossRef]
- Tiam Kapen, P.; Medjo Nouadje, B.A.; Chegnimonhan, V.; Tchuen, G.; Tchinda, R. Techno-Economic Feasibility of a PV/Battery/Fuel Cell/Electrolyzer/Biogas Hybrid System for Energy and Hydrogen Production in the Far North Region of Cameroon by Using HOMER Pro. Energy Strateg. Rev. 2022, 44, 100988. [Google Scholar] [CrossRef]
- Attemene, N.S.; Agbli, K.S.; Fofana, S.; Hissel, D. Optimal Sizing of a Wind, Fuel Cell, Electrolyzer, Battery and Supercapacitor System for off-Grid Applications. Int. J. Hydrogen Energy 2020, 45, 5512–5525. [Google Scholar] [CrossRef]
- Budak, Y.; Devrim, Y. Comparative Study of PV/PEM Fuel Cell Hybrid Energy System Based on Methanol and Water Electrolysis. Energy Convers. Manag. 2019, 179, 46–57. [Google Scholar] [CrossRef]
- Hashimoto, K.; Kawahara, K. Optimal Operation of Fuel Cell and Electrolyzer in Household Hybrid System by Stochastic Programming. In Proceedings of the 2017 IEEE Innovative Smart Grid Technologies—Asia (ISGT-Asia), Auckland, New Zealand, 4–7 December 2017; pp. 1–6. [Google Scholar] [CrossRef]
- Hassan, Q. Optimisation of Solar-Hydrogen Power System for Household Applications. Int. J. Hydrogen Energy 2020, 45, 33111–33127. [Google Scholar] [CrossRef]
- Török, L.; Nielsen, C.K.; Munk-Nielsen, S.; Rømer, C.; Flindt, P. High Efficiency Electrolyser Power Supply for Household Hydrogen Production and Storage Systems. In Proceedings of the 2015 17th European Conference on Power Electronics and Applications (EPE’15 ECCE-Europe), Geneva, Switzerland, 8–10 September 2015; pp. 1–9. [Google Scholar] [CrossRef]
- Ceran, B.; Mielcarek, A.; Hassan, Q.; Teneta, J.; Jaszczur, M. Aging Effects on Modelling and Operation of a Photovoltaic System with Hydrogen Storage. Appl. Energy 2021, 297, 117161. [Google Scholar] [CrossRef]
- Abdolmaleki, L.; Berardi, U. Hybrid Solar Energy Systems with Hydrogen and Electrical Energy Storage for a Single House and a Midrise Apartment in North America. Int. J. Hydrogen Energy 2024, 52, 1381–1394. [Google Scholar] [CrossRef]
- Abdolmaleki, L.; Berardi, U. Dynamic Simulation of a Hydrogen-Fueled System for Zero-Energy Buildings Using TRNSYS Software. E3S Web Conf. 2023, 396, 04005. [Google Scholar] [CrossRef]
- Jahanbin, A.; Abdolmaleki, L.; Berardi, U. Techno-Economic Feasibility of Integrating Hybrid-Battery Hydrogen Energy Storage in Academic Buildings. Energy Convers. Manag. 2024, 309, 118445. [Google Scholar] [CrossRef]
- Shao, Z.; Cao, X.; Zhai, Q.; Guan, X. Risk-Constrained Planning of Rural-Area Hydrogen-Based Microgrid Considering Multiscale and Multi-Energy Storage Systems. Appl. Energy 2023, 334, 120682. [Google Scholar] [CrossRef]
- Zhuk, A.Z.; Shkolnikov, E.I.; Borodina, T.I.; Valiano, G.E.; Dolzhenko, A.V.; Kiseleva, E.A.; Kochanova, S.A.; Filippov, E.D.; Semenova, V.A. Aluminium—Water Hydrogen Generator for Domestic and Mobile Application. Appl. Energy 2023, 334, 120693. [Google Scholar] [CrossRef]
- Nastasi, B.; Mazzoni, S.; Groppi, D.; Romagnoli, A.; Astiaso Garcia, D. Optimized Integration of Hydrogen Technologies in Island Energy Systems. Renew. Energy 2021, 174, 850–864. [Google Scholar] [CrossRef]
- Olczak, P.; Jaśko, P.; Kryzia, D.; Matuszewska, D.; Fyk, M.I.; Dyczko, A. Analyses of Duck Curve Phenomena Potential in Polish PV Prosumer Households’ Installations. Energy Rep. 2021, 7, 4609–4622. [Google Scholar] [CrossRef]
- Kazanecka, E.; Olczak, P. A Specific Yield Comparison of 2 Photovoltaic Installations—Polish Case Study. Polityka Energ.-Energy Policy J. 2023, 26, 129–148. [Google Scholar] [CrossRef]
- Groenemans, H.; Saur, G.; Mittelsteadt, C.; Lattimer, J.; Xu, H. Techno-Economic Analysis of Offshore Wind PEM Water Electrolysis for H2 Production. Curr. Opin. Chem. Eng. 2022, 37, 100828. [Google Scholar] [CrossRef]
- Sezer, D.; Ada, E.; Kazançoğlu, Y. Investigating the Key Drivers in the Transition to Sustainable Hydrogen Transportation Fuel. Econ. Ecol. Socium 2024, 8, 16–26. [Google Scholar] [CrossRef]
- NRC; NAE. Transportation, Distribution, and Storage of Hydrogen. In The Hydrogen Economy: Opportunities, Costs, Barriers, and R&D Needs; National Research Council and National Academy of Engineering, Ed.; The National Academies Press: Washington, DC, USA, 2004. [Google Scholar] [CrossRef]
- Hrinchenko, H.; Antonenko, N.; Khomenko, V.; Artiukh, S. Assessment of Power Equipment Operational Safety in the Sustainable Management of Residual Lifespan. Econ. Ecol. Socium 2024, 8, 78–91. [Google Scholar] [CrossRef]
- Stecuła, K.; Olczak, P.; Kamiński, P.; Matuszewska, D.; Duong Duc, H. Towards Sustainable Transport: Techno-Economic Analysis of Investing in Hydrogen Buses in Public Transport in the Selected City of Poland. Energies 2022, 15, 9456. [Google Scholar] [CrossRef]
- Dawood, F.; Anda, M.; Shafiullah, G.M. Hydrogen Production for Energy: An Overview. Int. J. Hydrogen Energy 2020, 45, 3847–3869. [Google Scholar] [CrossRef]
- Genovese, M.; Piraino, F.; Kovač, A.; Marciuš, D.; Pagnotta, L.; Fragiacomo, P. Integration of Hydrogen Compressors and Turbines into Current and Future Hydrogen Infrastructure. J. Power Sources 2025, 629, 235965. [Google Scholar] [CrossRef]
- Trela, M.; Dubel, A. Net-Metering vs. Net-Billing from the Investors Perspective—Impacts of Changes in RES Financing in Poland on the Profitability of a Joint Photovoltaic Panels and Heat Pump System. Energies 2022, 15, 227. [Google Scholar] [CrossRef]
- Roberts, M.B.; Sharma, A.; MacGill, I. Efficient, Effective and Fair Allocation of Costs and Benefits in Residential Energy Communities Deploying Shared Photovoltaics. Appl. Energy 2022, 305, 117935. [Google Scholar] [CrossRef]
Disclaimer/Publisher’s Note: The statements, opinions and data contained in all publications are solely those of the individual author(s) and contributor(s) and not of MDPI and/or the editor(s). MDPI and/or the editor(s) disclaim responsibility for any injury to people or property resulting from any ideas, methods, instructions or products referred to in the content. |
© 2025 by the authors. Licensee MDPI, Basel, Switzerland. This article is an open access article distributed under the terms and conditions of the Creative Commons Attribution (CC BY) license (https://creativecommons.org/licenses/by/4.0/).