
MCDM Optimization-Based Development of a Plus-Energy Microgrid Architecture for University Buildings and Smart Parking


Abstract
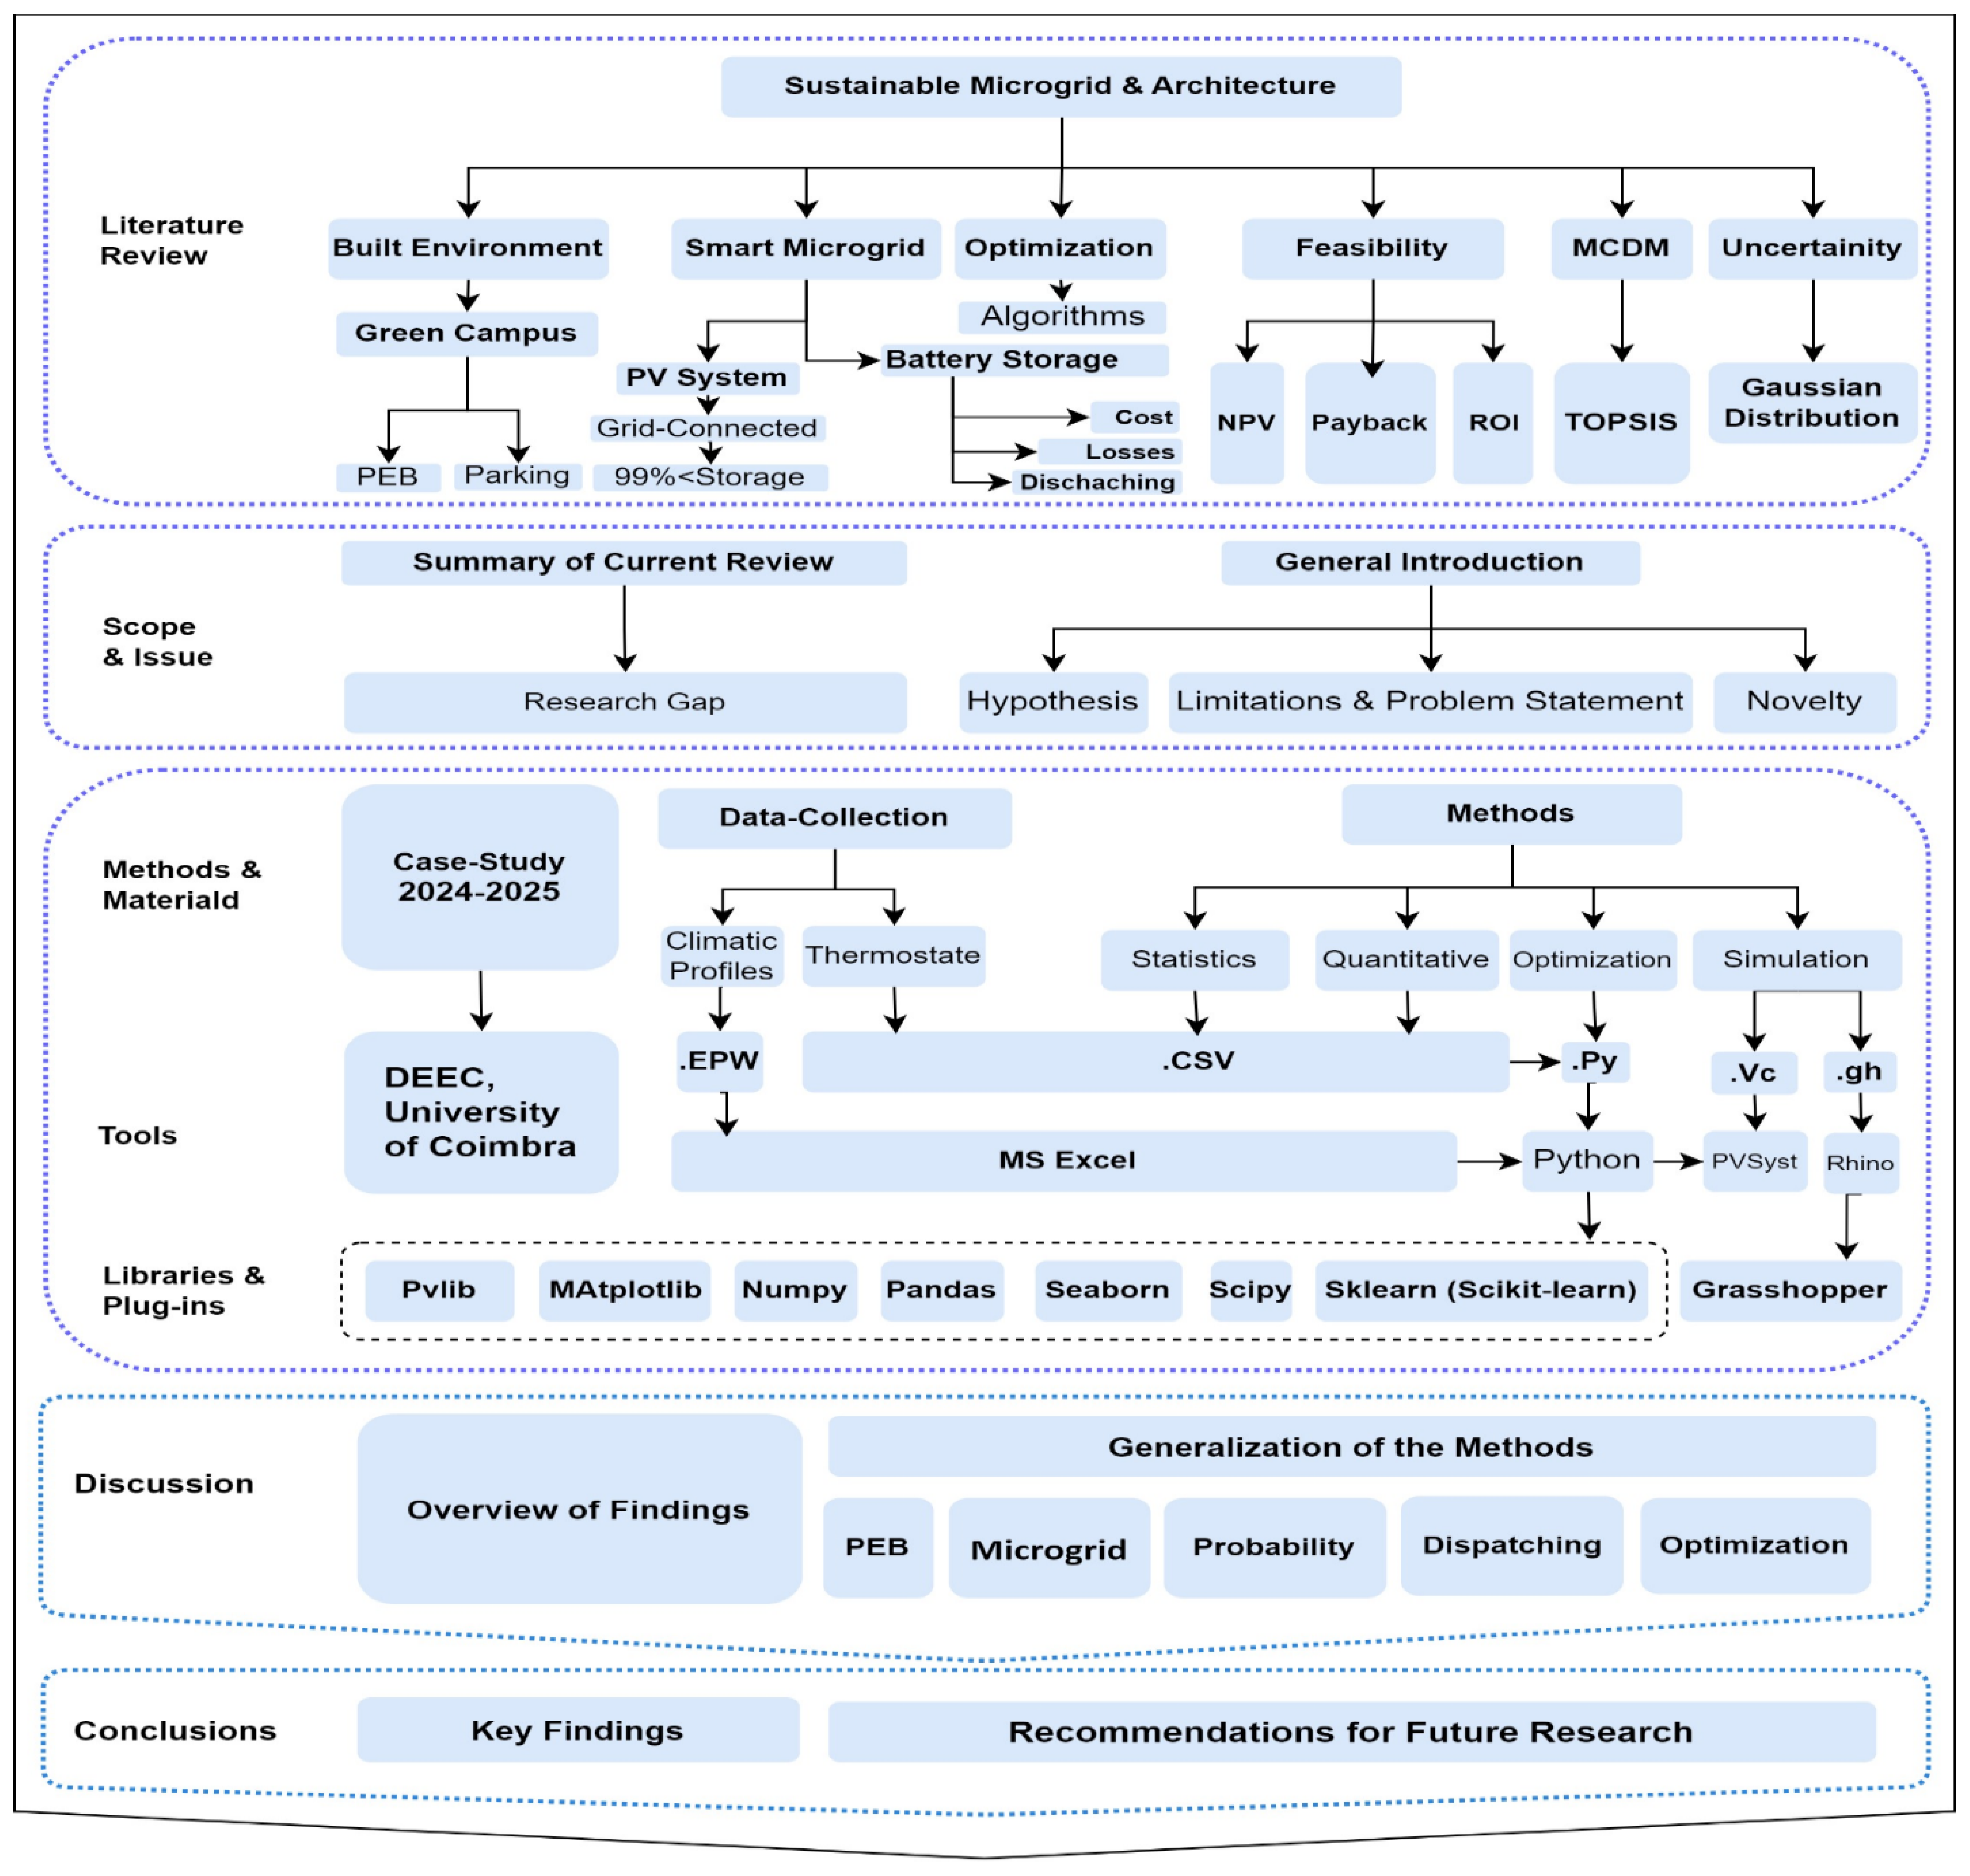
1. Introduction
1.1. Research Motivation
1.2. Literature Review
1.3. Research Novelty
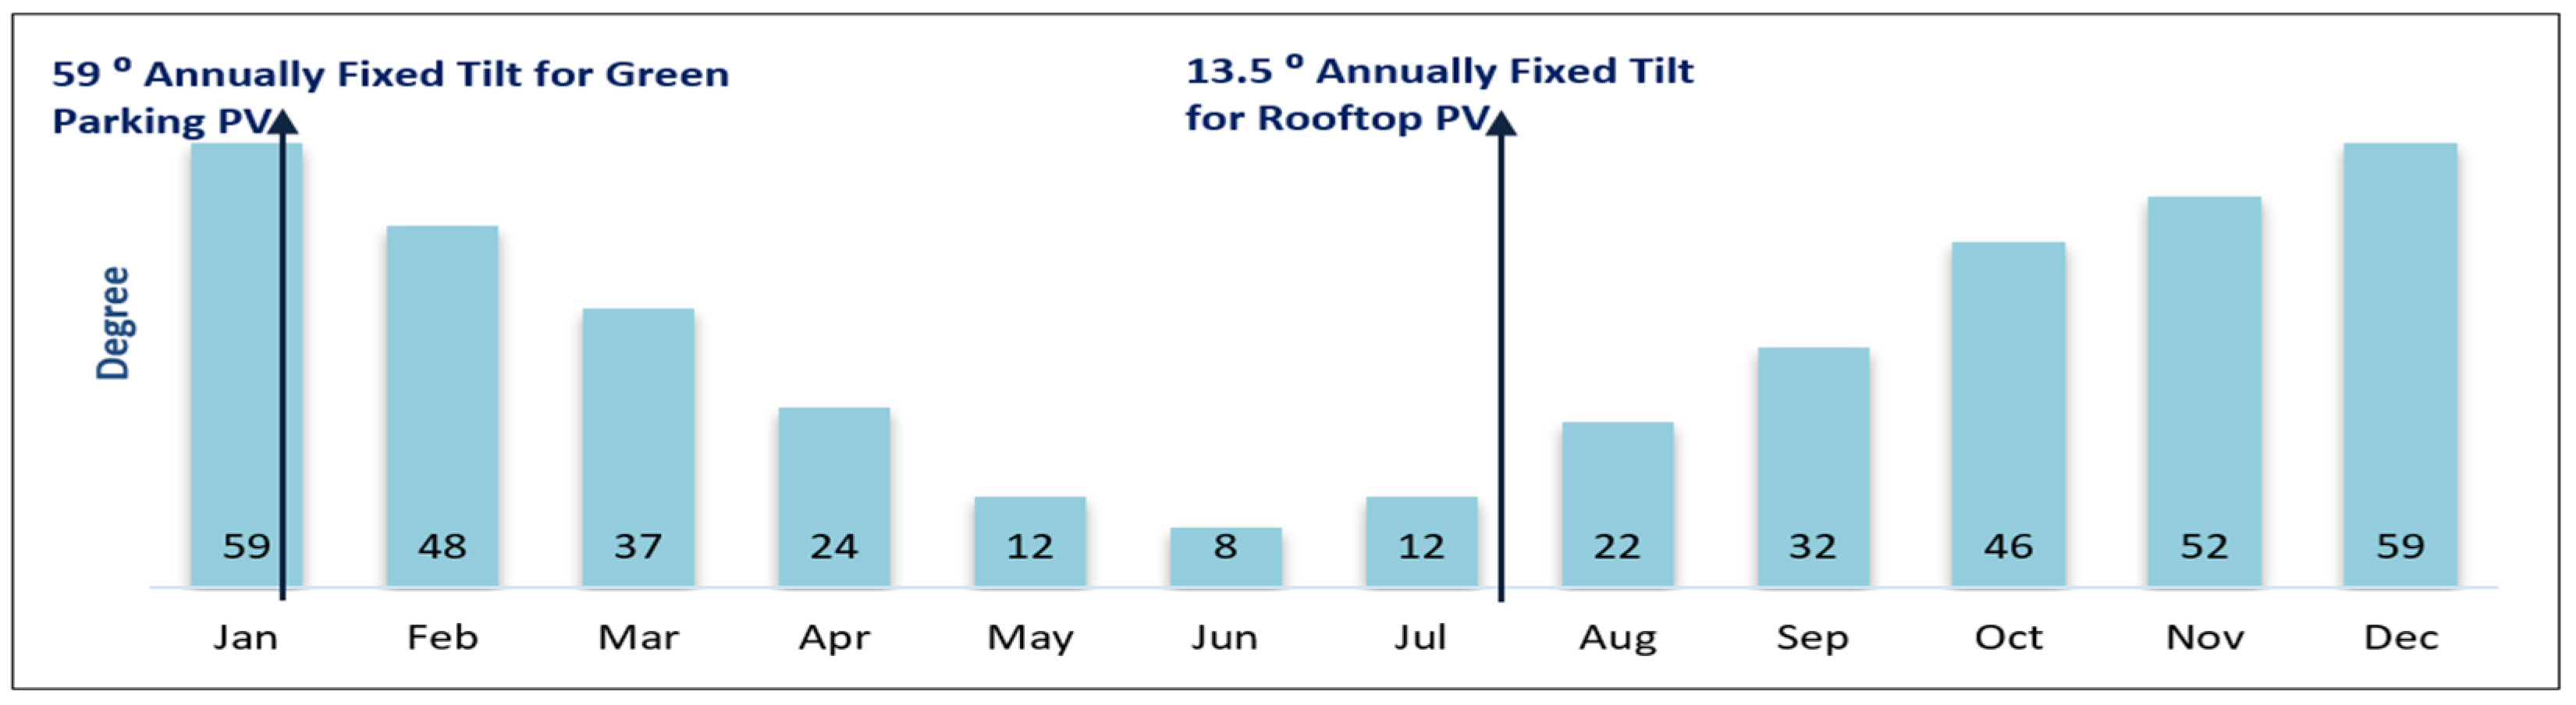
- Advanced Fixed Tilt Optimization: This study proposes a dual fixed tilt approach (13.5° for rooftop and 59° for green parking), carefully selected to balance energy independence while minimizing grid injection in critical periods. This method enhances yield stability across seasonal variations and ensures high system efficiency.
- Optimized Row Spacing with Shading Loss Reduction: This research employs a geometric shading analysis combined with solar position algorithms to determine the most efficient row spacing between panels. This method reduces inter-row shading losses and improves energy capture, optimizing system performance compared to conventional setups.
- IAM-Based Energy Adjustment: The implementation of the Incidence Angle Modifier (IAM) correction refines energy estimation, accounting for angular losses in solar radiation. Unlike conventional models that assume a constant efficiency, IAM ensures a more accurate representation of received irradiance at varying tilt angles.
- Probabilistic Performance Assessment via Gaussian and Monte Carlo Modeling: To quantify uncertainties in solar generation, this study introduces a Gaussian-based probability analysis of irradiation and energy production validated by Monte Carlo simulation. This probabilistic approach improves confidence in system feasibility, providing an insightful P50 vs. P98 yield comparison for risk assessment.
- Trade-off Analysis Using Multi-Criteria Decision-Making (MCDM): Economic feasibility is evaluated through the TOPSIS decision-making framework, considering battery storage cost, surplus energy injection, and autonomous operation duration. This holistic assessment provides a data-driven financial optimization strategy, ensuring realistic scalability.
2. Theories and Design Fundamentals
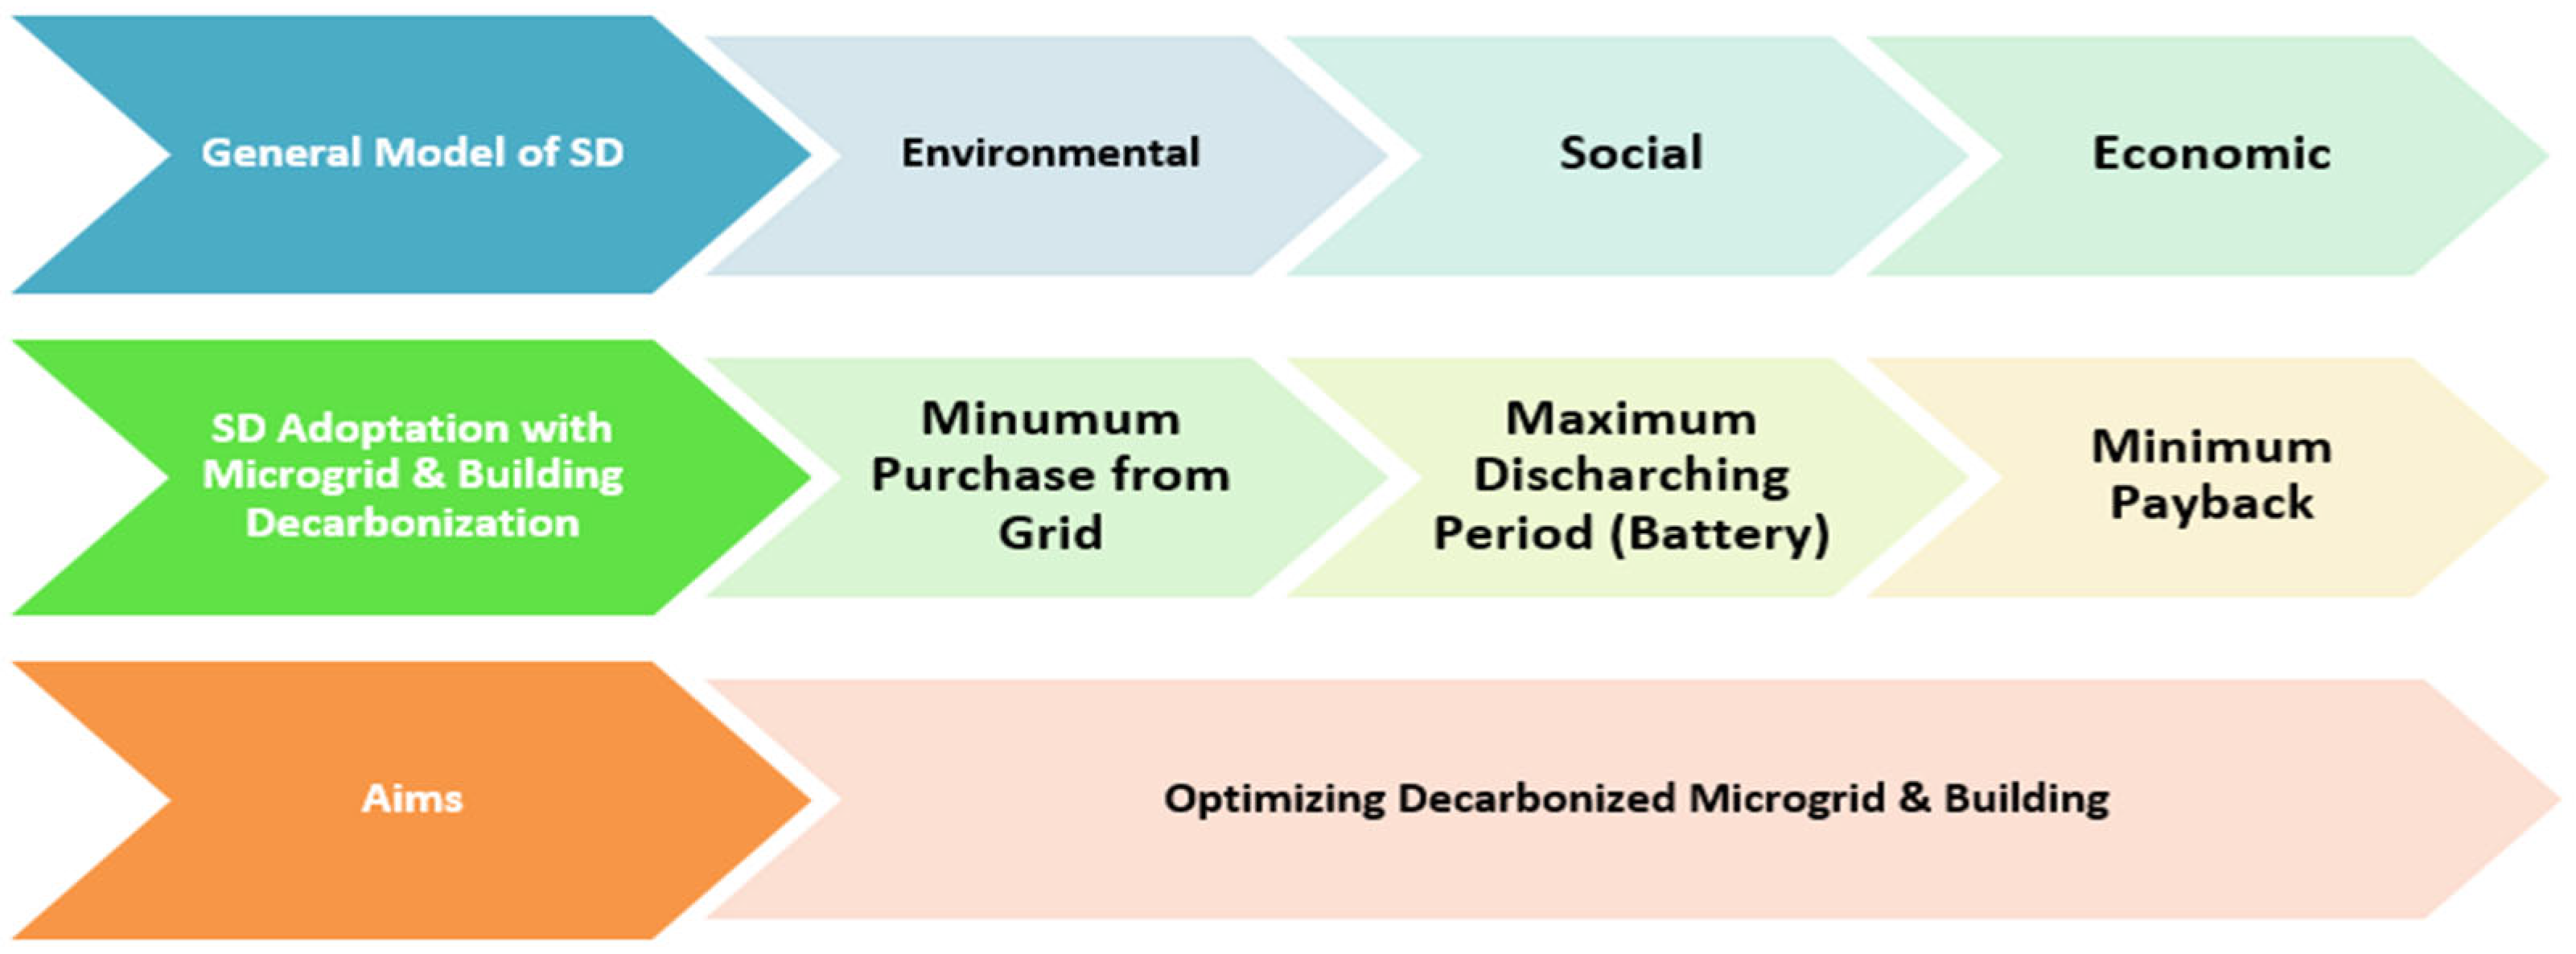
2.1. Sustainable Microgrid
2.2. Power Generation, Uncertainty, and Optimization
2.2.1. Gaussian Distribution and Probability
- = probability density function (likelihood of a certain energy yield);
- E = energy yield value;
- μ = mean value (P50 energy production estimate);
- σ = standard deviation (uncertainty range);
- e = Euler’s number (~2.718).
2.2.2. Energy Output and Performance Ratio
- E: annual energy output (in kilowatt-hours, kWh).
- A: total area of the PV system (m2).
- : efficiency of the PV panels (e.g., 0.25 for 25%).
- : annual average solar radiation on tilted panels (kWh/m2/year).
- PR: performance ratio.
- E_Grid is energy injected into the grid (kWh);
- E_Solar is energy used directly before grid export (kWh);
- GlobInc represents irradiation in the plane of the array (kWh/m2);
- P_nomPV addresses installed nominal power of the PV system (kWp).
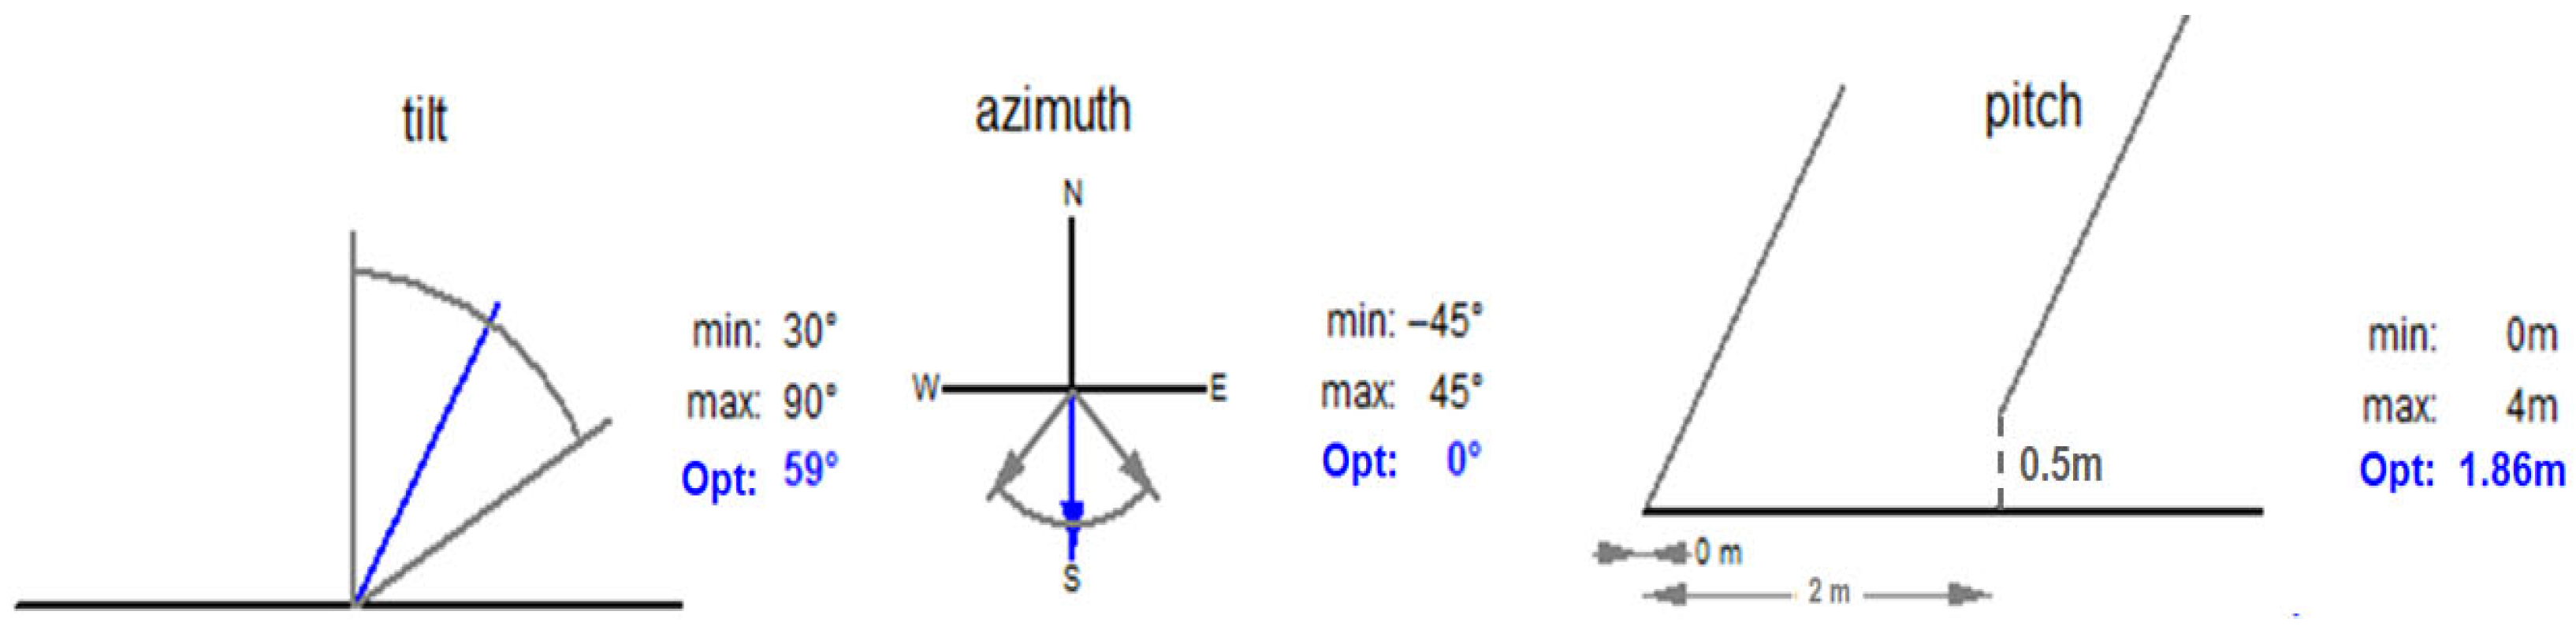
- If the panel is mounted at a 90-degree angle, this value will be exactly equal to the panel length.
- If the tilt angle is 0 degrees (i.e., the panel is completely horizontal to the ground), this value will be 0.
- This value is similar to the optimal dynamic height since both depend on the tilt angle, but it is not exactly equivalent, since the optimal dynamic height also depends on the effective height of the panel.
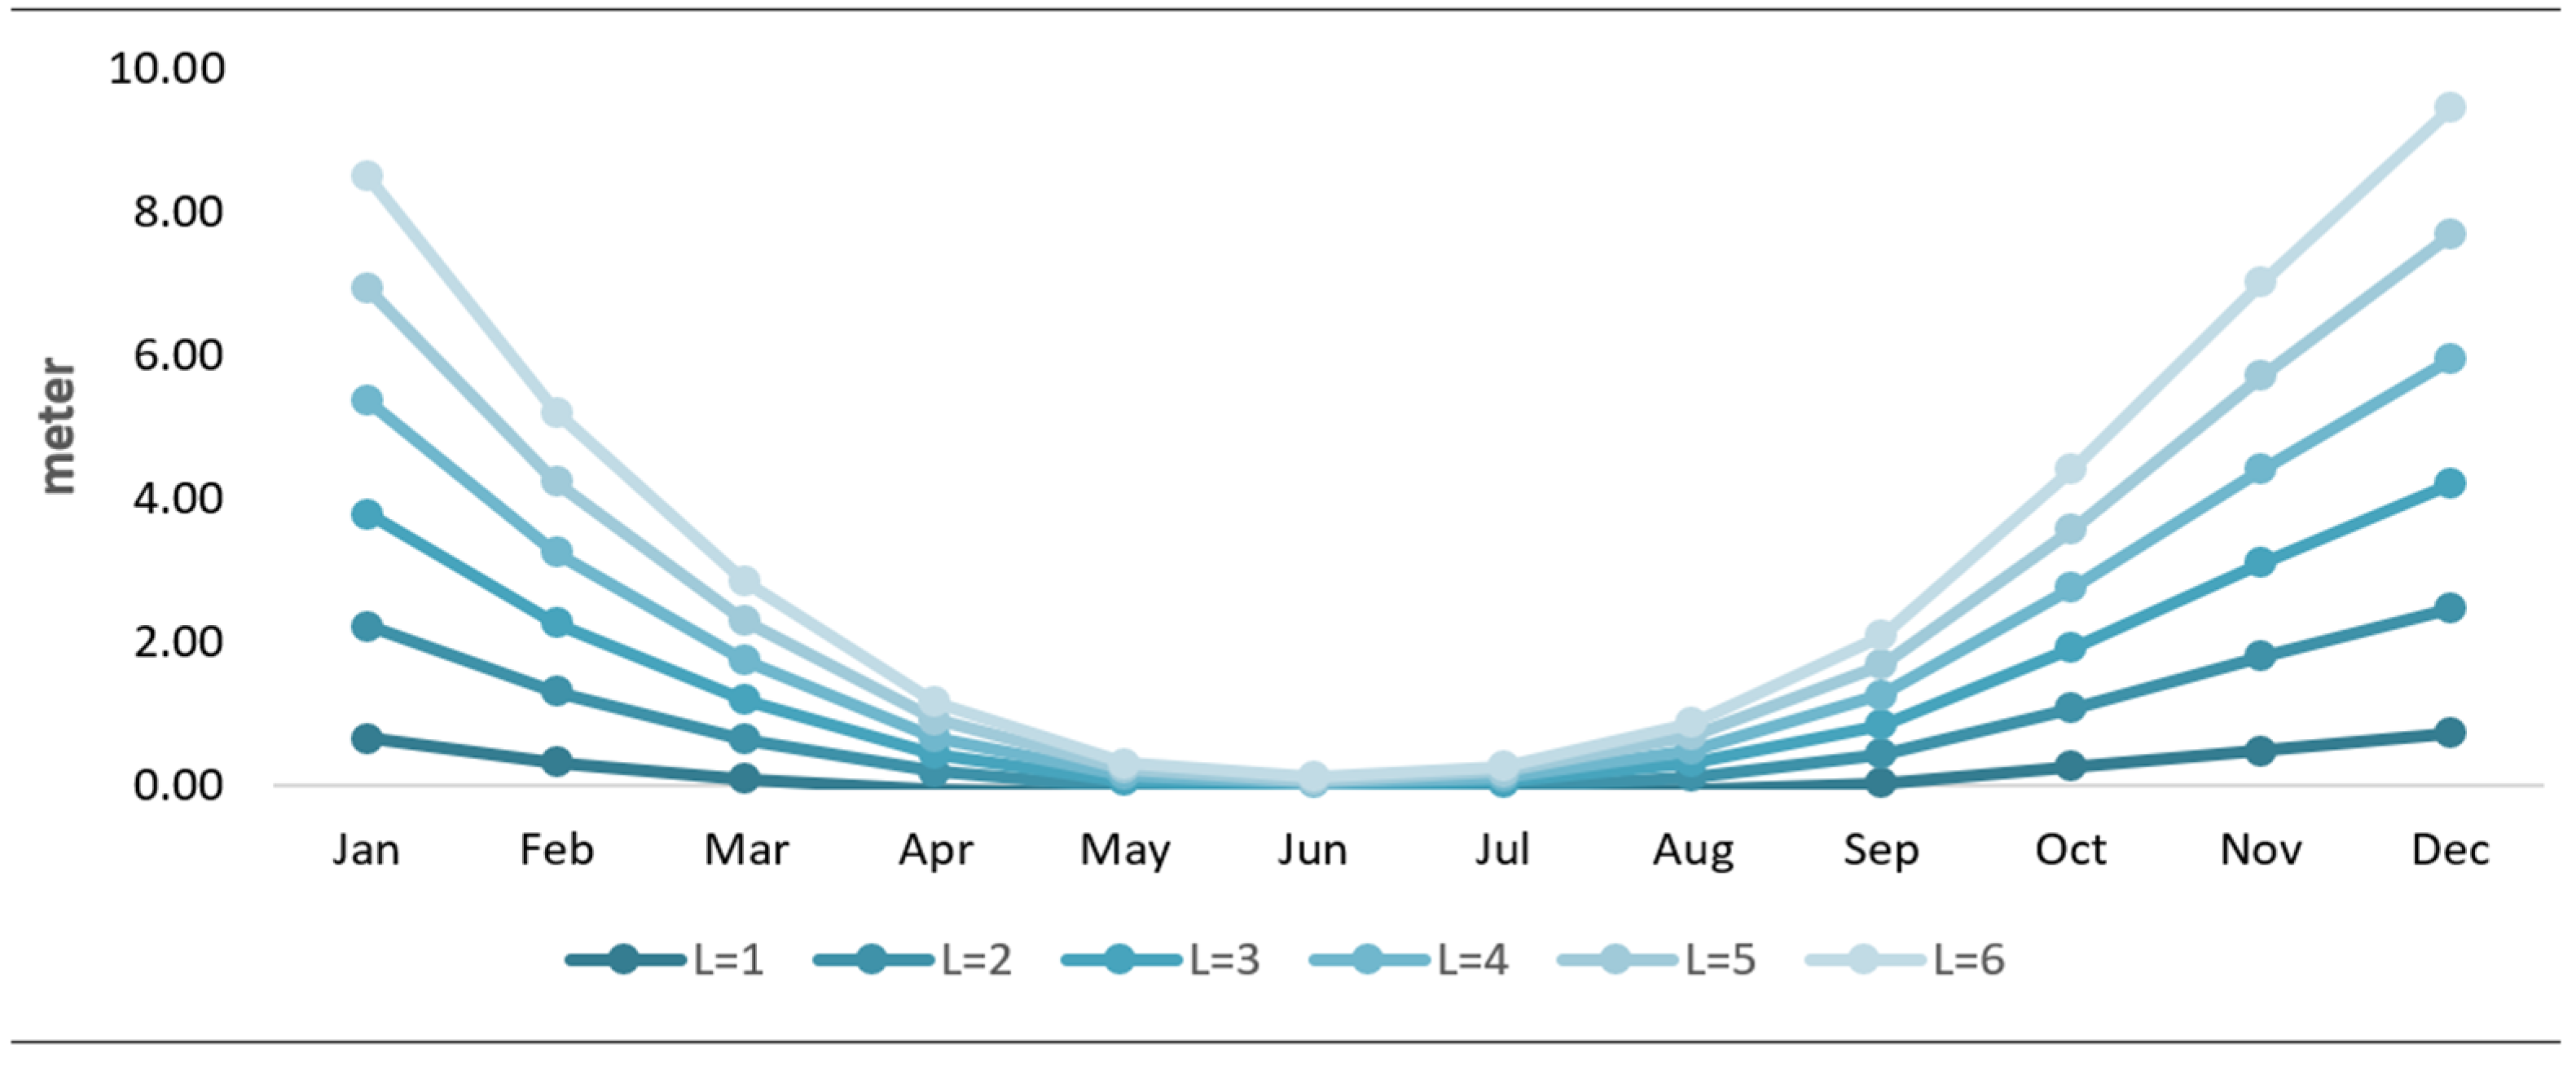
2.2.3. Shadow Effect and Panel Optimization
2.3. Optimization Process and Constraints
- The objective function is to maximize total energy output E(Array), considering the tilt angle, number of modules, and spacing.
- The decision variables are as follows:
- ○
- Tilt angle (θ): Monthly values to optimize energy capture.
- ○
- Number of rows (): Based on site length, row spacing, and module height.
- ○
- Number of modules per row (): Limited by site width.
- ○
- Spacing between sheds (d): To minimize shading losses.
- Constraints:
2.4. Microgrid Flexibility
2.4.1. Demand-Side Management
2.4.2. Energy Storage Systems and Degradation
- BSC is the battery storage capacity (Wh).
- represents the Daily Energy Usage (Wh).
- is the Number of Autonomy Days.
- DoD is the Depth of Discharge.
- is the system efficiency.
- ○
- Temperature (T), where higher temperatures accelerate degradation.
- ○
- Calendar aging (t), meaning the natural aging of the battery over time.
- ○
- Self-discharge losses, imposing gradual energy loss when idle.
- ○
- DOD, where a higher DOD increases wear.
- ○
- Number of cycles (N), with more cycles leading to faster degradation.
- ○
- Charge/discharge rate (C-rate), with faster charging/discharging affecting longevity.
- ○
- Battery chemistry, where different chemistries degrade at different rates.
2.5. Integration of Renewable Energy Sources
2.6. Sustainable Development and TOPSIS
- Define the estimation matrix;
- Normalize the decision matrix;
- III.
- Estimate the normalized weighted decision matrix;
- IV.
- Identify the best and worst alternatives;
- V.
- Calculate the distance measures;
- IV.
- Determine the closeness of each alternative to the ideal solution;
- V.
- Calculate a performance score and rank the alternatives.
3. Methods and Materials
3.1. DEEC Building Characteristics
3.2. Data Collection and Analysis
3.2.1. Electricity Demand
3.2.2. Photovoltaic Generation
3.2.3. Existing Microgrid
3.2.4. Energy Storage
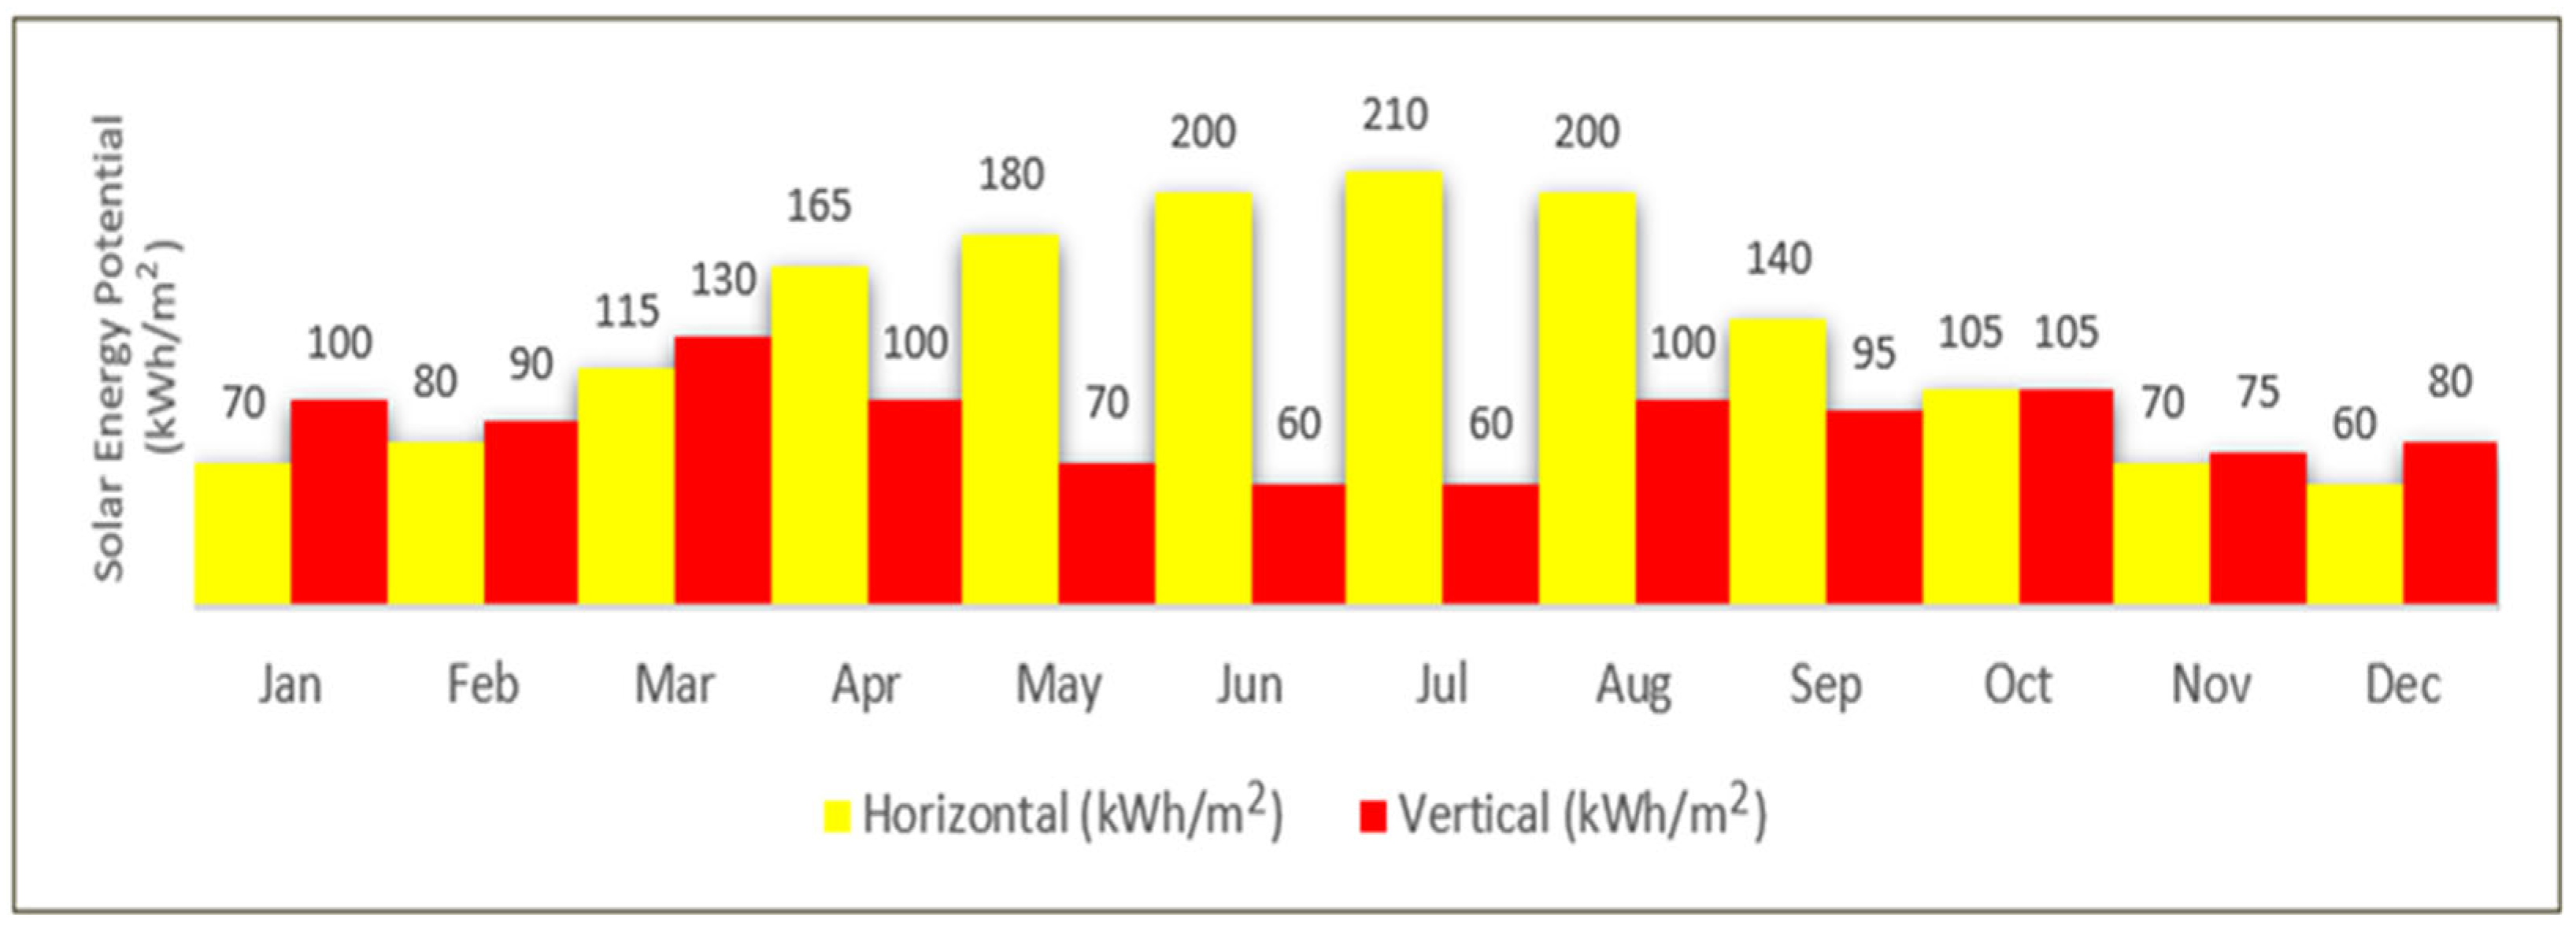
3.3. Solar Radiation Modeling
3.4. Effective Financing and Costs
3.5. MCDM for Criteria Weights for TOPSIS Based on SDPs
4. Results of the Analysis
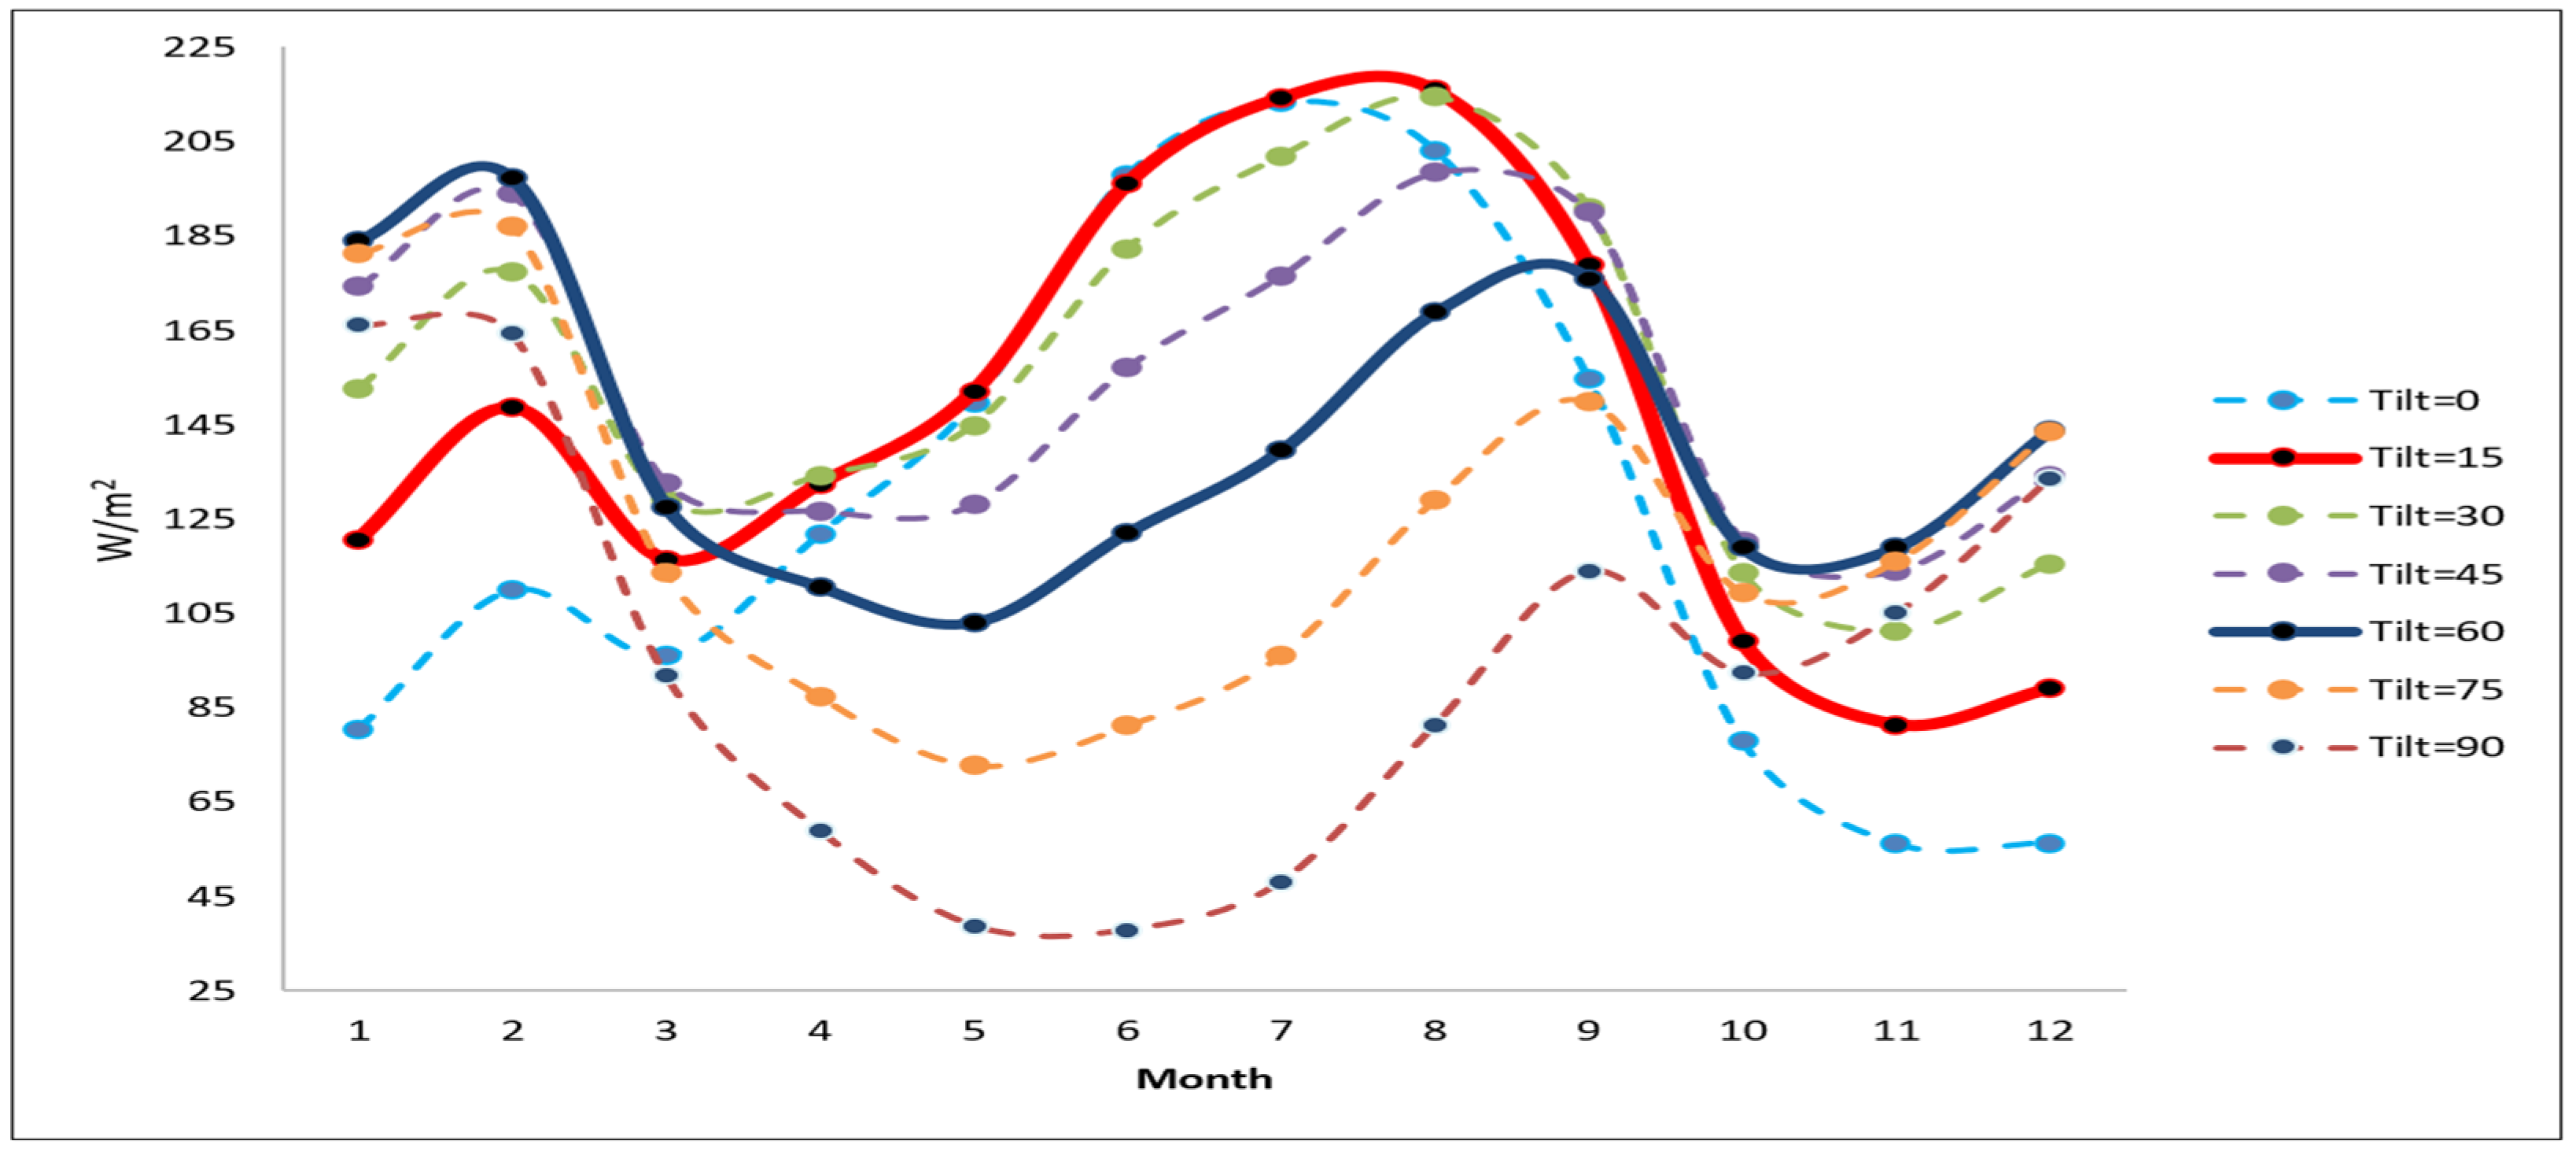
4.1. Results of PV Tilt and Row Spacing Optimization
- Tilt = 60°:
- ○
- The highest irradiance values occur during the winter months (January and February), with 184 W/m2 and 197 W/m2, respectively.
- ○
- The irradiance values decrease significantly during the summer months (June: 122 W/m2; July: 140 W/m2), making it clear that tilt = 60° favors winter energy collection over summer efficiency.
- ○
- This trend confirms its suitability for applications like green parking PVs, where winter irradiance optimization is critical.
- Tilt = 15°:
- ○
- Irradiance values are balanced across the year, with consistent performance from winter (January: 121 W/m2) to summer (June: 196 W/m2; July: 214 W/m2).
- ○
- The data supports its use in rooftop PV systems, as tilt = 15° minimizes seasonal variations, creating a balanced output between summer and winter months.
- Winter Optimization: Tilt = 60° is better suited for winter, ensuring higher energy capture during lower solar angles.
- Year-Round Balance: Tilt = 15° provides a steadier performance across seasons, balancing energy output effectively between winter and summer.
- Winter Curve Alignment: Tilt = 59° optimizes winter irradiance, supporting high-energy needs during colder months.
- Summer Curve Balance: Tilt = 13.5° ensures a balanced energy output, preventing oversaturation in summer while maintaining adequate winter performance.
4.2. Results of MCDM
- Economic trade-offs: While larger battery capacities increase grid independence and sustainability, they lead to higher installation costs, lower NPV, extended payback periods, and increased LCOE.
- Technical improvements: Greater storage enhances autonomy, ensuring longer full discharge durations and reducing dependency on grid-sourced electricity.
- Environmental benefits: Higher storage reduces grid consumption, supporting energy sustainability and improving system efficiency.
- Final sustainability ranking: Larger battery systems score higher on sustainability metrics, but their feasibility depends on economic constraints.
4.3. Results of Energy Storage on Power Dispatching
- Minimal impact on direct solar consumption: Storage does not significantly influence immediate solar energy usage.
- Higher battery utilization: Larger storage capacities allow for more energy retrieval from batteries instead of direct consumption.
- Reduced grid dependence: Expanding storage minimizes the need for external power sources.
- Lower grid injection: More energy is retained locally rather than exported.
- Enhanced backup capability: Larger batteries provide prolonged energy availability during periods without generation.
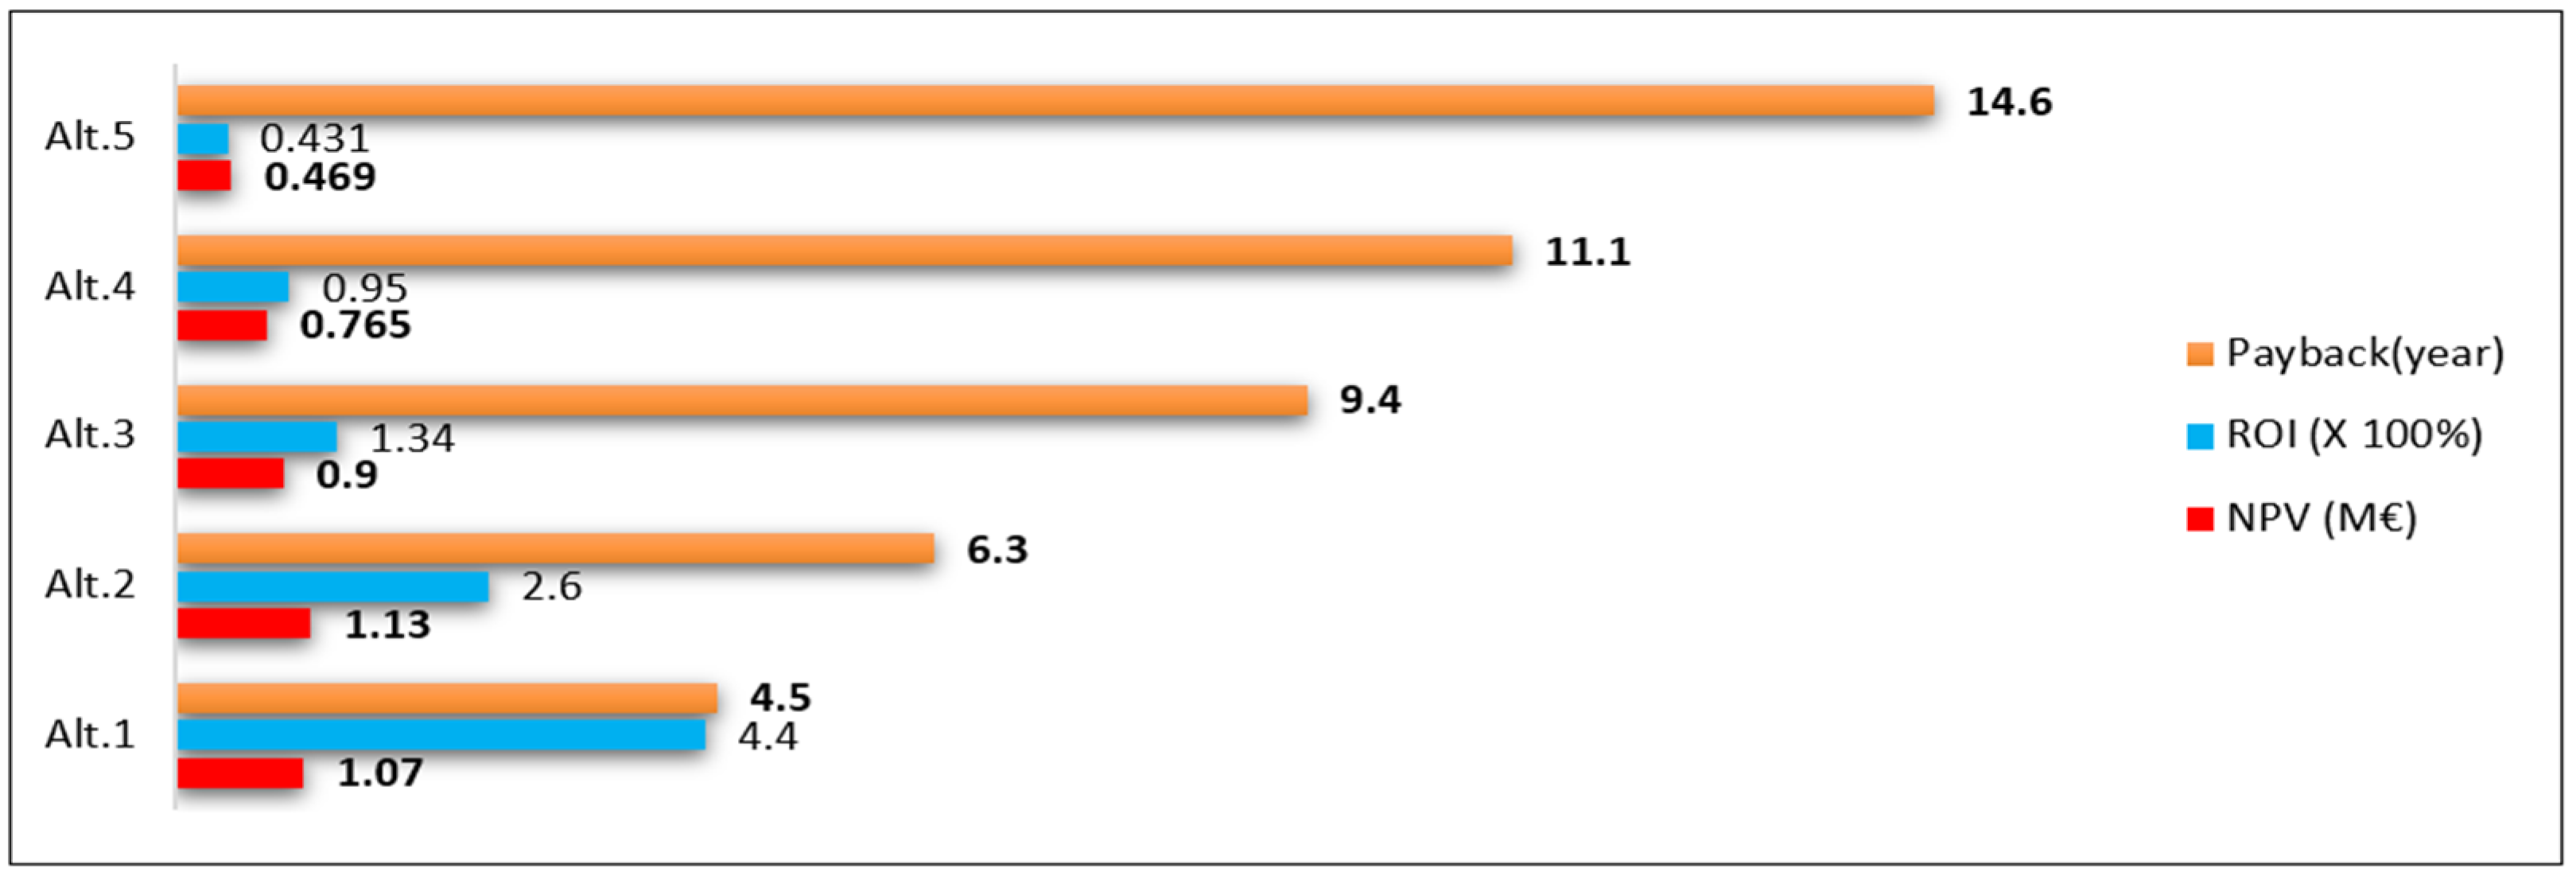
4.4. Results of Financial Assessment
- Shorter payback for no storage: Investment rapidly recovers in just 4.5 years.
- Declining profitability with larger storage: Higher battery capacities result in lower NPV and extended payback periods.
- Reduced ROI with increased capacity: Larger batteries diminish return percentages, impacting financial viability.
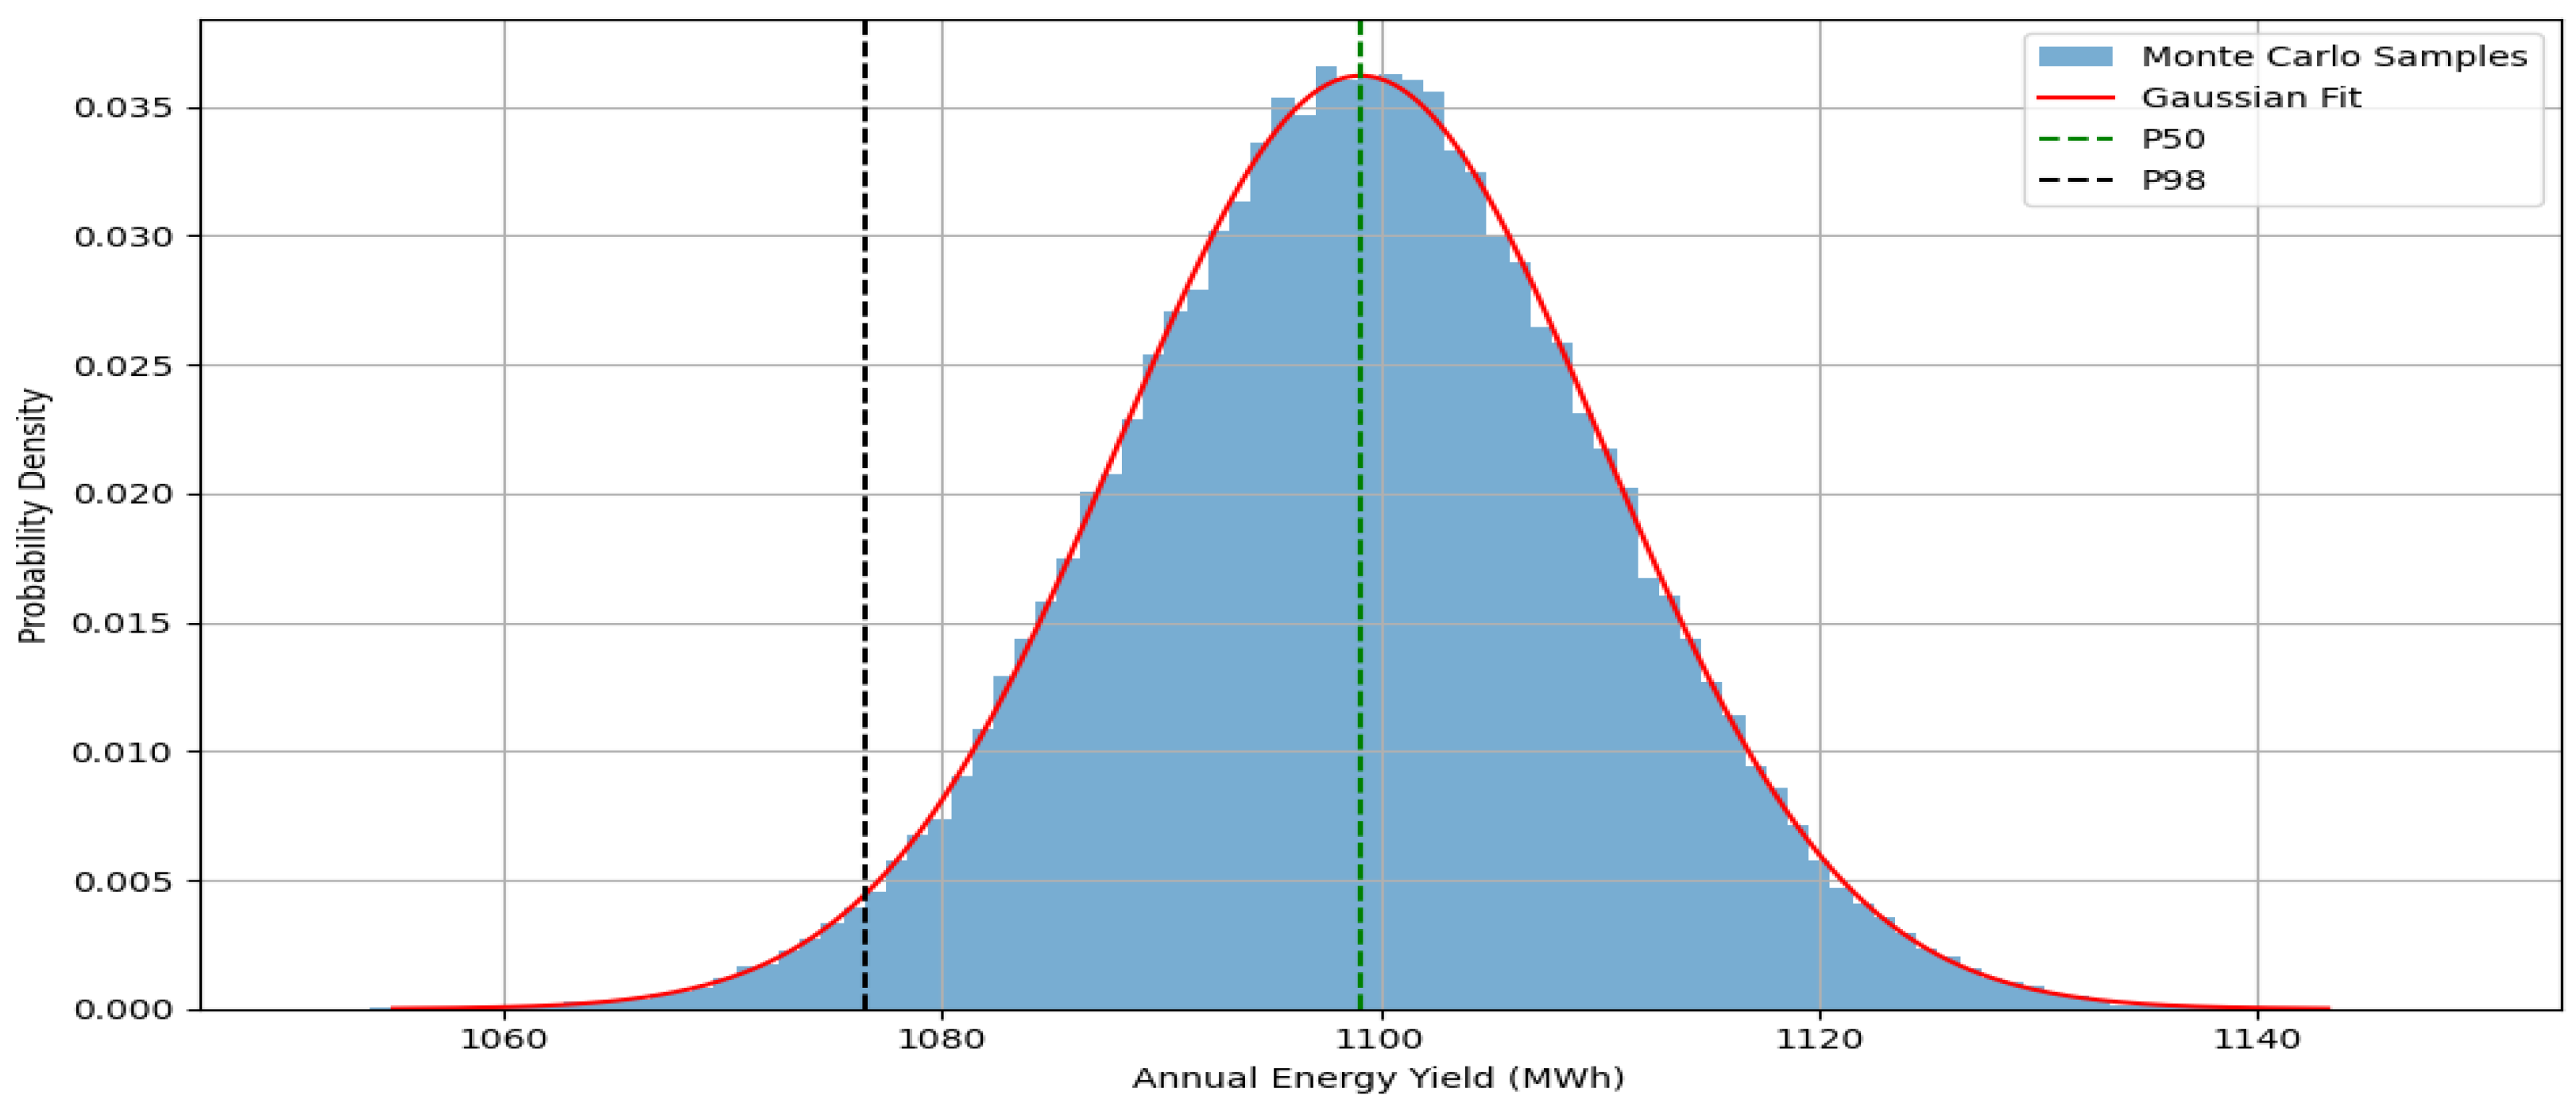
4.5. Results of Probability-Based Production Analysis
- P50 Value (Most Probable Yield): approximately 1137 MWh, representing the median expected production, meaning there is a 50% probability that the actual yield exceeds this value.
- P98 Value (Highly Conservative Estimate): approximately 1089 MWh, ensuring only a 2% probability of experiencing lower yields than this threshold.
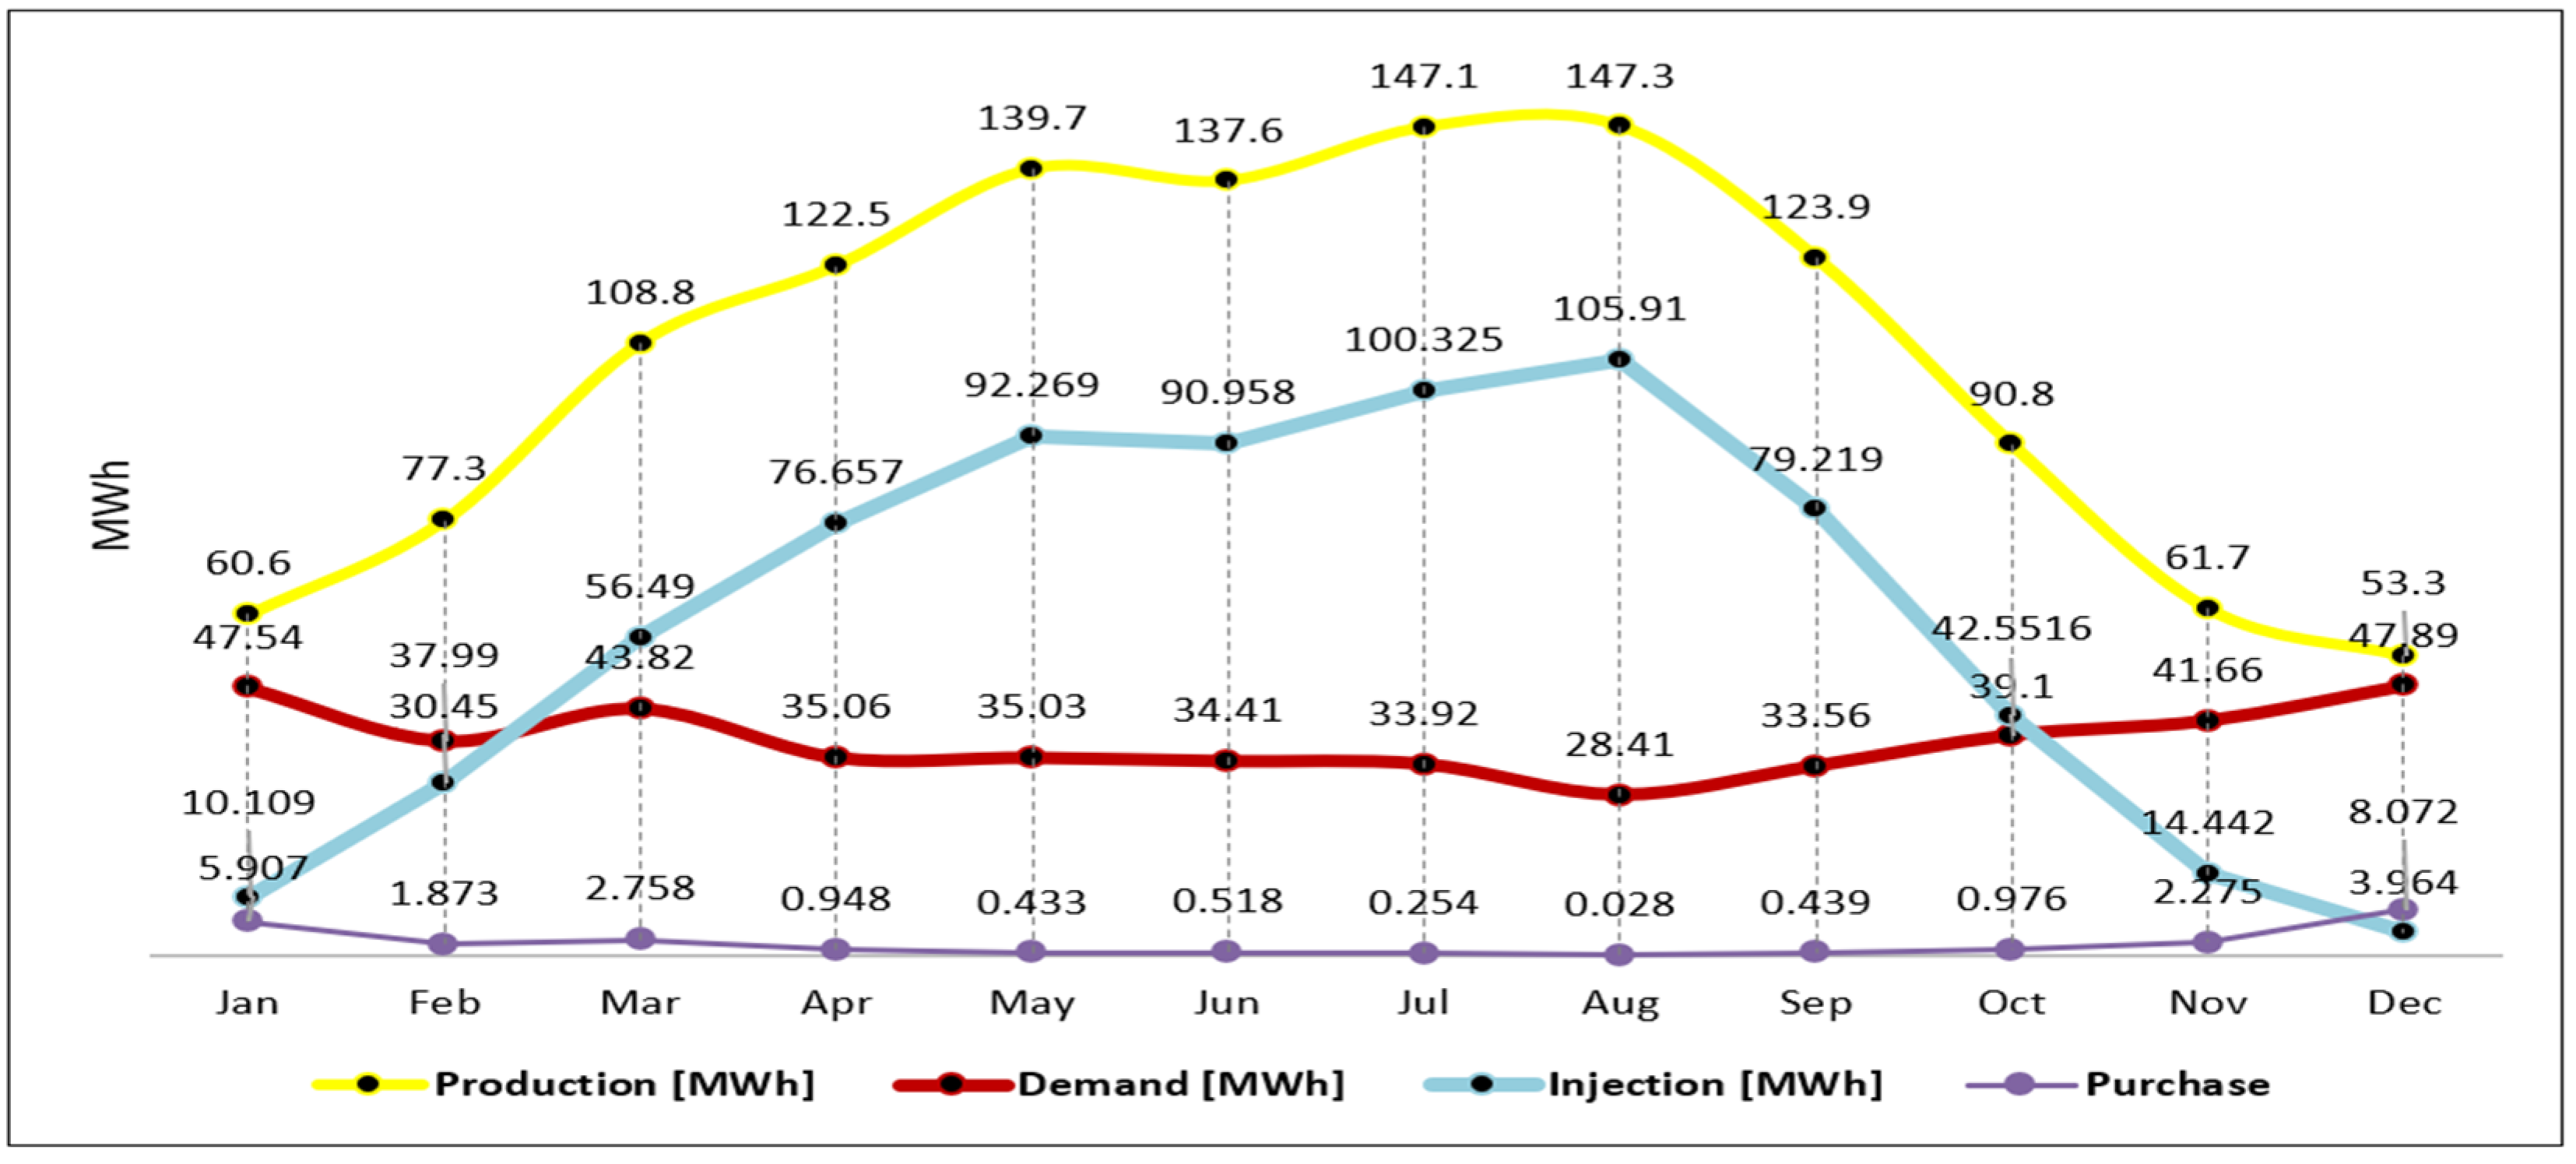
4.6. Results of Monthly Supply–Demand and Injection Curve
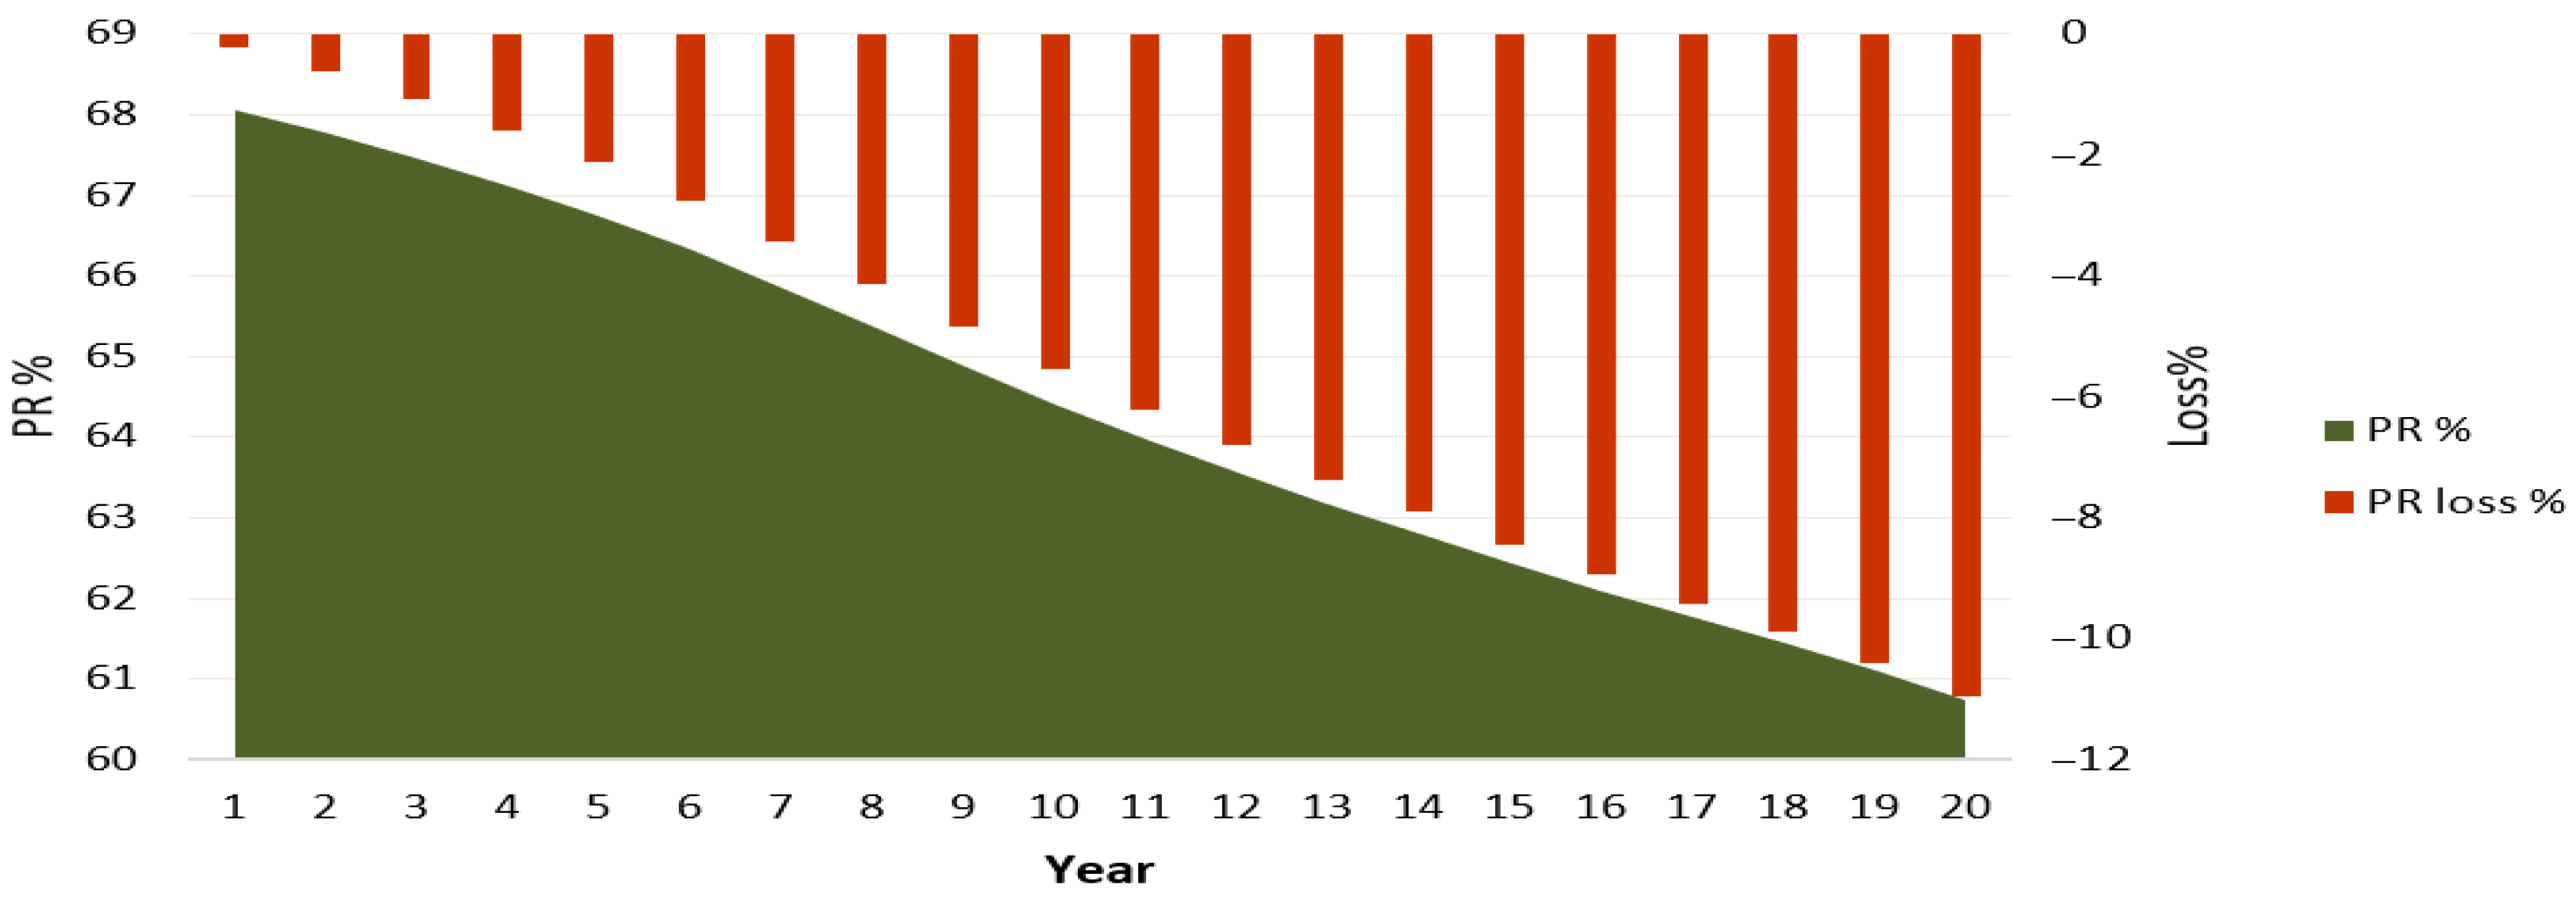
4.6.1. Results of PR and Loss Analysis
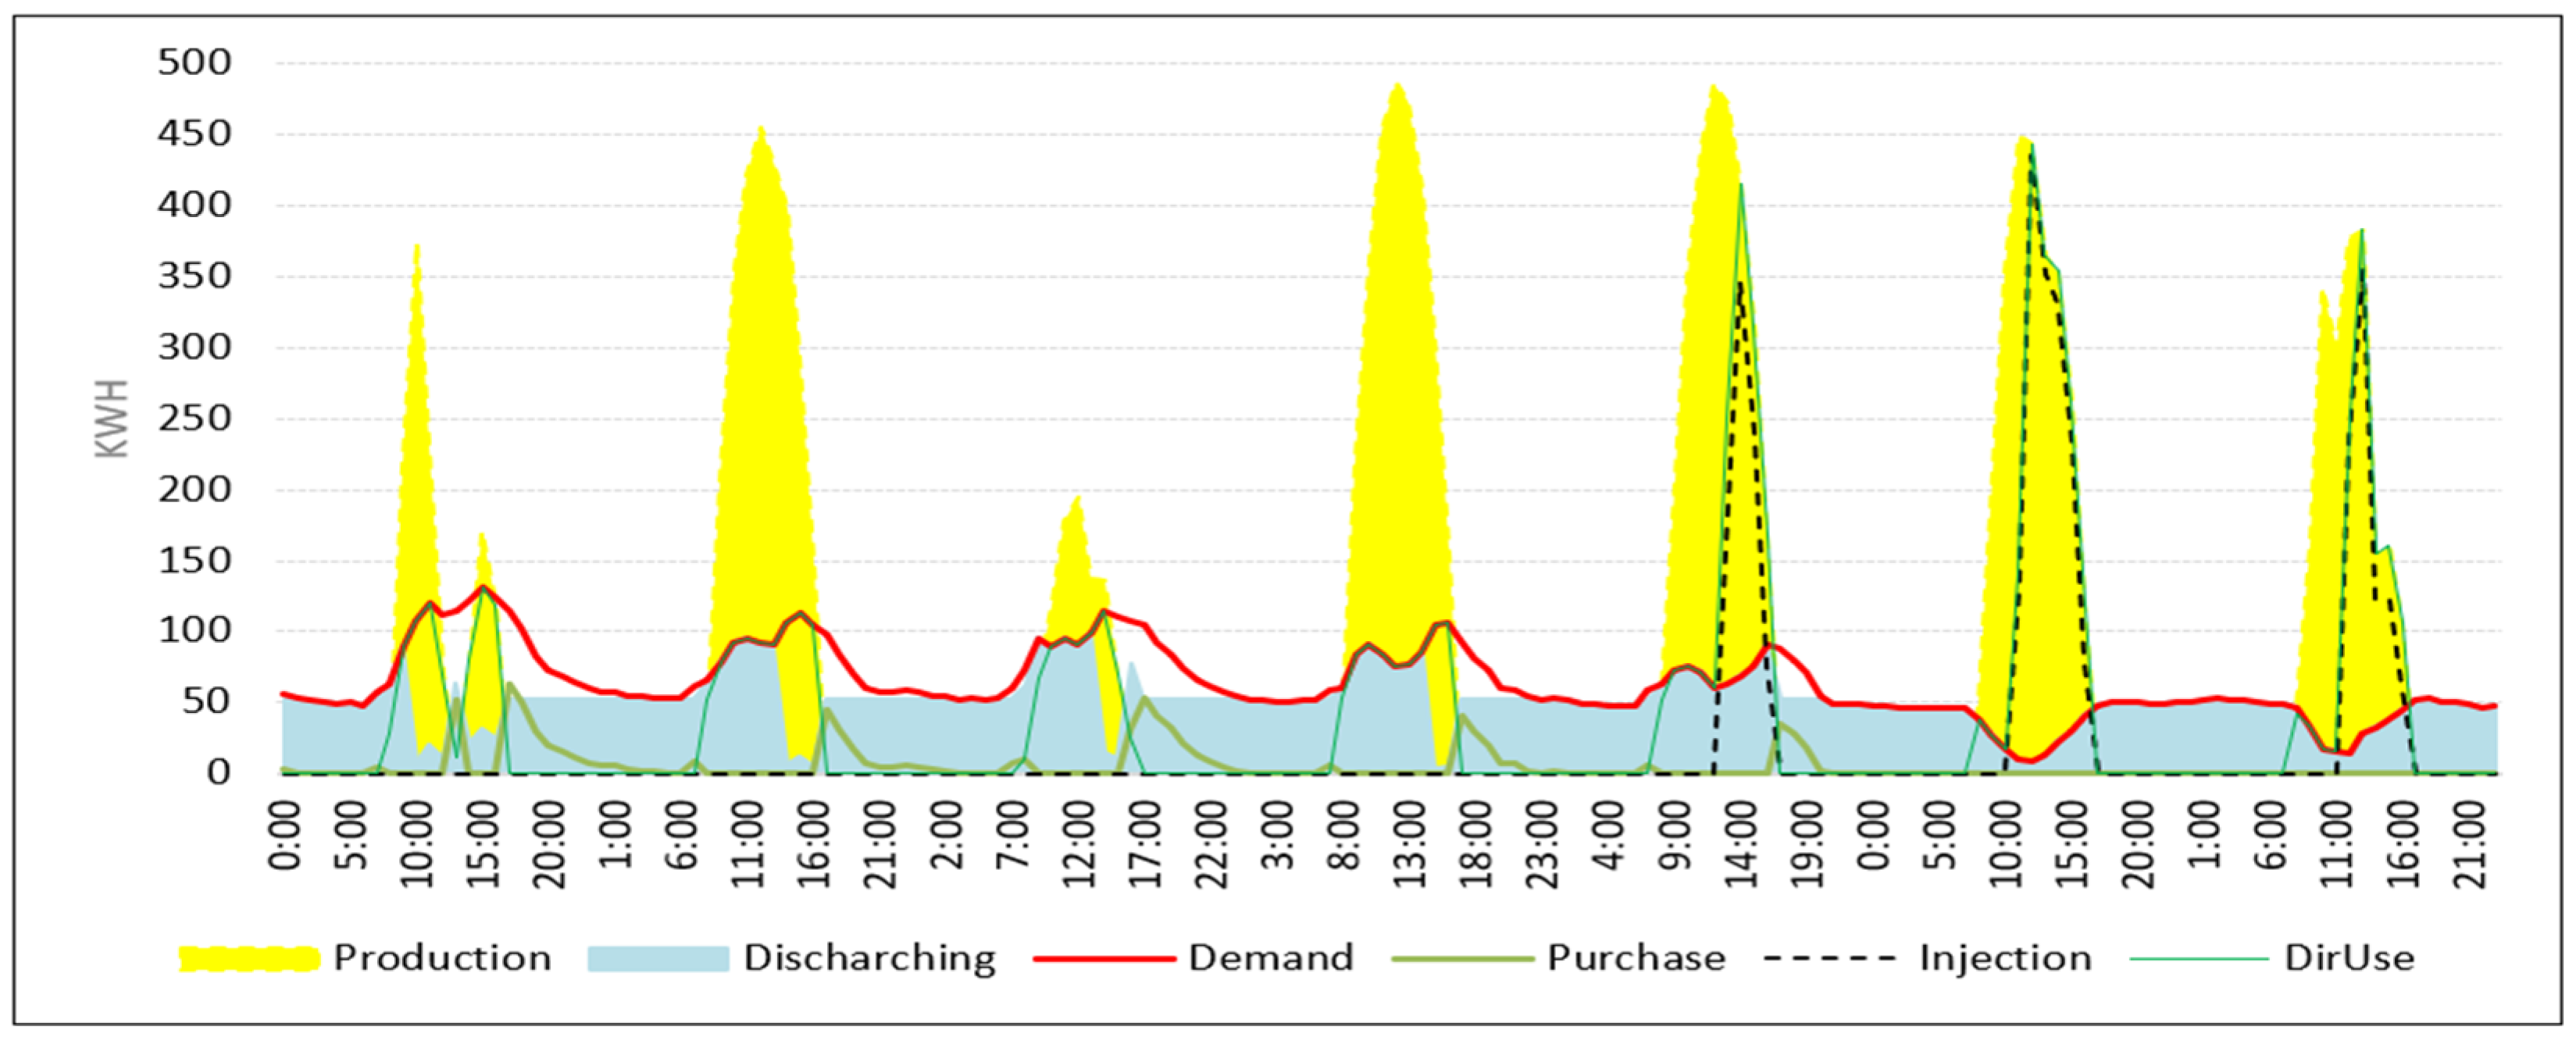
4.6.2. Winter Demanding Week
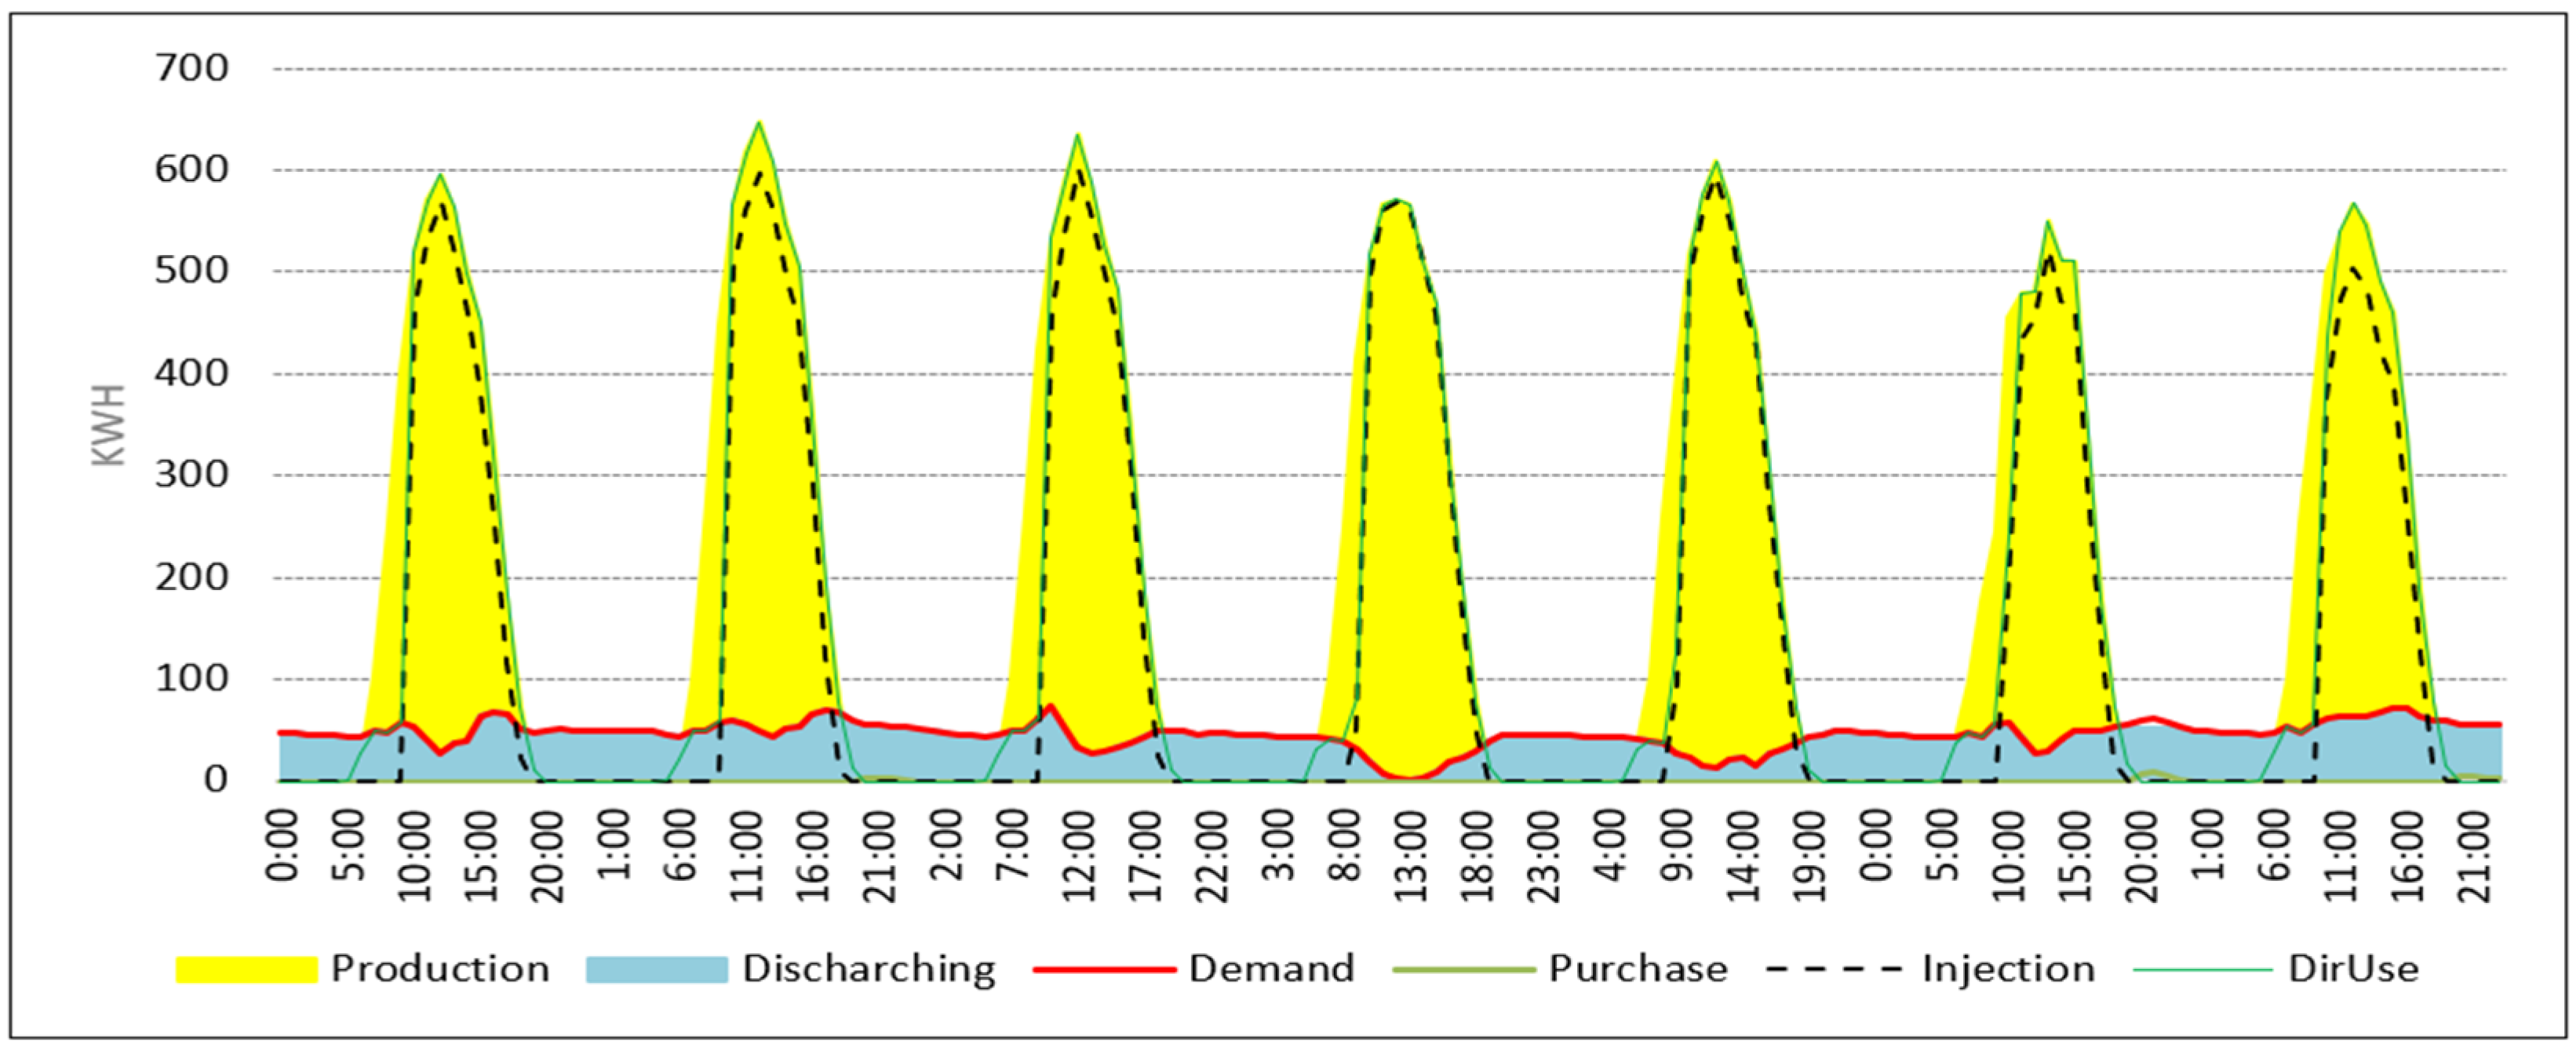
4.6.3. Summer Demanding Week
5. Discussions of the Results
5.1. Energy Production and Dispatching Efficiency
5.2. Impact of Battery Storage on System Performance
5.3. Economic Trade-Offs in System Optimization
5.4. System Adaptations for Improved Performance
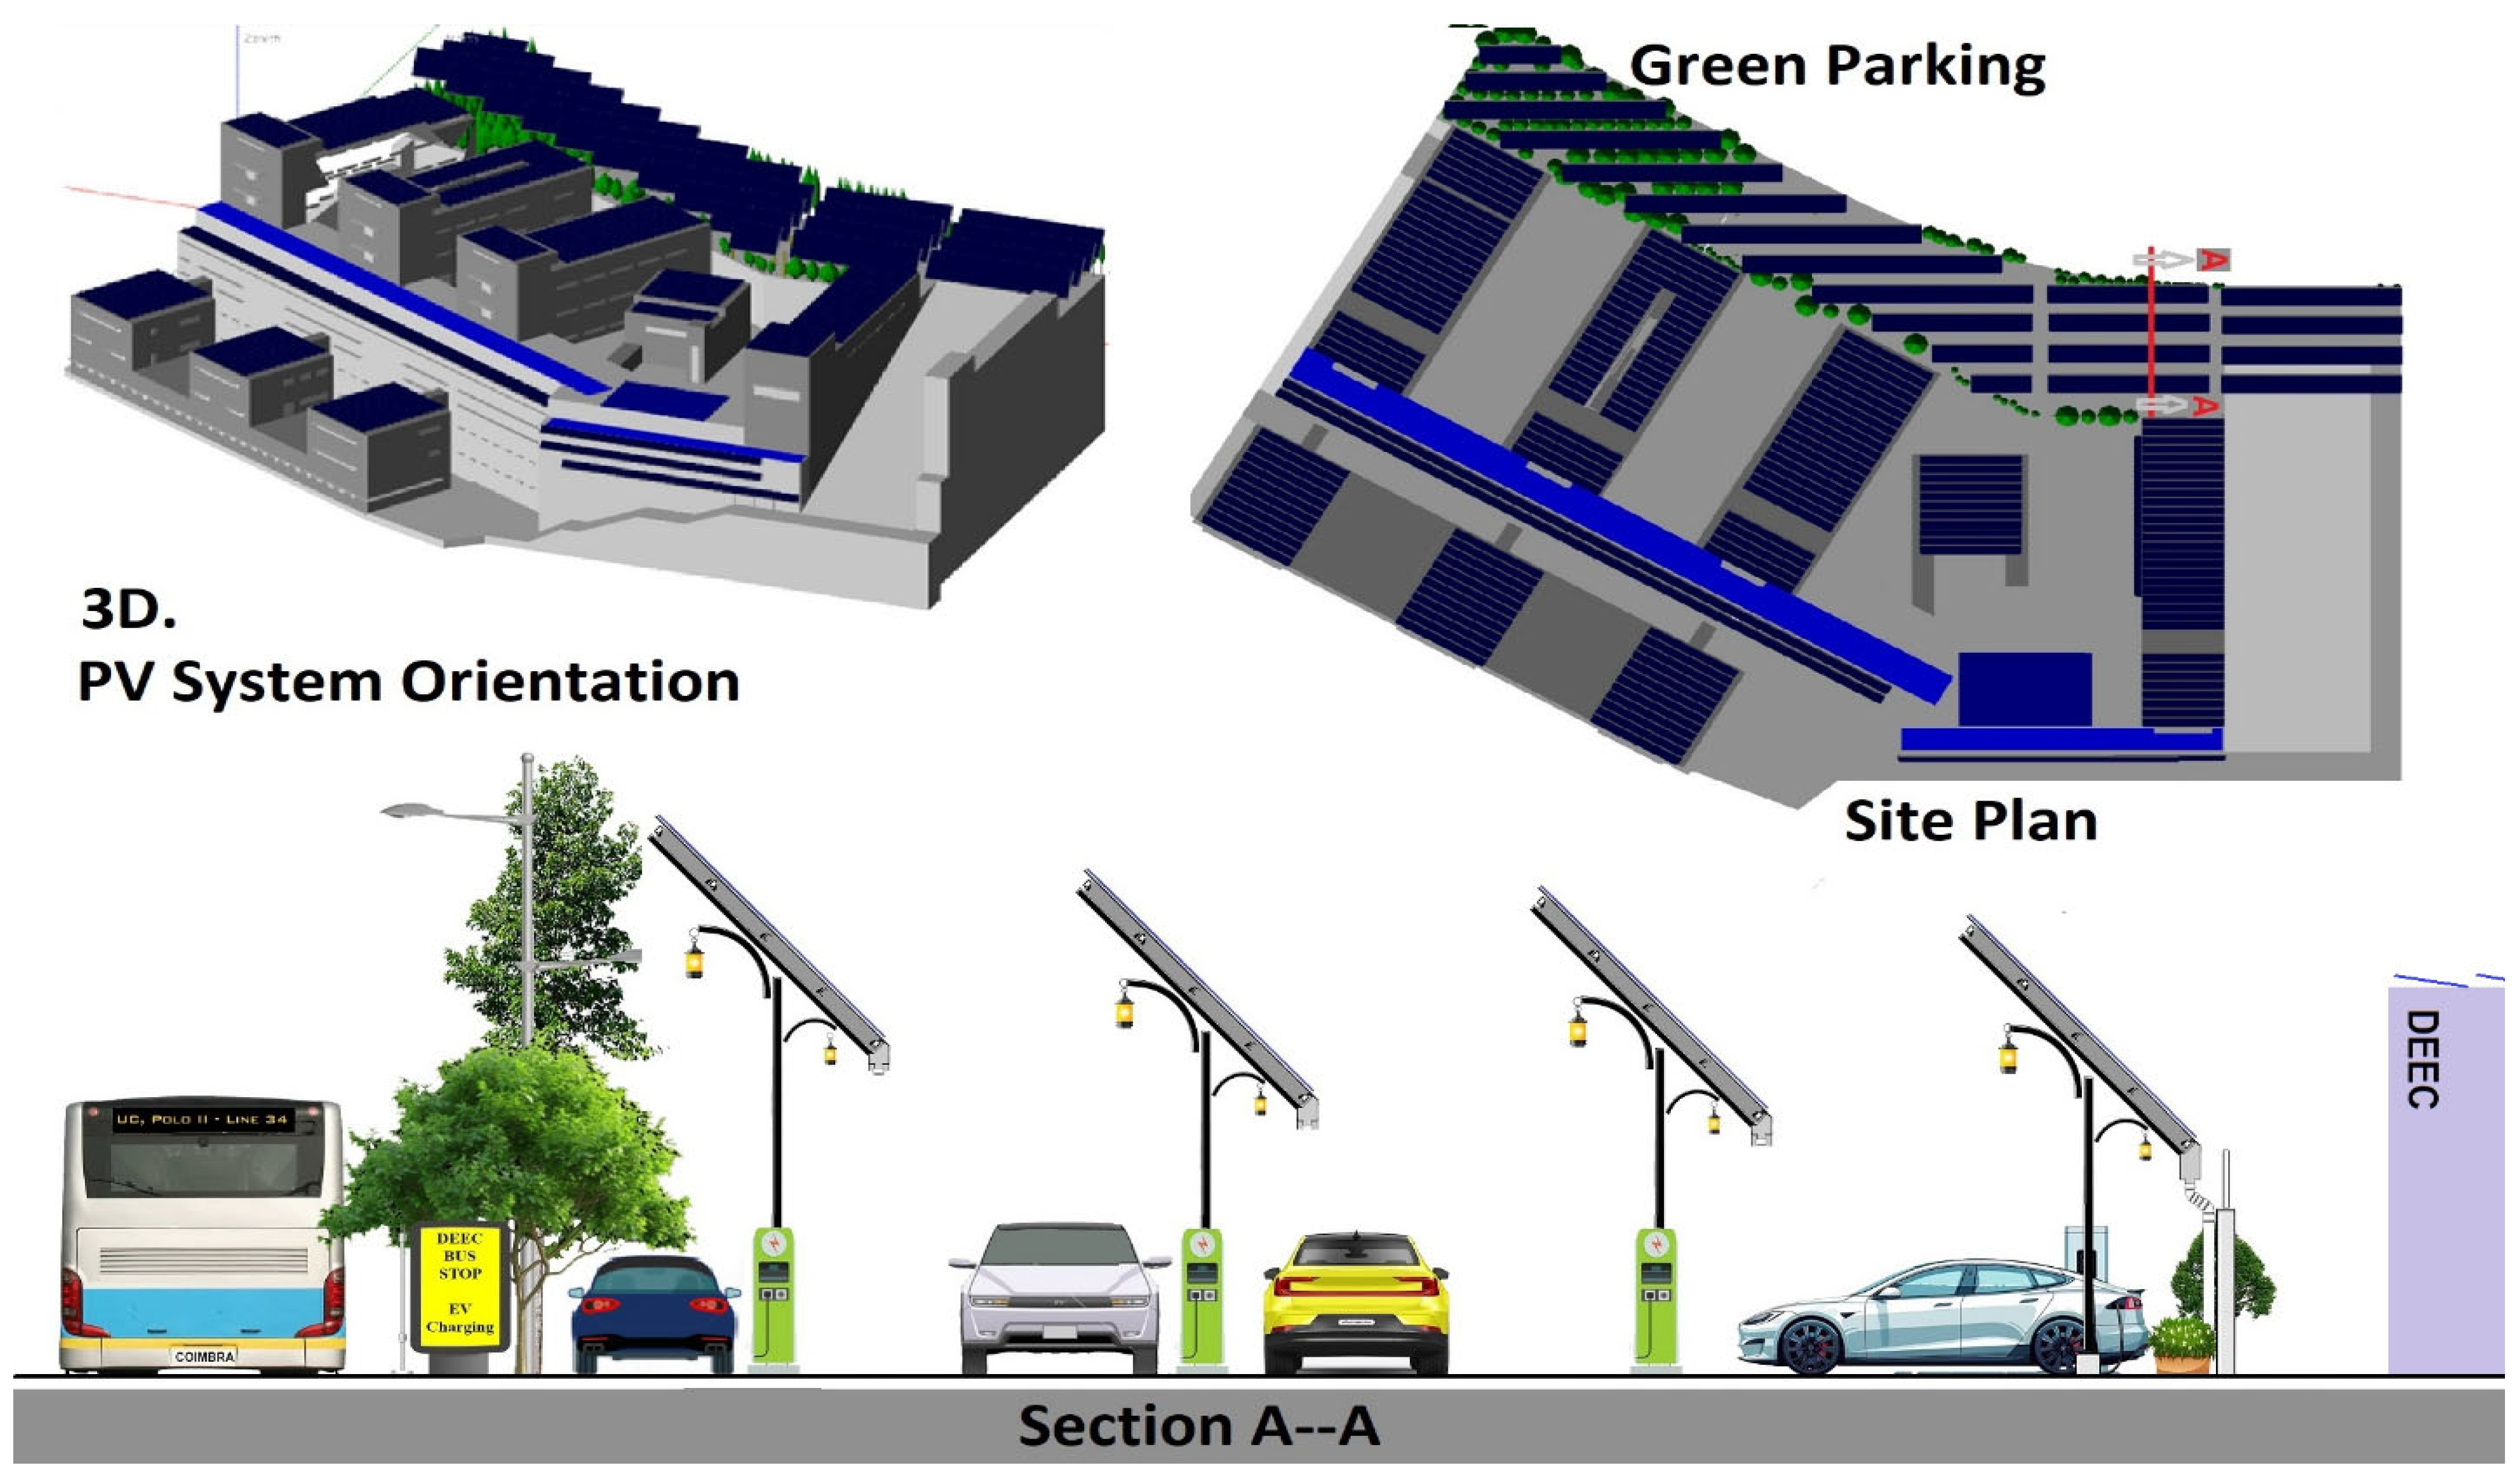
- ○
- Panel configurations in the northern department section were optimized with 4.2 m panel lengths, ensuring spatial efficiency.
- ○
- Roof-mounted panels in the southern department followed a 13° tilt, balancing energy capture with visual aesthetics.
- ○
- Row spacing was reduced to increase power density, while rear panel rows were elevated by 0.5 m to reduce shading losses.
6. Conclusions
6.1. Contributions and Future Directions
6.2. Future Research
- Dynamic energy dispatch models can be integrated into real-time consumption forecasts based on weather and activity schedules for further optimization.
- Hybrid storage solutions, such as thermal storage, can be used to take advantage of the building’s thermal mass to optimize HVAC operation and to reduce dependence on high-cost battery investments.
- As the V2G technology becomes commercially available, progressive integration of this technology may be used to ensure reliable supply even during extreme weather events.
- Smart grid interaction strategies, including demand–response techniques and feed-in algorithms for HVAC load management, can be used to maximize surplus energy utilization.
- The DEEC microgrid can be integrated into an energy community with other university buildings.
Author Contributions
Funding
Data Availability Statement
Acknowledgments
Conflicts of Interest
References
- Arzani, A.; Boshoff, S.; Arunagirinathan, P.; Maigha; Enslin, J.H.R. System Design, Economic Analysis and Operation Strategy of a Campus Microgrid. In Proceedings of the 2018 9th IEEE International Symposium on Power Electronics for Distributed Generation Systems (PEDG), Charlotte, NC, USA, 25–28 June 2018; pp. 1–7. [Google Scholar]
- Hadjidemetriou, L.; Zacharia, L.; Kyriakides, E.; Azzopardi, B.; Azzopardi, S.; Mikalauskiene, R.; Al-Agtash, S.; Al-Hashem, M.; Tsolakis, A.; Ioannidis, D.; et al. Design factors for developing a university campus microgrid. In Proceedings of the 2018 IEEE International Energy Conference (ENERGYCON), Limassol, Cyprus, 3–7 June 2018; pp. 1–6. [Google Scholar] [CrossRef]
- Dagdougui, H.; Dessaint, L.-A.; Gagnon, G.; Al-haddad, K. Modeling; optimal operation of a university campus microgrid. In Proceedings of the 2016 IEEE Power and Energy Society General Meeting (PESGM), Boston, MA, USA, 17–21 July 2016; pp. 1–5. [Google Scholar]
- Savic, N.; Katić, V.A.; Katic, N.; Dumnic, B.P.; Milićević, D.; Čorba, Z. Techno-economic and environmental analysis of a microgrid concept in the university campus. In Proceedings of the 2018 International Symposium on Industrial Electronics (INDEL), Banja Luka, Bosnia and Herzegovina, 1–3 November 2018; pp. 1–6. [Google Scholar]
- Antoniadou-Plytaria, K.E.; Srivastava, A.; Ghazvini, M.A.F.; Steen, D.; Tuan, L.A.; Carlson, O. Chalmers Campus as a Testbed for Intelligent Grids and Local Energy Systems. In Proceedings of the 2019 International Conference on Smart Energy Systems and Technologies (SEST), Porto, Portugal, 9–11 September 2019; pp. 1–6. [Google Scholar]
- Lghoul, R.; Abid, M.R.; Khallaayoun, A.; Bourhnane, S.; Zine-Dine, K.; Elkamoun, N. Towards a Real-World University Campus Micro-Grid. In Proceedings of the 2018 International Conference on Smart Energy Systems and Technologies (SEST), Seville, Spain, 10–12 September 2018; pp. 1–6. [Google Scholar]
- González, R.M.; Goch, T.A.J.V.; Aslam, M.F.; Blanch, A.; Ribeiro, P.F. Microgrid design considerations for a smart-energy university campus. In Proceedings of the IEEE PES Innovative Smart Grid Technologies, Istanbul, Turkey, 12–15 October 2014; pp. 1–6. [Google Scholar] [CrossRef]
- Akindeji, K.T.; Tiako, R.; Davidson, I.E. Use of Renewable Energy Sources in University Campus Microgrid—A Review. In Proceedings of the 2019 International Conference on the Domestic Use of Energy (DUE), Wellington, South Africa, 25–27 March 2019; pp. 76–83. [Google Scholar]
- Castro, J.F.C.; Roncolatto, R.A.; Donadon, A.R.; Andrade, V.E.M.S.; Rosas, P.; Bento, R.G.; Matos, J.G.; Assis, F.A.; Coelho, F.C.R.; Quadros, R.; et al. Microgrid Applications and Technical Challenges—The Brazilian Status of Connection Standards and Operational Procedures. Energies 2023, 16, 2893. [Google Scholar] [CrossRef]
- Alhawsawi, E.Y.; Salhein, K.; Zohdy, M.A. A Comprehensive Review of Existing and Pending University Campus Microgrids. Energies 2024, 17, 2425. [Google Scholar] [CrossRef]
- Garcia, Y.V.; Garzon, O.; Andrade, F.; Irizarry, A.; Rodriguez-Martinez, O.F. Methodology to Implement a Microgrid in a University Campus. Appl. Sci. 2022, 12, 4563. [Google Scholar] [CrossRef]
- Pilay, N.S. System Dynamics Simulation of Income Distribution and Electric Vehicle Diffusion for Electricity Planning in South Africa. Ph.D. Thesis, Stellenbosch University, Stellenbosch, South Africa, 2018. [Google Scholar]
- Correia, A.F.M.; Cavaleiro, M.; Neves, M.; Coimbra, A.P.; Almeida, T.R.O.; Moura, P.; de Almeida, A.T. Architecture and Operational Control for Resilient Microgrids. In Proceedings of the 2024 IEEE/IAS 60th Industrial and Commercial Power Systems Technical Conference (I&CPS), Las Vegas, NV, USA, 19–23 May 2024; pp. 1–12. [Google Scholar] [CrossRef]
- Gómez-Ruiz, G.; Sánchez-Herrera, R.; Clavijo-Camacho, J.; Cano, J.M.; Ruiz-Rodríguez, F.J.; Andújar, J.M. A Versatile Platform for PV System Integration into Microgrids. Electronics 2024, 13, 3995. [Google Scholar] [CrossRef]
- Wenjie, Z. Forecasting and Management in Smart Grid with Artificial Intelligence. Ph.D. Thesis, National University of Singapore, Kent Ridge, Singapore, 2020. [Google Scholar]
- Yang, L.; Xie, P.; Zhang, R.; Cheng, Y.; Cai, B.; Wang, R. HIES: Cases for hydrogen energy and I-Energy. Int. J. Hydrogen Energy 2019, 44, 29785–29804. [Google Scholar] [CrossRef]
- Peric, V.S.; Hamacher, T.; Mohapatra, A.; Christiange, F.; Zinsmeister, D.; Tzscheutschler, P.; Wagner, U.; Aigner, C.; Witzmann, R. CoSES Laboratory for Combined Energy Systems at TU Munich. In Proceedings of the 2020 IEEE Power & Energy Society General Meeting (PESGM), Montreal, QC, Canada, 2–6 August 2020. [Google Scholar]
- Husein, M.; Chung, I.-Y. Optimal design and financial feasibility of a university campus microgrid considering renewable energy incentives. Appl. Energy 2018, 225, 273–289. [Google Scholar] [CrossRef]
- Leskarac, D.; Moghimi, M.; Liu, J.; Water, W.; Lu, J.; Stegen, S. Hybrid AC/DC Microgrid testing facility for energy management in commercial buildings. Energy Build. 2018, 174, 563–578. [Google Scholar] [CrossRef]
- Elenkova, M.; Papadopoulos, T.A.; Psarra, A.; Chatzimichail, A. A simulation platform for smart microgrids in university campuses. In Proceedings of the 2017 52nd International Universities Power Engineering Conference (UPEC), Heraklion, Greece, 28–31 August 2017; pp. 1–6. [Google Scholar]
- Sreedharan, P.; Farbes, J.; Cutter, E.; Woo, C.K.; Wang, J. Microgrid and renewable generation integration: University of California, San Diego. Appl. Energy 2016, 169, 709–720. [Google Scholar] [CrossRef]
- Moura, P.; Correia, A.; Delgado, J.; Fonseca, P.; Almeida, A.D. University Campus Microgrid for Supporting Sustainable Energy Systems Operation. In Proceedings of the 2020 IEEE/IAS 56th Industrial and Commercial Power Systems Technical Conference (I&CPS), Las Vegas, NV, USA, 29 June-28 July 2020; pp. 1–7. [Google Scholar] [CrossRef]
- Najim, K.; Ikonen, E.; Daoud, A.-K. Chapter 2—Estimation of Probability Densities. In Stochastic Processes: Estimation, Optimization & Analysis; Kogan Page Science: Oxford, UK, 2004; pp. 93–166. [Google Scholar]
- Yao, W.; Yue, C.; Xu, A.; Kong, X.; Cao, W.; Zheng, Z.; Yue, Q. Power generation evaluation of solar photovoltaic systems using radiation frequency distribution. J. Build. Eng. 2024, 98, 110981. [Google Scholar] [CrossRef]
- PVsyst. Performance Ratio PR. Available online: https://www.pvsyst.com/help/project-design/results/performance-ratio-pr.html (accessed on 10 March 2025).
- Ouria, M.; Moura, P.; Ouria, A.; de Almeida, A.T. Multi-objective architectural parametric optimization toward decarbonizing building sector—Tabriz city case study. J. Build. Eng. 2025, 105, 112422. [Google Scholar] [CrossRef]
- Arévalo, P.; Ochoa-Correa, D.; Villa-Ávila, E. Optimizing Microgrid Operation: Integration of Emerging Technologies and Artificial Intelligence for Energy Efficiency. Electronics 2024, 13, 3754. [Google Scholar] [CrossRef]
- Arévalo, P.; Ochoa-Correa, D.; Villa-Ávila, E. Systematic Review of the Effective Integration of Storage Systems and Electric Vehicles in Microgrid Networks: Innovative Approaches for Energy Management. Vehicles 2024, 6, 2075–2105. [Google Scholar] [CrossRef]
- Wamalwa, F.; Ishimwe, A. Optimal energy management in a grid-tied solar PV-battery microgrid for a public building under demand response. Energy Rep. 2024, 12, 3718–3731. [Google Scholar] [CrossRef]
- Vardakas, J.S.; Zorba, N.; Verikoukis, C.V. A Survey on Demand Response Programs in Smart Grids: Pricing Methods and Optimization Algorithms. EEE Commun. Surv. Tutor. 2015, 17, 152–178. [Google Scholar] [CrossRef]
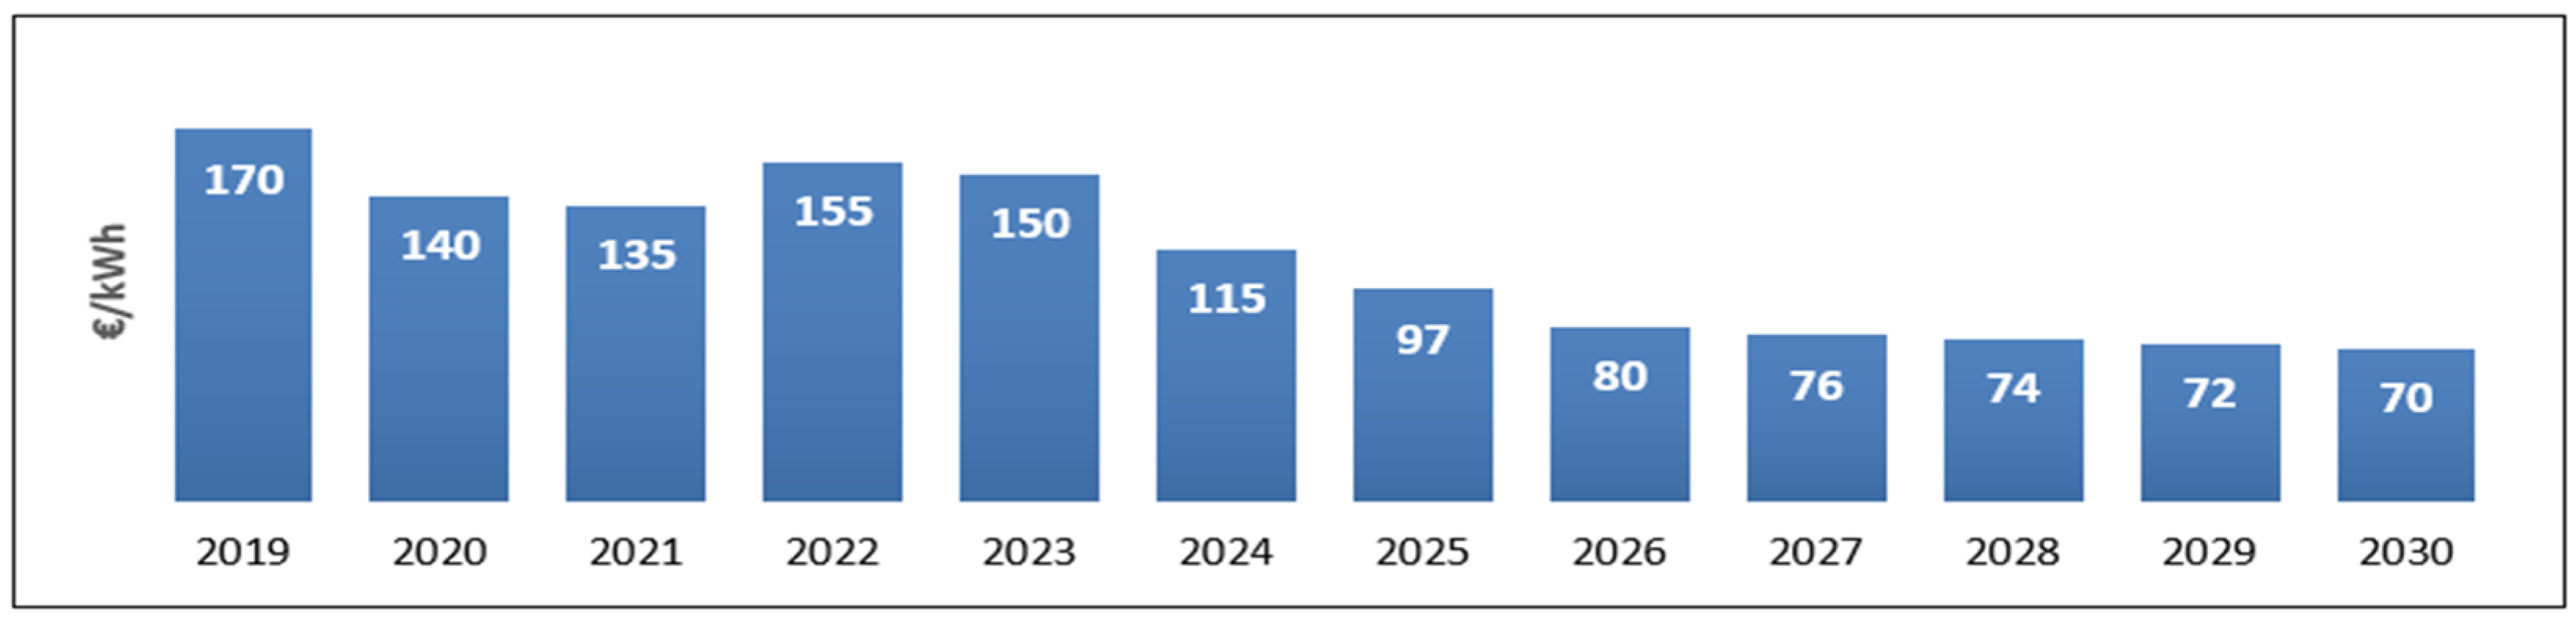
- Monolithai. Introduction to Solid-State Battery Technology. Available online: https://www.monolithai.com/blog/solid-state-batteries-energy-storage (accessed on 10 March 2025).
- Cao, M.; Liu, Y.; Zhang, T.; Wang, Y.; Wang, R.; Shi, Z. A flexible battery capacity estimation method based on partial voltage curves and polynomial fitting. Energy Build. 2023, 290, 113045. [Google Scholar] [CrossRef]
- PVsyst. Battery Efficiency and Losses. Available online: https://www.pvsyst.com/help/physical-models-used/batteries/battery-model/battery-efficiency.html (accessed on 10 March 2025).
- Enertec. Battery Cycle Count Comparison Between Lithium-Ion vs Lead-Acid. 2022. Available online: https://enertec.co.za/blog/battery-cycle-count-comparison-between-lithium-ion-vs-lead-acid.html (accessed on 10 March 2025).
- Vectron. Lithium-Iron-Phosphate Batteries. Available online: https://www.victronenergy.nl/upload/documents/Datasheet-12,8-&-25,6-Volt-lithium-iron-phosphate-batteries-Smart-EN.pdf (accessed on 10 March 2025).
- Peters, J.; Buchholz, D.; Passerini, S.; Weil, M. Life cycle assessment of sodium-ion batteries. Energy Environ. Sci. 2016, 9, 1744–1751. [Google Scholar] [CrossRef]
- Flow Battery Targets. 2025. Available online: https://flowbatterieseurope.eu/wp-content/uploads/2023/03/Flow-Battery-Targets-Position-Paper-2023.pdf (accessed on 10 March 2025).
- Wells, C.H. Solar microgrids to accommodate renewable intermittency. In Proceedings of the IEEE PES T&D 2010, New Orleans, LA, USA, 19–22 April 2010; pp. 1–9. [Google Scholar] [CrossRef]
- Talaat, M.; Elkholy, M.H.; Alblawi, A.; Said, T. Artificial intelligence applications for microgrids integration and management of hybrid renewable energy sources. Artif. Intell. Rev. 2023, 56, 10557–10611. [Google Scholar] [CrossRef]
- Hassan, A.A.; Atia, D.M. Optimizing microgrid integration of renewable energy for sustainable solutions in off/on-grid communities. J. Electr. Syst. Inf. Technol. 2024, 11, 61. [Google Scholar] [CrossRef]
- Paliwal, P. Determining optimal component sizes for an isolated solar-battery micro-grid using Butterfly PSO. In Proceedings of the 2021 1st International Conference on Power Electronics and Energy (ICPEE), Bhubaneswar, India, 2–3 January 2021; pp. 1–6. [Google Scholar] [CrossRef]
- Güven, A.F.; Yücel, E. Sustainable energy integration and optimization in microgrids: Enhancing efficiency with electric vehicle charging solutions. Electr. Eng. 2024, 107, 1541–1573. [Google Scholar] [CrossRef]
- Sachs, G. Even as EV Sales Slow, Lower Battery Prices Are Expected to Boost Demand. Ed. 2024. Available online: https://www.goldmansachs.com/insights/articles/even-as-ev-sales-slow-lower-battery-prices-expect (accessed on 10 March 2025).
- Ouria, M.; Delgado, J.; Moura, P.; de Almeida, A.T. Multi-criteria decision-making in decarbonizing urban transportation systems: A case study from Tabriz-Iran. Transp. Res. Part D Transp. Environ. 2023, 122, 103854. [Google Scholar] [CrossRef]
- Greene, R.; Devillers, R.; Luther, J.E.; Eddy, B.G.; Compass, G. GIS-based multi-criteria analysis. Geogr. Compass 2011, 5, 412–432. [Google Scholar]
- Locatelli, G.; Mancini, M. A framework for the selection of the right nuclear power plant. Int. J. Prod. Res. 2012, 50, 4753–4766. [Google Scholar]
- Zhang, N.; Yan, J.; Hu, C.; Sun, Q.; Yang, L.; Gao, D.W.; Guerrero, J.M.; Li, Y. Price-Matching-Based Regional Energy Market With Hierarchical Reinforcement Learning Algorithm. EEE Trans. Ind. Informatics 2024, 20, 11103–11114. [Google Scholar] [CrossRef]
- Lin, K.; Gao, J.; Li, Y.; Savaglio, C.; Fortino, G. Multi-Granularity Collaborative Decision With Cognitive Networking in Intelligent Transportation Systems. IEEE Trans. Intell. Transp. Syst. 2022, 24, 1088–1098. [Google Scholar] [CrossRef]
- Tüysüz, N.; Kahraman, C. An integrated picture fuzzy Z-AHP & TOPSIS methodology: Application to solar panel selection. Applied Soft Comput. 2023, 149, 110951. [Google Scholar] [CrossRef]
- Fonseca, P.; Moura, P.; Jorge, H.; de Almeida, A. Sustainability in university campus: Options for achieving nearly zero energy goals. Int. J. Sustain. High. Educ. 2018, 19, 790–816. [Google Scholar] [CrossRef]
- Sunpower, P. Sunpower Solar Panels 350W Black Lot of 30 Pieces. SPR-X21-350-BLK-D-AC. Available online: https://www.ebay.com/itm/296289728906?_skw=SunPower+SPR-X21-345+High+Efficiency+X+Series+345+Watts+Mono+Solar+Panel&itmmeta=01JKYM6ESYX4ZZADE5CQDPG8PA&hash=item44fc3e798a:g:JxAAAOSwKvdl8c2P (accessed on 10 March 2025).
- LG, N. LG Neon 2 LG350N1C-V5. Available online: https://www.europe-solarstore.com/lg-neon-2-lg350n1c-v5.html (accessed on 10 March 2025).
- Panasonic, P. Best Quality High Efficiency 700W Panasonic Solar Panel. Available online: https://mysolar.en.made-in-china.com/product/MFOTbylvMGfo/China-Best-Quality-High-Efficiency-700W-Panasonic-Solar-Panel.html (accessed on 10 March 2025).
- Jinko, P. Jinko Solar Panels 450W 500W 550W 600W 700W PV Module Perc Solar Photovoltaic Panel for Home Use Solar System. Available online: https://ahguangya.en.made-in-china.com/product/OEzpClDPHfkh/China-Jinko-Solar-Panels-450W-500W-550W-600W-700W-PV-Module-Perc-Solar-Photovoltaic-Panel-for-Home-Use-Solar-System.html (accessed on 10 March 2025).
- Victron, E. Victron 330W-24V Poly. Available online: https://www.europe-solarstore.com/solar-panels/manufacturer/victron/victron-330w-24v-poly.html (accessed on 10 March 2025).
- Alico, S. Htj 132 Half Cell 210mm Solar Panel 640W 650W 660W 670W 700W PV Module Price Monocrystalline PV Energy for Solar Power System. Available online: https://alicosolar.en.made-in-china.com/product/JxsUZXtMOmkf/China-Htj-132-Half-Cell-210mm-Solar-Panel-640W-650W-660W-670W-700W-PV-Module-Price-Monocrystalline-PV-Energy-for-Solar-Power-System.html?pv_id=1ijvjvf1ua7c&faw_id=1ijvjvomlc8f (accessed on 10 March 2025).
- First, P. Hot Sale First Solar Panel Monocrystalline 350W 700W Solar. Available online: https://assolareng.en.made-in-china.com/product/swGtMKnTAokB/China-Hot-Sale-First-Solar-Panel-Monocrystalline-350W-700W-Solar-Panel.html (accessed on 10 March 2025).
- Trina, P. Tier 1 Solar Panels Trina Solar 700W. Available online: https://rosensolar.en.made-in-china.com/product/JwMaUksPhtfZ/China-Tier-1-Solar-Panels-Trina-Solar-700W.html (accessed on 10 March 2025).
- Longi, P. Longi/Ja/Jinko/Giftsun Best Quality 495W 500W 515W High Efficiency. Available online: https://giftsunsolar.en.made-in-china.com/product/PxzYuTKGJMWd/China-Longi-Ja-Jinko-Giftsun-Best-Quality-495W-500W-515W-High-Efficiency-Mono-Polycrystalline-PV-Solar-Power-Panels-Price-Cost-Trina-Yingli-Canadian.html (accessed on 10 March 2025).
- JA, S. Ja Solar 700W 710W 720 Wp Hjt Mono Solar Panel 600W 700W 750W for Solar Power System. Available online: https://wonvolt.en.made-in-china.com/product/QfyRVeIAggcN/China-Ja-Solar-700W-710W-720-Wp-Hjt-Mono-Solar-Panel-600W-700W-750W-for-Solar-Power-System.html (accessed on 10 March 2025).
- PvGIS. Hourly Radiation Data for Coimbra. Available online: https://re.jrc.ec.europa.eu/pvg_tools/en/#MR (accessed on 10 March 2025).


| University | Focus/Contribution | Key Findings/Results | Ref. |
|---|---|---|---|
| Clemson University (USA) | Microgrid component sizing is designed to provide sufficient energy for a two-day islanding event. | Demonstrated the feasibility of ensuring energy supply during a two-day isolation scenario. | [1,13] |
| Malta College of Arts, Science, and Technology | Design guidelines, main functionalities, key components, and control architecture for developing a microgrid. | Presented a comprehensive framework for microgrid development in an academic setting. | [2] |
| ETS Montreal (Canada) | System design, modeling, and optimal operation for the microgrid. | Achieved optimal operation strategies for energy-efficient microgrid performance. | [3] |
| University of Novi Sad Faculty of Technical Sciences (Serbia) | Microgrid incorporating PV, wind power, biogas, EVs, and battery storage. | Illustrated the potential of integrating diverse energy sources in a campus microgrid. | [4] |
| Chalmers University of Technology (Sweden) | Testbed for intelligent distribution grids, local energy systems, and energy-flexible buildings; modeling and simulation included. | Enabled simulation and testing of intelligent energy systems and flexible energy use. | [5] |
| Al Akhawayn University (Morocco) | General microgrid testbed development and simulation. | Provided a scalable and flexible microgrid testing environment for research and experimentation. | [6] |
| Eindhoven University of Technology (The Netherlands) | Transforming the current distribution network into a smart grid by simulation of future loads and mobile storage capabilities. | Demonstrated a practical method to transition existing grids to smart grids with advanced capabilities. | [7] |
| Various universities worldwide | A review of existing campus microgrids; highlights their primary use as testbeds and laboratories. | Concluded that most university microgrids are designed for research and testing purposes, not real-world implementation. | [8] |
| UNICAMP (Brazil) | Implementation of “Campus GRID” microgrid with PV, energy storage, and automated load control. | Demonstrated effective energy management and optimization of resources. | [9] |
| Oakland University (USA) | A comprehensive review of campus microgrids, focusing on renewable energy sources and hybrid configurations. | Identified optimal configurations for energy production and flexibility. | [10] |
| University of Puerto Rico at Mayagüez (USA) | Methodology for designing a microgrid using renewable resources and critical load analysis. | Validated reliability and cost-effectiveness of microgrid systems during outages. | [11] |
| Stellenbosch University (South Africa) | Solar-powered microgrid with battery storage for campus energy needs. | Reduced energy costs and promoted sustainability initiatives. | [12] |
| University of Coimbra | Design and management strategies for robust microgrids | Microgrid architecture enhances resilience by ensuring power supply during extreme events | [10,13] |
| University of Cambridge (UK) | Microgrid with solar PV, battery storage, and demand–response systems. | Improved energy efficiency and reduced carbon footprint. | [14] |
| National University of Singapore (Singapore) | Smart microgrid integrating solar, wind, and energy storage systems. | Enhanced energy efficiency and provided a testbed for smart grid technologies. | [15] |
| Kyoto University (Japan) | Microgrid with solar, wind, and hydrogen storage systems. | Demonstrated the feasibility of integrating hydrogen as an energy storage solution. | [16] |
| Technical University of Munich (Germany) | Microgrid testbed for renewable energy integration and smart grid research. | Enabled advanced research on energy systems and grid optimization. | [17] |
| Seoul National University (South Korea) | Assessment of the technical and financial feasibility of deploying a microgrid using a planning model. | Highlighted the financial viability and technical challenges of microgrid deployment in a campus setting. | [18] |
| University of Queensland (Australia) | Solar-powered microgrid with battery storage for research and energy independence. | Reduced reliance on the main grid and promoted renewable energy research. | [19] |
| Democritus University of Thrace (Greece) | Simulation platform for a smart microgrid configuration including PV installation, battery storage, and energy management system. | Developed a reliable simulation platform for evaluating smart microgrid performance. | [20] |
| University of California, San Diego (USA) | Advanced microgrid with solar, storage, and CHP systems. | Achieved significant energy cost savings and enhanced grid resilience. | [21] |
| Battery Type | Cost | Availability | Performance | Life Cycles | Energy Density | Mass Density |
|---|---|---|---|---|---|---|
| Lead–Acid [34] | Low | Widely available | Good at low discharge rates | Short (500–1500) | Low | Heavy and bulky |
| Lithium-Ion (Li-ion) [34] | Medium | Widely available | Good at fast charging, sensitive to high temperatures | Long (2000–5000) | High | Remarkable |
| Lithium Iron Phosphate (LiFePO4) [35] | Low | Widely available | Good for stationary storage, safe and stable | Long (5000–10,000) | Medium | Remarkable |
| Sodium-Ion [36] | Very Low | Very Limited | Environmentally friendly, more thermally stable | Long (2000–7000) | Low | Moderate |
| Flow Batteries [37] | High | Limited | Ideal for grid-scale storage | Varying over 10,000 | Low | Heavy |
| Data | Existing | Proposed |
|---|---|---|
| Annual energy demand | 518 MWh | 460 MWh |
| Annual energy yield | 116 MWh | >1 GWh |
| Grid feed-in | 4.26 MWh | <460 |
| Purchased electricity | 407 MWh | 0 |
| Self-consumption | 111 MWh | ~460 MWh |
| Self-consumption (in % of PV) | 96.3% | >50% |
| Self-sufficiency (in % of demand) | 21.4% | ≥99% |
| Financing | Loan Interest Rate | 2.5%/year | |
| Feed-in-Tariff | EUR 0.05/kWh | ||
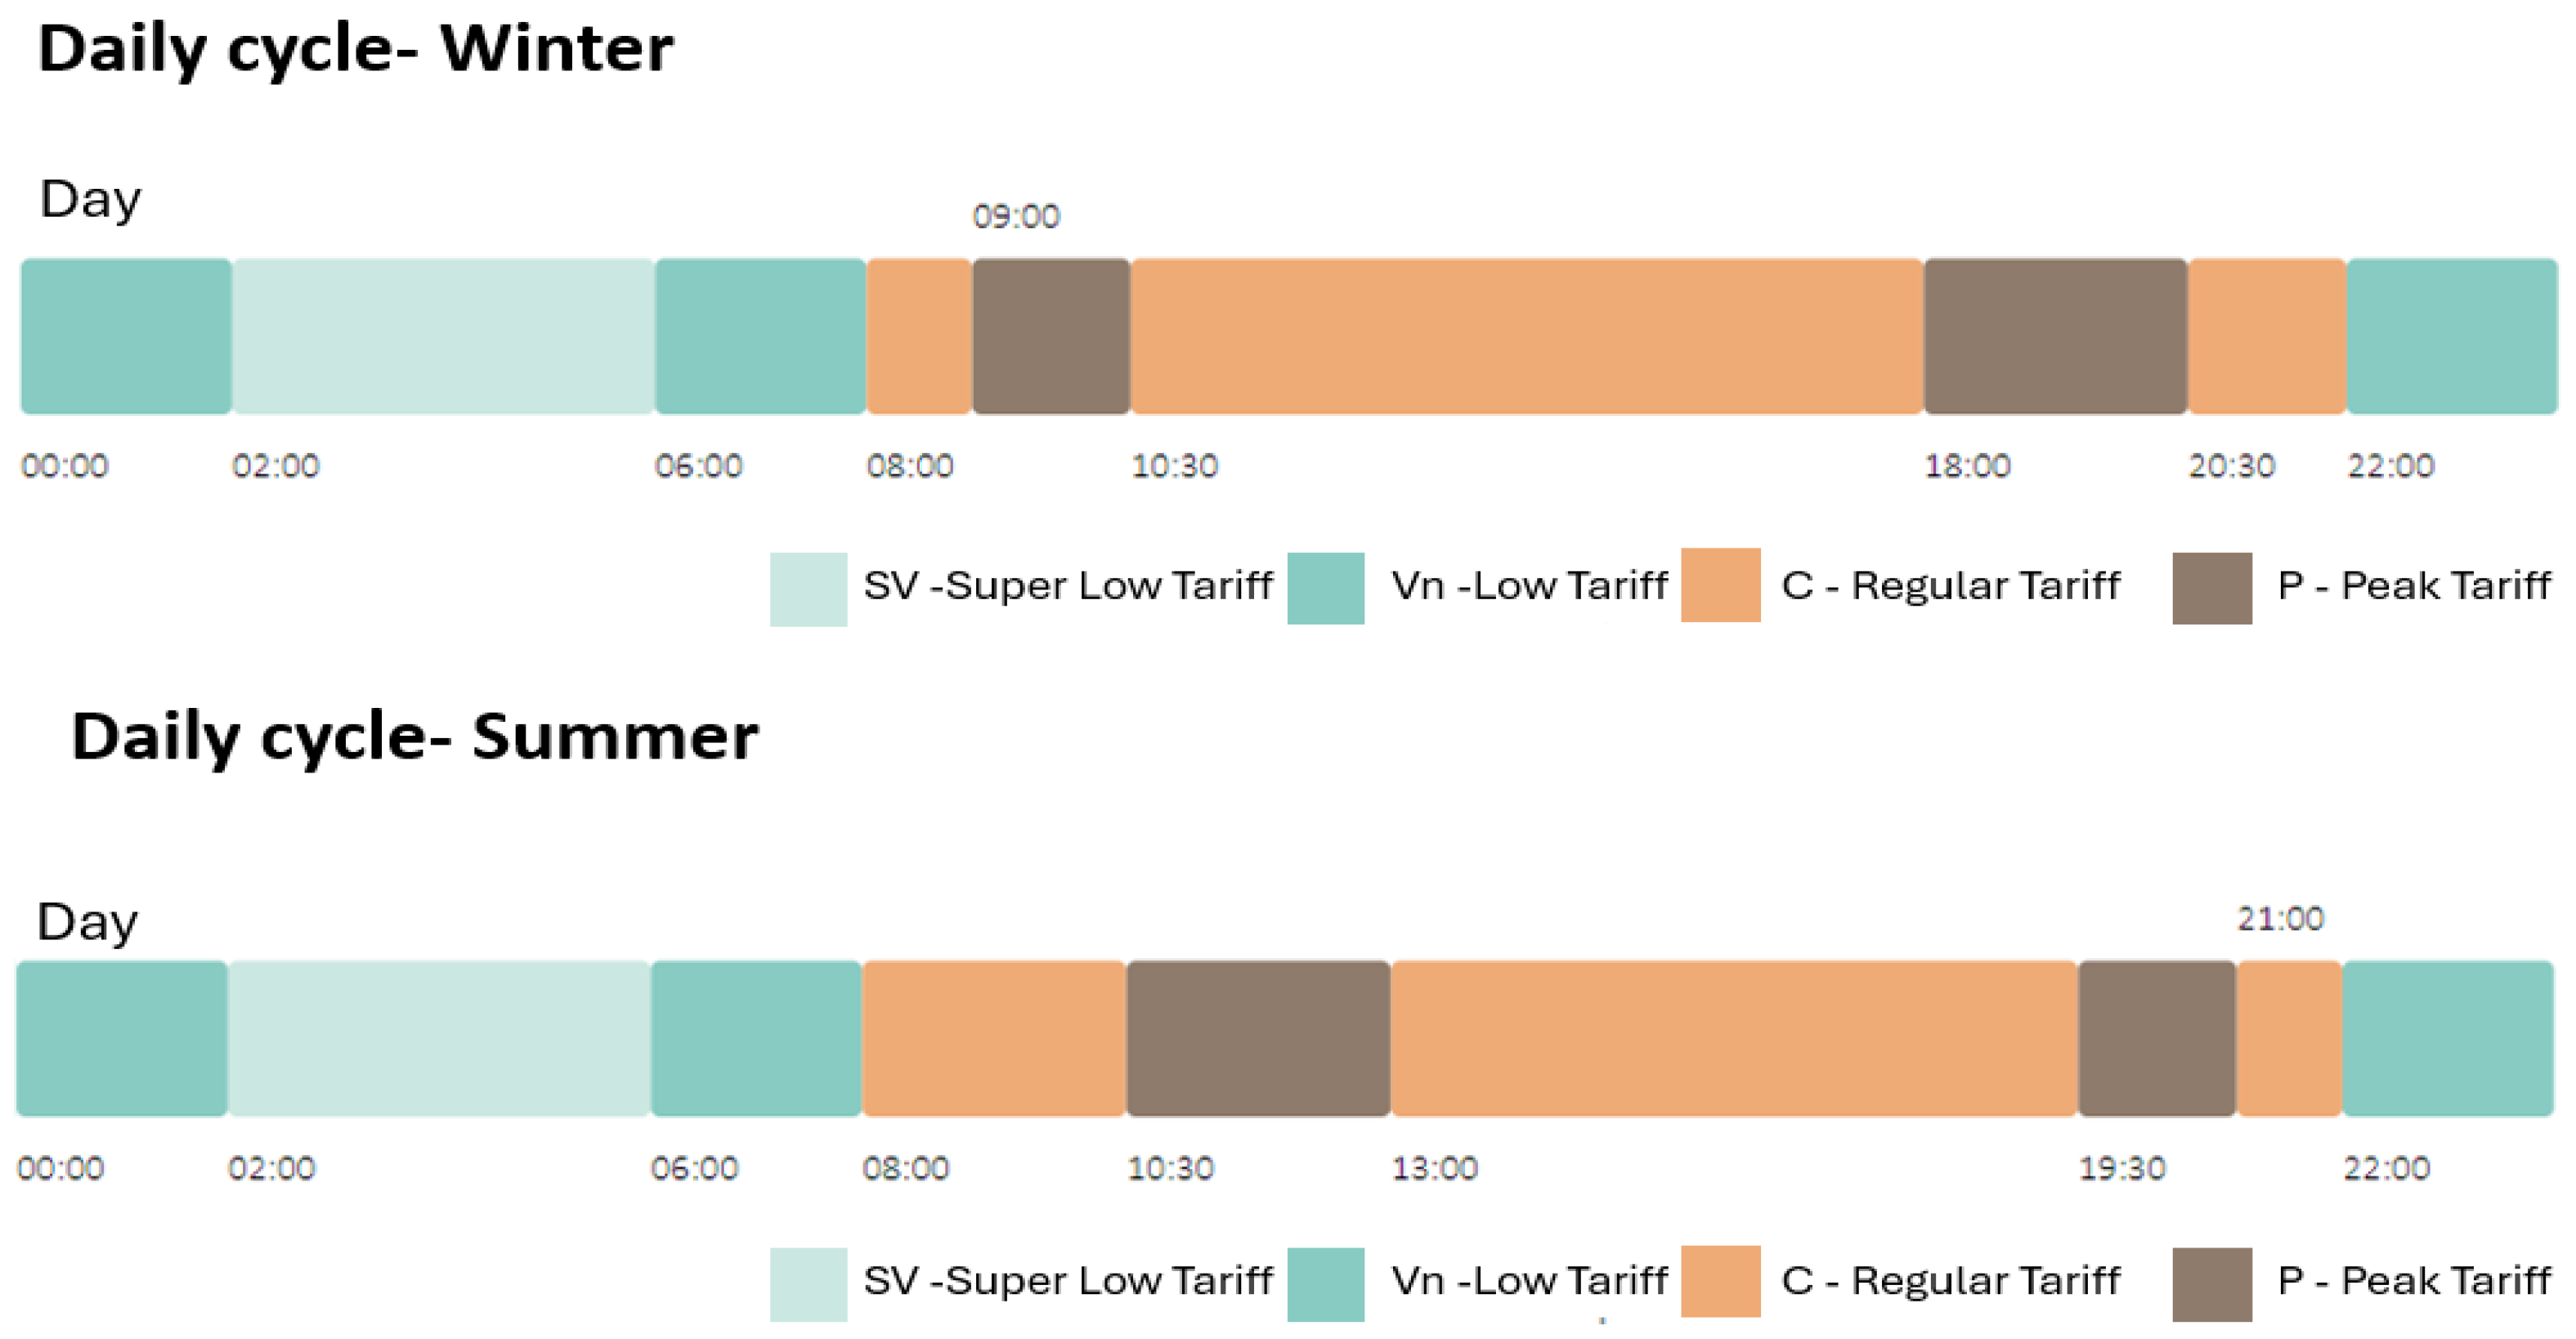
| Consumption Tariff | Super Low | EUR 0.1052/kWh | |
| Low | EUR 0.1058/kWh | ||
| Regular | EUR 0.1203/kWh | ||
| Peak | EUR 0.213/kWh | ||
| VAT | 6% | ||
| Costs | PV Panel | EUR 0.12/W | |
| Battery | EUR 200/kWh | ||
| Inverter | EUR 12/kW | ||
| Supports for Modules | EUR 0.012/kWh | ||
| Operating (OPEX) | EUR 0.0175/kWh/year | ||
| SDPs | TOPSIS Criteria/Optimization Objectives | Weight of Optimized Alternatives | ||||
|---|---|---|---|---|---|---|
| Alt. 1 | Alt. 2 | Alt. 3 | Alt. 4 | Alt. 5 | ||
| Environmental | Decarbonization | 33.3% | 33.3% | 33.3% | 33.3% | 33.3% |
| Social | Independence from Grid | 33.3% | 33.3% | 33.3% | 33.3% | 33.3% |
| Economic | Costs | 33.3% | 33.3% | 33.3% | 33.3% | 33.3% |
| Total | - | 100% | 100% | 100% | 100% | 100% |
| SDPs | TOPSIS Criteria/Optimization Objectives | Weightage of Optimized Alternatives | ||||
|---|---|---|---|---|---|---|
| Alt. 1 | Alt. 2 | Alt. 3 | Alt. 4 | Alt. 5 | ||
| Socio-economic 33% | NPV (M EUR) | 10% | 10% | 10% | 10% | 10% |
| ROI (100%) | 5% | 5% | 5% | 5% | 5% | |
| Total installation cost (k EUR) | 5% | 5% | 5% | 5% | 5% | |
| Payback (year) | 8% | 8% | 8% | 8% | 8% | |
| LCOE (EUR/kWh) | 5% | 5% | 5% | 5% | 5% | |
| Socio-technical 33% | Grid independency | 9% | 9% | 9% | 9% | 9% |
| Inject to grid (B2V) % | 5% | 5% | 5% | 5% | 5% | |
| Full discharge duration [h] | 19% | 19% | 19% | 19% | 19% | |
| Socio-environmental 33% | From grid (V2B) % | 33% | 33% | 33% | 33% | 33% |
| Total | 100% | 100% | 100% | 100% | 100% | |
| Alternatives | Criteria | Ref. | ||||
|---|---|---|---|---|---|---|
| Price | EE (%) | Panel Area (m2) | Life Span (Years) | |||
| EUR/pcs | EUR/Wp | |||||
| Alt. 1 | 135 | 0.4 | 19.82 | 1.77 | 25 | [51] |
| Alt. 2 | 211 | 0.66 | 18.71 | 1.71 | 25 | [52] |
| Alt. 3 | 152 | 0.216 | 22.54 | 3.11 | 25 | [53] |
| Alt. 4 | 84 | 0.12 | 22.54 | 3.11 | 25 | [54] |
| Alt. 5 | 160 | 0.45 | 18.2 | 1.98 | 25 | [55] |
| Alt. 6 | 145 | 0.207 | 21.54 | 3.11 | 25 | [56] |
| Alt. 7 | 202 | 0.46 | 17.45 | 2.52 | 25 | [57] |
| Alt. 8 | 105 | 0.15 | 22.5 | 3.1 | 25 | [58] |
| Alt. 9 | 77 | 0.12 | 23.1 | 2.58 | 25 | [59] |
| Alt. 10 | 60 | 0.12 | 22.5 | 3.1 | 30 | [60] |
| No. Fixed Orientation | Tilt (◦) | Azimuth (◦) | Row Distance (m) | Row ∆h (m) | Sub-Array No. | Module Area (m2) | PV Module No. | Location in the DEEC Site | |||
|---|---|---|---|---|---|---|---|---|---|---|---|
| PV System | 3D Scene | PV System | 3D Scene | PV System | 3D Scene | ||||||
| rientation #1 | 59 | 0 | 4.2 | 0.2–0.5 | 1 | 21 + 2 | 2004 | 2004 | 742 | 743 | Parking |
| Orientation #2 | 59 | 270 | - | 0 | 1 | 3 | 72.9 | 72.9 | 27 | 27 | Awning |
| Orientation #3 | 13.5 | 30 | 1.25 | 0 | 1 | 13 | 1621 | 1648 | 600 | 610 | Rooftop |
| Orientation #4 | 13.5 | 0 | 1.25 | 0 | 1 | 4 | 492 | 494 | 182 | 183 | Rooftop |
| Rank | −25% | +25% | −25% | +25% | TOPSIS |
|---|---|---|---|---|---|
| Alternative | Price (EUR/Wp) | EE (%) | Panel Area | Power (wp) | Pi |
| 1 | 0.14 | 23.01 | 2.58 | 620 | 78.3% |
| 2 | 0.12 | 21.67 | 2.8 | 605 | 77.0% |
| 3 | 0.12 | 22.54 | 3.11 | 700 | 75.3% |
| 4 | 0.15 | 22.54 | 3.106 | 700 | 73.7% |
| 5 | 0.2 | 22.54 | 3.11 | 700 | 69.8% |
| 6 | 0.2 | 21.54 | 3.11 | 700 | 69.6% |
| 7 | 0.4 | 19.82 | 1.77 | 350 | 41.9% |
| 8 | 0.45 | 18.2 | 1.98 | 360 | 33.6% |
| 9 | 0.46 | 17.45 | 2.52 | 440 | 29.6% |
| 10 | 0.6 | 18.71 | 1.71 | 320 | 24.2% |
| TOPSIS | Weight | No Storage | S = 0.87 MWh | S = 1.9 MWh | S = 2.5 MWh | S = 3.75 MWh | |
|---|---|---|---|---|---|---|---|
| Socio-economic 33% | 10% | NPV (M EUR) | 1.07 | 1.13 | 0.9 | 0.765 | 0.469 |
| 5% | ROI (×100%) | 4.4 | 2.6 | 1.34 | 0.95 | 0.431 | |
| 5% | Total installation cost (k EUR) | 246.3 | 441 | 667.5 | 807.9 | 1088.725 | |
| 8% | Payback (year) | 4.5 | 6.3 | 9.4 | 11.1 | 14.6 | |
| 5% | LCOE (EUR/kWh) | 0.0281 | 0.0381 | 0.0487 | 0.0554 | 0.0685 | |
| Socio-technical 33% | 9% | Grid independency | 76% | 94% | 98% | 99% | 99% |
| 5% | Inject to grid (B2V) % | 84% | 62% | 60% | 60% | 60% | |
| 19% | Full discharge duration [h] | 0 | 17 | 36 | 48 | 72 | |
| Socio-environmental 33% | 33% | From grid (V2B) % | 0.2354 | 0.059 | 0.02 | 0.013 | 0.008 |
| TOPSIS rank of sustainability | 99% | Pi | 50% | 51% | 58% | 63% | 69% |
Disclaimer/Publisher’s Note: The statements, opinions and data contained in all publications are solely those of the individual author(s) and contributor(s) and not of MDPI and/or the editor(s). MDPI and/or the editor(s) disclaim responsibility for any injury to people or property resulting from any ideas, methods, instructions or products referred to in the content. |
© 2025 by the authors. Licensee MDPI, Basel, Switzerland. This article is an open access article distributed under the terms and conditions of the Creative Commons Attribution (CC BY) license (https://creativecommons.org/licenses/by/4.0/).
Share and Cite
Ouria, M.; Correia, A.F.M.; Moura, P.; Coimbra, P.; de Almeida, A.T. MCDM Optimization-Based Development of a Plus-Energy Microgrid Architecture for University Buildings and Smart Parking. Energies 2025, 18, 3641. https://doi.org/10.3390/en18143641
Ouria M, Correia AFM, Moura P, Coimbra P, de Almeida AT. MCDM Optimization-Based Development of a Plus-Energy Microgrid Architecture for University Buildings and Smart Parking. Energies. 2025; 18(14):3641. https://doi.org/10.3390/en18143641
Chicago/Turabian StyleOuria, Mahmoud, Alexandre F. M. Correia, Pedro Moura, Paulo Coimbra, and Aníbal T. de Almeida. 2025. "MCDM Optimization-Based Development of a Plus-Energy Microgrid Architecture for University Buildings and Smart Parking" Energies 18, no. 14: 3641. https://doi.org/10.3390/en18143641
APA StyleOuria, M., Correia, A. F. M., Moura, P., Coimbra, P., & de Almeida, A. T. (2025). MCDM Optimization-Based Development of a Plus-Energy Microgrid Architecture for University Buildings and Smart Parking. Energies, 18(14), 3641. https://doi.org/10.3390/en18143641