1. Introduction
In applications such as high-voltage direct current (HVDC) transmission, renewable energy generation, and industrial power systems, DC rectangular busbars play a critical role in current transmission at key nodes due to their advantages of high current-carrying capacity, low power loss, ease of installation, and efficient space utilization. The accurate measurement of busbar current is essential for operational monitoring and control decision-making. However, the high energy density of DC rectangular busbars often leads to compact installation environments, posing challenges for conventional DC current measurement devices such as shunt resistors [
1], fiber-optic current sensors [
2], and flux-gate current sensors [
3]. These devices are typically bulky, costly, and difficult to deploy at scale, limiting their suitability for distributed current monitoring in DC transmission and distribution networks. Consequently, there is an urgent need to develop compact and cost-effective DC current-sensing technologies specifically tailored for rectangular busbar applications.
The field-source inversion-based current measurement method utilizes spatial magnetic field measurements to achieve the target current measurement in a contactless manner. This method offers advantages such as a compact structure, easy installation, and low cost, making it widely applied in overhead transmission lines [
4], urban cables [
5], and power electronics [
6]. Additionally, it has been preliminarily explored for measuring both AC and DC currents in rectangular busbars [
7,
8]. The core of this method lies in determining the correlation coefficient between the measured magnetic field and the target current, which can be achieved through both offline [
9,
10] and online approaches [
11,
12]. For the offline method, after installing the magnetic field sensor array, a reference current with a known value is introduced into the target conductor. The linear fitting coefficient between the measured magnetic field and the target current for each magnetic field sensor is then calculated [
13]. After these coefficients are determined, the current can be measured based on the detected magnetic field. However, the offline method has drawbacks, including operational inconvenience and measurement errors caused by shifts in the relative position between the magnetic field sensors and the target conductor over time. In contrast, the online method determines key measurement parameters such as the position, magnetic sensitivity direction, and sensitivity of each sensor, and, by either applying the discrete integration of Ampère’s loop theorem [
14,
15,
16] or solving the field-source inverse problem [
17,
18], the target current can be directly inferred from the measured magnetic fields. This approach enables plug-and-play functionality and adaptive compensation for positional variations.
Table 1 presents a concise comparison of various non-contact current sensors in terms of their principle, accuracy, complexity, cost, and distinguishing features. Among them, current sensors based on magnetic sensor arrays offer measurement accuracy ranging from 1% to 5%, while maintaining relatively low cost and high design flexibility. This makes them particularly suitable for complex conductor geometries (e.g., busbars and multicore cables), enabling their large-scale deployment for distributed current measurement in power systems.
Currently, the non-contact measurement of DC rectangular busbar currents using a magnetic field sensor array is primarily based on the discrete integration method derived from Ampère’s loop theorem [
19]. For example, in ref. [
20], an elliptical magnetic field sensor array is used to measure the magnetic field around the busbar based on the discrete integral form of Ampère’s theorem. By optimizing parameters such as the aspect ratio, sensor positions, and the number of magnetic field sensors, the study finds that, when the aspect ratio of the elliptical array is less than 0.25, at least nine magnetic field sensors are required to achieve a measurement accuracy of 1%. However, this method assumes that the center of the rectangular busbar always aligns with the center of the magnetic field sensor array, without accounting for the eccentricity or rotation of the busbar. In ref. [
21], a rectangular magnetic field sensor array is employed for high-current measurement in large rectangular busbars. The study explores different numerical integration methods, including the trapezoidal rule, Simpson’s rule, and Boole’s rule, to discretely integrate Ampere’s loop theorem. A total of 52 magnetic field sensors are required to be distributed at equal intervals around a
rectangular busbar for non-contact current measurement.
The discrete integration method based on Ampère’s circuital law enables non-contact current measurement by requiring magnetic field sensors to be uniformly distributed around the conductor, with the conductor ideally aligned with the geometric center of the magnetic field sensor array. However, any displacement between the conductor and the sensor array degrades the accuracy of the current measurement [
22,
23]. In contrast, the field-source inverse modeling approach allows the real-time estimation of the correlation coefficients. This method eliminates the requirement for uniform sensor spacing and demonstrates strong robustness to conductor position variations, thereby improving the reliability of current measurement under practical conditions. This method has been applied to AC current measurement in circular conductors [
24,
25], but there are no reported studies on its application to DC rectangular busbars. For example, in ref. [
26], triaxial magnetic field sensors are used to measure the magnetic fields around a single conductor. By analyzing the proportional relationships of the magnetic field components along different axes, the conductor’s position and tilt angle are inferred, allowing the correlation coefficient between the measured current and the magnetic field to be determined. In ref. [
27], a circular array composed of eighteen magnetic field sensors is used to establish a nonlinear equation system. By solving it with a nonlinear least-squares approach, three-phase current inversion is achieved, along with the determination of conductor positions. This method enables the adaptive updating of current measurement coefficients when the relative position between the conductor and the sensor array changes, ensuring measurement accuracy.
This paper explores a non-contact measurement method for DC rectangular busbar currents based on field-source inversion. Compared to the discrete integration method using Ampère’s loop theorem, this approach effectively reduces the number of magnetic field sensors and provides an equal distribution of magnetic field sensors. The basic framework of this study is as follows. First, an analytical model of the spatial magnetic field generated by the DC rectangular busbar current is established, taking into account factors such as busbar eccentricity, rotation, and the influence of the geomagnetic field. Then, a field-source inversion model is constructed and solved using the nonlinear least-squares method. Finally, both a simulation study and a physical experiment are conducted to validate the proposed method.
3. Field-Source Inversion-Based Non-Contact Current Measurement Method
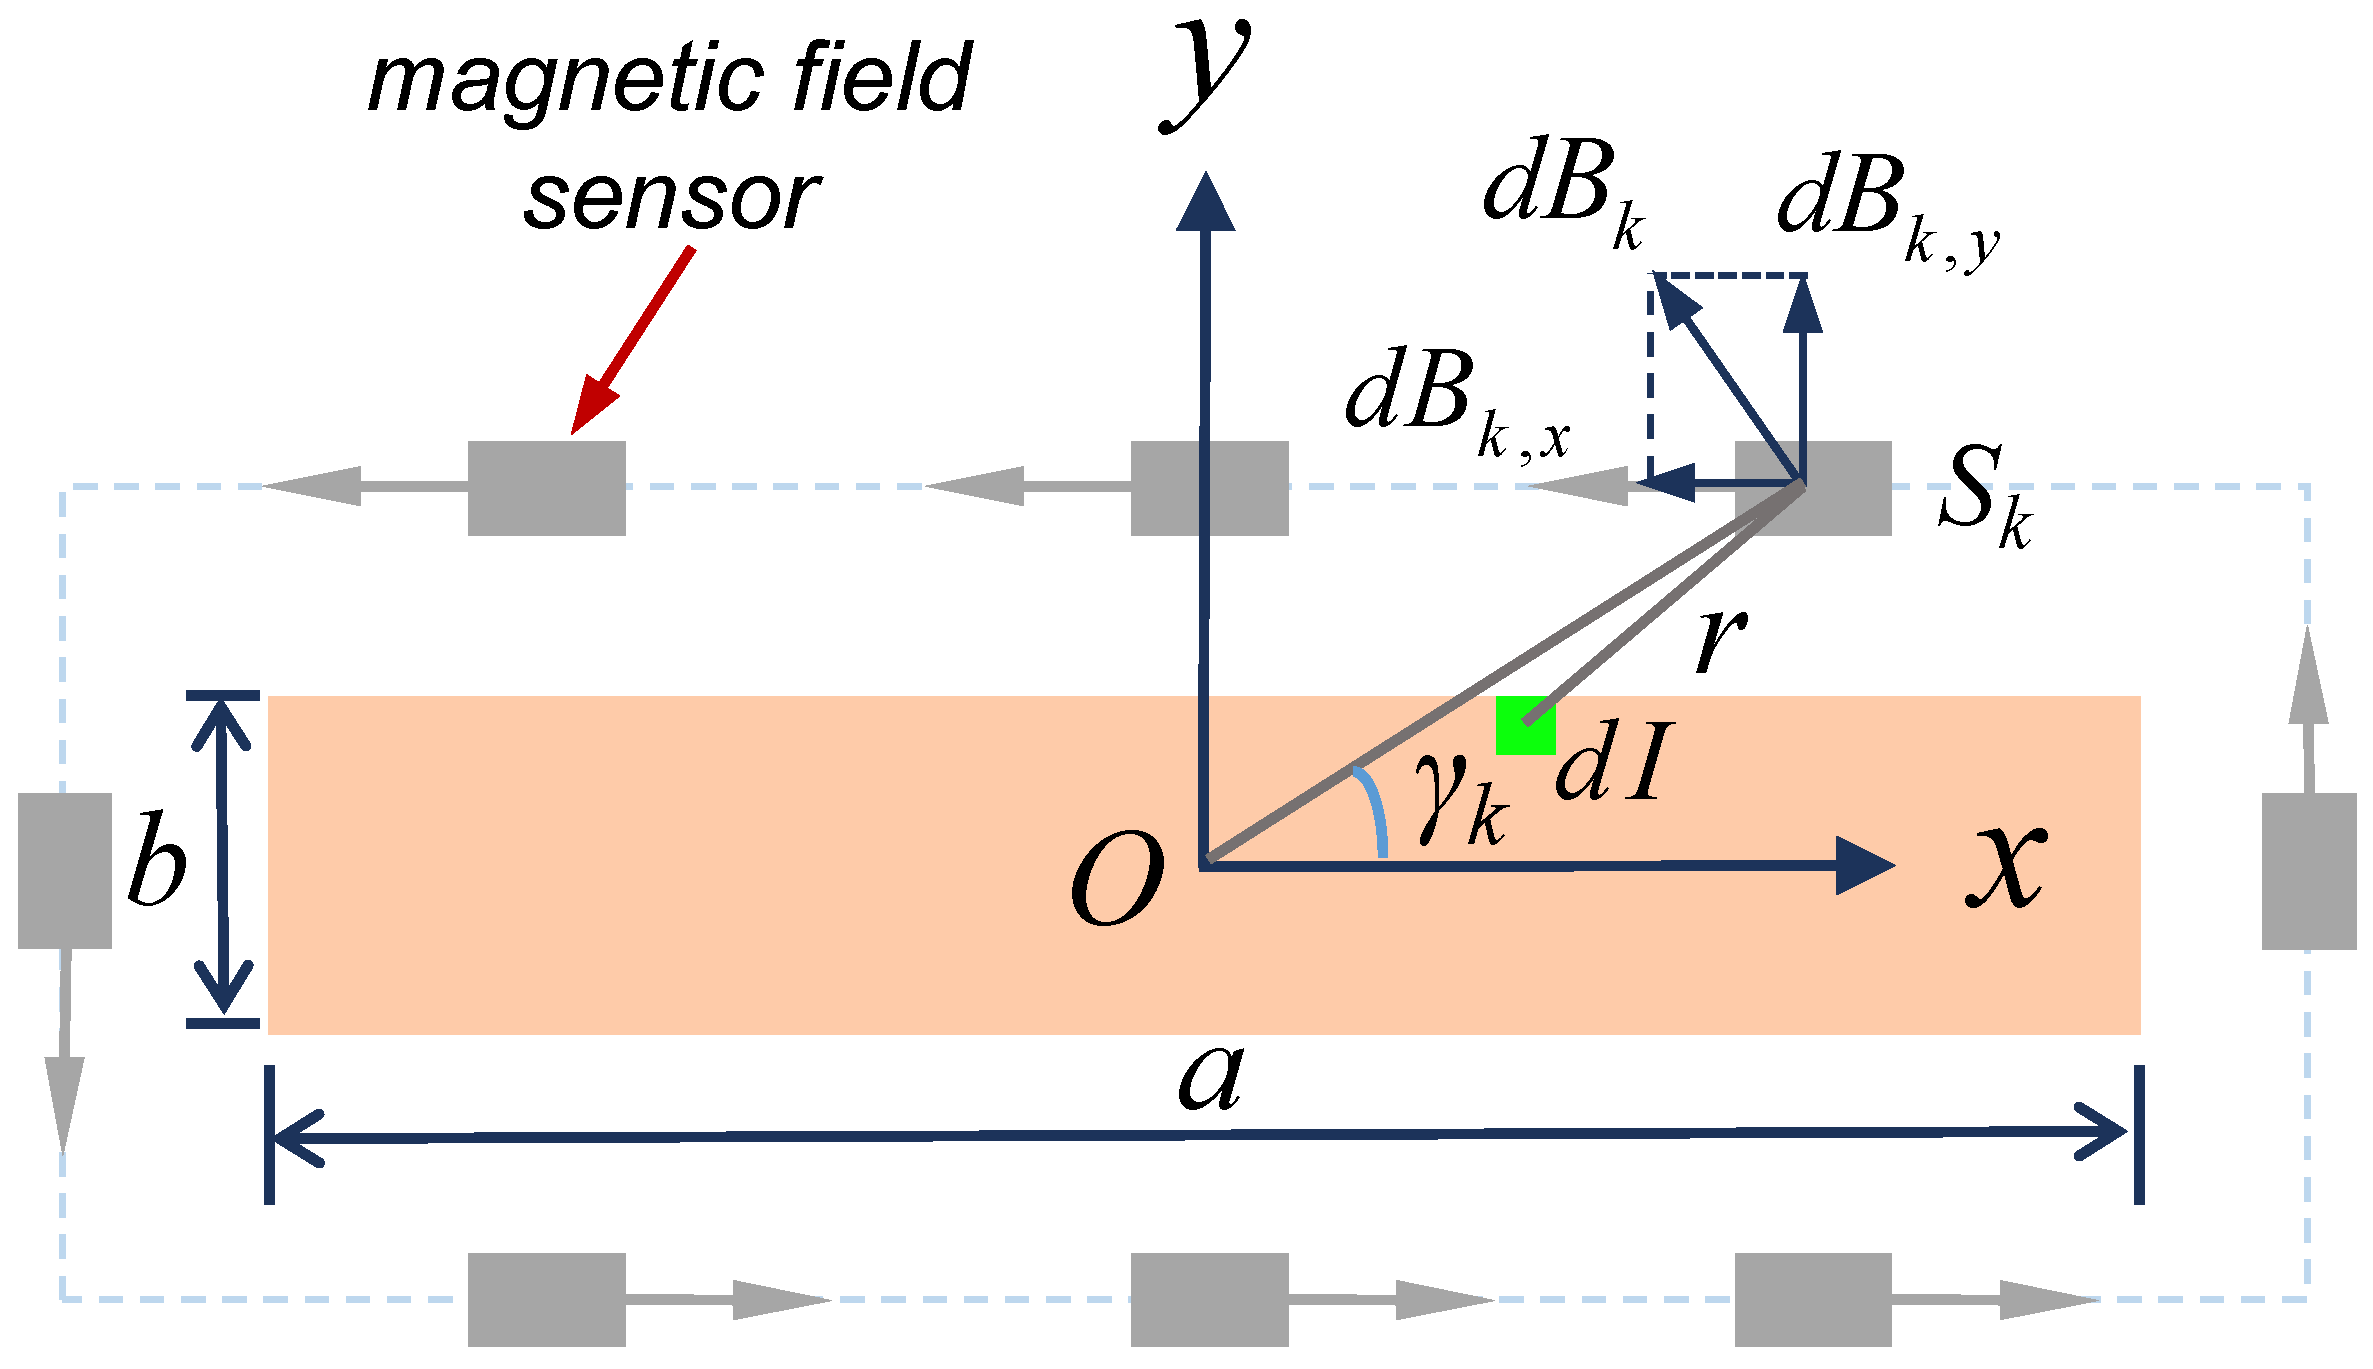
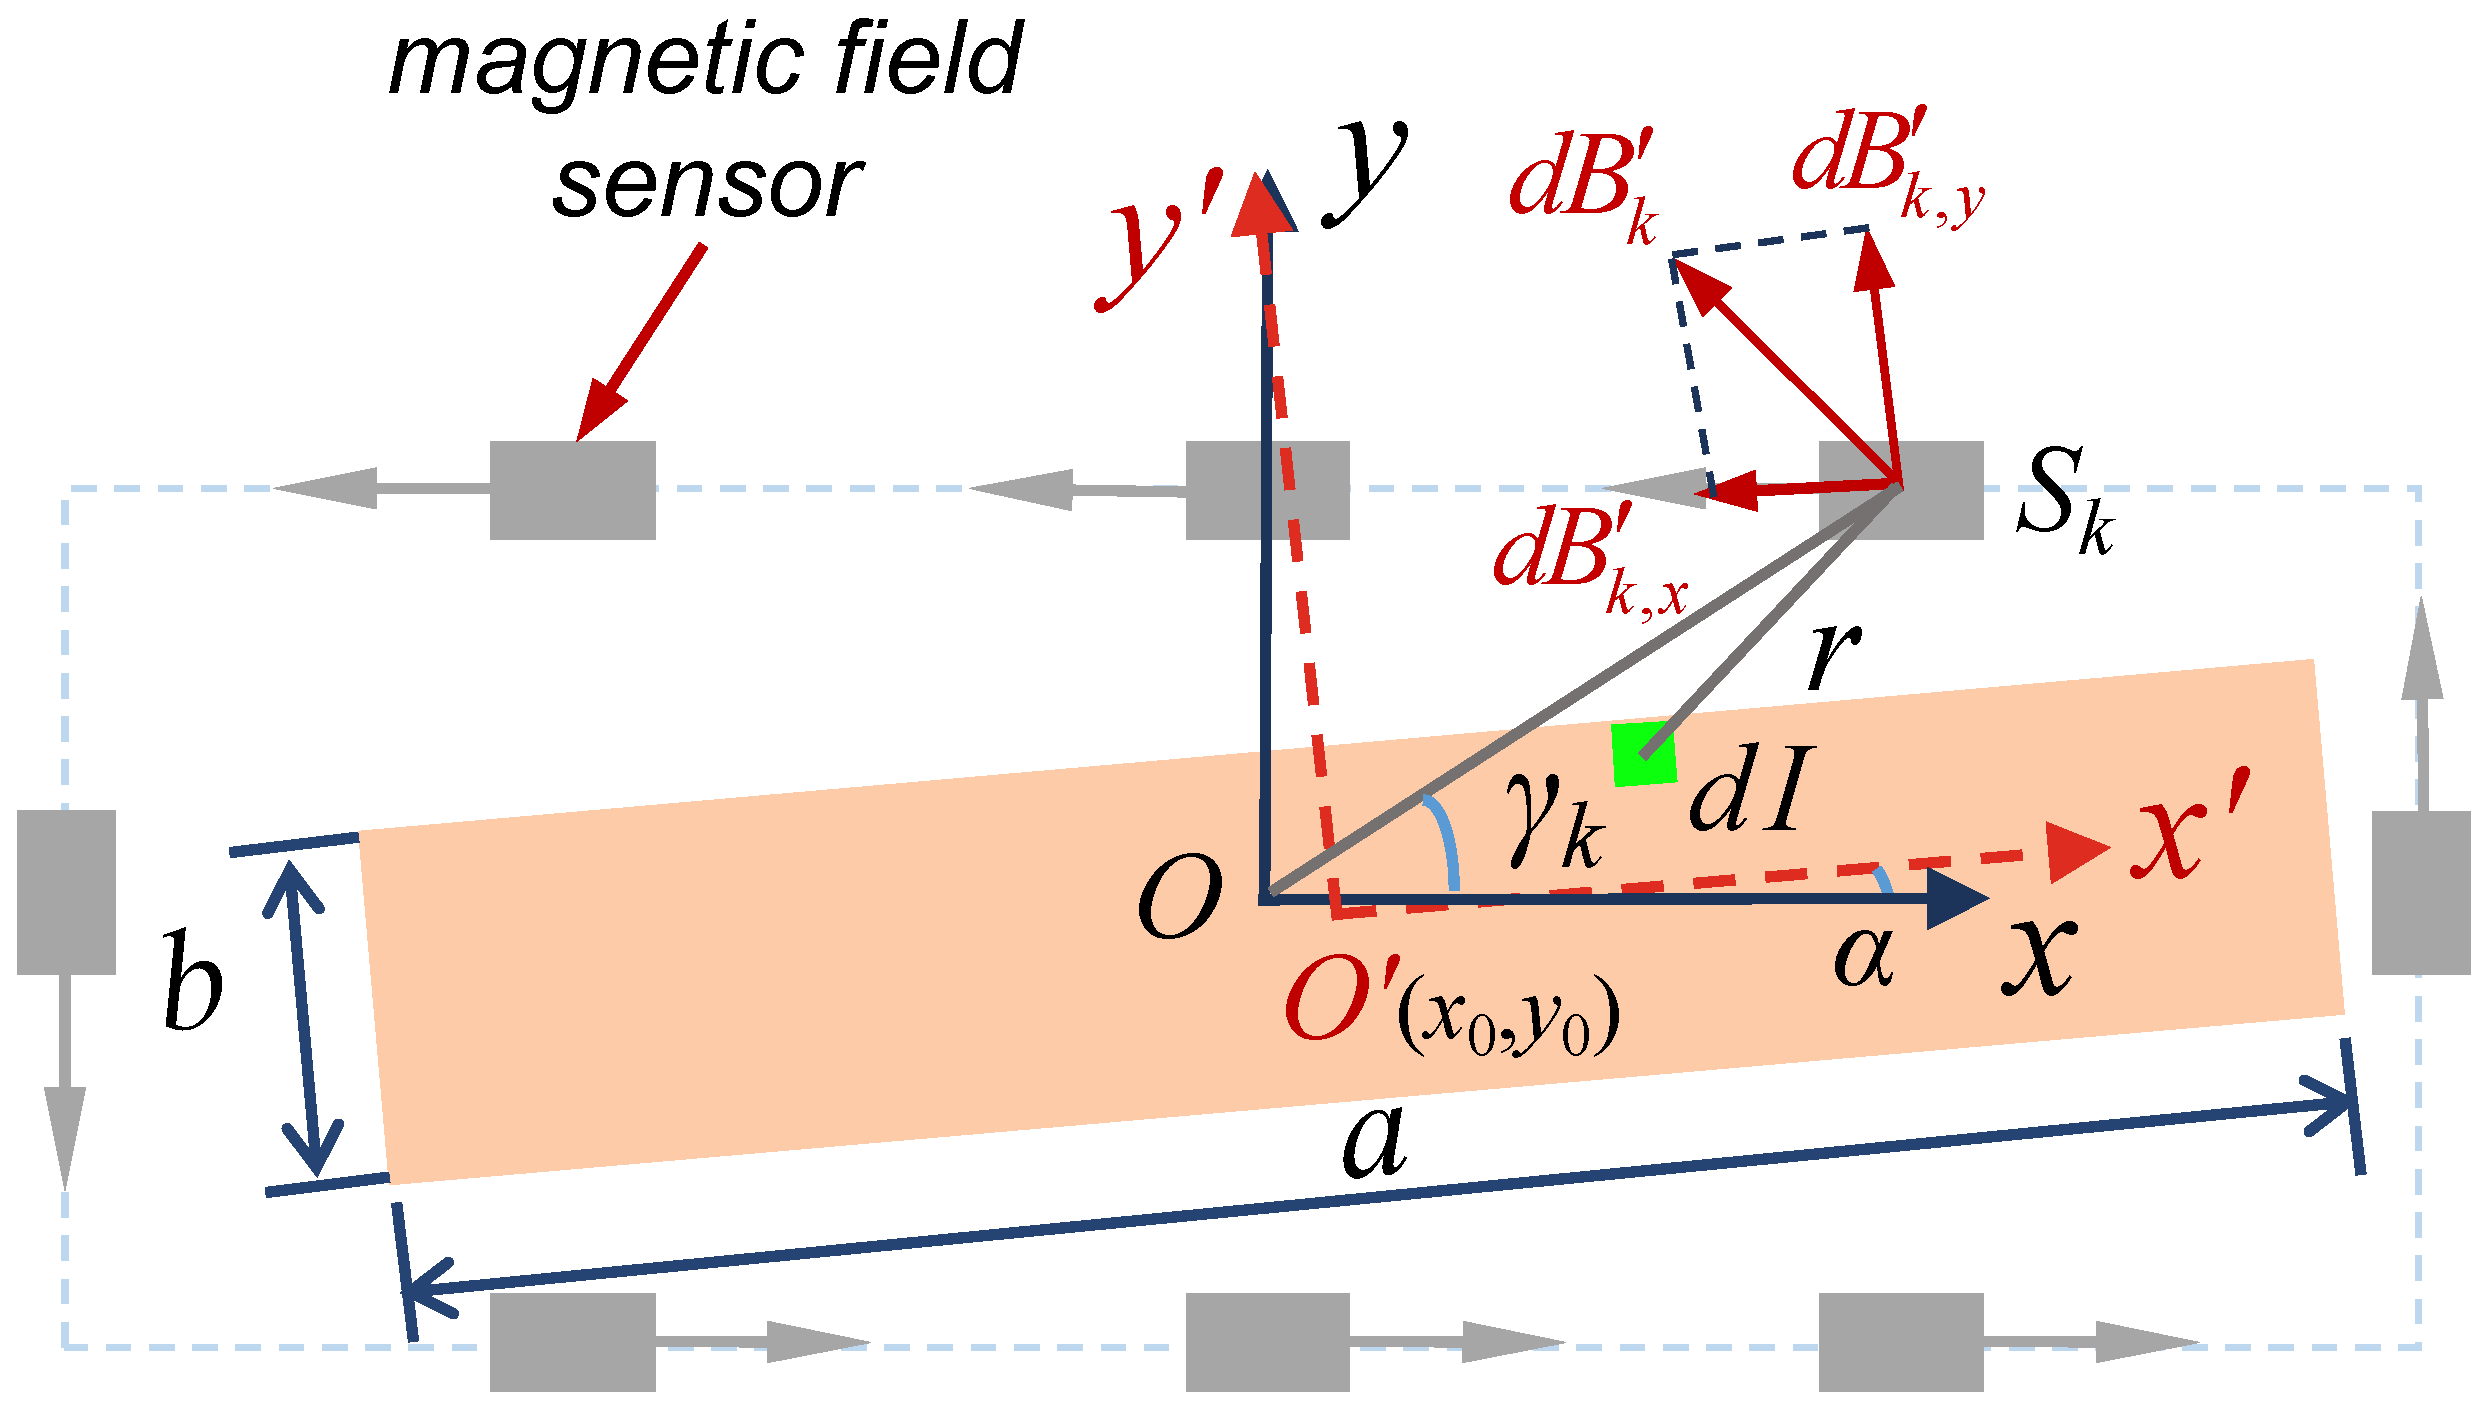
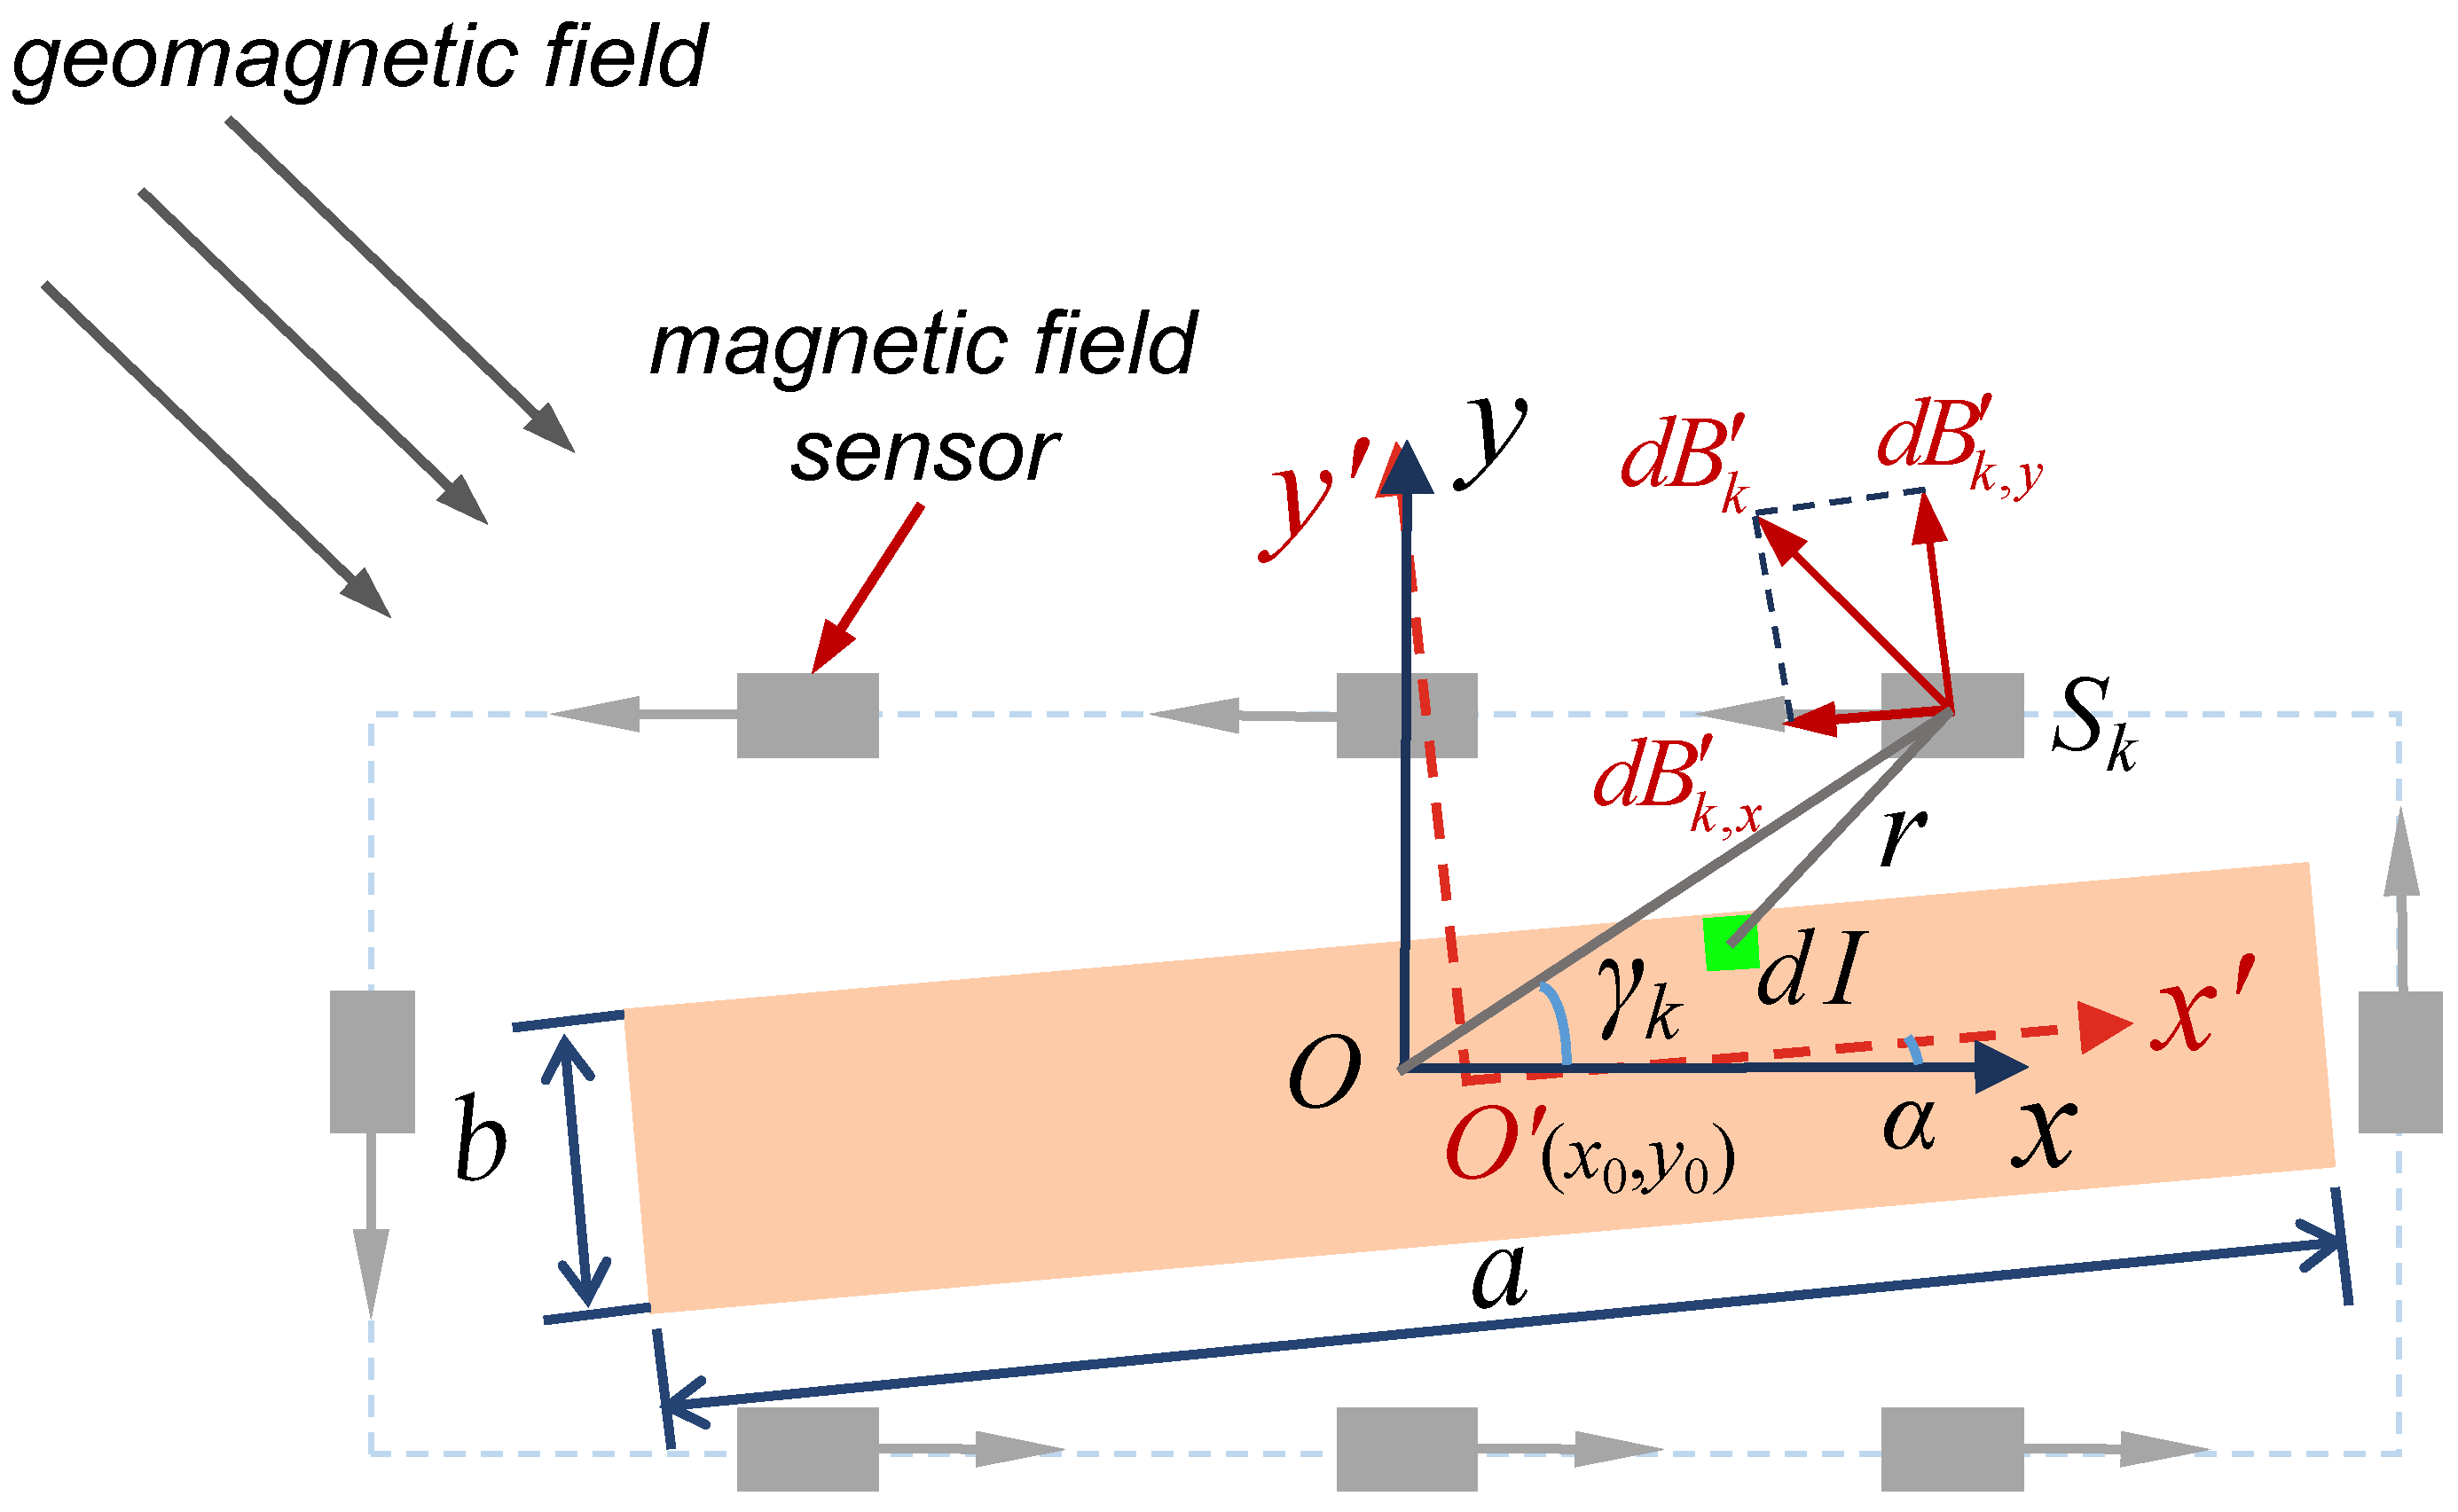
After the installation of the magnetic field sensor array, if the rectangular busbar is eccentric or rotated relative to the center of the magnetic field sensor array, and the influence of the geomagnetic field is also considered, the magnetic field expression measured by the
k-th magnetic field sensor, as described in Equation (
19), includes not only the DC rectangular busbar current
I but also the parameters
,
, which characterize the eccentricity and rotation angle
of the rectangular busbar, and the parameters
and
, which characterize the magnitude and direction of the geomagnetic field. These six parameters are unknown, while the parameters related to the magnetic field sensor in Equation (
19), such as its position coordinates
,
and the magnetic sensitivity direction angle
, are known quantities that are obtained by calibration. The essence of achieving the non-contact measurement of the DC rectangular busbar current using a magnetic field sensor array is to solve for these six unknown parameters, thereby completing the online inversion of the DC rectangular busbar current. In this way, the relative position between the DC rectangular busbar and the magnetic field sensor array does not need to be considered, and the current flowing through the DC rectangular busbar can always be accurately calculated.
To determine the six unknown parameters discussed above, a minimum of six magnetic field sensors must be strategically positioned around the DC rectangular busbar to measure the magnetic field at no fewer than six distinct points. Based on Equation (
19), a system comprising at least six distinct equations is constructed. To efficiently estimate the unknown parameters, the system is reformulated as a nonlinear least-squares problem, with the objective function defined as follows:
where
represents the theoretical magnetic field calculated from Equation (
19), and
represents the actual magnetic field measured by the
k-th magnetic field sensor.
Solving the nonlinear least-squares problem represented by Equation (
20) involves searching for the optimal combination of unknown parameters such that the magnetic fields measured by all magnetic field sensors are as close as possible to their corresponding theoretical magnetic fields. To expedite the solution of the nonlinear least-squares problem represented by Equation (
20), appropriate constraints must be imposed on the variables to restrict the feasible domain of the unknowns. The eccentricity parameters
and
of the magnetic field sensor array satisfy the following constraints:
where
and
represent the length and width of the rectangular magnetic field sensor array, respectively.
The rotation angle
of the rectangular busbar and the direction
of the geomagnetic field satisfy the following constraint conditions:
To solve the nonlinear least-squares problem with Equation (
20) as the objective function, the AMPL (A Mathematical Programming Language) programming language is used for modeling, and the Knitro solver is employed for solving. The AMPL programming language has a simple syntax and efficient solving capabilities, allowing seamless integration with multiple solvers and supporting the solution of various optimization problems. It is particularly well-suited for modeling and solving complex and large-scale optimization problems. Knitro, on the other hand, is a specialized high-level solver for solving nonlinear optimization problems, capable of efficiently solving complex optimization problems with fast algorithms.
4. Simulation Study
A simulation-based verification is conducted to validate the effectiveness of the proposed current inversion method for a DC rectangular busbar. The length
a and width
b of the DC rectangular busbar are 50 mm and 10 mm, respectively. Eight magnetic field sensors are arranged in a rectangular array around the busbar, as shown in
Figure 3. The preset values of the eccentric position coordinates
, rotation angle
, geomagnetic field magnitude
, and its direction angle
are listed in
Table 2. A current ranging from 2 A to 10 A, with a step size of 2 A, is applied to the DC rectangular busbar.
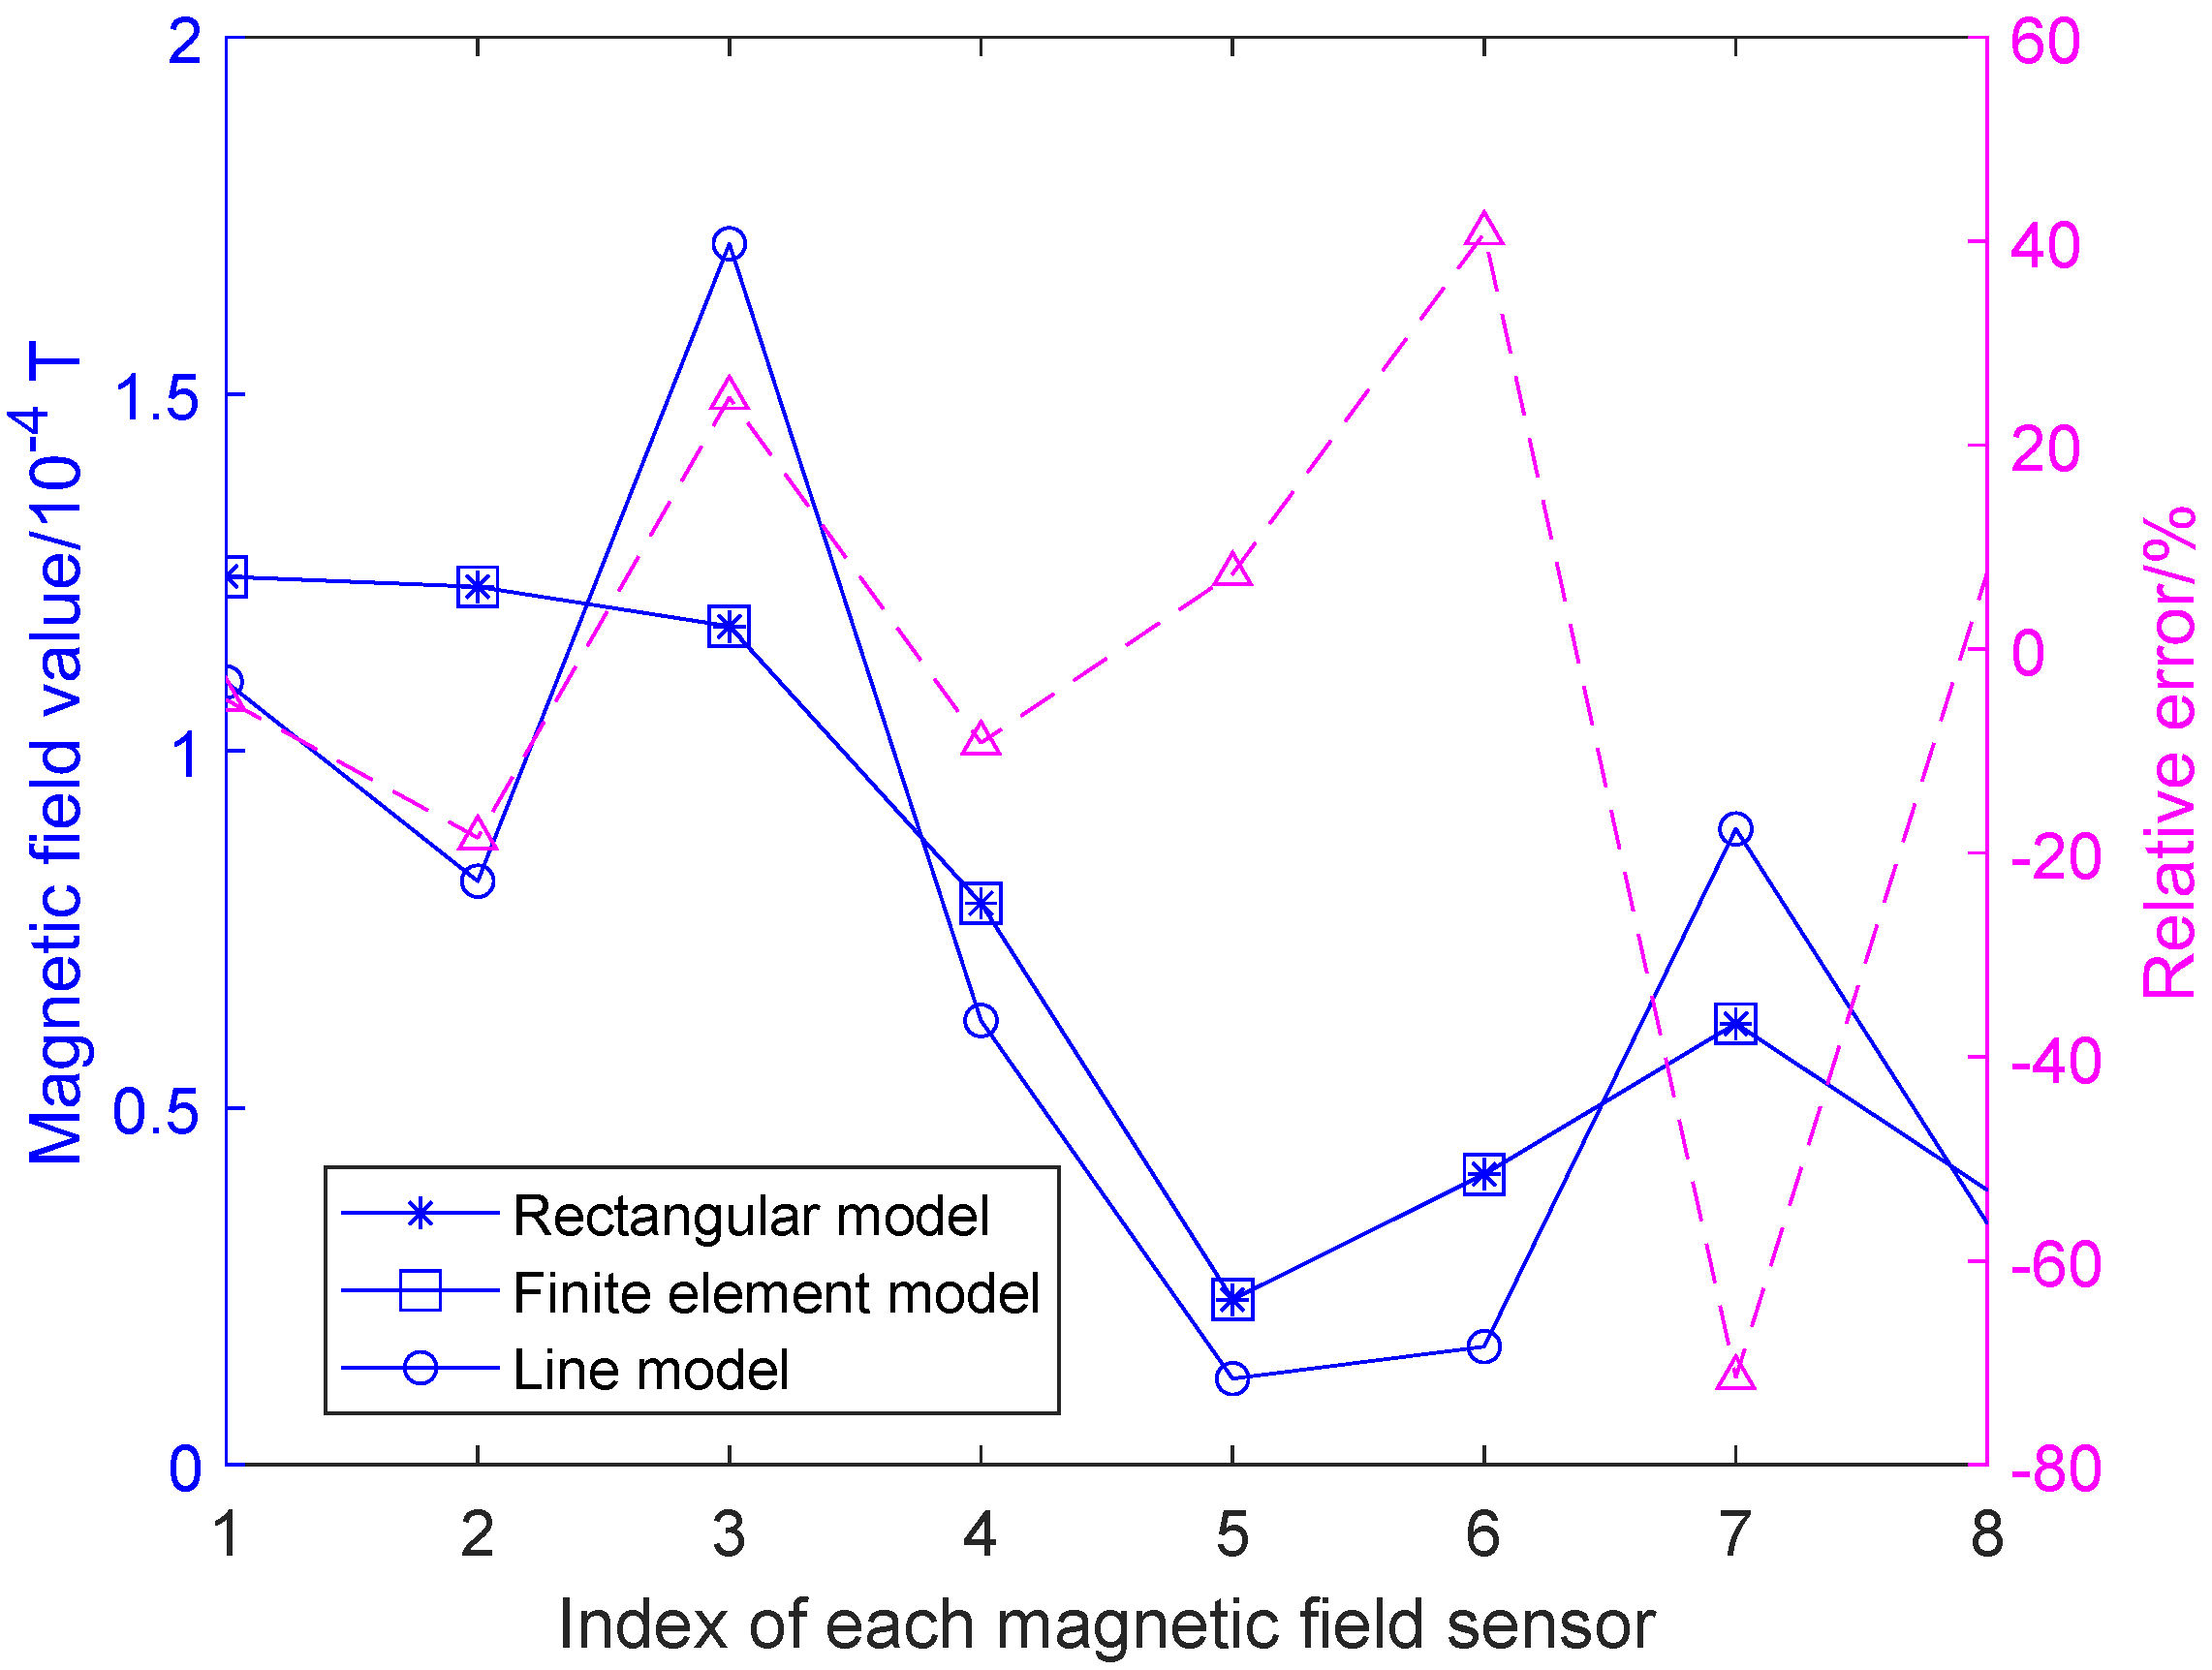
The key to the accuracy of current inversion lies in whether the magnetic field calculated using a mathematical model for each magnetic field sensor matches or closely approximates the corresponding measured magnetic field. In this study, an analytical model of the spatial magnetic field generated by a rectangular busbar current is established, which enables the accurate computation of the theoretical magnetic field values at different sensor locations. When the rectangular busbar current is approximated as a line current, significant deviations may arise between the computed magnetic field and the theoretical values. To validate this, a finite element model of the rectangular busbar is constructed based on the simulation parameters listed in
Table 2. With the busbar current set to an amplitude of 10 A and under the influence of the geomagnetic field, the theoretical magnetic field values measured by all eight magnetic field sensors are accurately computed. Simultaneously, both the rectangular busbar magnetic field model and the line current magnetic field model are used to calculate the magnetic field values corresponding to eight magnetic field sensors. The resulting comparisons are shown in
Figure 4.
As shown in
Figure 4, the magnetic field calculated using the finite element model (represented by square markers) closely matches the results obtained from the analytical model of the spatial magnetic field generated by the rectangular busbar current established in this paper (represented by star markers). In contrast, the magnetic field computed using the line current model is represented by hollow circles in the same figure. It is evident that the magnetic field results from the line current model differ significantly from those obtained using both the finite element model and the rectangular busbar model. The corresponding relative errors in magnetic field magnitude are shown on the right axis of
Figure 4, ranging from −66.56% to 80.48%. Therefore, approximating a rectangular busbar current with a line current model introduces substantial forward calculation errors in the magnetic field. This demonstrates the validity and accuracy of the analytical model for the magnetic field generated by a rectangular busbar current proposed in this paper.
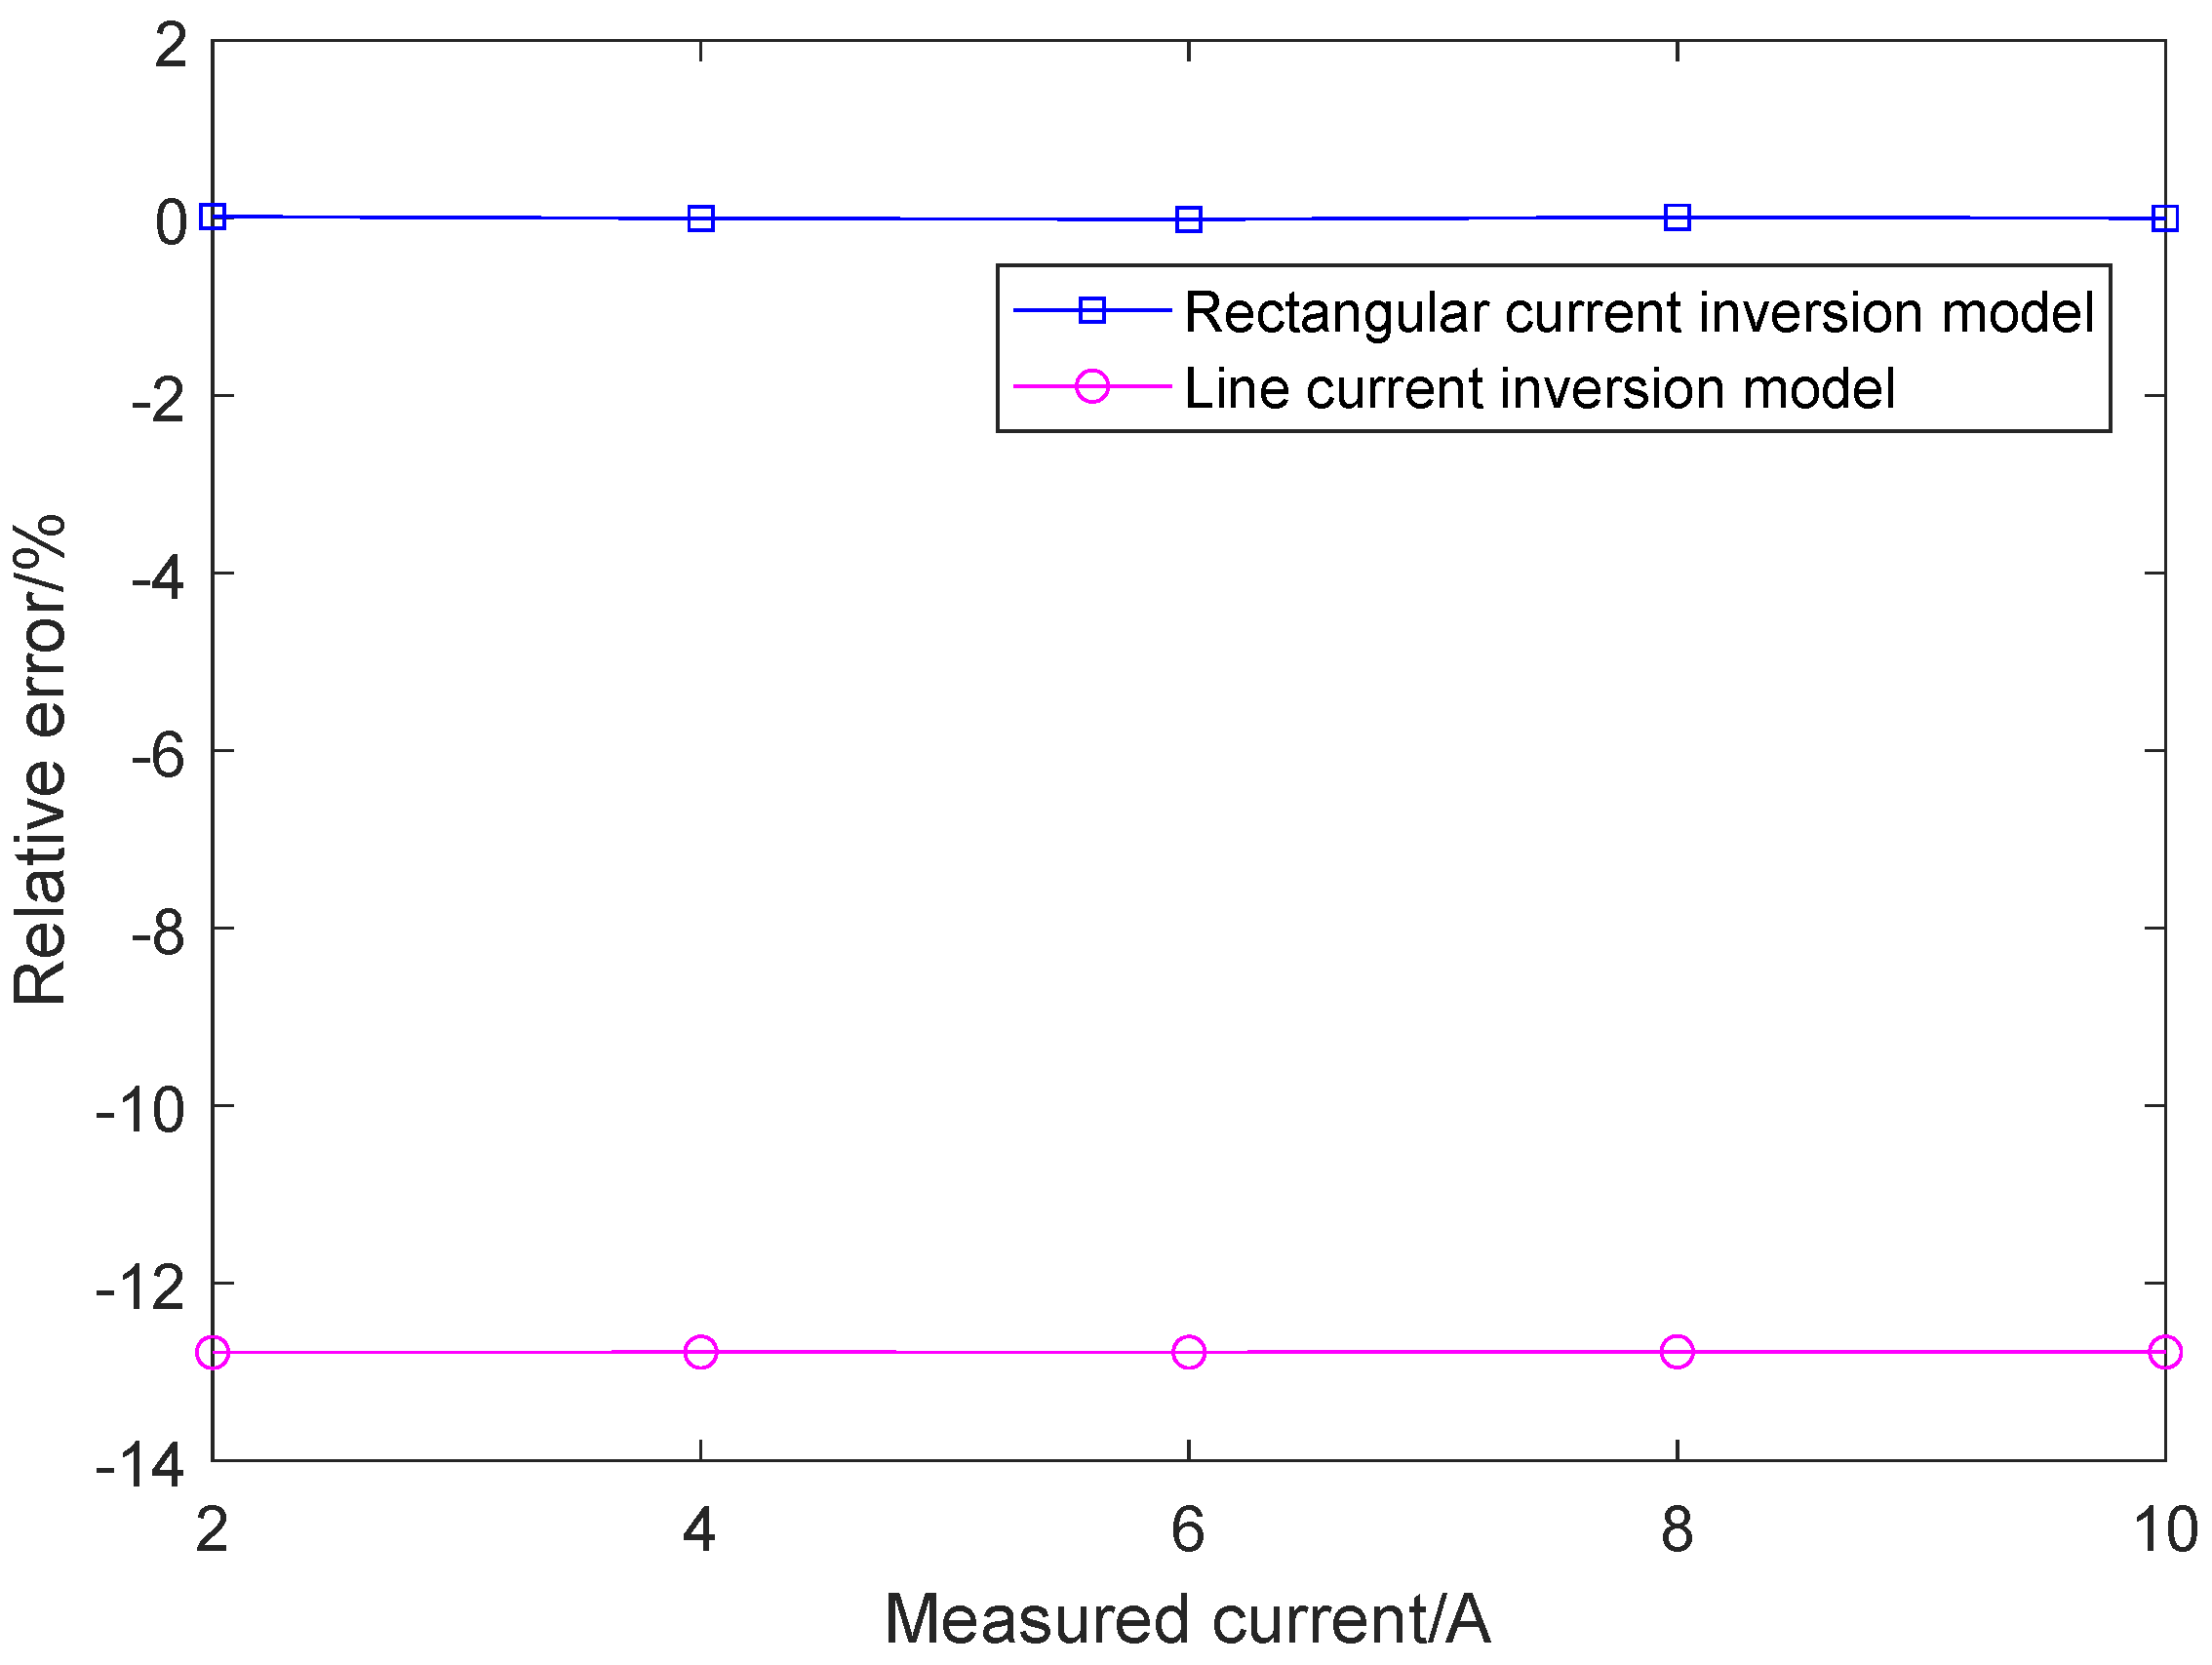
To validate the effectiveness of the rectangular busbar current inversion model proposed in this study, a comparative approach is adopted by approximating the rectangular busbar current as a line current located at its center. Based on this approximation, a line current inversion model is constructed, which contains only five unknown parameters: the measured current
I, the position of the line current
and
, and the magnitude
and orientation angle
of the geomagnetic field. Compared to the rectangular busbar inversion model, the line current model does not include the rotation angle
of the busbar. The magnetic field data computed using Equation (
19) is used as input for the current inversion models. The current amplitude inversion results obtained from both the rectangular busbar and line current models are compared, and the corresponding relative errors are shown in
Figure 5.
As shown in
Figure 5, under the condition of considering the geomagnetic field, the current amplitude error calculated using the rectangular current inversion model ranges from −0.016% to 0.015%. The relative error of the current amplitude obtained using the line current inversion model is also shown in
Figure 5. Under the condition of considering the geomagnetic field (i.e., treating both the magnitude and direction of the geomagnetic field as unknown variables), when the measured current ranges from 2 A to 10 A, the relative error of the inverted current amplitude remains approximately around −12.7%. The current measurement accuracy based on the line current inversion model is significantly inferior to that of the rectangular busbar inversion model. This is because approximating the rectangular busbar current as a line current introduces substantial errors in the forward-calculated magnetic field compared to the theoretical magnetic field, as shown in
Figure 4. Since the errors in magnetic field measurements and sensor positioning are not considered, the current inversion error is independent of the amplitude of the measured current.
5. Experimental Results and Discussion
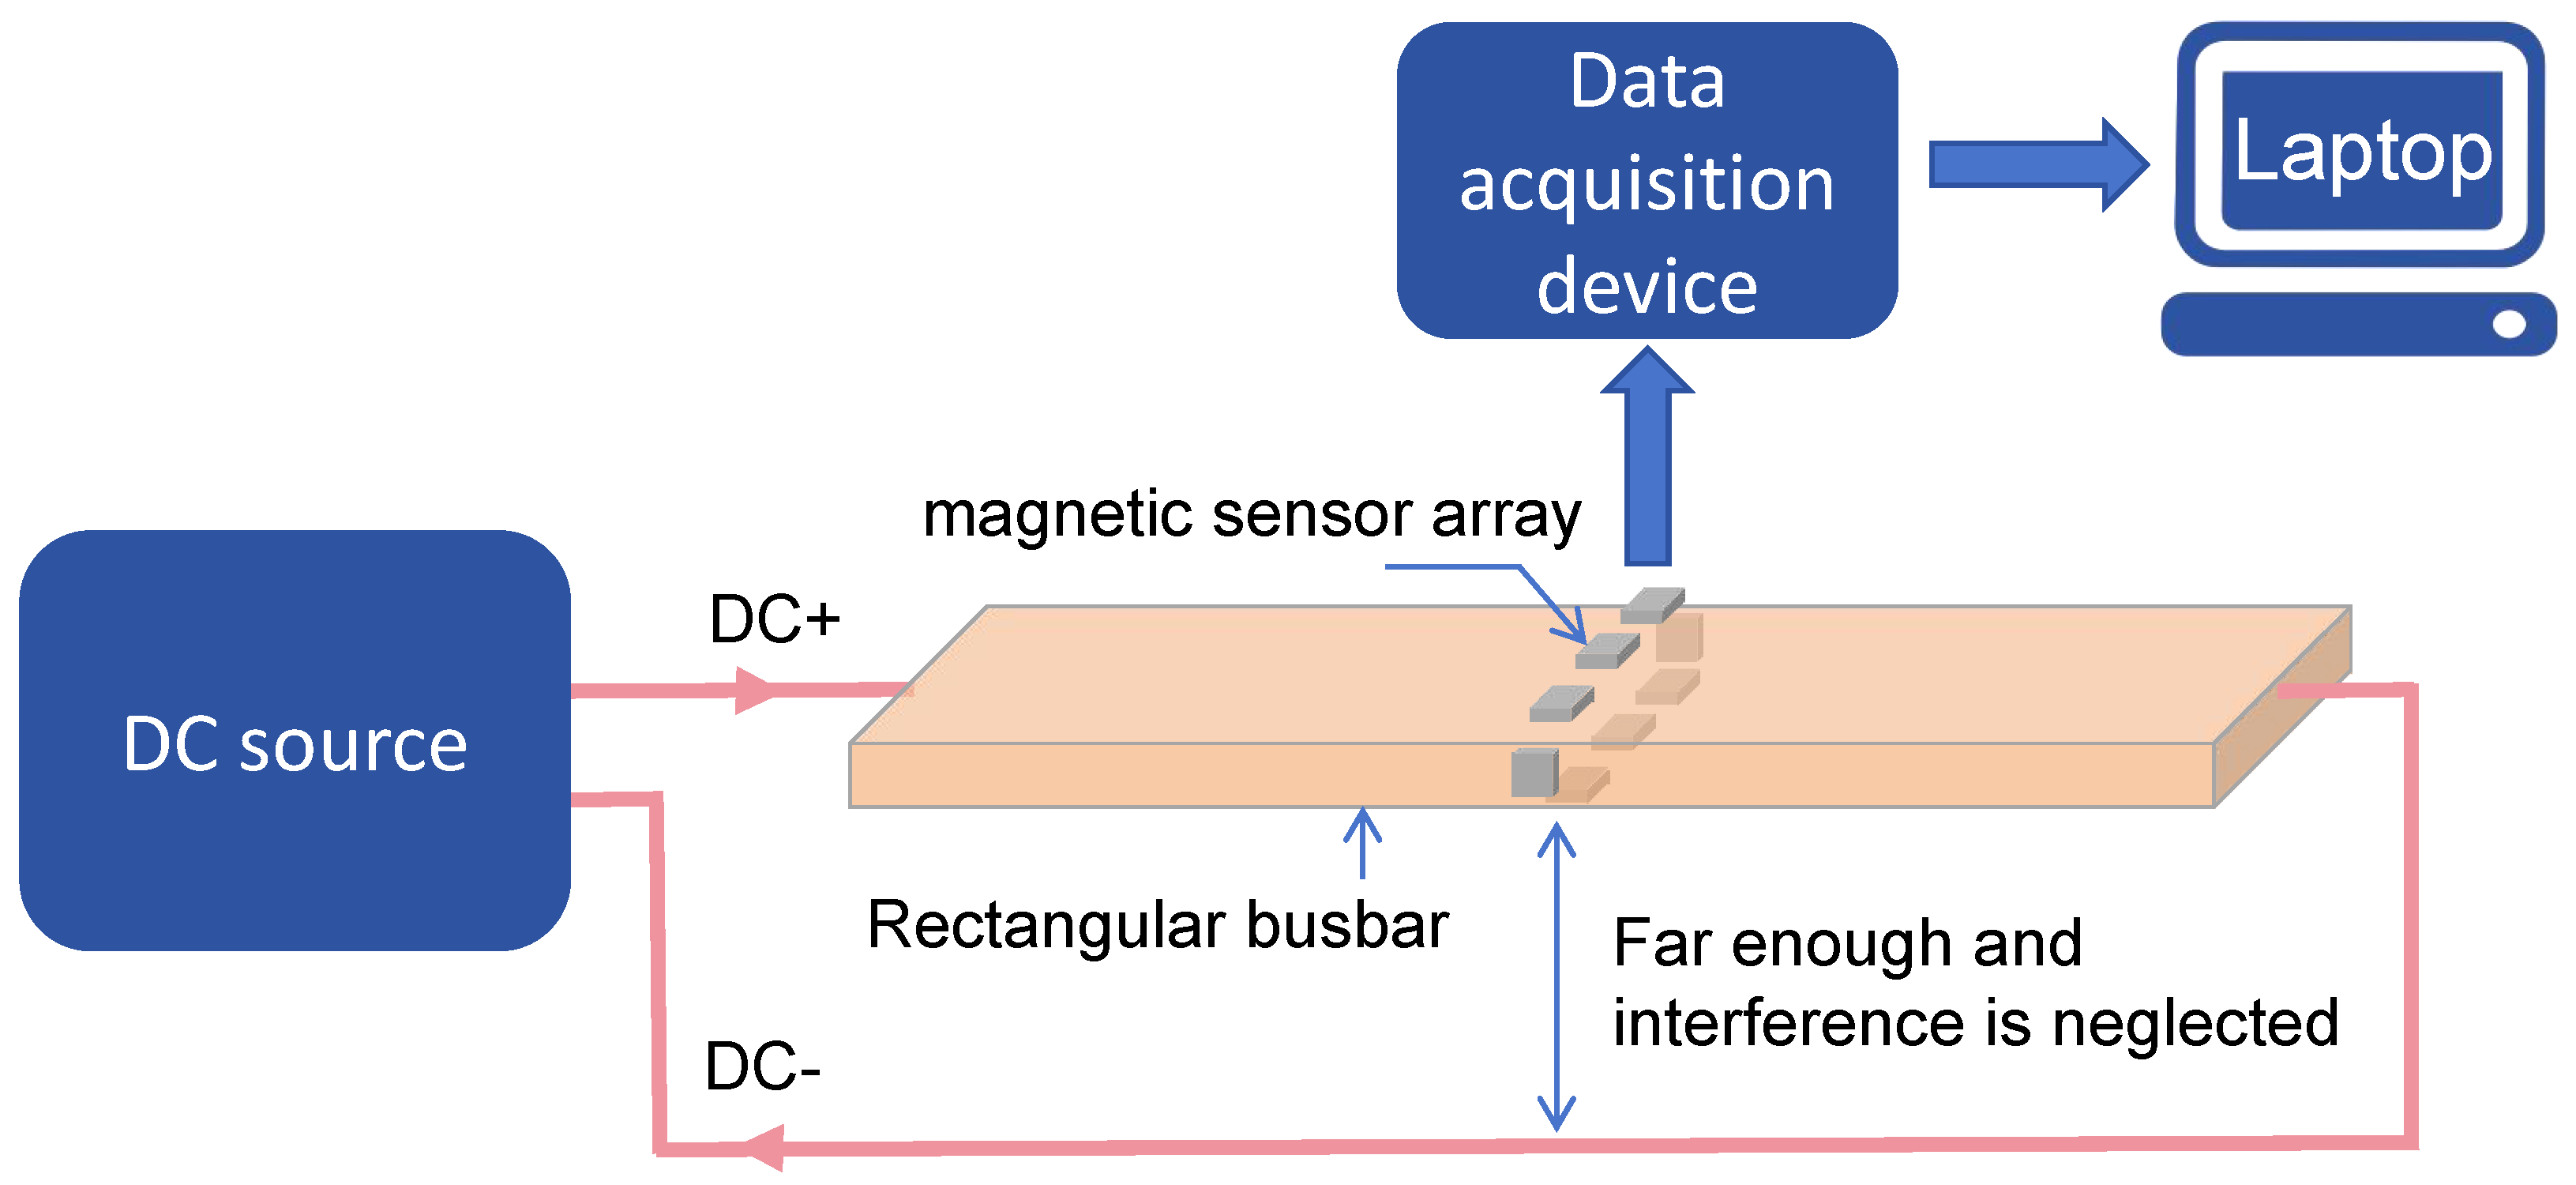
To evaluate the effectiveness of the proposed current measurement method based on magnetic field–current inversion for DC rectangular busbar, a dedicated current measurement platform is constructed and its schematic diagram is illustrated in
Figure 6. A DC source supplies current to the rectangular busbar. The resulting DC magnetic fields are detected by a magnetic sensor array. The magnetic sensor outputs are captured by a data acquisition system and transmitted to a laptop for data analysis and magnetic field–current inversion. The current loop conductors are positioned sufficiently far from the DC busbar, so their magnetic interference with the sensor array is negligible.
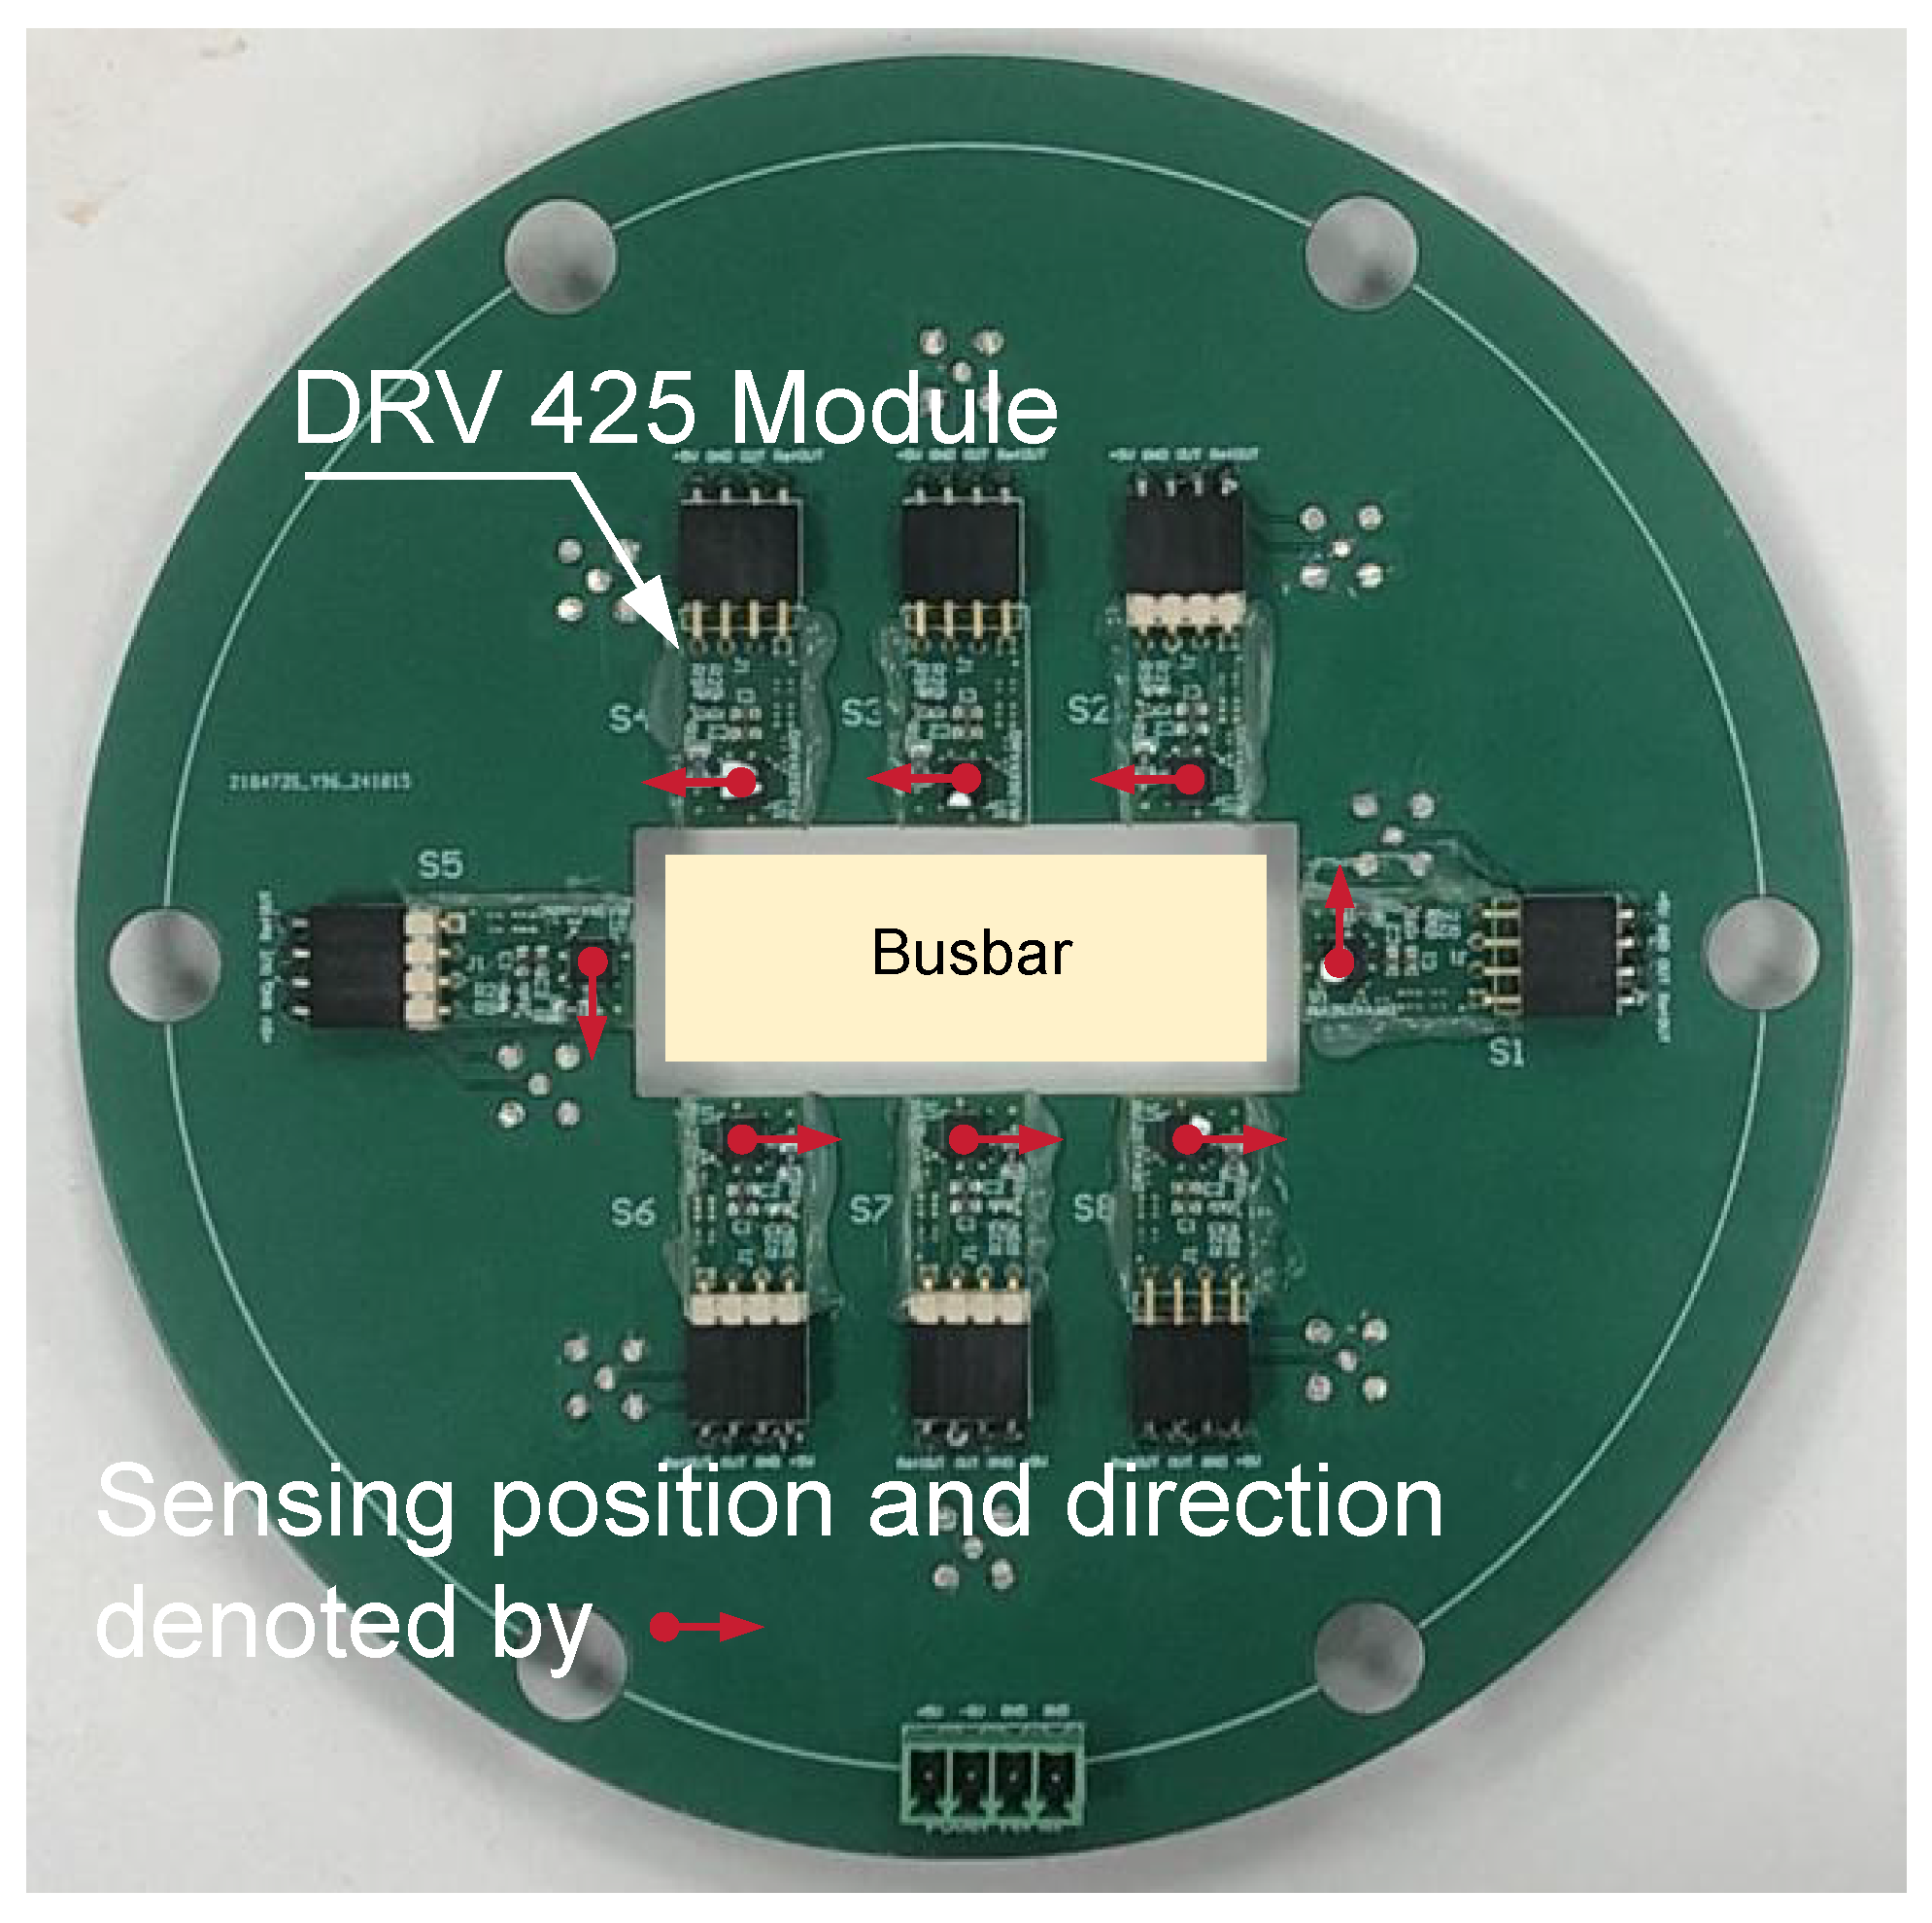
The designed magnetic sensor array is shown
Figure 7. Eight magnetic sensors are used and configured in a rectangular shape. Each magnetic sensor is obtained using a commercial fluxgate-based DRV425 evaluation module (DRV425EVM) [
28], which is a fully-integrated fluxgate magnetic sensor of DRV425 [
29] for open-loop applications. In
Figure 7, each red arrow indicates the sensing direction, and the solid dot at the tail of the red arrow denotes the sensing position of each magnetic sensor. The DRV425 has a magnetic field measurement range of ±2 mT, linearity of ±0.1%, selectable bandwidth of 47 kHz or 32 kHz, and a sensitivity temperature coefficient of approximately 7 ppm/°C. By adjusting the external circuit resistors of DRV425EVM, its magnetic field measurement range and bandwidth can be configured. In this work, the DRV425EVM is operated under a +5 V power supply. Based on its default external circuit configuration, the magnetic field measurement range is ±0.5 mT, linearity is ±0.1%, and bandwidth is 47 kHz. Actual measurements show that the temperature coefficient of the DRV425EVM is approximately 200 ppm/°C. A temperature compensation strategy can be further employed to indirectly improve the stability of magnetic field measurements and thus reduce the influence of temperature on current measurement results.
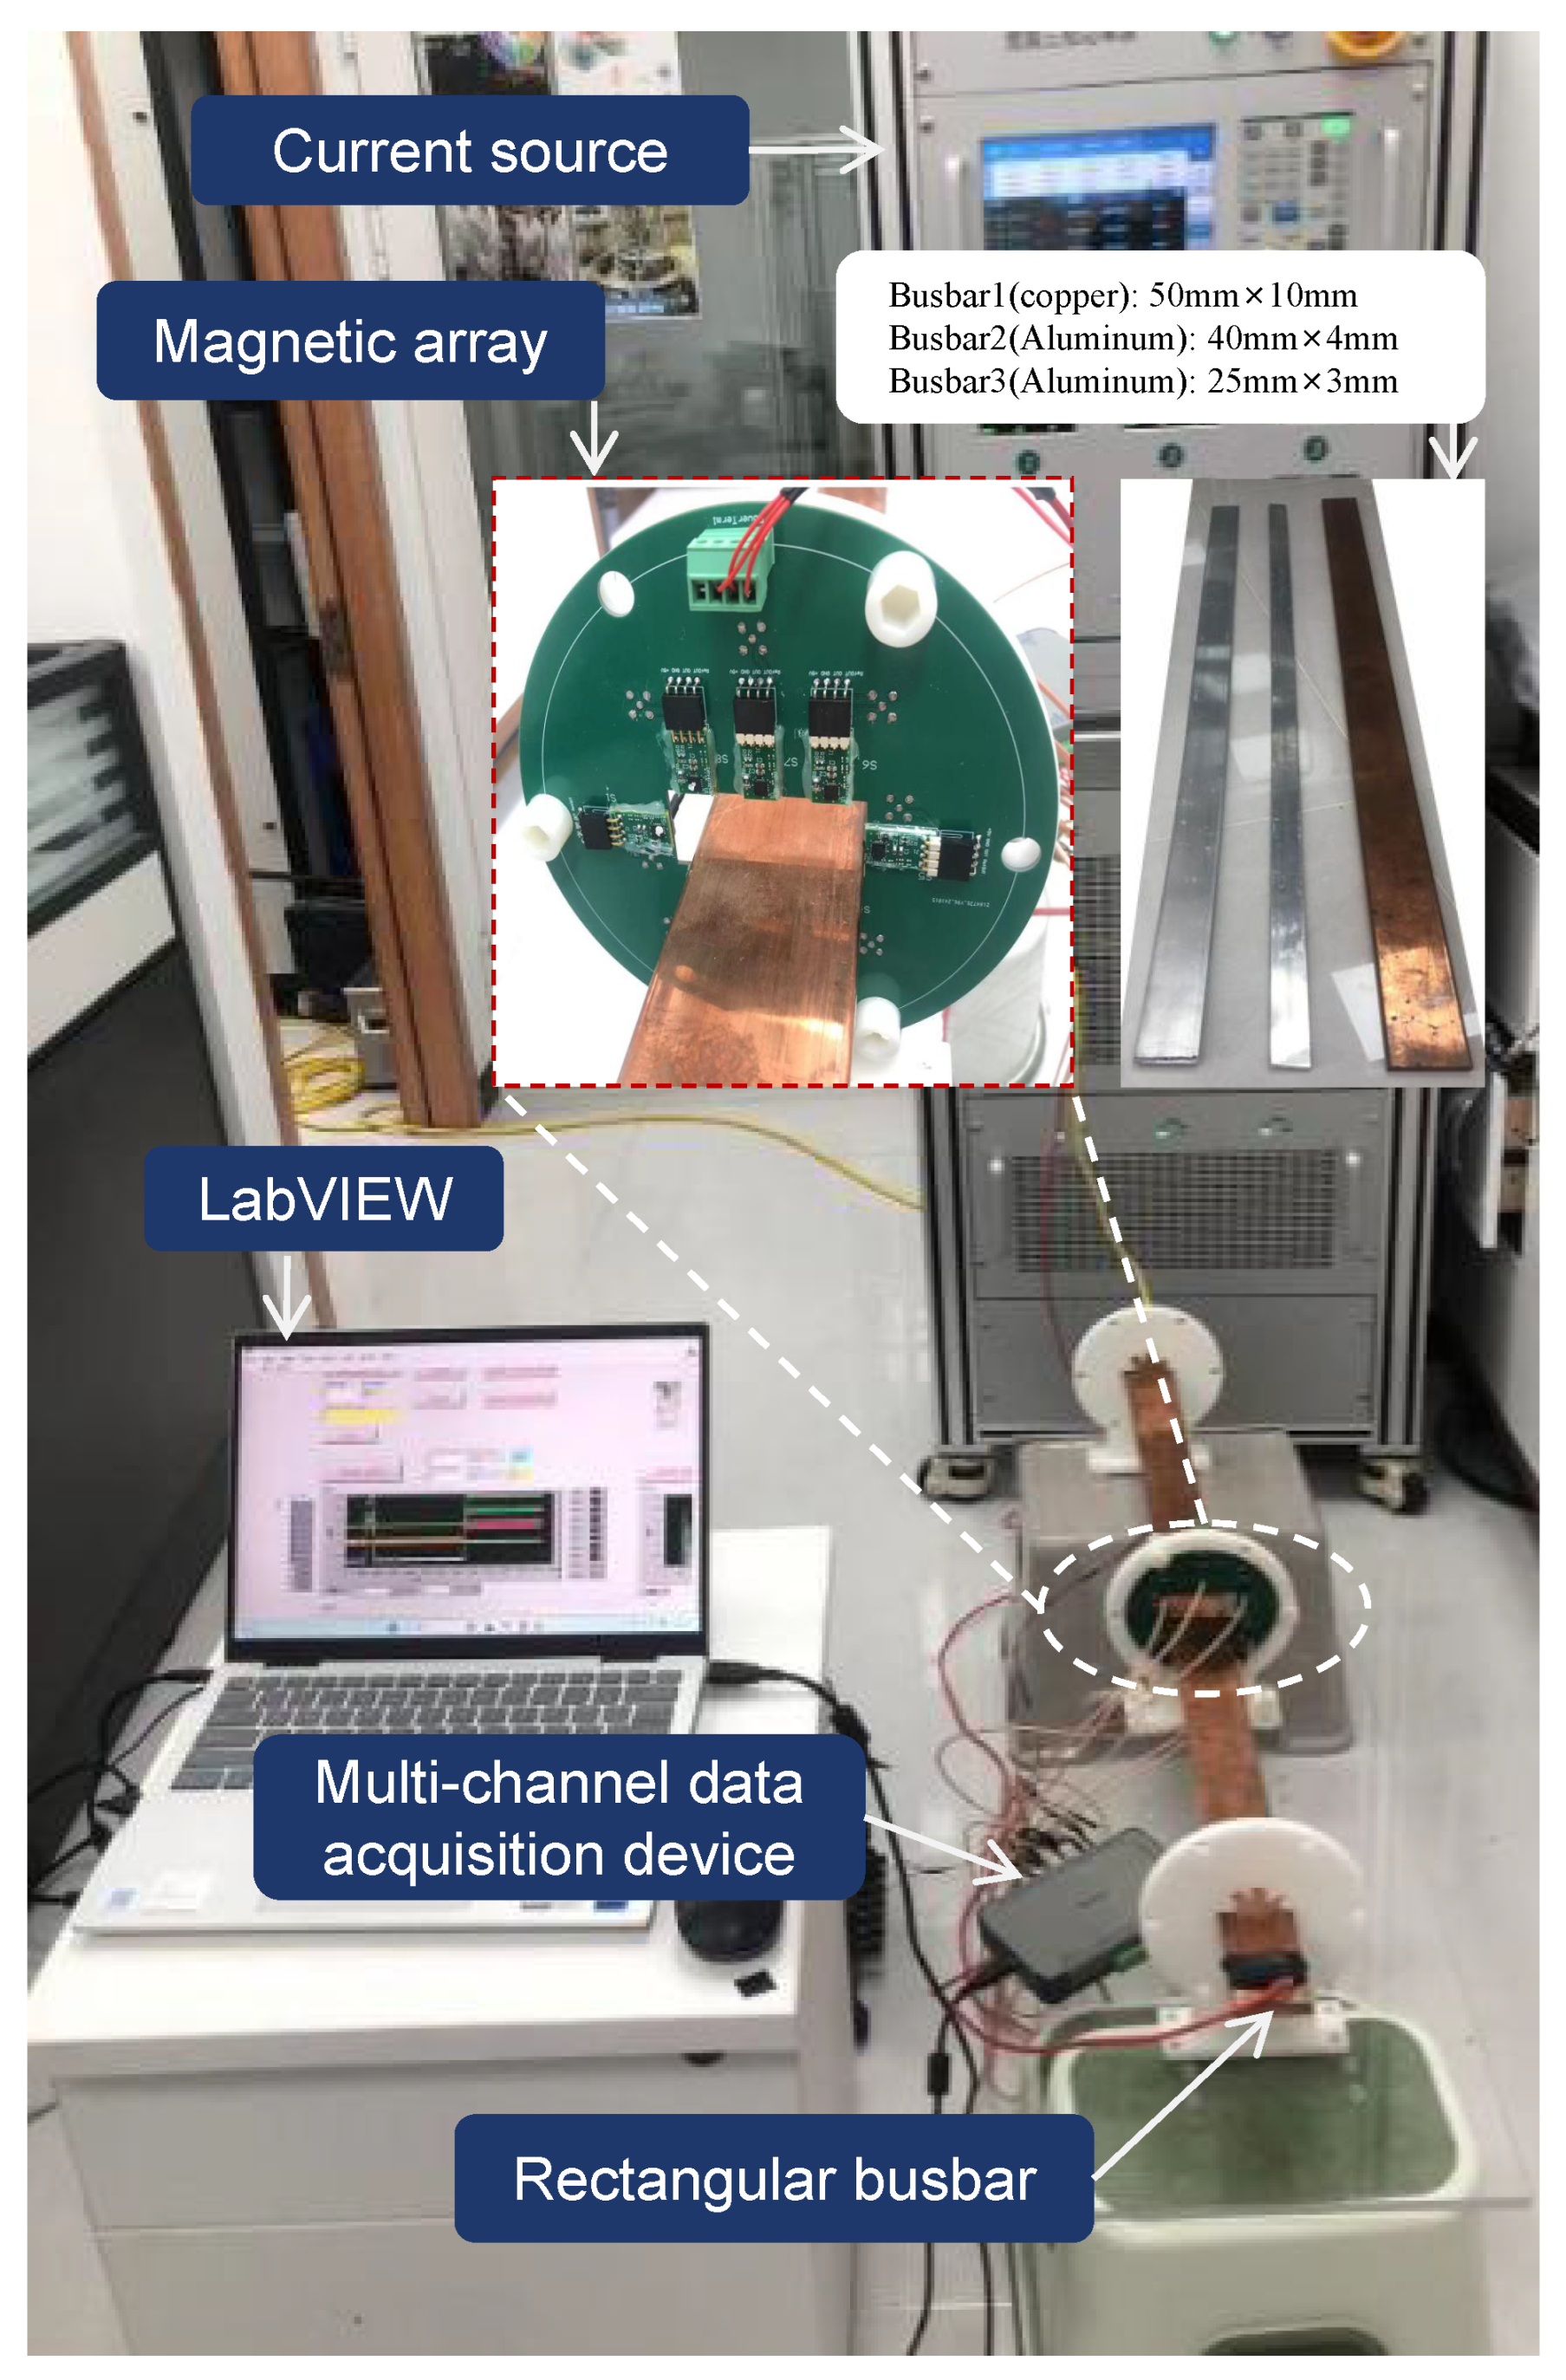
The physical current test platform is presented in
Figure 8. Three types of rectangular busbars, denoted as Busbar1, Busbar2, and Busbar3 with cross-sections of 50 mm × 10 mm (copper), 40 mm × 4 mm (aluminum), and 25 mm × 3 mm (aluminum), respectively, are used for current measurement tests, as shown in the inset of
Figure 8. The DC source used in this study is a custom-built three-phase broadband standard power source developed in the laboratory. It can output standard currents over a frequency range from DC to 2.5 kHz, with a current range of up to 10 A and an accuracy of 0.05%, providing high-accuracy reference currents for the current measurements presented in this paper. The rectangular DC busbar penetrates the designed magnetic sensor array, and the generated magnetic fields near the surface of the busbar are captured by each magnetic field sensor. The output signals from all magnetic field sensors are collected via a multi-channel synchronous acquisition board, with a sampling rate set to 1 kS/s, and the acquired signals are transmitted to the host computer. Subsequently, current inversion calculations are performed based on the collected magnetic field data and compared with the standard current value to evaluate the measurement accuracy of the proposed magnetic field–current inversion method for DC rectangular busbar.
To study the impact of different rectangular busbar installation positions on the current measurement accuracy of magnetic field–current inversion, three relative positions between the measured DC rectangular busbar and the magnetic field sensor array are defined as follows: a small eccentricity and deflection (denoted as
Pos1), significant eccentricity with small deflection (
Pos2), and significant eccentricity and rotation (
Pos3). The corresponding eccentric positions and rotation angles are shown in
Table 3. For each of the three types of busbars (as shown in the inset of
Figure 8) under different installation conditions, the current source outputs current with a step size of 2 A in the range from 2 A to 10 A. For each measured current, five repetitions of the magnetic field–current inversion calculations are conducted.
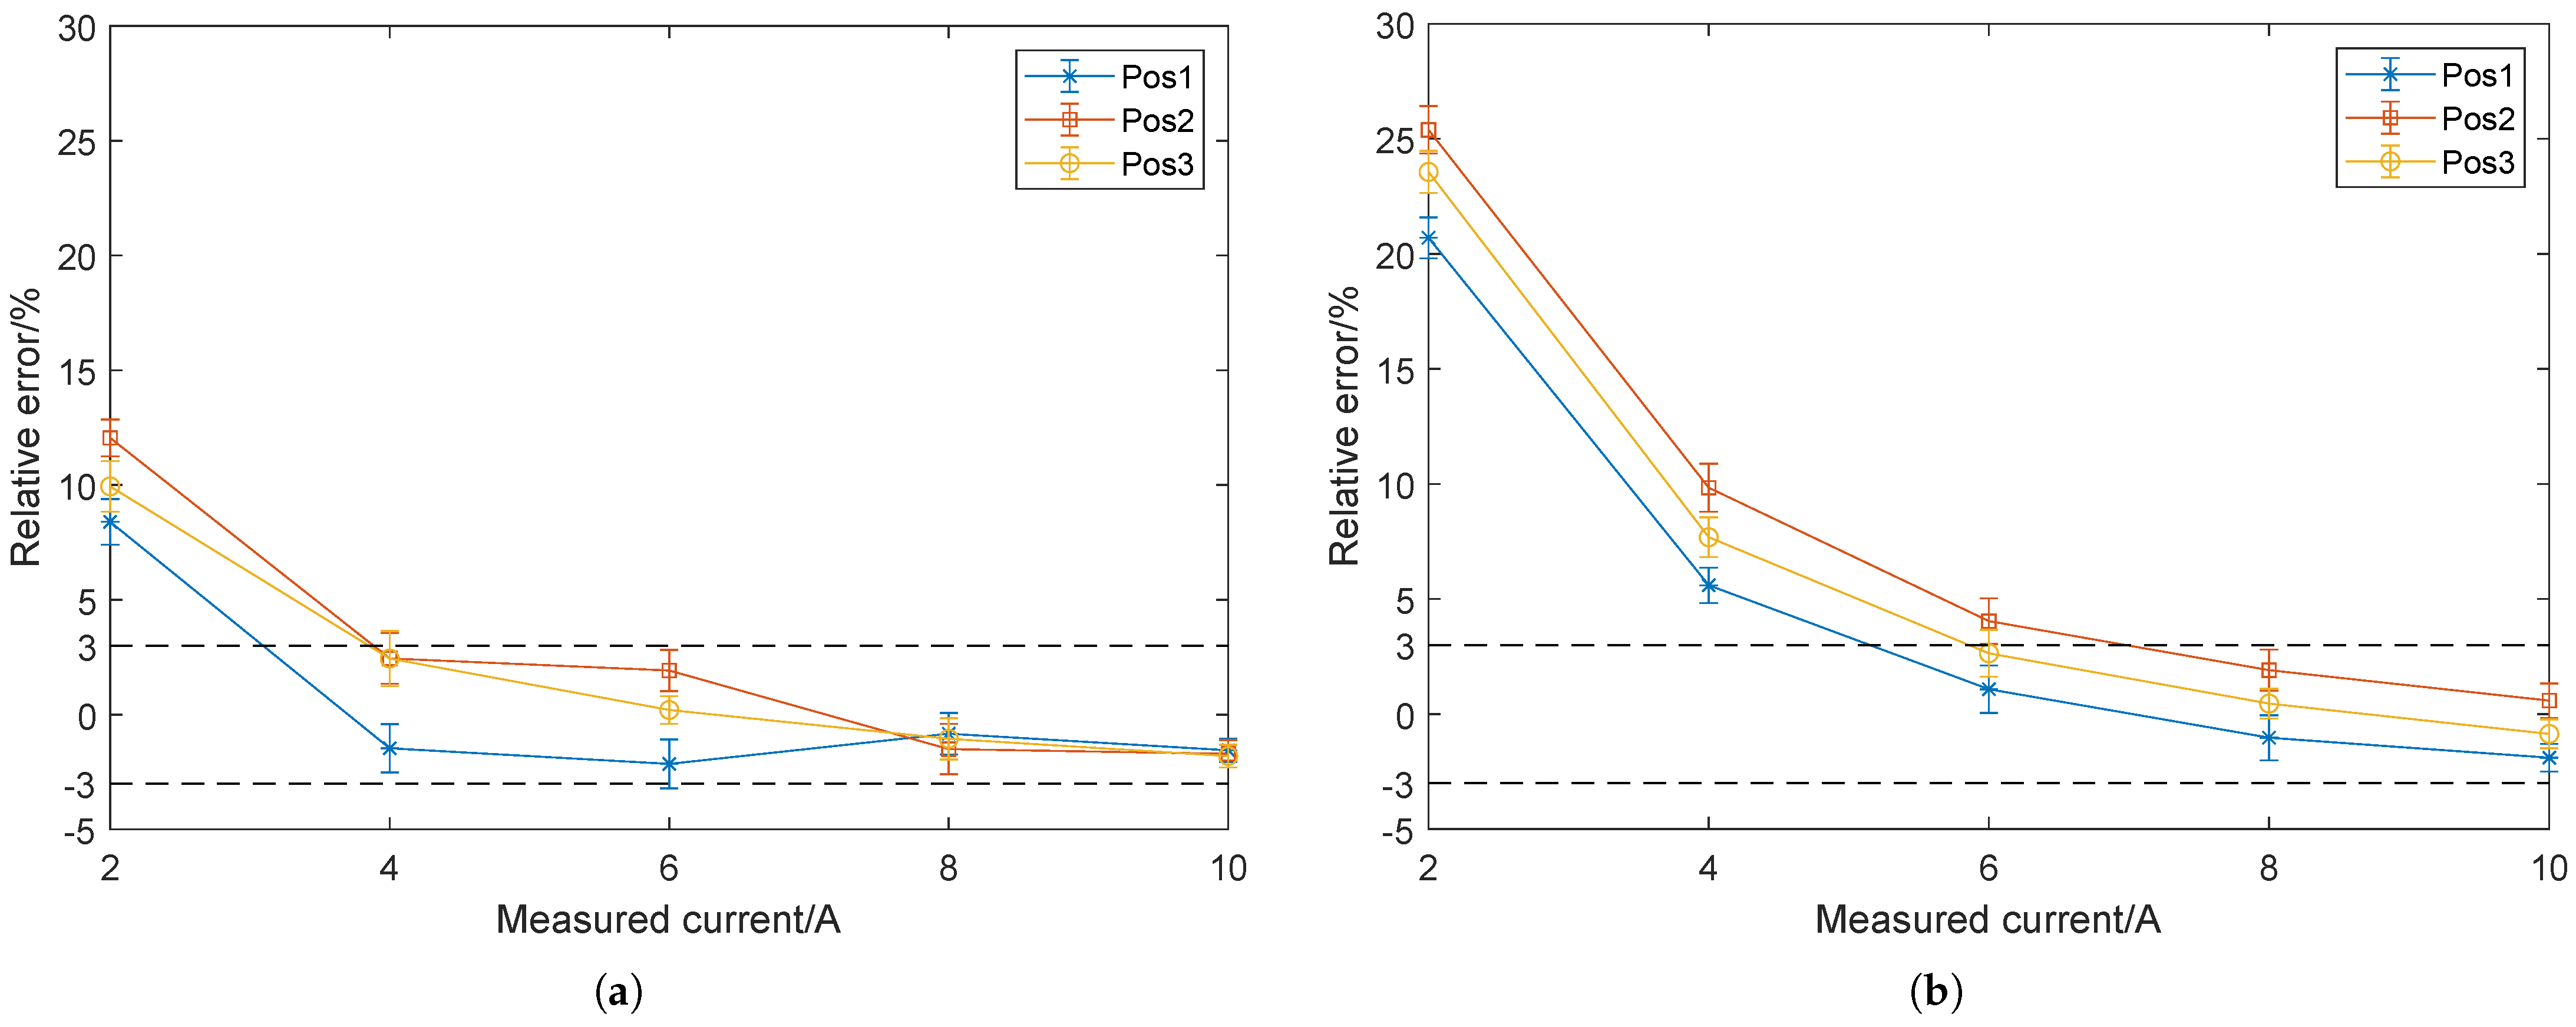
The current measurement results for Busbar1 (50 mm × 10 mm) are presented in
Figure 9 using the measured magnetic fields by all the magnetic sensors. When geomagnetic field
and direction angle
are also treated as optimization variables, the current inversion results are shown in
Figure 9a. From the figure, it can be observed that, under the three different rectangular busbar installation positions, the trend of current measurement error remains consistent: when the measured current is 2 A, the measurement error is about 10%, while, for the current range of 4 A to 10 A, the measurement error remains within 3%.
When the magnetic field–current inversion model does not consider the geomagnetic field, i.e., the variables
and
are set to zeros, the current measurement error still shows a gradually decreasing trend. However, when the measured current is 2 A and 4 A, the measurement errors reach 20% and 8%, respectively, significantly higher than the corresponding errors in
Figure 9a. This indicates that the interference effect of the geomagnetic field is significant when measuring small currents, and larger magnetic field–current inversion errors occur when measuring small currents. This validates that the proposed magnetic field–current inversion model, which considers the geomagnetic field, can effectively decouple the geomagnetic field. Through magnetic field–current inversion, the calculated geomagnetic field
and its angle
are approximately 0.3 Gs and
, respectively. For the given measured current, through repetitive current measurements, the magnetic field–current inversion error varies within a range of ±1%.
As a result, the magnetic field–current inversion method proposed in this paper results in larger current measurement errors when the measured current is small. As seen in
Figure 9a, the current measurement error reaches approximately 10%. This is because, during small current inversion, the signal-to-noise ratio (SNR) of the magnetic field sensors is low, leading to larger magnetic field measurement errors. When the measured current is small, the relative error increases significantly. However, when the measured current increases, the magnetic field sensors exhibit a higher SNR, and the relative current measurement error of the corresponding measured current decreases significantly.
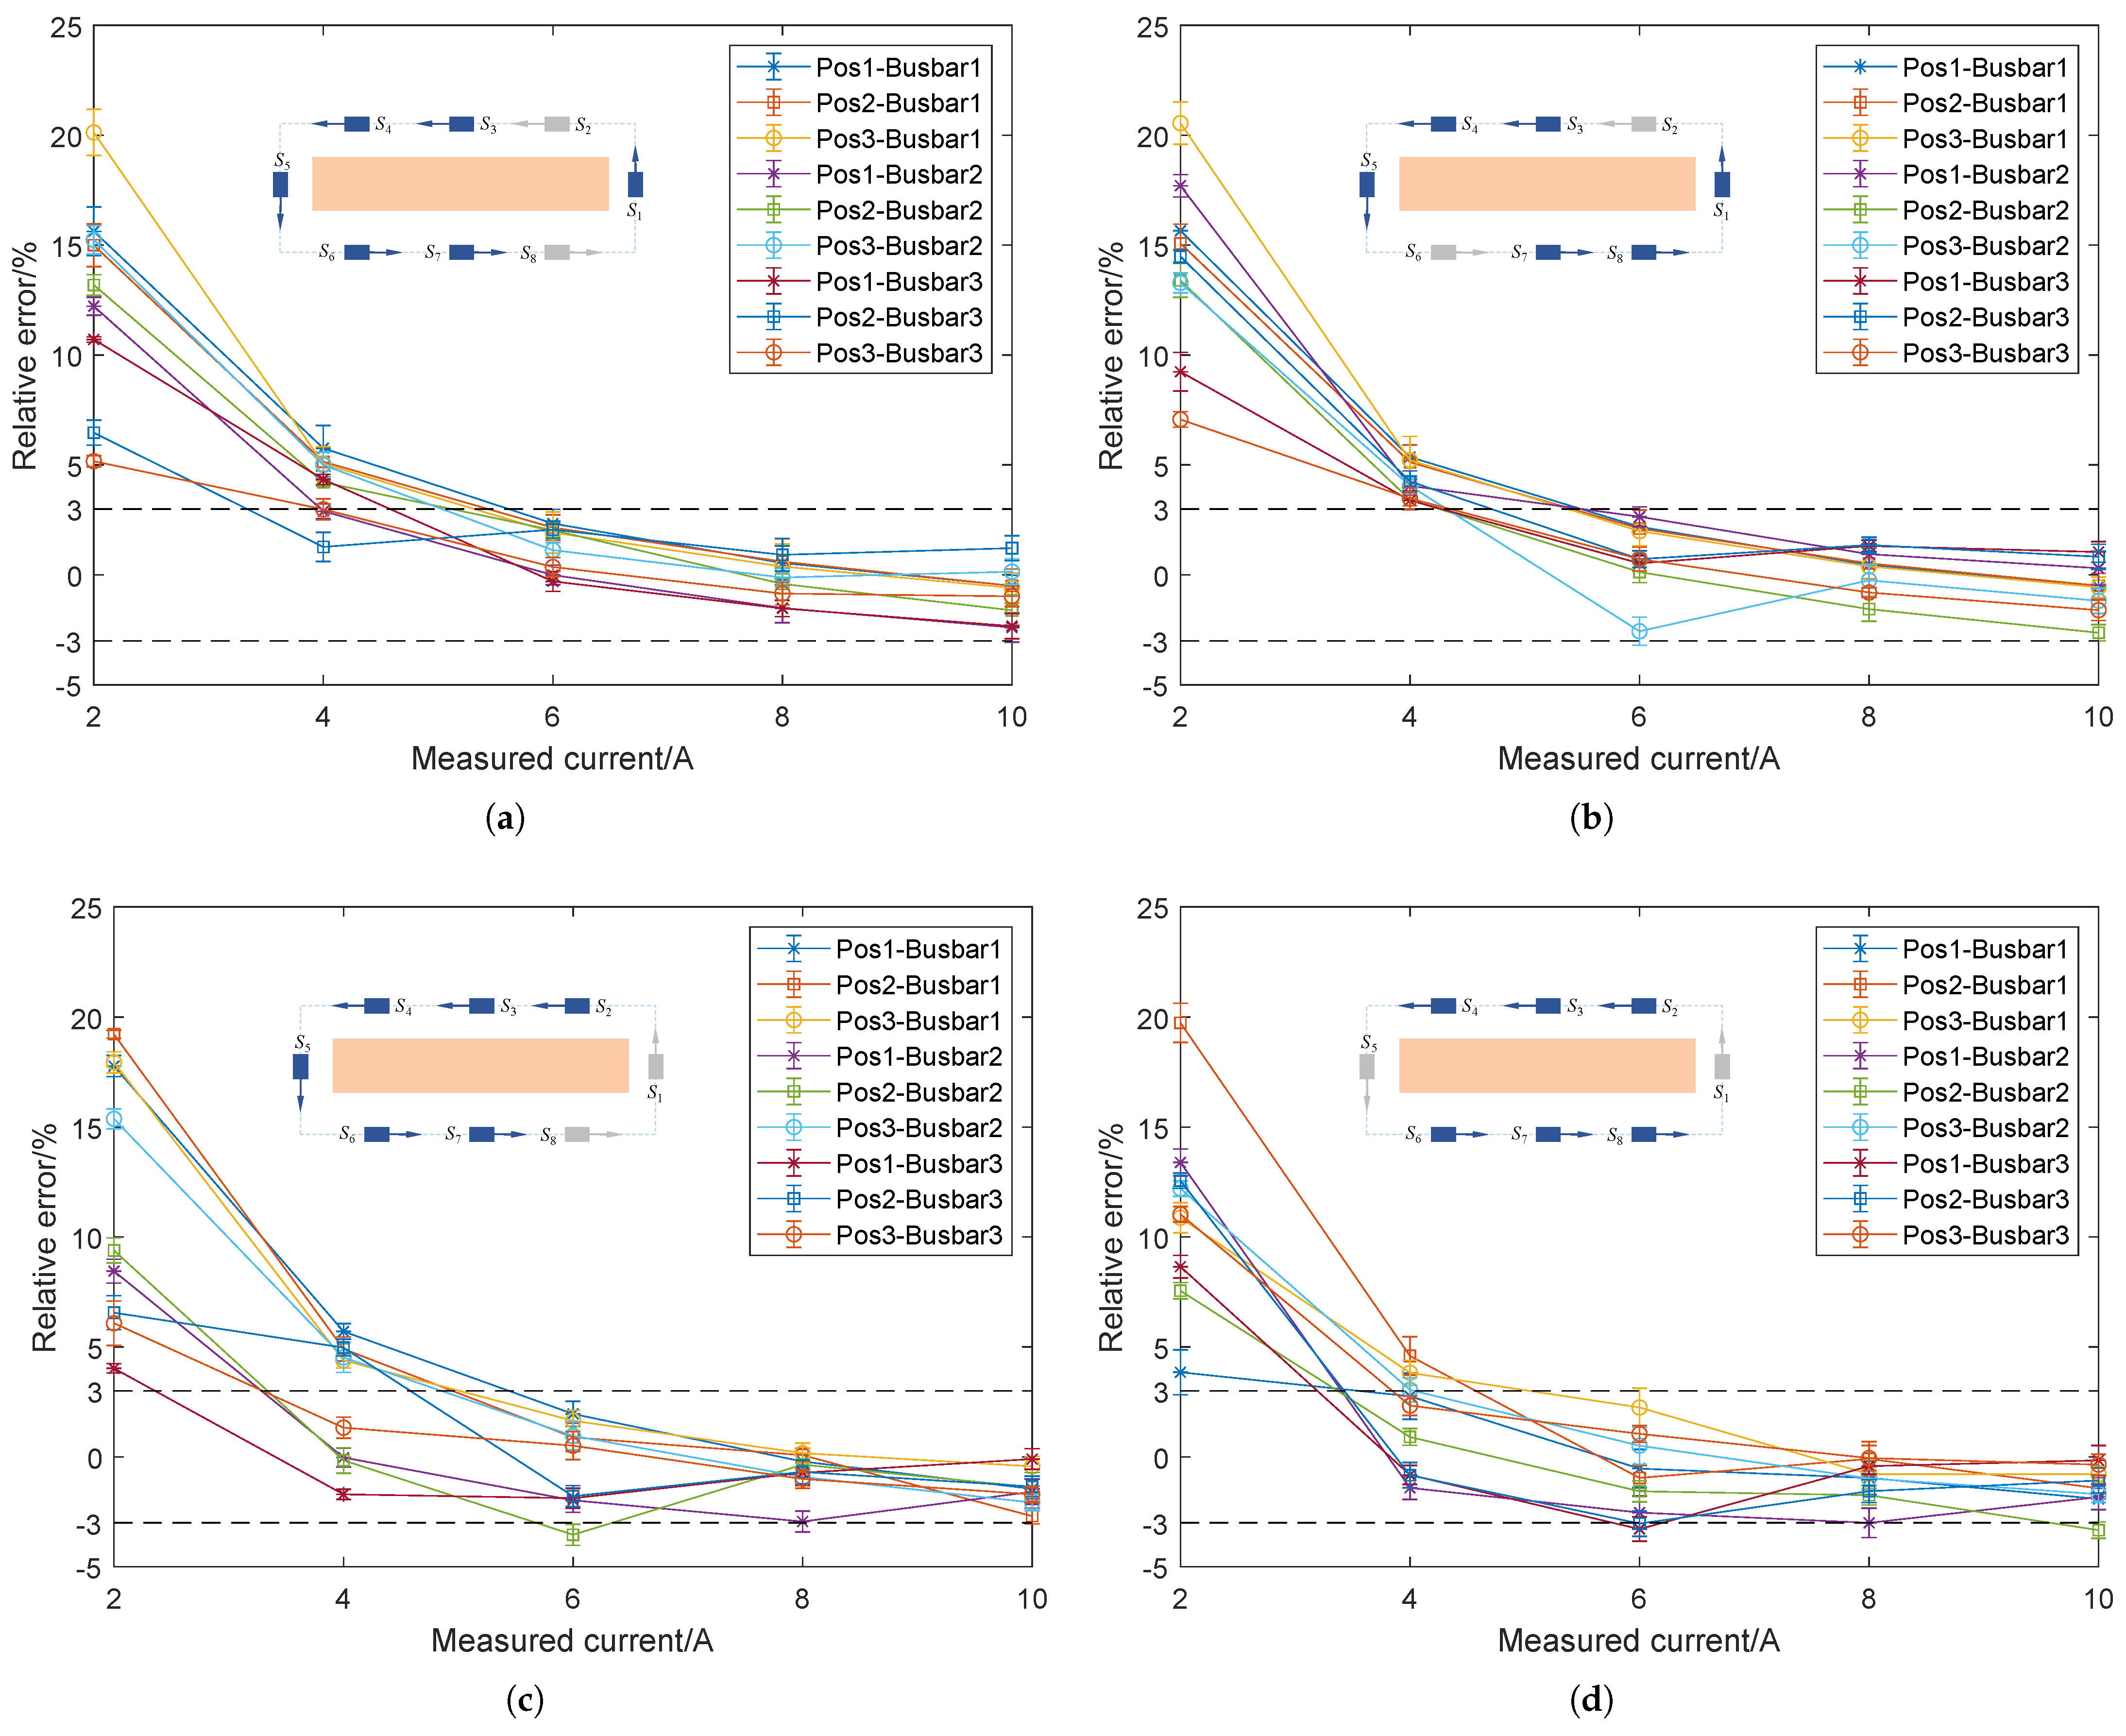
In addition, this paper also investigates the impact of the magnetic field sensor array structure on the accuracy of magnetic field–current inversion for rectangular busbars with different cross-sections. To construct sufficient equation systems and accurately invert the measured current, at least six magnetic field sensors are required. Therefore, six magnetic field sensors are used in this paper, and different array structures are constructed for current inversion. As shown in
Figure 10a, the selected magnetic field sensors are
,
,
,
,
, and
, with the corresponding array structure illustrated in the inset of
Figure 10a. The relevant results are shown in
Figure 10 for Busbar1 (copper, 50 mm × 10 mm), Busbar2 (aluminum, 40 mm × 4 mm), and Busbar3 (aluminum, 25 mm × 3 mm) under different installation positions. The current inversion error shows a gradually decreasing trend. For all the tested busbars, when the measured current is 2 A, the current measurement errors are relatively high, at an approximately level of 10%. Although these errors are higher than those obtained when all magnetic field sensors are used for current inversion, as shown in
Figure 9a, the current measurement error remains within 3% in the current range of 4 A to 10 A. For other array structures, as shown in
Figure 10b–d, the current measurement error exhibits a similar trend of variation.
The number of magnetic field sensors and the array structure have a certain impact on the accuracy of magnetic field–current inversion. Increasing the number of magnetic field sensors can improve the accuracy of magnetic field–current inversion, as shown in
Figure 9a and
Figure 10a. An important advantage of the magnetic field–current inversion method proposed in this paper is that, even when the magnetic field sensor array does not form a fully closed-loop structure, current inversion accuracy close to that of a fully closed-loop structure can still be achieved. For example, the array structure in
Figure 10d uses only sensors
,
,
,
,
, and
. This non-closed-loop array structure design allows for direct on-site installation, which effectively simplifies the installation process and reduces complexity.
Due to the limitation of the standard DC source used in this work, current measurements of only up to 10 A are conducted, to verify the effectiveness of the proposed field-to-source inversion method. For DC measurements, there is a linear relationship between the measured current and the detected magnetic field. Therefore, the measurable current range is determined by the magnetic field measurement range of the magnetic sensors. In this study, the DRV425EVM has a magnetic field measurement range of ±0.5 mT. Based on the designed magnetic sensor array, the maximum measured magnetic field at 10 A is approximately 0.15 mT, as shown in
Figure 4. Thus, within the ±0.5 mT range, the measurable current is limited to approximately 80 A. To further extend the measurable current range, magnetic sensors with larger ranges and better linearity can be selected for sensor array design. As the measured current increases, the signal-to-noise ratio of the magnetic field measurement will significantly improve, and the current measurement error is expected to remain within 3%.
6. Conclusions
This paper addresses the non-contact measurement of DC in rectangular busbars based on magnetic field–current inversion. An analytical model is developed to characterize the magnetic field distribution on the surface of a DC rectangular busbar, taking into account the effects of busbar eccentricity, rotation, and the geomagnetic field. Leveraging this model, the DC current is estimated by minimizing the discrepancy between the measured magnetic field from a magnetic sensor array and the analytically computed forward magnetic field. Simultaneously, the model enables the estimation of the busbar’s eccentric displacement, rotation angle, and ambient geomagnetic field, thereby compensating for their influence on the inversion accuracy. The proposed approach is validated through comprehensive simulations and experimental tests. The main contributions are summarized as follows:
First, when all magnetic field sensors are used for magnetic field–current inversion, the current measurement error decreases as the measured current increases. Specifically, when the measured current is below 2 A, the measurement error is on the order of approximately 10%. As the current gradually increases within the range of 4 A to 10 A, the error significantly decreases and stabilizes within 3%. The primary reason is that, at low current levels, the magnetic sensors exhibit a low signal-to-noise ratio, leading to higher magnetic field measurement errors, which in turn reduce the accuracy of the magnetic field–current inversion. This phenomenon also reflects a common limitation in sensor accuracy when measuring weak signals.
Second, the study shows that the geomagnetic field affects the accuracy of magnetic field–current inversion. When the inversion model does not account for the geomagnetic field, significant interference occurs at measured currents below 2 A, resulting in a considerable increase in magnetic field–current inversion error. In contrast, incorporating the geomagnetic field into the model effectively suppresses this error. For higher current measurements (4 A to 10 A), the influence of the geomagnetic field becomes less significant, and the magnetic field–current inversion error remains within 3% even without considering the geomagnetic field.
Finally, the proposed magnetic field–current inversion method for DC rectangular busbars enables the flexible design of the magnetic sensor array configuration while maintaining comparable current measurement accuracy across different array arrangements. This method does not rely strictly on a fully closed-loop sensor structure; instead, by employing an open-loop sensor array, it significantly reduces installation complexity and engineering implementation difficulty without compromising measurement accuracy.
In conclusion, this paper investigates the field-source inversion problem for DC rectangular busbars and presents a practical non-contact current measurement approach that accounts for busbar eccentricity, rotation, and geomagnetic interference. Experimental results demonstrate that the method achieves a current measurement accuracy of approximately 3%, which meets the requirements for monitoring the operating state of DC rectangular busbars. Future work will concentrate on precisely calibrating magnetic sensor positions and developing high-accuracy magnetic field–current inversion algorithms to improve measurement accuracy further.


 and
and 
