
A Fully Coupled Numerical Simulation Model for Bottom-Water Gas Reservoirs Integrating Horizontal Wellbore, ICD Screens, and Zonal Water Control: Development, Validation, and Optimization Strategies

Abstract
1. Introduction
2. Development and Solution of Fully Coupled Numerical Simulation Model for Horizontal Wellbore–ICD Screen–Zonal Water Control Completion
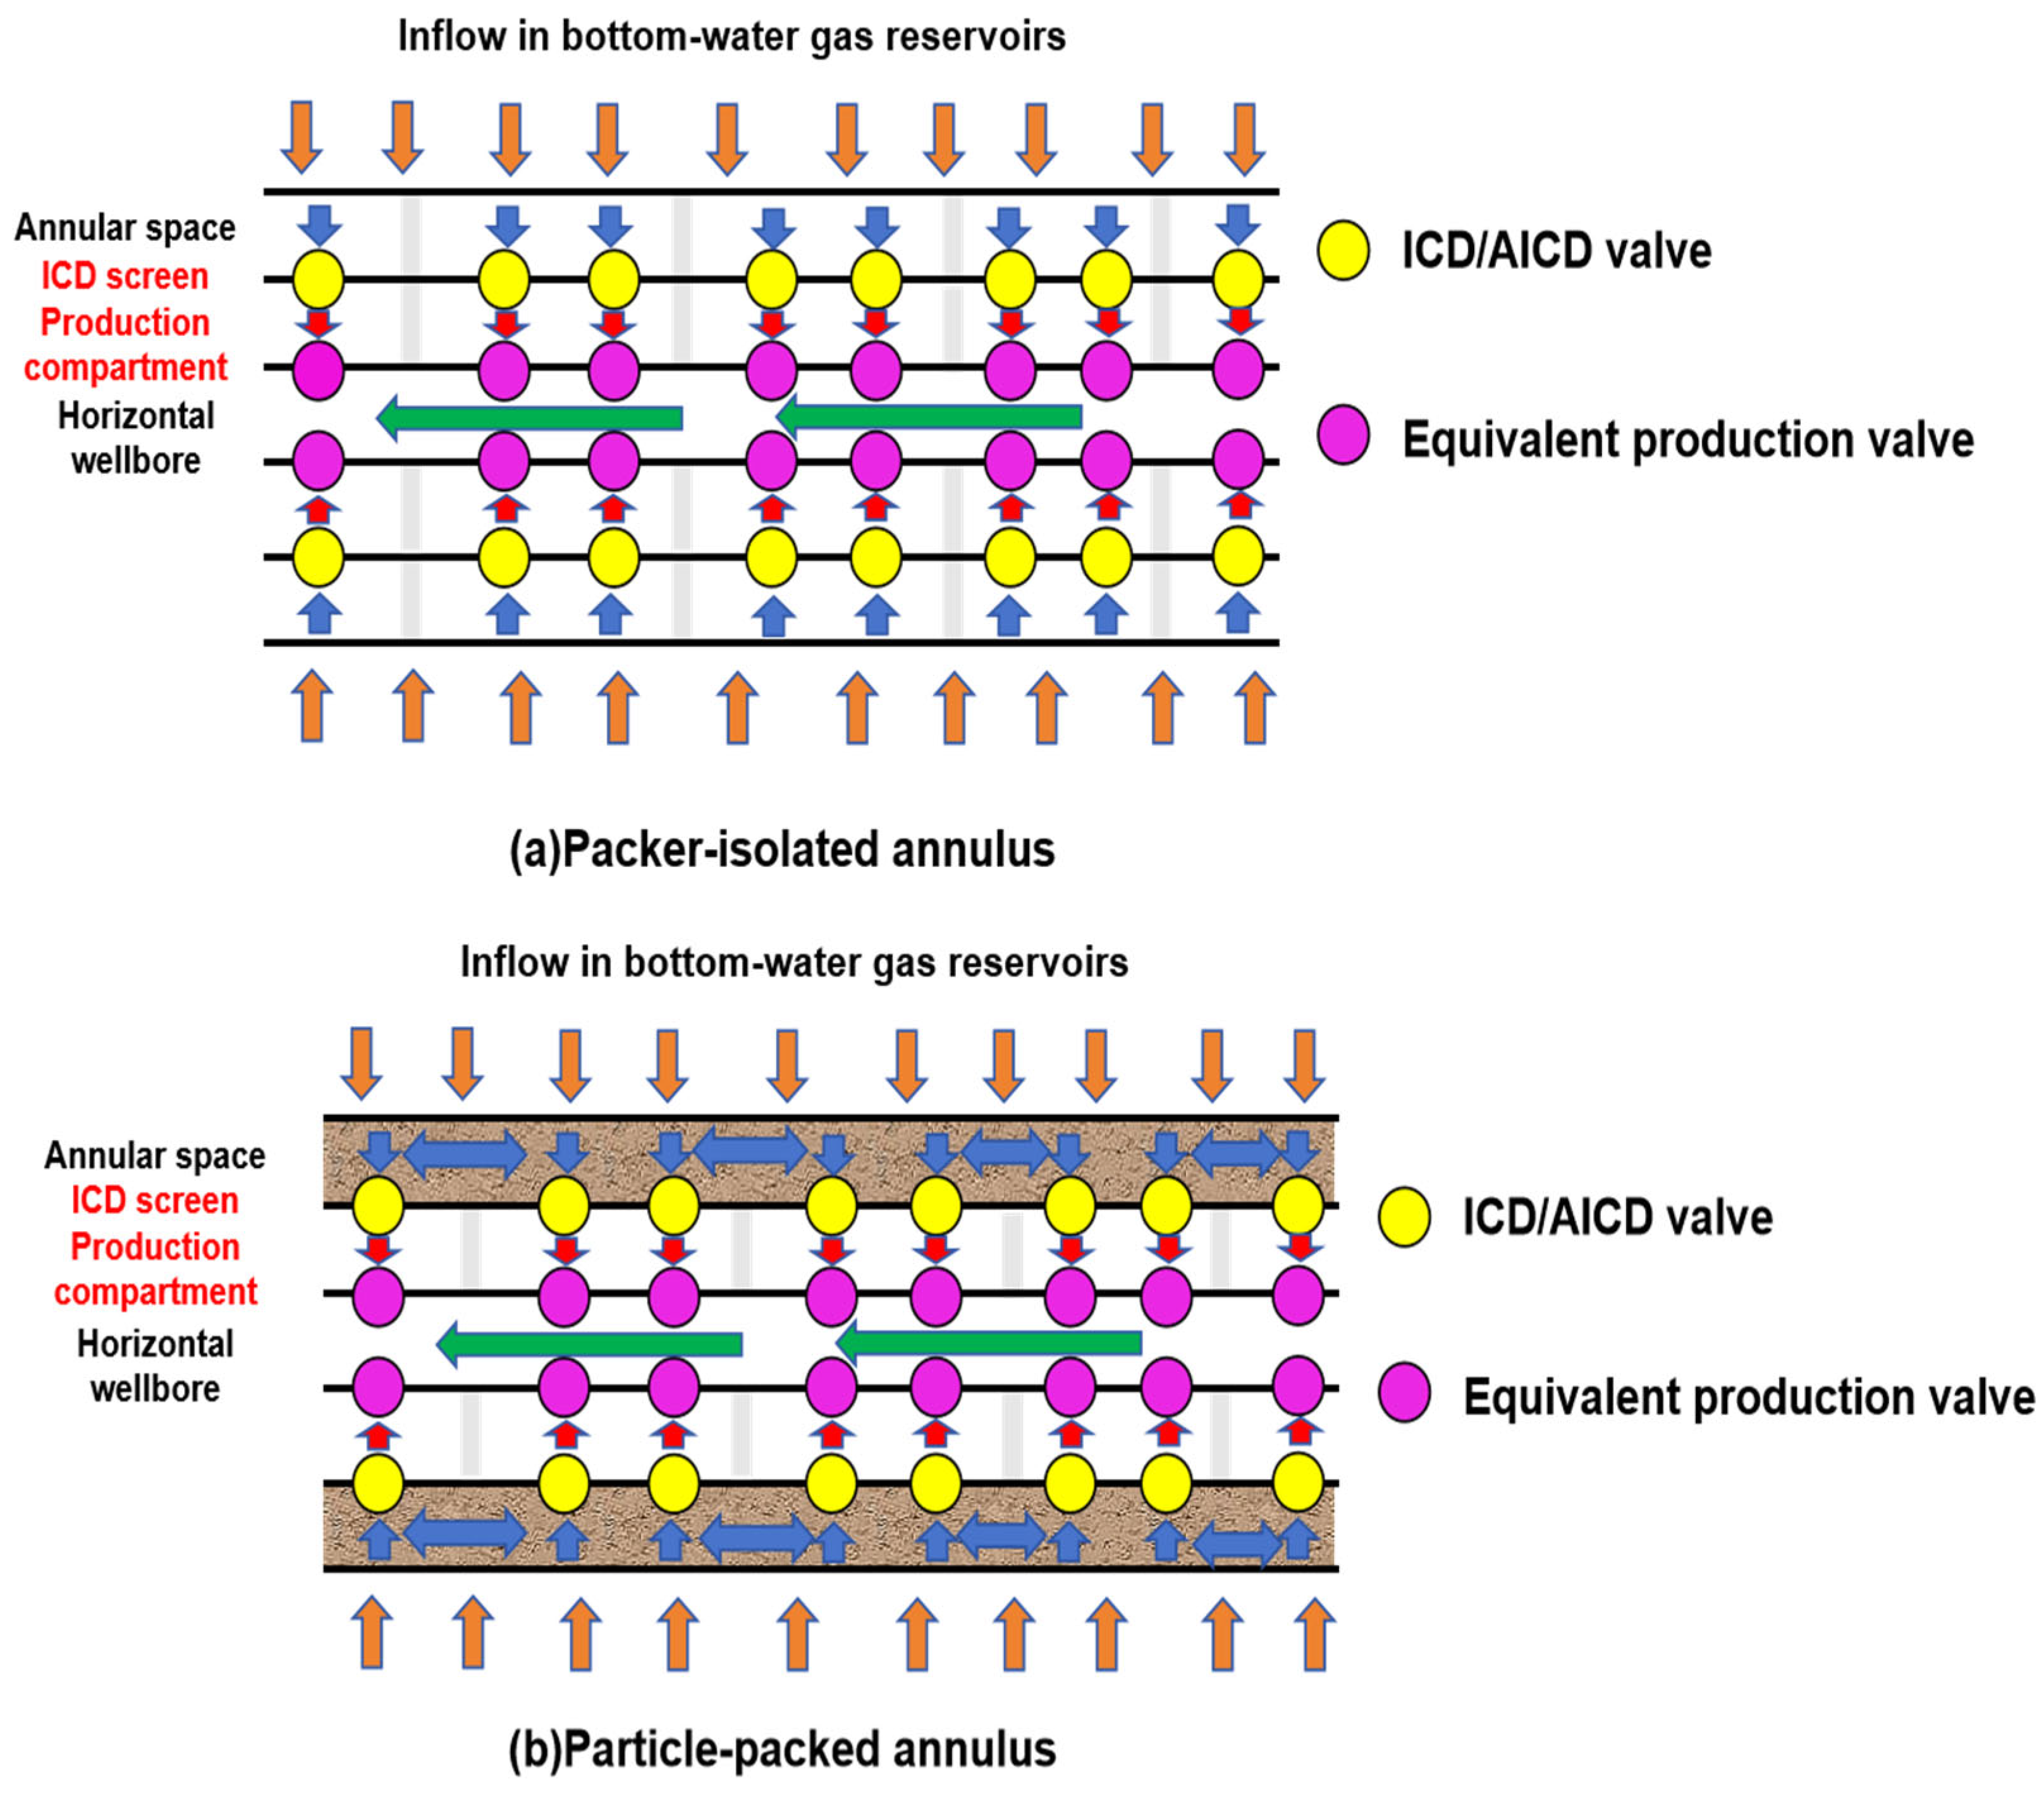
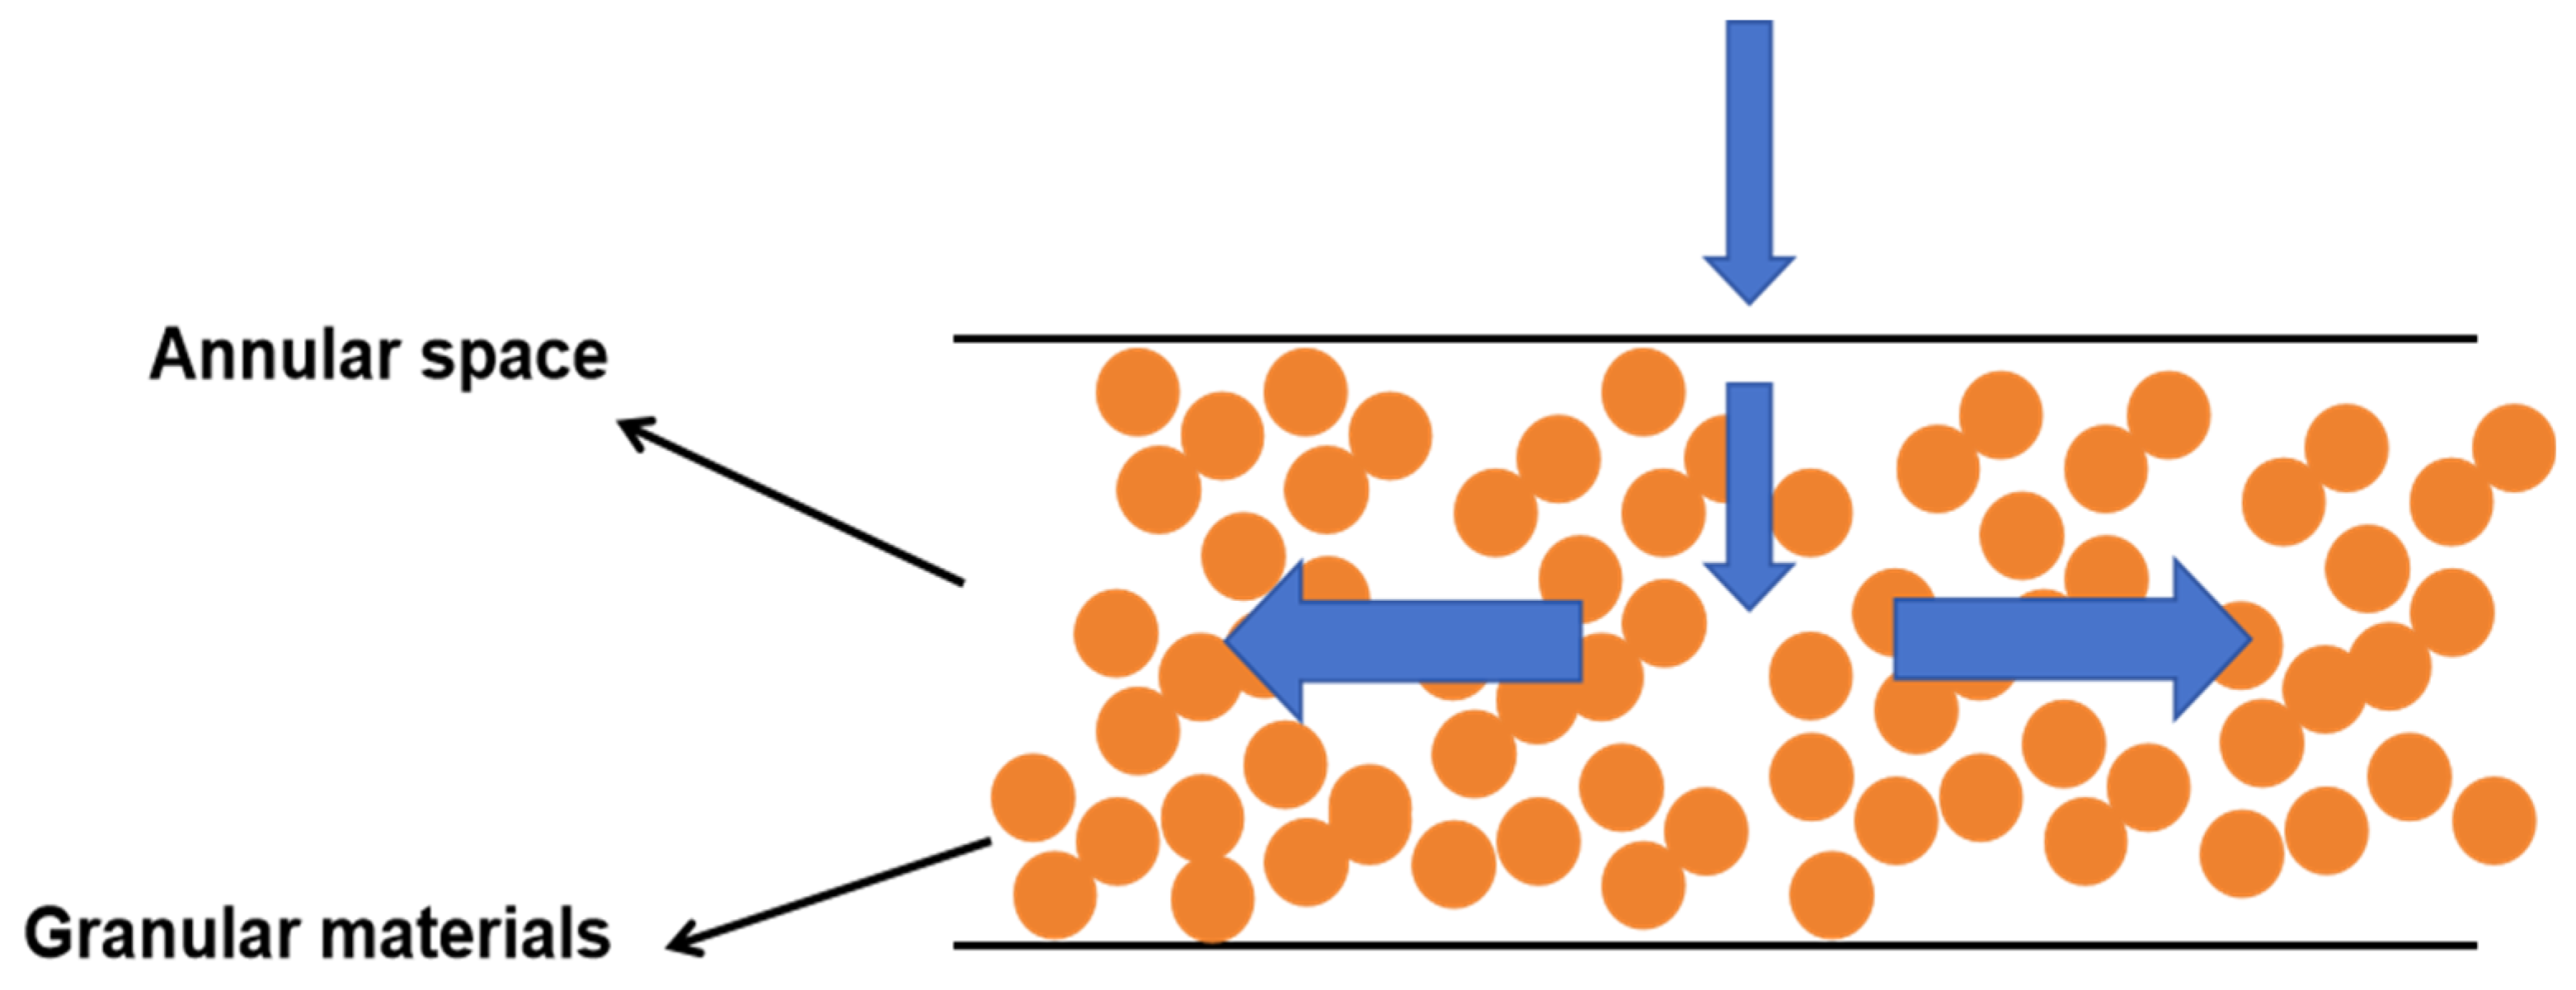
2.1. Physical Model
2.2. Mathematical Model
2.2.1. Mathematical Model for Bottom-Water Gas Reservoir Flow
2.2.2. Mathematical Model for Flow in ICD Screen and Zonal Water Control System
2.3. Coupled Solution Method
3. Application of Fully Coupled Numerical Simulation Model for Horizontal Wellbore–ICD Screen–Zonal Water Control Completion
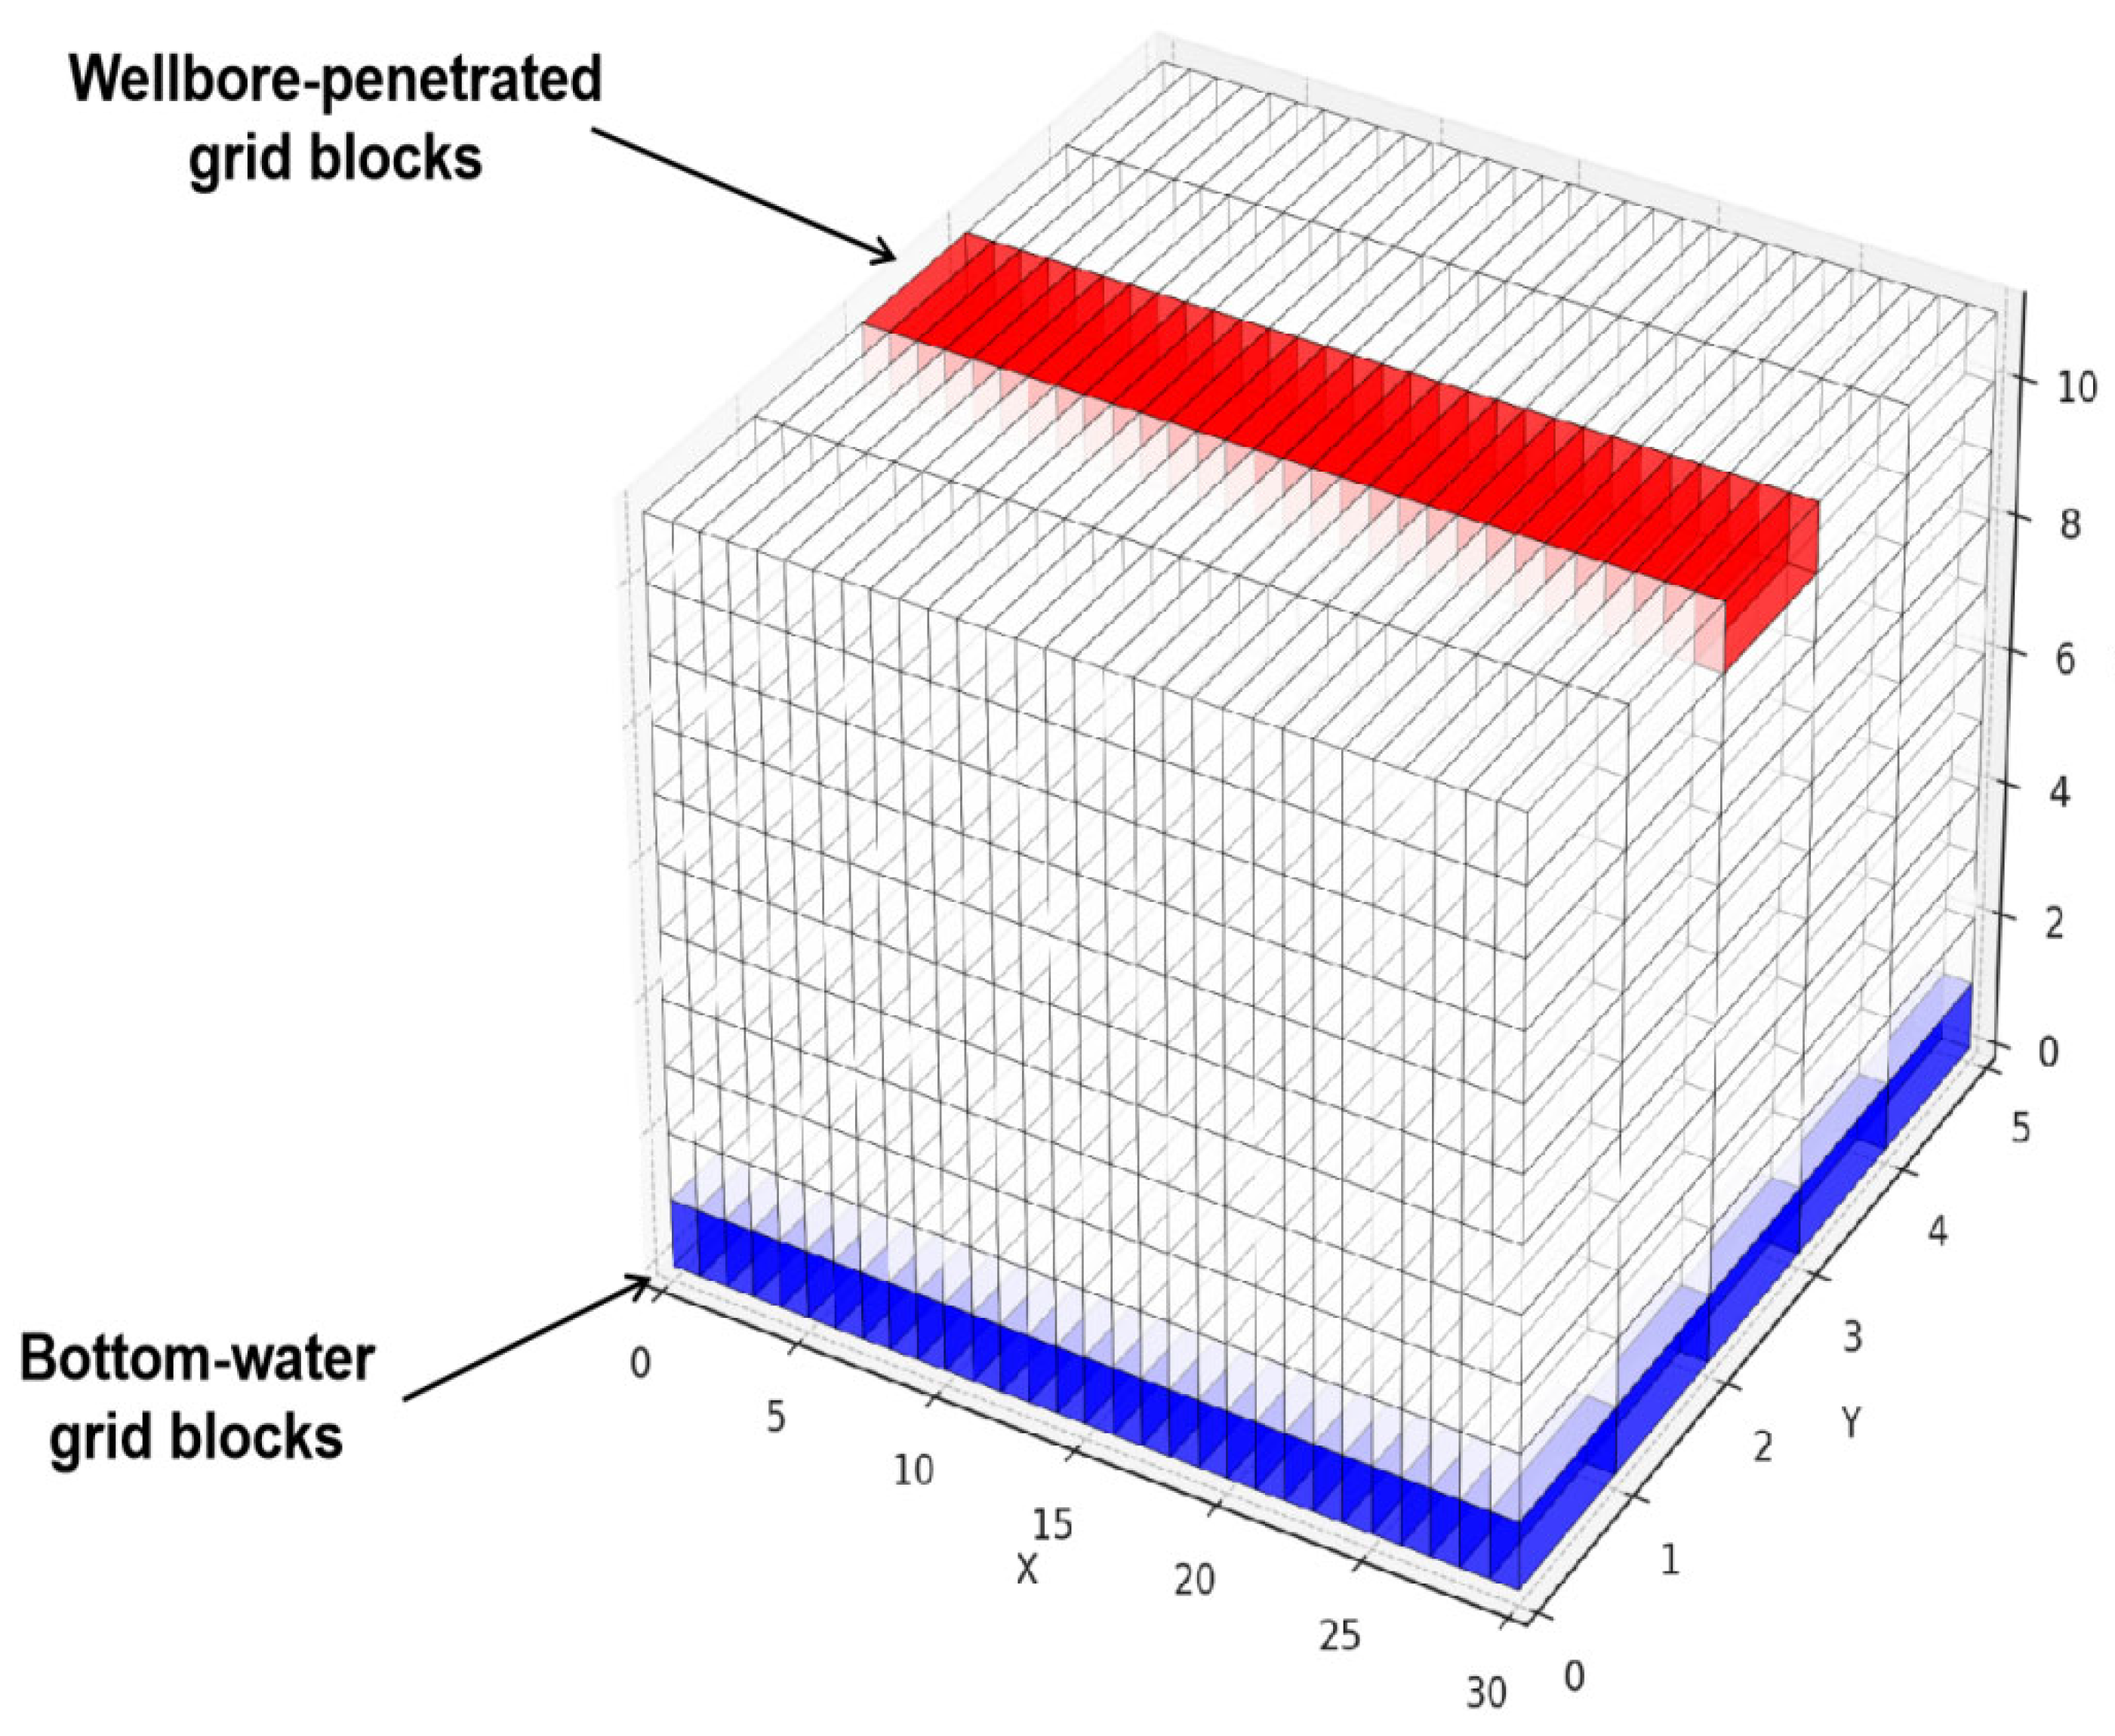
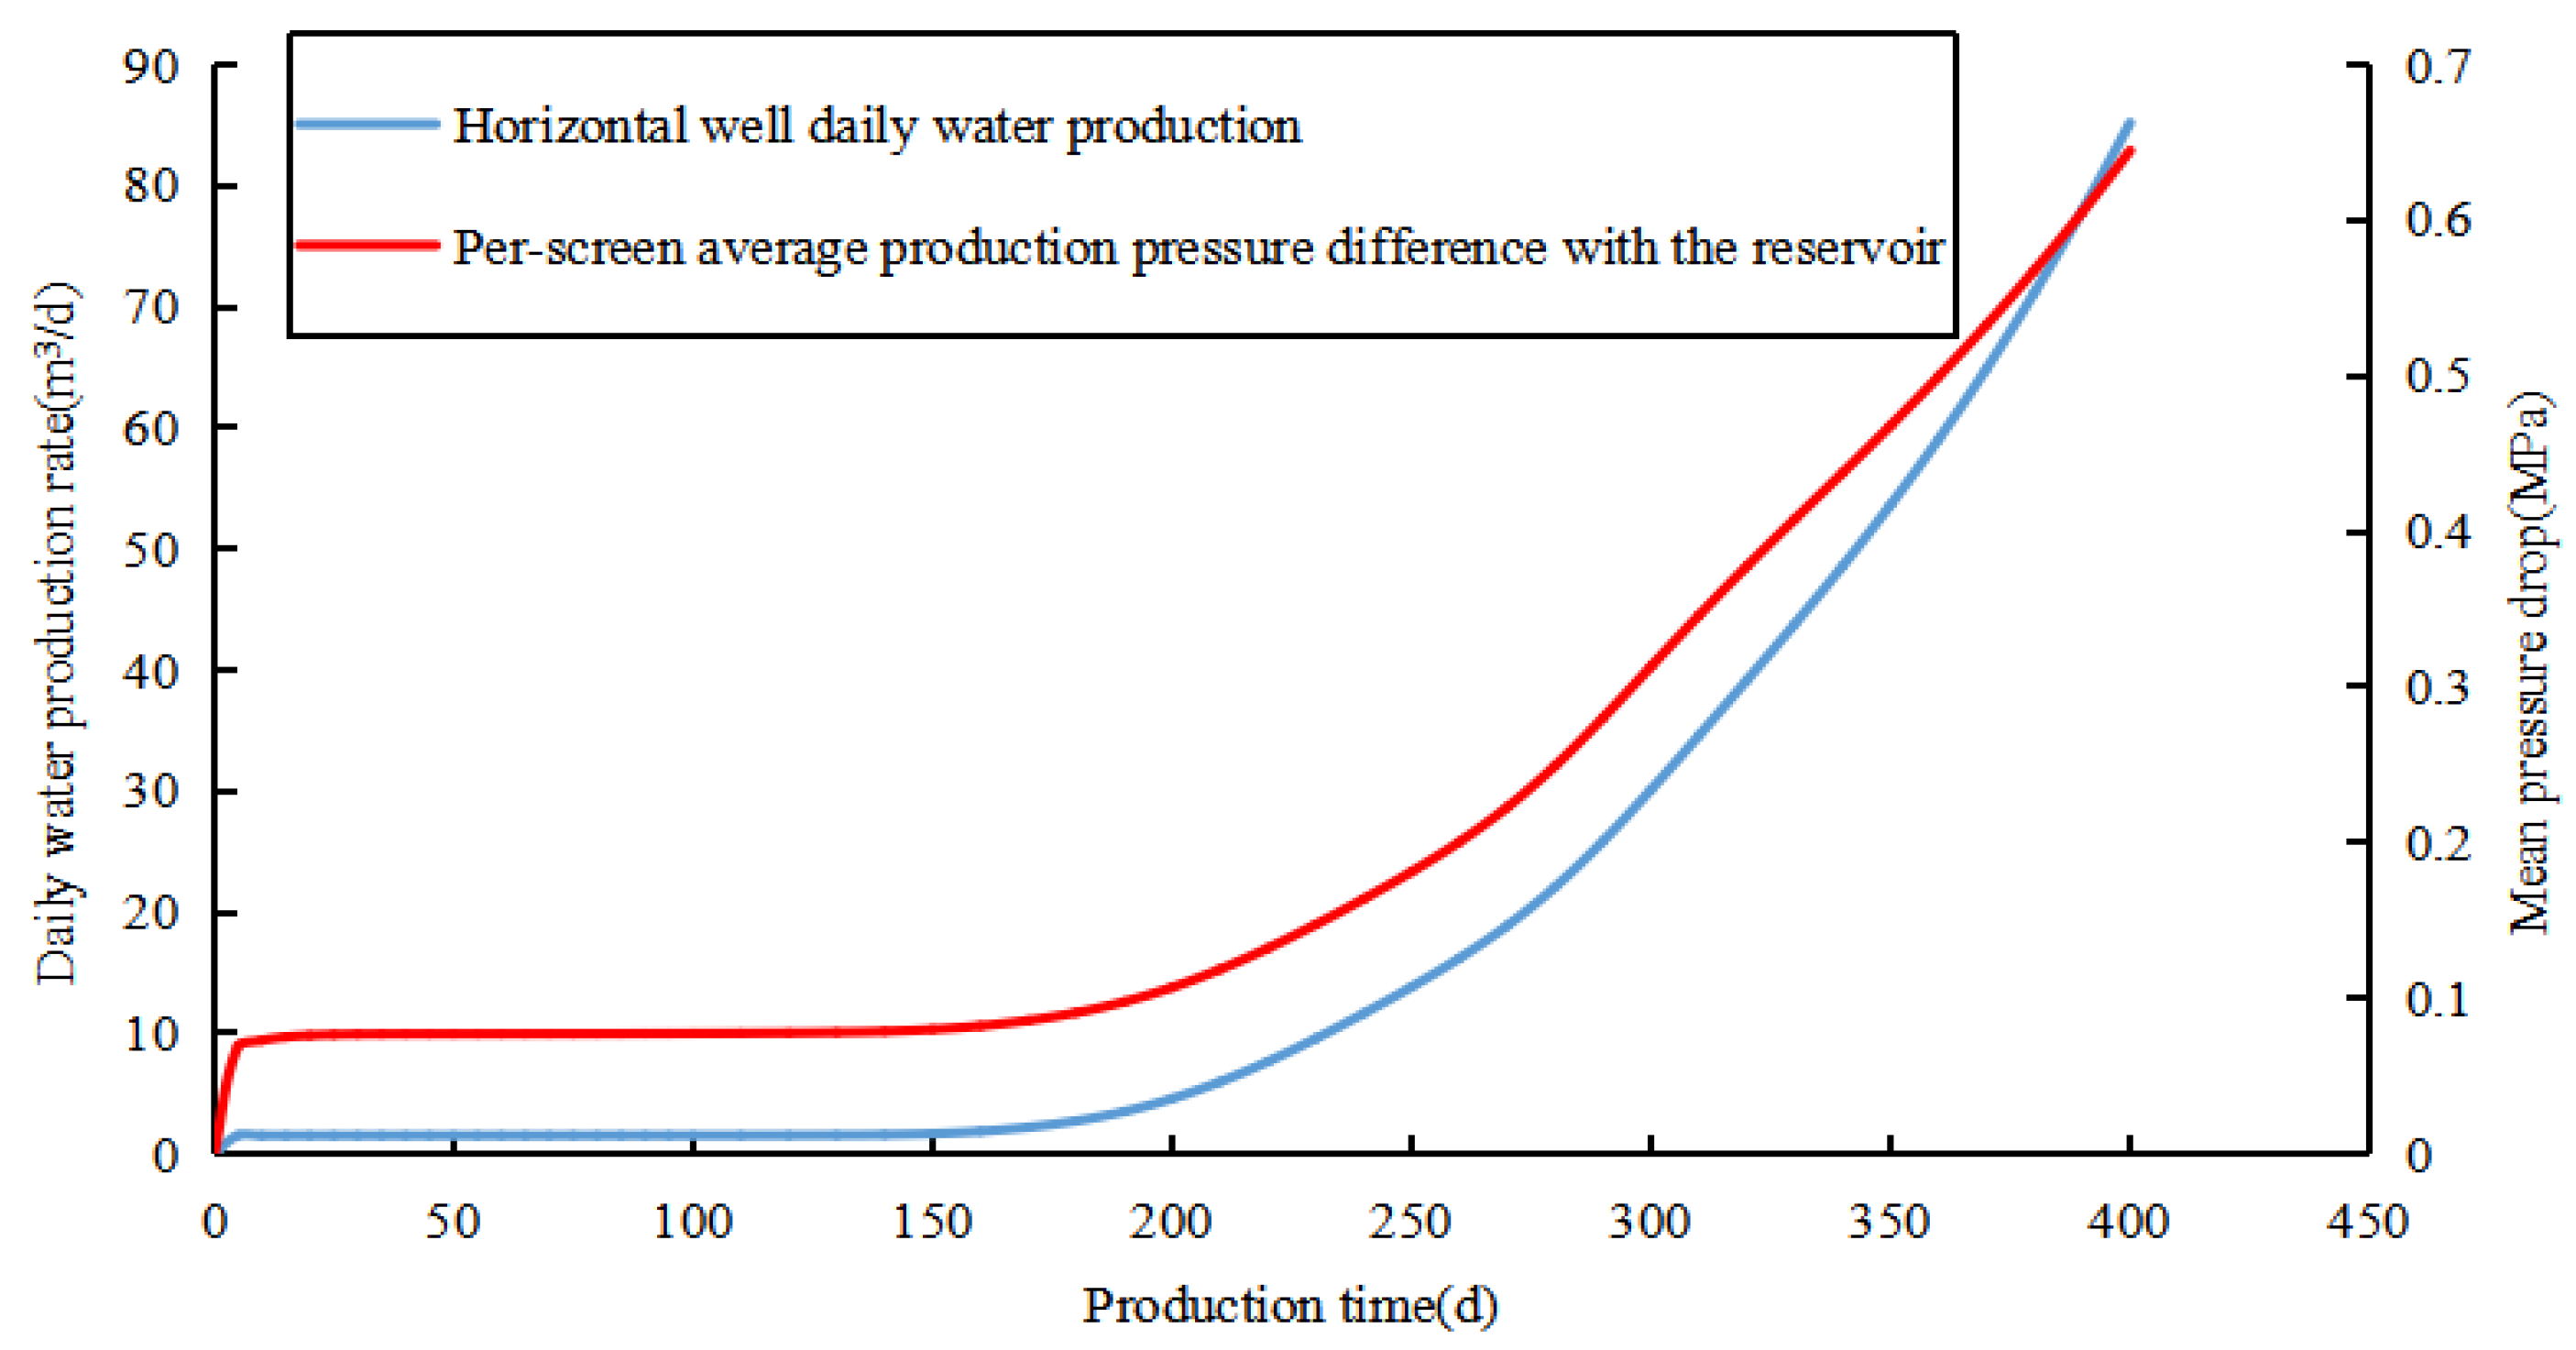
3.1. Field-Scale Production Simulation
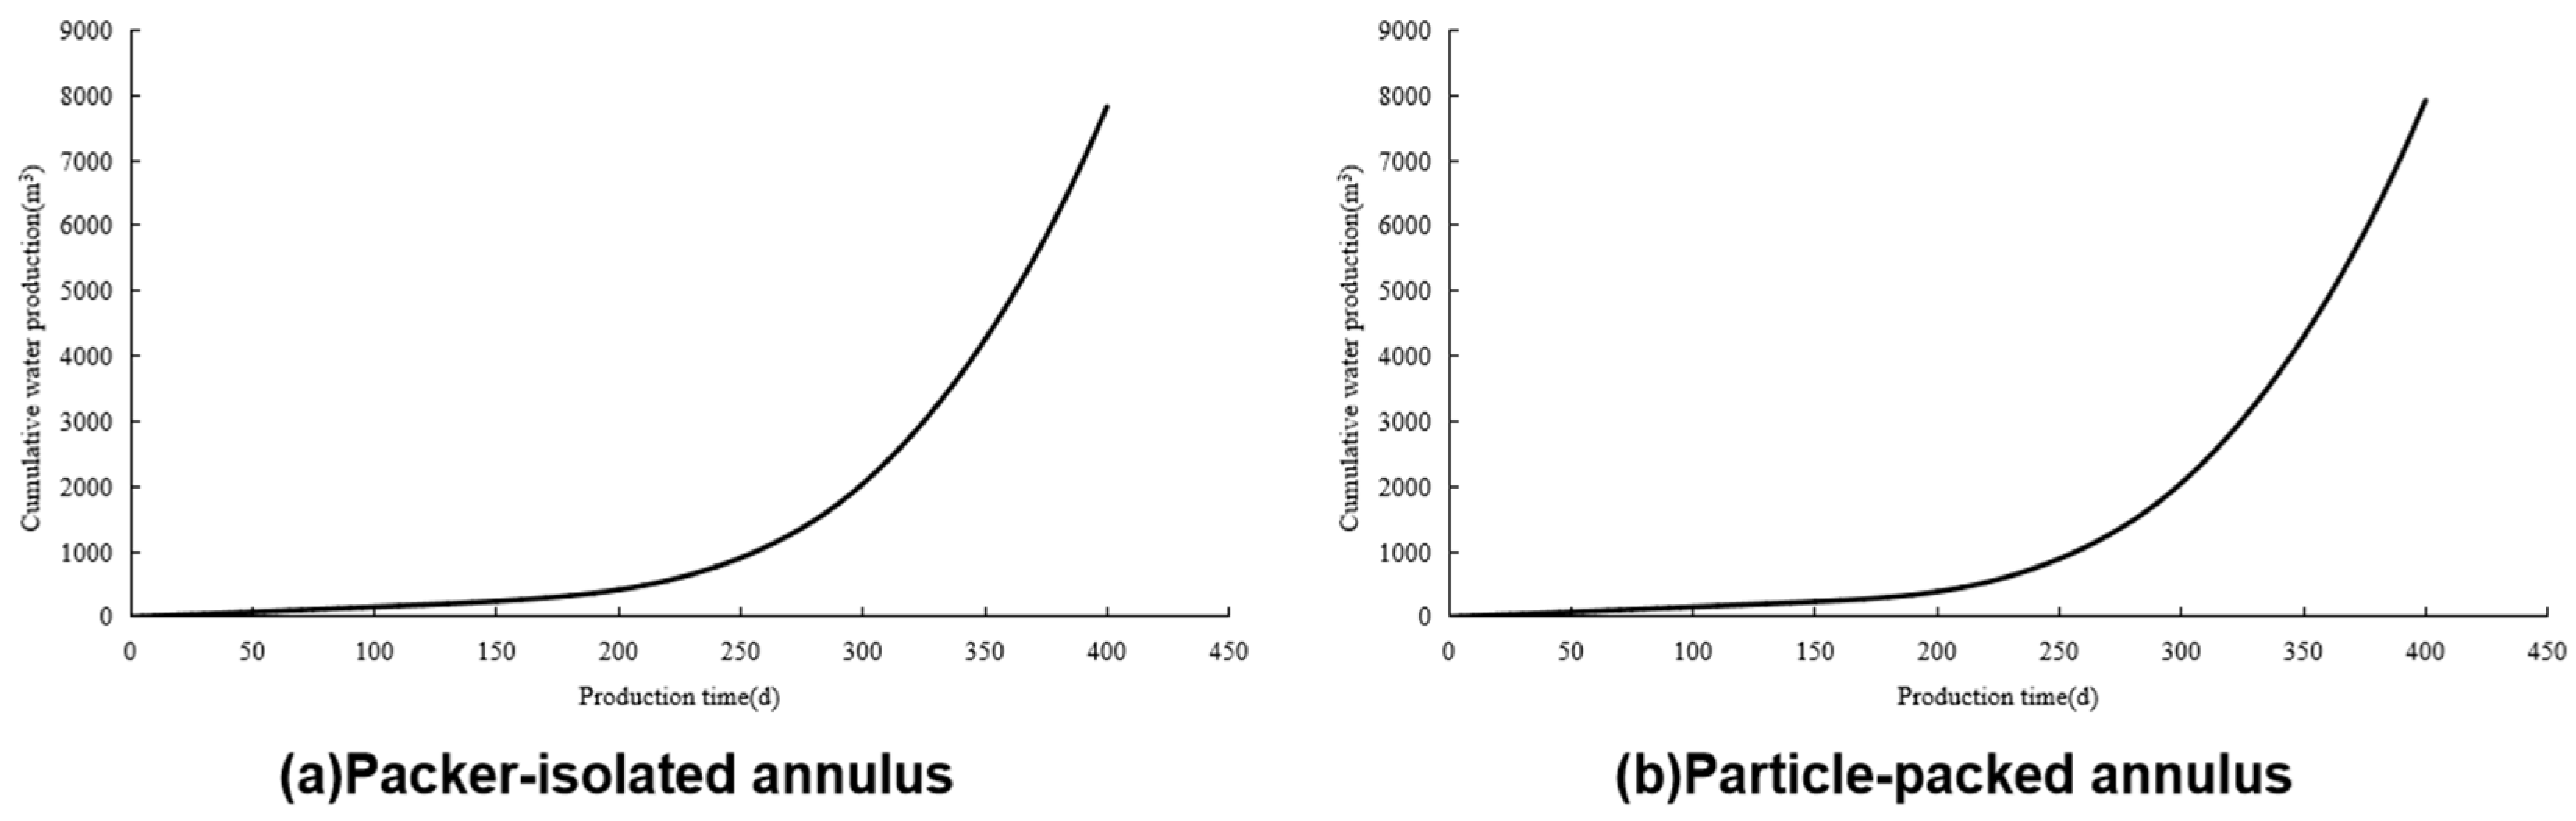
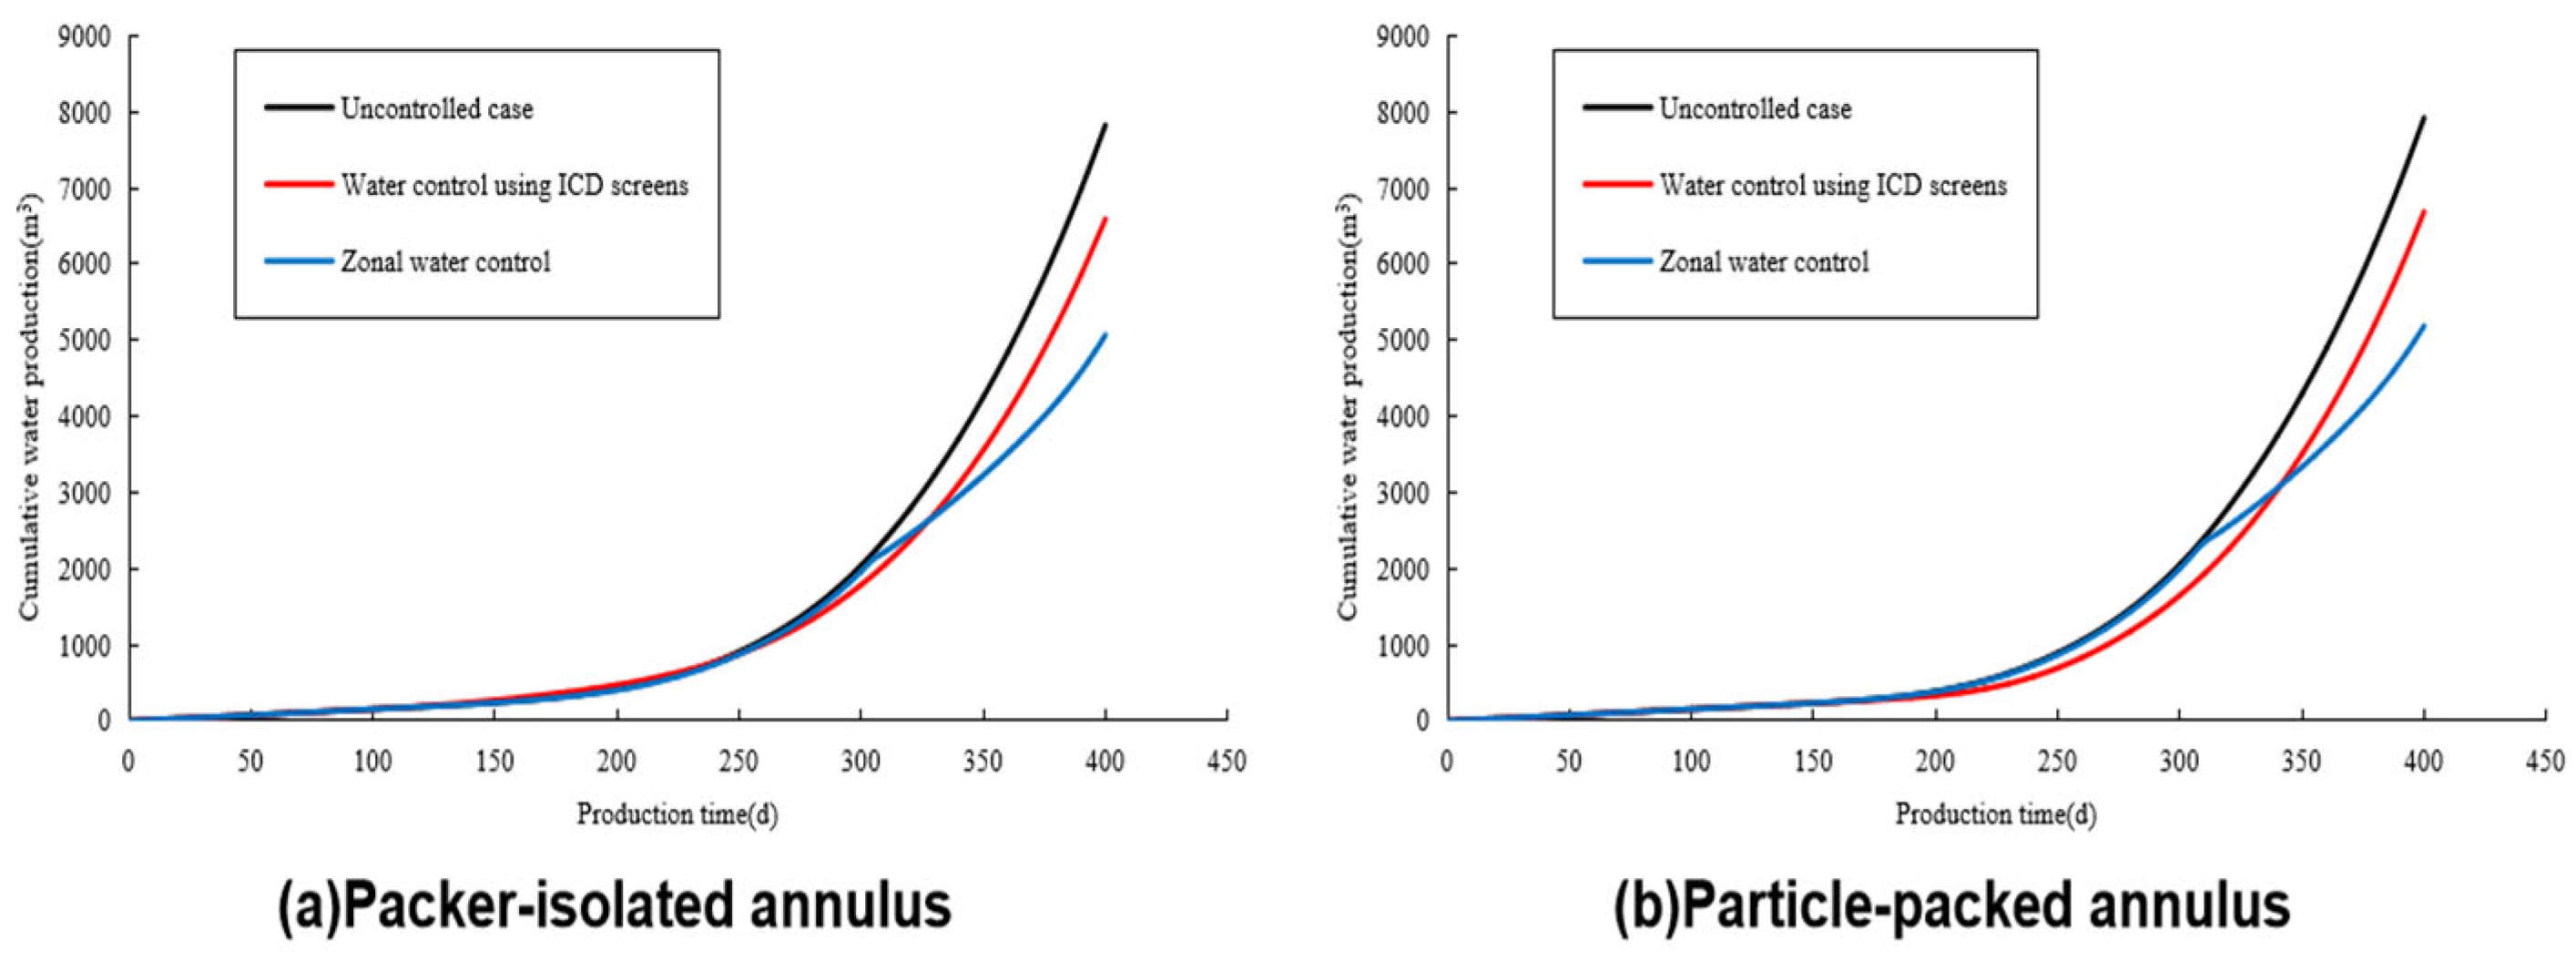
3.2. Prediction of Water Control Performance
- (1)
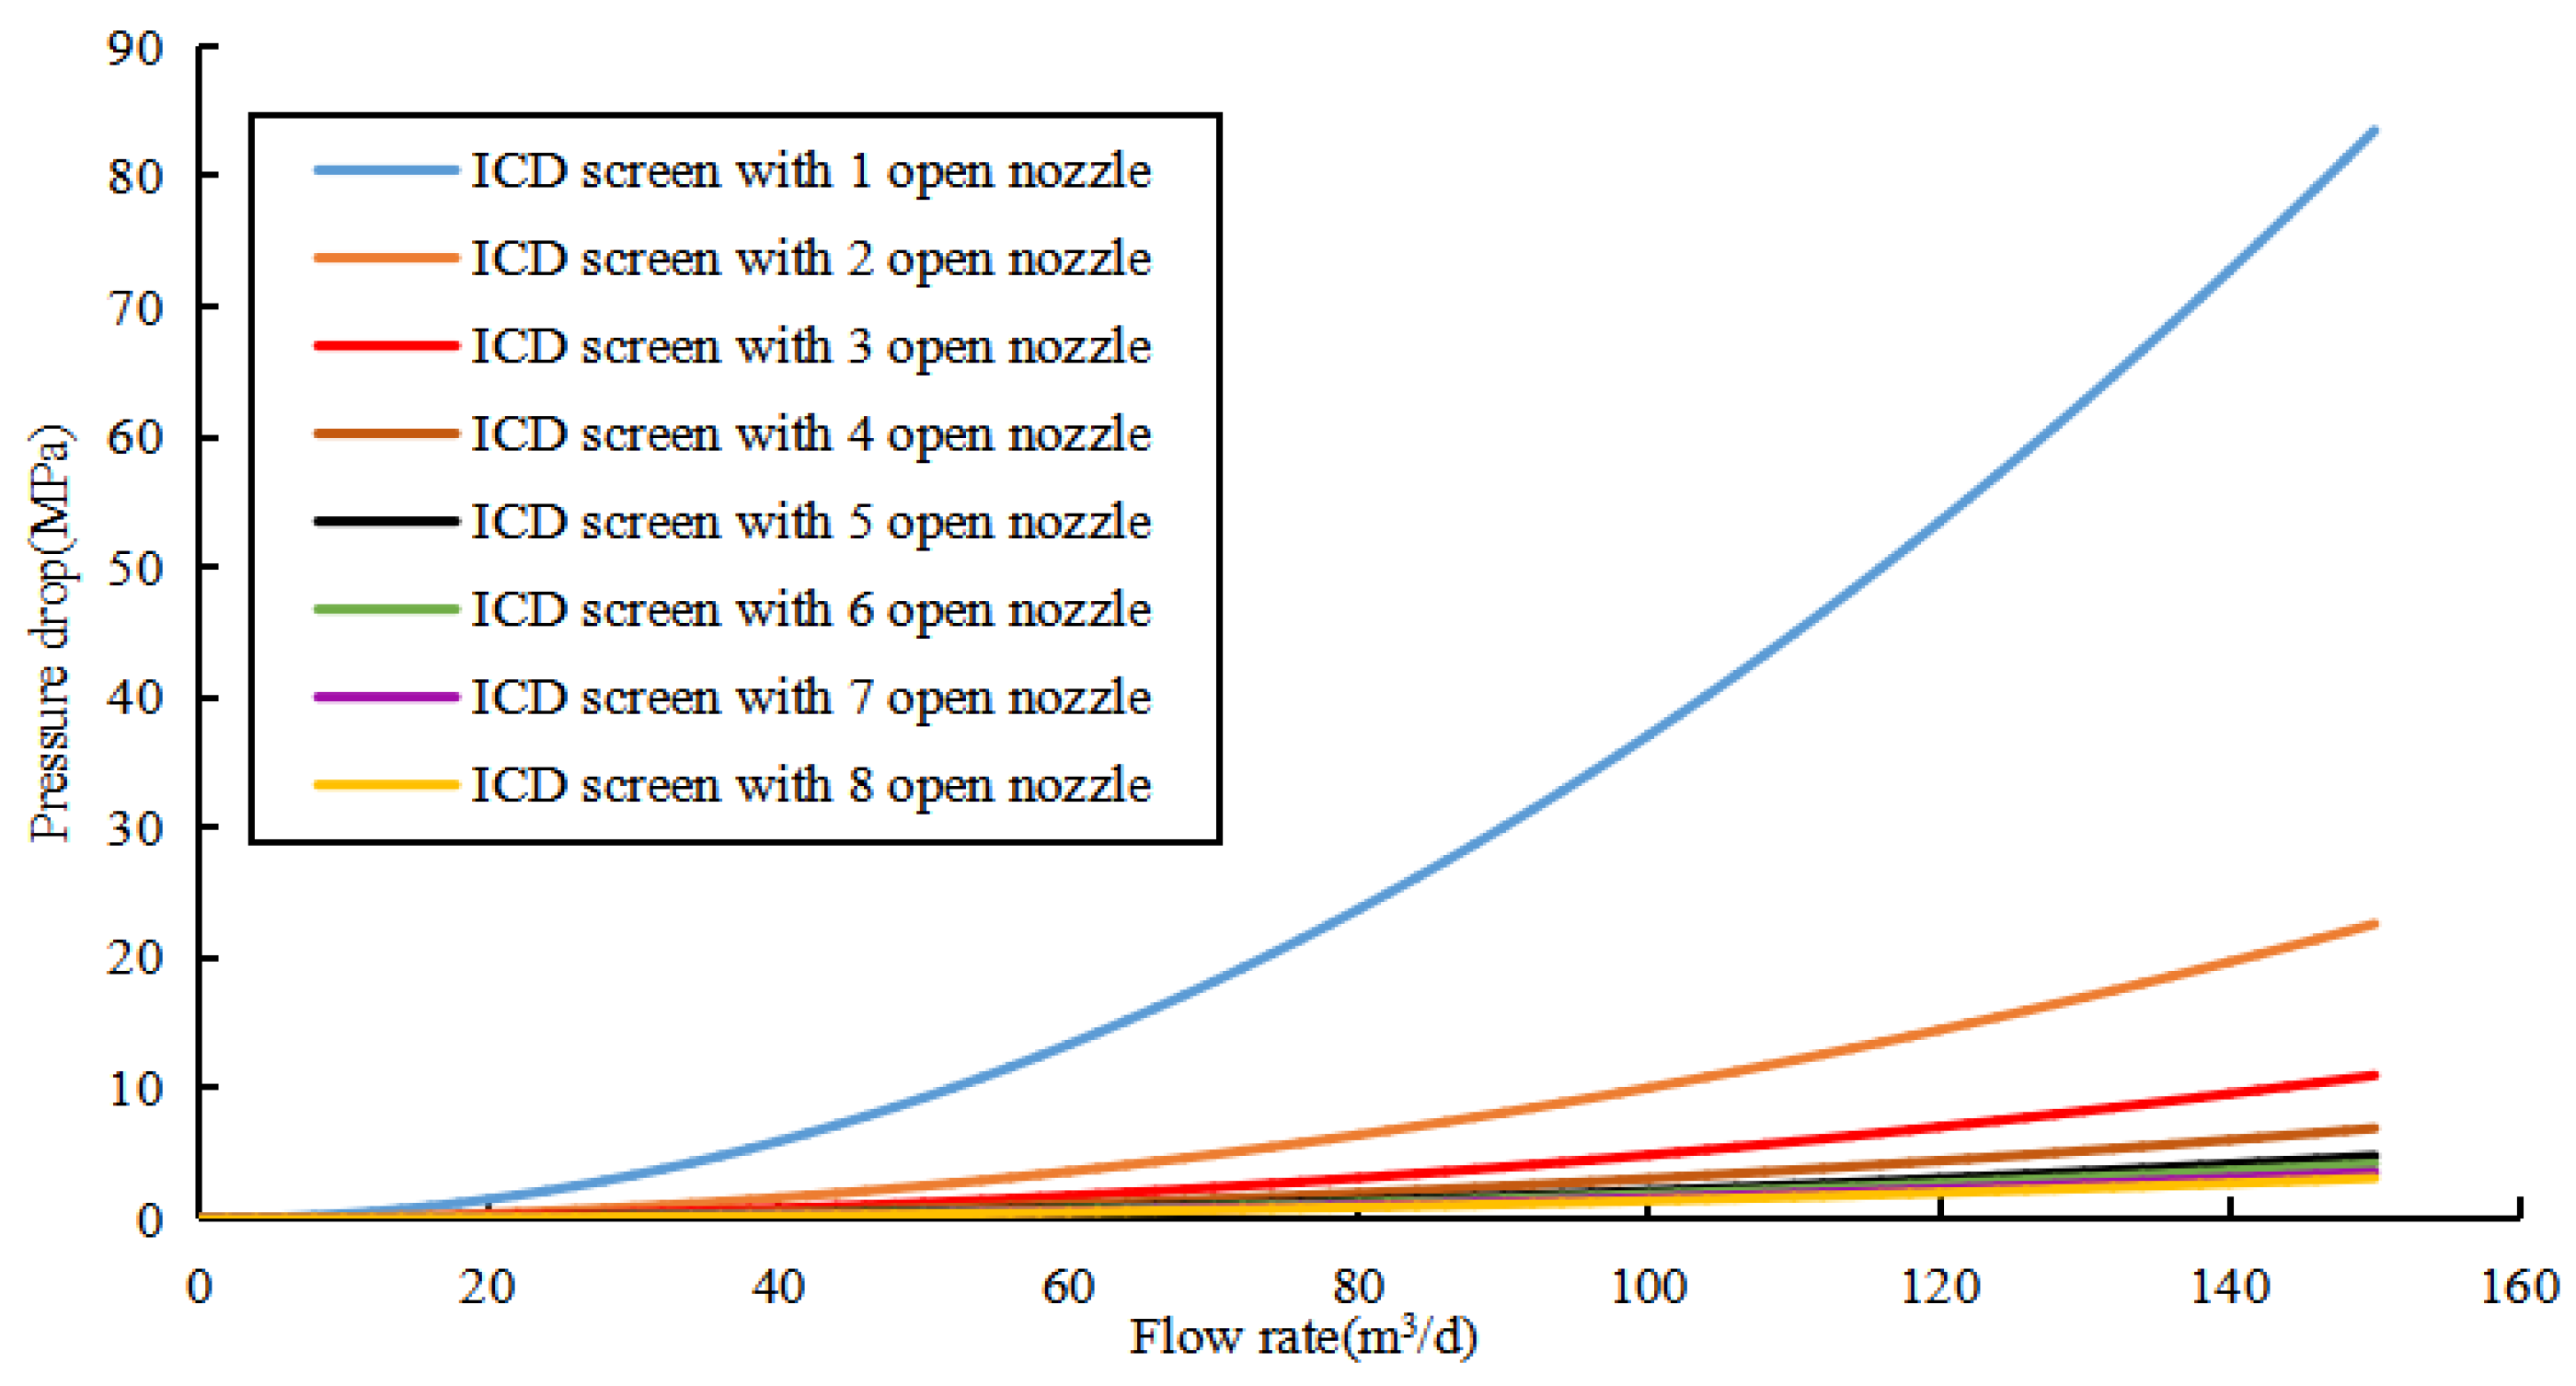
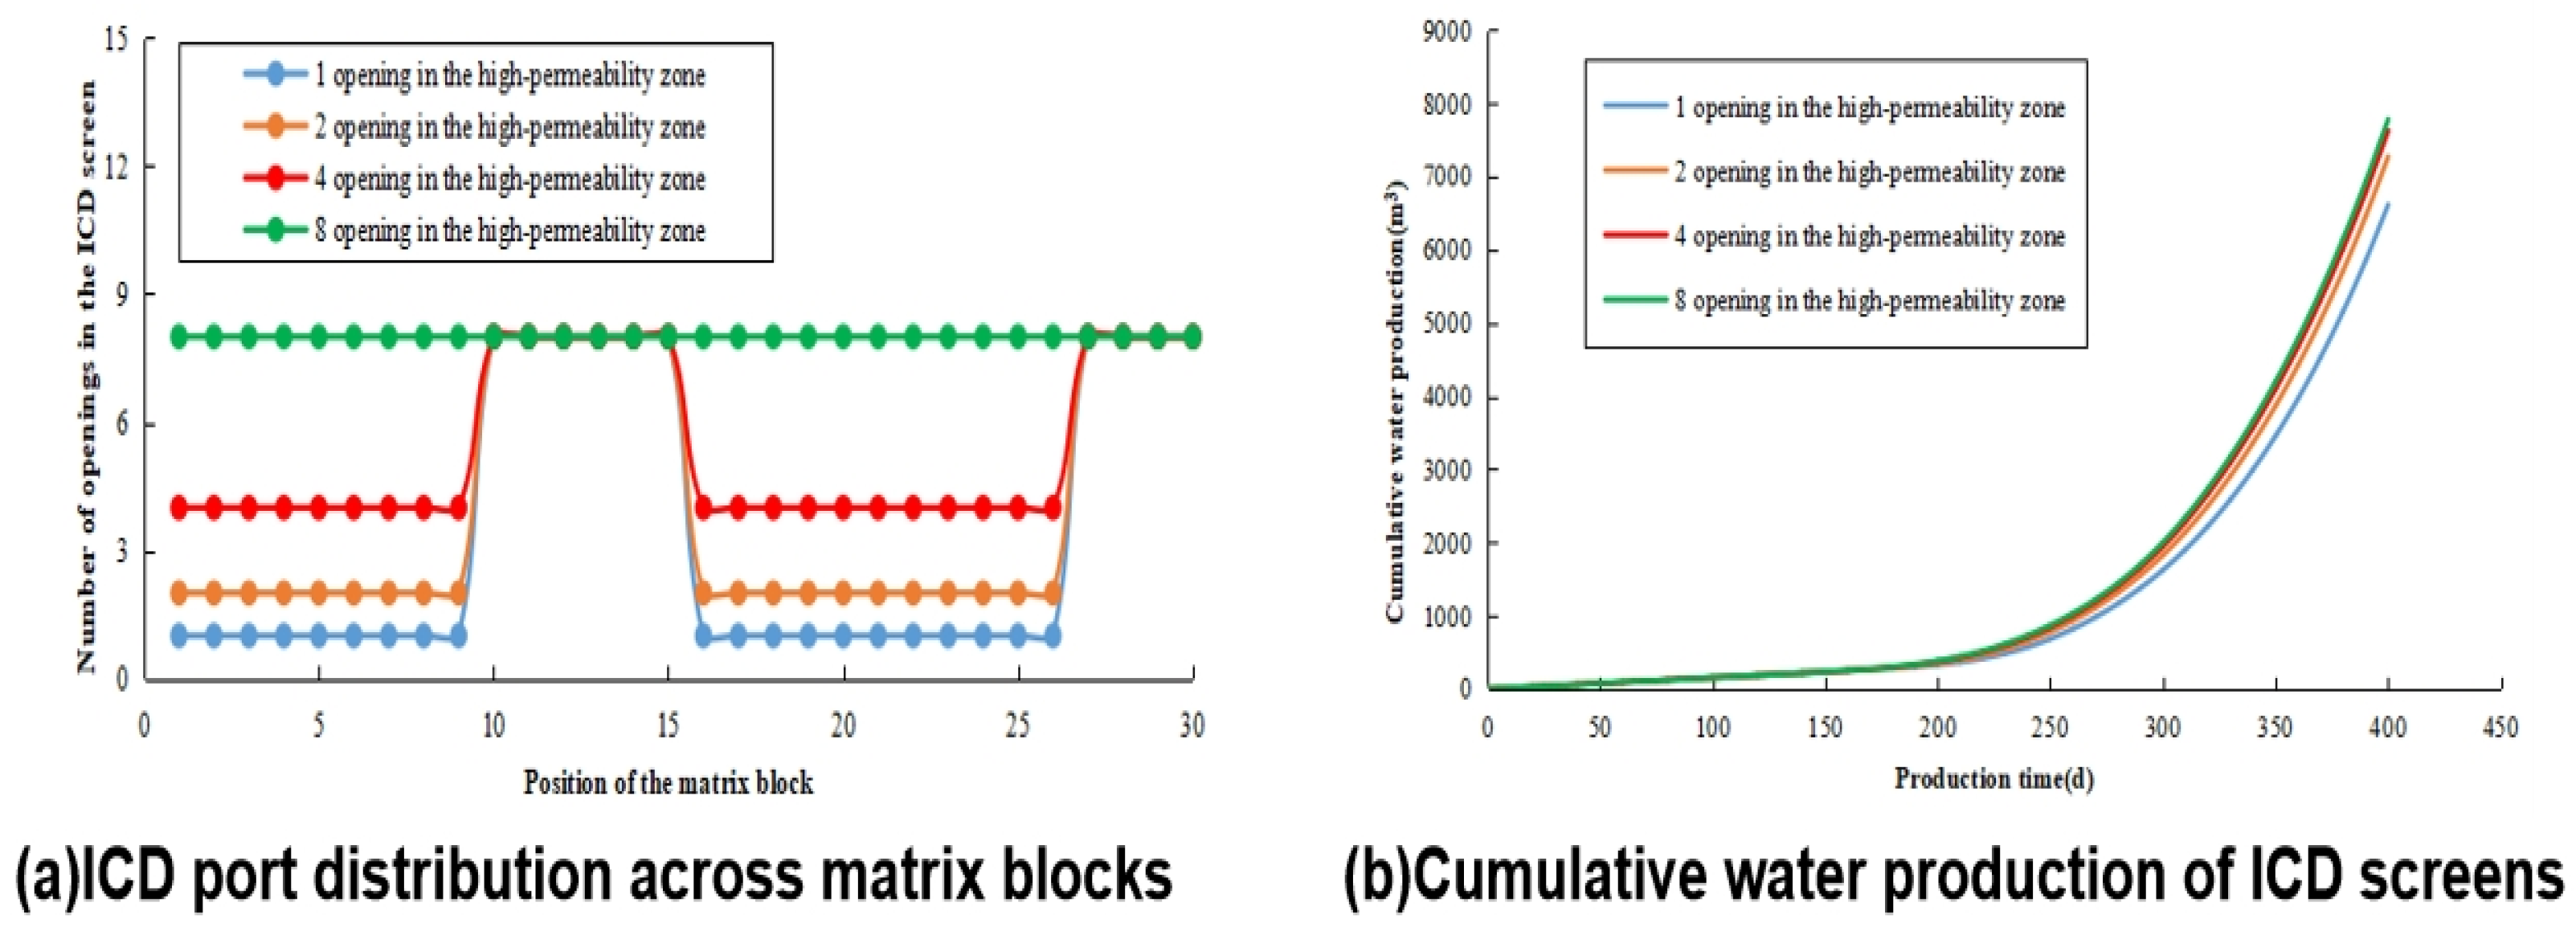
- Influence of ICD Screen Opening Number on Water Control Performance
- (2)
- Influence of Production Compartment Shutdown Timing on Water Control Performance
4. Conclusions
Author Contributions
Funding
Data Availability Statement
Conflicts of Interest
Nomenclature
| Φm | porosity of the matrix block |
| Sgm | gas saturations in the matrix block |
| Swm | water saturations in the matrix block |
| Bgm | formation volume factors of gas in the matrix block |
| Bwm | formation volume factors of water in the matrix block |
| Tgm | transmissibilities of gas in the matrix block |
| Twm | transmissibilities of water in the matrix block |
| Ugm | gas potentials in the matrix block |
| Uwm | water potentials in the matrix block |
| WIm–ICD | well index between the matrix block and the ICD screen |
| λgm | gas mobilities in the near-well matrix region |
| λwm | water mobilities in the near-well matrix region |
| Pgm | gas pressures in the matrix block |
| Pwm | water pressures in the matrix block |
| LCIg | gas inflow performance indices for the ICD screen |
| LCIw | water inflow performance indices for the ICD screen |
| [KICD] | ICD screen strength coefficient |
| ρg | gas densities |
| ρw | water densities |
| PICD | pressure within the ICD screen |
| PPC | pressure within the production compartment |
| A | cross-sectional area of the annulus between the ICD screen and the horizontal wellbore |
| kp | permeability of the particle-packed layer |
| μg | viscosities of the gas phases |
| μw | viscosities of the water phases |
| L | length of the water control completion assembly |
| PCIg | gas inflow performance indices for the production compartment |
| PCIw | water inflow performance indices for the production compartment |
| [KPC] | strength coefficient of the production compartment |
| PWell | bottomhole flowing pressure of the horizontal well |
References
- Li, J.; Wang, Z.; Ou, J.; Li, Z.; Yang, Y.; Wu, J.; Li, S. Research progress on development strategies for bottom-water gas reservoirs. Nat. Gas Explor. Dev. 2024, 47, 46–56. [Google Scholar]
- Wu, Y.; Liu, L.; Dai, P.; Ren, H.; Liu, Y. Gas–water distribution and early identification of water invasion in the Upper Permian Changxing Formation, Yuanba Gas Field, Sichuan Basin. Mar. Oil Gas Geol. 2021, 26, 245–252. [Google Scholar]
- Mustakimov, I.I.; Tudvachev, A.V.; Konosavsky, P.K. Analysis of phase-permeability function of oil-saturated reservoirs of the Eastern part of the Orenburg oil and gas condensate field (Russian). Oil Ind. J. 2016, 2016, 116–118. [Google Scholar]
- Kuo, C. Processing Case Study with AVO and Pore Pressure Analyses: Eugene Island, Gulf of Mexico. Master’s Thesis, University of Houston, Houston, TX, USA, 2019. [Google Scholar]
- Fan, Z.; Song, Z.; Zhu, S.; Zhang, Q.; Han, X.; Zhou, X. Numerical simulation on main controlling factors of water invasion and development effect in water-drive gas reservoirs. Fault-Block Oil Gas Field 2025, 32, 141–146. [Google Scholar]
- Li, Z.; Qiu, H.; Wen, M.; Fan, B.; Huang, H.; Pan, H.; Li, Z.; Zheng, Y. Experimental evaluation of composite water control in fractured buried-hill gas reservoirs: A case study of HZ gas field. Fault-Block Oil Gas Field 2022, 29, 837–841. [Google Scholar]
- Zhang, R.; Sun, B.; Qin, L.; Yang, X.; Gu, S.; Wang, Y. Progress in productivity evaluation after water breakthrough in gas wells. Fault-Block Oil Gas Field 2018, 25, 62–65. [Google Scholar]
- Li, J.D.; Tian, B. Development characteristics and countermeasures practice of water drive gas reservoir in East China Sea. Offshore Oil 2023, 43, 8–12. [Google Scholar]
- Liu, G.F.; Meng, Z.; Li, X.J.; Gu, D.; Yang, D.; Yin, H. Experimental and numerical evaluation of water control and production enhancement in tight gas formations using polymers. J. Energy Resour. Technol. 2019, 141, 102903. [Google Scholar] [CrossRef]
- Zhang, J.; An, Y.; Wang, H.; Xiong, M.; Li, Q. Numerical simulation of production dynamics for horizontal wells completed with continuous packer and ICD. China Offshore Oil Gas 2021, 33, 121–125. [Google Scholar]
- Zhang, G.W.; Qian, J.; Liu, F.; Zhang, W.P.; Shen, Z.J.; Pei, X.H. Research and application of water control completion string for horizontal wells. China Pet. Mach. 2013, 41, 89–91. [Google Scholar]
- Birchenko, V.M. Analytical Modelling of Wells with Inflow Control Devices. Ph.D. Thesis, Heriot-Watt University, Edinburgh, UK, 2010. [Google Scholar]
- Li, H.; Huang, J.; Zhu, Y.; Guo, X.; Wang, C.; Wang, Y. Key challenges and solutions for water control in heavy oil reservoirs with thin sandstone layers and strong water drive. Petrochem. Technol. 2025, 32, 295–297. [Google Scholar]
- Tian, X.; Li, L.; Xie, X.; Xiao, M. Application of balanced water control ICD completion technology in Huizhou Oilfield. J. Pet. Nat. Gas 2012, 34, 238–240. [Google Scholar]
- An, Y.S.; Zhang, N.; Zhang, H. Coupled numerical simulation of horizontal well ICD water control completion. China Offshore Oil Gas 2017, 29, 109–113. [Google Scholar]
- Atkinson, C.; Monmont, F.; Zazovsky, A.F. Flow performance of horizontal wells with inflow control devices. Eur. J. Appl. Math. 2004, 15, 409–450. [Google Scholar] [CrossRef]
- Li, W.; Chen, Y.; Zou, X.M. Optimization of variable-density screen with blank pipe for flow control in horizontal wells. Pet. Geol. Eng. 2016, 30, 110–114. [Google Scholar]
- Liu, H.; Zheng, L.C.; Yang, Q.H.; Yu, J.; Yue, Q.; Jia, D.; Wang, Q. Development and prospect of layered oil production technologies. Pet. Explor. Dev. 2020, 47, 1027–1038. [Google Scholar] [CrossRef]
- Luo, W.; Lin, Y.; Li, H.; Jiang, Z.; Wu, Q.; Tao, Z. Optimization design for horizontal well ICD completion in heterogeneous bottom-water reservoirs. Acta Pet. Sin. 2017, 38, 1200–1209. [Google Scholar]
- Tan, L.; Zhang, N.; Qin, S.L.; An, Y.S.; Xiong, C.C. Production prediction method for water control completions with particle-packed horizontal wells. Oil Drill. Prod. Technol. 2024, 46, 78–88. [Google Scholar] [CrossRef]
- Hou, D.; Gong, F.; Chen, B.; Liang, S.; Su, J. CO2 flooding mechanism and storage performance in bottom-water sandstone gas reservoirs. Nat. Gas Ind. 2024, 44, 93–103. [Google Scholar]
- Cheng, L.; Yang, C.; Cao, R.; Jia, P.; Pu, B.; Shi, J. Numerical simulation of dynamic behavior of water-induced fractures. Spec. Oil Gas Reserv. 2023, 30, 84–90. [Google Scholar]
- Fu, X.; Li, G.; Cui, M.; Huang, Z.; Liang, Y. Coupled model and target profile calculation method for ICD completions in heterogeneous bottom-water oil reservoirs. Oil Drill. Prod. Technol. 2015, 04, 27–32. [Google Scholar]
- Moinfar, A.; Varavei, A.; Sepehrnoori, K.; Johns, R.T. Johns. Development of a coupled dual continuum and discrete fracture model for the simulation of unconventional reservoirs. In SPE Reservoir Simulation Symposium; SPE: The Woodlands, TX, USA, 2013. [Google Scholar]
- Liu, Y.; Wang, B.; Meng, X.; Xing, H.; Zhang, Y.; Huang, B.; Liu, C. Sensitivity analysis of fluid parameters for water control valves in oil wells. Pet. Field Mach. 2020, 49, 9–14. [Google Scholar]
- Gu, T.X. Iterative Methods and Preconditioning Techniques; Science Press: Beijing, China, 2015. [Google Scholar]


| Parameters (Unit) | Value | Parameters (Unit) | Value |
|---|---|---|---|
| Area (m2) | 339 × 250 | Reservoir thickness (m) | 12 |
| Initial water saturation (%) | 50 | Reservoir pressure (MPa) | 20 |
| Reservoir porosity (%) | 6.7 | Reservoir depth (m) | 2000 |
| Distance to bottom-water (m) | 6 | Average reservoir permeability (10−3 μm2) | 31.2 |
| Vertical-to-horizontal permeability ratio | 0.1 | Permeability of the particle-packed layer (10−3 μm2) | 40,000 |
Disclaimer/Publisher’s Note: The statements, opinions and data contained in all publications are solely those of the individual author(s) and contributor(s) and not of MDPI and/or the editor(s). MDPI and/or the editor(s) disclaim responsibility for any injury to people or property resulting from any ideas, methods, instructions or products referred to in the content. |
© 2025 by the authors. Licensee MDPI, Basel, Switzerland. This article is an open access article distributed under the terms and conditions of the Creative Commons Attribution (CC BY) license (https://creativecommons.org/licenses/by/4.0/).
Share and Cite
An, Y.; Sun, Z.; Kang, Y.; Yang, G. A Fully Coupled Numerical Simulation Model for Bottom-Water Gas Reservoirs Integrating Horizontal Wellbore, ICD Screens, and Zonal Water Control: Development, Validation, and Optimization Strategies. Energies 2025, 18, 3607. https://doi.org/10.3390/en18143607
An Y, Sun Z, Kang Y, Yang G. A Fully Coupled Numerical Simulation Model for Bottom-Water Gas Reservoirs Integrating Horizontal Wellbore, ICD Screens, and Zonal Water Control: Development, Validation, and Optimization Strategies. Energies. 2025; 18(14):3607. https://doi.org/10.3390/en18143607
Chicago/Turabian StyleAn, Yongsheng, Zhongwen Sun, Yiran Kang, and Guangning Yang. 2025. "A Fully Coupled Numerical Simulation Model for Bottom-Water Gas Reservoirs Integrating Horizontal Wellbore, ICD Screens, and Zonal Water Control: Development, Validation, and Optimization Strategies" Energies 18, no. 14: 3607. https://doi.org/10.3390/en18143607
APA StyleAn, Y., Sun, Z., Kang, Y., & Yang, G. (2025). A Fully Coupled Numerical Simulation Model for Bottom-Water Gas Reservoirs Integrating Horizontal Wellbore, ICD Screens, and Zonal Water Control: Development, Validation, and Optimization Strategies. Energies, 18(14), 3607. https://doi.org/10.3390/en18143607