Abstract
Large steam turbine generators are increasingly vulnerable to damage from shaft voltages and bearing currents due to the widespread adoption of modern power electronic excitation systems and more flexible operating regimes. Earthing brushes provide a critical path for discharging these shaft currents and voltages, but their effectiveness depends on the timely detection of brush degradation or faults. Conventional monitoring of shaft voltage and current is often rudimentary, typically limited to peak readings, making it challenging to identify specific fault conditions before mechanical damage occurs. This study addresses this gap by systematically analyzing shaft voltage and current signals under various controlled earthing brush fault conditions (floating brushes, worn brushes, and oil/dust contamination) in several large turbine generators. Experimental site tests identified distinct electrical signatures associated with each fault type, demonstrating that online shaft voltage and current measurements can reliably detect and classify earthing brush faults. These include unique RMS, DC, and harmonic patterns in both voltage and current signals, enabling accurate fault classification. These findings highlight the potential for more proactive maintenance and condition-based monitoring, which can reduce unplanned outages and improve the reliability and safety of power generation systems.
1. Introduction
The phenomenon of shaft voltages and circulating bearing currents in large rotating electric machines, particularly synchronous turbine generators, has been recognized for over a century and continues to be a subject of critical research interest [1,2]. This persistent concern is attributed to the damaging effects of shaft-induced currents on generator components such as journal bearings, hydrogen seals, and rotor insulation systems [3,4,5]. Recent developments in power electronics including the widespread deployment of static excitation systems (SES), variable frequency drives (VFDs), and high-frequency inverters have significantly increased the susceptibility of large generators to shaft voltage-related failures [6,7,8]. These high-frequency switching devices generate common-mode voltages and fast transients, which couple into the rotor shaft through capacitive and electromagnetic pathways, leading to parasitic voltages and circulating currents [6,9,10]. If not effectively discharged, these parasitic voltages can result in catastrophic damage such as bearing fluting, lubricant breakdown, hydrogen seal leakage, shaft heating, and insulation degradation [5,11,12].
Historically, shaft voltage suppression has been addressed by implementing dedicated shaft earthing brushes and monitoring systems [5,13,14,15]. In conventional configurations, a low-impedance carbon or metal–graphite current brush is installed at the drive-end of the generator to discharge circulating shaft currents to ground, while a high-impedance voltage sensing brush is placed at the non-drive end to capture the shaft voltage waveform for diagnostic analysis [5,13,14,16]. The need for robust grounding solutions is further emphasized in modern SES-equipped machines, where thyristor-based excitation introduces sharp voltage spikes often exceeding 100 V (with rise times on the order of tens of microseconds) due to capacitive coupling between the field winding and the rotor shaft [6,7,8].
While earlier research predominantly viewed shaft voltage monitoring as a protective measure, recent studies have repositioned this parameter as a valuable diagnostic signal [17,18,19,20,21,22]. Notably, reference [23] demonstrated that distinct harmonic components in shaft voltage waveforms correlate with specific machine faults such as rotor eccentricity and field winding inter-turn shorts. Through experimental validation and spectral analysis, the authors of [23] showed that shaft voltage is more than a passive indicator; it carries fault-specific signatures that can enable early fault detection. Similarly, the authors of [11] provided insights into the multifaceted origins of shaft voltages ranging from excitation-induced spike transients and magnetic asymmetries to axial shaft magnetization and electrostatic charge build-up and reported that peak-to-peak shaft voltages could reach as high as ~150 V in extreme conditions. Such levels are sufficient to compromise the lubricant film in bearings and initiate destructive arcing currents. When subjected to frequency-domain analysis (FFT), these shaft voltage signals reveal distinct patterns: for example, even-order harmonics (2nd, 4th, 6th) have been strongly associated with rotor winding shorts, whereas certain odd harmonics (e.g., 3rd, 5th) are amplified by rotor eccentricity. These harmonic fingerprints have been confirmed by multiple studies: field winding short circuits tend to elevate even-order harmonics, while static eccentricity increases specific odd harmonics. The authors of [24] further corroborated these findings in a 2-pole generator, noting a direct correlation between the amplitude of the 5th harmonic and the degree of rotor eccentricity.
Recent work has also explored the role of the earthing brushes themselves in the observed electrical signatures [3,5,14,25]. The authors of [26] demonstrated in a 20 kVA synchronous machine that faults in the shaft grounding system can suppress or alter key harmonic components of the shaft voltage, significantly changing the time-domain waveform. Their results showed, for instance, that an earthing brush fault could attenuate the 150 Hz third-harmonic component and introduce waveform distortion, providing a measurable spectral signature of the fault well before it becomes evident through visual inspection. This finding aligns with earlier suggestions by reference [13] that monitoring shaft voltage spectra can serve as an early warning of developing problems, although past implementations lacked detailed fault classification schemes. In addition, the authors of [5] highlighted the importance of proper brush application: brushes operating below critical current density thresholds (around 6–9 A/cm2) can make poor contact with the shaft, leading to inadequate discharge of the shaft voltage and subsequent voltage build-up. Placing voltage brushes at the exciter end (non-drive end) has been found to reduce mechanical disturbances and contamination, thereby improving data fidelity for diagnostic analysis. These insights suggest that a combination of optimized brush design/placement and advanced signal processing can substantially improve the diagnostic capability of shaft voltage monitoring systems.
Collectively, the literature strongly supports treating shaft voltage and current monitoring as a foundational element of condition-based maintenance (CBM) in modern power plants. By integrating high-resolution signal processing (e.g., FFT, wavelet analysis) and artificial intelligence techniques (e.g., machine learning classifiers), non-invasive shaft voltage measurements can be transformed into real-time diagnostics for a range of issues including rotor field faults, eccentricity, and grounding deficiencies. However, a key gap remains in extending these diagnostic techniques to the detection of earthing brush faults themselves. To date, substantial research has focused on using shaft signal analysis for rotor electrical faults (winding shorts, broken rotor bars) and mechanical imbalances, but relatively little attention has been given to systematically classifying different earthing brush fault conditions in large turbo-generators [20,22,26,27]. These brush-related issues, though often subtle in early stages, can significantly compromise the shaft grounding path, leading to increased shaft voltage, uncontrolled discharge currents through bearings, and accelerated wear or damage (bearing pitting, seal failure, insulation stress) [4,12,28,29].
The main objective of this paper is to develop a diagnostic framework for detecting and classifying earthing brush fault types in large turbine generators using shaft voltage and current measurements. Building on the insights from previous studies, the authors leverage both time-domain waveforms and frequency-domain harmonic features of the shaft signals to identify specific signatures corresponding to various brush fault conditions (such as floating or lifted brushes, worn brushes, and contamination by oil or dust). By correlating measurable electrical anomalies with each type of brush failure mode, this work aims to expand the utility of shaft voltage monitoring beyond traditional applications and into a practical tool for predictive maintenance of generator grounding systems. The motivation for this study is to fill a gap in the existing literature and industry practice by improving the early detection of brush degradation or failure to enable maintenance personnel to intervene before minor issues escalate into major failures, thereby enhancing generator reliability and safety.
2. Experimental Methodology
The experimental investigation was carried out on a fleet of large turbo-generators (over five units) ranging from 618 MW to 846 MW (22 kV). In each generator, both shaft current and shaft voltage were measured using a consistent configuration, as depicted in Figure 1. A high-impedance voltage sensing brush at the non-drive end (NDE) of the generator was used to pick up the shaft voltage signal, while a low-impedance current earthing brush at the drive end (DE) provided a path to ground through a shunt resistor. The shunt (0.0496 Ω, 150 A, 1100 W) was connected between the DE brush and ground, and the shaft current was measured across this resistor. In essence, the NDE brush captured the shaft’s electrical potential (voltage) relative to the ground, and the DE brush ensured the shaft was effectively grounded while allowing measurement of the grounding current. Both the voltage brush output and the current shunt output were connected to data acquisition equipment for simultaneous recording of the shaft voltage and shaft current waveforms.
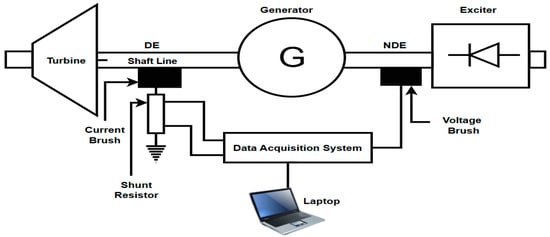
Figure 1.
Turbine generator experimental setup with associated instrumentation systems used to measure shaft current and voltage signals.
The non-drive end (exciter end) is generally preferred for voltage brush placement in diagnostic applications for the following reasons:
- Reduced electromagnetic interference (EMI): The drive end is typically closer to large rotating components such as the turbine shaft, oil pumps, and gearboxes, which introduce significant electromagnetic noise due to their associated control and power electronics. This noise can interfere with low-level voltage measurements. In contrast, the exciter end is relatively isolated and has fewer high-frequency EMI sources, allowing for a cleaner voltage signal [5,15,16,19,28].
- Proximity to excitation system and neutral zone: The non-drive end is typically where the excitation system is installed and is closer to the electrical neutral point of the generator shaft. This results in more consistent shaft-to-ground potential differences, which improves the reliability and reproducibility of voltage signals captured for diagnostic analysis [5,15,16,19,28].
- Thermal and mechanical stability: The exciter end operates at relatively lower mechanical and thermal stress compared to the turbine-connected drive end. Reduced vibration and thermal cycling contribute to more stable electrical contact between the voltage brush and the shaft, which is essential for capturing high-fidelity signals without intermittent arcing or loss of contact [5,15,16,19,28].
- Physical accessibility and sensor protection: Maintenance access is often better at the exciter end, making it more practical to install and maintain sensitive diagnostic brushes and associated instrumentation. This also helps in shielding measurement equipment from oil mist, heat, or vibration-induced wear [5,15,16,19,28].
- The shaft voltage and current signals were captured using a utility-developed digital monitoring platform equipped with the following configuration:
- Sampling Rate: 1 MS/s (1 megasample per second), sufficient to capture transient and harmonic components up to 500 kHz, in line with the Nyquist criterion.
- Resolution: 12-bit analog-to-digital conversion, providing sufficient dynamic range to detect low-level bearing current activity and voltage fluctuations associated with earthing faults.
This configuration allowed high-fidelity waveform recording and accurate FFT-based spectral analysis for identifying fault signatures.
To evaluate the performance of the shaft grounding system and identify fault signatures, a set of controlled tests was conducted representing common earthing brush fault conditions. First, a baseline measurement was obtained under normal operating conditions (healthy brushes with clean contact) for each generator. This baseline served as a reference for comparison. Then, one fault scenario at a time was introduced while keeping other conditions nominal. The tested fault conditions were as follows:
- Floating voltage brush: The voltage-sensing brush at the NDE was intentionally lifted off the shaft (open-circuited), while the current brush at the DE remained in contact to continue grounding the shaft. This simulates a failure or improper seating of the voltage brush. Both shaft voltage and current were recorded during this condition to observe the effect of losing the primary voltage pickup path.
- Floating current brush: The main earthing brush at the DE was lifted, leaving only the high-impedance voltage brush in contact with the shaft. This simulates loss of the primary grounding path. The shaft voltage and current signals were captured to see how the system behaves when the intended current discharge path is interrupted.
- Worn brush: A set of brushes that had reached the end of their usable life (approximately 25% of original length remaining, a point at which utility practice calls for replacement) was installed. Worn brushes typically have reduced contact pressure and potentially irregular contact surfaces. This test examines the impact of brush wear on the continuity of shaft grounding.
- Oil and dust contamination: The shaft earthing brush was contaminated by applying a mixture of turbine seal oil and fine carbon dust to its contact surface. This condition mimics real-world scenarios where oil leaks or carbon dust create an insulating film or abrasive layer at the brush–shaft interface. The resulting shaft voltage and current were measured to determine how contamination affects the electrical contact and grounding performance.
All waveform data (both voltage and current) were later analyzed in the time domain and frequency domain (via FFT analysis) to extract characteristic features associated with each fault condition. By comparing these results against the baseline, the authors identified distinct signatures attributable to each type of brush fault. This methodology ensures that any deviations in shaft voltage or current can be confidently linked to the specific induced fault, thereby providing a basis for diagnosing such issues in practice.
3. Test Results and Measurements
This section highlights that shaft voltage and current measurements provide critical insights into the performance of turbine generator earthing systems. The tests conducted at various power stations across the fleet assessed the impact of floating and worn brushes, as well as contamination by oil and dust, on shaft voltage, shaft current, and harmonic signatures. The fault signatures presented here were obtained through a combination of site-based experimental testing and historical data collection from multiple power stations operating hydrogen-cooled generators ranging from 200 MW to 846 MW at 22 kV. The primary objective was to evaluate shaft voltage and current behavior under both healthy and degraded brush conditions to generate labeled datasets suitable for training the diagnostic model. It is important to note that the results presented in Table 1 represent measurements obtained from a single reference generator unit selected from the fleet. The additional measurements were collected across more than five generator units, with a detailed comparative analysis of fleet-wide trends and variances presented later in the manuscript (see Figures 26 and 27). These figures are referenced here for contextual completeness but are formally discussed in Section 3.3 to preserve the chronological flow of fault condition testing and results. These figures illustrate broader shaft voltage and current behavior under similar fault conditions across the evaluated generator fleet. Table 1 shows power station A baseline results versus all other conditions for both shaft voltage and shaft current under different brush conditions.

Table 1.
Power station a baseline results versus all other conditions for both shaft voltage and shaft current under different brush conditions.
3.1. Power Station A Test Results
This section presents detailed results from fault injection tests conducted at Power Station A, where controlled shaft earthing-brush fault scenarios were introduced and evaluated under steady-state operating conditions. Figure 2, Figure 3, Figure 4, Figure 5, Figure 6, Figure 7, Figure 8, Figure 9, Figure 10, Figure 11, Figure 12 and Figure 13 illustrate the corresponding time-domain and frequency-domain characteristics, enabling a comprehensive diagnosis of the impact of each fault mechanism on the generator shaft earthing system.
3.1.1. Power Station A Floating Voltage Brush Test
The waveform of the floating voltage brush in Figure 2 shows a low amplitude and highly erratic signal compared to the stable baseline. This implies a loss of consistent electrical contact, possibly due to mechanical lifting or poor contact at the brush–shaft interface. Table 1 confirms that the RMS peak voltage drops from 7.13 V to 0.21 V and the average voltage drops from 7.02 V to 0.20 V, effectively nullifying the brush’s ability to regulate shaft potential. DC voltage also falls from 0.01 V to 0.00 V, indicating a complete loss of capacitive coupling or voltage reference.
The FFT spectrum in Figure 3 shows a decrease in harmonic content by over an order of magnitude, indicating that the floating brush fails to couple effectively to the shaft. The absence of dominant harmonics highlights electromagnetic decoupling, reinforcing the interpretation of poor contact or floating potential.
In contrast to the reduced voltage, the scatter plot in Figure 4 shows a substantial increase in shaft current amplitude. Table 1 confirms that increases from 2.66 A to 4.45 A and increases from 2.60 A to 4.35 A. Despite the voltage damping, the increase in shaft current indicates a diversion of current through unintended or higher impedance paths, likely due to the absence of a stable voltage reference. The floating voltage brush condition represents a high-risk operating state.
A floating voltage brush leads to catastrophic loss of shaft voltage control and a dangerous increase in circulating shaft current. At the same time, the shaft current increases significantly, likely rerouting through alternative low-impedance paths such as bearings, leading to elevated risk of electrical discharge machining (EDM) and bearing pitting. It causes an almost complete loss of shaft voltage regulation and more than a 67% increase in shaft current, significantly increasing the risk of equipment damage.
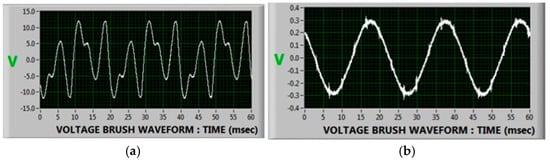
Figure 2.
Power station A shaft voltage brush waveform (V): (a) baseline vs. (b) floating voltage brush.
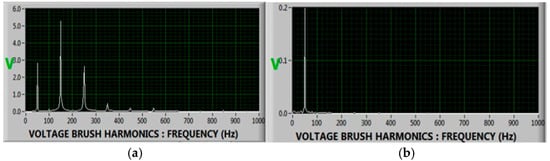
Figure 3.
Power station A shaft voltage brush harmonics (Hz) (FFT): (a) baseline vs. (b) floating voltage brush.
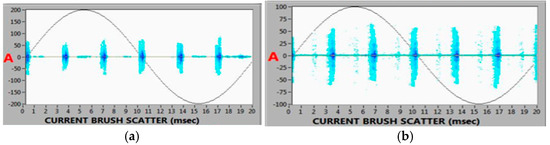
Figure 4.
Power station A current brush scatter plot (A): (a) baseline vs. (b) a floating voltage brush.
3.1.2. Power Station A Floating Current Brush Test
The waveform from the floating current brush in Figure 5 shows truncated voltage peaks, suggesting non-uniform or intermittent contact at the brush–shaft interface. The RMS peak and average voltage values remain largely unchanged ( > ≈ 7.08 V vs. baseline 7.13 V and ≈ 7.00 V vs. 7.02 V). However, the DC voltage component increases sharply from 0.01 V to 0.23 V, indicating loss of symmetrical waveform balance and voltage build-up due to poor current dissipation.
The elevated DC component in the FFT in Figure 6 further supports the presence of unidirectional or pulsed current flow, likely caused by partial insulation or contact arcing.
The scatter plot in Figure 7 indicates a significant reduction in current amplitude compared to the baseline, though a slight spread increase may still be observed. As per Table 1, drops from 2.66 A to 0.92 A and drops from 2.60 A to 0.17 A. This drastic reduction suggests that the floating current brush fails to provide an effective path to ground, forcing most of the shaft current to either dissipate internally or through alternate routes. The floating current brush no longer effectively conducts shaft current, as shown by the sharp drop in both peak and average current values. The increased DC voltage component and the presence of strong even harmonics confirm that the contact is degraded or uneven, creating an unstable electrical interface.
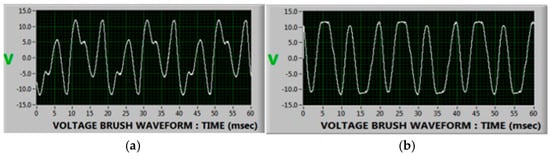
Figure 5.
Power station A shaft voltage brush waveform (V): (a) baseline vs. (b) a floating current brush.
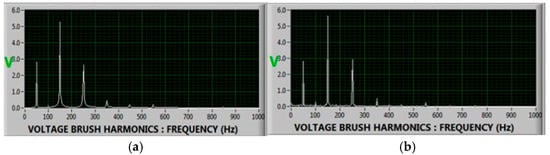
Figure 6.
Power station A shaft voltage brush harmonics (Hz) (FFT): (a) baseline vs. (b) a floating current brush.
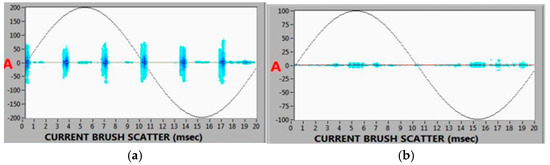
Figure 7.
Power station A current brush scatter plot (A): (a) baseline vs. (b) a floating current brush.
3.1.3. Power Station A Worn Current Brush
The waveform of the worn voltage brush in Figure 8 shows severe distortion compared to the smooth, consistent baseline signal. This distortion reflects irregular or intermittent electrical contact, which prevents the voltage brush from maintaining a steady shaft potential. From Table 1, remains nearly unchanged (7.13 V to 7.05 V), but drops drastically (7.02 V to 0.05 V), indicating intermittent or pulsed voltage conduction rather than stable continuous contact. DC component ( increases slightly (0.01 V to 0.03 V), suggesting asymmetric or unidirectional voltage conduction due to degraded contact. The discrepancy between and under the worn current brush condition is attributed to intermittent contact and surface degradation of the brush. While high-amplitude transients from arcing or sporadic contact maintain the value, the loss of continuous conduction reduces the overall energy content, resulting in a significantly lower . This pattern is a typical indicator of brush wear and deteriorated shaft contact quality.
The FFT in Figure 9 shows a decrease in higher-order harmonics, but there is a notable increase in broadband odd and even harmonics, along with an elevated DC component. The presence of both odd and even harmonics is a signature of arcing, fluctuating impedance, and unstable conduction. This pattern indicates that the brush is no longer acting as a consistent capacitive and resistive coupling path, but rather as a discontinuous conductor, which compromises voltage regulation and monitoring accuracy.
The scatter plot in Figure 10 shows a widespread and high amplitude, with an order of magnitude increase in current fluctuations compared to the baseline. This implies erratic conduction, potentially driven by micro-arcing across gaps or inconsistent pressure between brush and shaft. From Table 1, we see increases from 5.07 A to 5.36 A and increases more significantly from 3.94 A to 5.28 A. These increases indicate that, although the voltage brush fails to regulate voltage consistently, it still conducts high currents in bursts, stressing the shaft grounding path and associated components.
The worn voltage brush introduces a highly unstable electrical interface, where voltage regulation is severely compromised, despite maintaining peak voltage at times. The drop in average voltage and rise in harmonic distortion indicate irregular voltage coupling, characteristic of brush wear, uneven contact pressure, or contamination.
This test reveals that a worn voltage brush fails to provide stable shaft voltage regulation, with average voltage nearly collapsing to zero and a surge in current conduction. The system becomes prone to transient conduction, electrical noise, and potential arcing, significantly raising the risk of rotating machine failure.
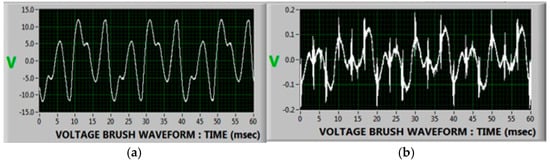
Figure 8.
Power station A shaft voltage brush waveform (V): (a) baseline vs. (b) a worn current brush.
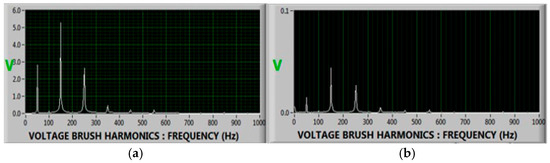
Figure 9.
Power station A shaft voltage brush harmonics (Hz) (FFT): (a) baseline vs. (b) a worn current brush.
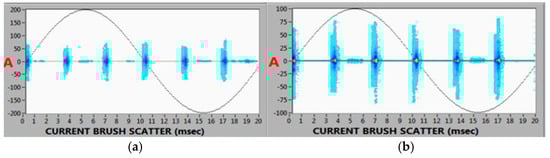
Figure 10.
Power station A current brush scatter plot (A): (a) baseline vs. (b) a worn current brush.
3.1.4. Power Station A Current Brush Exposed to Oil and Dust
The shaft voltage waveform under oil and dust contamination in Figure 11 shows little to no deviation from the baseline waveform. From Table 1, decreases slightly from 7.13 V to 7.03 V. The remains unchanged at 7.02 V and the DC component ( rises marginally from 0.01 V to 0.02 V, indicating a minor increase in asymmetry but not enough to alter the voltage profile significantly. This implies that voltage regulation is not directly impacted by the contamination; the voltage brush continues to couple reasonably well with the shaft.
The FFT spectrum in Figure 12 shows a slight increase in the DC component, aligning with the marginal ( rise seen in Table 1. A modest increase in both odd and even harmonics suggests that surface contamination is introducing minor non-linearities in the contact interface. These harmonic distortions, while not severe, reflect subtle disruptions in the uniformity of the voltage coupling path, possibly due to the inconsistent conductivity introduced by oil films or particulate debris.
The scatter plot in Figure 13 displays a significant broadening and increased amplitude, indicating more erratic and higher-magnitude current conduction events. From Table 1, increases dramatically from 2.66 A to 5.23 A and nearly doubles from 2.6 A to 4.96 A. These substantial increases imply that the contaminants are facilitating unintended conductive paths, likely through localized film breakdown or bridging, resulting in transient high-current spikes.
Although the voltage waveform appears stable, the shaft current increases drastically, suggesting that the contaminants (oil and dust) are disrupting the current path more than the voltage path. The increased current magnitude and scatter plot amplitude signal erratic conduction, possibly through temporary low-resistance paths created by contaminant bridging or arcing across localized surface irregularities. Contamination of the current brush by oil and dust does not significantly alter shaft voltage regulation, but it severely degrades the stability of current conduction, resulting in high-magnitude, erratic current surges.

Figure 11.
Power station A shaft voltage brush waveform (V): (a) baseline vs. (b) when the current brush is exposed to dust and oil.
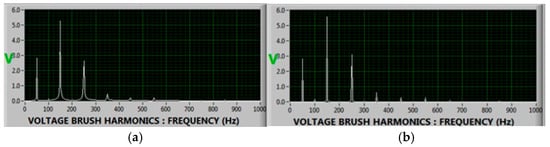
Figure 12.
Power station A shaft voltage brush harmonics (Hz) (FFT): (a) baseline vs. (b) when the current brush is exposed to dust and oil.
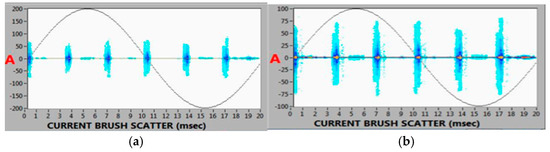
Figure 13.
Power station A current brush scatter plot (A): (a) baseline vs. (b) when the current brush is exposed to dust and oil.
3.2. Power Station B Test Results
The summarized comparison Table 2 showing Power Station B baseline results versus all other conditions for both shaft voltage and shaft current under different brush conditions (floating voltage brush, floating current brush, worn brush, and oil and dust contamination).
Table 2.
Power station B baseline results versus all other conditions for both shaft voltage and shaft current under different brush conditions.
3.2.1. Power Station B Floating Voltage Brush Test
The waveform for the floating voltage brush condition in Figure 14 shows a low-amplitude and erratic pattern compared to the baseline. From Table 2, although increases slightly (7.21 V to 7.94 V), the RMS average voltage drops significantly (6.56 V to 0.78 V), and decreases from 0.13 V to 0.07 V. This indicates that while the shaft may momentarily reach high voltage peaks, the sustained coupling is weak and unstable, failing to maintain a consistent potential due to intermittent or floating brush contact.
The voltage harmonics in Figure 15 decrease by more than an order of magnitude. This flattening of the FFT spectrum indicates loss of consistent periodic voltage disturbances, which typically arise from stable brush contact. The reduction suggests a decoupling effect: the brush no longer acts as an effective capacitive pickup or voltage probe, likely floating or intermittently contacting the shaft surface.
The scatter plot in Figure 16 shows a substantial increase in current amplitude, with a dense core and prominent main harmonic. This is consistent with transient current spikes due to unstable grounding paths. The increase in (0.47 A to 1.60 A) and (0.55 A to 1.54 A) signals increased current conduction through unintended paths, such as generator bearings, which poses a significant risk of bearing pitting and insulation degradation.
The floating voltage brush condition results in unstable voltage coupling and dangerously elevated shaft current, posing a direct risk to generator bearings and shaft insulation. Although the voltage peak may rise due to capacitive charging, the average voltage collapse confirms the brush is no longer functioning as intended. Voltage instability (sharp drop in average voltage) suggests ineffective brush contact, reducing the ability to monitor or control shaft potential. Significant current rise indicates that shaft current is discharging through alternate paths, most likely via generator bearings or housing. The presence of dominant harmonics and transient current behavior raises concern for electrical discharge machining (EDM), which can shorten bearing life and lead to catastrophic generator failure if undetected.
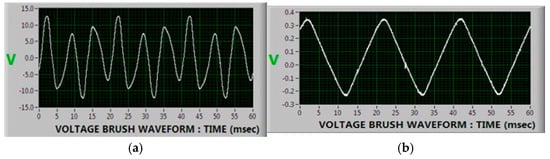
Figure 14.
Power station B shaft voltage brush waveform (V): (a) baseline vs. (b) a floating voltage brush.
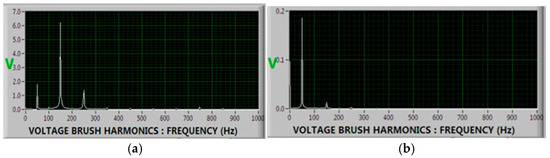
Figure 15.
Power station B shaft voltage brush harmonics (Hz) (FFT): (a) baseline vs. (b) a floating voltage brush.
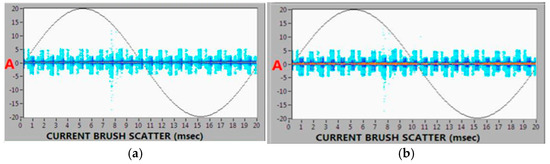
Figure 16.
Power station B current brush scatter plot (A): (a) baseline vs. (b) a floating voltage brush.
3.2.2. Power Station B Floating Current Brush Test
The waveform under the floating current brush condition in Figure 17 reveals an erratic voltage behavior. The harmonic spectrum reveals a notable increase in even harmonics (especially 2nd and 4th), which is diagnostic of degraded or intermittent brush contact. This periodic distortion implies intermittent mechanical contact between the brush and the shaft, leading to unstable electrical conduction. From Table 2, the RMS peak voltage rises slightly (7.21 V to 7.67 V), but the RMS average increases more substantially (6.56 V to 7.55 V), and increases sharply (0.13 V to 0.75 V). This sharp rise in DC voltage indicates a loss of AC symmetry, often caused by unidirectional or pulsed conduction due to brush lift-off or sparking.
The FFT spectrum in Figure 18 shows a pronounced increase in even harmonics, particularly the 2nd and 4th, alongside a stronger DC component. These harmonics are typical indicators of poor brush contact, mechanical asymmetry, or electrical imbalance.
The scatter plot in Figure 19 reveals a modest increase in current amplitude compared to the baseline, but the spread of the pulses is wider, indicating less stable conduction. From Table 2, increases from 0.47 A to 1.37 A and rises from 0.55 A to 1.22 A. These increases confirm that the brush is intermittently allowing large current spikes, likely during moments of brief physical contact, characteristic of arcing or sparking discharges.
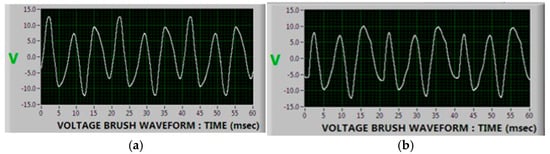
Figure 17.
Power station B shaft voltage brush waveform (V): (a) baseline vs. (b) a floating current brush.
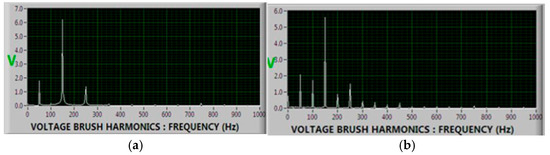
Figure 18.
Power station B shaft voltage brush harmonics (Hz) (FFT): (a) baseline vs. (b) a floating current brush.
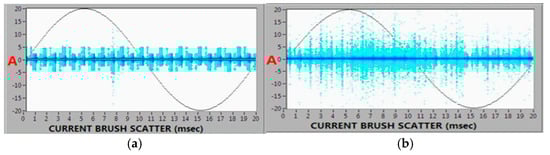
Figure 19.
Power station B current brush scatter plot (A): (a) baseline vs. (b) a floating current brush.
The floating current brush condition leads to unstable voltage conduction and increased discharge currents due to poor mechanical contact and intermittent brush engagement. The presence of strong even harmonics and a dominant DC bias reflects significant waveform distortion, posing a high risk to generator reliability and long-term operational integrity. The floating current brush creates an unstable electrical interface where the voltage signal remains high but distorted. The rise in average voltage and DC component signals loss of clean sinusoidal characteristics, often caused by charging effects or rectified conduction through arcing.
3.2.3. Power Station B Worn Current Brush
The waveform from the worn voltage brush contaminated by oil and dust in Figure 20 shows severe distortion, unlike the smooth sinusoidal shape of the baseline. This distortion indicates unstable and inconsistent electrical contact, where contamination disrupts the interface between brush and shaft, likely through variable resistance or insulating films. According to Table 2, rises slightly from 7.21 V to 7.94 V, increases modestly from 6.56 V to 7.01 V, and increases dramatically from 0.13 V to 3.72 V. The DC offset spike strongly indicates non-linear or unidirectional current flow, possibly due to surface arcing, partial conduction through contamination layers, or dielectric charging effects.
The FFT spectrum in Figure 21 reveals a reduction in dominant high-frequency harmonics and a broad increase in both odd and even harmonic content. This shift in the harmonic profile is consistent with non-linear and unstable conduction paths, such as those introduced by film contamination or carbon tracking on the brush surface. The increased broadband harmonic energy suggests that voltage irregularities are no longer periodic but random and wideband, confirming significant brush degradation and signal distortion.
The scatter plot in Figure 22 exhibits a large amplitude increase and a much wider dispersion of data points compared to the baseline. From Table 2, increases from 0.47 A to 1.60 A and increases from 0.55 A to 1.54 A. These values reflect more than a threefold increase in shaft current, suggesting transient high-energy discharges, likely caused by arcing, leakage currents, or unstable surface conduction through the worn brush path.
The test clearly shows that a worn voltage brush contaminated with oil and dust results in unstable, asymmetric voltage conduction and elevated shaft current, creating a high-risk operational state. The combination of increased DC offset, broadband harmonics, and severe current surges undermines generator reliability and significantly raises the risk of failure. Oil and dust contamination compromises the brush’s contact integrity, introducing instabilities in voltage regulation and promoting uncontrolled current discharges. The extremely high DC voltage component implies rectified or unidirectional conduction, possibly due to a breakdown in insulation or brush arcing.
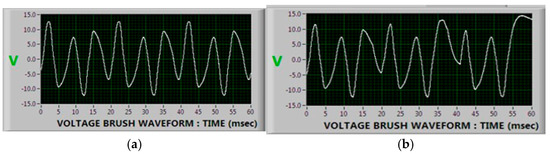
Figure 20.
Power station B shaft voltage brush waveform (V): (a) baseline vs. (b) a worn current brush.
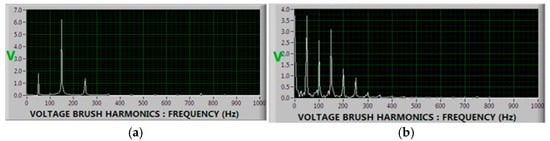
Figure 21.
Power station B shaft voltage brush harmonics (Hz) (FFT): (a) baseline vs. (b) a worn current brush.
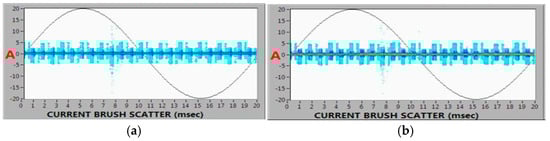
Figure 22.
Power station B current brush scatter plot (A): (a) baseline vs. (b) a worn current brush.
3.2.4. Power Station B Current Brush Exposed to Oil and Dust
The voltage waveform under oil and dust contamination in Figure 23 appears visually similar to the baseline, indicating that the general shape of the waveform is preserved. However, subtle instabilities may be masked visually but are evident in the numerical and frequency domain analysis. From Table 2, decreases slightly from 7.21 V to 6.89 V, remains nearly the same (6.56 V to 6.63 V), and increases significantly from 0.13 V to 0.78 V. The increase in DC offset suggests that the contamination introduces asymmetry in conduction, possibly due to film build-up or variable contact resistance.
The FFT in Figure 24 reveals a noticeable rise in DC and low-order harmonics, with broadband increases in both odd and even harmonics. The contamination alters surface impedance, resulting in irregular conduction paths and minor discharges that cause low-level, widespread harmonic distortion.
The current scatter plot in Figure 25 shows a dramatic increase in amplitude and broader dispersion, reflecting erratic and intensified discharge currents. From Table 2, increases more than 3× from 0.47 A to 1.55 A and nearly triples from 0.55 A to 1.48 A. This suggests the contaminated brush path enables frequent high-energy discharge events, potentially via conductive bridges formed by carbon dust, oil, or moisture.

Figure 23.
Power station B shaft voltage brush waveform (V): (a) baseline vs. (b) a voltage brush is exposed to oil and dust.

Figure 24.
Power station B shaft voltage brush harmonics (Hz) (FFT): (a) baseline vs. (b) a voltage brush is exposed to oil and dust.
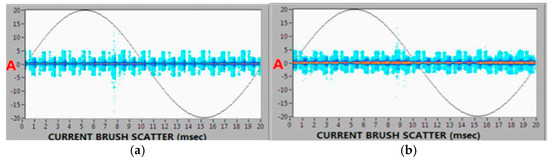
Figure 25.
Power station B current brush scatter plot (A): (a) baseline vs. (b) when the current brush is exposed to dust and oil.
Oil and dust contamination severely compromises the electrical integrity of the voltage brush, causing significant current fluctuations, harmonic distortion, and a high DC voltage offset. These changes signal uncontrolled discharge activity and escalating thermal stress, which collectively undermine brush life, shaft insulation, and overall generator reliability.
3.3. Comparative Analysis of Shaft Voltage and Current Fault Signatures Across Multiple Power Stations (A, B, C, D and E)
The selected power stations (A through E) vary in rated capacity, years in service, and excitation system architecture, offering a diverse dataset for examining the influence of machine configuration on shaft earthing performance as shown in Table 3. The purpose of this comparison is to understand how generator design parameters such as power rating, excitation system type, age, and OEM correlate with the characteristics and severity of shaft grounding anomalies.
Table 3.
Generator design parameters across power stations A–E.
The floating voltage brush exhibits drastic voltage normalization drop across all stations as shown in Figure 26. Worn brushes show moderate reduction (~0.6–0.8 p.u.), reflecting partial but unstable contact. Contaminated brushes yield inconsistent behavior likely due to varying oil/dust adherence and local surface leakage effects.
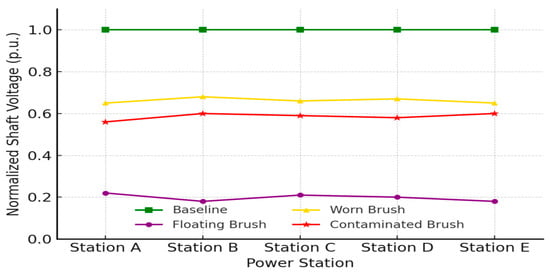
Figure 26.
Normalized shaft voltage comparison across stations under different fault conditions.
Floating brushes caused severe current suppression in Station A and C confirming ineffective current dissipation as shown in Figure 27. Contamination brushes showed elevated or fluctuating current levels across most stations. Station E recorded consistently high normalized shaft current, indicating ongoing discharge through contaminated or degraded brush paths. Shaft current normalization is highly sensitive to floating current brush faults and is also valuable for diagnosing contamination-related discharge paths.
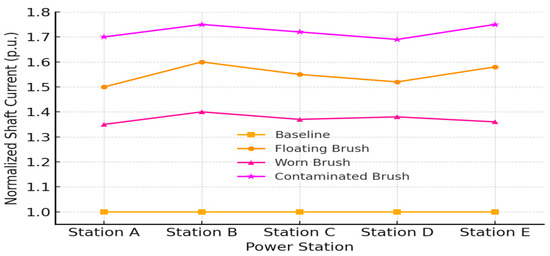
Figure 27.
Normalized shaft current comparison across stations under different fault conditions.
Synthesis and fault classification implications play a critical role in linking the observed electrical behavior (shaft voltage and current signatures) to the underlying physical condition of generator brush systems. It serves as a diagnostic decision-support tool for condition monitoring and fault classification of shaft earthing brush systems across turbine generators. Table 4 acts as a diagnostic bridge between electrical signatures and physical faults in shaft grounding systems. It is especially valuable for utilities implementing condition-based monitoring strategies and designing automated fault detection models. Its use enhances diagnostic confidence, operational efficiency, and system reliability.
Table 4.
Synthesis and fault classification implications.
4. Key Finding and Discussion
Through a series of controlled site tests on multiple turbo-generators, the authors demonstrated that distinct earthing brush fault conditions (floating brushes, worn brushes, and contamination scenarios) produce measurable and characteristic changes in shaft voltage and current. These findings validate that an online monitoring approach can indeed distinguish multiple fault types, which was the core goal. For example, this study showed that shaft voltage/current measurements responded clearly to each induced fault, confirming the viability of using these electrical signals as diagnostic indicators. In essence, the measured results provided fault-specific signatures that can be used to detect and classify earthing brush issues, thus expanding shaft voltage monitoring into the domain of brush fault diagnostics.
It is worth noting that this paper not only identifies the fault signatures but also discusses how they could form the basis of a broader diagnostic framework. While a full implementation of an automated classification system (e.g., using machine learning) was not detailed, the authors established the necessary link between fault conditions and signal patterns. This lays groundwork for any future classifier, satisfying the intent of the objectives. Overall, the experimental outcomes match the original aims by proving that advanced analysis of shaft voltages and currents can reliably indicate various earthing brush faults.
The testing yielded several key findings, each corresponding to a particular brush fault scenario. These findings not only demonstrate the distinctive electrical signatures of each fault but also carry important operational implications for generator reliability:
- Floating Voltage Brush Fault: When the voltage-sensing brush was intentionally lifted off the shaft, the shaft voltage signal dropped to near-zero (from a normal ~7 V RMS down to ~0.2 V) indicating the brush was no longer picking up the shaft potential. This effectively meant the machine lost its reference for shaft voltage. Despite the voltage brush floating, the shaft current increased significantly and the average grounding current rose by over 67% relative to baseline. The data imply that without the high-impedance voltage brush in place, the shaft’s charge had to discharge through other paths (potentially through bearings or other unintended routes). This condition represents a high-risk state: the loss of voltage regulation and surge in current can lead to electrical discharge machining (spark erosion) in bearings and other damage. Operationally, a floating voltage brush can go unnoticed (since the machine will still run) but it silently elevates wear and tear. The finding underlines the importance of detecting a lifted or failed voltage brush early as, while it does not directly trip the machine, it compromises protection and accelerates damage to critical components.
- Floating Current Brush Fault: This fault, simulating the loss of the main earthing brush, had an opposite electrical effect. Here the shaft grounding path was broken at the drive end, leaving only the high-impedance voltage brush in contact. The result was that the shaft current dropped essentially to zero through the intended path (from ~2.6 A normal down to <1 A), since the primary current discharge brush was offline. However, the shaft voltage did not drop, it remained at roughly the same 7 V amplitude as baseline. Instead, the voltage waveform became distorted: it showed truncated peaks and developed a DC offset of about 0.23 V where normally virtually no DC would be present. In the frequency domain, strong even-order harmonics (2nd, 4th, etc.) appeared, which is a telltale sign of intermittent or rectifying contact. The interpretation is that with the current brush floating, the shaft was effectively ungrounded, causing charge to accumulate until sporadic discharges occurred (hence the pulsed, uneven waveform). In practice, a floating current brush is extremely dangerous. This study shows the shaft is no longer properly earthed, forcing the current to find “alternate routes” such as through bearing oil films or other parts of the machine. This greatly increases the risk of bearing damage (pitting, fluting) and even flashover if the accumulated voltage spikes high. This finding underscores that a failed earthing brush must be detected and remedied immediately; the generator is one insulation breakdown away from a serious fault in this condition.
- Worn Brush Fault: Using an excessively worn earthing brush (nearly end-of-life) produced a very unstable electrical response. The shaft voltage became highly erratic, with the average measured voltage collapsing from ~7 V to essentially 0.2 V in the worst moments. Unlike the clean “off” of a lifted brush, a worn brush still made contact sporadically; this led to irregular, fleeting connections between shaft and ground. The voltage waveform was severely distorted and the FFT indicated a broad spread of both odd and even harmonics, along with elevated DC component, consistent with continuous micro-arcing and fluctuating impedance at the brush interface. The shaft current under this condition showed large fluctuations and spikes; in fact, the data showed an order-of-magnitude increase in current variability compared to normal. Essentially, the brush was no longer providing a steady path, but when contact momentarily occurred, large surge currents flowed. The authors note this results in transient conduction and electrical noise, greatly raising the risk of arc damage and even generator trip or rotor earth fault due to instability. Operational implication: a worn-out brush can mimic some of the worst aspects of a completely failed brush (loss of consistent grounding) while intermittently conducting high currents that stress the system. This finding highlights why utilities have standards to replace brushes well before they wear out completely. It also shows that monitoring can detect brush degradation: even before total failure, the signature of increasing harmonic noise and erratic current can serve as an early warning that a brush needs replacement.
- The more pronounced increase in observed at Station B under floating and worn brush conditions, compared to Station A, may be attributed to differences in generator shaft geometry, excitation system configuration, and grounding path impedance. Station B is equipped with a 24-pulse static excitation system, which introduces higher-frequency ripple components and a broader harmonic spectrum than the 6-pulse system used at Station A. These high-frequency components are more likely to cause voltage build-up when the shaft grounding path is compromised, leading to more pronounced voltage spikes during brush degradation. Both units are of similar size (~600 MW), but operational data suggest that Station B operates closer to full load more consistently. Higher field excitation at full load may result in greater shaft-induced voltages when brush contact deteriorates, amplifying values. These differences underscore the importance of site-specific grounding system characteristics when interpreting shaft voltage behavior.
- Brush Contamination (Oil and Dust) Fault: In this scenario, the earthing brush was fouled with seal oil and dust which is a common real-world issue when oil seals leak and mix with carbon dust. Interestingly, the shaft voltage waveform remained largely unchanged relative to the clean baseline; the RMS and average voltage values stayed around 7 V with only negligible drop. This indicates the voltage brush could still capacitively couple to the shaft despite the contamination film. However, the shaft current behavior changed dramatically. The current trace became erratic with significantly higher amplitude excursions. Quantitatively, the peak grounding current roughly doubled (e.g., from ~2.6 A to ~5.2 A in one measure) under contaminated conditions. The current scatter plots showed a much broader spread of values, evidencing frequent spikes. The analysis concluded that oil/dust contaminants create intermittent conductive bridges or alter the contact resistance in unpredictable ways, causing surges of current even though the average voltage is not altered. In operational terms, this finding is critical: Contamination might not be immediately obvious from simple voltage monitoring alone, but it can severely degrade the stability of the grounding system, leading to high-magnitude current surges. Those surges can accelerate brush wear, cause localized heating, or even momentarily route current through undesirable paths if the brush contact is partially insulating at times. The implication is that monitoring of the current signal (in addition to voltage) is essential to catch contamination issues. A generator with a contaminated brush may appear normal in voltage, but it is silently experiencing stress that could precipitate a failure if left unaddressed.
- Units equipped with 24-pulse static excitation systems (e.g., Station B) demonstrated cleaner harmonic profiles and more stable RMS values during baseline conditions. In contrast, 6-pulse static excitation systems (Stations A, D, and E) showed higher harmonic distortion and were more sensitive to brush degradation, as reflected in the increased DC offsets and erratic waveforms. These excitation systems influence the dominant frequency components and the system’s susceptibility to shaft voltage build-up due to high-frequency ripple currents.
- Higher-rated units (e.g., Stations D and E, ~846 MW) displayed higher shaft current amplitudes and a broader spread in excitation current scatter plots under faulty conditions, likely due to increased magnetic field strength and capacitive coupling effects. Smaller machines like Station C (200 MW) showed narrower fault envelopes and lower harmonic amplitudes, which may require different diagnostic thresholds.
- Older units (e.g., Station A, 41 years in service) tend to exhibit increased baseline shaft voltage levels, possibly due to insulation aging, shaft surface degradation, or legacy brush materials. In contrast, newer machines (e.g., Station D) with modern grounding architecture showed more abrupt changes in response to brush faults, making early detection easier but requiring finer resolution in monitoring equipment.
- Observed discrepancies in brush performance were also influenced by station-specific maintenance history, brush material (e.g., grade or grain orientation), and environmental conditions (e.g., oil contamination). These differences further justify the recommendation to adopt site-specific diagnostic thresholds rather than applying a one-size-fits-all approach.
Collectively, these findings confirm that shaft voltage and current measurements are highly sensitive to earthing brush conditions, fulfilling this paper’s diagnostic purpose. Each fault type produced a unique signature that can be used for identification: loss of all harmonics and voltage = lifted voltage brush; high even-harmonics + zero current = lifted current brush; broadband noise and surging current = worn brush; stable voltage with spiking current = contamination. This means that in practice, a monitoring system could potentially not only detect that there is a problem but also suggest what type of brush fault is occurring, based on the pattern. That addresses the original goal of classification of brush fault types.
The key takeaway is that any degradation in brush performance has a direct, measurable effect on generator electrical conditions and can quickly escalate risk. A failed or ineffective earthing brush can lead to bearing damage, reduced machine life, or unplanned outages. Therefore, implementing these advanced diagnostic techniques would provide early warning of these issues. In real terms, if a plant were tracking these parameters, they could be alerted to, say, a floating brush condition (via a sudden drop in shaft voltage reading or surge in current noise) and schedule a shutdown to fix it before a bearing fails. This study essentially demonstrates the value of moving from rudimentary checks (or waiting for visual inspection at outages) to continuous electrical monitoring for the shaft grounding system.
In summary, the findings strongly support the notion that proactive monitoring of shaft voltage and current can significantly enhance reliability. By detecting brush faults early, whether it is a loose connection, a deteriorating brush, or contamination, maintenance can be performed before catastrophic damage occurs. The data and discussion provided in this report give a clear mapping from measured symptom to fault cause, which is extremely useful for engineering teams looking to implement condition-based maintenance on turbine generators.
While the present study focused on steady-state operating conditions to ensure controlled analysis of shaft earthing brush fault signatures, it is important to recognize that actual generator operation involves dynamic transitions, including start-up, shutdown, and load-following scenarios. These changes can significantly affect the signal characteristics of shaft voltage and current.
Increased generator loading typically leads to higher excitation current, which can amplify shaft voltage amplitudes and alter the harmonic spectrum, particularly in machines with 6-pulse excitation systems where harmonic ripple is more pronounced. Conversely, brushless or 24-pulse excitation systems exhibit more stable harmonic profiles under varying loads. During transient events such as start-up and shutdown, abrupt changes in shaft speed and magnetic flux distribution can introduce non-fault-related voltage spikes and transient harmonic distortion. These effects can potentially mask fault signatures or generate false positives in real-time diagnostic systems if not properly accounted for.
Therefore, while the findings presented in this study establish clear baseline thresholds under steady-state conditions, future research should extend this analysis to dynamic operating regimes. This would enable the development of adaptive diagnostic thresholds and filtering algorithms capable of distinguishing true fault conditions from load-induced transients, ultimately improving reliability in online monitoring systems.
5. Conclusions
This study successfully demonstrated that shaft voltage and current monitoring can be used as an advanced diagnostic tool for the detection and classification of earthing brush faults in large turbine generators. By systematically analyzing the electrical behavior of generators under baseline and faulted conditions, specifically, floating brushes, worn brushes, and brushes contaminated with oil and dust, this research established clear, fault-specific electrical signatures observable through both time-domain waveforms and frequency-domain (FFT) analysis.
The results confirmed that each fault condition produces a distinct and measurable impact on shaft voltage and shaft current behavior:
- Floating voltage brushes lead to near-total loss of average shaft voltage with elevated shaft current surges, indicating a high risk of uncontrolled shaft discharges.
- Floating current brushes cause significant DC voltage offsets and intermittent conduction patterns, severely compromising the shaft grounding system and raising the likelihood of bearing damage.
- Worn brushes produce unstable conduction characterized by truncated waveforms, strong DC bias, increased even-order harmonics, and erratic, high-amplitude current spikes.
- Oil and dust contamination subtly affect the voltage waveform but cause substantial degradation of current conduction, leading to unstable, high-current discharge behavior despite a visually stable voltage profile.
The experiments conducted across multiple large-scale generators confirmed that shaft voltage and current signals are highly sensitive to the health of the earthing brushes. Notably, it was demonstrated that even early-stage deterioration, such as minor contamination or partial brush wear, introduces detectable anomalies in the electrical signatures, allowing for fault detection well before catastrophic failure.
This study not only verified that online shaft voltage and current monitoring can detect earthing brush degradation but also provided a detailed mapping between electrical measurements and specific fault types. This positions the methodology as a strong candidate for integration into predictive maintenance frameworks for power plant operators.
In conclusion, the study provides compelling evidence that
- Shaft voltage and shaft current analysis offer a reliable, sensitive method for early detection and classification of earthing brush faults.
- Combining time-domain and frequency-domain features significantly improves diagnostic accuracy.
- Proactive monitoring of earthing brushes can enhance generator reliability, reduce forced outages, and extend asset life.
To support implementation in online monitoring systems, preliminary diagnostic thresholds were derived from controlled brush fault testing conducted across Power Stations A to E, covering a range of generator configurations and fault types. The following trends were consistently observed:
- A drop of more than 30–40% from the healthy baseline reliably indicated worn or intermittently contacting brushes, suggesting impaired electrical continuity at the brush–shaft interface.
- A DC offset increase exceeding 0.1–0.2 V was associated with floating or contaminated brush conditions, reflecting asymmetrical grounding and loss of stable discharge paths.
- Shaft current RMS peak values increased by over 100% in several fault scenarios, particularly under worn or oil-contaminated brushes, due to uncontrolled current surges.
- Shaft current RMS average values rose by more than 30–40%, consistent with elevated conduction instability.
- Conversely, a drop exceeding 90% in current RMS average served as a reliable indicator of complete brush lift-off or severe contact loss.
Additionally, harmonic analysis revealed a 20–50% rise in low-order harmonic amplitudes (1st to 5th) under faulted conditions, with spectral distortions reflecting the underlying degradation mechanisms. While these thresholds are indicative and subject to variation across unit design and excitation topology, they provide a practical starting point for real-time condition monitoring and predictive diagnostics. Fleet-specific calibration and threshold tuning are recommended for integration into advanced global condition monitoring systems.
Future work should focus on automating the fault classification process such as through machine learning algorithms and integrating these diagnostics into real-time shaft monitoring systems to further support condition-based maintenance strategies. This study primarily aimed to correlate electrical signal behavior with brush condition under controlled fault scenarios using online monitoring techniques. While post-test physical validation of the observed electrical fault signatures using methods such as Scanning Electron Microscopy (SEM), Transmission Electron Microscopy (TEM), or Optical Microscopy (OM) was not performed, it is considered a valuable extension for future research.
Author Contributions
Conceptualization, K.O.M. and A.K.S.; methodology, K.O.M. and A.K.S.; investigation, K.O.M. and A.K.S.; resources, K.O.M. and A.K.S.; writing—original draft preparation, K.O.M. and A.K.S.; writing—review and editing, K.O.M. and A.K.S.; supervision, A.K.S.; project administration, A.K.S. All authors have read and agreed to the published version of the manuscript.
Funding
This research received no external funding.
Data Availability Statement
The original contributions presented in the study are included in the article, further inquiries can be directed to the corresponding author.
Conflicts of Interest
The authors declare no conflicts of interest.
References
- Alger, P.L.; Samson, H.W. Shaft currents in electric machines. Trans. AlEE 1924, 42, 235–245. [Google Scholar]
- Tawfiq, B.K.; Güleç, M.; Sergeant, P. Bearing current and shaft voltage in electrical machines: A comprehensive research review. Adv. Power Electron. Technol. Electr. Drive Syst. 2023, 11, 550. [Google Scholar] [CrossRef]
- Mailula, K.O.; Saha, A.K. A Comprehensive Review of Shaft Voltages and Bearing Currents, Measurements and Monitoring Systems in Large Turbogenerators. Energies 2025, 18, 2067. [Google Scholar] [CrossRef]
- Verma, S.P. Damages due to shaft-potentials in modern generators. In Proceedings of the Joint International Power Conference Athens Power Tech, Athens, Greece, 5–8 September 2002. [Google Scholar]
- Stone, G.; Lloyd, B.; Sasic, M. Monitoring of shaft voltages and grounding currents in rotating machines. In Proceedings of the 17th International Conference Electrical Machine Systems, Hangzhou, China, 22–25 October 2014. [Google Scholar]
- Ammann, C.; Posedel, Z.; Joho, R.; Reichert, K. Shaft voltages in generators with static excitation systems—Problems and Solutions. IEEE Trans Energy Convers. 1988, 3, 409–419. [Google Scholar] [CrossRef] [PubMed]
- Ahmed, M.S.; Mahdi, H.F. Investigation of bearing current in a Gas Turbine generator due to static excitation system. In Proceedings of the 2013 IEEE Student Conference on Research and Development, Putrajaya, Malaysia, 13–14 December 2015. [Google Scholar]
- Muetze, A. On a New type of Inverter-Induced bearing current in large drives with one journal bearing. IEEE Trans. Ind. Appl. 2010, 46, 240–248. [Google Scholar] [CrossRef]
- Muetze, A.; Binder, A. Calculation of circulating bearing currents in Machines of Inverter-Based Drive Systems. IEEE Trans. Ind. Electron. 2007, 54, 932–938. [Google Scholar] [CrossRef]
- Zhu, W.; De Gaetano, D.D.; Chen, X.; Jewell, G.W.; Hu, Y. A Review of modeling and mitigation techniques for bearing currents in electrical machines with variable-frequency drives. IEEE Access 2022, 10, 125279–125297. [Google Scholar] [CrossRef]
- Buckley, G.W.; Corkins, R.J.; Stephens, R.N. The Importance of grounding brushes to safe operations of large turbine generators. IEEE Trans. Energy Convers. 1988, 3, 607–612. [Google Scholar] [CrossRef] [PubMed]
- Sohre, J.S. Shaft riding brushes to control electric stray currents. In 20th Turbomachinery Symposium; Texas A&M University, Turbomachinery Laboratories: College Station, TX, USA, 1991; pp. 63–76. [Google Scholar]
- Nippes, P.I. Early warning of developing problems in rotating machinery as provided by monitoring shaft voltages and grounding currents. IEEE Trans. Energy Convers. 2004, 19, 340–345. [Google Scholar] [CrossRef]
- Nippes, P.I.; Elizabeth, P.E.; Galano, S. Understanding Shaft Voltage and Ground Currents of Turbine Generators. Gaussbusters. Available online: www.gaussbusters.com (accessed on 5 October 2024).
- Higgins, S. Rotating Machine Shaft Signal Monitoring Method and System. Eskom Patent US 2011/0313701 A1, 7 September 2011. [Google Scholar]
- Pedneault-Desroches, J.; Merkhouf, A.; Al-Haddad, K. Hydrogenerators’ vulnerability towards bearing Insulation systems, shaft voltage and current. In Proceedings of the 2023 IEEE Electrical Insulation Conference (EIC), Quebec City, QC, Canada, 18–21 June 2023. [Google Scholar]
- de Canha, D.; Cronje, W.A.; Meyer, A.S.; Hoffe, S.J. Methods for diagnosing static-eccentricity in a synchronous 2 pole generator. In Proceedings of the 2007 IEEE Lausanne Power Tech, Lausanne, Switzerland, 1–5 July 2007; pp. 2162–2167. [Google Scholar]
- Doorsamy, W.; Cronje, W.A.; Meyer, A.S. Multiple fault diagnosis on a synchronous 2 pole generator using shaft and flux probe signals. In Proceedings of the 2013 IEEE International Conference on Industrial Technology (ICIT), Cape Town, South Africa, 25–28 February 2013; pp. 362–367. [Google Scholar]
- Pedneault-Desroches, J.; Merkhouf, A.; Al-Haddad, K. Shaft current diagnostics in large salient-pole generators. In Proceedings of the 2022 International Conference on Electrical Machines (ICEM), Valencia, Spain, 5–8 September 2022. [Google Scholar]
- Darques, K.; Tounzi, A.; Menach, Y.L.; Beddek, K. Analysis of shaft voltage of large turbo-generators for rotor defect detection purposes. In Proceedings of the 19th International Symposium on Electromagnetic Fields in Mechatronics, Electrical and Electronic Engineering (ISEF), Nancy, France, 29–31 August 2020. [Google Scholar]
- Torlay, J.-E.; Corenwinder, C.; Audoli, A.; Herigault, J.; Foggia, A. Analysis of shaft voltages in large synchronous generators. In Proceedings of the IEEE International Electric Machines and Drives Conference. IEMDC’99, Seattle, WA, USA, 9–12 May 1999. [Google Scholar]
- Pe, T.; Zhang, H.; Hua, W.; Zhang, F. Comprehensive Review of Bearing Currents in Electrical Machines: Mechanisms, Impacts, and Mitigation Techniques. Energies 2025, 18, 517. [Google Scholar] [CrossRef]
- Yucai, W. Diagnosis of turbine generator typical faults by shaft voltage. In Proceedings of the IEEE Industry Applications Society Annual Meeting, Las Vegas, NV, USA, 7–11 October 2012. [Google Scholar]
- Hoffe, S.J. Synchronous Generator Fault Diagnosis Using Shaft Signal Measurements. Master’s Thesis, School of Electrical and Information Engineering, University of the Witwatersrand, Johannesburg, South Africa, 2006. [Google Scholar]
- William Oh, H. Willwerth Shaft Grounding-A Solution to Motor Bearing Currents. In Proceedings of the ASHRAE Transactions, Atlanta, GA, USA, 5 November 2008; Volume 114, pp. 246–251. [Google Scholar]
- Mailula, K.O.; Higgins, S.; Singh, A.; Moloi, S. Detection of Generator Earth-brush Fault Types from Shaft Voltage and Currents Measurements to monitor the performance of Earthing Brushes. In Power Generation and Electromechanical Energy Conversion (A1); CIGRE: Paris, France, 2024. [Google Scholar]
- Berhausen, S.; Jarek, T. Method of limiting shaft voltages in AC electric machines. Energies 2021, 14, 3326. [Google Scholar] [CrossRef]
- Nippes, P.I.; Sohre, J.S. Electromagnetic shaft currents and demagnetization on rotors of turbines and compressors. In Proceedings of the 10th Turbomachinery Symposium, TX, USA, 23 August 1978; Available online: https://oaktrust.library.tamu.edu/items/74a1a11d-df15-47c6-9f3b-c85c0d5bc982 (accessed on 2 July 2024).
- Nippes, P.I. Magnetism and stray currents in rotating machinery. Trans. Am. Soc. Mech. Eng. 1996, 118, 228. [Google Scholar] [CrossRef]
Disclaimer/Publisher’s Note: The statements, opinions and data contained in all publications are solely those of the individual author(s) and contributor(s) and not of MDPI and/or the editor(s). MDPI and/or the editor(s) disclaim responsibility for any injury to people or property resulting from any ideas, methods, instructions or products referred to in the content. |
© 2025 by the authors. Licensee MDPI, Basel, Switzerland. This article is an open access article distributed under the terms and conditions of the Creative Commons Attribution (CC BY) license (https://creativecommons.org/licenses/by/4.0/).