Abstract
Enhancing the load-adjustment flexibility of combined heat and power units facilitates the integration of renewable energy and enhances their profitability in dynamic electricity markets. However, the optimal coordination of various retrofitted combined heat and power units to maximize profitability has not been thoroughly investigated. To address this gap, this study conducts thermodynamic analysis and operation optimization for a combined heat and power plant integrated with flexibility retrofits, by developing models for the extraction-condensing unit, high back-pressure retrofitted unit, and low-pressure turbine zero output retrofitted unit. Results show that the low-pressure turbine zero output retrofitted unit achieves the largest energy efficiency (90.7%), while the extraction-condensing unit attains the highest exergy efficiency (38.0%). A plant-level optimization model is proposed to maximize profitability, demonstrating that the retrofitted combined heat and power plant increases total profit by 8.1% (CNY 86.4 million) compared to the original plant (CNY 79.9 million). The profit improvement stems from reduced coal consumption and enhanced heating capacity, enabling better power generation optimization. Furthermore, the study evaluates the profitability under different retrofit combinations. The findings reveal that an optimal profit can be achieved by reasonably coordinating the energy-saving characteristics of high back-pressure units, the heat supply capacity of low-pressure turbine zero output units, and the flexible adjustment capability of extraction-condensing units.
1. Introduction
Global initiatives to combat climate change are intensifying, with nations implementing strategies to achieve carbon neutrality. For instance, China has set a target to reach carbon neutrality by 2060 [1]. Countries such as Germany and Denmark have outlined plans to entirely replace fossil fuels with renewable energy by 2050 [2,3]. The rapid deployment of renewable energy sources is a pivotal approach to reducing carbon emissions. However, the inherent variability and uncontrollability of photovoltaic and wind energy present significant challenges to power grid stability. To effectively integrate renewable energy sources, traditional power generation systems must improve their flexibility, a feature that coal-fired combined heat and power (CHP) units currently do not possess. The growing reliance on renewable energy requires a level of flexibility that existing CHP facilities find difficult to provide, highlighting a critical gap that needs to be resolved [4]. Consequently, enhancing the CHP plants’ flexibility is crucial to resolving this issue, a topic that is garnering growing interest in the field.
Typically, the flexibility of coal-fired power plants is constrained by the thermal inertia [5] and the minimum combustion load [6] of the boiler. In the case of coal-fired CHP plants, an additional limitation arises from the inherent heat-power coupling mechanism [7]. To address these issues, researchers have proposed various heat-power decoupling (HPD) [8,9] technologies in recent years. Among the most extensively implemented HPD approaches in CHP plants are thermal energy storage (TES) [10,11], power-to-heat (P2H) [12], compressed air energy storage (CAES) [13,14], and flexibility retrofit [15]. Lai et al. [16] implemented a hot water TES system in a 330 MW CHP plant. Their results demonstrated a significant improvement in operational flexibility, with the minimum feasible power output being reduced by approximately 12% when operating at a heat load of 300 MW. Wang et al. [17] developed an innovative CHP configuration incorporating molten salt TES technology. Their design utilized reheated steam as the heat source for charging the molten salt TES, which reduced the plant’s minimum load ratio from 30% to 23.4% of its designed capacity. Moreover, heat pumps (HPs) and electric boilers (EBs) are prominent P2H technologies, facilitating the decoupling of heat and power generation through electrical energy conversion into thermal energy. Liu et al. [18] conducted a comparative analysis of the operational flexibility enhancement potential between EBs and HPs. Their findings revealed significant reductions in minimum output power, with EBs achieving a 124.2 MW decrease and HPs yielding a 71.6 MW reduction. Besides, recent research suggests that integrating TES with P2H technologies represents a promising strategy for maximizing the flexibility potential of CHP plants, as evidenced by multiple studies [19,20,21,22]. Furthermore, Wang et al. [23] developed an innovative CHP-CAES system with higher flexibility. The system’s distinctive feature involved utilizing the district heating network as the thermal energy source for the CAES discharge process, resulting in 2% reduction in the plant’s minimum load and a decent energy-saving effect.
In contrast to the above flexibility technologies that rely on additional equipment, retrofit methods based on the CHP units themselves can also be effectively employed to improve flexibility. Various flexibility retrofit strategies have been developed in the past years, such as low-pressure turbine zero output (LZPO) and high back-pressure (HBP) renovations. Through comprehensive investigations, researchers have systematically evaluated the flexibility enhancement potential of LZPO retrofits in CHP plants. Ref. [24] conducted simulation-based analyses to assess the LZPO retrofitted units’ flexibility, while Ref. [25] provided experimental validation of these findings through practical implementation. Specifically, Ref. [26] reported that the integration of LZPO retrofits enabled a substantial reduction in the minimum load of a 650 MW CHP plant, decreasing from 457 MW to 353 MW. Moreover, Zhao et al. [27] analyzed HBP renovation’s impact, demonstrating a 92.89 MW increase in heat load and 46.29 MW renewable energy absorption capacity. Subsequent Refs. [28,29] focused on the parametric analysis of HBP systems, while Ge et al. [30] evaluated its potential based on heating areas and network parameters. Parallel research efforts have extensively investigated LZPO retrofits.
As reviewed earlier, flexibility retrofits of CHP units, particularly HBP retrofits and LZPO retrofits, have garnered increasing attention in recent years. Through literature review, it was found that the existing work commonly focused on the unit-level flexibility and often confined to a single type of retrofit. Nevertheless, a real-world CHP plant typically comprises multiple CHP units; the knowledge derived from a flexibility retrofitted unit may not suffice to guide the optimal operation of a CHP plant integrated with flexibility retrofits. More importantly, leveraging the flexibility and energy-conversion characteristics of various retrofitted CHP units to maximize the profitability in the electricity market remains a pressing challenge. Additionally, the optimal configuration of retrofit types and their proportions within a CHP plant is still an unresolved issue.
To fill in these knowledge gaps, in this study, the thermodynamic models of three types of CHP units, including the extraction-condensing (EC) unit, HBP, and LZPO retrofitted units, are developed. Then, energy-conversion characteristics of various CHP units are investigated based on energy and exergy efficiency analyses. Subsequently, a plant-level optimization model is proposed to maximize the plant’s profitability in the electricity market. By comparing the profitability of CHP plants with various flexibility retrofit combinations, the optimal retrofit combination is identified.
2. Methods
2.1. Thermodynamic Model Development
- (1)
- EC unit:
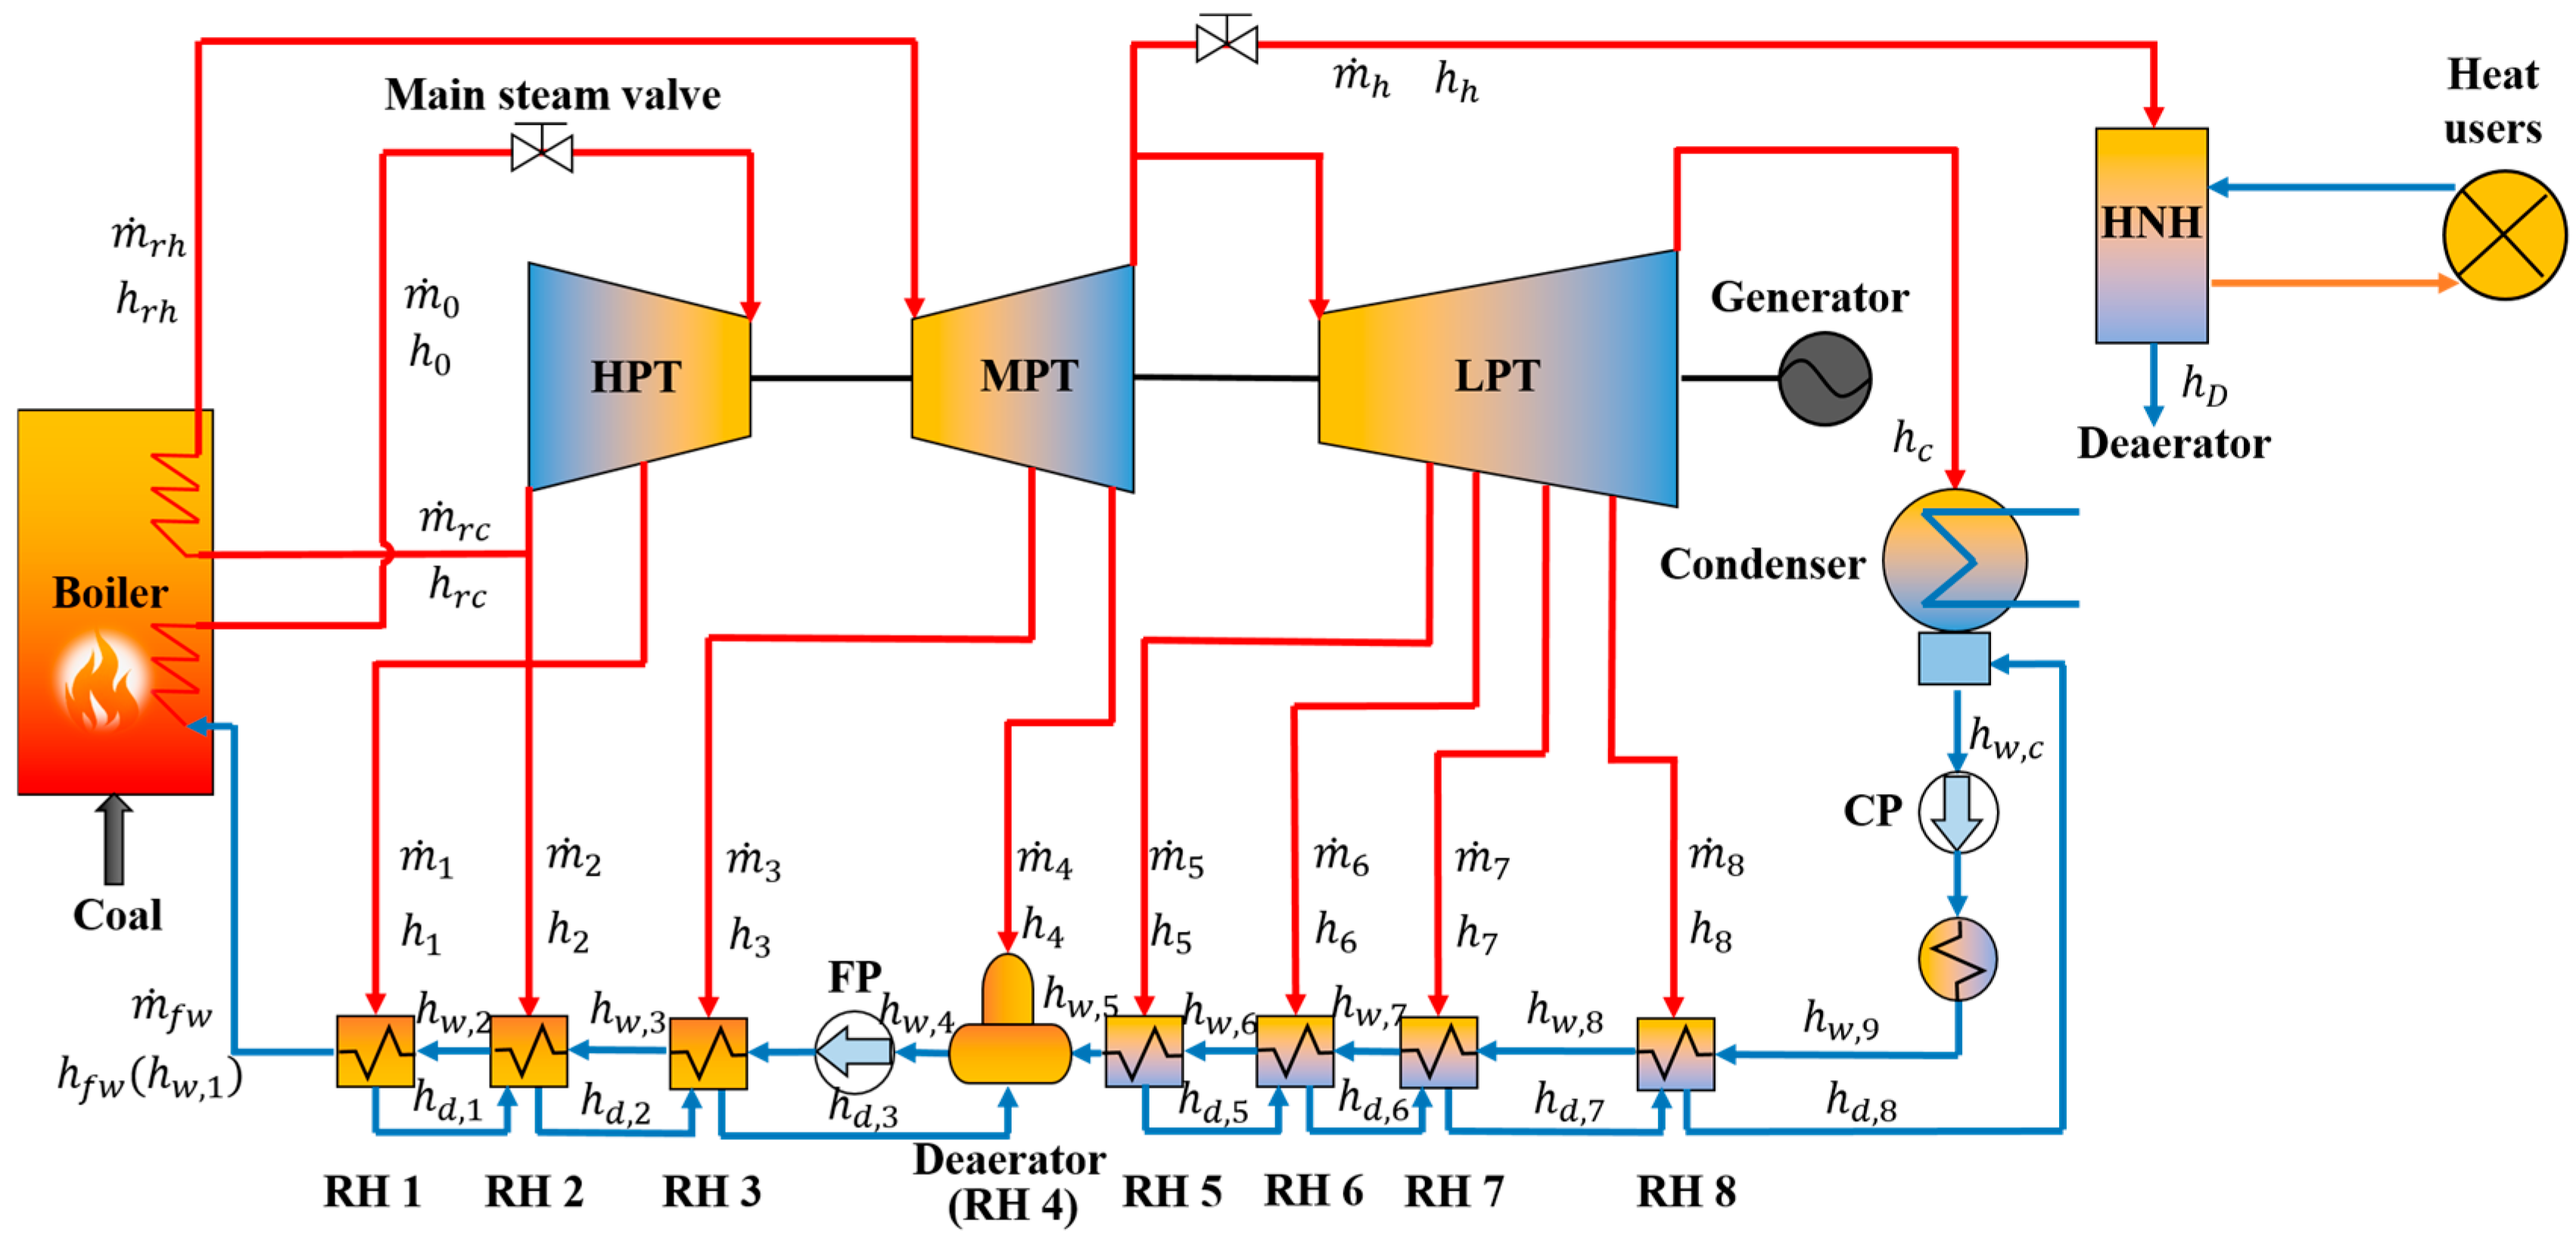
The system sketch of the EC unit is illustrated in Figure 1. Steam generated in the boiler sequentially passes through the high-pressure turbine (HPT), medium-pressure turbine (MPT), and low-pressure turbines (LPTs) to do work. After passing through the low-pressure turbine (LPT), the exhaust steam is channeled into the condenser. Once condensed, the water is pumped into the regenerative system, where its temperature is elevated. This system consists of eight regenerative heaters (RHs). Finally, the heated water, functioning as feedwater, is circulated back to the boiler for reuse. A portion of the steam is extracted from the inlet of LPT and used to heat the circulating water in the heat network heater (HNH), enabling the transfer of thermal energy to end heat users.
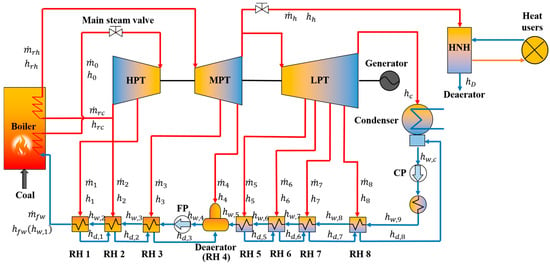
Figure 1.
System sketch of the EC unit.
In this study, the energy balance matrix method [31,32,33] is used to develop the thermodynamic models of CHP units. This approach calculates the parameters of steam and water, based on the energy balance of each component inside the CHP unit.
The energy balance equations of the EC unit are as follows.
For RH 1:
For RH 2:
For RH 3:
For deaerator:
Combining Formulas (4) and (5), it can be derived that
For RH 5:
For RH 6:
For RH 7:
For RH 8:
By solving Formulas (1) to (10), it can be derived that
where, denotes the specific enthalpy; represents the mass flow rate; the subscripts of , , and denote the feed water, the No. i RH, heating extraction steam, and the return water. Moreover, the represent the extraction steam enthalpy drop, the drainage water enthalpy drop, and the feed water enthalpy rise, respectively, which is defined as
Therefore, the extraction steam flow rates of RH 1 to RH8 ( to ) can be obtained using the Formula (11). Then, the power and heat generation of the EC unit can be calculated with
where, represents the generator efficiency; is the main steam enthalpy; is the steam’s enthalpy increase after the reheat process; and denote the enthalpies of the heating extracted steam and exhaust steam; is the mass flow rate of feed water; represents the mass flow rate of the steam extracted into RHi; and are enthalpy of heating extraction and return water, respectively.
- (2)
- HBP retrofitted unit:
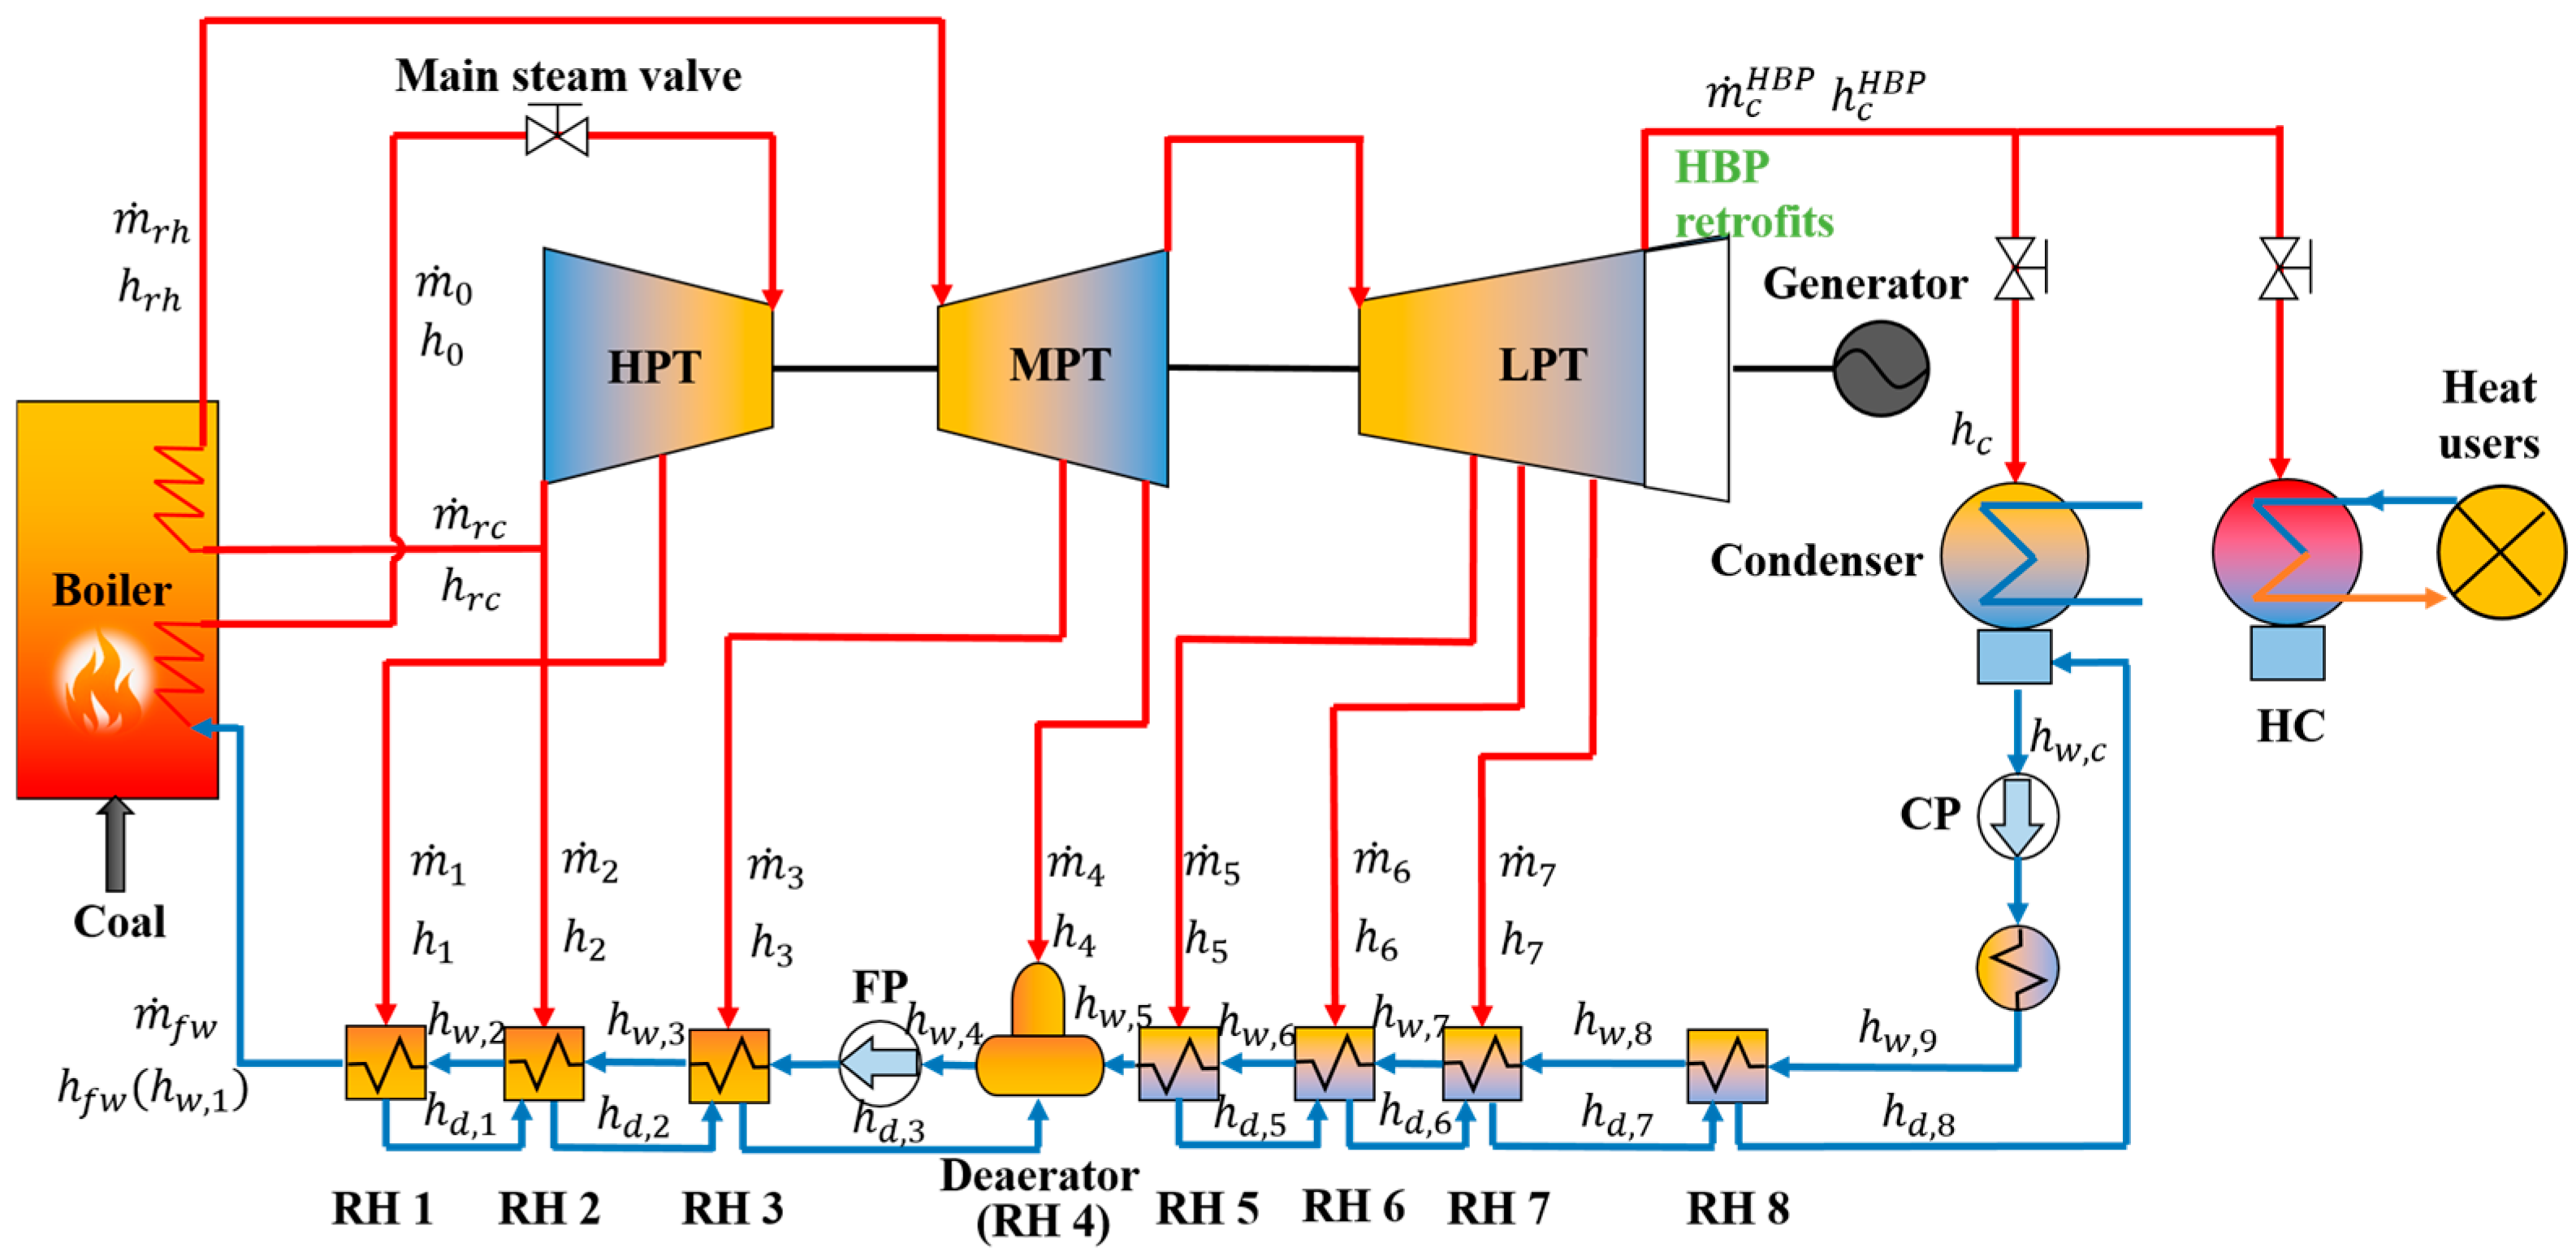
The system sketch of the HBP retrofitted unit is depicted in Figure 2. In contrast to traditional EC units, the HBP unit utilizes exhaust steam from the LPT for heat supply rather than relying on extracted steam. To facilitate this process, the last two blades’ stages are deleted to elevate the back pressure. As a result, the amount of RHs has been decreased from eight to seven. The back pressure of the HBP retrofitted unit is raised from 5.4 kPa to 45 kPa [15], obtaining a higher saturation temperature to heat the cold circulating water. The heating condenser (HC) serves as the component in which the exhaust steam transfers thermal energy to heat users. A control valve is employed to regulate the stream between the original condenser and HC, enabling an adjustable heating operation.
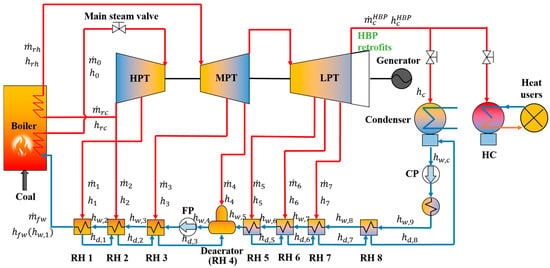
Figure 2.
System sketch of the HBP retrofitted unit.
Given the similarity in derivation methodology between the EC and HBP retrofitted unit, this paper presents only the final energy balance matrix for the HBP retrofitted unit, as shown in Equation (17), while omitting the detailed derivation process.
As shown in Figure 2, the steam is no longer extracted to heat the condensate water in RH8 after the HBP retrofits. Since the used RHs in the HBP retrofitted unit is reduced from 8 stages to 7 stages, the order of the matrix in Equation (17) is correspondingly reduced to 7 stages. Then, the output power and heat of the HBP retrofitted unit can be calculated with
where and are enthalpy and mass flow rate of the HBP retrofitted unit’s exhaust steam; is the saturated water enthalpy.
- (3)
- LZPO retrofitted unit:
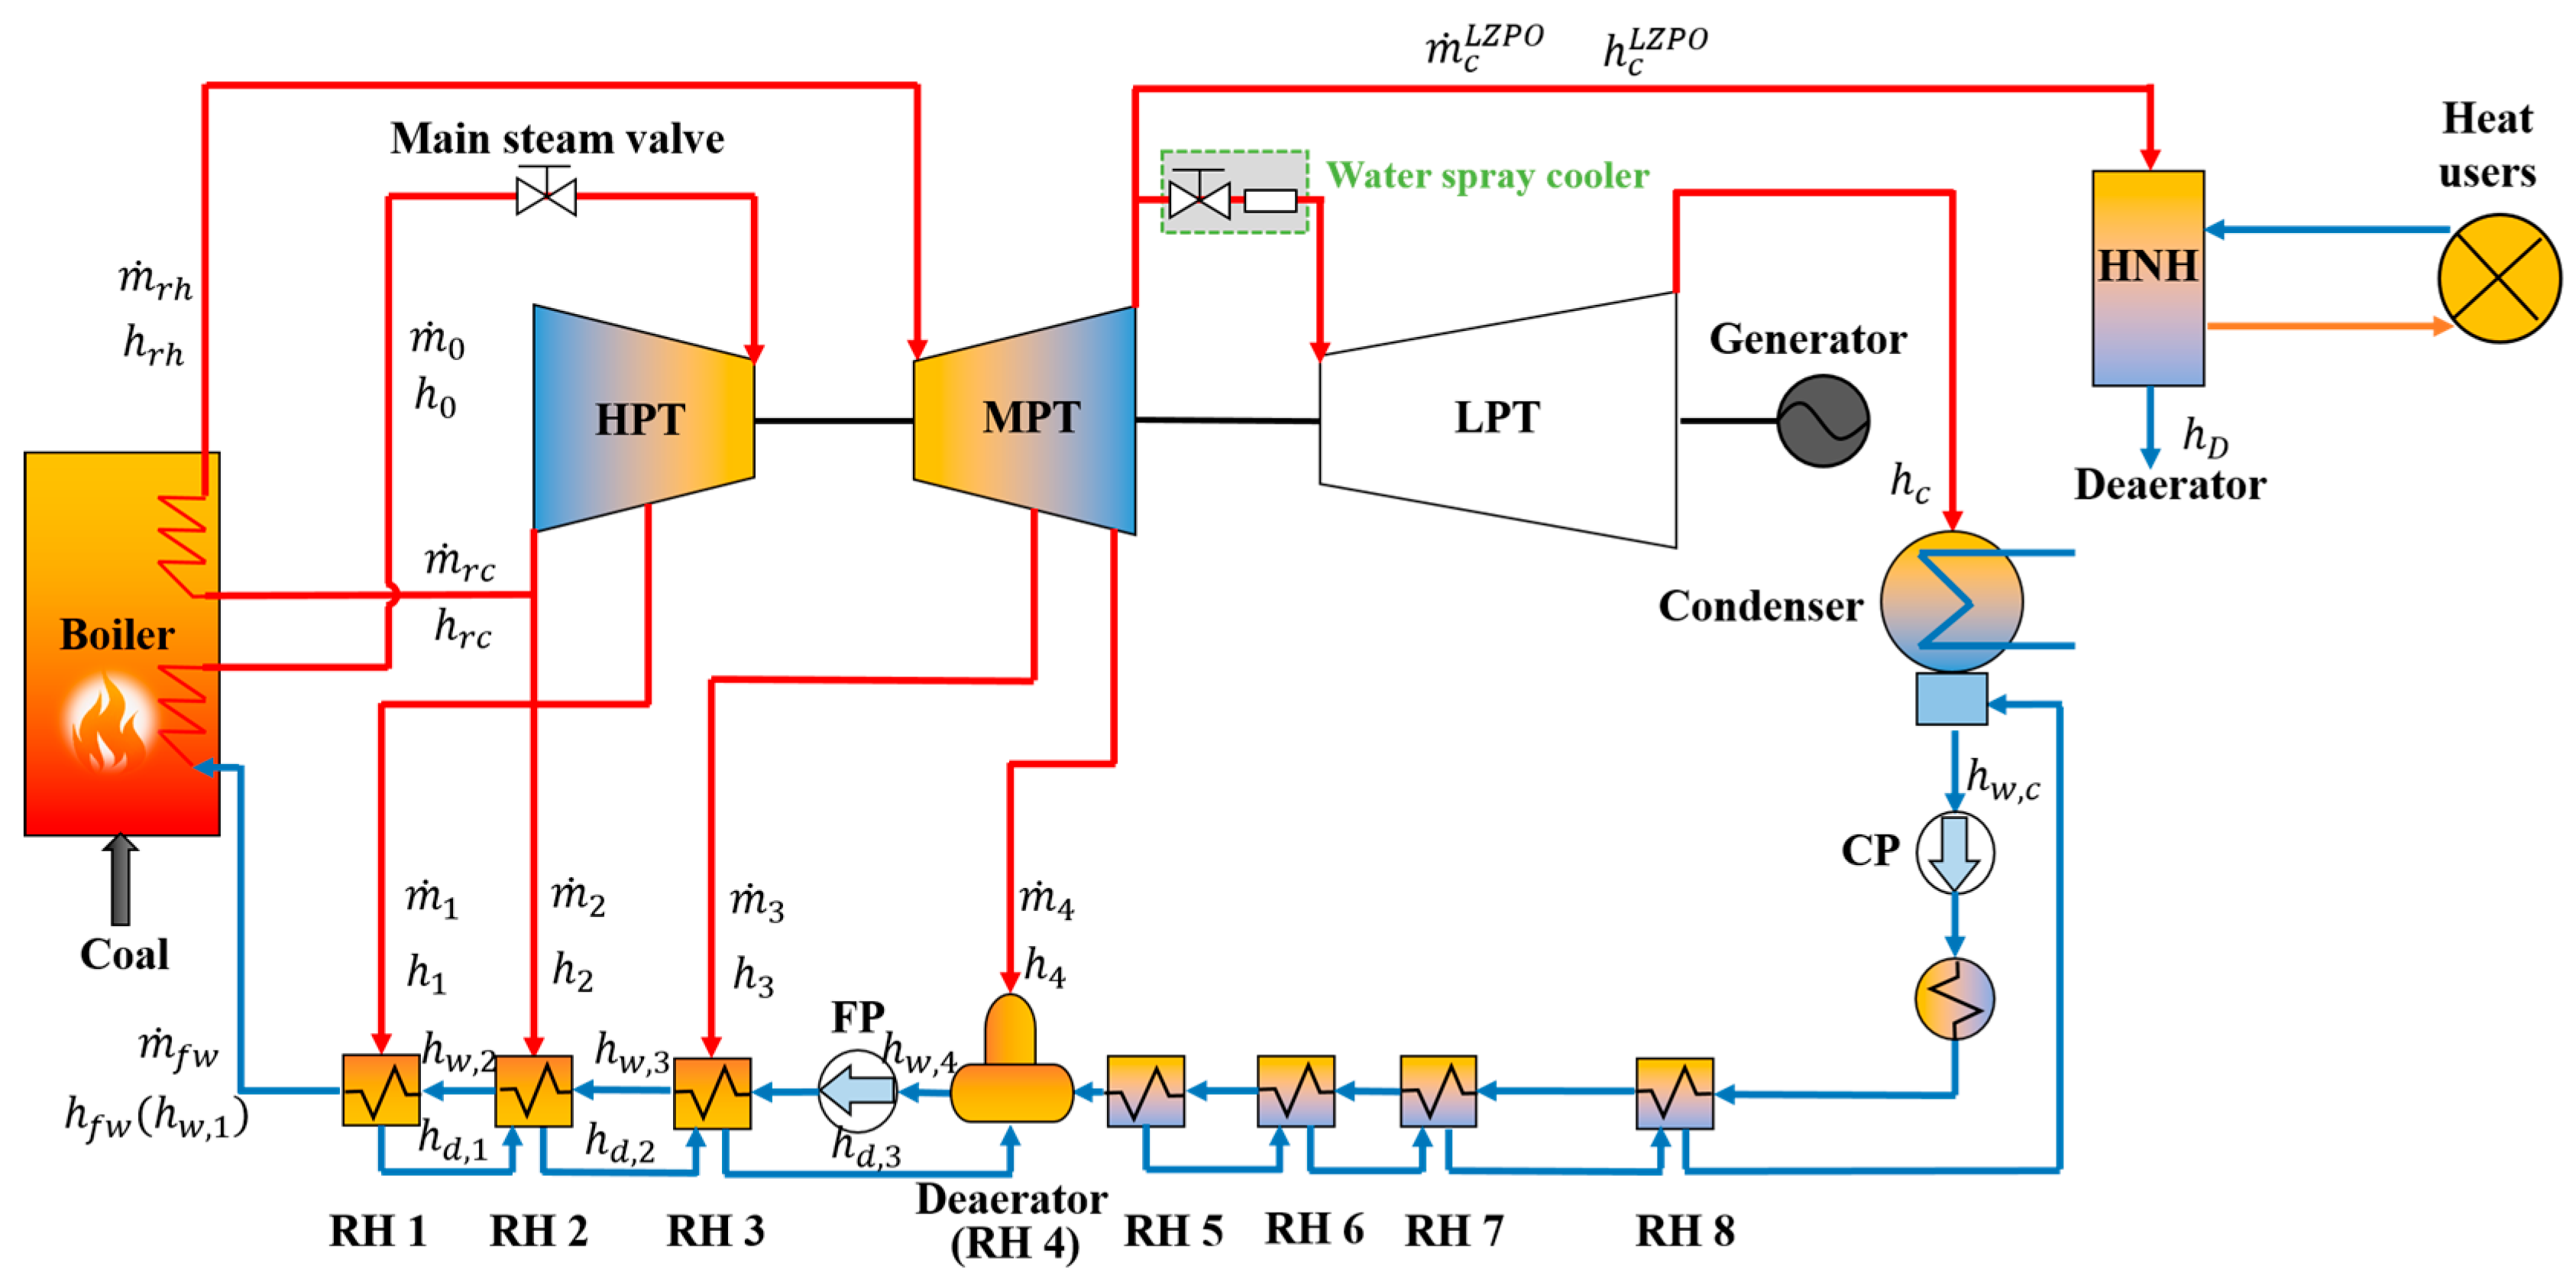
The system sketch of the LZPO retrofitted unit is illustrated in Figure 3. In this configuration, most of the MPT exhaust steam is rerouted into HNH to deliver heat, while a minor portion of 10 t/h [18] is diverted to the LPTs via a newly added bypass system, which includes a water spray cooler to ensure proper cooling of the terminal rotors. By utilizing the steam that would otherwise produce power in LPT for supplying heat, this retrofit reduces the units’ power generation while enhancing its heat output capacity.
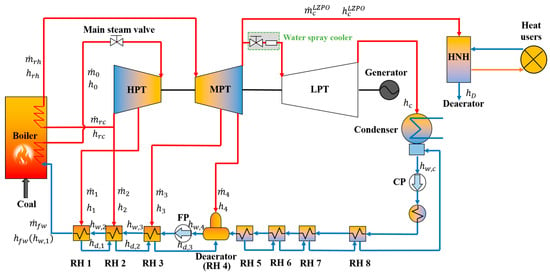
Figure 3.
System sketch of the LZPO retrofitted unit.
As shown in Figure 3, the steam is no longer extracted to heat the condensate water in RHs 5 to RHs 8 after the LZPO retrofits. Since the used RHs in the LZPO retrofitted unit is reduced from 8 stages to 4 stages, the order of the matrix is correspondingly reduced to 4 stages. Therefore, the LZPO retrofitted unit’s energy balance matrix is expressed as
The output power and heat of the LZPO retrofitted unit can be calculated with
2.2. Energy-Conversion Characteristic Models Development
This study is grounded in the first and second laws of thermodynamics, employing energy efficiency and exergy efficiency to evaluate the energy-conversion characteristics of CHP units.
- (i)
- Energy efficiency:
Energy efficiency of a thermodynamic system is defined as the ratio of the energy output by the system to the system’s input energy. For a CHP unit, the input energy is the chemical energy generated by coal combustion, and the output energy includes both electrical and thermal energy. Therefore, the energy efficiency of the CHP unit can be defined as Equation (23).
where represents the CHP units’ coal consumption rate; denotes the lower heating value of coal; is the boiler efficiency; is the consumed power by the unit itself.
- (ii)
- Exergy efficiency:
Exergy is defined as the maximum useful work theoretically obtainable when a thermodynamic system reversibly changes from an arbitrary state to a state of equilibrium with the environment [34]. Neglecting changes in kinetic energy, potential energy, and chemical exergy, and considering only physical exergy, the specific exergy of either steam or water in a CHP system can be expressed as Equation (27).
where represents the specific entropy; subscript of 0 denote the environment. The environment temperature and pressure is taken as 293 K and 0.1 MPa, respectively.
The exergy efficiency of a CHP unit is calculated with
where represents the higher heating value of coal; and denote the electrical exergy and thermal exergy output from the system, respectively. The electrical exergy is numerically equal to the power generation, while the thermal exergy is characterized by the exergy increase of the circulating water after passing through the HNH; represents the mass flow rate of the circulating water in the heating network; and are exergy of the supply and return water in the heating network, respectively.
2.3. Parameter Specification
This study involves three types of CHP units, i.e., EC unit, HBP unit, and LZPO unit. The HBP and LZPO units are retrofitted from the EC unit, thus they have the same main parameters of the boiler and turbine subsystems, as listed in Table 1. In addition, more detailed data used in the energy balance matrix has been given in Table 2.

Table 1.
Main parameters of CHP units.

Table 2.
Used data in the energy balance matrix.
2.4. Model Validation
The thermodynamic models of these CHP units are developed by MATLAB R2020a. Model validation is performed using an indicator of the heat consumption rate (HCR), which integrates both the unit’s output power and coal consumption. The simulation results under various conditions, including 100%THA, 75%THA, 50%THA, and 40%THA, are compared with the corresponding data from heat balance diagrams. The details of the off-design using energy balance matrix methods can be found in our previous work [31]. The validation results, presented in Table 3, demonstrate that the relative errors for all three CHP units are within 0.8%, thereby confirming the high accuracy and reliability of the developed models.

Table 3.
Model validation results.
2.5. Operation Optimization Model Development
2.5.1. Objective Function
The objective function in this study aims to maximize the profit of a CHP plant integrated with flexibility retrofits, which can be expressed as Equation (33).
where represents the time; denote total duration of the optimization; are the output power of different CHP units at the moment t; is the total output of all EC units in this reference CHP plant; are the output heat of different CHP units at the moment t; are the coal consumption rate of different CHP units at the moment t; are the selling prices of electricity energy, heat energy, and the coal cost.
2.5.2. Constraints
- (1)
- Heat load balance constraint:
The heat load balance constraint means that the total heat output of all CHP units is equal to the demands of heat users (). This constraint can be expressed as
- (2)
- Operational region constraint:
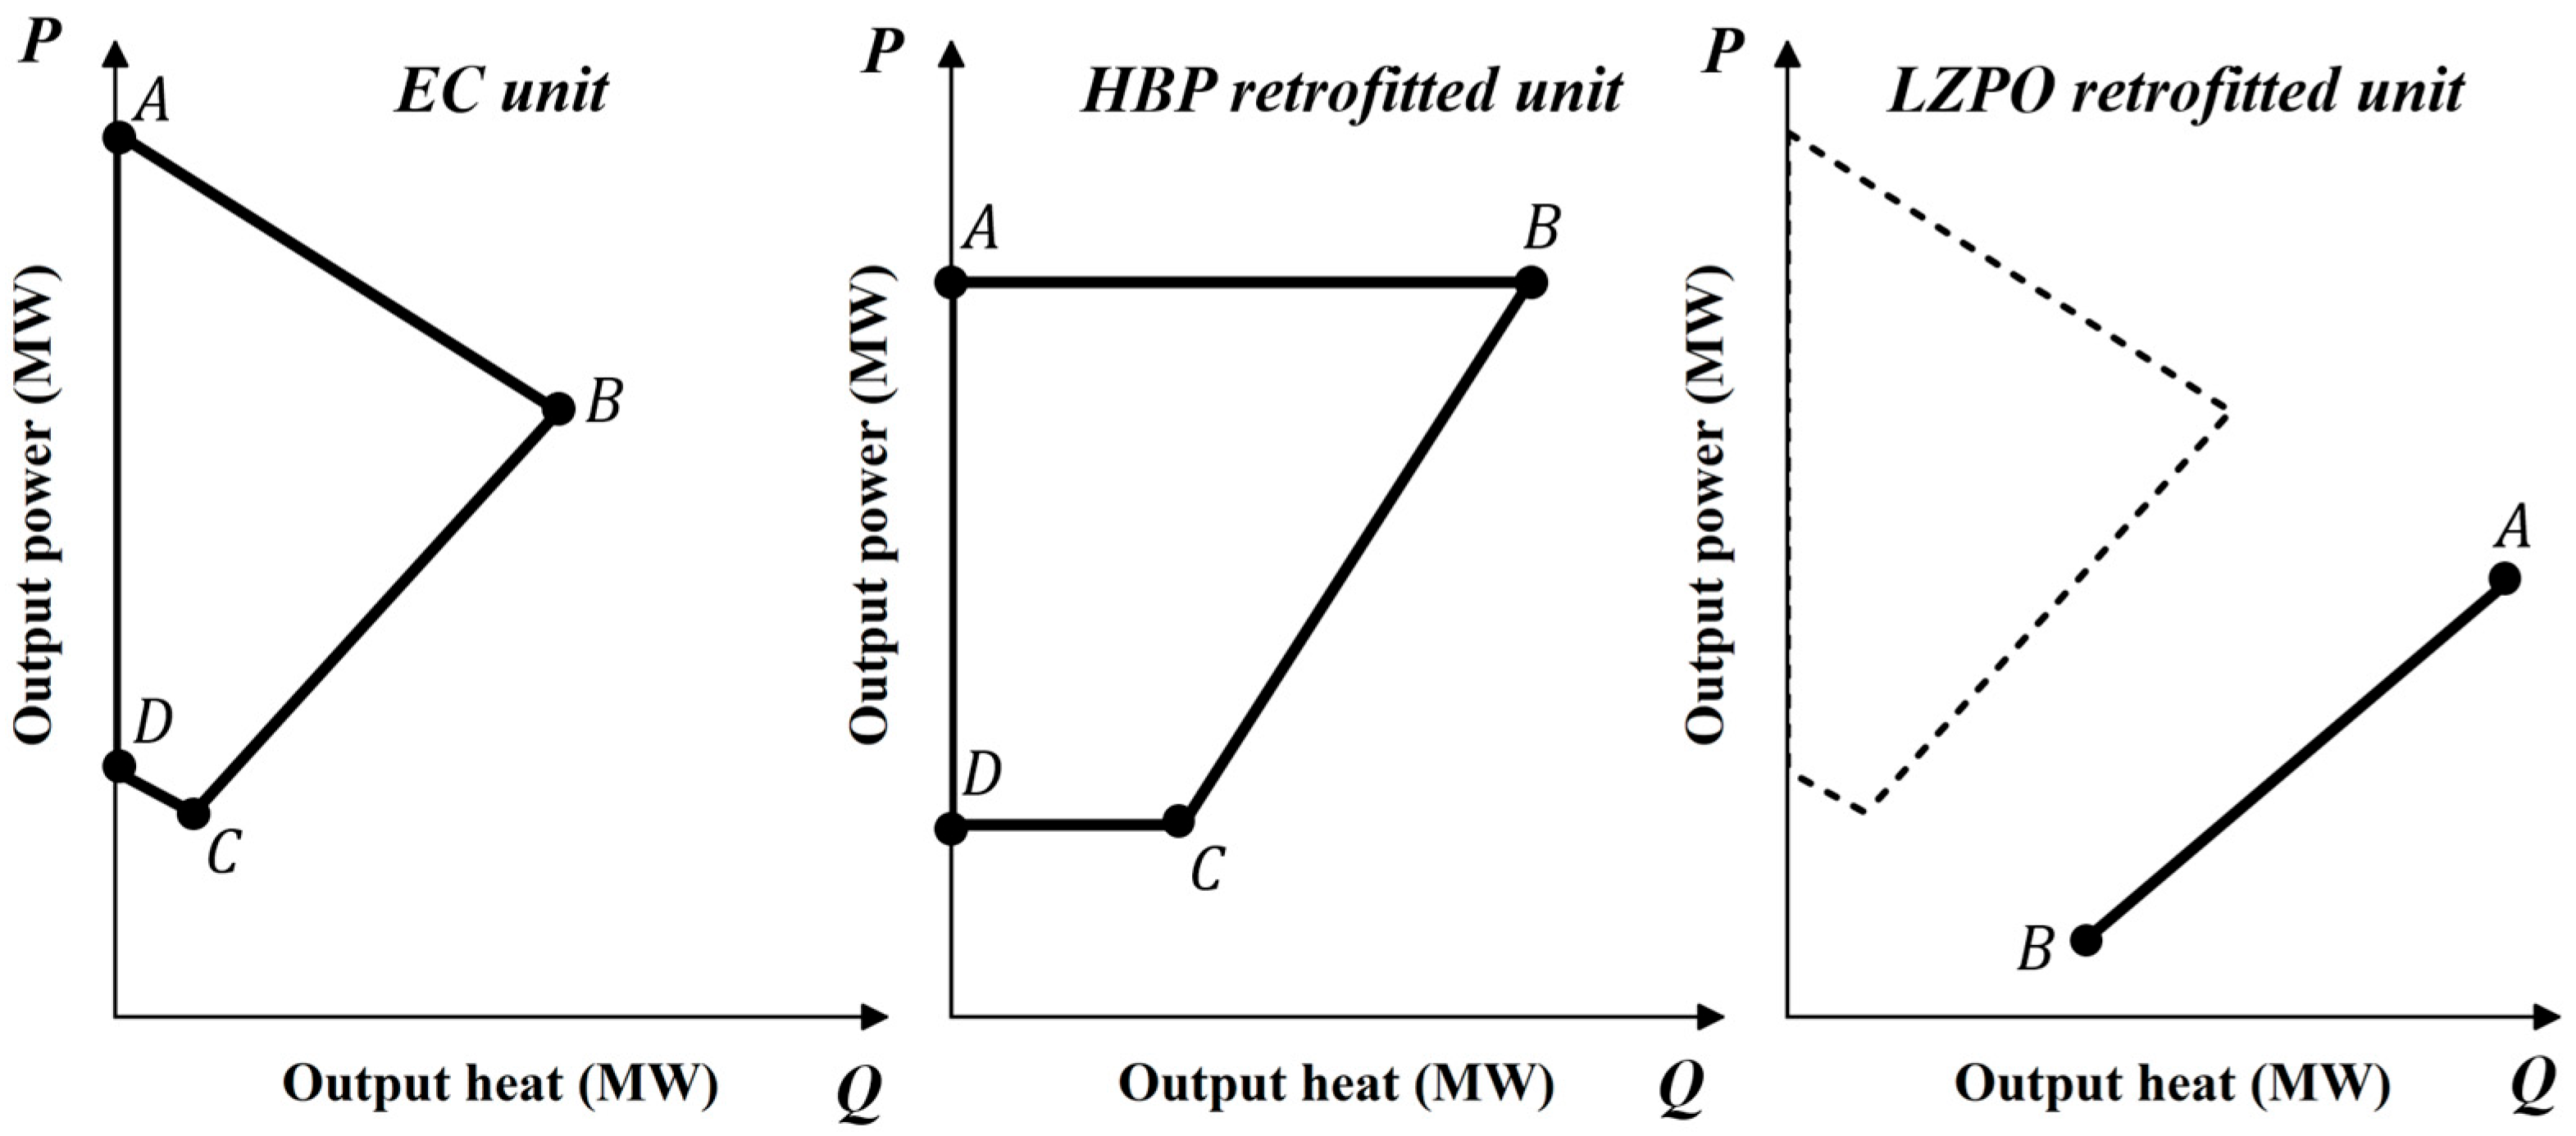
The operational region constraint reflects the heat-power coupling characteristics of CHP units, i.e., its output power and output heat must be adjusted within certain limits. As stated in Refs. [9,23], the typical operation regions of the EC unit, HBP retrofitted unit, and LZPO retrofitted unit are displayed in Figure 4.
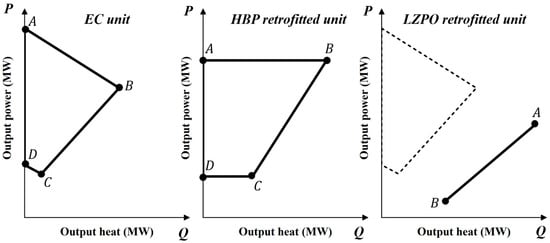
Figure 4.
Typical operation regions of various CHP units.
For a EC unit, its output power and output heat must obey the following ranges:
where subscripts of represents the points in Figure 4.
For a HBP retrofitted unit, its output power and output heat must obey the following ranges:
For a LZPO retrofitted unit, its output power and output heat must obey the following ranges:
- (3)
- HNH supply water temperature constraint:
For the HBP unit, heat is supplied through exhaust steam rather than extracted steam, which will reduce the water supply temperature of HNH. To meet the water supply temperature requirement of HNH, the proportion of heat load borne by the HBP unit must be lower than a certain critical value (), as shown in the following formula
where this critical value of has been calculated in our previous study [35] and is taken as 37.84%.
2.5.3. Solving Method
The optimization in this study is formulated as a Mixed Inter Linear Pro-gramming (MILP) problem, which can be solved using MATLAB R2020a. The time step of this optimization is one hour, and the detailed optimization procedure is presented in Table 4.

Table 4.
Solving procedure of the optimization model.
2.6. System Configuration of the CHP Plant
2.6.1. A Real-Word CHP Plant Integrated with Flexibility Retrofits
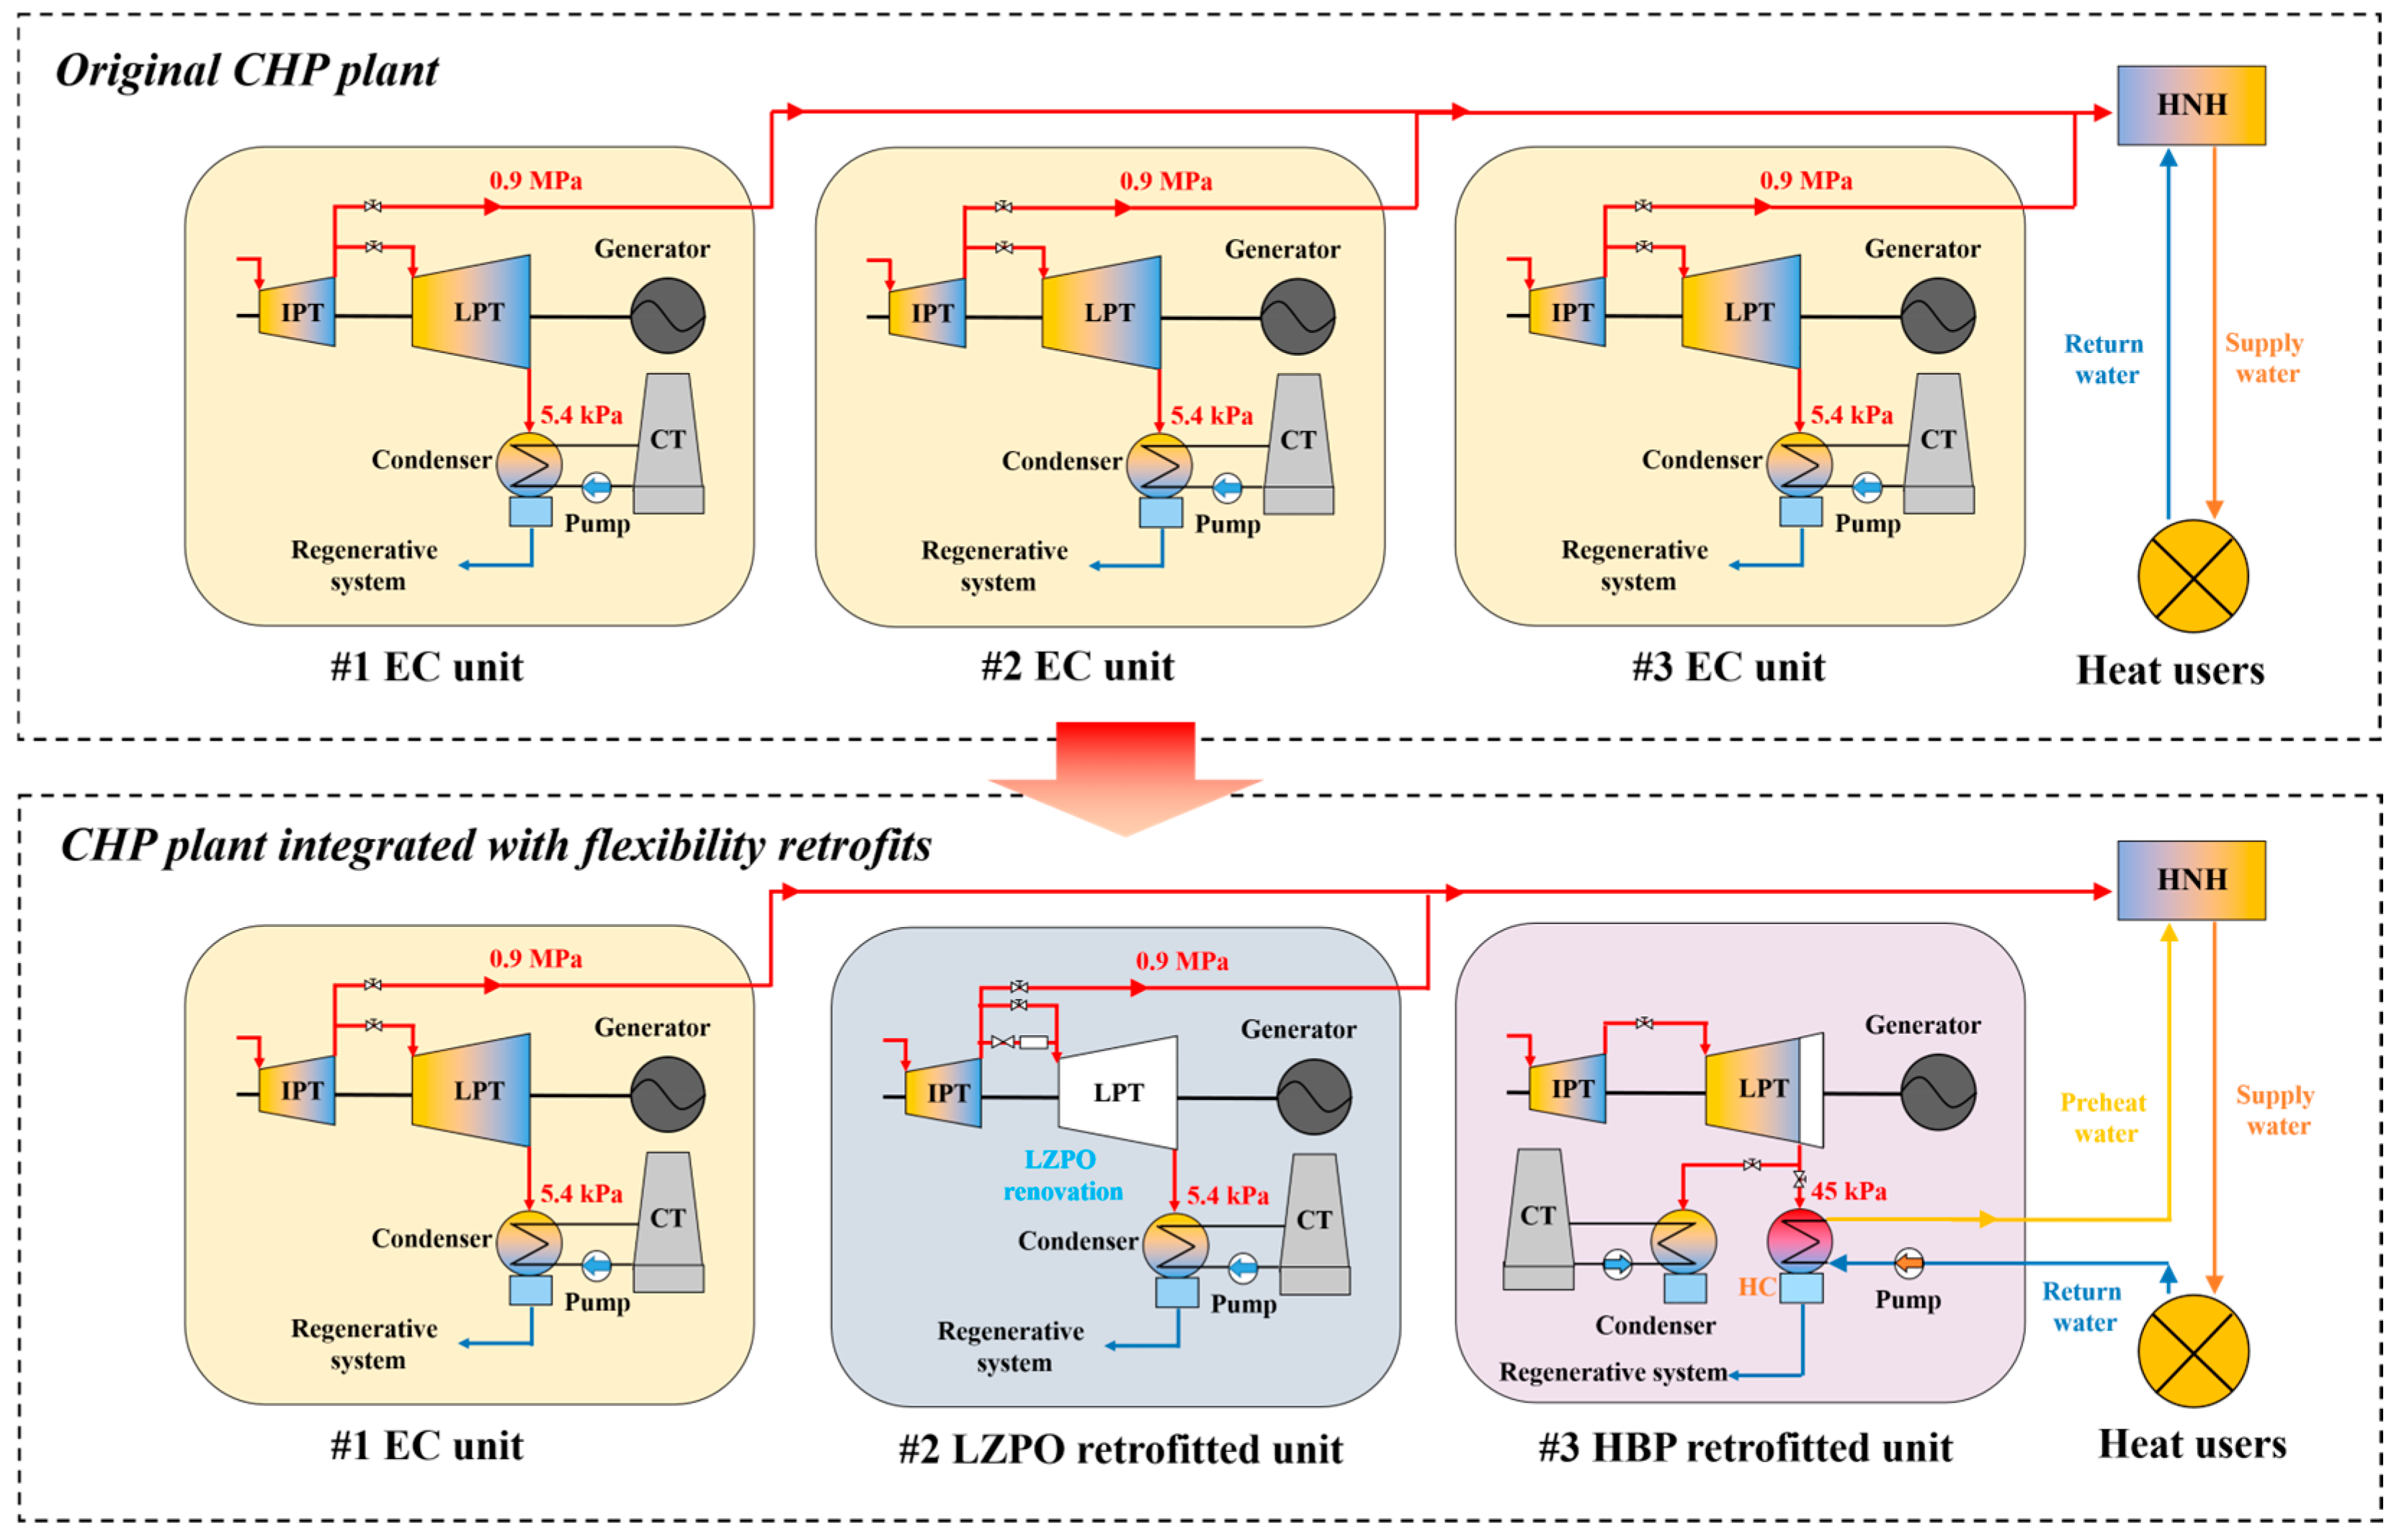
This section describes the system configuration of the studied CHP plant. The reference CHP plant is derived from a real-world plant in northern China, which consists of three CHP units. As shown in Figure 5, the original CHP plant consists of three parallel EC units, designated as #1~#3EC units, serving as the baseline for comparison. Moreover, the counterpart CHP plant with flexibility retrofits incorporates one EC unit (#1), one LZPO retrofitted unit (#2), and one HBP retrofitted unit (#3).
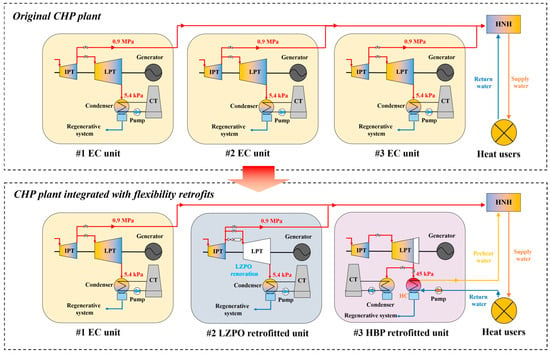
Figure 5.
System configurations of the original CHP plant and the CHP plant integrated with flexibility retrofits.
2.6.2. CHP Plants Integrated with Various Flexibility Retrofit Combinations
To further evaluate the impact of various retrofit combinations on the profitability, this study also optimizes the operation of the CHP plant integrated with various flexibility retrofit combinations. The analysis aims to assist plant managers in making informed decisions regarding the optimal types and proportions of retrofitting to maximize economic benefits. The retrofit combinations selected for the comparative study are listed in Table 5.

Table 5.
Retrofit combinations.
3. Results and Discussion
This section presents the thermodynamic efficiency analysis and operational optimization results for a CHP plant integrated with flexibility retrofits. Section 3.1 examines the energy-conversion characteristics of different CHP units through comprehensive energy and exergy efficiency analyses. Section 3.2 quantifies the profitability of flexibility retrofit integration in CHP plants using plant-level operational optimization. Section 3.3 evaluates the optimal configuration of the CHP plant by conducting a comparative analysis of profitability across various retrofit combinations.
3.1. Energy-Conversion Characteristics of Various Retrofitted CHP Units
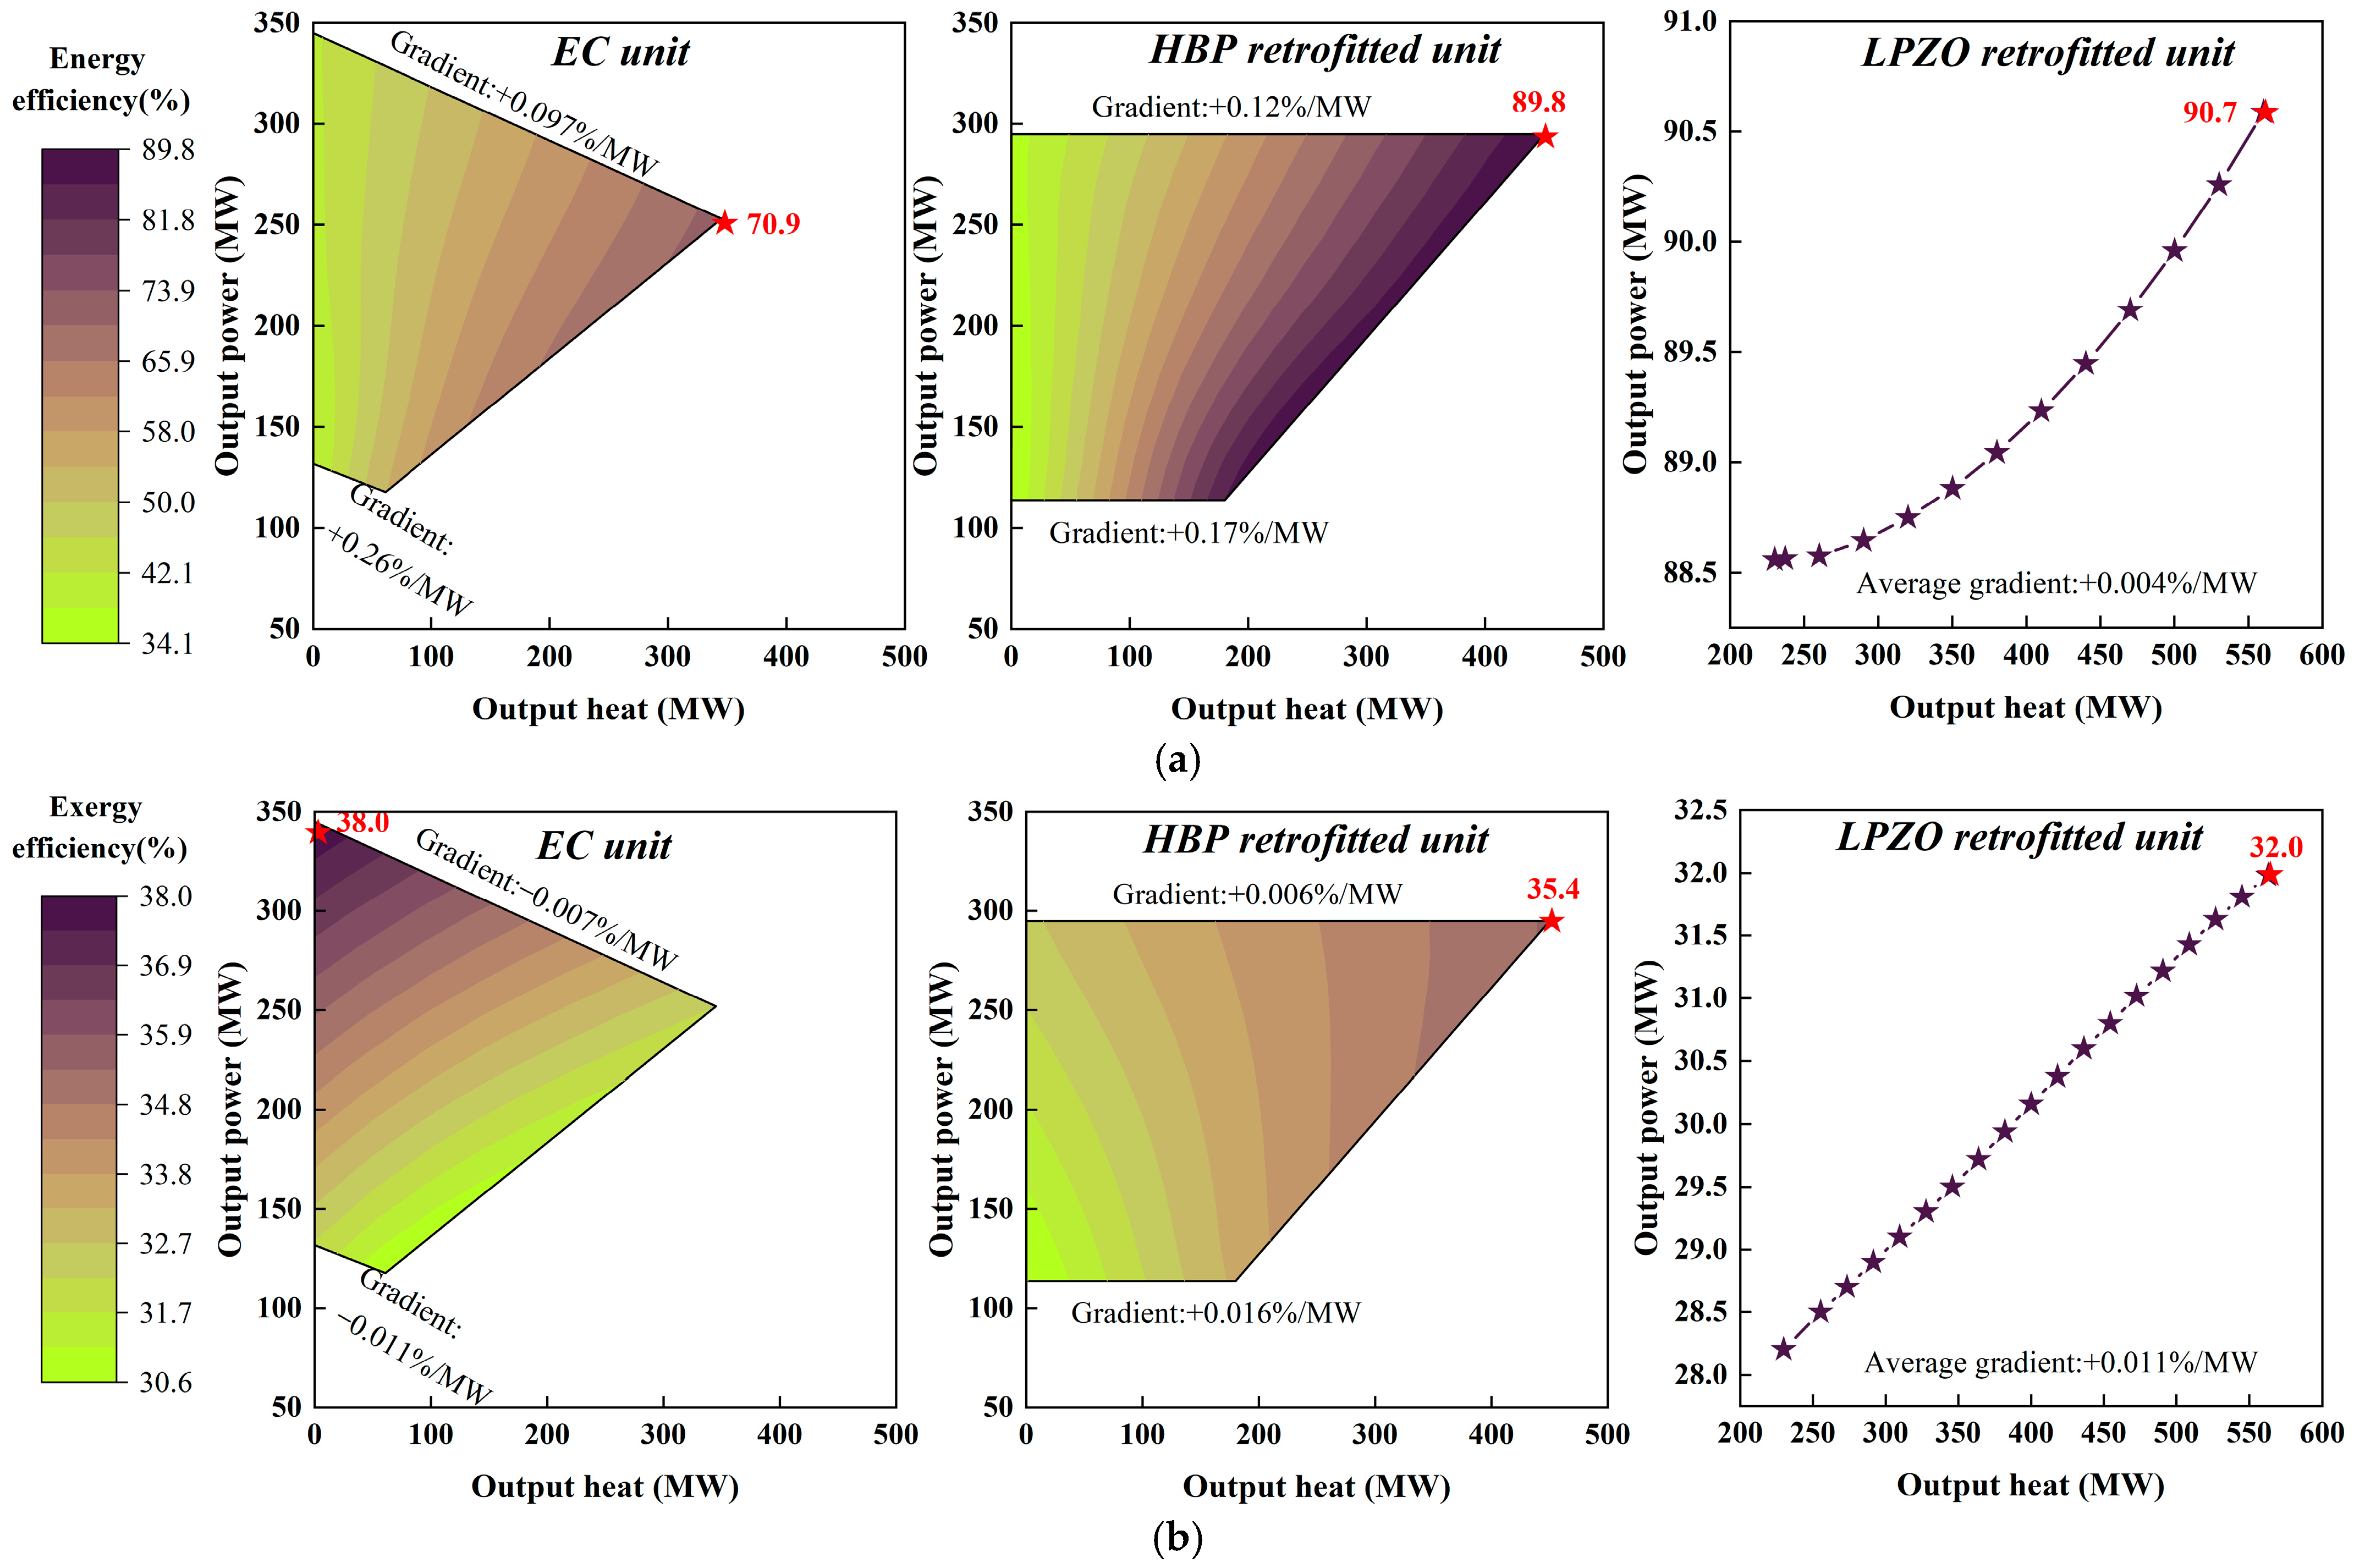
Grounded in the first and second laws of thermodynamics, the distributions of energy efficiency and exergy efficiency for these CHP units are analysed, as displayed in Figure 6.
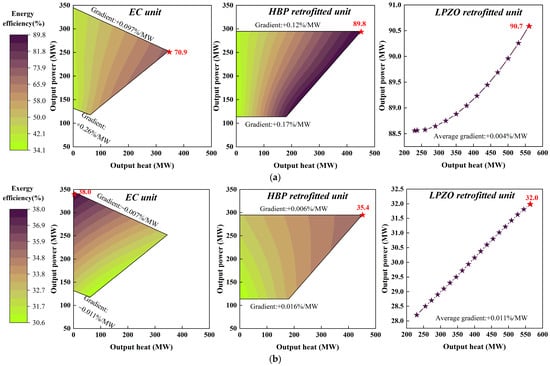
Figure 6.
Distributions of energy efficiency and exergy efficiency for various CHP units. (a) Distributions of energy efficiency. (b) Distributions of exergy efficiency.
Figure 6a illustrates the energy efficiency characteristics of three CHP units. Both the EC unit and the HBP retrofitted unit exhibit substantial variations in energy efficiency, ranging from approximately 34% to 70.9% and 89.8%, respectively. In contrast, the LZPO retrofitted unit maintains relatively stable energy efficiency across varying output levels (with the lowest gradient of +0.011%/MW). The analysis reveals that increased output heat has a more pronounced effect on energy efficiency than increased output power for both the EC and HBP retrofitted units. Furthermore, the influence of output heat on energy efficiency becomes more pronounced when the CHP unit operates at lower loads. For example, the EC unit exhibits an efficiency gradient of +0.097%/MW under the THA condition, which significantly increases to +0.26%/MW under the 40% THA condition. Among the three units, the LZPO retrofitted unit achieves the largest maximum energy efficiency at 90.7%, followed by the HBP retrofitted unit at 89.8%, with the EC unit reaching 70.9%. These findings demonstrate that flexibility retrofits significantly enhance CHP unit energy efficiency, primarily through improved heat supply capacity.
Figure 6b illustrates the exergy efficiency characteristics of the three CHP units. In contrast to the energy efficiency distribution patterns, all these three CHP units maintain relatively stable exergy efficiency across varying operating conditions. The exergy efficiency gradient is significantly smaller compared to that of energy efficiency. Furthermore, output power demonstrates a more substantial influence on exergy efficiency than output heat, primarily because electrical energy possesses higher energy quality than thermal energy. Among the three units, the EC unit achieves the highest maximum exergy efficiency at 38.0%, followed by the HBP retrofitted unit at 35.4%, with the LZPO retrofitted unit reaching 32.0%. These results suggest that flexibility retrofits may not enhance exergy efficiency, as they involve the conversion of high-grade electrical energy into lower-grade thermal energy.
The analysis demonstrates that while flexibility retrofits effectively enhance energy efficiency, they do not contribute to improved exergy efficiency. Consequently, the profit of a flexibility-retrofitted plant in the electricity market is contingent upon two key factors: the prevailing electricity price level (more precisely, its relative magnitude compared to heat prices) and the total heat load of the CHP plant. The optimization results presented in Section 3.2 and Section 3.3 will offer valuable insights into the economic potential of flexibility retrofits for CHP plants, demonstrating their capacity to generate measurable financial benefits.
3.2. Optimization Results of a CHP Plant Integrated with Flexibility Retrofits
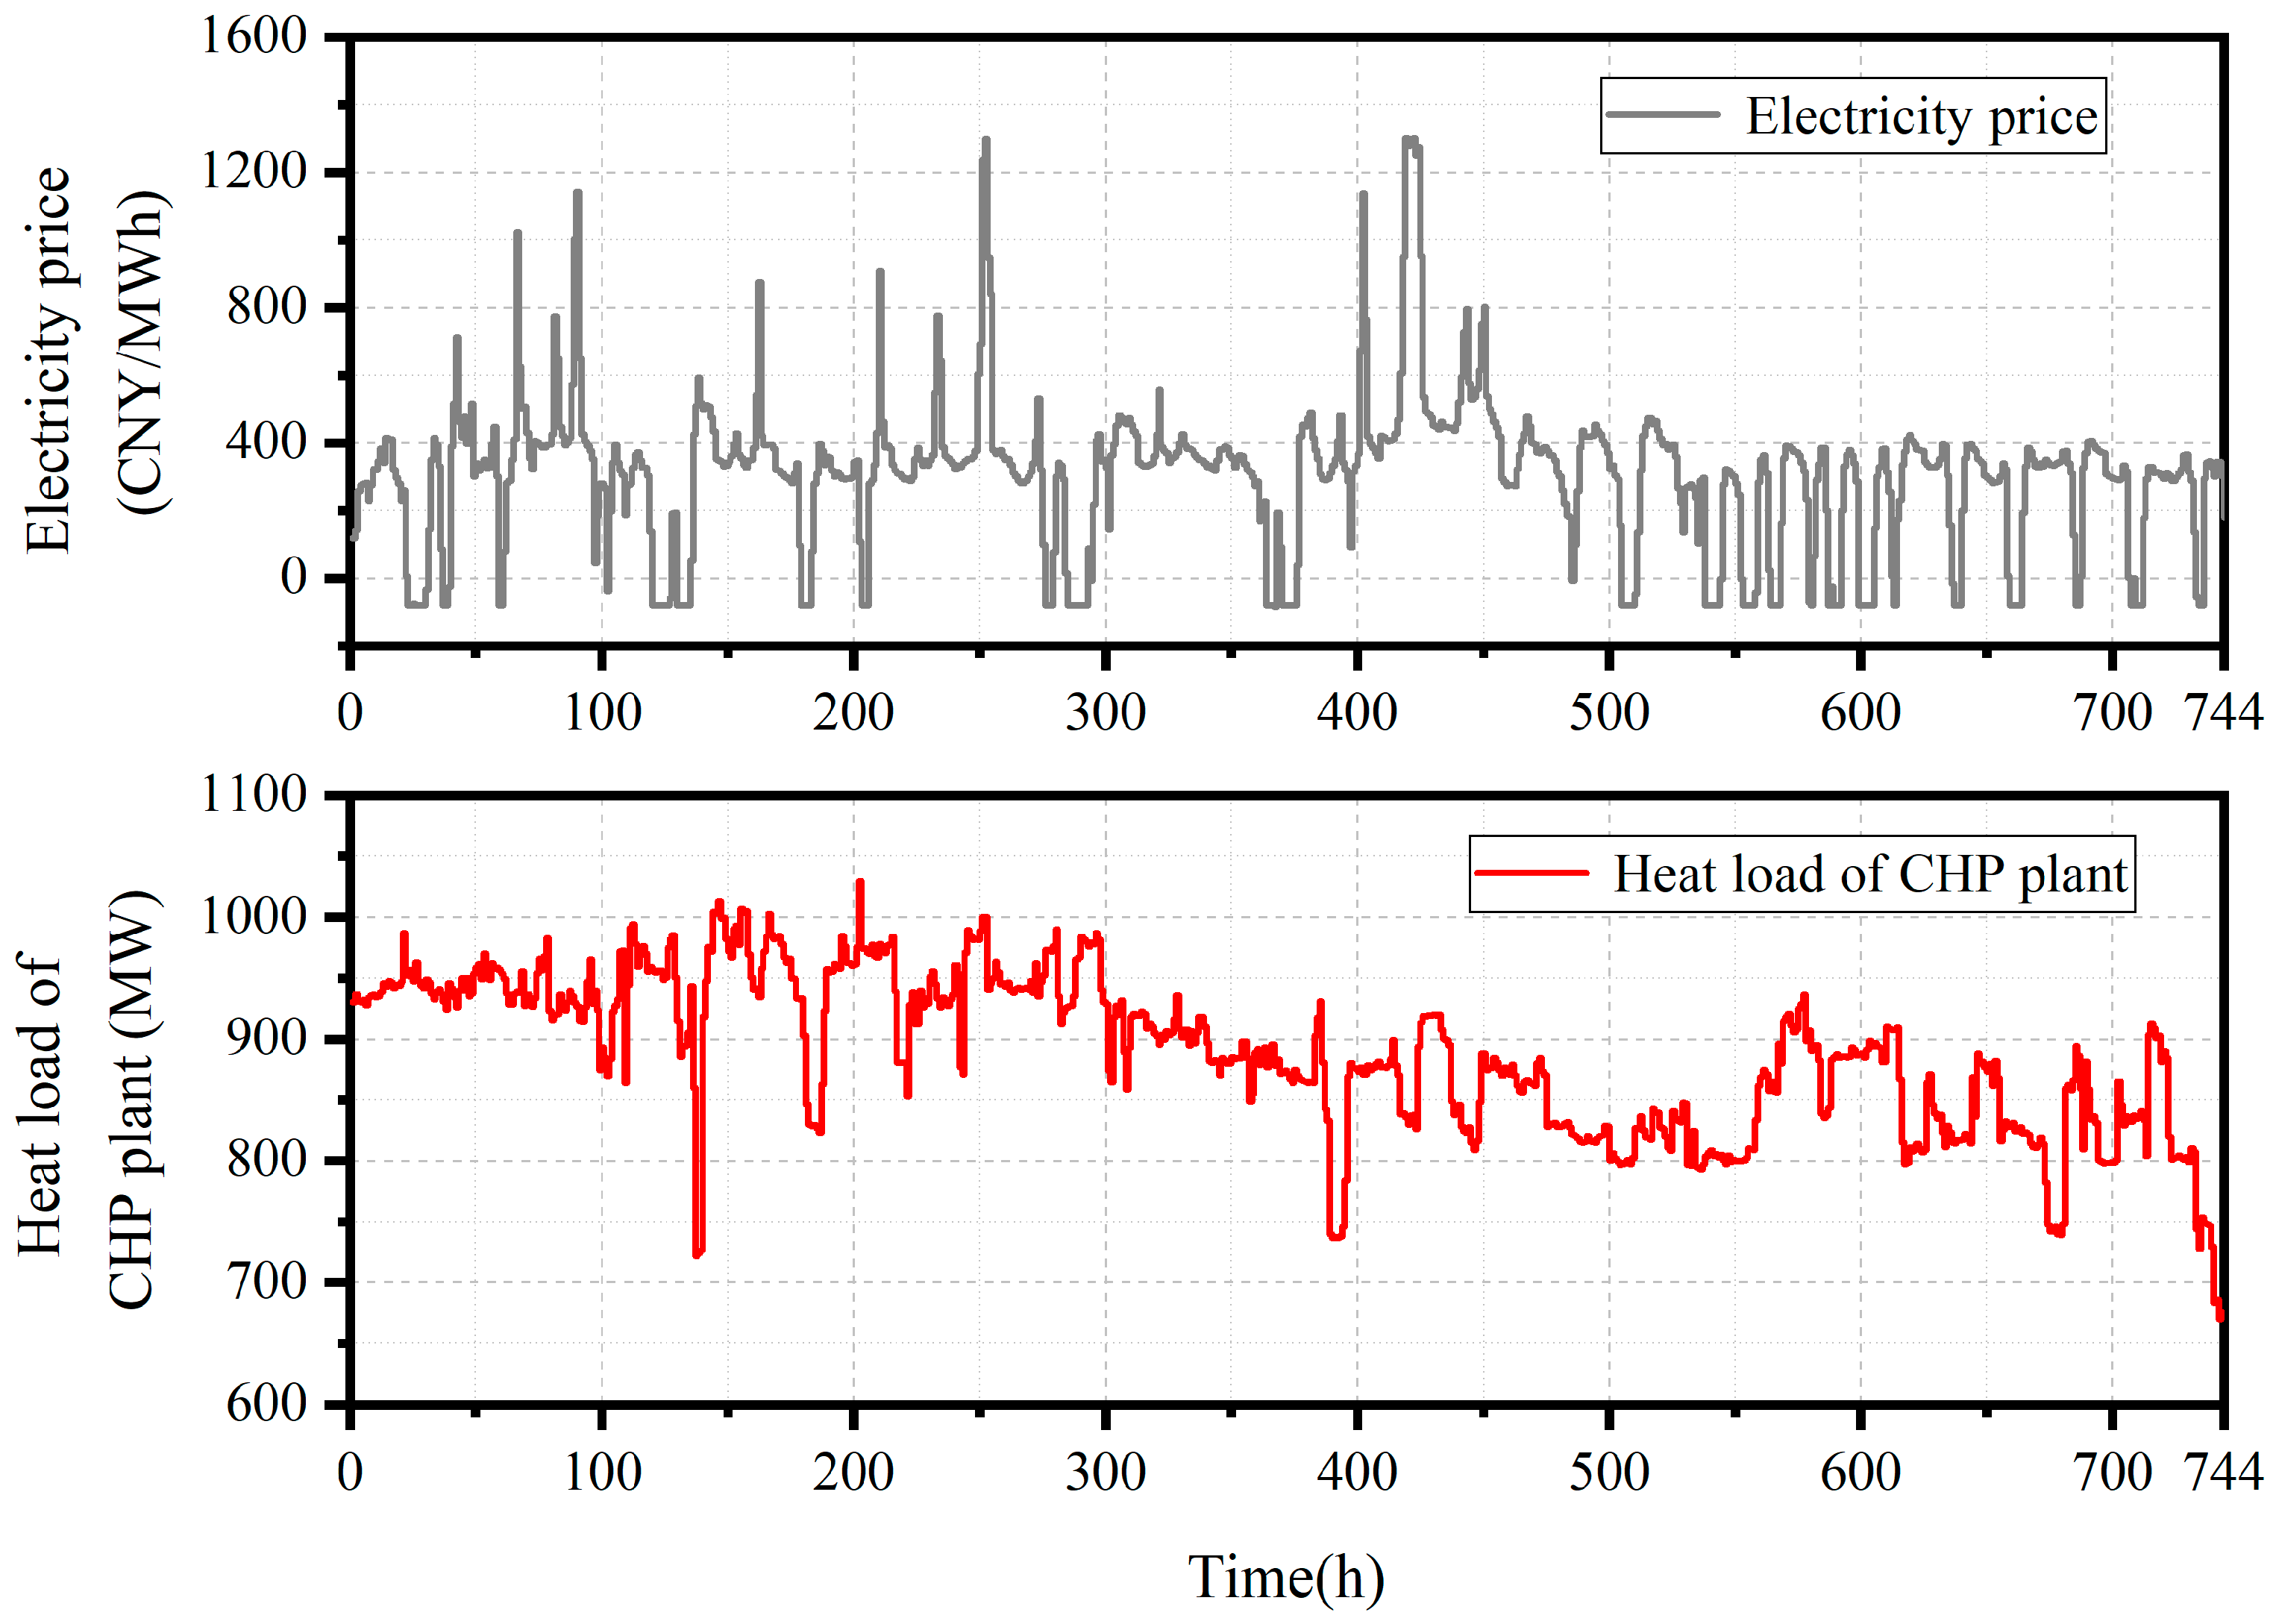
In this section, the economic performance of the retrofitted CHP plant is evaluated through plant-level operation optimization, with comparative analysis against the original CHP plant. This optimization is conducted based on the data of a one-month time span (from 1 January 2024 to 31 January 2024), where electricity price and the heat load are displayed in Figure 7.
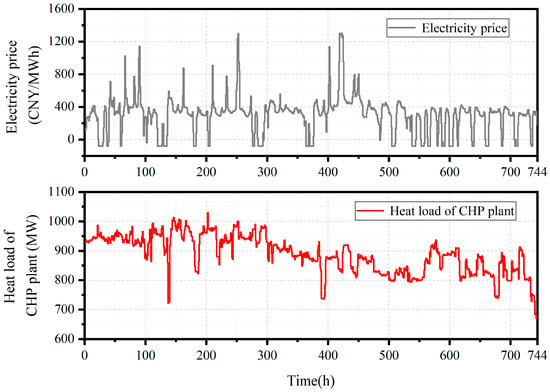
Figure 7.
Electricity price and heat load in the case study (from 1 January 2024 to 31 January 2024).
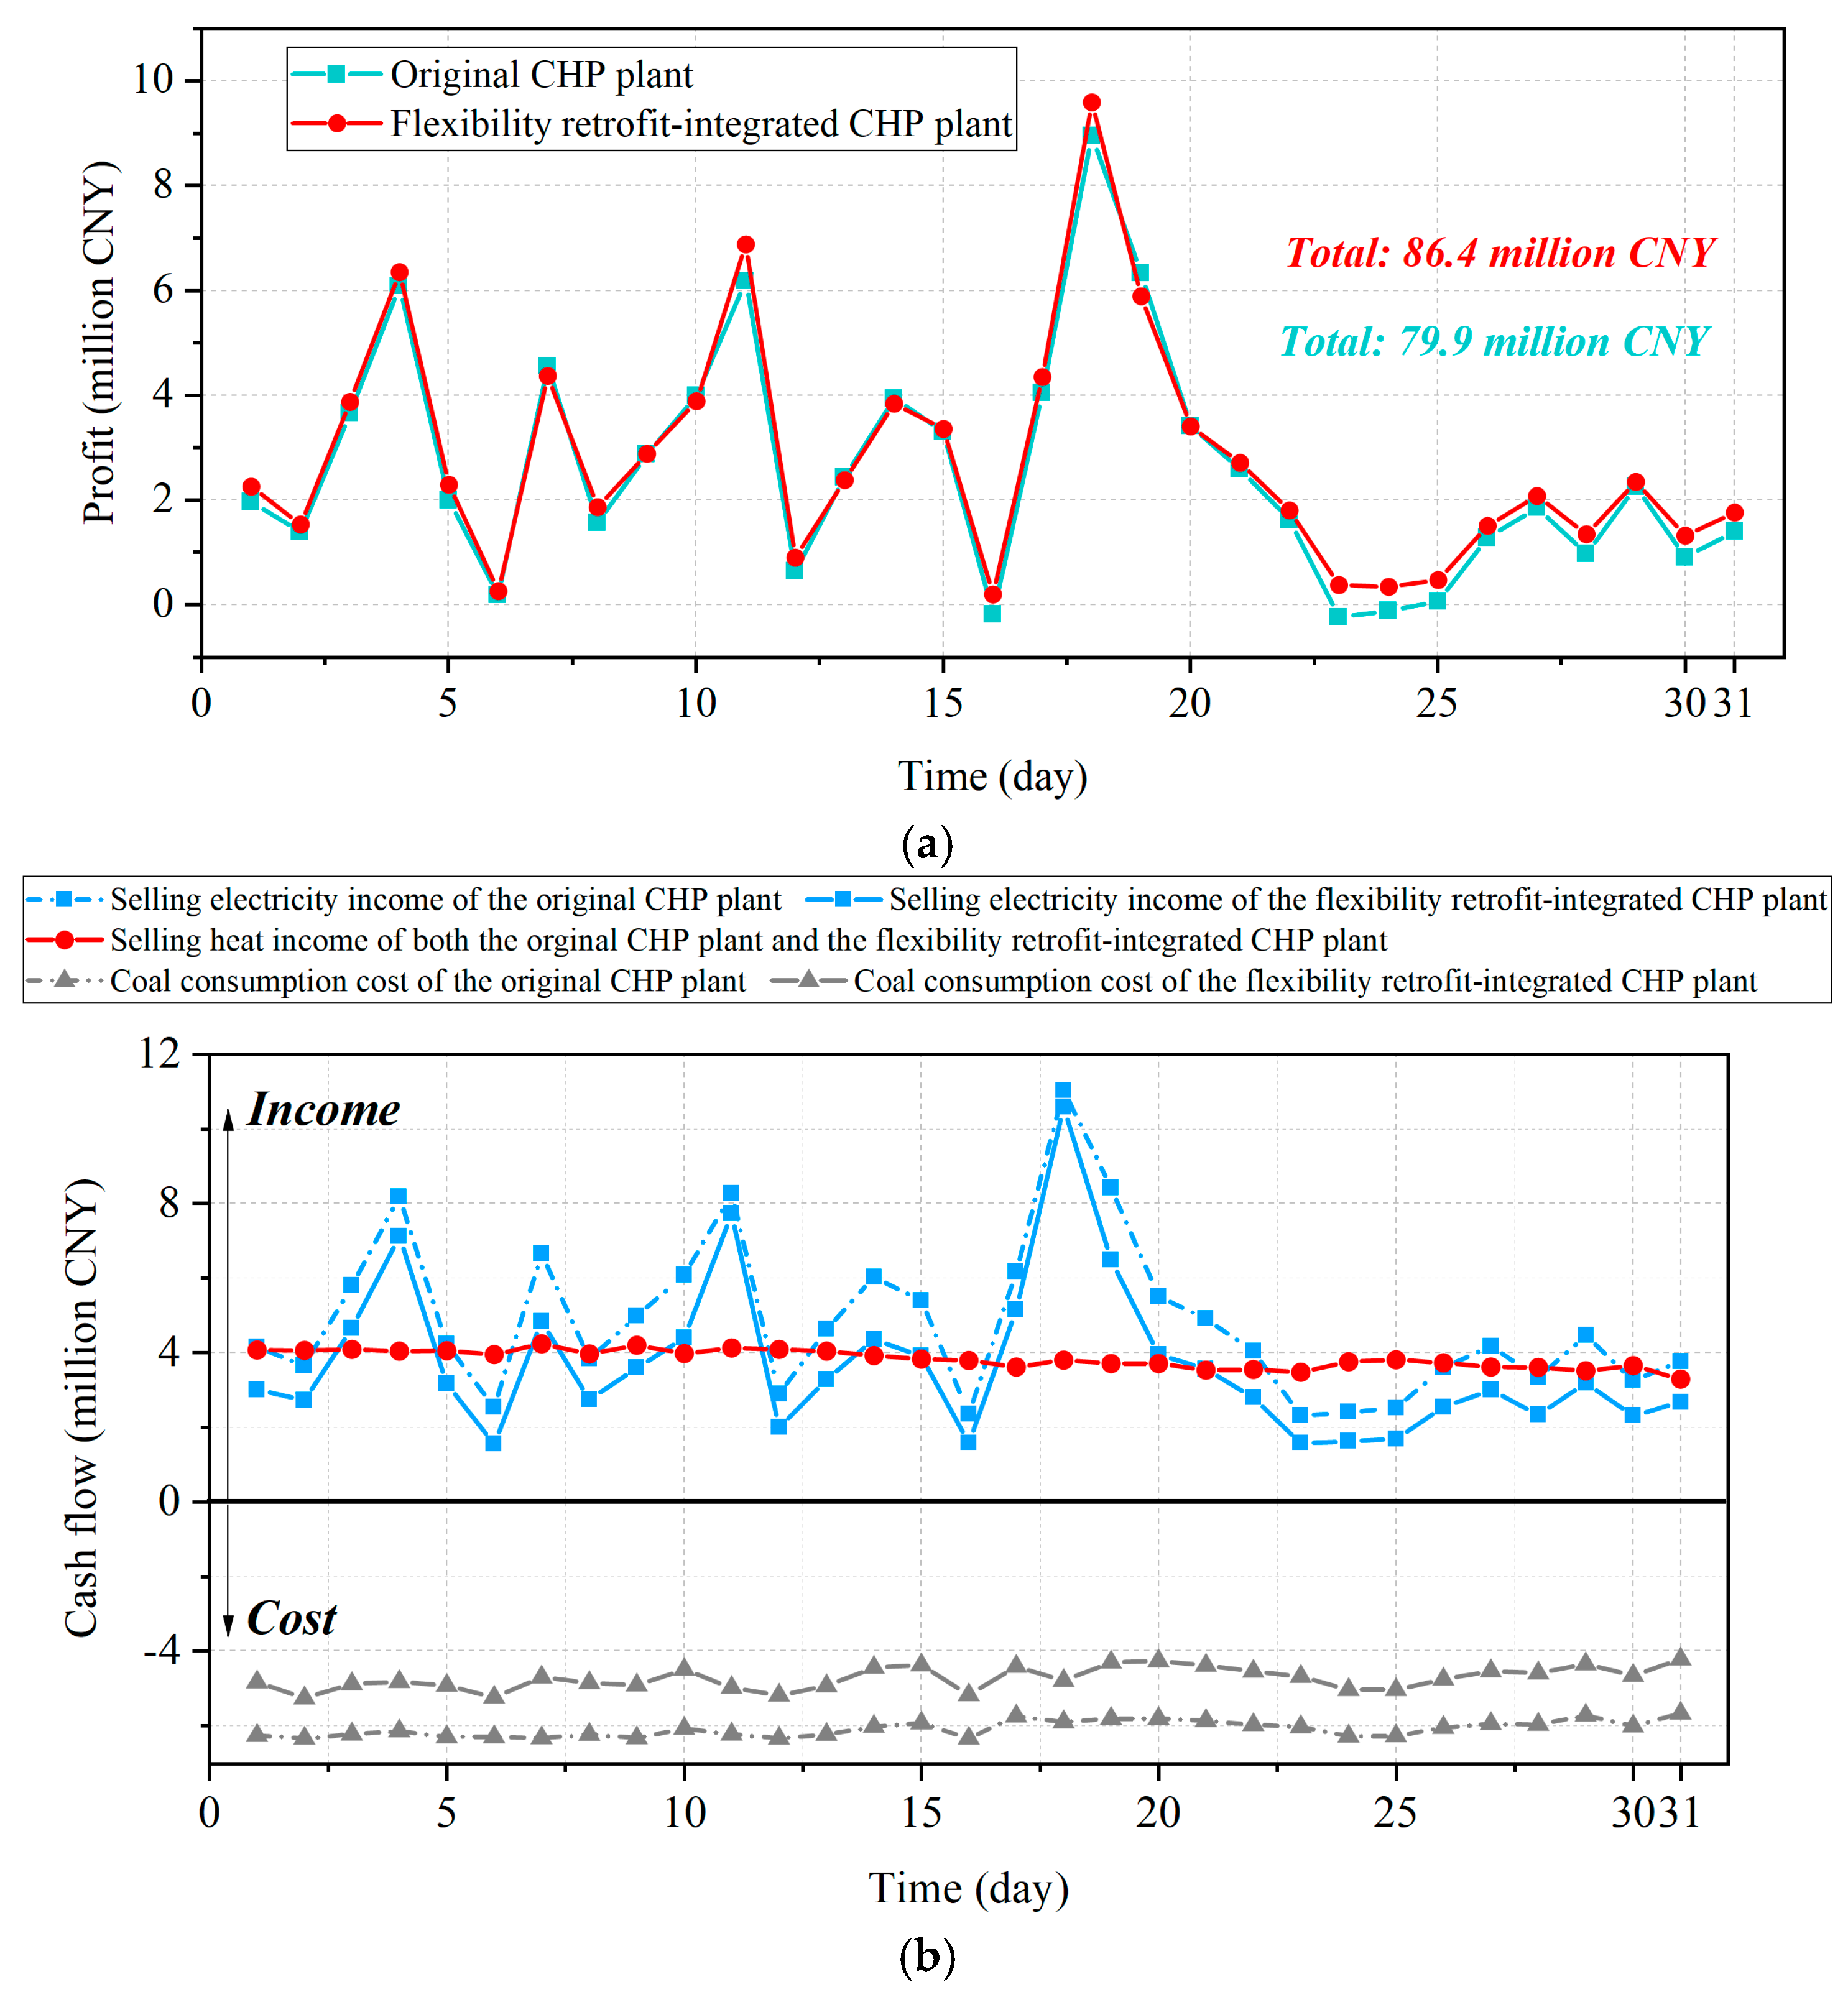
The economic results are shown in Figure 8. Figure 8a illustrates the comparative profit analysis between the original CHP plant and the retrofitted CHP plant over a specified time period, measured in days. The total profit for the original CHP plant is reported as 79.9 million Chinese Yuan (CNY), while the retrofitted CHP plant yields a total profit of CNY 86.4 million, with an increase of 8.1%.
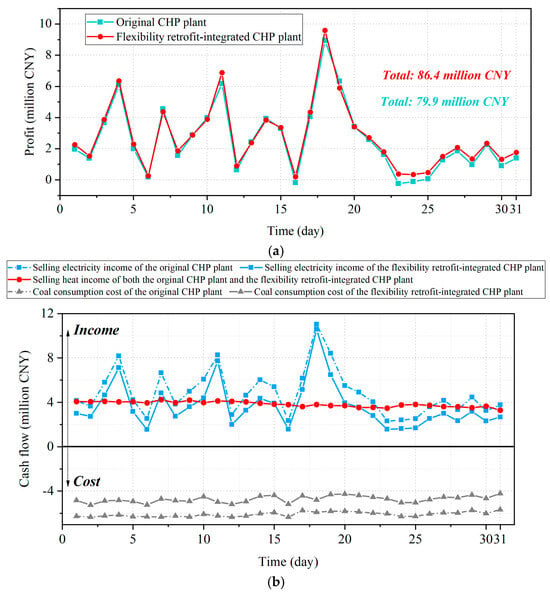
Figure 8.
Economic results ccomparison between the original CHP plant and the retrofitted CHP plant. (a) The profit comparison between two CHP plants. (b) Comparison of the case flow between two CHP plants.
To elucidate the mechanisms through which flexibility retrofitting enhances the economic performance of CHP plants, we conducted a detailed analysis of the cash flows for both the original and retrofitted CHP plant. This analysis focused on income and cost components over a one-month period, as illustrated in Figure 8b. While the electricity sales revenue of the retrofitted CHP plant is frequently lower than that of the original CHP plant, the retrofitted plant achieves higher overall profitability due to a substantial reduction in coal consumption costs. This improved financial outcome is attributed to the enhanced heating capacity of the retrofitted plant, which enables the EC unit to optimize power generation in response to electricity price fluctuations. Specifically, the plant maintains higher power generation during periods of elevated electricity prices and operates at minimal load during low-price intervals, thereby minimizing coal consumption.
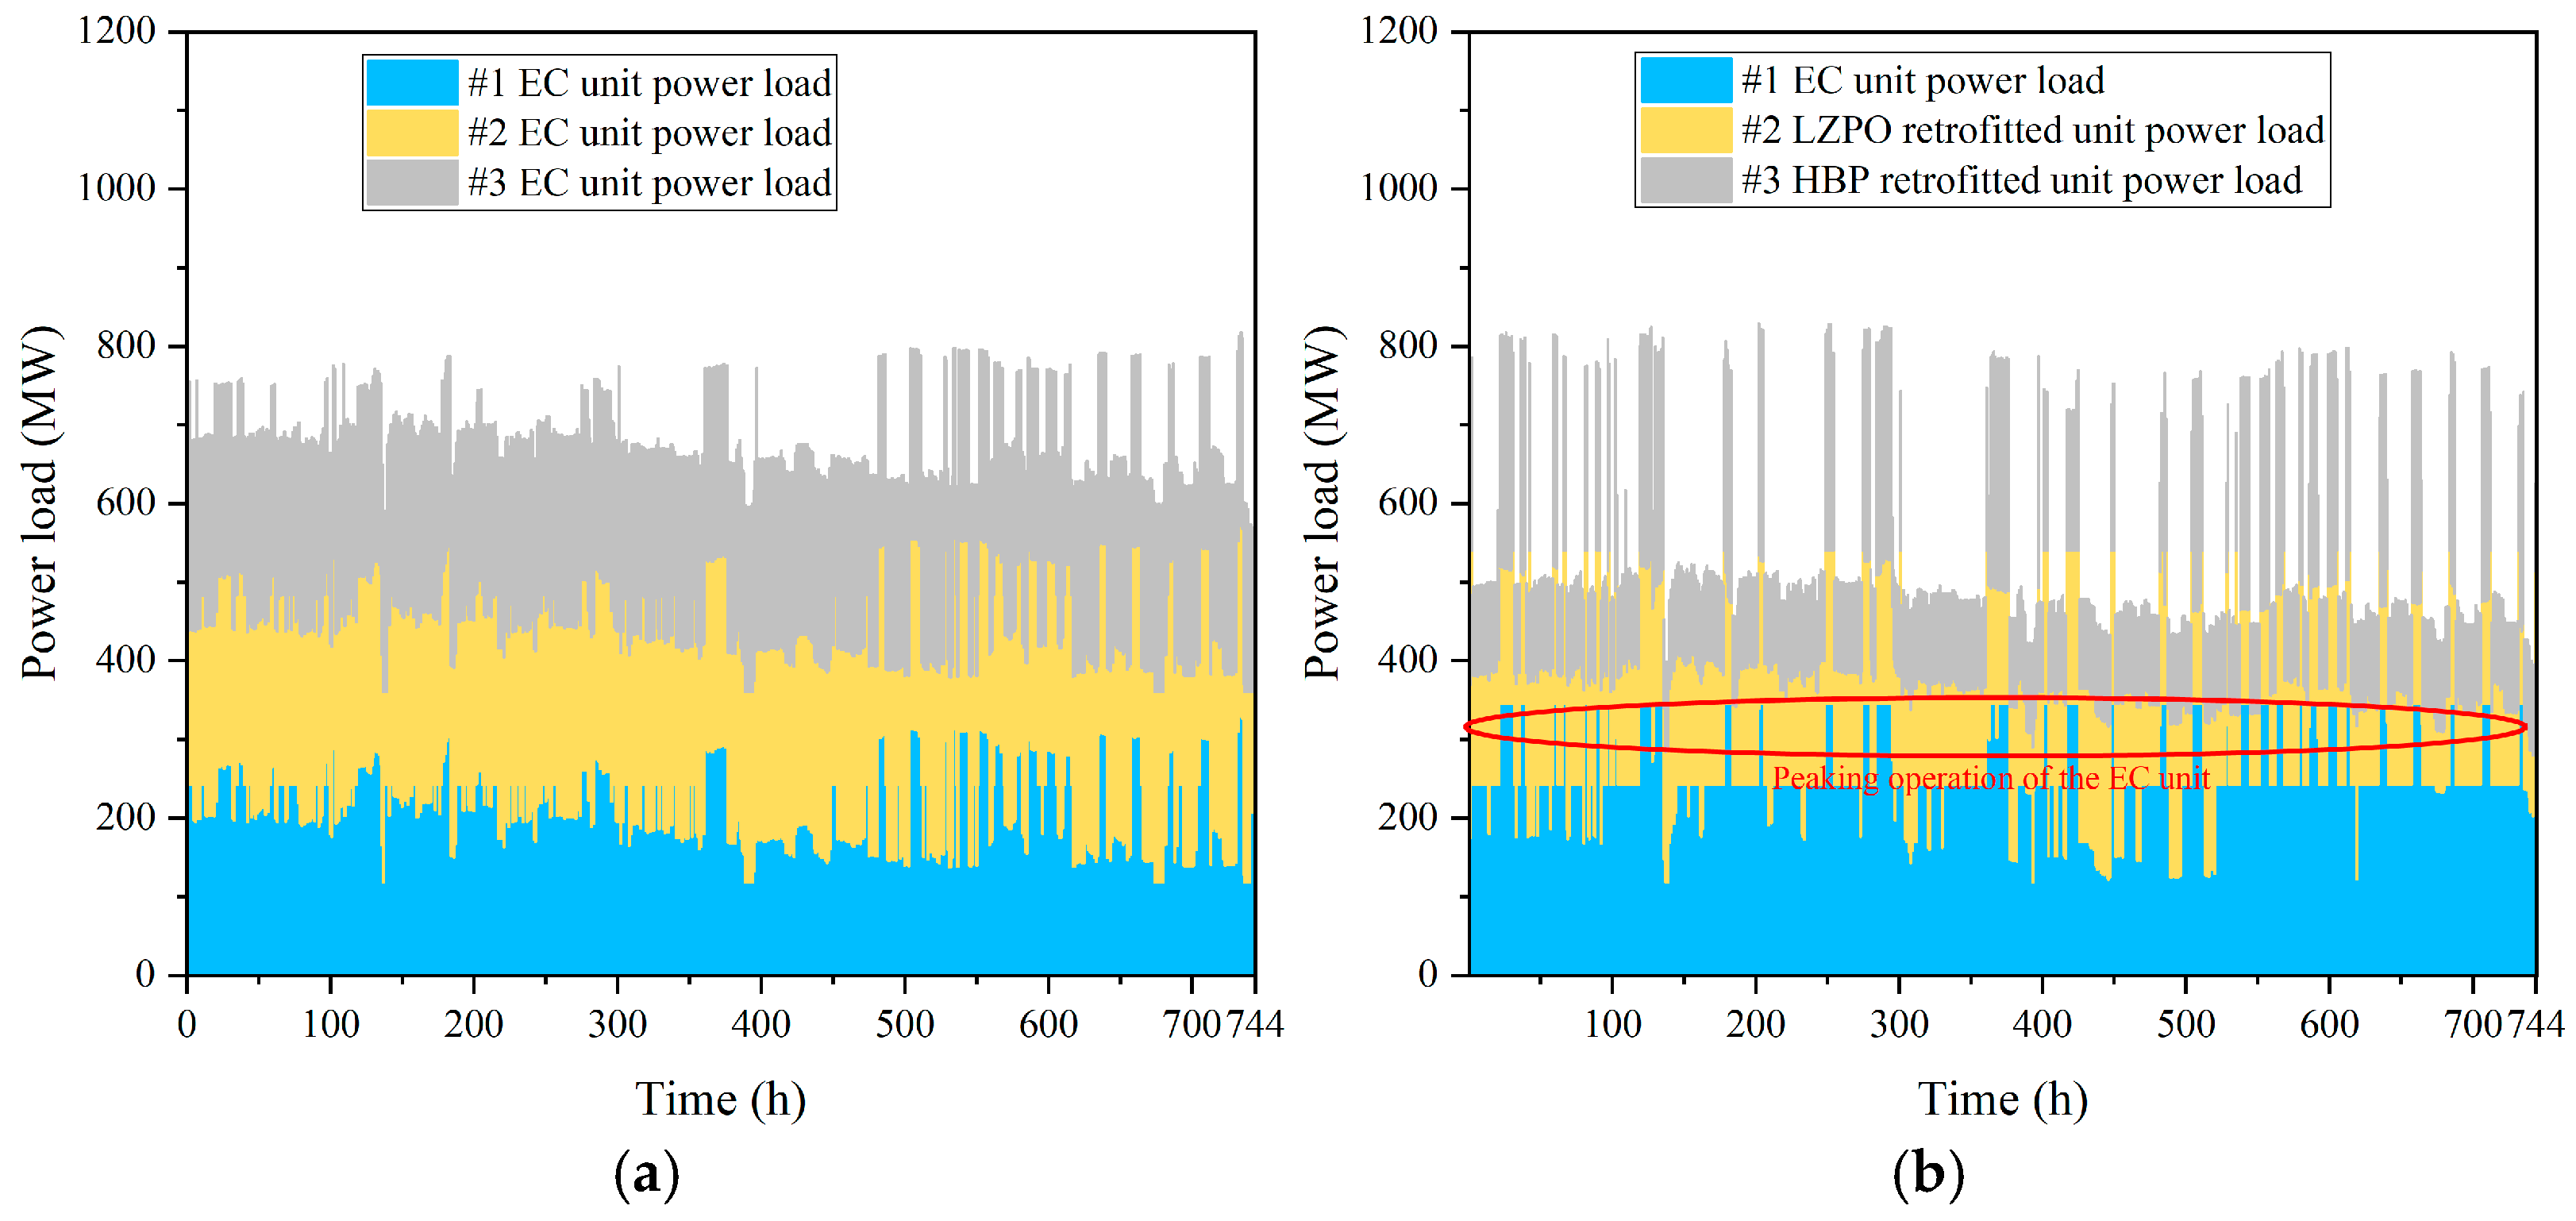
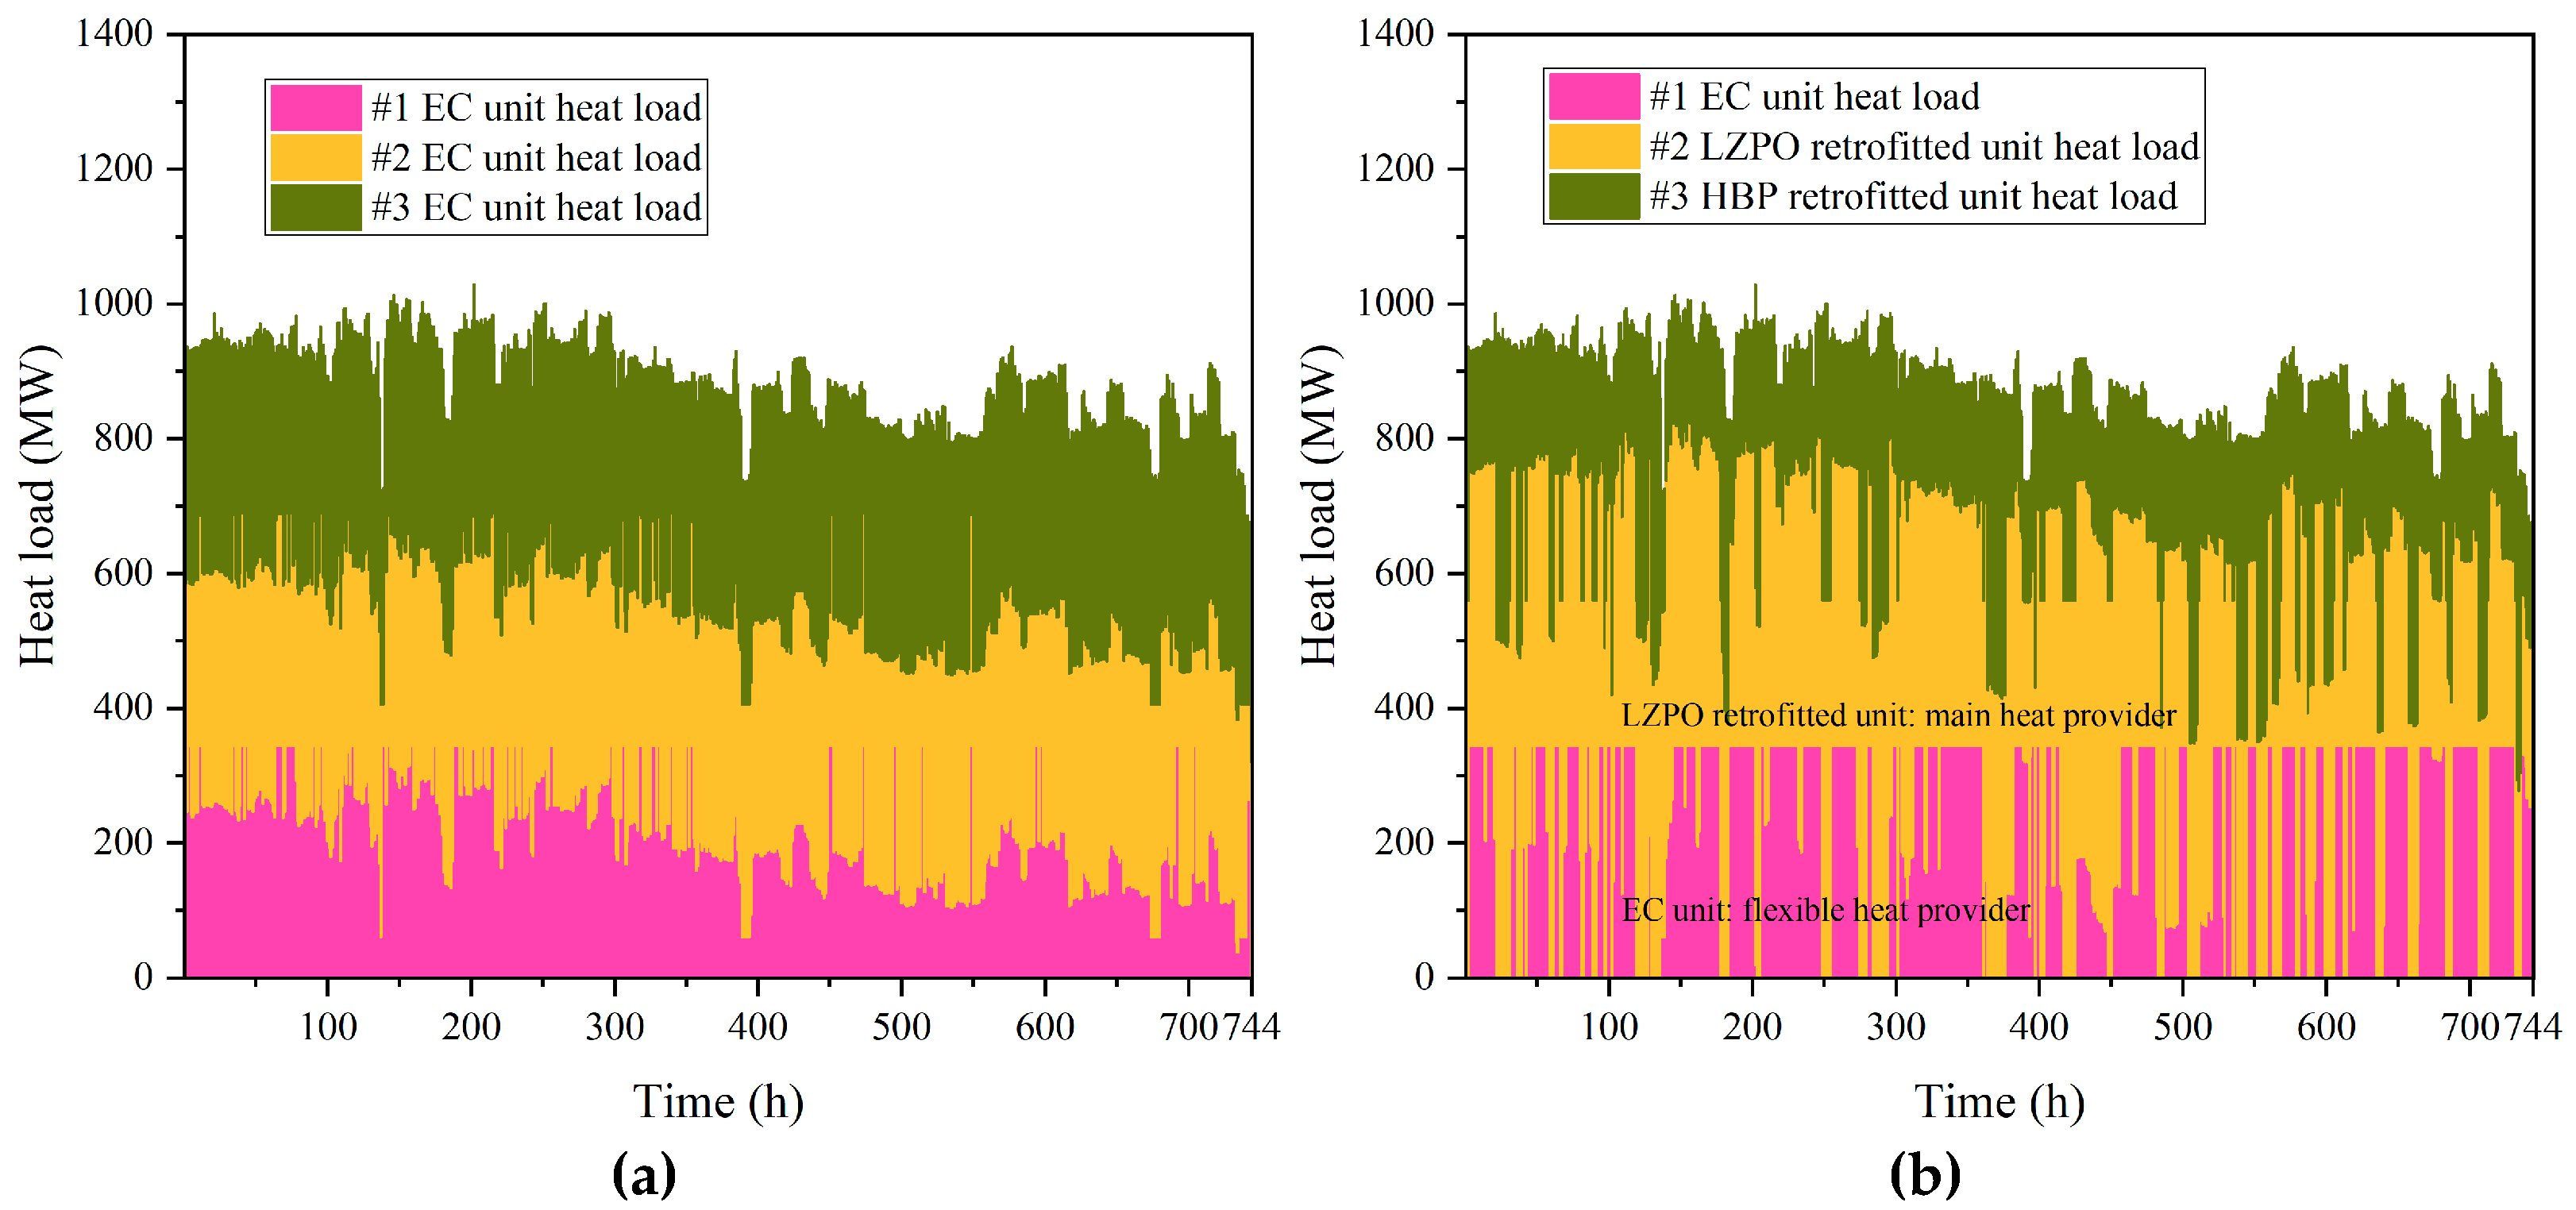
The detailed distributions of power load and heat load within the CHP plants are illustrated in Figure 9 and Figure 10. The power load distribution results, as depicted in Figure 9, indicate that the EC unit of the retrofitted CHP plant exhibits enhanced peaking capacity compared to its counterpart in the original CHP plant. This improvement is attributed to the LZPO retrofitted unit, which assumes the primary heat load, thereby enabling the EC unit to peak its power generation during periods of high electricity prices.
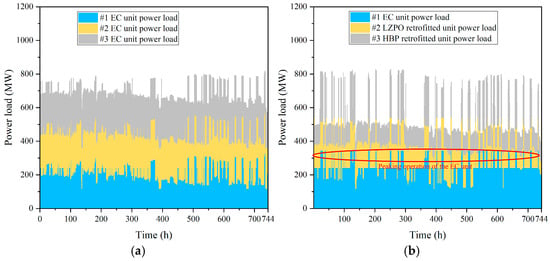
Figure 9.
Power load distribution within the CHP plant. (a) Original CHP plant. (b) The CHP plant integrated with flexibility retrofits.
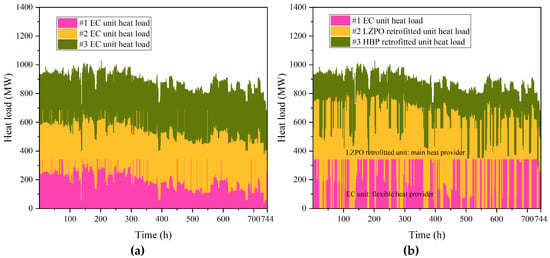
Figure 10.
Heat load distribution within the CHP plant. (a) Original CHP plant. (b) The CHP plant integrated with flexibility retrofits.
Furthermore, the heat load distribution results, presented in Figure 10, elucidate the respective roles of each CHP unit type in the district heating process within the retrofitted CHP plant. Specifically, the LZPO retrofitted unit serves as the main heat provider, while the EC unit functions as a flexible heat provider, capable of adjusting its operation in response to variations in electricity prices and heat demand. Consequently, the enhanced profitability of the retrofitted CHP plant is achieved through the more flexible operation of the EC unit, which relies on the LZPO and HBP retrofitted units to bear the majority of the heating burden.
3.3. Profit Comparison of the CHP Plants with Various Retrofit Combinations
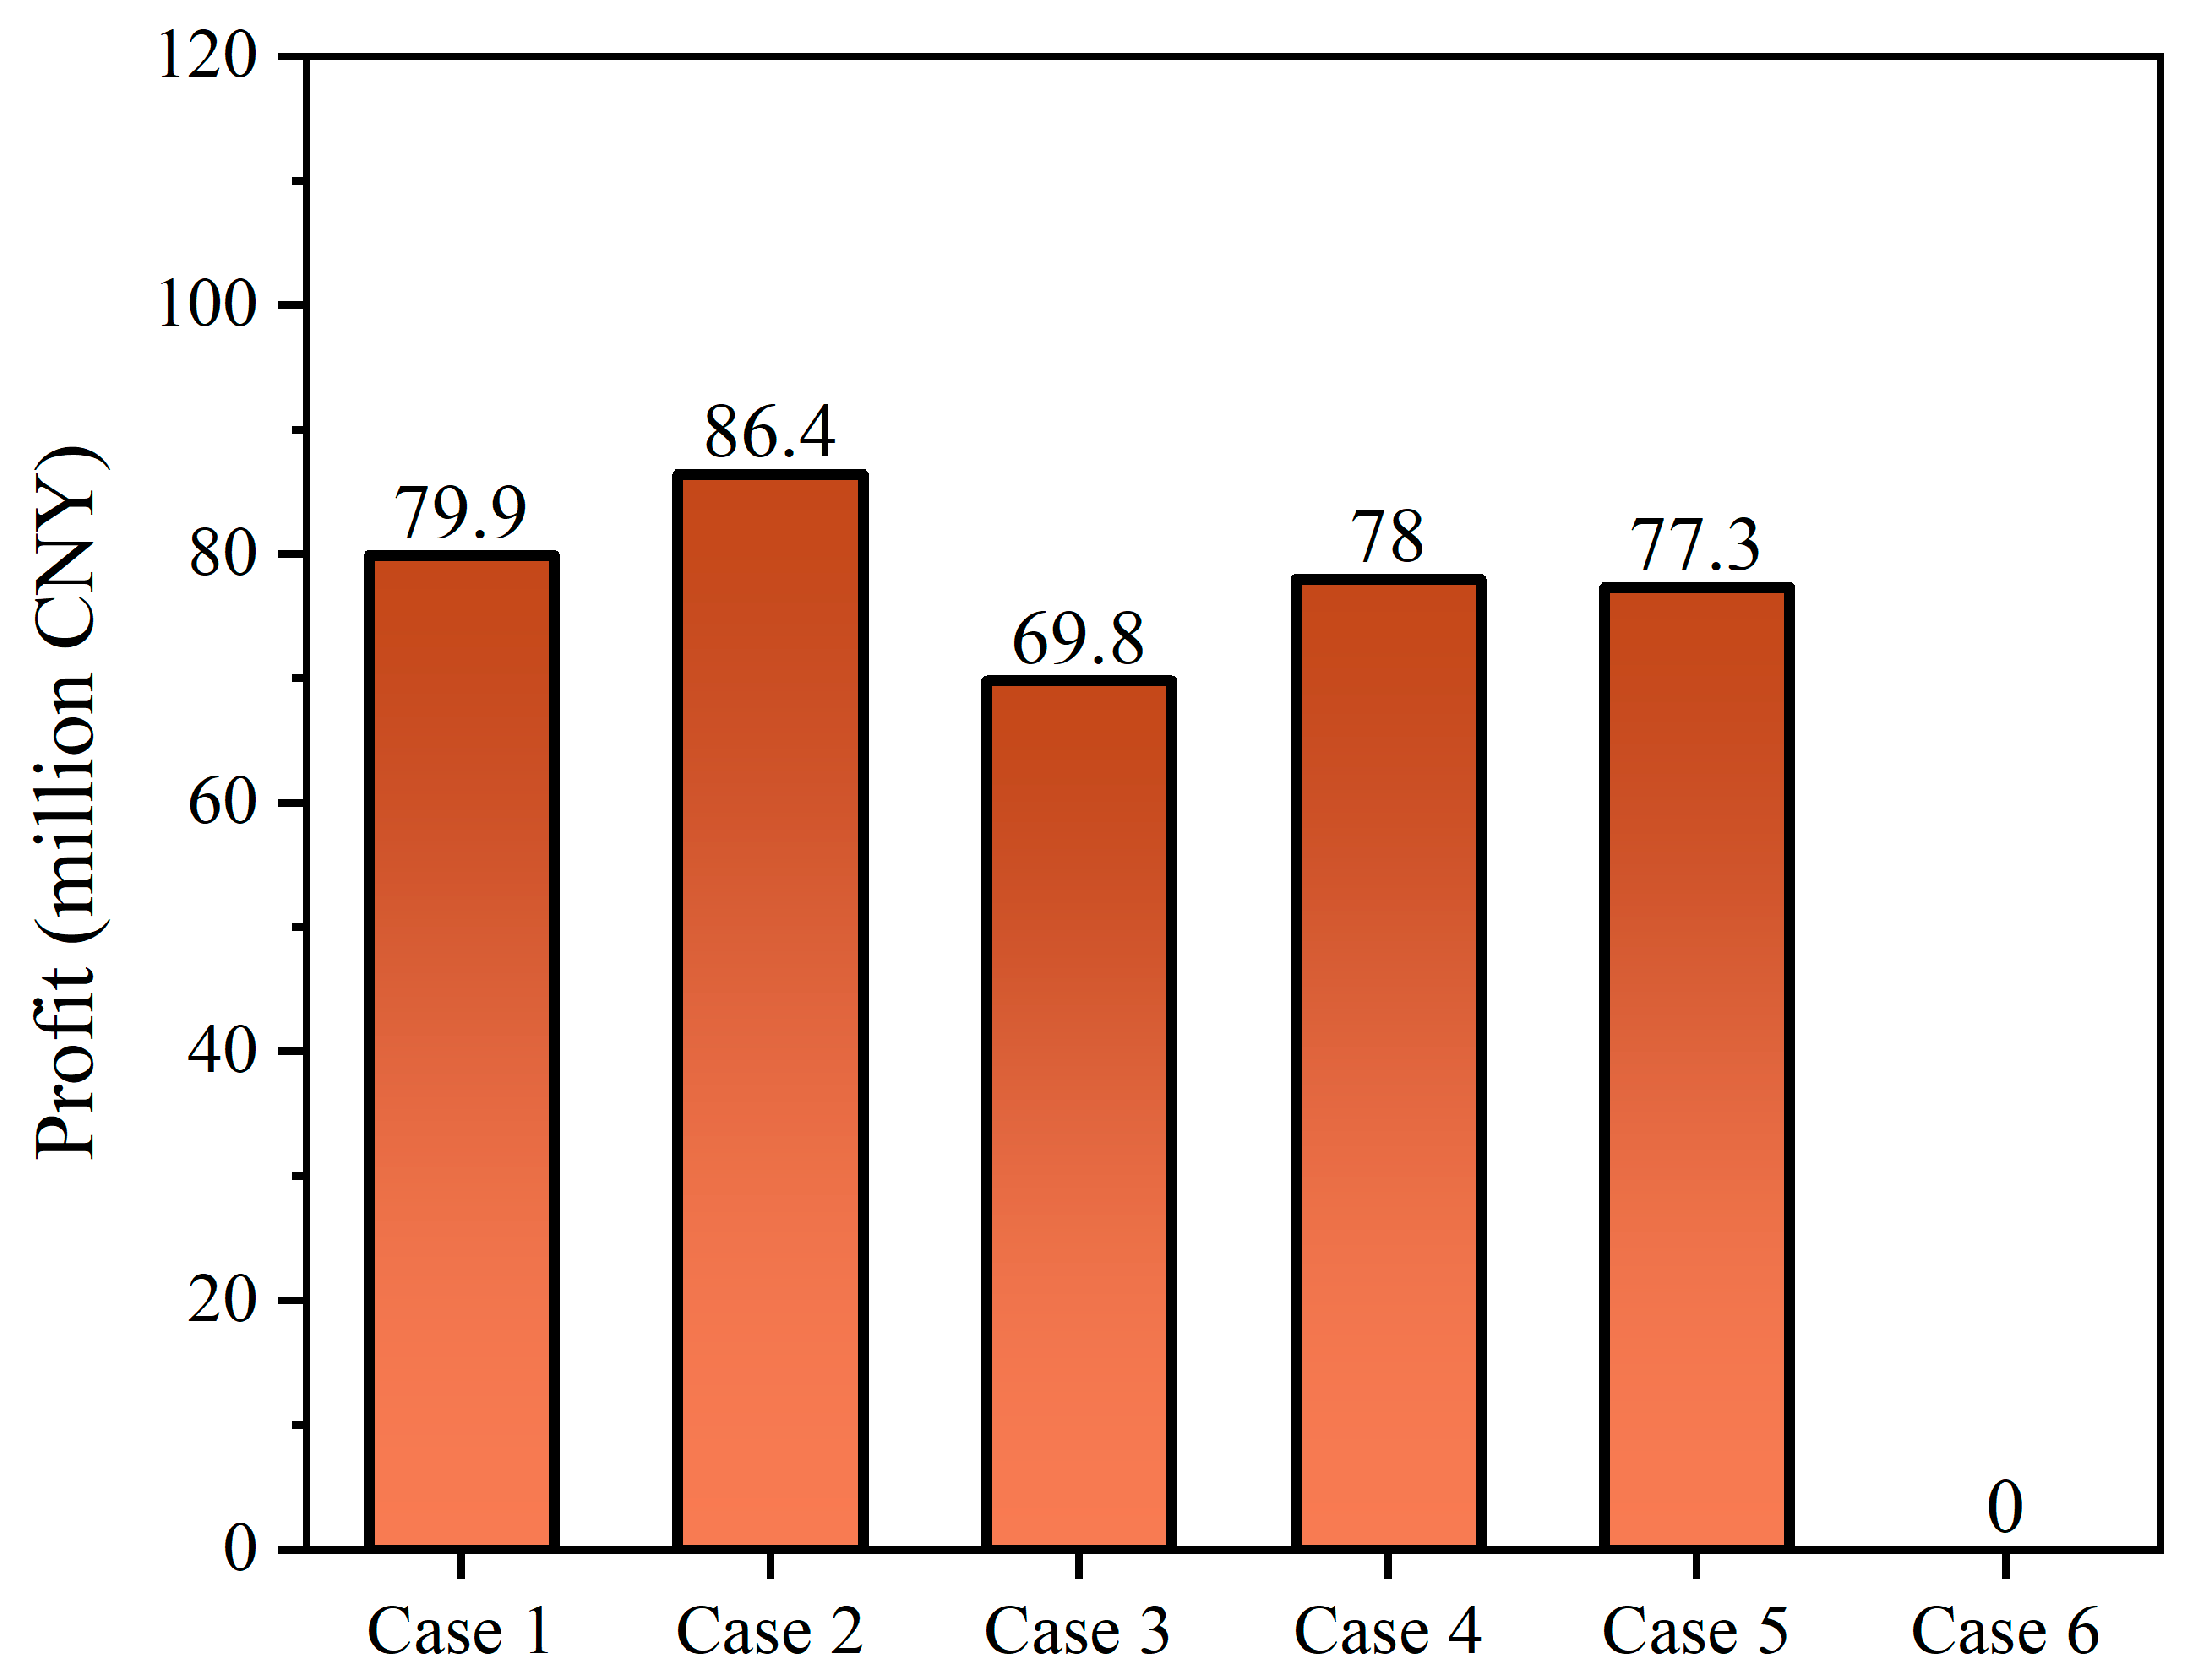
This section further evaluates the impact of various retrofit combinations on the profitability of the CHP plant integrated with flexibility retrofits. The analysis aims to assist plant managers in making informed decisions regarding the optimal types and proportions of retrofitting to maximize economic benefits. The optimization results based on various retrofit combinations are shown in Figure 11.
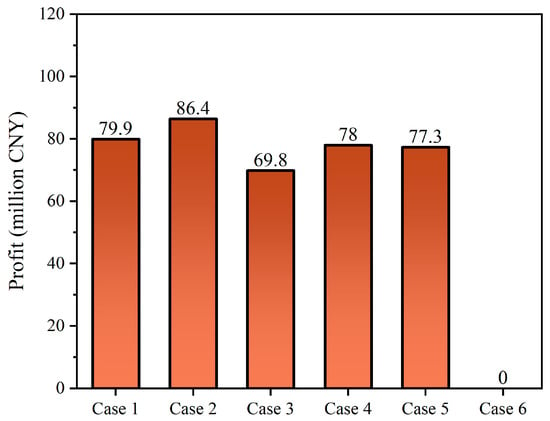
Figure 11.
Economic performance of the CHP plant under various retrofit combinations.
As illustrated in Figure 11, Case 2 exhibits the highest profit of 86.4 million CNY, followed by Case 1 with a profit of 79.9 million CNY. Moreover, the retrofit combination of Case 6 is unreasonable because it fails to meet the water supply temperature requirement of HNH. It can be found that the profit of Case 3 and Case 5 is lower than the original CHP plant (Case 1). The reason for this is that the heat and power output of the LZPO retrofitted unit is fully coupled, preventing it from increasing power generation to achieve satisfactory profit during periods of high electricity prices. In addition, the case also shows a lower profit than the original CHP plant, due to the water supply temperature limit of HNH. These findings reveal the necessity of a reasonable combination. Only by utilizing the energy-saving characteristics of HBP units, the heat supply capacity of LZPO units, and the flexibility adjustment capability of EC units can the optimal profit of the entire power plant be achieved.
3.4. Comparison with Other Studies on CHP’s Flexibility Retrofits
In this section, the finding of this study is compared with those of other studies on CHP’s flexibility retrofits, in terms of the retrofit type, research object, methodology, and quantified results, as summarized in Table 6.

Table 6.
Comparison of the findings on CHP’s flexibility retrofits.
As shown in Table 6, Refs. [35,36] only focus on one type of retrofit, thereby failing to reveal the synergistic mechanism of the HBP retrofitted unit and the LZPO retrofitted unit. Moreover, although Refs. [15,34] involves two retrofitted units, and the research objects focus on the flexibility between peak shaving and heat supply. However, with the development of China’s electricity marketization, how to use the CHP units’ flexibility to arbitrage in the electricity market is an important current issue that has not been solved by the above studies. Compared with existing studies, this paper, for the first time, investigates the feasibility of flexibility retrofitting for CHP units to expand profit margins in the electricity market and derives quantitative results. Further, the impact of various retrofit combinations on the profitability of a flexibility retrofitted CHP plant is assessed.
4. Conclusions
This study presents a comprehensive analysis of thermodynamic efficiency and operational optimization for a CHP plant integrated with flexibility retrofits. The models of the EC unit, HBP retrofitted unit, and the LZPO retrofitted unit are developed. The energy-conversion characteristics of these CHP units are investigated based on energy and exergy efficiency analyses. Subsequently, a plant-level optimization model is proposed to maximize the plant’s profitability in the electricity market. By comparing the profitability of CHP plants with various retrofit combinations, the optimal retrofit combination is identified. The main findings are summarized as follows:
- (1)
- The energy and exergy efficiencies of the EC unit, HBP retrofitted unit, and LZPO retrofitted unit are analysed within the operation regions. Results indicate that the output heat has a greater impact on the CHP plant’s energy efficiency, while the output power significantly influences exergy efficiency. Among the units studied, the LZPO retrofitted unit exhibits the highest energy efficiency, reaching 90.7%, closely followed by the HBP retrofitted unit at 89.8%, and the EC unit at 70.9%. In contrast, the EC unit demonstrates the best exergy efficiency, peaking at 38.0%, while the HBP and LZPO units achieve 35.4% and 32.0%, respectively. These findings demonstrate that flexibility retrofits significantly enhance CHP units’ energy efficiency but may not improve their exergy efficiency, due to the degradation of energy quality.
- (2)
- The profitability of the CHP plant integrated with flexibility retrofits is evaluated via plant-level operation optimization, a comparative analysis against the original CHP plant. Results indicate that the original CHP plant generates a total profit of 79.9 million CNY, whereas the retrofitted plant achieves CNY 86.4 million, with an increase of 8.1%. This profit improvement stems from two key mechanisms. First, the retrofitting reduces the unit’s coal consumption for heat supply. Second, the HBP and LZPO retrofits enhance the heating capacity of the CHP plant, enabling the EC unit to optimize power generation according to the dynamics in electricity prices.
- (3)
- The impact of retrofit combinations on the CHP plant’s profitability is evaluated, aiming to assist plant managers in making informed decisions on the optimal types and proportions of retrofitting to maximize economic benefits. Results show that Case 2 exhibits the highest profit of 86.4 million CNY, followed by the original power plant (Case 1) with a profit of 79.9 million CNY. The results reveal that an excessive number of HBP units fail to provide higher profit, as the heat network water supply temperature cannot meet the requirement. Additionally, an excessive deployment of LZPO units also restricts the arbitrage capability during periods of high electricity prices, as this configuration sacrifices power generation capacity to prioritize heating output.
This study provides valuable insights into how to maximize the profits of a CHP plant integrated with flexibility retrofit. However, the research relies on steady-state models and utilizes off-design calculations to simplify dynamic operational processes. Therefore, future work will focus on developing dynamic simulations of flexibility-retrofitted units to achieve findings that more closely reflect real-world scenarios.
Author Contributions
H.C.: writing, original draft preparation, Software. J.S.: supervision, Conceptualization. All authors have read and agreed to the published version of the manuscript.
Funding
This research was funded by the Project of Shandong Zhongshi Yitong Group Co., Ltd. (YTZB20230919).
Data Availability Statement
The raw data supporting the conclusions of this article will be made available by the authors on request.
Conflicts of Interest
The authors declare no conflicts of interest.
Nomenclature
| Abbreviations | |
| CAES | Compressed air energy storage |
| CHP | Combined heat and power |
| EB | Electric boiler |
| EC | Extraction-condensing |
| HBP | High back pressure |
| HC | Heating condenser |
| HCR | Heat consumption rate |
| HNH | Heat network heater |
| HP | Heat pump |
| HPD | Heat-power decoupling |
| HPT | High-pressure turbine |
| LPT | Low-pressure turbine |
| LZPO | Low-pressure turbine zero output |
| MILP | Mixed inter linear programming |
| MPT | Medium-pressure turbine |
| RH | Regenerative heater |
| TES | Thermal energy storage |
| THA | Turbine heat acceptance |
| Symbols | |
| Mass flow rate, t/h | |
| Specific enthalpy, kJ/kg | |
| Extraction steam enthalpy drop, kJ/kg | |
| Drainage water enthalpy drop, kJ/kg | |
| Feed water enthalpy rise, kJ/kg | |
| Efficiency, % | |
| Power load, MW | |
| Heat load, MW | |
| Coal consumption rate, t/h | |
| Lower heating value, kJ/kg | |
| Consumed power ratio by the unit itself, % | |
| Specific entropy, kJ/(kg·K) | |
| Temperature, K | |
| Specific exergy, kJ/kg | |
| Price, CNY/MW | |
| Subscripts | |
| No. i RH | |
| Feed water | |
| Heating extracted steam | |
| Exhaust steam | |
| Main steam | |
| Generator | |
| Electricity energy | |
| Heat energy | |
| Coal |
References
- Yang, F.; Yang, X.; Li, X. China’s diverse energy transition pathways toward carbon neutrality by 2060. Sustain. Prod. Consum. 2024, 47, 236–250. [Google Scholar] [CrossRef]
- Napiontek, J.; Fishman, T.; Pichler, P.; Heintz, J.; Weisz, H. live (a) little: GHG emissions from residential building materials for all 400 counties and cities of Germany until 2050. Resour. Conserv. Recycl. 2025, 215, 108117. [Google Scholar] [CrossRef]
- Tozan, B.; Hoxha, E.; Sørensen, C.; Birgisdóttir, H. Resource consumption and GHGe of future new construction: Hotspots for mitigation efforts in Denmark. Sustain. Prod. Consum. 2025, 54, 1–11. [Google Scholar] [CrossRef]
- Wang, X.; Cui, C.; Pan, C.; Zhang, C.; Ren, H.; Ghias, A. A deep reinforcement learning control strategy to improve the operating flexibility of CHP units under variable load conditions. Therm. Sci. Eng. Prog. 2024, 49, 102482. [Google Scholar] [CrossRef]
- Zhao, C.; Wang, C.; Fan, J.; Liu, M.; Liu, J.; Yan, J. Enhancing the load ramp-up capability of the subcritical CFB power unit by considering the evolution of internal stored energy. Energy 2024, 307, 132571. [Google Scholar] [CrossRef]
- Wu, C.; Wang, C.; Hou, Z.; Wang, Z. Flexible peak shaving in coal-fired power plants: A comprehensive review of current challenges, recent advances, and future perspectives. Energy 2025, 327, 136446. [Google Scholar] [CrossRef]
- Wang, R.; Du, X.; Shi, Y.; Deng, W.; Wang, Y.; Sun, F. A novel system for reducing power plant electricity consumption and enhancing deep peak-load capability. Energy 2024, 295, 131031. [Google Scholar] [CrossRef]
- Hou, G.; Fan, Y.; Wang, J. Intelligent fuzzy neural network modeling for flexible operation of combined heat and power plant with heat-power decoupling technology. Energy 2024, 309, 133099. [Google Scholar] [CrossRef]
- Wang, Z.; Xu, J.; Ma, S.; Zhao, G.; Wang, J.; Gu, Y. Comparative investigation on heat pump solutions for peak shaving and heat-power decoupling in combined heat and power plants. Renew. Sustain. Energy Rev. 2025, 216, 115703. [Google Scholar] [CrossRef]
- Baidya, D.; Kannaiyan, S.; Bhushan, M.; Bhartiya, S. Plantwide dynamic simulation of hybrid solar thermal power plant with molten salt thermal energy storage. Renew. Energy 2025, 255, 123794. [Google Scholar] [CrossRef]
- Tang, H.; Liu, M.; Zhang, K.; Zhang, S.; Wang, C.; Jan, J. Performance evaluation and operation optimization of a combined heat and power plant integrated with molten salt heat storage system. Appl. Therm. Eng. 2024, 245, 122848. [Google Scholar] [CrossRef]
- Jin, T. Estimating the potential of power-to-heat (P2H) in 2050 energy system for the net-zero of South Korea. Energy 2025, 314, 134206. [Google Scholar] [CrossRef]
- Li, J.; Li, X.; Yan, P.; Zhou, G.; Liu, J.; Yu, D. Thermodynamics, flexibility and techno-economics assessment of a novel integration of coal-fired combined heating and power generation unit and compressed air energy storage. Appl. Energy 2023, 339, 120924. [Google Scholar] [CrossRef]
- Chae, Y.; Lee, J. Thermodynamic analysis of compressed and liquid carbon dioxide energy storage system integrated with steam cycle for flexible operation of thermal power plant. Energy Convers. Manag. 2022, 256, 115374. [Google Scholar] [CrossRef]
- Wang, C.; Song, J. Performance assessment of the novel coal-fired combined heat and power plant integrating with flexibility renovations. Energy 2023, 263, 125886. [Google Scholar] [CrossRef]
- Lai, F.; Wang, S.; Liu, M.; Yan, J. Operation optimization on the large-scale CHP station composed of multiple CHP units and a thermocline heat storage tank. Energy Convers. Manag. 2020, 211, 112767. [Google Scholar] [CrossRef]
- Wang, C.; Liu, F. Dynamic performance of a power plant integrating with molten salt thermal energy storage. Appl. Therm. Eng. 2025, 262, 125223. [Google Scholar] [CrossRef]
- Liu, M.; Wang, S.; Zhao, Y.; Tang, H.; Yan, J. Heat–power decoupling technologies for coal-fired CHP plants: Operation flexibility and thermodynamic performance. Energy 2019, 188, 116074. [Google Scholar] [CrossRef]
- Sinha, R.; Bak-Jensen, B.; Pillai, J.; Zareipour, H. Flexibility from Electric Boiler and Thermal Storage for Multi Energy System Interaction. Energies 2020, 13, 98. [Google Scholar] [CrossRef]
- Salman, C.; Li, H.; Li, P.; Yan, J. Improve the flexibility provided by combined heat and power plants (CHPs)—A review of potential technologies. E-Prime-Adv. Electr. Eng. Electron. Energy 2021, 1, 100023. [Google Scholar] [CrossRef]
- Wang, L.; Zhang, S.; Fu, Y.; Liu, M.; Liu, J.; Yan, J. Heat–power decoupling for the CHP unit by utilizing heat storage in the district heating system integrated with heat pumps: Dynamic modeling and performance analysis. Energy 2024, 306, 132485. [Google Scholar] [CrossRef]
- Lepiksaar, K.; Mašatin, V.; Latõšov, E.; Siirde, A.; Volkova, A. Improving CHP flexibility by integrating thermal energy storage and power-to-heat technologies into the energy system. Smart Energy 2021, 2, 100022. [Google Scholar] [CrossRef]
- Wang, C.; Song, J.; Zheng, W.; Zhu, L.; Guo, J.; Wang, W. Integration of compressed air energy storage into combined heat and power plants: A solution to flexibility and economy. Energy Convers. Manag. 2023, 290, 117215. [Google Scholar] [CrossRef]
- Hu, Q.; Wang, K.; Zhang, L.; Zhou, L.; Chen, R.; Wang, S.; Zhang, Y.; Li, G. Theoretical investigation on heat-electricity decoupling technology of low-pressure steam turbine renovation for CHPs. In IOP Conference Series: Earth and Environmental Science; IOP Publishing: Bristol, UK, 2019; Volume 227, p. 042043. [Google Scholar] [CrossRef]
- Liu, S.; Zhang, J.; Wu, X.; Hu, Y. Performance Analysis and Application Research of Low-Pressure Cylinder Zero Output Technology on 320 MW Unit. Electr. Power 2021, 54, 213–220. (In Chinese) [Google Scholar]
- Wang, J. Analysis of Flexible Peak-Load Regulation Capability and Economy on the Zero Output Technology of Low-Pressure Cylinder for 650 MW Supercritical Unit. J. Eng. Therm. Energy Power 2021, 36, 18–23. (In Chinese) [Google Scholar]
- Zhao, S.; Wang, W.; Ge, Z. Energy and Exergy Evaluations of a Combined Heat and Power System with a High Back-Pressure Turbine under Full Operating Conditions. Energies 2020, 13, 4484. [Google Scholar] [CrossRef]
- Chen, H.; Xiao, Y.; Xu, G.; Xu, J.; Yao, X.; Yang, Y. Energy-saving mechanism and parametric analysis of the high back-pressure heating process in a 300 MW coal-fired combined heat and power unit. Appl. Therm. Eng. 2019, 149, 829–840. [Google Scholar] [CrossRef]
- Ma, L.; Ge, Z.; Fu, Z.; Wei, H. A novel super high back pressure cascade heating scheme with multiple large-scale turbine units. Energy 2020, 201, 117469. [Google Scholar] [CrossRef]
- Ge, Z.; Sun, S.; Wan, Y.; Zhao, S.; He, J. Applicability Analysis of High Back-pressure Heating Retrofit for Large-scale Steam Turbine Unit. Proc. CSEE 2017, 37, 3216–3222. (In Chinese) [Google Scholar]
- Wang, C.; Song, J.; Zheng, W.; Liu, Z.; Lin, C. Analysis of economy, energy efficiency, environment: A case study of the CHP system with both civil and industrial heat users. Case Stud. Therm. Eng. 2022, 30, 101768. [Google Scholar] [CrossRef]
- Zhu, L.; Zong, Z.; Wang, C.; Song, J.; Guo, J.; Zheng, W. Thermo-economic comparison of integrating compressed air energy storage and molten salt thermal energy storage in a combined heat and power plant. Appl. Therm. Eng. 2025, 260, 124931. [Google Scholar] [CrossRef]
- Wang, W.; Jing, S.; Sun, Y.; Liu, J.; Niu, Y.; Zeng, D.; Cui, C. Combined heat and power control considering thermal inertia of district heating network for flexible electric power regulation. Energy 2019, 169, 988–999. [Google Scholar] [CrossRef]
- Wang, C.; Song, J.; You, D.; Zheng, W.; Guo, J.; Zhu, L. Combined heat and power plants integrated with steam turbine renovations: Optimal dispatch for maximizing the consumption of renewable energy. Energy Convers. Manag. 2022, 258, 115561. [Google Scholar] [CrossRef]
- Wang, C.; Song, J. Optimal dispatch of the cascade heating CHP plants integrating with the high back-pressure technology. Case Stud. Therm. Eng. 2022, 38, 102330. [Google Scholar] [CrossRef]
- Zhao, S.; Wang, W.; Ge, Z. Thermodynamic, operational, and techno-economic analysis of the cascade heating system with a double-unit. Energy Convers. Manag. 2020, 226, 113558. [Google Scholar] [CrossRef]
- Xin, Y.; Zhao, T.; Chen, X.; He, K.; Ma, H.; Chen, Q. Heat current method-based real-time coordination of power and heat generation of multi-CHP units with flexibility retrofits. Energy 2022, 252, 124018. [Google Scholar] [CrossRef]
Disclaimer/Publisher’s Note: The statements, opinions and data contained in all publications are solely those of the individual author(s) and contributor(s) and not of MDPI and/or the editor(s). MDPI and/or the editor(s) disclaim responsibility for any injury to people or property resulting from any ideas, methods, instructions or products referred to in the content. |
© 2025 by the authors. Licensee MDPI, Basel, Switzerland. This article is an open access article distributed under the terms and conditions of the Creative Commons Attribution (CC BY) license (https://creativecommons.org/licenses/by/4.0/).

