Article

Marangoni Convection of Self-Rewetting Fluid Layers with a Deformable Interface in a Square Enclosure and Driven by Imposed Nonuniform Heat Energy Fluxes

by
Bashir Elbousefi
,
William Schupbach
and
Kannan N. Premnath
*
Department of Mechanical Engineering, University of Colorado Denver, 1200 Larimer Street, Denver, CO 80204, USA
*
Author to whom correspondence should be addressed.
Energies 2025, 18(13), 3563; https://doi.org/10.3390/en18133563
Submission received: 26 April 2025 / Revised: 29 June 2025 / Accepted: 30 June 2025 / Published: 6 July 2025
(This article belongs to the Section J1: Heat and Mass Transfer)

Abstract

Fluids that exhibit self-rewetting properties, such as aqueous long-chain alcohol solutions, display a unique quadratic relationship between surface tension and temperature and are marked by a positive gradient. This characteristic leads to distinctive patterns of thermocapillary convection and associated interfacial dynamics, setting self-rewetting fluids apart from normal fluids (NFs). The potential to improve heat transfer using self-rewetting fluids (SRFs) is garnering interest for use in various technologies, including low-gravity conditions and microfluidic systems. Our research aims to shed light on the contrasting behaviors of SRFs in comparison to NFs regarding interfacial transport phenomena. This study focuses on the thermocapillary convection in SRF layers with a deformable interface enclosed inside a closed container modeled as a square cavity, which is subject to nonuniform heating, represented using a Gaussian profile for the heat flux variation on one of its sides, in the absence of gravity. To achieve this, we have enhanced a central-moment-based lattice Boltzmann method (LBM) utilizing three distribution functions for tracking interfaces, computing two-fluid motions with temperature-dependent surface tension and energy transport, respectively. Through numerical simulations, the impacts of several characteristic parameters, including the viscosity and thermal conductivity ratios, as well as the surface tension–temperature sensitivity parameters, on the distribution and magnitude of the thermocapillary-driven motion are examined. In contrast to that in NFs, the counter-rotating pair of vortices generated in the SRF layers, due to the surface tension gradient at the interface, is found to be directed toward the SRF layers’ hotter zones. Significant interfacial deformations are observed, especially when there are contrasts in the viscosities of the SRF layers. The thermocapillary convection is found to be enhanced if the bottom SRF layer has a higher thermal conductivity or viscosity than that of the top layer or when distributed, rather than localized, heating is applied. Furthermore, the higher the magnitude of the effect of the dimensionless quadratic surface tension sensitivity coefficient on the temperature, or of the effect of the imposed heat flux, the greater the peak interfacial velocity current generated due to the Marangoni stresses. In addition, an examination of the Nusselt number profiles reveals significant redistribution of the heat transfer rates in the SRF layers due to concomitant nonlinear thermocapillary effects.

1. Introduction

Marangoni convection, also known as thermocapillary convection, arises due to surface tension gradients caused by variations in temperature or concentration at fluid interfaces [1], leading to convective motions that significantly impact mass and heat transfers. This phenomenon plays crucial roles in various single- and multiphase flow systems and has been the subject of extensive experimental and computational studies in recent years. It is particularly relevant in numerous industrial and scientific applications, including high-quality crystal growth, heat pipe technologies, and two-phase flow systems (see, e.g., [2,3,4,5]). Since the pioneering study by Young et al. [6], which demonstrated bubble migration toward warmer regions in microgravity due to Marangoni stresses, thermocapillary effects have been actively explored for controlling dispersed phases, such as bubbles and droplets. In microelectromechanical systems (MEMS), where interfacial forces become dominant at small scales, thermocapillary convection has been leveraged for manipulating fluid streams and enhancing thermal transport in microchannels. Such mechanisms have broad implications for multiphase transport phenomena, including surfactant-driven flows and microfluidic applications. Given its diverse practical significance, Marangoni convection remains a focal point of ongoing research in fluid mechanics and thermal sciences.
The study of significant thermocapillary convection has been advanced through various computational methods that model the complex interplay of surface tension gradients and fluid flows. Traditional approaches often involve solving the Navier–Stokes equations coupled with energy conservation equations to capture the fluid dynamics and heat transfer characteristics. Finite difference methods (FDMs) and finite element methods (FEMs) are commonly employed for discretizing these equations, providing insights into the behaviors of fluids under thermocapillary forces (see, e.g., [7,8,9]). Additionally, in recent years, the lattice Boltzmann method (LBM) has gained prominence as an alternative computational approach for simulating Marangoni convection. The LBM offers advantages in handling complex boundary conditions and multiphase flows due to its mesoscopic nature and inherent parallelism. This method has been effectively applied to model thermocapillary flows, capturing the intricate dynamics of surface-tension-driven convection (see, e.g., [10,11,12,13,14,15,16,17]). These computational methods, among others, continue to enhance our understanding of Marangoni convection phenomena, enabling the detailed analysis of fluid behaviors in various engineering and industrial applications.
Marangoni convection in normal fluids, where surface tension decreases linearly with increasing temperature, has been extensively studied in cavities, focusing on its influence on heat and mass transfers. Wang et al. [18] analyzed buoyancy–thermocapillary interactions under different boundary conditions. Gupta et al. [19] examined Marangoni effects in crystal growth under microgravity. The interfacial motion and deformation due to Marangoni and capillary forces were investigated by Ciccotosto and Brooks [20]. In addition, the VOF method was used to simulate thermocapillary-driven flows by Ma and Bothe [21]. Also, Liu et al. [22] showed that Marangoni effects slightly enhance heat transfer. Zhou et al. [23] analyzed its instability with increasing nanoparticle volume. Chen et al. [24] found that graphene nanoplatelets alter heat transfer in microgravity. These studies highlight the crucial roles of Marangoni convection in fluid dynamics and engineering applications.
Moreover, the lattice Boltzmann method (LBM) has been effectively employed to study Marangoni convection in cavities containing normal fluids, where the surface tension decreases linearly with temperature. A lattice Boltzmann model to simulate two-phase fluid flow with a deformable interface under thermal effects was developed by Chang and Alexander [25] and demonstrated its applicability to complex fluid systems. A numerical investigation utilized the LBM to simulate fluid flow and heat transfer in a partially heated square cavity filled with water near its density maximum, providing insights into the interplay between buoyancy and thermocapillary forces [26]. Another study applied the LBM to examine buoyant Marangoni convection heat transfer in a differentially heated cavity filled with various nanofluids, highlighting the method’s capability in handling complex multiphase interactions [27]. The LBM has also been applied to simulate natural convection in open-ended enclosures by Mohamad et al. [28], demonstrating its versatility in modeling various convective phenomena. Additionally, Xie et al. [29] developed a hybrid LBM and finite difference model to study thermocapillary flow in a differentially heated annular cavity with a deformable interface. These studies highlight the LBM’s strength in capturing thermocapillary dynamics in cavity flows.
Certain fluids, including aqueous solutions of long-chain alcohols, like n-butanol, pentanol, and heptanol, as well as specific liquid–metal alloys and nematic liquid crystals, exhibit a distinctive characteristic, namely, that their surface tension displays a nonlinear parabolic dependence on temperature. This behavior, in contrast to the typical linear decrease in the surface tension with increasing temperature, as seen in most fluids, includes a range where the surface tension gradient is positive and includes the minimum surface tension. These fluids, often referred to as self-rewetting fluids (SRFs), exhibit remarkable thermocapillary effects, driving liquid inflow toward regions of higher temperature [30,31,32,33,34]. This phenomenon is particularly advantageous in preventing dry patches at hot spots, such as nucleation sites, during boiling. Over the last two decades, SRFs have garnered significant attention for their potential to enhance thermal management systems due to these unique thermophysical properties. Applications for SRFs span both terrestrial and microgravity environments, where they have demonstrated promise as working fluids for advanced heat transfer systems [34,35]. Research has shown that SRFs can significantly improve heat transfer performance in various systems, including heat pipes, flow boiling and evaporation in microchannels, pool boiling, and two-phase heat transfer devices enhanced with self-rewetting gold nanofluids [36,37,38,39,40,41,42]. Building on these advancements, our recent studies have explored specific configurations involving SRFs. We have developed analytical and numerical frameworks to investigate thermocapillary convection in superimposed fluid layers [14], simulated the dynamics of surfactant-laden bubble migration in SRFs [12], and examined the coalescence and pinch-off of self-rewetting drops on heated liquid layers, revealing unique thermocapillary behaviors and offering deeper insights into these complex fluid behaviors.
Research on Marangoni convection in self-rewetting fluids (SRFs) within cavity configurations is limited. Existing studies have primarily focused on SRFs’ unique surface tension characteristics and their applications in heat transfer enhancement. For instance, Abe et al. [43] reviewed heat transfer studies on SRFs, highlighting their potential in enhancing boiling heat transfer due to cooperative thermocapillary and solutocapillary effects. Additionally, Chaurasiya et al. [44] investigated magnetically controlled thermal and solutal Marangoni convection in an SRF flow over a disk, modeling the quadratic dependence of the surface tension on temperature and concentration. However, specific investigations of Marangoni convection in SRFs within cavity geometries are scarce. This gap in the literature underscores the need for further research in this area, motivating our current study to explore thermocapillary convection in SRFs within cavity configurations. Moreover, the cavity setup is crucial for studying heat transfer in enclosed systems with heated surfaces, which are common in practical applications, such as thermal management and phase-change systems. For two fluids coexisting, especially self-rewetting fluids, their interfacial behavior under thermocapillary forces remains largely unexplored. This study fills that gap by investigating the underlying physics, providing new insights into self-rewetting fluid dynamics in confined enclosures.
One primary objective of this study is to simulate and examine thermocapillary convection within self-rewetting fluid layers contained in a closed, square-shaped cavity. The cavity is exposed to nonuniform heating along one side, modeled using a Gaussian distribution for the heat flux variations, and the simulations are conducted under gravity-free conditions in order to isolate the role of the Marangoni stresses in driving the thermocapillary convection. We consider the two self-rewetting fluids to be having distinct thermophysical properties, such as viscosities and thermal conductivities, where the interface is regarded to be deformable.
In this regard, we will present a numerical simulation method utilizing a robust central-moment lattice Boltzmann (LB) approach. This method is based on a phase-field model derived from the conservative Allen–Cahn equation, which is an extension and enhancement of our prior work [12,14,45]. This approach involves the calculation of the development of three distinct distribution functions: one for the flow field, another for the temperature field, and the third for capturing interfaces through an order parameter and with an attendant surface tension equation of state for SRFs. As such, our previous studies [12,14] have simplified and improved the central-moment LB approach [45] for the simulation of SRFs involving bubble dynamics and microchannel applications. By contrast, the present paper involves an extension of this LB formulation to study a different internal flow configuration with SRFs with attendant thermal surface conditions, viz., thermocapillary flows in SRFs enclosed in a cavity subjected to thermal energy fluxes.
This paper is organized as follows: Section 2 presents the problem formulation for thermocapillary convection in a self-rewetting fluid (SRF) confined within a square cavity and subject to sidewall nonuniform heating. It outlines the governing equations for incompressible two-fluid motion, energy transport, and interfacial dynamics. Section 3 describes the numerical implementation of the lattice Boltzmann method (LBM), detailing the discretized equations and transformation procedures used to compute fluid flow, interfacial evolution, and temperature distribution. This section also addresses the use of nonorthogonal-moment basis vectors in their construction and interfacial force treatment. Section 4 introduces the numerical approach based on the central-moment LBM, incorporating three distribution functions: one for two-fluid motion with Marangoni effects, another for interfacial tracking via the conservative Allen–Cahn equation, and a third for solving the energy transport equation. In Section 5, the numerical method is validated for two benchmark problems—one related to natural convection in a cavity and the other related to surface-tension-driven flow in two superimposed self-rewetting fluid layers, thereby demonstrating the LBM’s capability in capturing such flows and heat transfer and in including temperature-dependent surface tension effects accurately. Section 6 then presents our new simulation results, analyzing the influences of key parameters, such as surface tension sensitivity coefficients, the viscosity ratio, and the thermal conductivity ratio on flow structures and heat transfer characteristics. A comparative analysis between normal fluids (NFs) and SRFs highlights distinct differences in interfacial behavior and convection patterns. Finally, Section 7 summarizes the main findings, emphasizing the implications of self-rewetting fluids in thermocapillary-driven convection within heated enclosures and their potential applications in heat transfer systems.

2. Problem Formulation, Governing Equations, and the Surface Tension Relation for SRFs

2.1. Problem Formulation

The problem we consider is the thermocapillary flow in a two-dimensional square cavity with a height of H and a length of L (where H = L ), as illustrated in Figure 1. Inside, there are two immiscible, incompressible self-rewetting liquid layers with a deformed interface, and this setup is in the absence of gravity. As depicted in Figure 1, the top and bottom rigid walls of the square cavity are insulated, while the right wall is maintained at a constant reference temperature ( T r e f ), which is equal to the cold temperature ( T C ). The left wall experiences nonuniform heating, which is represented using a Gaussian profile for the heat flux variation. Nonslip boundary conditions are applied to all the solid walls. In the upcoming discussion, we will use subscripts a and b to refer to quantities associated with fluids’ a and b values, respectively. Each liquid layer is characterized by its density ( ρ i ), thermal conductivity ( k i ), and dynamic viscosity ( μ i ), with the subscript i being a or b. Initially, the interface between these two layers is assumed to be flat.

2.2. Bulk Fluid Motions and Energy Transport: Governing Equations

The behavior of the thermocapillary convection in self-rewetting fluids (SRFs) is governed by a set of fundamental equations, including the mass and momentum conservation equations, commonly known as the Navier–Stokes equations (NSEs), along with the energy transport equation. These equations are expressed as follows:
· u = 0 ,
ρ u t + u · u = p + · μ ( u + u ) ,
T t + u · T = · α T .
In these equations, ρ represents the fluid density, μ denotes the dynamic viscosity, and α is the thermal diffusivity, defined as the ratio of the thermal conductivity (k) to the specific heat capacity ( c p ) given by α = k / ( ρ c p ) . The primary variables in this formulation include the velocity field ( u ), pressure (p), and temperature (T). Additionally, the superscript † denotes the transpose of the velocity gradient tensor ( u ), thus ensuring the proper representation of the viscous stress term.

2.3. Surface Tension’s Interfacial Equation of State for Self-Rewetting Fluids

At the fluid interface, it is crucial to define an equation that governs the surface tension as a function of local temperature variations. For self-rewetting fluids (SRFs), the relationship between the surface tension and temperature follows a nonlinear (parabolic) form, given by (see, e.g., [12,14])
σ ( T ) = σ 0 + σ T ( T T r e f ) + σ T T ( T T r e f ) 2 .
In this equation, σ 0 denotes the surface tension at the reference temperature ( T r e f ), σ T represents the first derivative of the surface tension with respect to the temperature at T r e f , defined as σ T = d σ d T | T r e f , and σ T T corresponds to half of the second derivative of the surface tension with respect to the temperature at T r e f , given by σ T T = 1 2 d 2 σ d T 2 | T r e f . These coefficients characterize the sensitivity of the surface tension to temperature changes. Notably, for self-rewetting fluids (SRFs), σ T T 0 , whereas for normal fluids (NFs), σ T T = 0 , and only σ T remains nonzero. The parameters σ 0 , T r e f , σ T , and σ T T are intrinsic material properties specific to each self-rewetting fluid. Furthermore, at the interface, it is essential to establish a balance between the Marangoni stress arising from variations in the tangential surface tension gradient and the viscous stress exerted by the surrounding fluid. Additionally, interfacial continuity conditions must be satisfied for both the velocity and temperature fields. These considerations will be further explored in the subsequent discussion.
To facilitate the analysis, the governing equations are nondimensionalized using a reference velocity scale, U, and a characteristic length scale, L o , which corresponds to the length of the square cavity, L, and with the characteristic time scale being T o = L o / U . This process introduces the following key dimensionless parameters: the Reynolds number ( Re ), the Marangoni number ( Ma ), and the capillary number ( Ca ). These parameters are defined as follows:
Re = U L o ν a , Ma = U L o α a = Re Pr , Ca = U μ a σ 0 ,
where ν = μ / ρ is the kinematic viscosity, and Pr denotes the Prandtl number, defined as Pr = ν / α . Additionally, the thermocapillary convection in self-rewetting fluids (SRFs) is influenced by the ratios of the bulk material properties, given by
ρ ˜ = ρ a ρ b , μ ˜ = μ a μ b , k ˜ = k a k b ,
where the subscript a corresponds to the lower liquid layer.

2.3.1. Dimensionless Surface Tension Sensitivity Coefficients

An essential aspect of the self-rewetting fluid (SRF) effect is studying the influence of the surface tension variations with temperature. These effects are characterized by the dimensionless parameters that describe the linear and quadratic sensitivities of the surface tension in the equation of state as follows:
M 1 = Δ T σ o σ T , M 2 = Δ T 2 σ o σ T T ,
where Δ T represents a reference temperature difference. As such, M 1 refers to the nondimensional sensitivity or the relative rate of the variation in the surface tension with respect to the temperature, while M 2 corresponds to the dimensionless curvature of the surface tension variation with respect to the temperature. As such, for NFs, only M 1 is relevant, while the behavior of SRFs is parameterized by M 2 . To give an example, for the n-butanol/water mixture, which is a typical SRF, a parabolic curve fit of the σ vs. T data yields σ 0 = 0.0246 N/m and σ T T = 2.46 × 10 3 N/(m K2). Then, taking a temperature excursion scale of Δ T = 3.16 K, the dimensionless characteristic parameter for this SRF is M 2 = 1.0 , which is the value used in this study. Similarly, one can estimate the other dimensionless parameters based on the operating flow and thermal conditions for a chosen fluid.

2.3.2. Nonuniform Heating Condition

As discussed earlier, the left-side cavity wall is subjected to a nonuniform heating condition (see Figure 1), where the surface heat flux, q ( y ) , follows a Gaussian profile, expressed as follows:
q ( y ) = q o exp y H / 2 2 2 L q 2 .
where q o represents the maximum heat flux at the center of the sidewall ( ( y = L / 2 ) ), and L q denotes the characteristic width of the heat flux distribution. The corresponding dimensionless heat flux (Q) is given by
Q = q o L k a Δ T ,
where L is the length of the computational domain, k a is the thermal conductivity of the liquid phase, and Δ T serves as the reference temperature difference.

3. Computational Modeling

This section outlines the numerical modeling framework developed for simulating thermocapillary convection in self-rewetting fluids (SRFs), using the lattice Boltzmann method (LBM). The model employs a phase-field approach based on the conservative Allen–Cahn equation (ACE) [46] to capture the dynamics of diffuse interfaces while preserving the separation of immiscible fluids. This enhances earlier models [47], which relied on counter-term methods [48]. The binary fluids are represented by an order parameter, ϕ , where fluid a corresponds to ϕ a and fluid b to ϕ b . The phase-field evolution follows the following equation:
ϕ t + · ( ϕ u ) = · [ M ϕ ( ϕ θ n ) ] ,
where u is the velocity field, M ϕ is the mobility parameter, and n = ϕ / | ϕ | is the interfacial normal. The sharpening term ( θ = 4 ϕ ϕ a ϕ ϕ b / [ W ϕ a ϕ b ] ) ensures an accurate interfacial representation, with its formulation dependent on the interfacial width (W). At equilibrium, the ACE solution results in a hyperbolic tangent profile for ϕ , ensuring smooth transitions across the interface.
To incorporate interfacial effects into a diffuse interfacial framework, a volumetric force term is used within a single-field formulation of the Navier–Stokes equations as follows:
· u = 0 ,
ρ u t + u · u = p + · μ ( u + u ) + F s + F e x t ,
where F s represents the surface-tension forces, and F e x t accounts for any external bodily force. Surface tension, which varies with temperature, influences both the normal and tangential stress components. The continuous surface force method [49] is used to distribute these forces smoothly across the interface as follows:
F s = σ κ n + s σ δ s ,
where κ = · n is the curvature, and δ s ensures the surface localization of the interfacial forces. The first term in Equation (11) represents the capillary forces, while the second captures the Marangoni stresses due to surface tension gradients. In this framework, σ ( T ) is modeled using a parabolic temperature dependence for SRFs, as given in Equation (2).
The surface gradient ( s ) in Equation (11) is defined as s = n ( n · ) , which removes the normal component of the gradient, retaining only the tangential contribution along the interface. Consequently, the Cartesian components of the surface-tension force in Equation (11) can be formulated as follows:
F s x = σ ( T ) | ϕ | 2 ( · n ) n x + | ϕ | 2 ( 1 n x 2 ) x σ ( T ) n x n y y σ ( T ) , F s y = σ ( T ) | ϕ | 2 ( · n ) n y + | ϕ | 2 ( 1 n y 2 ) y σ ( T ) n x n y x σ ( T ) .
In this study, the temperature dependence of surface tension for self-rewetting fluids (SRFs) follows a nonlinear parabolic relation, as described in Equation (2). For numerical implementation, the spatial gradients ( x σ ( T ) ) in Equation (12) are computed using an isotropic finite difference scheme [50]. Additionally, the temperature field (T) is determined by solving the energy transport equation, as outlined in Equation (1c).
Fluid properties, such as the density and viscosity, are smoothly interpolated across the interface as follows:
ρ = ρ b + ϕ ϕ b ϕ a ϕ b ρ a ρ b , μ = μ b + ϕ ϕ b ϕ a ϕ b μ a μ b .
where ρ a , ρ b , μ a , and μ b denote the densities and dynamic viscosities of the two phases, respectively. A similar interpolation is applied for thermal conductivity in the energy equation. For this study, the order parameter values are set as ϕ a = 0 and ϕ b = 1 , ensuring a well-defined interface.

4. Central-Moment LBM for Interfacial Capturing, Two-Fluid Flow, and Energy Transport

This section presents a numerical approach utilizing the central-moment-based lattice Boltzmann method (LBM) to model interfacial dynamics, binary fluid motion, and energy transport. The framework employs more advanced collision models, based on central moments [45,51,52], to solve the phase-field model for interfacial tracking (Equation (8)), binary fluid dynamics (Equations (9)–(12)), and energy transport (Equation (1c)). The numerical scheme evolves three distinct distribution functions using a standard two-dimensional, square lattice (D2Q9). The approach consists of a collision step, where central moments relax to their equilibrium states, followed by a streaming step, in which distribution functions propagate along characteristic directions to adjacent nodes. The macroscopic variables, including the order parameter, velocity, pressure, and temperature fields, are extracted through moment calculations of the respective distribution functions. Since the collision process operates in the central-moment space, whereas the streaming step is carried out using distribution functions, appropriate transformations are required to map between these representations before and after collisions. The central-moment-based LBM has demonstrated greater numerical stability compared to those of other collision models within the LBM framework [45,53]. While previous work on two-fluid interfacial flows [45] has employed an orthogonal-moment basis, the present study introduces an improved formulation utilizing a nonorthogonal-moment basis for enhanced accuracy and efficiency.

4.1. LBM for Interfacial Capturing

This section details a central-moment LB approach for solving the conservative Allen–Cahn equation (ACE) (Equation (8)) to track the evolution of interfaces in binary-fluid systems. The method operates on a D2Q9 lattice, where each discrete particle direction ( α = 0 , 1 , 2 , , 8 ) is associated with a distribution function ( f α ). During the collision step, the distribution functions ( f = ( f 0 , f 1 , f 2 , , f 8 ) ) relax toward their equilibrium counterparts, f e q = ( f 0 e q , f 1 e q , f 2 e q , , f 8 e q ) , following a transformation to the central-moment space.
To facilitate this, the velocity components of the lattice are defined using standard Dirac’s bra–ket notation as follows:
e x = ( 0 , 1 , 0 , 1 , 0 , 1 , 1 , 1 , 0 ) , e y = ( 0 , 0 , 1 , 0 , 1 , 1 , 1 , 1 , 1 ) .
Additionally, the zeroth moment of f α is defined using
1 = ( 1 , 1 , 1 , 1 , 1 , 1 , 1 , 1 , 1 ) .
The inner product of this vector with the set of distribution functions ( f | 1 ) yields the order parameter ( ϕ ) of the phase-field model. The central-moment LB formulation utilizes a set of nine nonorthogonal basis vectors as follows:
P 0 = 1 , P 1 = e x , P 2 = e y , P 3 = e x 2 , P 4 = e y 2 , P 5 = e x e y , P 6 = e x 2 e y , P 7 = e x e y 2 , P 8 = e x 2 e y 2 .
Symbols such as e x 2 e y = e x e x e y represent vectors obtained through the element-wise multiplication of the individual vectors ( e x , e x and e y ). These vectors can be organized into a matrix that establishes a relationship between the distribution functions and the raw moments, expressed using the moment basis vectors defined above.
P = P 0 , P 1 , P 2 , P 3 , P 4 , P 5 , P 6 , P 7 , P 8 .
It is important to highlight that the central moments are derived by adjusting the particle velocity ( e α ) relative to the fluid velocity ( u ). Using this idea, we can formally define both the raw moments of the distribution function ( f α ) and its corresponding equilibrium state ( f α e q ) as follows:
κ m n κ m n e q = α = 0 8 f α f α e q e α x m e α y n ,
and the corresponding central moments as follows:
κ m n κ m n e q = α = 0 8 f α f α e q ( e α x u x ) m ( e α y u y ) n .
In this context, κ m n denotes the raw moment of order ( m + n ) , whereas the associated central moment is represented by κ m n . To simplify their representations, all the possible raw and central moments for the D2Q9 lattice can be conveniently organized into the following two vectors:
κ = ( κ 00 , κ 10 , κ 01 , κ 20 , κ 02 , κ 11 , κ 21 , κ 12 , κ 22 ) ,
κ = ( κ 00 , κ 10 , κ 01 , κ 20 , κ 02 , κ 11 , κ 21 , κ 12 , κ 22 ) .
It is important to note that the distribution functions can be directly converted to raw moments using the relation κ = P f . These raw moments can then be further transformed to central moments through κ = F κ , where the transformation matrix ( F ) is derived from the binomial expansion of ( e α x u x ) m ( e α y u y ) n in terms of e α x m e α y n and similar terms. Likewise, the process can be reversed: Central moments can be mapped back to raw moments, and from there, the original distribution functions can be reconstructed using the inverse matrices F 1 and P 1 . For a listing of P , P 1 , F , and F 1 values, see, e.g., [14,53].
As discussed earlier, a crucial part of this approach is ensuring that the collision step is designed so that the central moments relax toward their respective equilibrium values. The discrete central-moment equilibria, κ m n e q , are determined by aligning them with the corresponding central moments of the continuous Maxwell distribution function, with a substitution of the density ( ρ ) with the order parameter ( ϕ ). Additionally, to properly account for the interface-sharpening flux terms in the conservative ACE equation (Equation (8)), the first-order central-moment equilibrium components must be adjusted by incorporating M ϕ θ n x and M ϕ θ n y , as outlined in [45]. Consequently, we obtain the following formulation:
κ 00 e q = ϕ , κ 10 e q = M ϕ θ n x , κ 01 e q = M ϕ θ n y , κ 20 e q = c s ϕ 2 ϕ , κ 02 e q = c s ϕ 2 ϕ , κ 11 e q = 0 , κ 21 e q = 0 , κ 12 e q = 0 , κ 22 e q = c s ϕ 4 ϕ ,
where c s ϕ 2 = 1 / 3 .
Taking into account the considerations mentioned above and drawing inspiration from the algorithmic framework outlined in [54] (as well as the approaches detailed in [53]), we can now outline the central-moment LB method used to solve the conservative ACE equation. The procedure, which advances the system by a time step ( Δ t ) from an initial distribution function ( f α = f α ( x , t ) ), is summarized as follows:
  • Calculate the Pre-Collision Raw Moments: Obtain the raw moments from the distribution functions using the transformation κ = P f ;
  • Compute the Pre-Collision Central Moments: Convert the raw moments to central moments using the relation κ = F κ ;
  • Apply the Collision Step: Relax the central moments ( κ m n ) toward their equilibrium values ( κ m n e q ) using the following relation:
    κ ˜ m n = κ m n + ω m n ϕ ( κ m n e q κ m n ) ,
    where the indices ( m n ) correspond to ( 00 ) , ( 10 ) , ( 01 ) , ( 20 ) , ( 02 ) , ( 11 ) , ( 21 ) , ( 12 ) , and ( 22 ) , and ω m n ϕ represents the relaxation parameter for a given moment order ( m + n ). The relaxation parameters for first-order moments follow ω 10 ϕ = ω 01 ϕ = ω ϕ , which relates to the mobility coefficient ( M ϕ ) in Equation (8) as M ϕ = c s ϕ 2 1 ω ϕ 1 2 Δ t . Meanwhile, for moments of order ( m + n ) 2 , the relaxation parameters are typically set at 1.0, i.e., ω m n ϕ = 1.0 . The updated central moments are collected in κ ˜ as follows:
  • Convert the post-collision central moments back to raw moments using the inverse transformation ( κ ˜ = F 1 κ ˜ );
  • Obtain the post-collision distribution functions by transforming the following post-collision raw moments using the following inverse mapping: f ˜ = P 1 κ ˜ ;
  • Perform the streaming step by updating the distribution functions according to the following rule: f α ( x , t + Δ t ) = f ˜ α ( x e α Δ t ) , where α = 0 , 1 , 2 , . . . , 8 , ensuring the distribution is advected to neighboring lattice nodes;
  • Update the order parameter ( ϕ ) in the phase-field model to capture the interfacial dynamics using the following expression:
    ϕ = α = 0 8 f α .

4.2. LBM for Two-Fluid Motion

In this section, we introduce a central-moment LB scheme designed to model the motion of binary fluids, incorporating interfacial forces, as described in Equations (9)–(12). This is achieved by evolving an additional distribution function, g α , where α = 0 , 1 , 2 , , 8 . Our methodology is founded on discretizing the modified continuous Boltzmann equation, allowing us to derive the discrete central-moment equilibria and the central moments of source terms associated with bodily forces. These quantities are obtained through a matching principle that ensures consistency with their continuous counterparts, following the approach outlined in Ref. [45]. Unlike the framework presented in Ref. [45], which employs an orthogonal-moment basis and leads to the cascaded LB method, our approach herein adopts a more straightforward formulation. Specifically, we use a nonorthogonal-moment basis, as previously defined in Equation (14), to maintain computational simplicity while effectively capturing interfacial dynamics.
Following the approach outlined in the previous section, we begin by defining the raw and central moments of the distribution function ( g α ), its equilibrium counterpart ( g α e q ), and the source term ( S α ). The source term ( S α ) incorporates the effects of the surface tension and bodily forces, along with additional contributions that emerge from transformations used to simulate flows with high density-ratios at the incompressible limit (see [45,55]).
η m n η m n e q σ m n = α = 0 8 g α g α e q S α e α x m e α y n ,
and
η m n η m n e q σ m n = α = 0 8 g α g α e q S α ( e α x u x ) m ( e α y u y ) n .
For convenience, the elements of the distribution function, its equilibrium state, and the source term in the D2Q9 lattice can be organized into the following vector representations:
g = ( g 0 , g 1 , g 2 , , g 8 ) , g e q = ( g 0 e q , g 1 e q , g 2 e q , , g 8 e q ) , and S = ( S 0 , S 1 , S 2 , , S 8 ) .
Additionally, all the possible raw and central moments defined for the D2Q9 lattice can be systematically arranged as follows:
η = ( η 00 , η 10 , η 01 , η 20 , η 02 , η 11 , η 21 , η 12 , η 22 ) ,
and similarly for the raw moments and the central moments, the equilibrium, and the source term.
The collision step is designed so that the central moments relax toward their corresponding equilibrium values. These equilibria are further modified to account for the influence of the net forces on the system. The total force contribution consists of the surface-tension force, F s = ( F s x , F s y ) , which includes the effects from both capillary and Marangoni forces, as expressed in Equation (12), and any externally applied force, F e x t = ( F e x t , x , F e x t , y ) . Together, these forces define the net force acting on the system as follows: F t = F s + F e x t or in component form, ( F t x , F t y ) = ( F s x + F e x t , x , F s y + F e x t , y ) .
Additionally, employing an incompressible transformation to accommodate fluids with high density-ratios [55] leads to a pressure-based formulation, where the net-pressure force, F p , arises from the pressure deviation function, φ ( ρ ) = p ρ c s 2 . This force is defined as F p = φ or in component form, ( F p x , F p y ) = ( x φ , y φ ) . For further details, see Ref. [45]. By applying these force contributions, the discrete central-moment equilibria, η m n , are determined by ensuring consistency with their continuous counterparts derived from the equilibrium distribution under the incompressible transformation. A similar approach is used to determine the central moments of the source term, σ m n . This leads to the following expressions for the D2Q9 lattice, detailed in Ref. [45] as follows:
η 00 e q = p , η 10 e q = φ ( ρ ) u x , η 01 e q = φ ( ρ ) u y , η 20 e q = p c s 2 + φ ( ρ ) u x 2 , η 02 e q = p c s 2 + φ ( ρ ) u y 2 , η 11 e q = φ ( ρ ) u x u y , η 21 e q = φ ( ρ ) ( u x 2 + c s 2 ) u y , η 12 e q = φ ( ρ ) ( u y 2 + c s 2 ) u x , η 22 e q = c s 6 ρ + φ ( ρ ) ( u x 2 + c s 2 ) ( u y 2 + c s 2 ) .
and
σ 00 = Γ 00 p , σ 10 = c s 2 F t x u x Γ 00 p , σ 01 = c s 2 F t y u y Γ 00 p , σ 20 = 2 c s 2 F p x u x + ( u x 2 + c s 2 ) Γ 00 p , σ 02 = 2 c s 2 F p y u y + ( u y 2 + c s 2 ) Γ 00 p , σ 11 = c s 2 ( F p x u y + F p y u x ) + u x u y Γ 00 p , σ 21 = 0 , σ 12 = 0 , σ 22 = 0 ,
where Γ 00 p = ( F p x u x + F p y u y ) .
Building on the formulations presented above, we now outline the central-moment LB algorithm for simulating two-fluid dynamics with interfacial forces. The following steps describe the computational procedure for advancing the system by a time step ( Δ t ) starting from the initial distribution function ( g α = g α ( x , t ) ) as follows:
  • Compute the Pre-Collision Raw Moments: Obtain the raw moments from the distribution functions using the transformation η = P g ;
  • Compute the Pre-Collision Central Moments: Transform the raw moments to central moments using η = F η ;
  • Perform the Collision Step: Apply the relaxation process, ensuring that the central moments ( η m n ) approach their equilibrium values ( η m n e q ) while incorporating the following effects of the source terms ( σ m n ): To enable the independent specifications of the shear viscosity ( ν ) and bulk viscosity ( ζ ), the trace of the second-order moments, given by η 20 + η 02 , must be treated separately from the remaining second-order moments. To achieve this, the diagonal components of the second-order moments are combined before the collision step as follows (see, for instance, [53,54]):
    η 2 s = η 20 + η 02 , η 2 s e g = η 20 s e g + η 02 e g , σ 2 s = σ 20 s + σ 02 , η 2 d = η 20 η 02 , η 2 d e g = η 20 s e g η 02 e g , σ 2 d = σ 20 s σ 02 ,
    As a result, η 2 s and η 2 d will evolve independently during the collision process. Following this, the post-collision central moments, incorporating both relaxation effects and force contributions, can be determined using the following expression:
    η ˜ m n = η m n + ω m n η m n e q η m n + 1 ω m n / 2 σ m n Δ t ,
    The parameter ω m n represents the relaxation time associated with the central moment ( η m n ), where ( m n ) = ( 00 ) , ( 10 ) , ( 01 ) , ( 2 s ) , ( 2 d ) , ( 11 ) , ( 21 ) , ( 12 ) , and   ( 22 ) . The relaxation parameter ( ω 2 s ) is linked to the bulk viscosity through the relation ζ = c s 2 1 / ω 2 s 1 / 2 Δ t . Similarly, the relaxation parameters ( ω 2 d and ω 11 ) are associated with the shear viscosity, given by ν = c s 2 1 / ω i j 1 / 2 Δ t , where ( i j ) = ( 2 d ) , ( 11 ) . Typically, the speed of sound squared is set at c s 2 = 1 / 3 . According to Equation (13), if the bulk fluid properties vary, the relaxation parameters ( ω 2 d and ω 11 ) will also change locally across the interface. The remaining central-moment relaxation parameters are generally set at unity, i.e., ω i j = 1.0 , where ( i j ) = ( 00 ) , ( 10 ) , ( 01 ) , ( 2 s ) , ( 21 ) , ( 12 ) , and   ( 22 ) .
    Furthermore, the combined post-collision central moments ( η ˜ 2 s and η ˜ 2 d ) are decomposed to their respective components, η ˜ 20 and η ˜ 02 , as follows:
    η ˜ 20 = 1 2 η ˜ 2 s + η ˜ 2 d , η ˜ 02 = 1 2 η ˜ 2 s η ˜ 2 d .
    Finally, incorporating the segregation described above, the results obtained from Equation (24) are systematically organized into the vector η ˜ , representing the post-collision central moments as follows:
  • Convert the Post-Collision Central Moments to Raw Moments: Transform the post-collision central moments back to raw moments using the inverse moment transformation ( η ˜ = F 1 η ˜ );
  • Reconstruct the Post-Collision Distribution Functions: Retrieve the post-collision distribution functions from the corresponding raw moments using the inverse mapping ( g ˜ = P 1 η ˜ );
  • Perform the Streaming Step: Update the distribution functions by propagating them to neighboring lattice nodes according to g α ( x , t + Δ t ) = g ˜ α ( x e α Δ t ) , where α = 0 , 1 , 2 , . . . , 8 ;
  • Update the Pressure Field and Fluid Velocity Components: Compute the pressure field (p) and the velocity components ( u = ( u x , u y ) ) using the following expressions:
    p = α g α + 1 2 F p · u Δ t , ρ c s 2 u = α g α e α + 1 2 c s 2 F t Δ t .

4.3. LBM for the Energy Equation

In this section, we present a central-moment LB approach for solving the energy transport equation (Equation (1c)). This is achieved by evolving a third distribution function, h α , where α = 0 , 1 , 2 , , 8 , on the D2Q9 lattice. Since Equation (1c) represents an advection–diffusion equation, the formulation of the LB scheme follows a methodology similar to that used for the conservative ACE equation discussed earlier. However, unlike the ACE equation, the energy equation does not involve terms such as the interface-sharpening flux. As with previous formulations, we begin by defining the raw and central moments associated with the distribution function ( h α ) and its equilibrium state ( h α e q ). These moments provide the foundation for the subsequent numerical computations in the LB framework.
χ m n χ m n e q = α = 0 8 h α h α e q e α x m e α y n ,
and
χ m n χ m n e q = α = 0 8 h α h α e q ( e α x u x ) m ( e α y u y ) n .
For clarity and convenience, we express the components of the distribution function and its equilibrium state in vector form as follows:
h = ( h 0 , h 1 , h 2 , , h 8 ) and h e q = ( h 0 e q , h 1 e q , h 2 e q , , h 8 e q ) .
Similarly, the raw moments and central moments are represented using the same structured notation as follows:
χ = ( χ 00 , χ 10 , χ 01 , χ 20 , χ 02 , χ 11 , χ 21 , χ 12 , χ 22 ) ,
χ = ( χ 00 , χ 10 , χ 01 , χ 20 , χ 02 , χ 11 , χ 21 , χ 12 , χ 22 ) .
To develop a central-moment-based collision model for solving the energy equation, following an approach similar to that in Section 4.1, we derive the discrete equilibrium central moments by aligning them with their continuous counterparts obtained from the Maxwellian distribution, with the fluid density ( ρ ) being replaced with the temperature (T), leading to the following expressions:
χ 00 e q = T , χ 10 e q = 0 , χ 01 e q = 0 , χ 20 e q = c s T 2 T , χ 02 e q = c s T 2 T , χ 11 e q = 0 , χ 21 = 0 , χ 12 e q = 0 , χ 22 e q = c s T 4 T ,
where the thermal lattice’s speed of sound is typically set at c s T 2 = 1 / 3 . With this, the computational procedure for solving the energy equation over a time step ( Δ t ), beginning with the initial distribution function ( h α = h α ( x , t ) ), can be outlined as follows:
  • Compute the Pre-Collision Raw Moments: Obtain the raw moments from the distribution functions using the following transformation: χ = P h ;
  • Compute the Pre-Collision Central Moments: Convert the raw moments to central moments using χ = F χ ;
  • Perform the Collision Step: Relax the central moments ( χ m n ) toward their equilibrium values ( χ m n e q ) using the following relation:
    χ ˜ m n = χ m n + ω m n T ( χ m n e q χ m n ) ,
    where ( m n ) = ( 00 ) , ( 10 ) , ( 01 ) , ( 20 ) , ( 02 ) , ( 11 ) , ( 21 ) , ( 12 ) , and ( 22 ) , and ω m n T represents the relaxation parameter corresponding to each central moment of order ( m + n ). The relaxation parameters for the first-order moments, ω 10 T = ω 01 T = ω T , are related to the thermal diffusivity, α = k / ( ρ c p ) , through the following expression: α = c s T 2 1 / ω T 1 / 2 Δ t . For higher-order central moments, the relaxation parameters are typically set at unity. The updated post-collision central moments obtained from Equation (29) are then assembled into the vector χ ˜ .
  • Convert the Post-Collision Central Moments to Raw Moments: Transform the post-collision central moments back to raw moments using the following inverse moment transformation: χ ˜ = F 1 χ ˜ ;
  • Reconstruct the Post-Collision Distribution Functions: Retrieve the post-collision distribution functions from the corresponding raw moments using the following inverse mapping: h ˜ = P 1 χ ˜ ;
  • Execute the Streaming Step: Update the distribution functions by propagating them to neighboring lattice nodes according to h α ( x , t + Δ t ) = h ˜ α ( x e α Δ t ) , where α = 0 , 1 , 2 , . . . , 8 , ensuring the proper advection of the thermal information across the computational domain;
  • Update the Temperature Field: The temperature field (T) is computed as follows:
    T = α = 0 8 h α .
The central-moment LB schemes presented herein provide a generalized and robust framework for modeling surface-tension-driven flows influenced by thermocapillary effects. In this study, these methods are specifically applied to investigate the influences of key characteristic parameters on flow patterns and the intensity of the thermocapillary convection in the SRF layers enclosed within a square cavity under nonuniform heating from one of its sides. For convenience, a summary of the various model parameters and constants used in the various LB solvers discussed in this section is consolidated in Table 1.
While the LBM outlined in this work can work under a broad range of multiphase flow conditions, including density ratios on the order of 1000 and relatively low viscosities, it does have some limitations. These include its applicability to situations with extremely high density-ratios, beyond the value mentioned above, as well as to simulate flows with very high Reynolds numbers. While these aspects do not influence the current study, they may be pertinent in some applications.

5. Validation of the Numerical Method

Before presenting our simulation results involving SRF layers with a deformable interface, let us first validate the LB schemes discussed in the previous section for two related benchmark problems: (1) the natural convection in a square cavity by comparison against other numerical solutions and (2) surface-tension-driven flow (i.e., thermocapillary convection) in two superimposed self-rewetting fluid (SRF) layers by comparison against a recently developed analytical solution [14].

5.1. Natural Convection in a Square Cavity

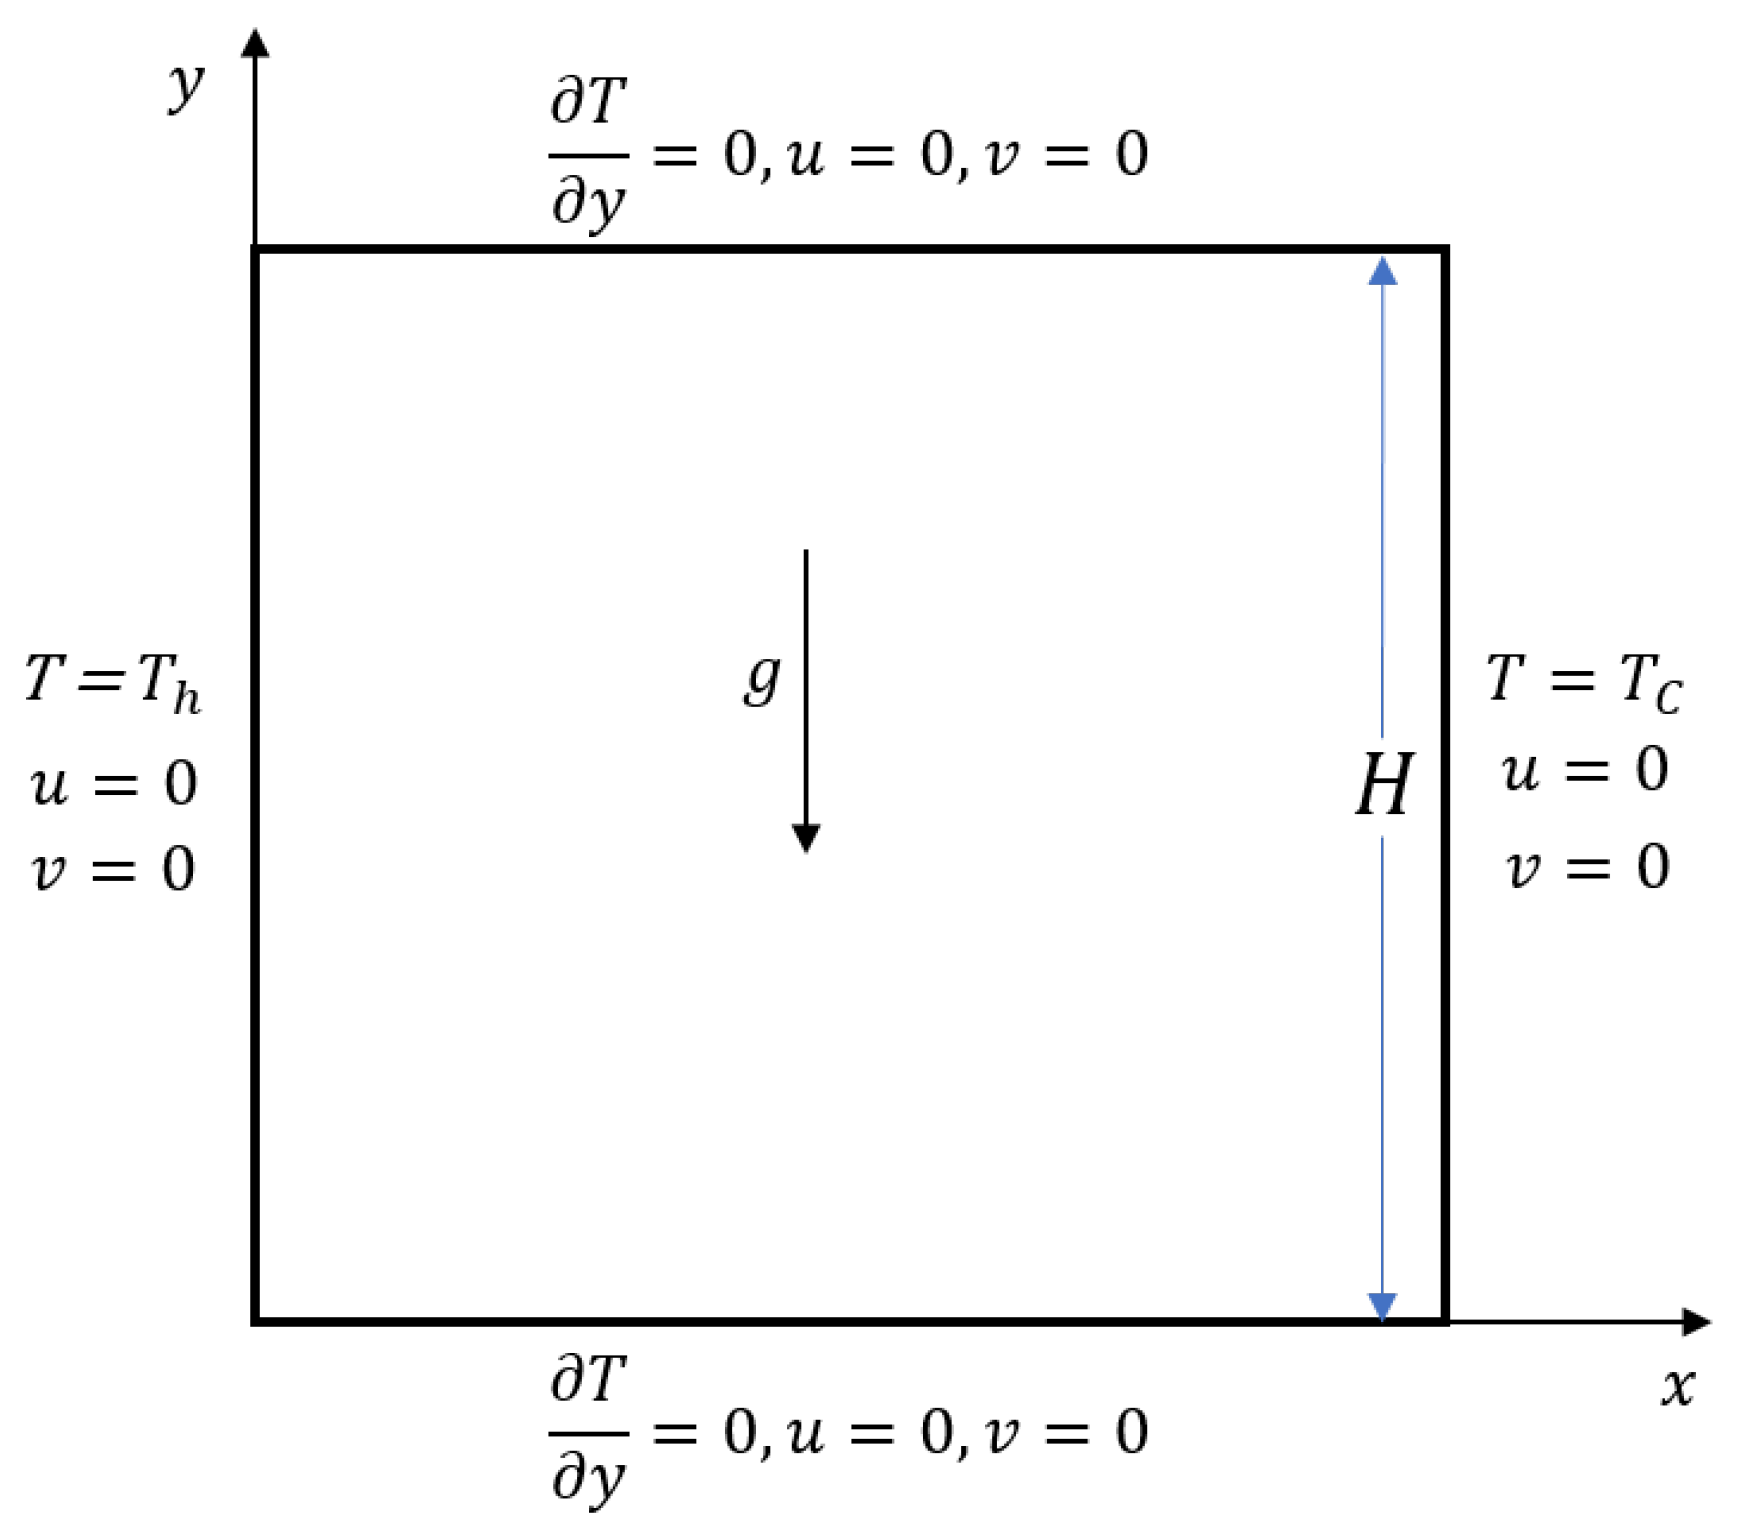
In this problem, we will test the present LBM for the simulation of the natural convection flow in a two-dimensional square cavity, which width and height are L and H  ( H = L ) , respectively. The horizontal walls (top and bottom) are insulated, i.e., T / y = 0 , while the vertical walls (left and right) of the cavity are maintained at uniform temperatures T h and T c , respectively, where T h > T c . All the walls are subject to a no-slip boundary condition, as depicted in Figure 2. Naturally occurring convective fluid motion results from the bodily force ( F = ( F x , F y ) ), which is caused by a local temperature difference relative to a reference temperature in the presence of gravity. The buoyancy (bodily) force is assumed to depend linearly on the temperature in the Boussinesq approximation and is given by
F = g β ( T T r e f )
where g is the vector of gravitational acceleration acting in the positive y-direction, β is the thermal expansion coefficient, T = T ( x , y , t ) is the local temperature field, and T r e f = ( T h T c ) / 2 is the reference temperature.
To compare our results to other benchmarks, two dimensionless numbers that govern this problem are needed, the Prandtl number ( Pr ) and Rayleigh number ( Ra ), which are defined as follows:
Pr = ν / α , Ra = g β T H 3 / ( ν α )
where H is the characteristic length, T = T h T c is the temperature difference (e.g., between the hot and cold walls), and α and ν are the thermal diffusivity and kinematic viscosity of the fluid, respectively. To determine every parameter required for performing the LBM simulation, we want an additional dimensionless number, specifically, the Mach number ( Ma ), which is given by Ma = U / c s , where c s = 1 / 3 is the speed of sound. Herein, for natural convection flows, the characteristic velocity (U) is defined as follows:
U = g β T H = Ra Pr ν H
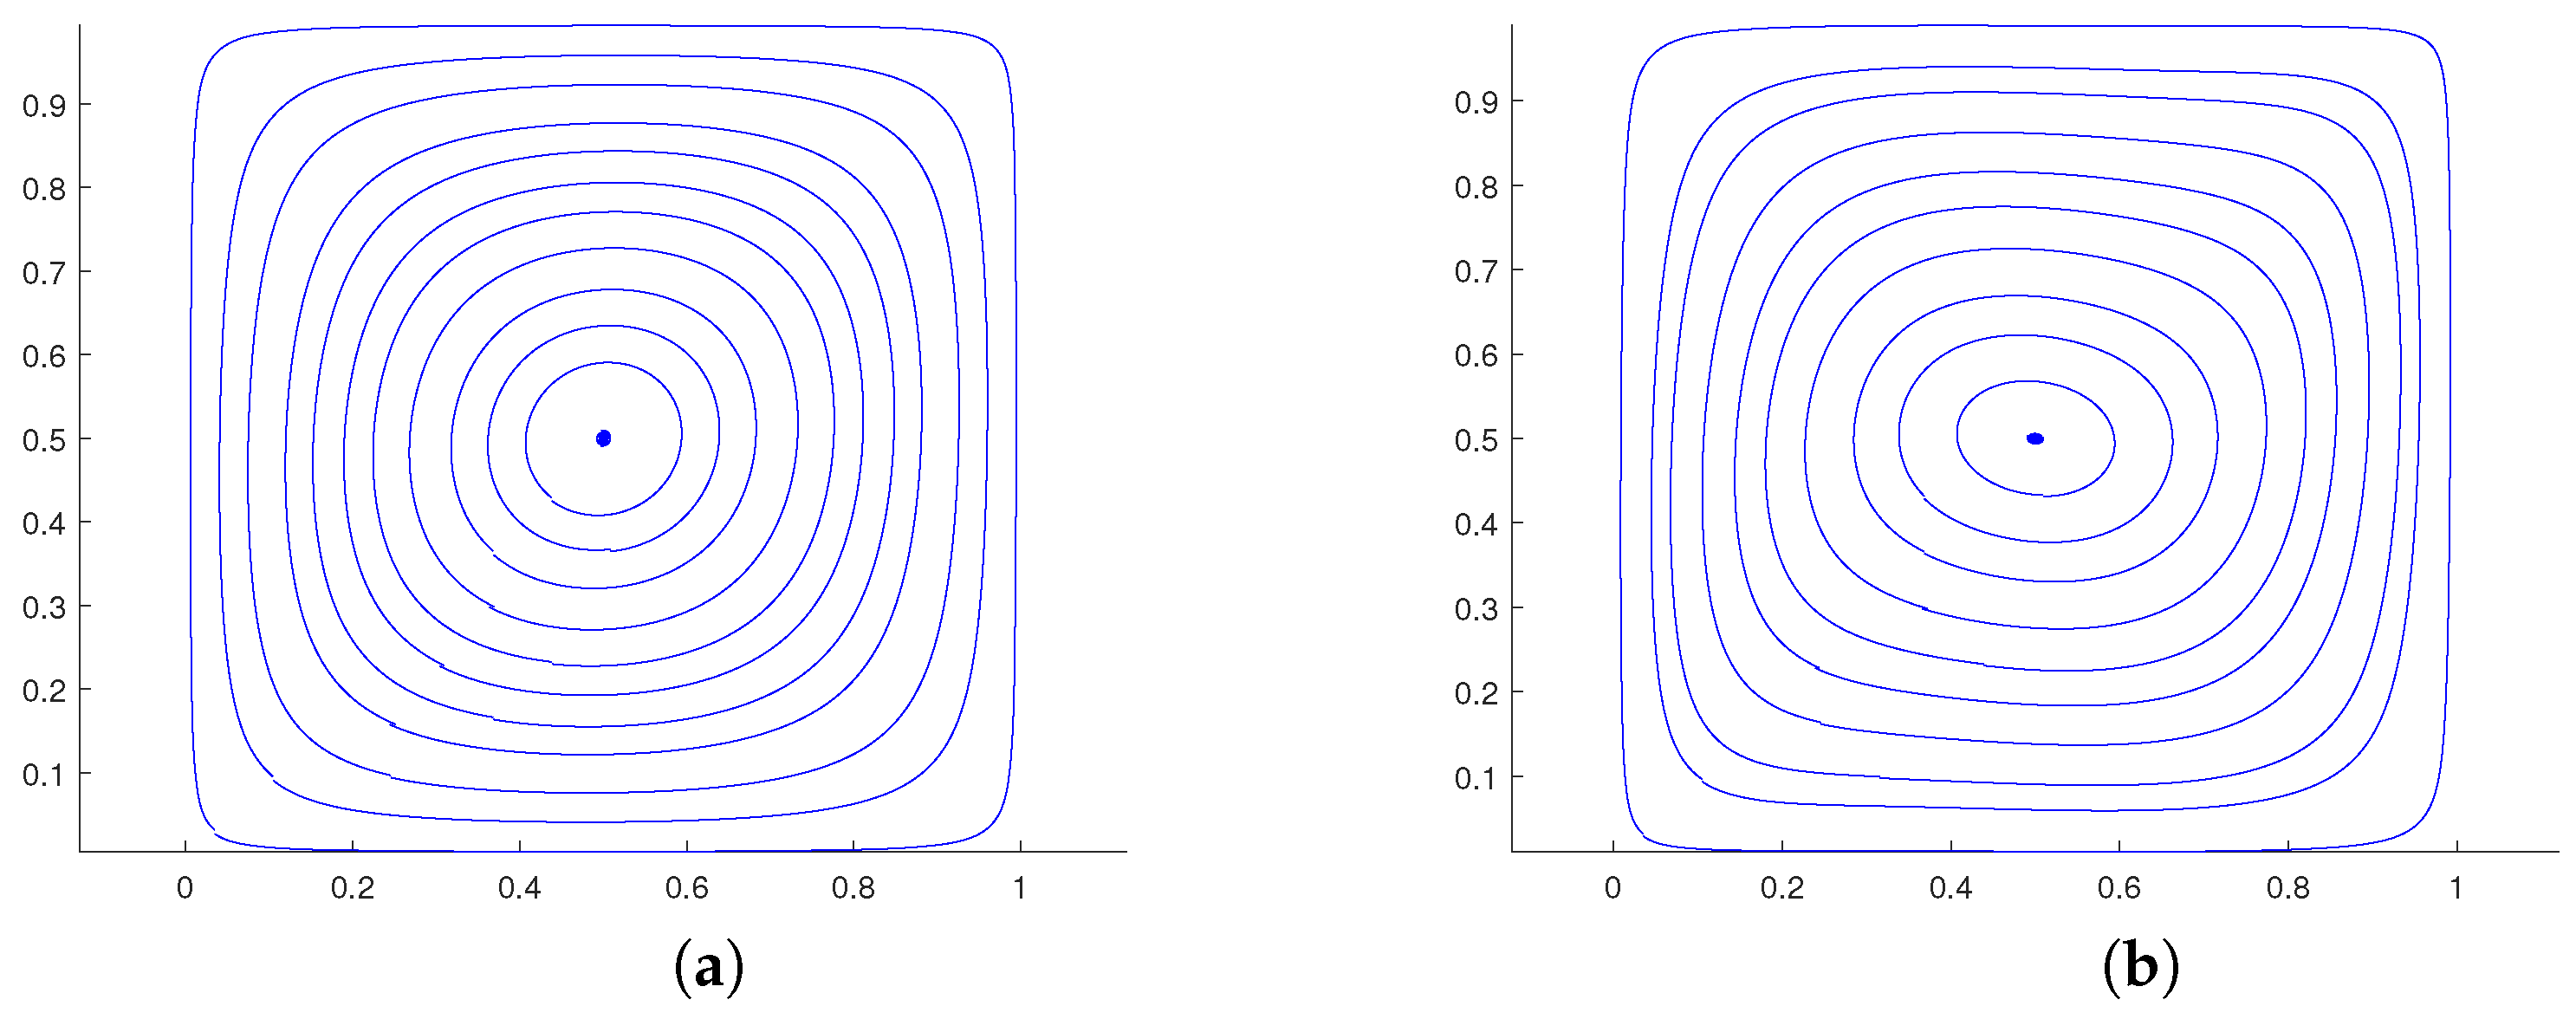
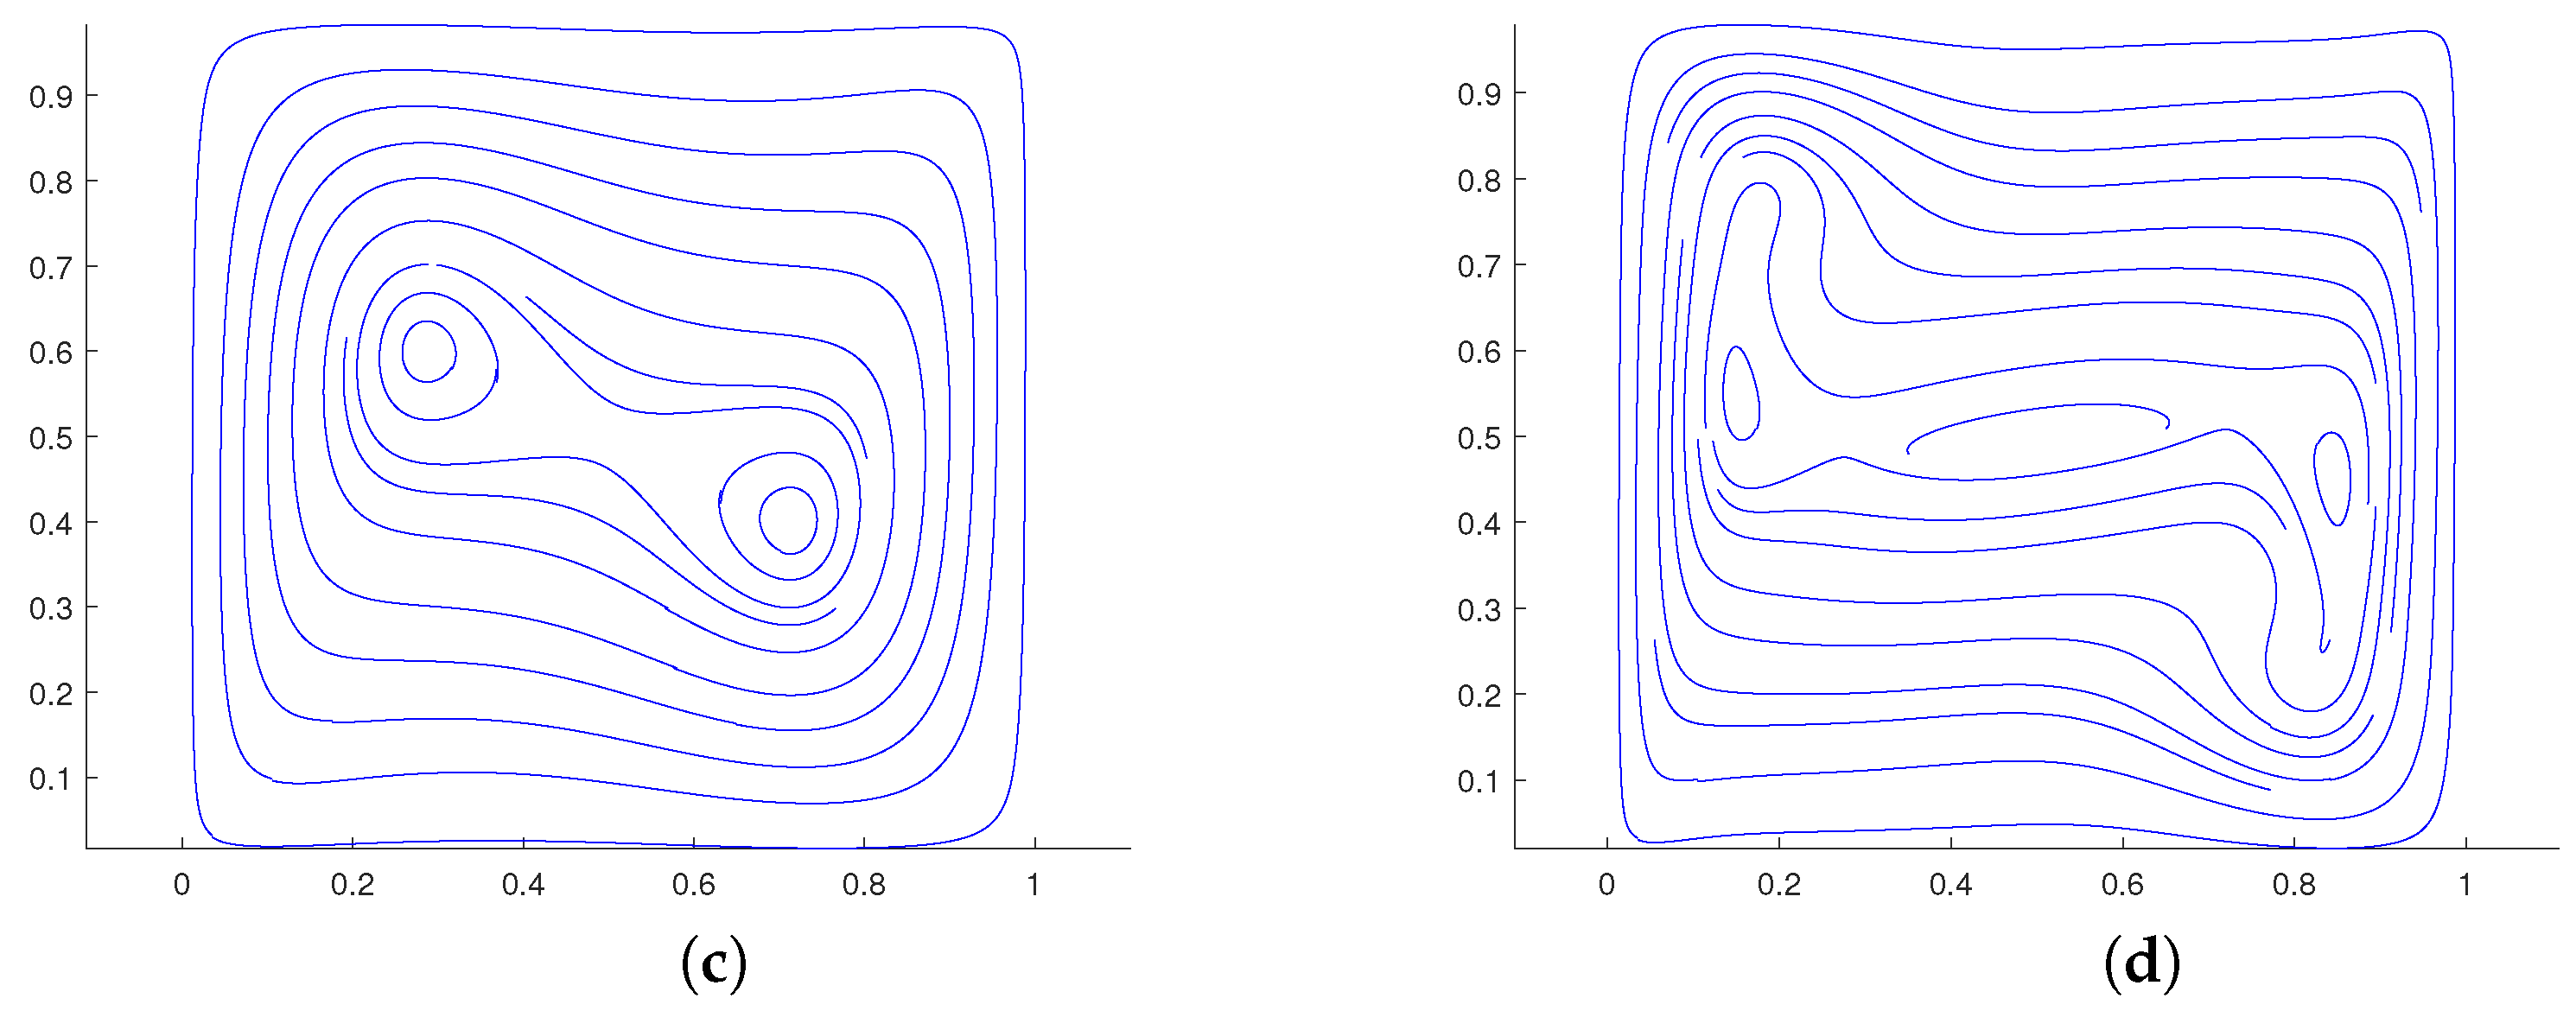
In the simulations, we will consider simulations of the natural convection of air ( Pr = 0.71 ) at different values of the Rayleigh numbers Ra , T h = 21 , T c = 1 , T r e f = ( T h + T c ) / 2 = 11 , and Ma = 0.1 . We will use the following computational domain: grid sizes of 128 × 128 for Ra = 10 3 , 192 × 192 for Ra = 10 4 , 256 × 256 for Ra = 10 5 , and 256 × 256 for Ra = 10 6 . The projections of the streamlines and the isotherms of the natural convection flow in a square cavity for Ra = 10 3 10 6 are shown in Figure 3 and Figure 4. Excellent consistency has been found between the flow and the thermal fields and those reported in the literature (see, e.g., [56,57,58]).
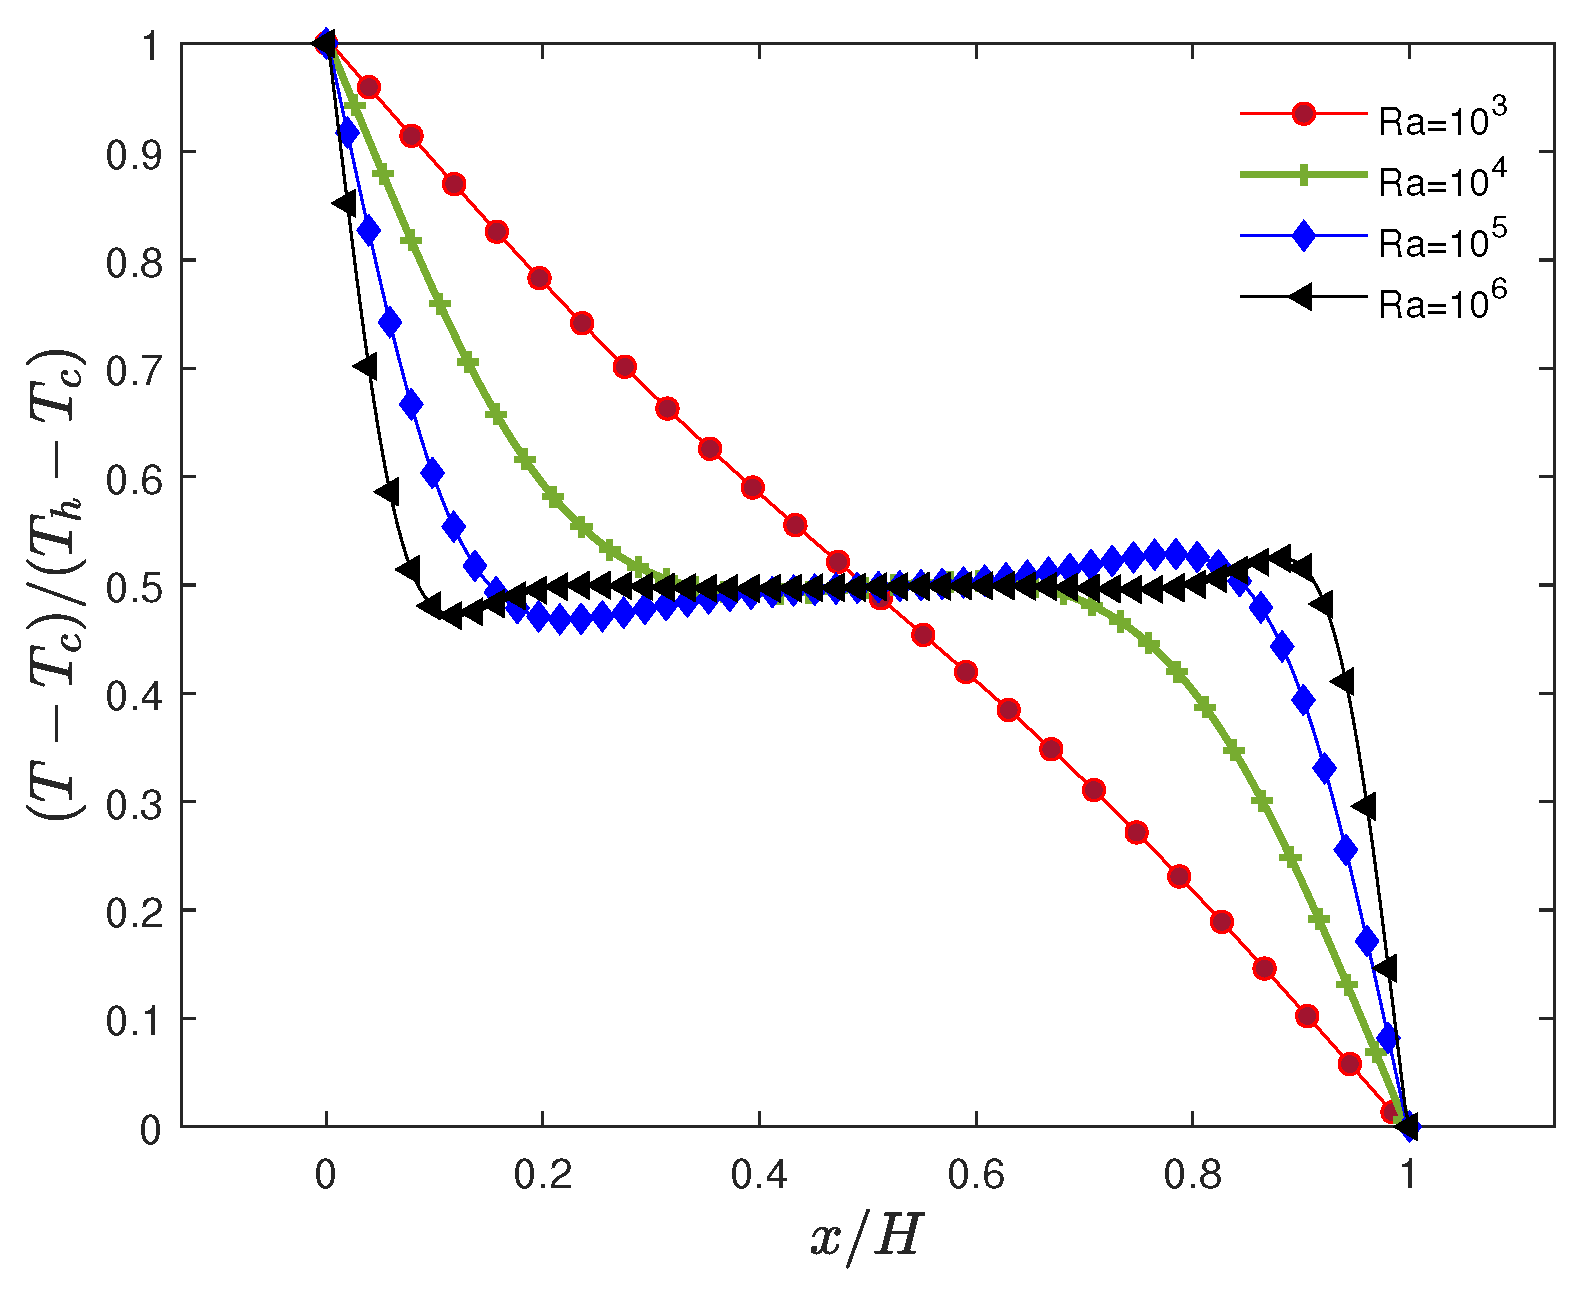
Figure 5 and Figure 6 present the variation in the nondimensional temperature ( ( T T c ) / ( T h T c ) ) along the horizontal and vertical midplane of the square cavity, i.e., y / H = 0.5 and x / H = 0.5 for Ra = 10 3 , 10 4 , 10 5 , and 10 6 . From Figure 5, it is seen that at lower Ra values (e.g., 10 3 ), the flow is more dominated by conduction, and the temperature gradient is relatively linear between the hot and cold sides. As Ra increases, convection effects become more pronounced. Around Ra = 10 4 and 10 5 , nonlinear temperature profiles with steeper gradients near the walls and a more uniform region at the center are seen. At Ra = 10 6 , strong convective currents will result in a well-mixed core, and the temperature profile shows a near-uniform region at the center, with sharp gradients close to the hot and cold walls. By looking at Figure 6, we noted that for lower Ra values, the temperature distribution is more uniform due to the dominance of the conduction. As Ra increases, the temperature gradient near the top and bottom walls becomes steeper, reflecting the rising and falling fluid due to buoyancy. At high Ra values (e.g., 10 6 ), the temperature in the middle part of the cavity can be more uniform due to the mixing effect of the convective currents, with sharp gradients near the top and bottom boundaries. To summarize this, as the Rayleigh number increases, the transition from a conduction-dominated regime to a convection-dominated regime occurs, which is reflected in the nonlinear and more complex temperature profiles along both the horizontal and vertical midplanes of the square cavity. The exact shape of these profiles would depend on the specific boundary conditions and fluid properties, and they are often obtained through detailed numerical simulations.
As a quantitative study of our numerical results, the following primary flow and thermal properties of the natural convection in a square cavity are also computed and compared: The maximum horizontal velocity component ( u m a x ) in the vertical midplane ( x = L / 2 ) and its location ( y m a x ), the maximum vertical velocity component ( v m a x ) in the horizontal midplane ( x = H / 2 ) and its location ( y m a x ), the average Nusselt number ( Nu ¯ ) along the right wall (cold wall), and its maximum value ( N u m a x ) and the location ( y N u ) where it occurs. The average Nusselt number ( Nu ¯ ) at either the left or the right wall is an important parameter for characterizing the thermal transport during natural convection and is defined by
N u ¯ = L H N u ( y ) d y / H .
Those quantitative comparisons between the present central-moment LBM results with the previous benchmark results [56,57,58] are presented in Table 2. It can be seen that the agreement between the present results and both the cascaded LBM data [56] and benchmark solutions [57,58] are in good agreement, thereby providing its validation for quantitatively studying thermally driven flows in enclosures.

5.2. Surface-Tension-Driven Thermocapillary Flow in Two Superimposed Self-Rewetting Fluid (SRF) Layers

Next, let us validate our numerical approach for the simulation of a benchmark problem involving a surface-tension-driven flow due to temperature-dependent effects in self-rewetting fluid (SRF) layers. In order to specifically address such a situation, we recently developed a new analytical solution of a thermocapillary flow in two superimposed SRF layers [14]. Briefly, the setup consists of two superimposed SRF fluid layers, of a total thickness of W, between two plates, where the bottom surface is heated nonuniformly by imposing a sinusoidal temperature distribution, while the top surface is maintained at a constant temperature. In such a formulation, the thickness ratio of the SRF layers and the viscosity and thermal conductivity ratios are regarded as free parameters. The interface between the two fluids induces a local surface tension that is taken to be a quadratic function of the temperature to model the SRF effects. Then, at the creeping flow limit, i.e., under the vanishing Reynolds number and Marangoni number conditions, analytical solutions for the stream functions (and, hence, the velocity field) and the temperature field were developed. Essentially, the flow pattern consists of the generation of a certain number of counter-rotating pairs of vortices or rolls in SRF layers, with the thermocapillary motions directed along the interface toward higher temperature zones, which are distinct from those seen in NF layers.
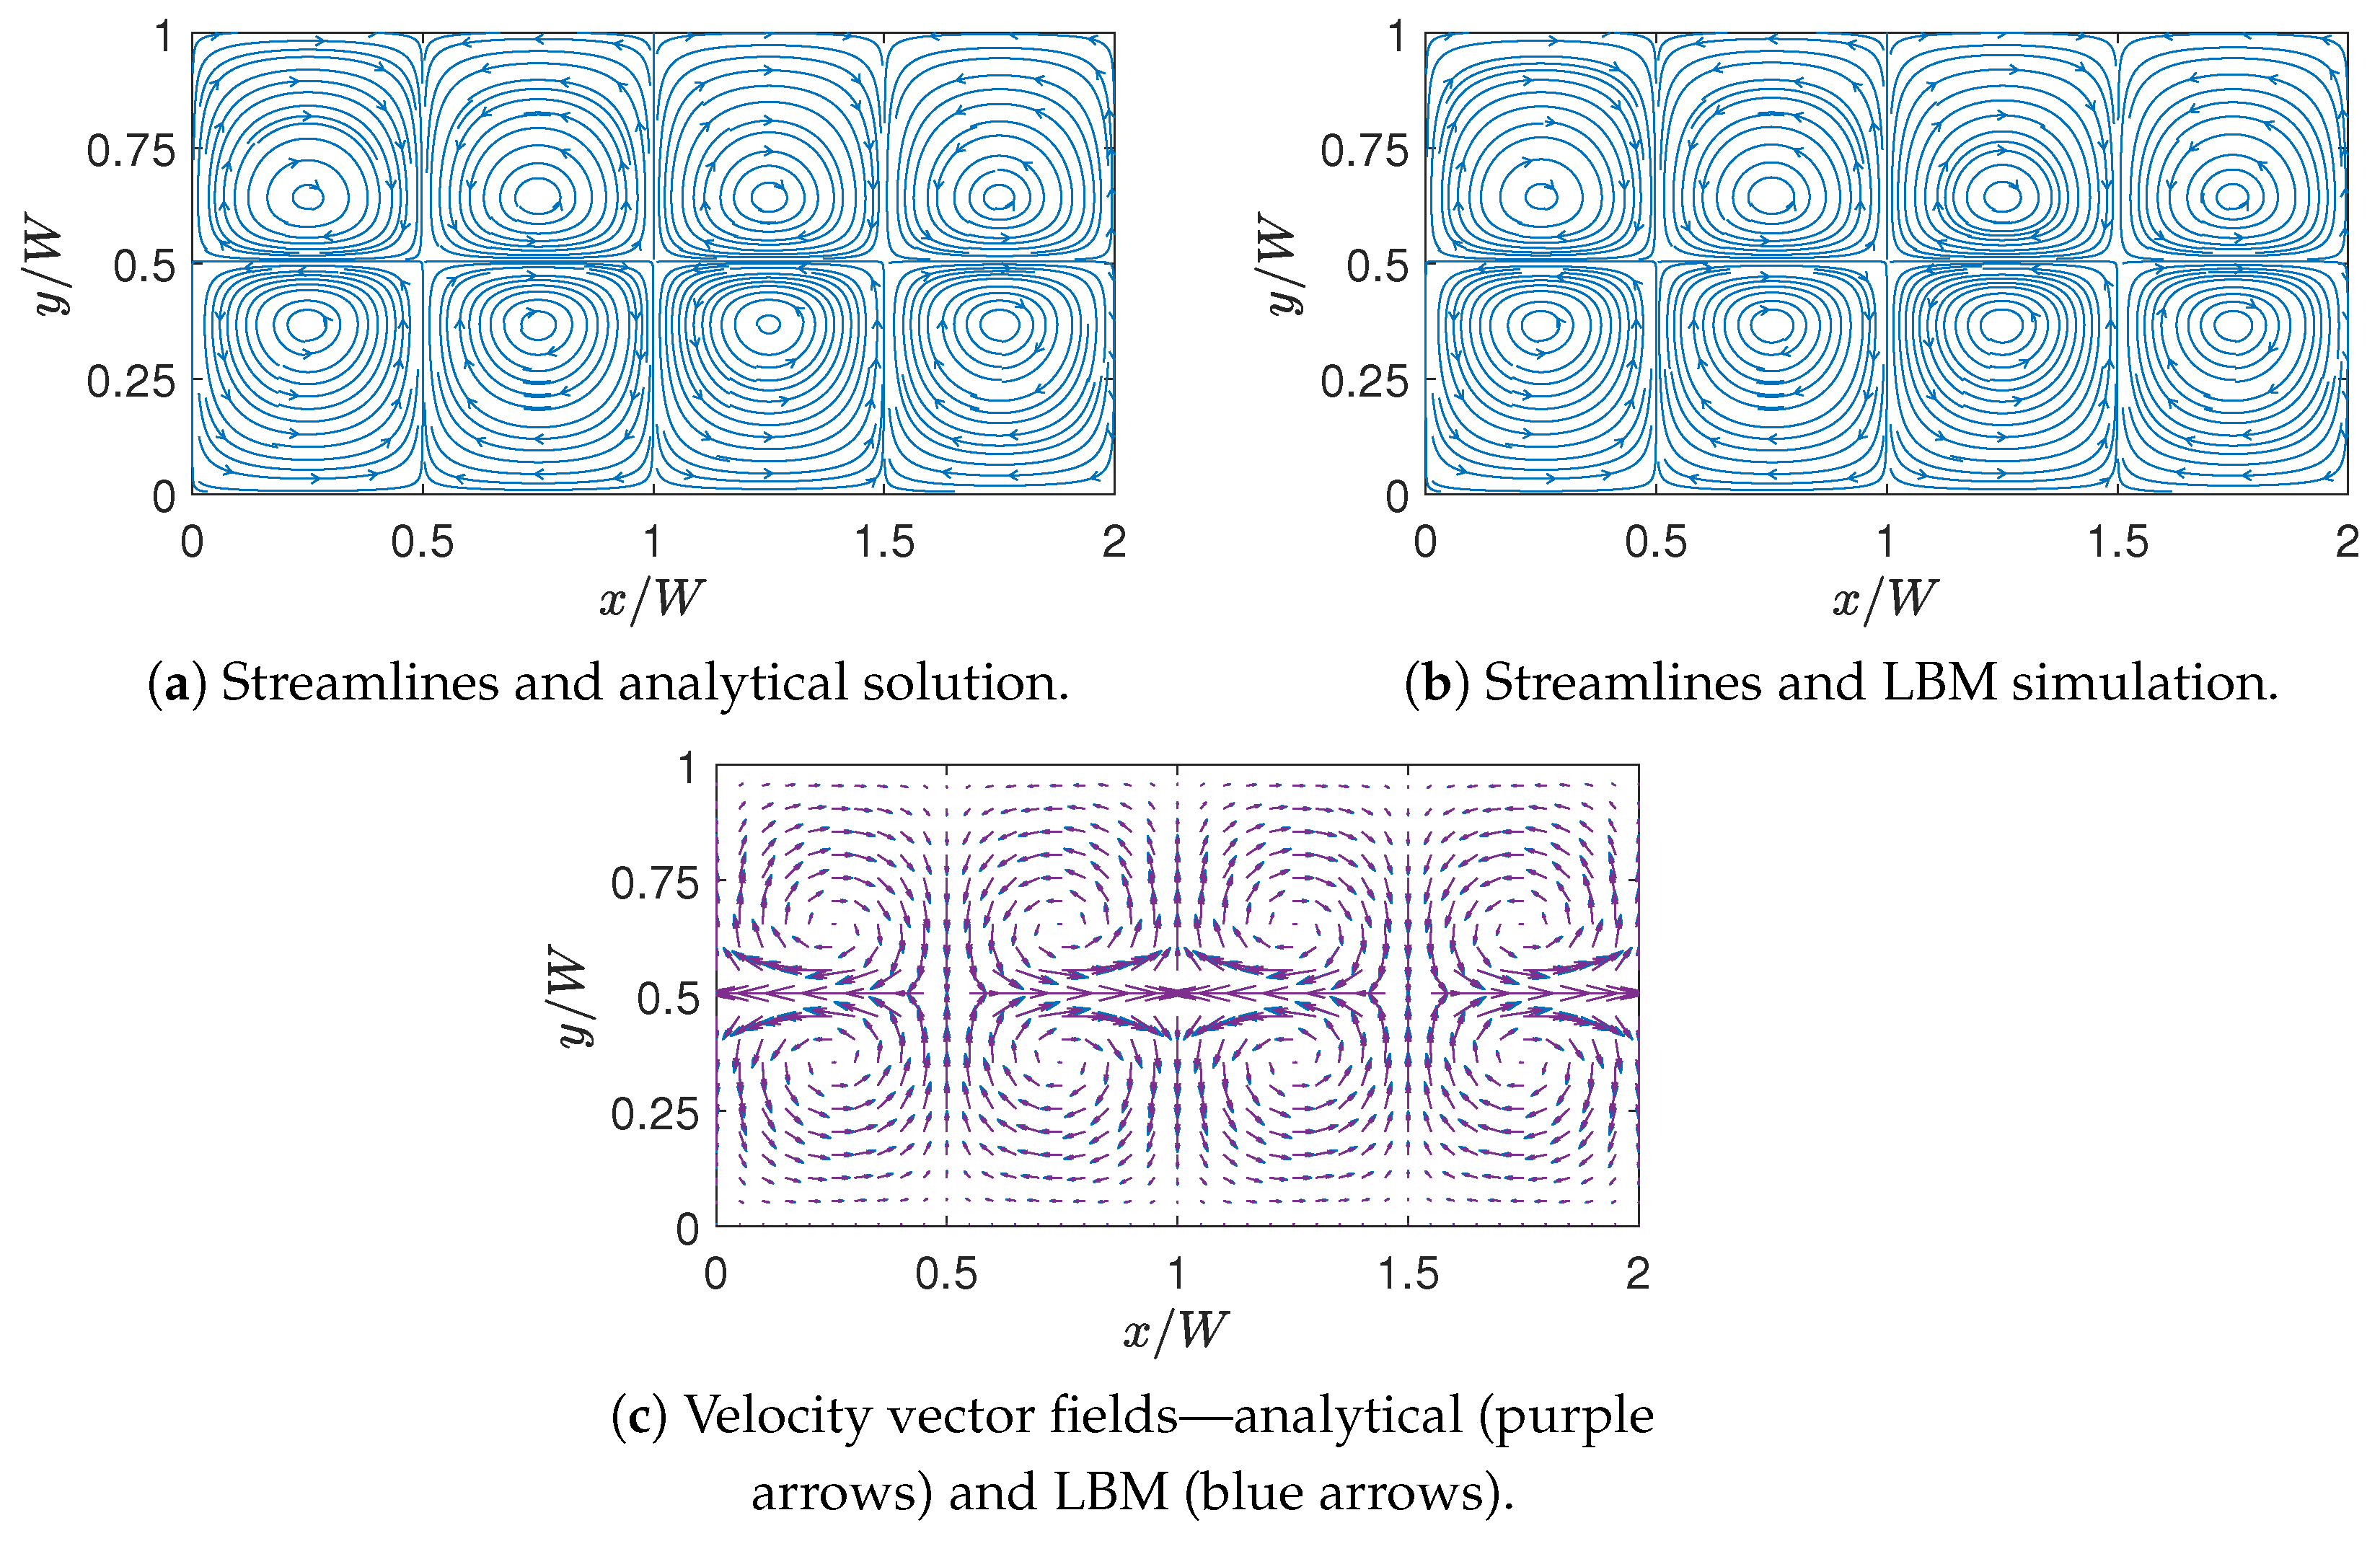
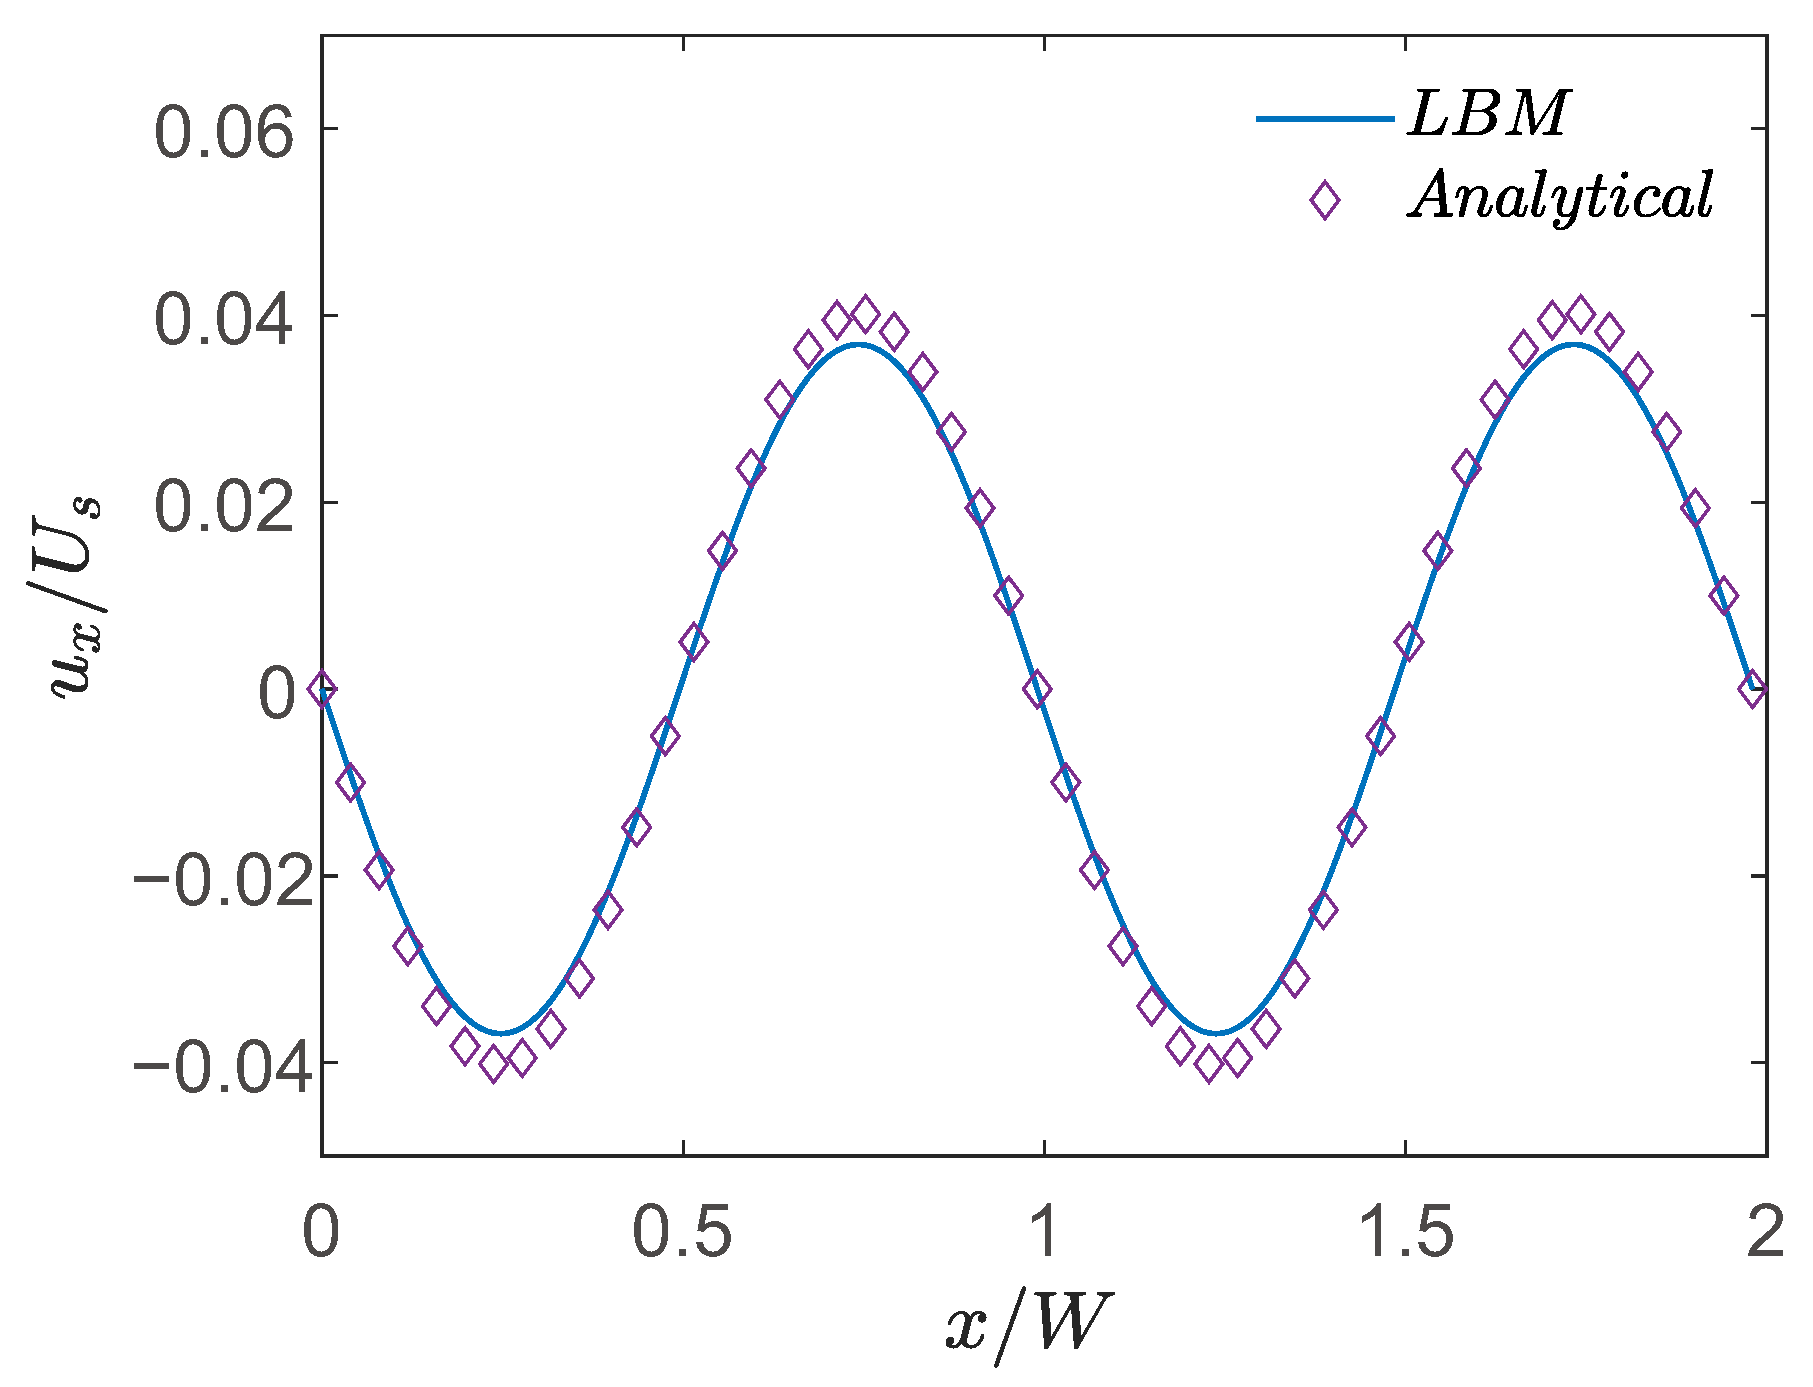
We will use this solution to validate our LBM under the same parametric conditions and a similar grid resolution used in the rest of this paper. Specifically, we considered two superimposed SRF layers of an equal thickness in a domain of a length that is twice that of the total SRF thicknesses (W). The domain was resolved with 200 × 100 grid nodes, and the setup used a thermal conductivity ratio of k ˜ = 1 and a viscosity ratio of μ ˜ = 1 . The dimensionless linear and quadratic coefficients of the surface tension variation with the temperature are M 1 = 0 and M 2 = 1.0 , respectively. As such, these values for the above parameters and the grid resolution are representative of those used in the simulations of the SRF layers in a cavity discussed in a later section of this paper. Figure 7 shows the comparisons of the streamline patterns and velocity vector fields in SRF layers generated under the above conditions between the analytical solution [14] and the LBM simulations. In general, four pairs of counter-rotating vortices are formed in the SRF layers (which is unlike that in NF layers, where only two such pairs are formed), and the simulation results are in good agreement with the analytical solution. Furthermore, to provide a more quantitative assessment, we have also compared the horizontal component of the thermocapillary velocity profile along the interface obtained using the analytical solution [14] with the LBM numerical results in Figure 8, which shows very good agreement between the two.

Grid Independence Test

Next, we study and test for the effect of the independence of the choice of the grid resolution on the results. In this regard, in addition to the baseline case of 200 × 100 grids, we performed simulations at a higher resolution of 300 × 150 grid points, and the results for the effect of the thermocapillary velocity profile on the interface at these two resolutions are plotted in Figure 9. Evidently, the baseline resolution result is in good agreement with that using a higher resolution, which demonstrates that the results are essentially grid independent.
Moreover, we note that additional validation case studies involving the thermocapillary migration of bubbles and other related multiphase flow benchmarks are presented in our recent investigations [12,14].

6. Simulation Results and Discussion

This study investigates thermocapillary convection in self-rewetting fluid (SRF) layers confined within a closed system, modeled as a two-dimensional square cavity with a spatially varying heat flux applied along one of its walls. Specifically, a nonuniform heat flux is imposed on the left wall, while the right wall is maintained at a constant temperature (see Figure 1). The LB schemes, validated in the preceding section, are utilized to simulate this setup. Our focus is on self-rewetting fluids (SRFs), which exhibit a quadratic dependence of the surface tension on the temperature ( σ T T 0 or M 2 0 ), in contrast to normal fluids (NFs), where the surface tension varies linearly with the temperature. The objective is to analyze how this quadratic term influences the fluid flow driven by variable surface tension effects and the interfacial behavior in comparison to normal fluids when confined in enclosures. As is typical for LB simulations, the selections of the parameters and the simulation results are naturally reported in lattice units.
The simulations are conducted in a two-dimensional square cavity with a height and a length of H = 200 and L = 200 , respectively, as illustrated in Figure 1. No-slip velocity boundary conditions are applied to all the solid walls, using the standard halfway bounce back method. The temperature conditions are set as T C = T r e f = 2 , while the magnitude of the nonuniform heat flux ( q o ) applied to the left wall is based on the choice of the dimensionless parameter (Q) and the length scale ( L q ) (see Equations (6) and (7)). The imposed temperature and heat flux conditions are implemented using the anti-bounce back and bounce back schemes applied to the distribution function used to recover the energy transport equation. Additionally, the reference surface tension is assumed to be σ 0 = 2 × 10 4 . The strength of the thermocapillary flows is determined by two dimensionless coefficients that characterize the temperature dependence of the surface tension: the linear coefficient ( M 1 ) and the quadratic coefficient ( M 2 ). Furthermore, for interfacial tracking using the conservative Allen–Cahn equation (ACE), the interfacial thickness and mobility parameters are set at W = 5 and M ϕ = 0.2 , respectively. In addition, unless otherwise reported, the dynamic viscosity ( μ ) and thermal diffusivity ( α ) used in the simulations are μ = 0.2 and α = 2 × 10 2 , respectively. A summary of the values of the various dimensionless parameters used in the LB simulations of the Marangoni convection in SRFs in a heated square cavity is presented in Table 3.

6.1. The Streamlines and Isotherms for the Two-Layer Flow of Normal Fluids (NFs)

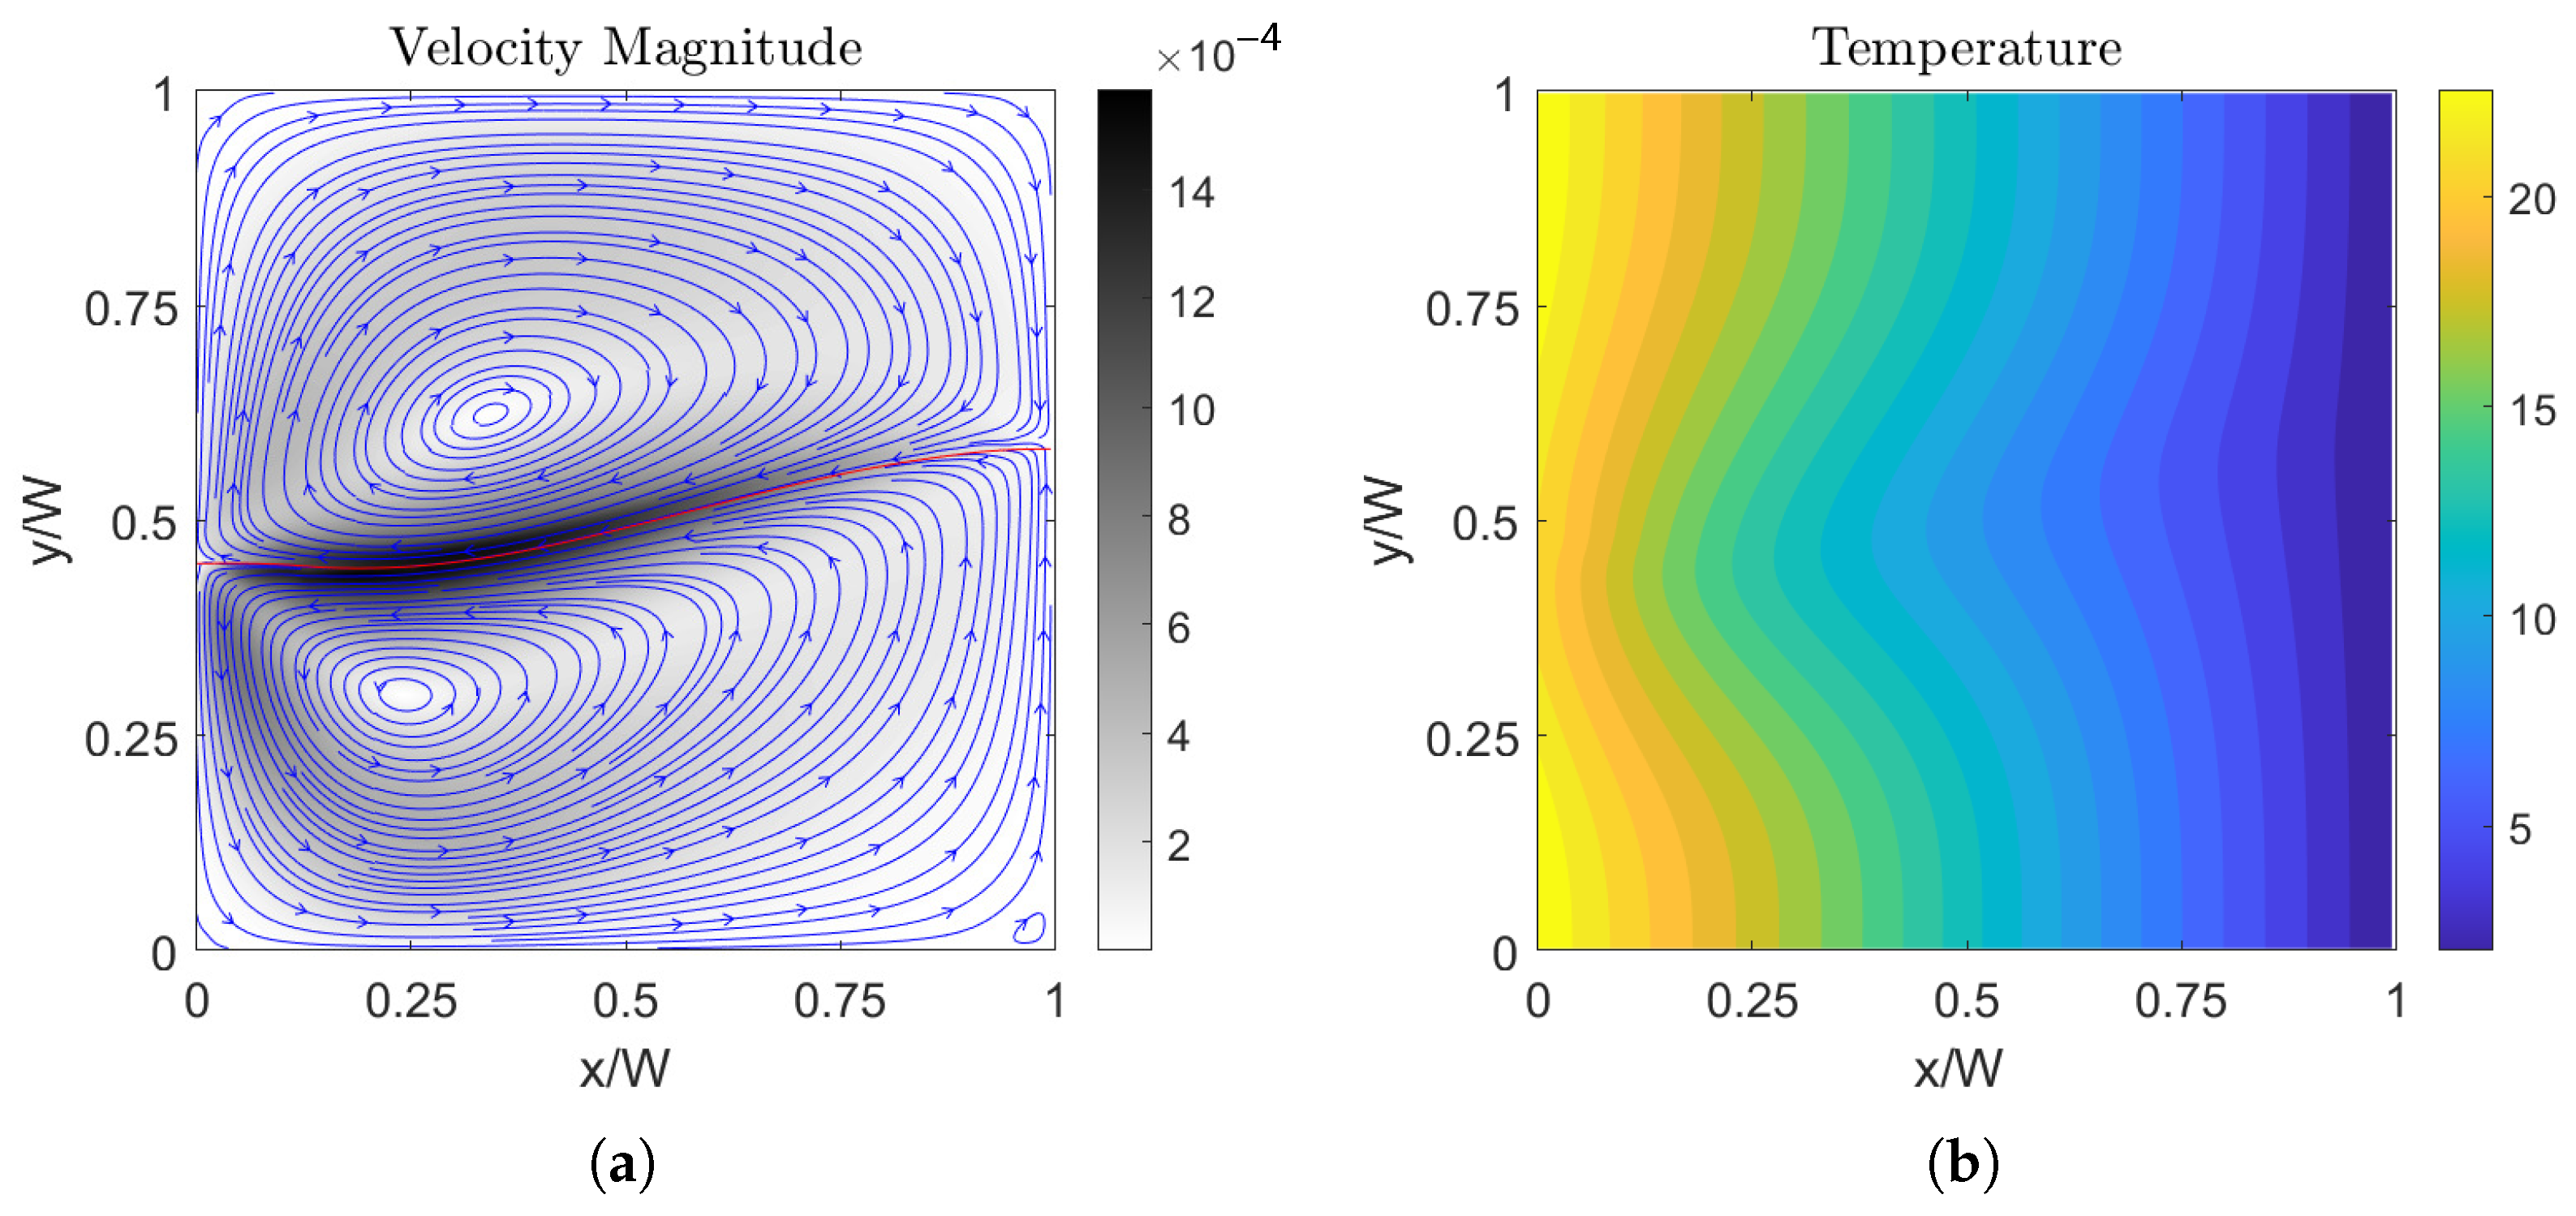
First, we begin discussing our results by considering cases where the linear coefficient of the surface tension variation with the temperature is nonzero, i.e., σ T 0 or M 1 0 , while the quadratic coefficient of the surface tension is absent, i.e., σ T T = 0 or M 2 = 0 . In this regard, we consider cases with two fluids with property ratios k ˜ = 1 and μ ˜ = 1 . In order to offer a perspective and a basis for comparison, we will first show the streamlines and isotherms for the two-layer flow of normal fluids (NFs) enclosed within a square cavity for localized and distributed heating boundary conditions corresponding to L q / H = 0.1 and L q / H = 1.0 , respectively, which are shown in Figure 10 and Figure 11, respectively, using M 1 = 0.1 and M 2 = 0 . Clearly, if the quadratic coefficient for the surface tension is absent (i.e., σ T T = 0 ), and by looking at the streamline figures, we see that the fluids move away from the hotter region at the interface at the center of the domain. Also, in the case of distributed heating, the strength of the Marangoni convection is seen to be increased compared to that in the localized heating case. Moreover, in both of these cases, the two counter-rotating vortices generated by the surface tension gradients have their centers roughly at the halfway point between the two vertical sides for the distributed heated case, which is seen to be shifted toward the left wall in the localized heating case. In both cases, the interface is found to be essentially flat with little deformation.

Heat Transfer Rate Characterization: Nusselt Numbers

An important aspect of thermocapillary convection is the quantification of the associated heat transfer rates in the fluids. This can be naturally defined in terms of the dimensionless Nusselt number ( Nu ) at any location (x) relative to the heated surface on the left side of the cavity as follows:
Nu = T x H Δ T
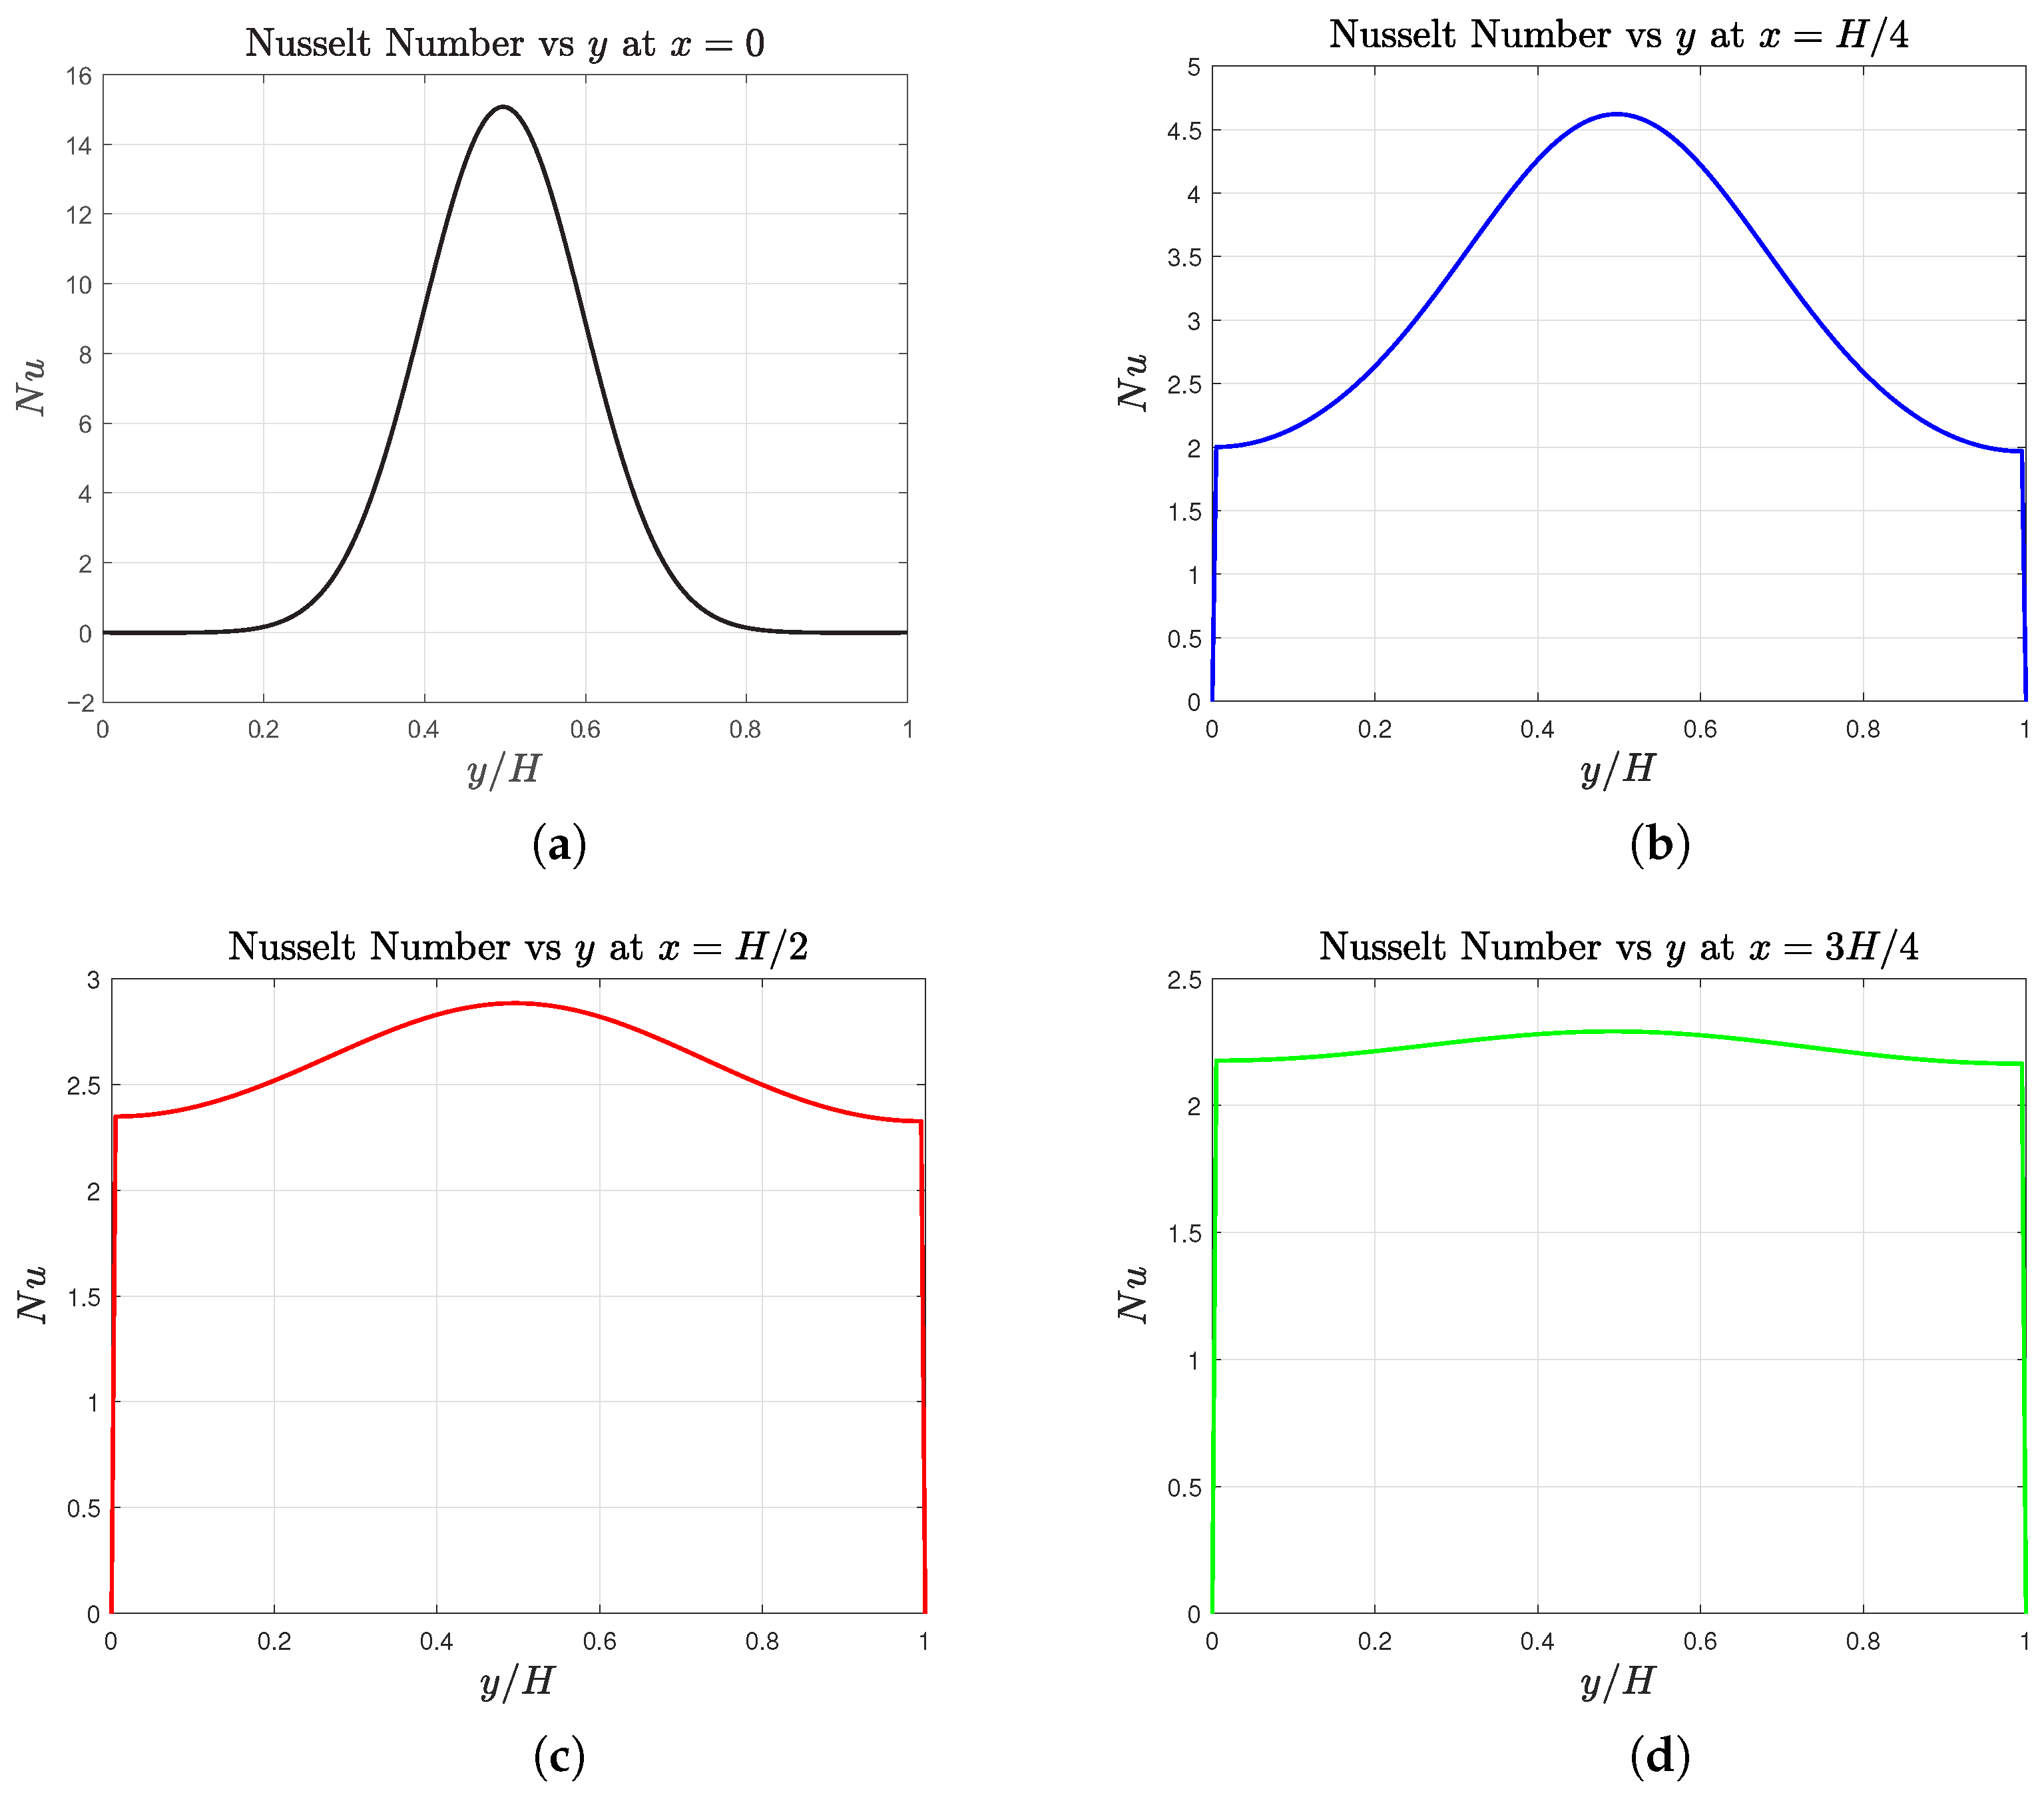
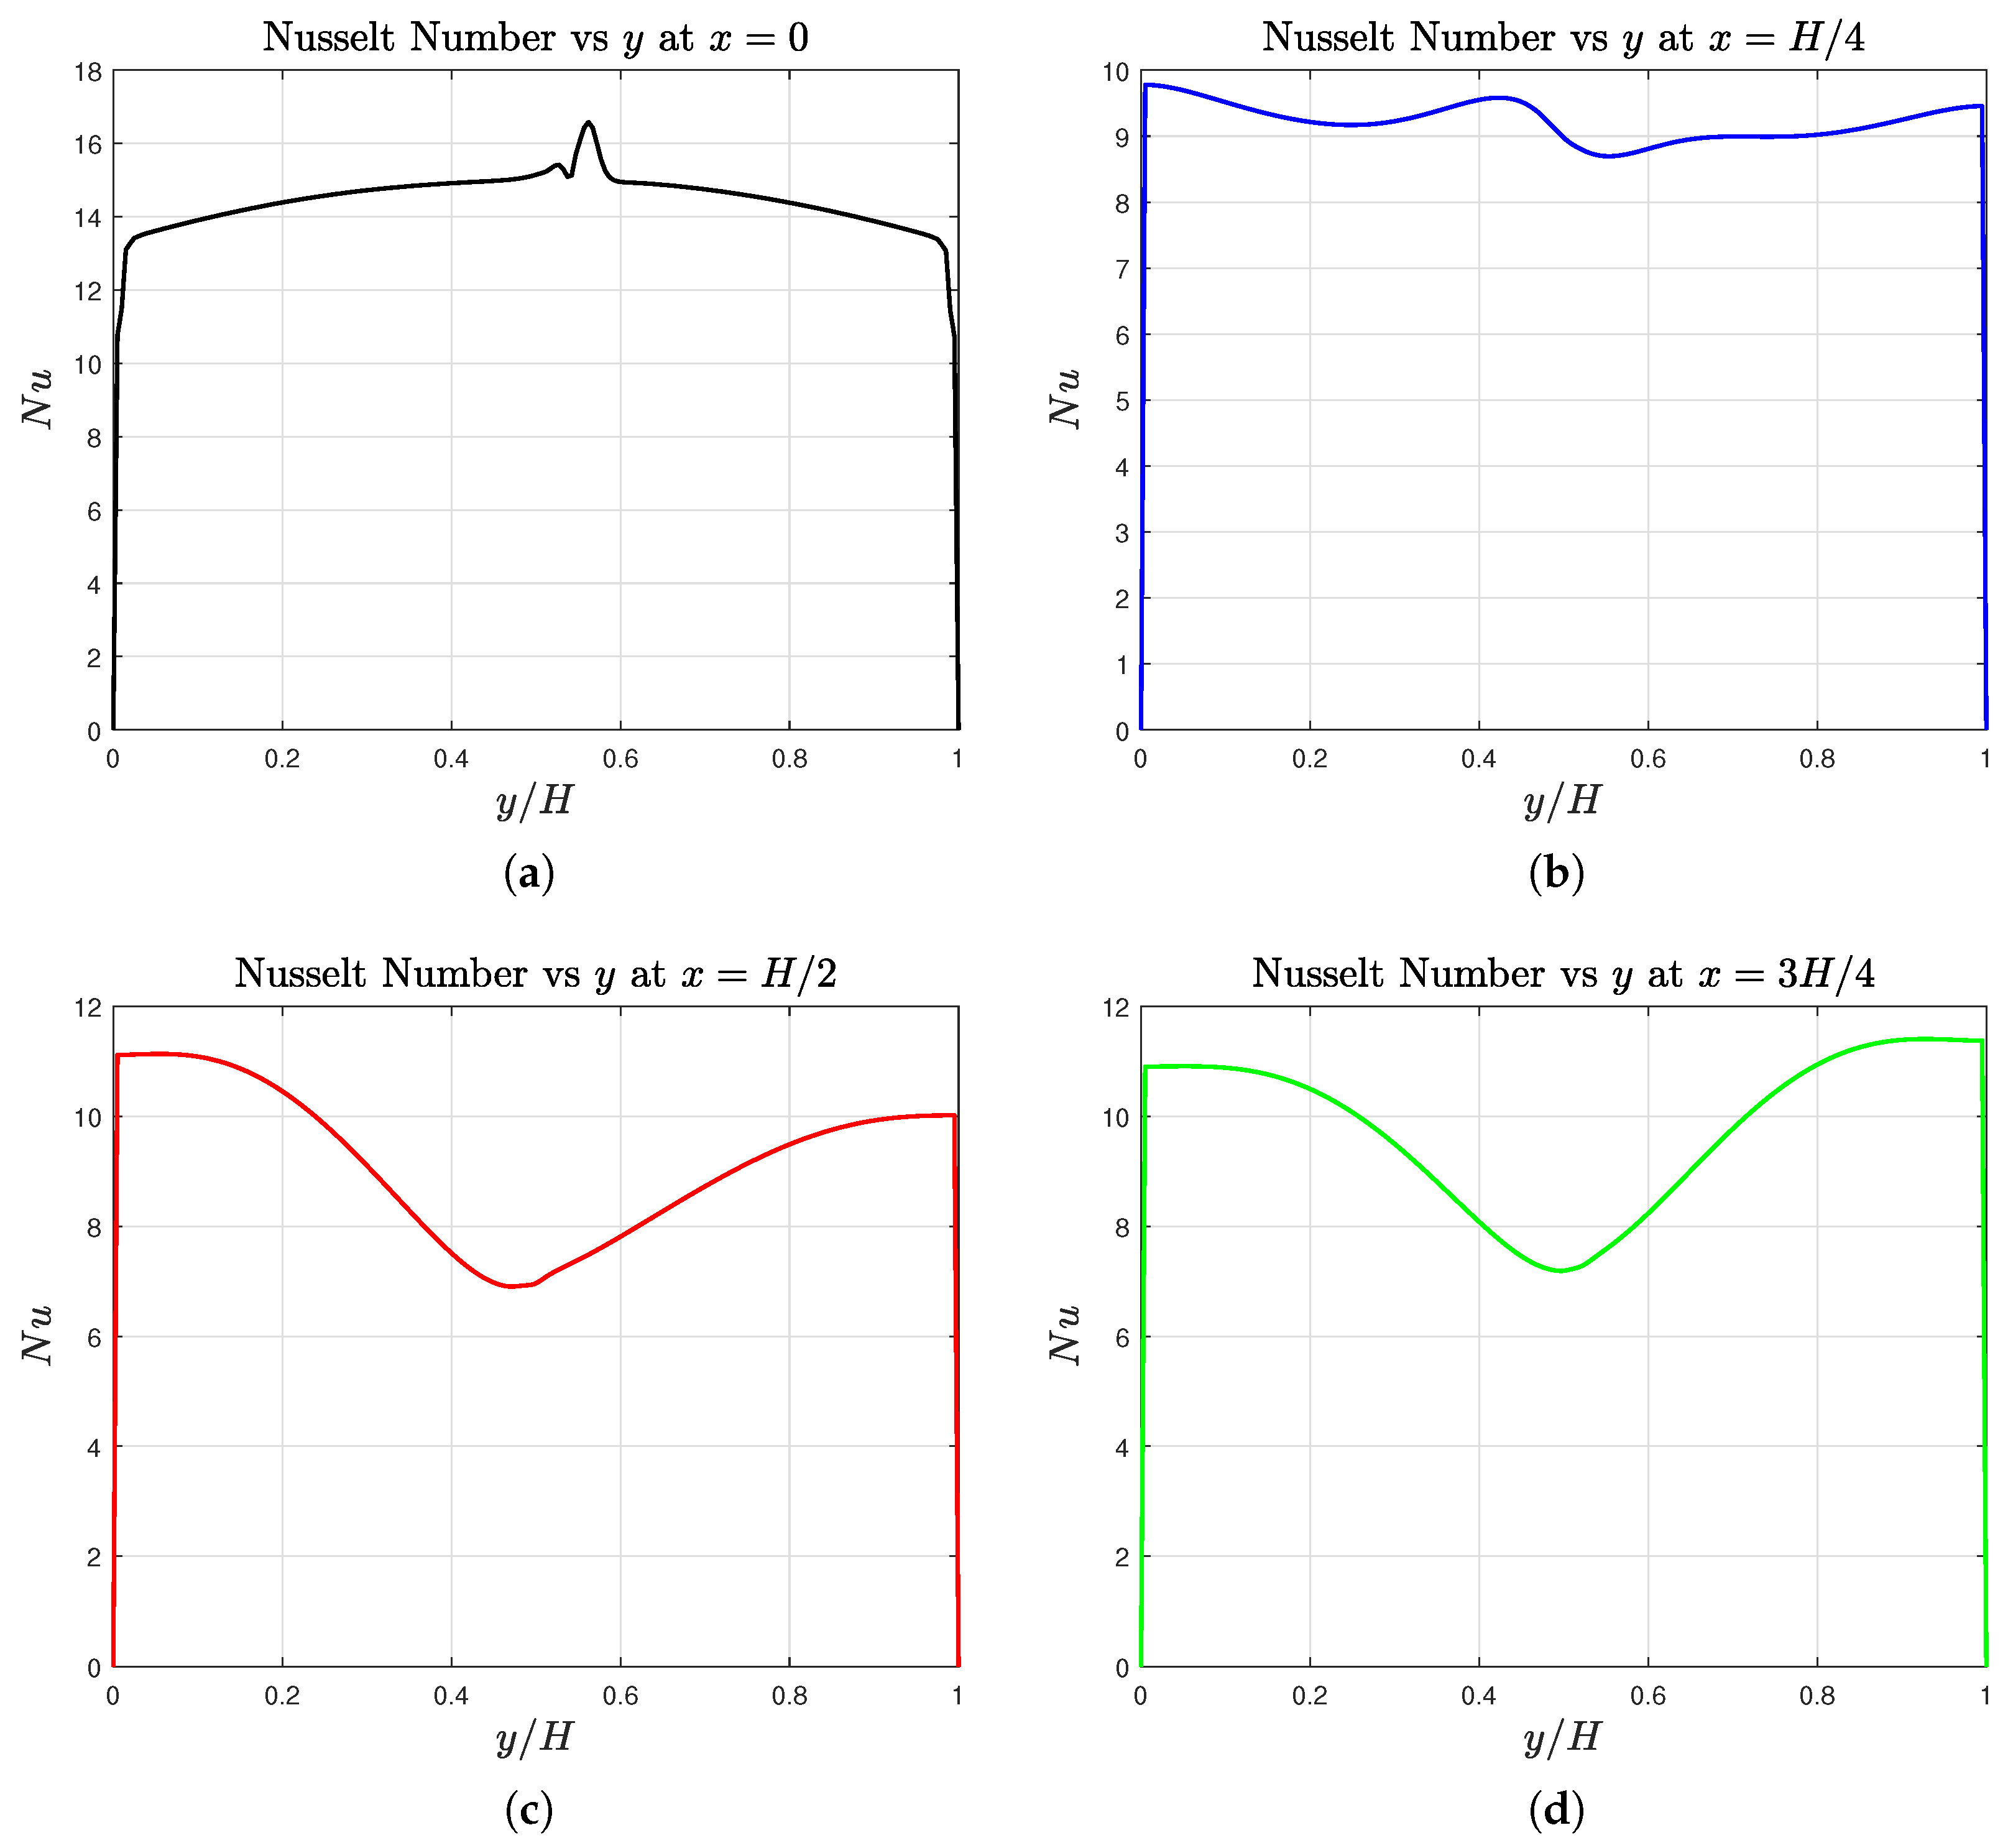
Figure 12 shows the profiles of the Nusselt number along the vertical lines in the cavity, i.e., Nu vs. y / H at (a) x = 0 , (b) x = H / 4 , (c) x = H / 2 , and (d) x = 3 H / 4 for NFs with localized heating ( L q / H = 0.1 ) involving a dimensional heat flux ( Q = 0.01 ) imposed at x = 0 . As expected, the Nusselt number is localized and peaking at the interface around y / H = 0.5 at the heated surface ( x = 0 ). Then, as we move away from this surface, the heat flux is diffused in both the fluid layers, leading to a distribution of the Nusselt number with broader variations in their profiles. For example, at x = 3 H / 4 , the Nusselt number shows relatively small variations along the vertical direction, with its maximum still occurring at y / H = 0.5 , which is characteristic of NFs.

6.2. The Streamlines and Isotherms for the Two-Layer Flow of Self-Rewetting Fluids (SRFs)

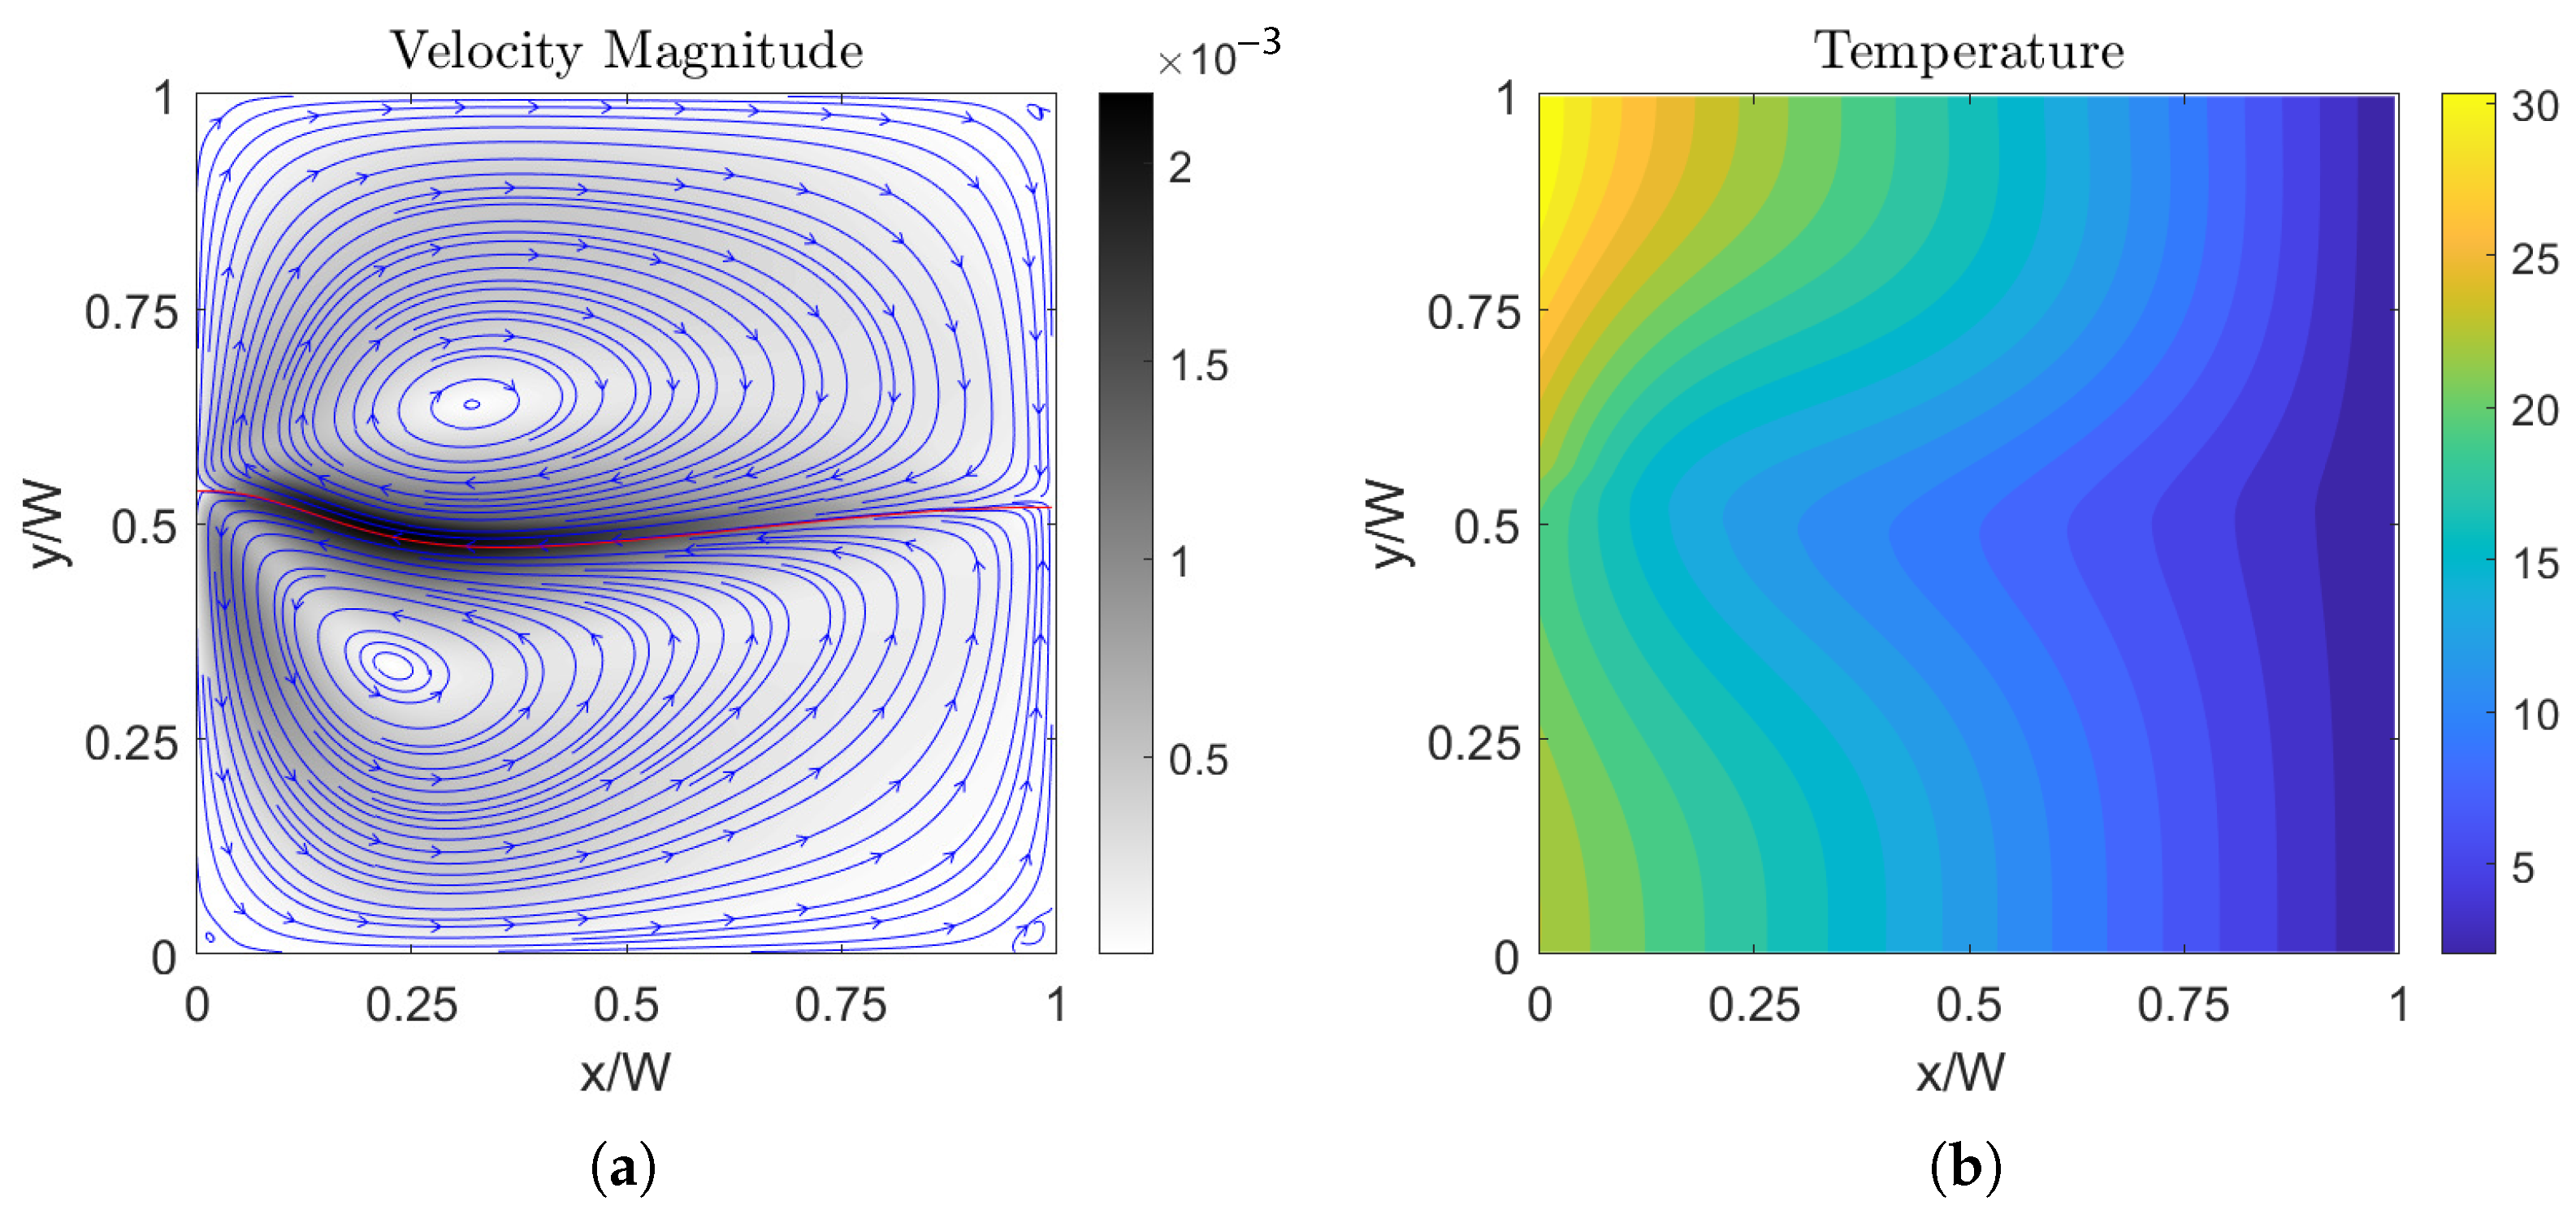
However, by turning off the linear coefficient of the surface tension (i.e., σ T = 0 or M 1 = 0 ) and leaving only the quadratic coefficient as nonzero, i.e., σ T T 0 or M 2 0 , for otherwise the same property ratios, we simulate the thermocapillary convection in SRFs for M 1 = 0 and M 2 = 1 . The results given in terms of the streamlines and isotherms for the two-layer flows of SRFs enclosed within a square cavity with localized (for L q / H = 0.1 ) and distributed (for L q / H = 1.0 ) heating boundary conditions are plotted in Figure 13 and Figure 14, respectively. It is clear that the thermocapillary flow patterns in SRFs and NFs differ significantly: In SRFs, the fluids at the interface aim to move toward the hotter region at the interface located at the center of the domain. These variations in the thermocapillary flow field’s direction between the SRFs and NFs are an indication of the flow resulting from the Marangoni stress caused by a surface tension gradient that is either positive or negative at the SRF or NF interface, respectively. Again, as compared to the localized heating situation, the intensity of the Marangoni convection increases in the case of dispersed heating. In both cases, the center of the two counter-rotating vortices is asymmetrically located closer to the heated wall. Moreover, the relatively stronger Marangoni velocity currents significantly alter the temperature distribution around the interfaces in the SRF case when compared to the NF case, especially for the distribution heating scenario. In addition, with L q / H = 1.0 , for the SRF case, significant deformation of the interface occurs and is accompanied by the generation of smaller corner vortices at the bottom, unlike in the NF case.

Heat Transfer Rate Characterization: Nusselt Numbers

Let us now characterize the nature of the heat transfer rates in the SRFs and compare them with those in the NFs discussed earlier. Figure 15 presents the Nusselt numbers along the vertical lines in the cavity, i.e., Nu vs. y / H at (a) x = 0 , (b) x = H / 4 , (c) x = H / 2 , and (d) x = 3 H / 4 for SRFs with localized heating ( L q / H = 0.1 ) involving a dimensional heat flux ( Q = 0.01 ) imposed at x = 0 . As before, there is a localization of Nu at the heated surface ( x = 0 ), with its maximum at y / H = 0.5 , which progressively broadens as we move away from it. However, there is a significant difference in the variations in the Nusselt number in SRFs when compared to that in NFs (see Figure 12), particularly at locations further from the location of the heater. Interestingly, at x = H / 2 and x = 3 H / 4 , the Nusselt number reaches its maxima in SRFs away from the interface, where it decreases, which is in contrast to that observed in NFs.
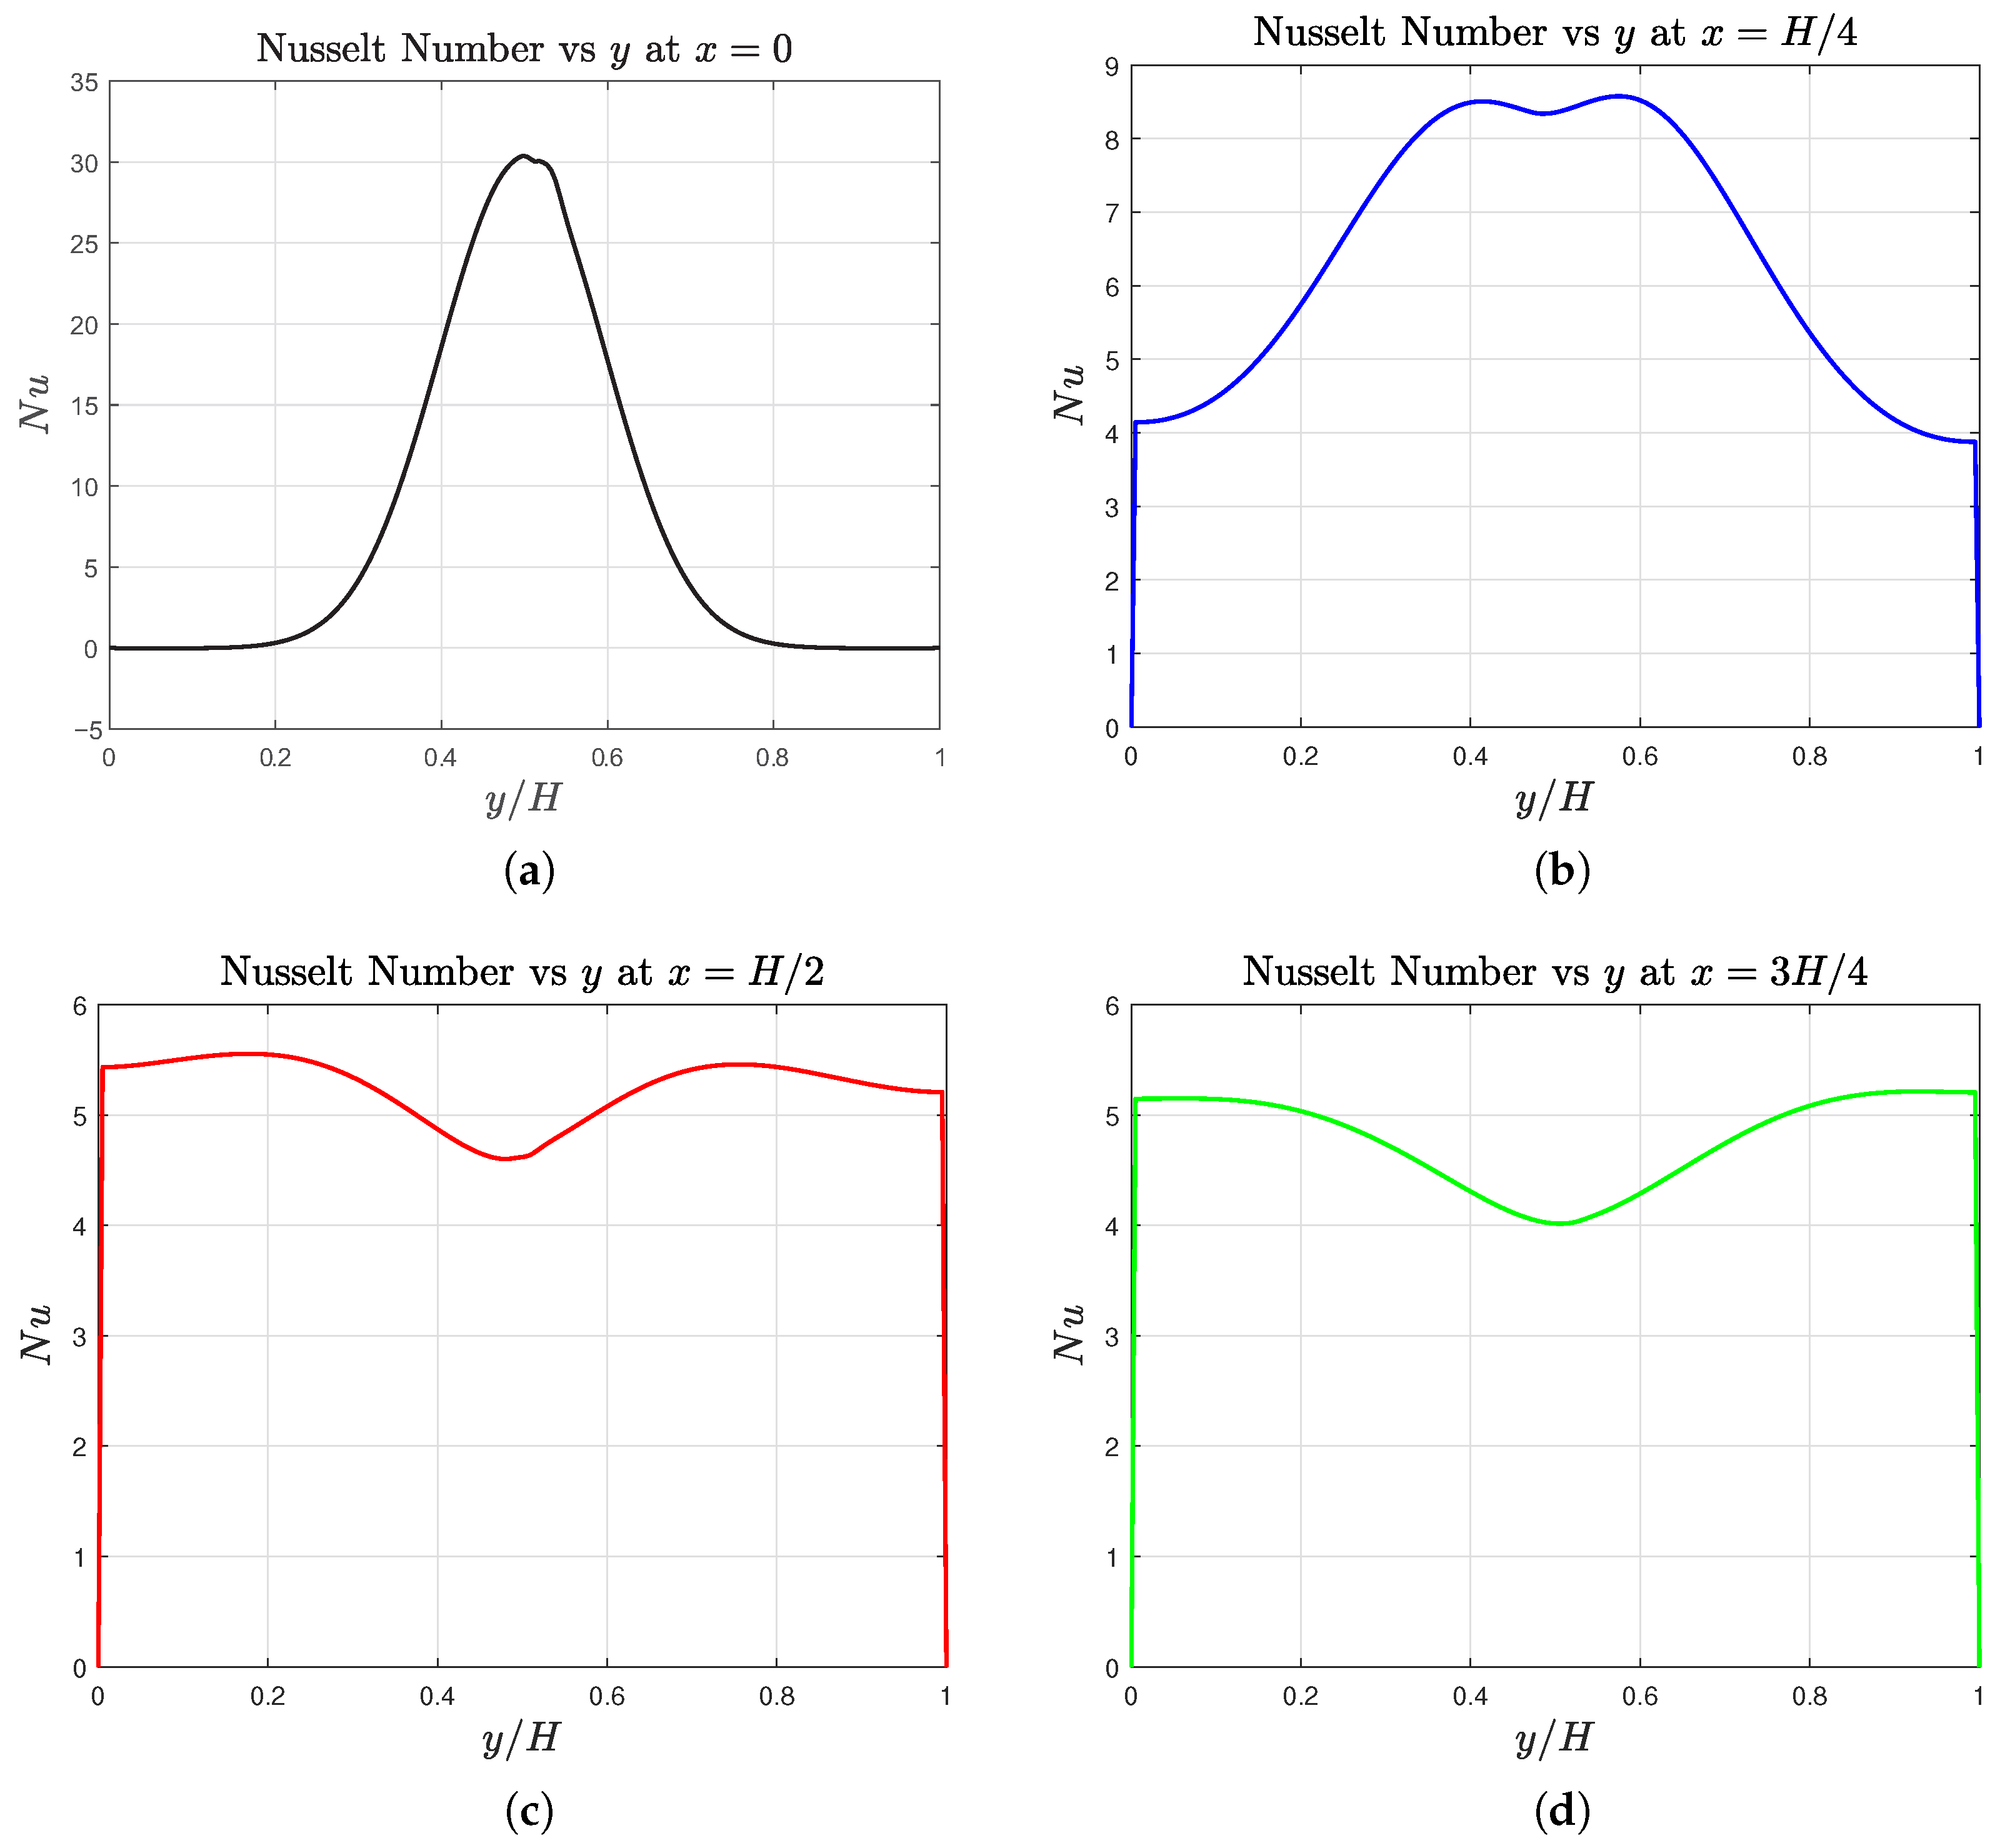
Moreover, as we increase the imposed heat flux from Q = 0.01 to Q = 0.02 , these effects are considerably more pronounced. Figure 16 shows the Nu profiles for the case of Q = 0.02 in SRFs, where the heat transfer rates in the fluids are generally twice as high as those in the previous case. Moreover, even at x = H / 4 , i.e., closer to the heater’s surface, its maxima occurs slightly away from the interface. As we move further away from the interface, viz., at x = H / 2 and x = 3 H / 4 , there is a significant local decrease in Nu at the interface with a concomitant increase in the heat transfer rates away from it. As such, there is a significant thermal transport away from the interface to the bulk fluids, and this heat redistribution arises from the thermocapillary convection due to the interfacial surface tension gradients associated with a nonlinear (quadratic) surface tension variation with increasing temperature in SRFs.
In addition, to provide further insights, let us look at the Nusselt number profiles in the case of distributed heating, with L q / H = 1 for the baseline case of Q = 0.01 , which are shown in Figure 17. Compared to the localized heating, with L q / H = 0.1 for the same Q = 0.01 , shown in Figure 15, the Nu profiles are markedly different. With distributed heating, the heat transfer rates in the fluid layers are expected to be more uniform, which appears to be the case for locations closer to the heater, see, e.g., x = H / 4 . However, as we move away further from the heater’s surface, there is a localized decrease in Nu around the interfaces, with a corresponding increase in the bulk fluids, which appears to be a characteristic feature of SRFs, as noted above. Moreover, importantly, with distributed heating, the SRFs sustain relatively much higher Nu values or heat transport throughout the bulk fluids, unlike those in the case of localized heating, as seen in Figure 15.

6.3. Effect of the Dynamic Viscosity Ratio ( μ ˜ ) on the Two-Layer Flow of SRFs for the Case of Distributed Heating ( L q / H = 1 )

Next, we conduct a further investigation into the effect of the dimensionless viscosity ratio ( μ ˜ = μ a / μ b ) on the temperature profiles and velocity field components in thermocapillary convection in SRFs. As we change μ ˜ fro 1.0 , we maintain the other parameters as fixed, i.e., set k ˜ = 1 , M 1 = 0 , and M 2 = 1 . Two typical alternatives are then considered: μ ˜ = 0.5 and 2.0 . The streamline and isotherm profiles for the distributed heating situation ( L q / H = 1 ) , where the dimensional heat flux is Q = 0.01 for μ ˜ = 0.5 , are displayed in Figure 18. For μ ˜ = 2.0 , Figure 19 displays a figure similar to this one. It is evident that the SRF viscosities have a significant impact on the thermocapillary convection’s strength. Higher peak thermocapillary velocities generated by surface-tension force variations under temperature excursions are associated with greater exchanges of momentum transfer between the layers of the bottom fluid and the interface, specifically if the bottom fluid layer is more viscous than the top fluid layer or μ ˜ > 1 . Moreover, when there is a contrast in the viscosities between the bottom and top layer, i.e., when μ ˜ 1 , strikingly larger interfacial deformations occur when compared to the baseline case with μ ˜ = 1 : When μ ˜ = 0.5 , i.e., the bottom fluid is less viscous than the top fluid, the latter is pushed upward on the right side of the enclosure relative to the initially flat interfacial configuration; this is due to the larger pressure differences generated across the interfaces under greater capillary force variations. By contrast, with μ ˜ = 2 , the top fluid layer is significantly squeezed up near the heated (left) vertical wall, with a concomitant distortion in the temperature field.

6.4. Effect of the Thermal Conductivity Ratio ( k ˜ ) on the Two-Layer Flow of SRFs for the Case of Distributed Heating ( L q / H = 1 )

Next, we study the effect of the thermal conductivity ratio ( k ˜ = k a / k b ) on the streamline and isotherm profiles in thermocapillary convection in SRFs at a fixed μ ˜ = 1 . Setting μ ˜ = 1 , M 1 = 0 , and M 2 = 1 is the first step in this process. We then vary k ˜ in two representative cases, i.e., k ˜ = 0.5 and 2.0 . Figure 20 shows the streamline and isotherm profiles for the case of distributed heating ( L q / H = 1 ) , where the dimensional heat flux is Q = 0.01 for k ˜ = 0.5 . A similar plot is shown in Figure 21 for k ˜ = 2.0 .
Initially, looking at the isotherms, we observe that k ˜ significantly alters the temperature distribution within the SRF layers. For k ˜ = 1 , the temperature contours have a symmetric structure in the direction perpendicular to the interface (see Figure 14). Higher-temperature fields appear on the lower fluid layer when it is significantly less conducting than the top fluid layer (i.e., k ˜ = 0.5 ), as shown in Figure 20. By contrast, we observe the opposite behavior when the top fluid layer is significantly less conducting than the bottom fluid layer (i.e., k ˜ = 2 ), as indicated in Figure 21. Moreover, the fluids are generally heated to higher temperatures when k ˜ = 2 when compared to the k ˜ = 0.5 case.
More significantly, the magnitude of the thermocapillary flow fields is significantly influenced by the thermal conductivity ratio. By comparing the streamline plot in Figure 21 (for k ˜ = 2.0 ) with the corresponding plot in Figure 20 (for k ˜ = 0.5 ), where the gray color in the color bar represents the magnitude of the Marangoni convection’s velocity, one can observe that the Marangoni velocities are higher for the former case when compared to the latter. This indicates that the thermocapillary velocity currents are significantly increased when the bottom fluid is thermally more conducting, i.e., when k ˜ > 1.0 . This results from the fact that when k ˜ < 1.0 , the bottom fluid layer’s thermal conductivity is substantially higher than that of the top fluid layer, enhancing heat diffusion to the interface and creating a relatively larger surface-tension-gradient-induced fluid layer. In summary, it is found that the thermal conductivity ratio has significant influences on the thermocapillary flow and temperature fields and their magnitudes in SRF layers, with more conductive bottom fluids increasing the flow strengths.

6.5. Effects of the Dimensionless Sensitivity Coefficients of the Surface Tension ( M 1 and M 2 ) and Dimensionless Heat Flux (Q) on the Magnitude of the Normalized Peak Interfacial Thermocapillary Velocity ( U p )

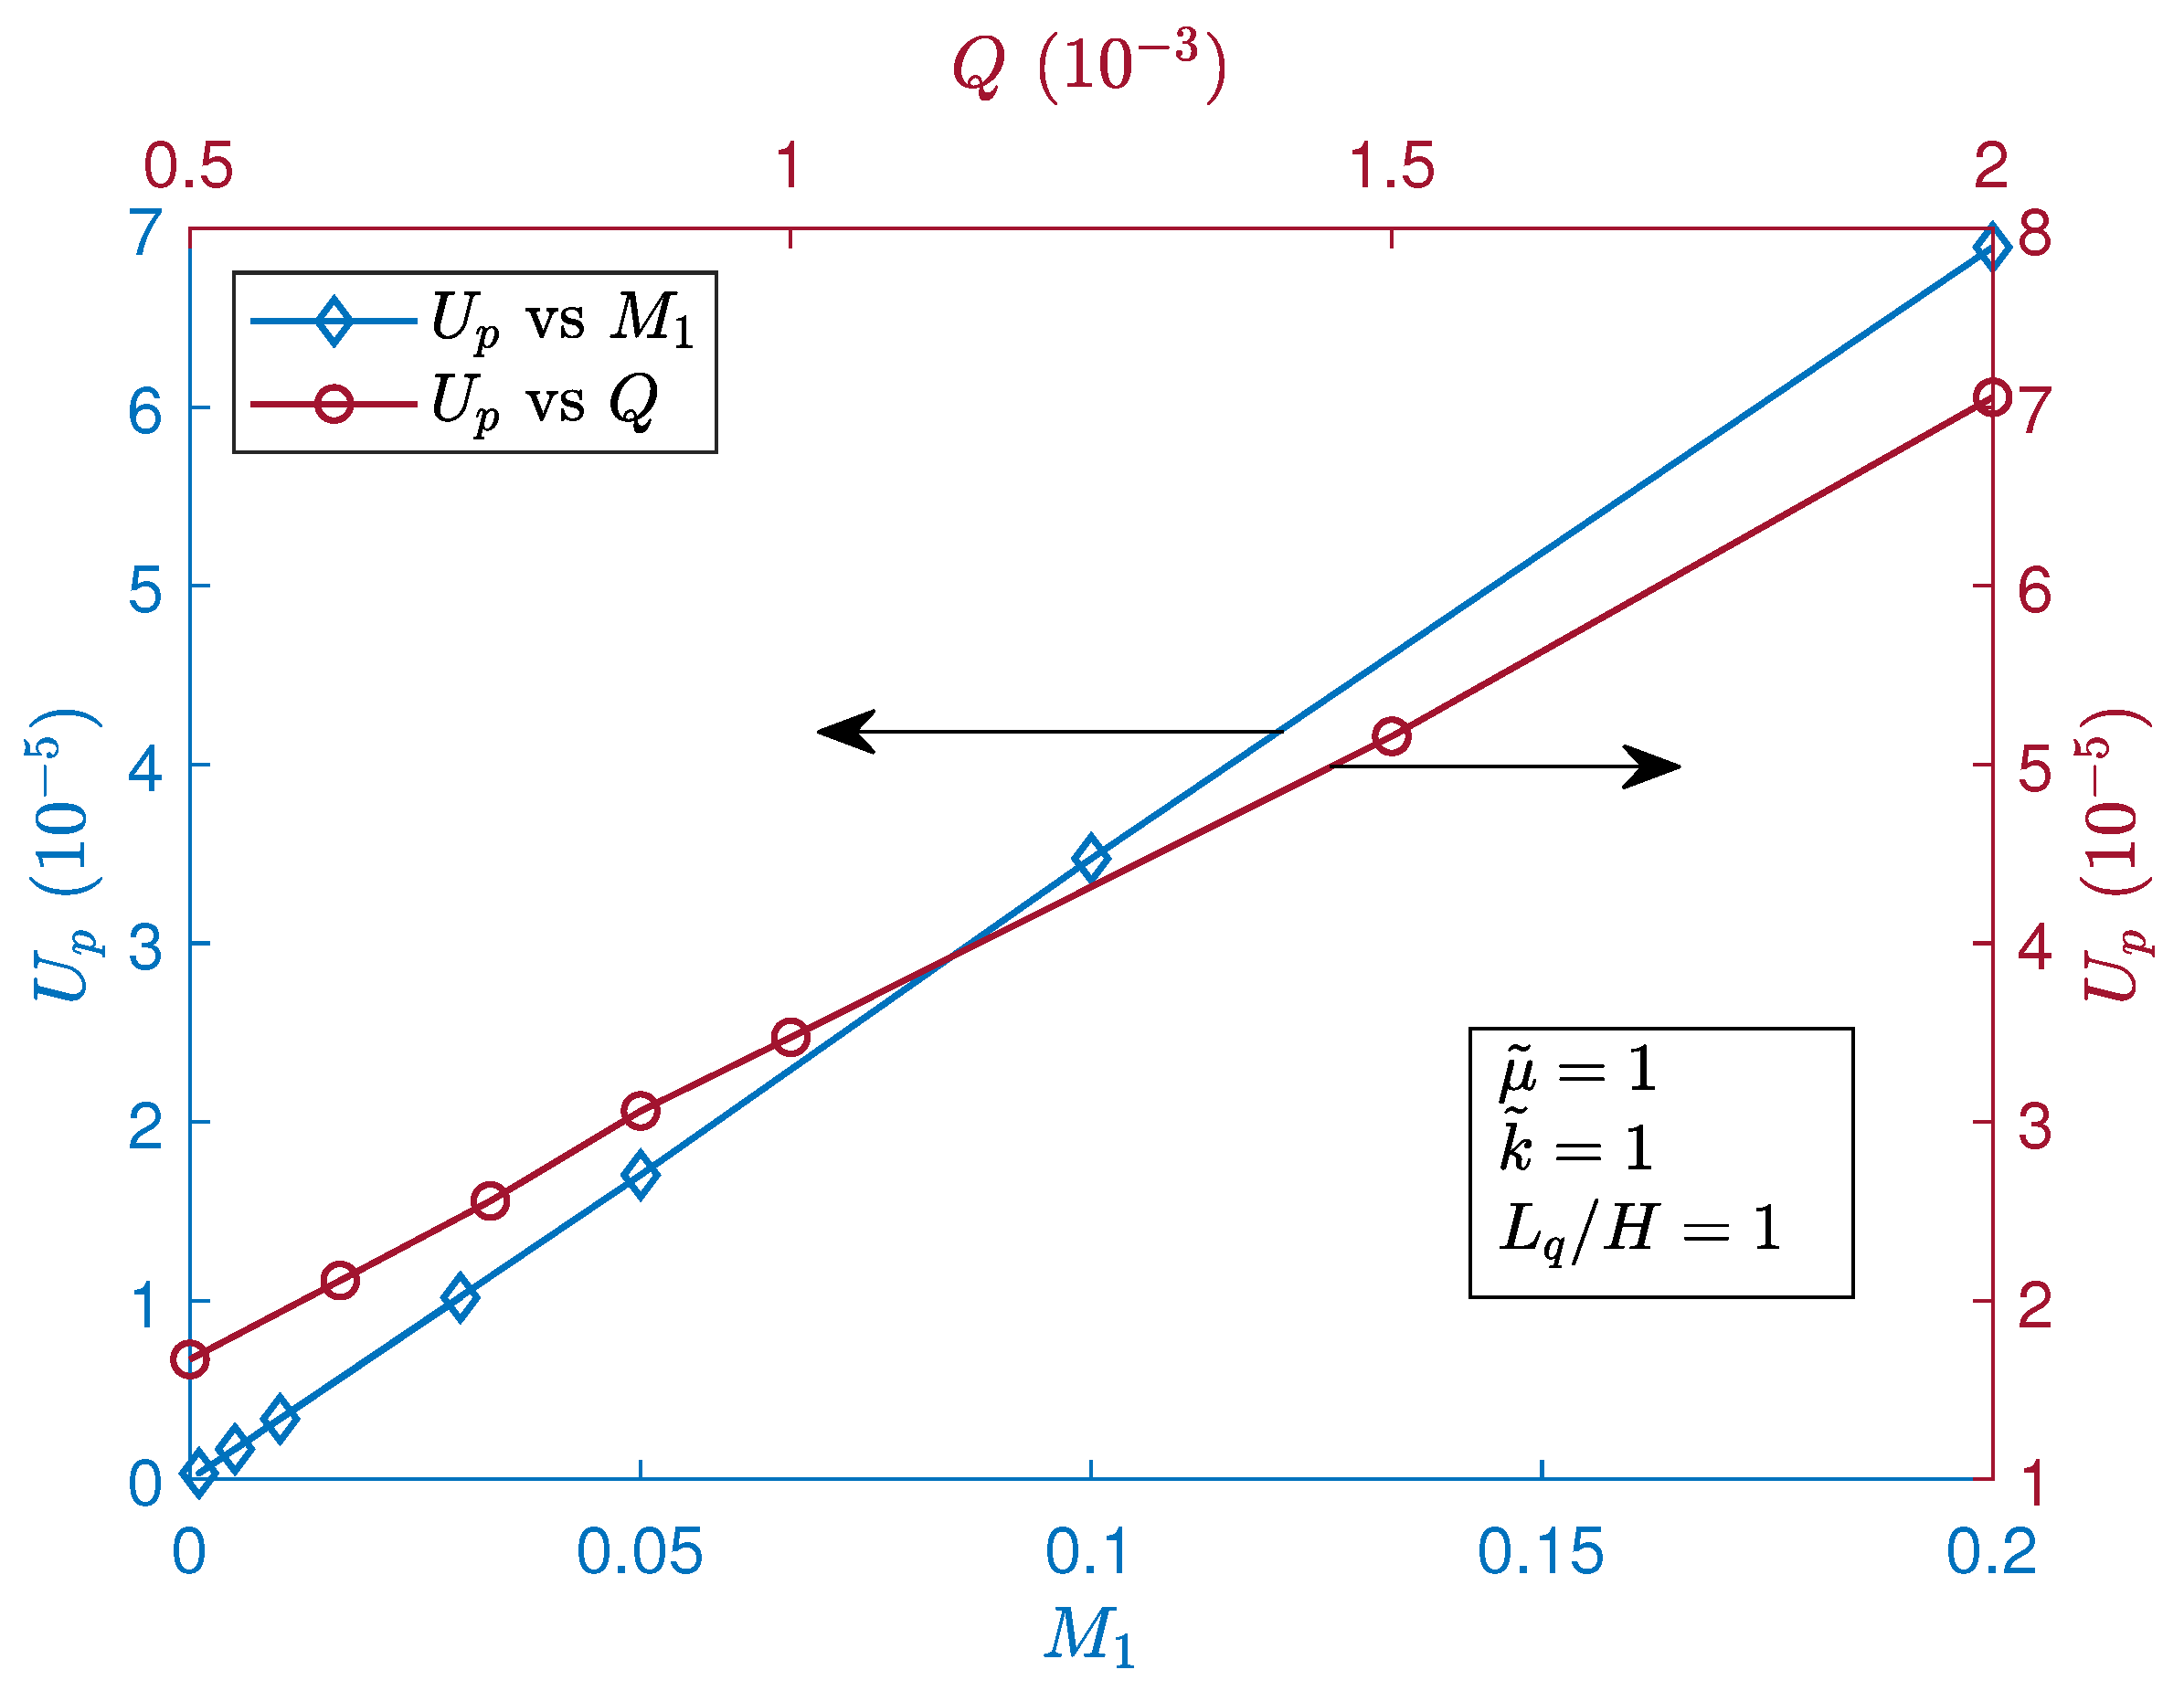
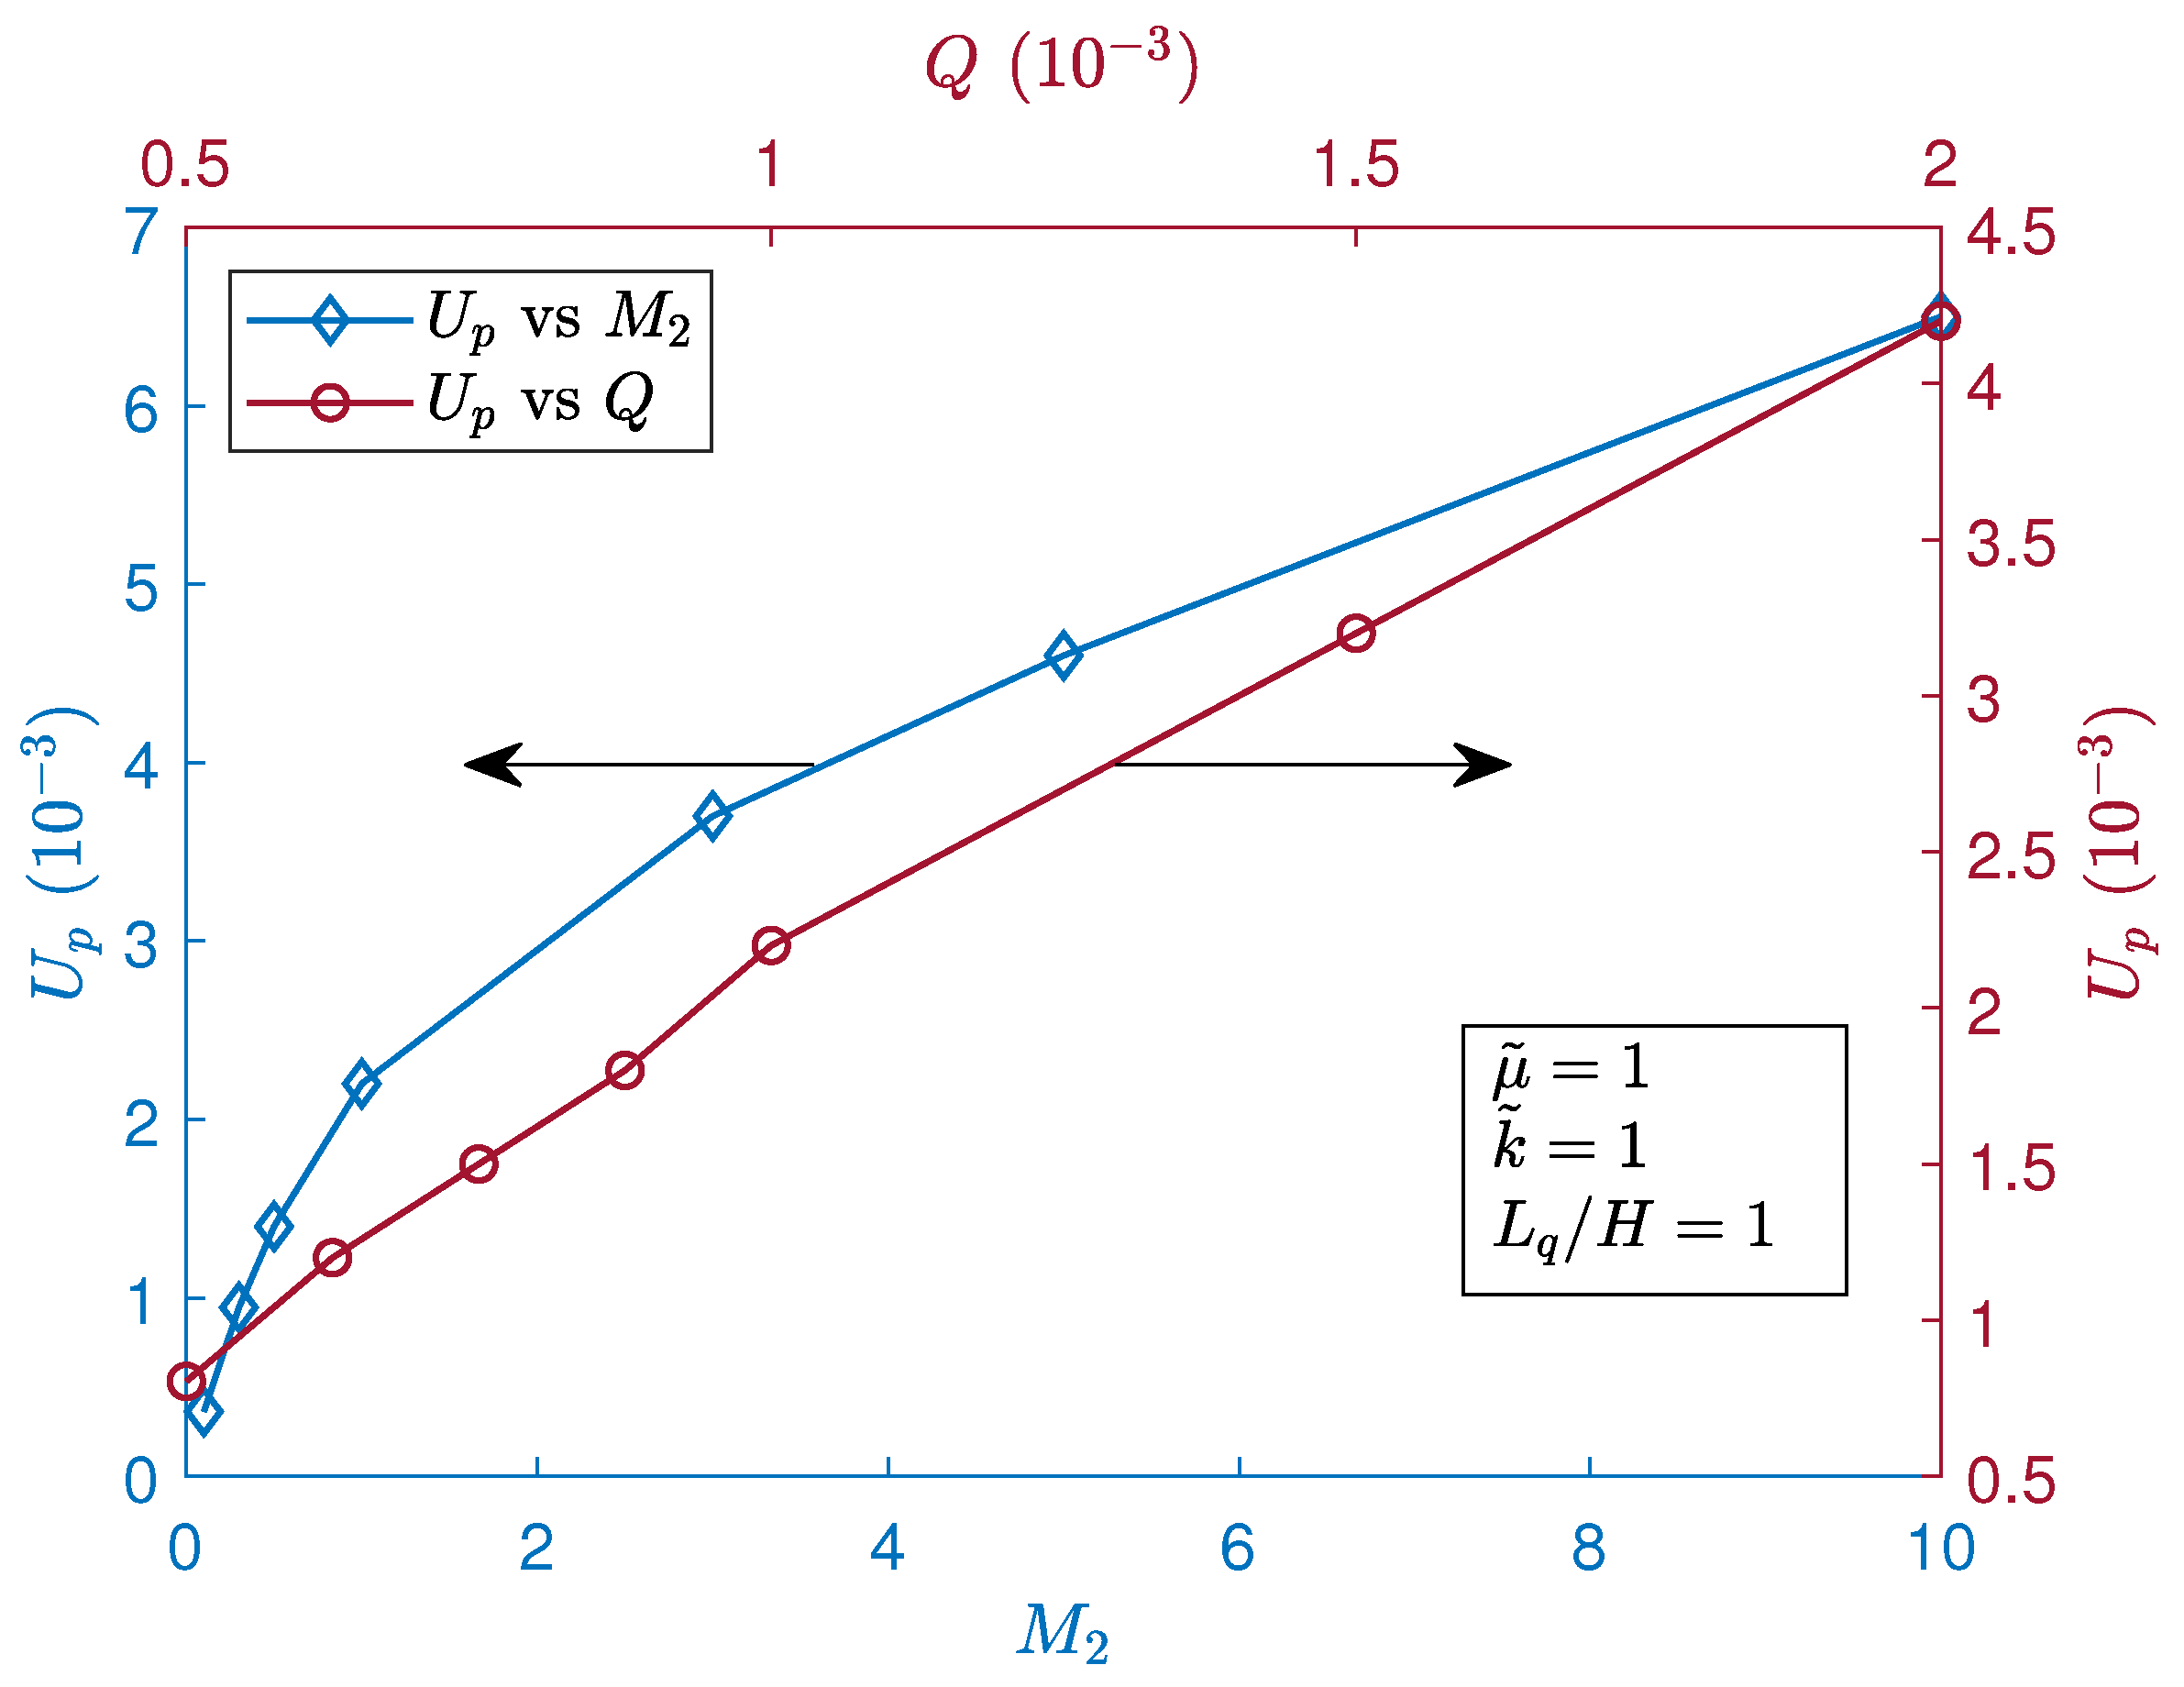
The effects of the dimensionless linear and quadratic coefficients, M 1 and M 2 , respectively, on the peak interfacial thermocapillary velocity ( U p ) for the dimensionless heat flux ( Q = 0.01 ) at fixed k ˜ = 1 and μ ˜ = 1 are then shown by the blue lines in Figure 22 and Figure 23, respectively. These coefficients are defined based on σ T and σ T T (see Equation (5)). It appears that the strength of the Marangoni velocity is increased with increasing either M 1 or M 2 . The reason for this is that the effects of the sensitivities of the surface tension on the temperature are represented by M 1 and M 2 . The Marangoni stresses or surface tension gradient at the interface increase with the increasing magnitude of these parameters, and this is shown as higher peak velocities in the thermocapillary flow. Moreover, we observed a similar behavior for the effects of the dimensionless heat flux (Q) on the peak thermocapillary velocity ( U p ) observed at fixed k ˜ = 1 and μ ˜ = 1 , which is indicated by the red lines, where M 1 = 0.1 and M 2 = 0 in Figure 22 and M 1 = 0 and M 2 = 1 in Figure 23. The stronger the magnitude of the imposed heat flux (Q), the greater the magnitude of the Marangoni convection currents.

6.6. Effects of the Thermal Conductivity Ratio ( k ˜ ) and Dynamic Viscosity Ratio ( μ ˜ ) on the Magnitude of the Normalized Peak Interfacial Thermocapillary Velocity ( U p ) in SRFs

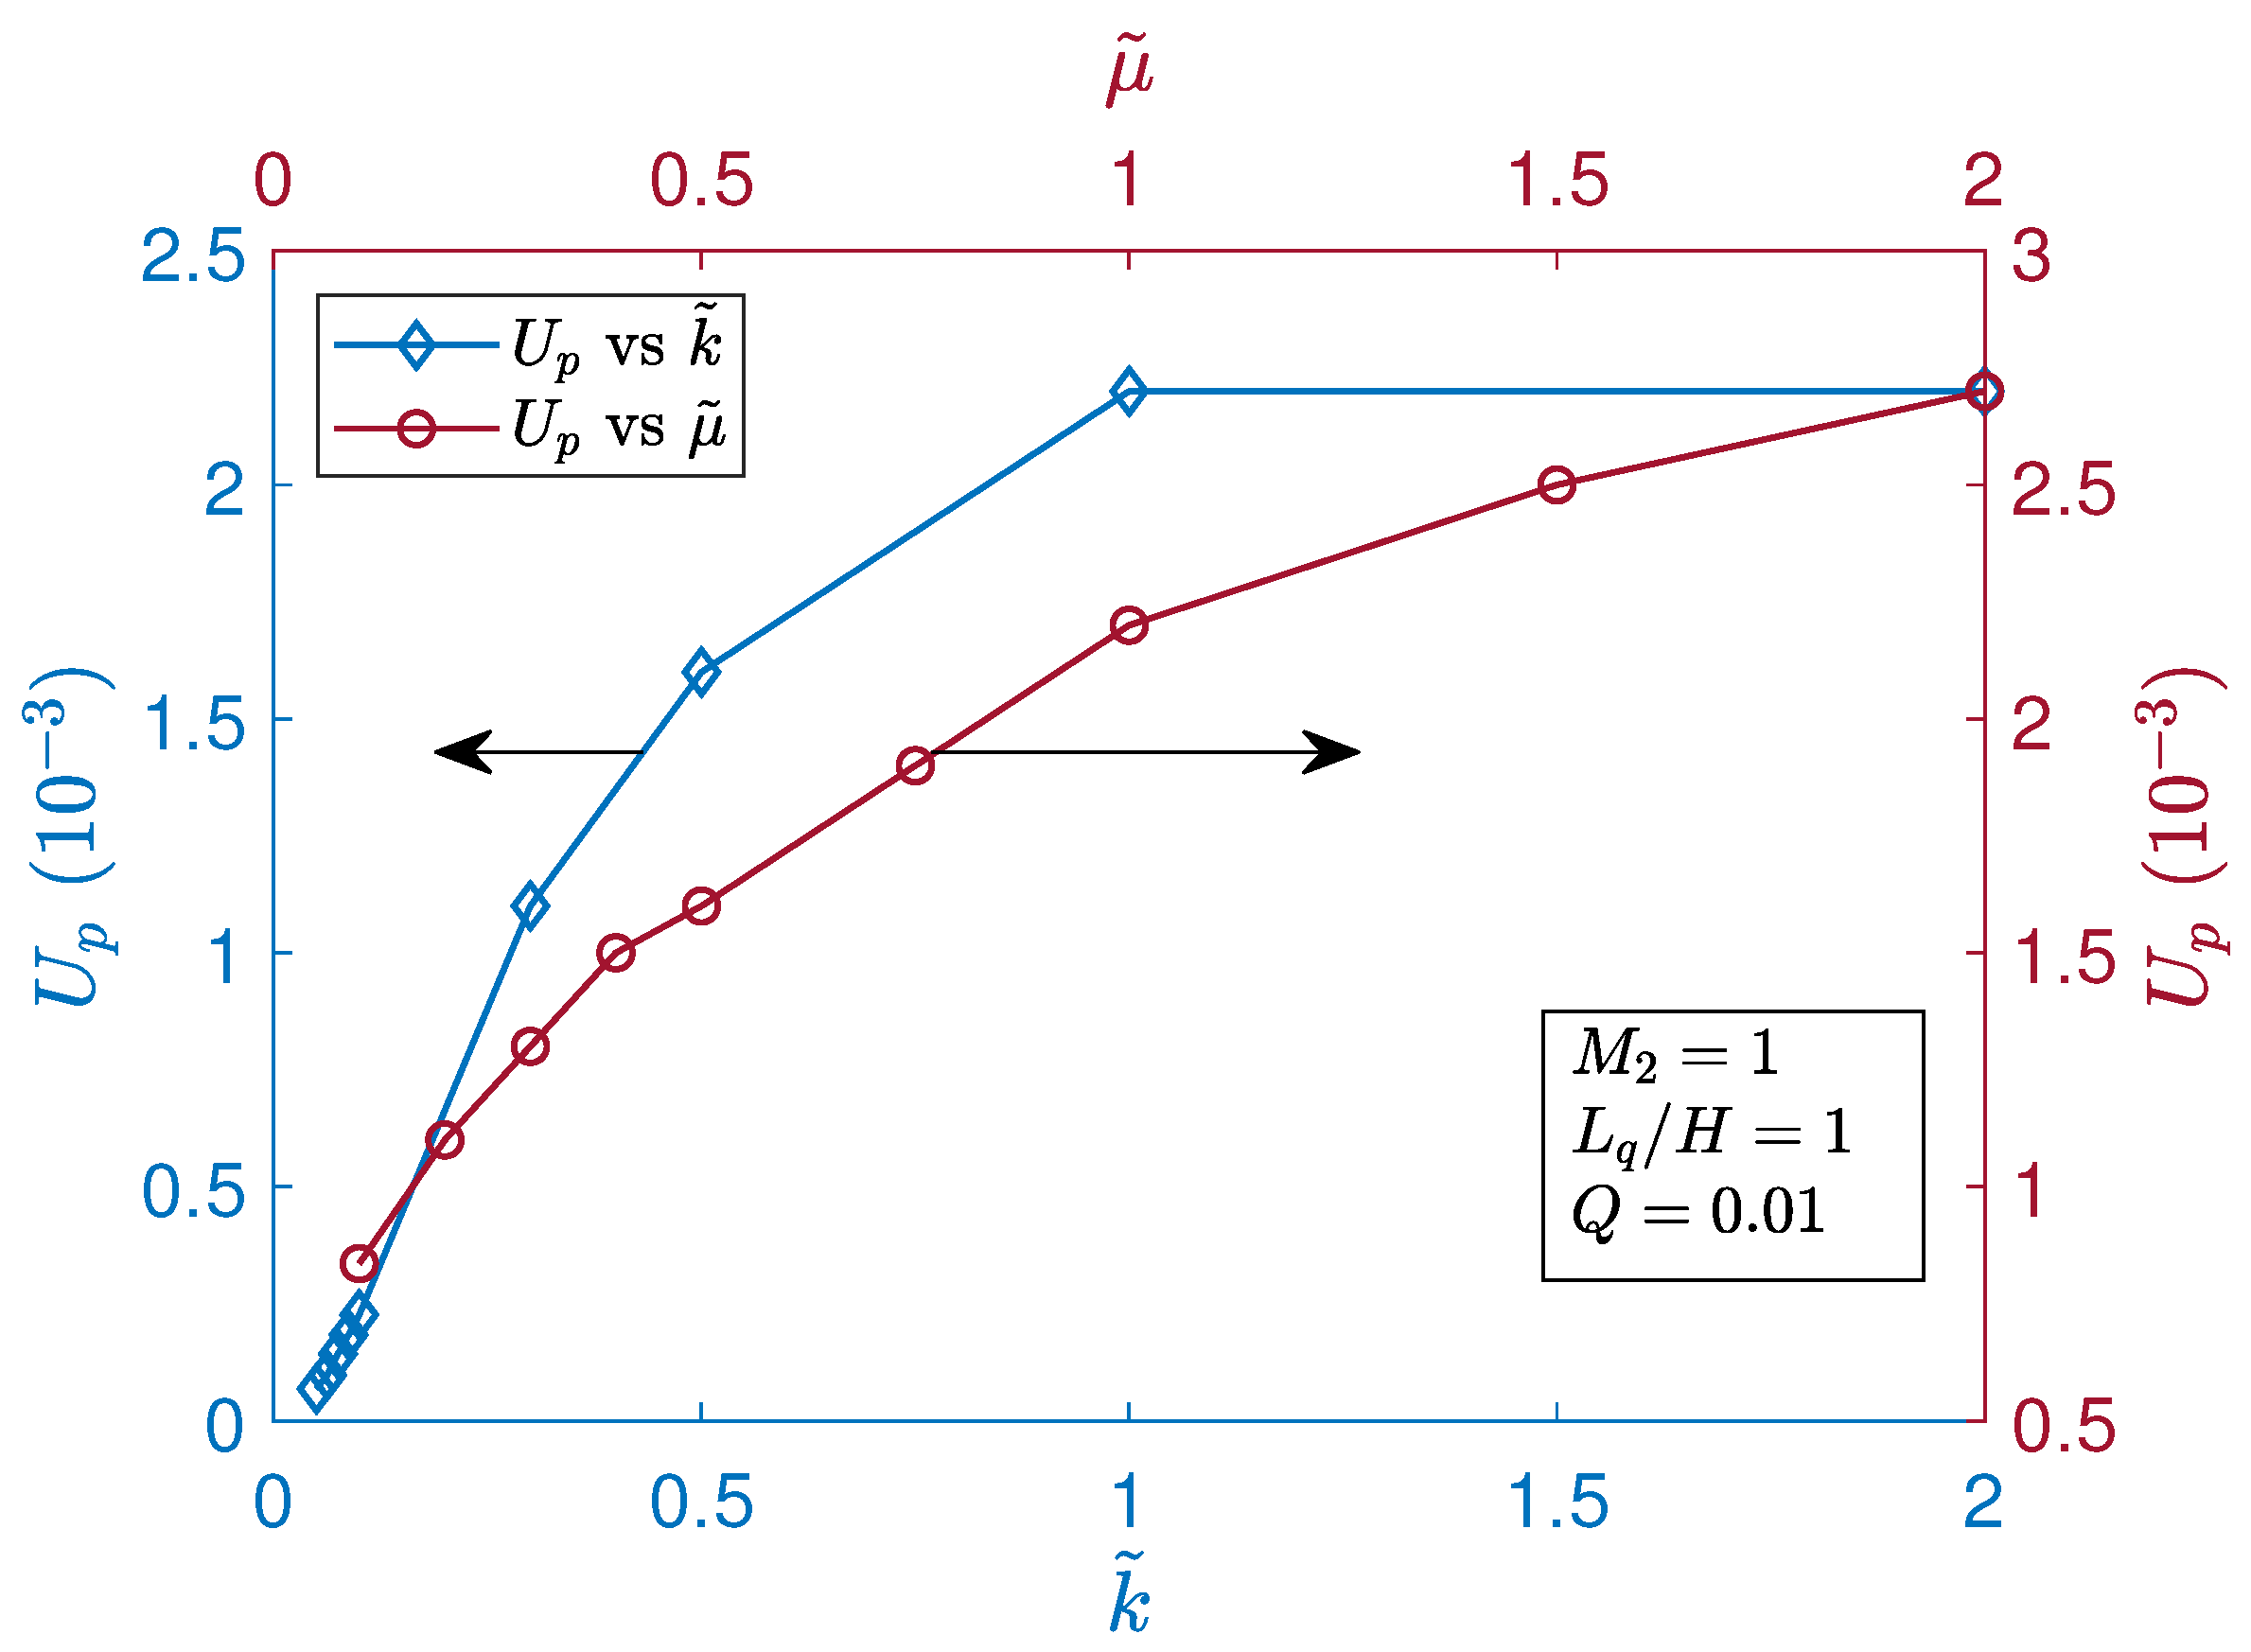
Figure 24 illustrates the effects of both the thermal conductivity ratio ( k ˜ ) and viscosity ratio ( μ ˜ ) on the maximum interfacial thermocapillary velocity in the SRF layer when M 2 = 1 , L q / H = 1 , and Q = 0.01 . In general, as the bottom fluid is either more viscous or more thermally conductive than the top fluid, i.e., μ ˜ > 1.0 or k ˜ > 1.0 , stronger thermocapillary convection currents are generated when compared to the μ ˜ 1.0 or k ˜ 1.0 case. As such, it is found that there is a monotonic increase in the peak thermocapillary velocity with increasing μ ˜ and k ˜ .

6.7. Effects of Localized Heating L q / H = 0.1 Versus Distributed Heating L q / H = 1 on the Magnitude of the Normalized Peak Interfacial Thermocapillary Velocity ( U p ) in SRFs

Finally, Figure 25 illustrates the impacts of varying the dimensionless characteristic width of the heat flux distribution ( L q / H ) on the peak interfacial thermocapillary velocity ( U p ). The analysis is conducted for a dimensionless heat flux of Q = 0.01 and a dimensionless quadratic surface tension coefficient of M 2 = 1 while maintaining the thermal conductivity ratio ( k ˜ = 1 ) and the viscosity ratio ( μ ˜ = 1 ). The results demonstrate that as L q / H increases, the peak interfacial thermocapillary velocity ( U p ) also increases, leading to a stronger Marangoni convection effect. The growth rate of U p is initially rapid but begins to plateau beyond a certain threshold. Specifically, when the entire surface is subjected to heating ( L q / H = 1 ), the velocity exhibits only a marginal increase compared to cases where approximately 70 % of the surface is heated. This suggests that beyond a certain level of heat distribution, the system reaches a saturation point, where the additional spatial distribution of the heating has a diminishing effect on thermocapillary convection. This is an indication that the SRFs have a stronger tendency to promote thermocapillary flow at the interface by creating larger surface tension gradients or higher Marangoni stresses.

7. Summary and Conclusions

One of the primary forces behind interfacial transport phenomena in fluids is surface tension, a temperature-dependent characteristic. The self-rewetting fluids (SRFs) show anomalous nonlinear (quadratic) dependence of the surface tension on the temperature, with a minimum and including a positive gradient, in contrast to normal fluids (NFs). Consequently, they are associated with several favorable features, such as fluid motions at interfaces toward regions of high temperature, which may be utilized in a variety of technologies, such as microfluidic devices and low-gravity environments.
In order to model thermocapillary convection in SRFs, we have devised a robust numerical approach in this study that is based on central-moment lattice Boltzmann (LB) techniques for interfacial tracking based on a conservative Allen–Cahn equation, two-fluid motion, and energy transport. This computational method was used to investigate thermocapillary convection in SRF layers with deformable interfaces enclosed within a cavity subject to a spatially varying heat flux on its left wall surface. It is shown that effect of the magnitude of the quadratic coefficient of the surface tension on temperature-dependent SRFs affects the strength of the thermocapillary velocities. The effects of the relevant parameters, such as the dynamic viscosity ratio ( μ ˜ ), thermal conductivity ratio ( k ˜ ), dimensionless heat flux (Q), heat flux distribution parameter ( L q / H ), and dimensionless surface tension linear and quadratic sensitivity coefficients ( M 1 and M 2 ), on the magnitude of the thermocapillary convection of the 2D square cavity are investigated. The numerical simulation indicates a major difference in the thermocapillary flow pattern between NFs and SRFs: In SRFs, the fluids at the interface strive to move toward the hotter region at the interface located at the center of the domain, which is contrary to that in NFs. Additionally, the thermocapillary convection currents are observed to be stronger if the viscosity or thermal conductivity of the bottom fluid layer is higher than that of the top fluid layer. In other words, the flow intensities in the two liquid layers increase with increasing dynamic viscosity ratio, μ ˜ , with a fixed dynamic viscosity in the liquid’s top layer. Interfacial deformation is correlated with the ratio of the physical properties of the two liquid layers. The dynamic viscosity ratio affects the interfacial deformation significantly, but the thermal conductivity ratio has less of an effect. It is found that the peak interfacial thermocapillary velocity ( U p ) is increased by increasing the imposed heat flux parameters, viz., Q or L q / H , and thus enhances the Marangoni convection inside the enclosure. Furthermore, higher thermocapillary velocities are seen to be associated with higher magnitudes of the surface tension coefficients, which generate stronger Marangoni stresses at the interface. In addition, the nonlinear thermocapillary effects result in a significant redistribution of the Nusselt numbers or the heat transfer rates from the interface to the SRF layers.
This study has investigated the roles of surface tension gradient effects under temperature variations in an SRF on the resulting Marangoni or thermocapillary convection in a square enclosure under the zero-gravity assumption, where such effects are more pronounced, so that the resulting phenomena can be systematically studied without interference from other forces. As such, this can serve as a reference and a basis for comparison when other effects are included. For example, in general situations, the buoyancy effects come into play, and the combined buoyancy–Marangoni effects can be studied by including such an additional force in our LB-modeling framework. Studying the coupled Benard–Marangoni convection of SRFs in enclosures, for various Rayleigh numbers and M 2 , will be an interesting topic for further investigation in a future study.

Author Contributions

Conceptualization, K.N.P.; methodology, K.N.P., B.E. and W.S.; software, B.E. and W.S.; validation, B.E. and W.S.; formal analysis, K.N.P. and B.E.; investigation, B.E. and W.S.; resources, K.N.P.; data curation, B.E.; writing—original draft preparation, K.N.P. and B.E.; writing—review and editing, K.N.P. and B.E.; visualization, B.E. and W.S.; supervision, K.N.P.; project administration, K.N.P.; funding acquisition, K.N.P. All authors have read and agreed to the published version of the manuscript.

Funding

The authors would like to acknowledge the support of the US National Science Foundation (NSF) for Research under Grant CBET-1705630. The third author would also like to thank the NSF for support for the development of a computer cluster (`Alderaan’), hosted at the Center for Computational Mathematics at the University of Colorado Denver, under Grant OAC-2019089 (Project “CC* Compute: Accelerating Science and Education by Campus and Grid Computing”), which was used in performing the simulations.

Data Availability Statement

The original contributions presented in this study are included in the article. Further inquiries can be directed to the corresponding author.

Conflicts of Interest

The authors declare no conflicts of interest.

References

  1. Zhong, Y.; Zhuo, Y.; Wang, Z.; Sha, Y. Marangoni convection induced by simultaneous mass and heat transfer during evaporation of n-heptane/ether binary liquid mixture. Int. J. Heat Mass Transf. 2017, 108, 812–821. [Google Scholar] [CrossRef]
  2. Ma, H.B.; Wilson, C.; Borgmeyer, B.; Park, K.; Yu, Q.; Choi, S.U.S.; Tirumala, M. Effect of nanofluid on the heat transport capability in an oscillating heat pipe. Appl. Phys. Lett. 2006, 88, 143116. [Google Scholar] [CrossRef]
  3. Sha, Y.; Li, Z.; Wang, Y.; Huang, J. The Marangoni convection induced by acetone desorption from the falling soap film. Heat Mass Transf. 2012, 48, 749–755. [Google Scholar] [CrossRef]
  4. Toolan, D.T.; Pullan, N.; Harvey, M.J.; Topham, P.D.; Howse, J.R. In situ studies of phase separation and crystallization directed by Marangoni instabilities during spin-coating. Adv. Mater. 2013, 25, 7033–7037. [Google Scholar] [CrossRef]
  5. Barash, L.Y. Marangoni convection in an evaporating droplet: Analytical and numerical descriptions. Int. J. Heat Mass Transf. 2016, 102, 445–454. [Google Scholar] [CrossRef]
  6. Young, N.O.; Goldstein, J.S.; Block, M.J. The motion of bubbles in a vertical temperature gradient. J. Fluid Mech. 1959, 6, 350–356. [Google Scholar] [CrossRef]
  7. Arbin, N.; Suhaimi, N.S.; Hashim, I. Simulation on double-diffusive Marangoni convection with the presence of entropy generation. Indian J. Sci. Technol. 2016, 9, 1–5. [Google Scholar] [CrossRef]
  8. Bobach, B.; Boman, R.; Celentano, D.; Terrapon, V.E.; Ponthot, J. Simulation of the Marangoni effect and phase change using the particle finite element method. Appl. Sci. 2021, 11, 11893. [Google Scholar] [CrossRef]
  9. Saidi, M.H.; Asadi, B.; Ahmadi, G. Computational simulation of Marangoni convection under microgravity condition. Sci. Iran. 2009, 16, 513–524. [Google Scholar]
  10. Mitchell, T.R.; Majidi, M.; Rahimian, M.H.; Leonardi, C.R. Computational modeling of three-dimensional thermocapillary flow of recalcitrant bubbles using a coupled lattice boltzmann-finite difference method. Phys. Fluids 2021, 33, 032108. [Google Scholar] [CrossRef]
  11. Holzer, M.; Mitchell, T.R.; Leonardi, C.R.; Rüde, U. Development of a central-moment phase-field lattice boltzmann model for thermocapillary flows: Droplet capture and computational performance. J. Comput. Phys. 2024, 518, 113337. [Google Scholar] [CrossRef]
  12. Elbousefi, B.; Schupbach, W.; Premnath, K.N.; Welch, S.W.J. Investigation of surfactant-laden bubble migration dynamics in self-rewetting fluids using lattice boltzmann method. Phys. Fluids 2024, 36, 112106. [Google Scholar] [CrossRef]
  13. Yan, H.; Wang, L.; Huang, J.; Yu, Y. Thermocapillary migration of a self-rewetting droplet on an inclined surface: A phase-field simulation. Appl. Therm. Eng. 2025, 263, 125345. [Google Scholar] [CrossRef]
  14. Elbousefi, B.; Schupbach, W.; Premnath, K.N.; Welch, S.W.J. Thermocapillary convection in superimposed layers of self-rewetting fluids: Analytical and lattice boltzmann computational study. Int. J. Heat Mass Transf. 2023, 208, 124049. [Google Scholar] [CrossRef]
  15. Majidi, M.; Haghani-Hassan-Abadi, R.; Rahimian, M. Single recalcitrant bubble simulation using a hybrid lattice boltzmann finite difference model. Int. J. Multiph. Flow 2020, 127, 103289. [Google Scholar] [CrossRef]
  16. Scherr, R.; Markl, M.; Körner, C. Volume of fluid based modeling of thermocapillary flow applied to a free surface lattice boltzmann method. J. Comput. Phys. 2023, 492, 112441. [Google Scholar] [CrossRef]
  17. Zhang, J.; Sekimoto, A.; Okano, Y.; Dost, S. Numerical simulation of thermal-solutal marangoni convection in a shallow rectangular cavity with mutually perpendicular temperature and concentration gradients. Phys. Fluids 2020, 32, 102108. [Google Scholar] [CrossRef]
  18. Cicek, K.; Baytas, A. A numerical study of combined natural and Marangoni convection in a square cavity. Transnav Int. J. Mar. Navig. Saf. Sea Transp. 2009, 3, 173–178. [Google Scholar]
  19. del Arco, E.C.; Extremet, G.P.; Sani, R.L. Thermocapillary convection in a two-layer fluid system with flat interface. Adv. Space Res. 1991, 11, 129–132. [Google Scholar] [CrossRef]
  20. Ciccotosto, B.E.; Brooks, C.S. Free surface motion of a liquid pool with isothermal sidewalls as a benchmark for Marangoni convection problems. Energies 2023, 16, 6824. [Google Scholar] [CrossRef]
  21. Ma, C.; Bothe, D. Direct numerical simulation of thermocapillary flow based on the volume of fluid method. Int. J. Multiph. Flow 2011, 37, 1045–1058. [Google Scholar] [CrossRef]
  22. Abir, F.M.; Barua, S.; Barua, S.; Saha, S. Numerical analysis of Marangoni effect on natural convection in two-layer fluid structure inside a two-dimensional rectangular cavity. Aip Conf. Proc. 2019, 2121, 030025. [Google Scholar]
  23. Zhou, X.; Chi, F.; Jiang, Y.; Chen, Q. Moderate Prandtl number nanofluid thermocapillary convection instability in rectangular cavity. Microgravity Sci. Technol. 2022, 34, 24. [Google Scholar] [CrossRef]
  24. Chen, C.; Feng, S.; Peng, H.; Peng, X.; Chaoyue, L.; Zhang, R. Thermocapillary convection flow and heat transfer characteristics of graphene nanoplatelet based nanofluid under microgravity. Microgravity Sci. Technol. 2021, 33, 40. [Google Scholar] [CrossRef]
  25. Chang, Q.; Alexander, J.I.D. Application of the lattice boltzmann method to two-phase rayleigh–benard convection with a deformable interface. J. Comput. Phys. 2006, 212, 473–489. [Google Scholar] [CrossRef]
  26. Kaba, S.; Cheddadi, A.; Achoubir, K.; Semma, A. Numerical simulation by a lattice Boltzmann method of fluid flow and heat transfer characteristics in a discreetly heated cavity containing water near its density maximum. Phys. Fluids 2022, 34, 093611. [Google Scholar] [CrossRef]
  27. Saleh, H.; Hashim, I. Buoyant Marangoni convection of nanofluids in square cavity. Appl. Math. Mech. 2015, 36, 1169–1184. [Google Scholar] [CrossRef]
  28. Mohamad, A.A.; Bennacer, R.; El-Ganaoui, M. Double dispersion, natural convection in an open end cavity simulation via lattice Boltzmann method. Int. J. Therm. Sci. 2010, 49, 1944–1953. [Google Scholar] [CrossRef]
  29. Xie, H.; Zeng, Z.; Zhang, L.; Lu, Y. Lattice Boltzmann simulation of the thermocapillary flow in an annular two liquid layers system with deformable interface. Int. Commun. Heat Mass Transf. 2015, 68, 78–84. [Google Scholar] [CrossRef]
  30. Vochten, R.; Petre, G. Study of the heat of reversible adsorption at the air-solution interface. ii. experimental determination of the heat of reversible adsorption of some alcohols. J. Colloid Interface Sci. 1973, 42, 320–327. [Google Scholar] [CrossRef]
  31. Petre, G.; Azouni, M.A. Experimental evidence for the minimum of surface tension with temperature at aqueous alcohol solution/air interfaces. J. Colloid Interface Sci. 1984, 98, 261–263. [Google Scholar] [CrossRef]
  32. Limbourg-Fontaine, M.C.; Pétré, G.; Legros, J.C. Thermocapillary movements under microgravity at a minimum of surface tension. Naturwissenschaften 1986, 73, 360–362. [Google Scholar] [CrossRef]
  33. Villers, D.; Platten, J.K. Temperature dependence of the interfacial tension between water and long-chain alcohols. J. Phys. Chem. 1988, 92, 4023–4024. [Google Scholar] [CrossRef]
  34. Abe, Y.; Iwasaki, A.; Tanaka, K. Microgravity experiments on phase change of self-rewetting fluids. Ann. N. Y. Acad. Sci. 2004, 1027, 269–285. [Google Scholar] [CrossRef]
  35. Abe, Y. Terrestrial and microgravity applications of self-rewetting fluids. Microgravity Sci. Technol. 2007, 19, 11–12. [Google Scholar] [CrossRef]
  36. Zaaroura, I.; Harmand, S.; Carlier, J.; Toubal, M.; Fasquelle, A.; Nongaillard, B. Thermal performance of self-rewetting gold nanofluids: Application to two-phase heat transfer devices. Int. J. Heat Mass Transf. 2021, 174, 121322. [Google Scholar] [CrossRef]
  37. Savino, R.; Cecere, A.; Paola, R.D. Surface tension-driven flow in wickless heat pipes with self-rewetting fluids. Int. J. Heat Fluid Flow 2009, 30, 380–388. [Google Scholar] [CrossRef]
  38. Savino, R.; Cecere, A.; Vaerenbergh, S.V.; Abe, Y.; Pizzirusso, G.; Tzevelecos, W.; Mojahed, M.; Galand, Q. Some experimental progresses in the study of self-rewetting fluids for the SELENE experiment to be carried in the thermal platform 1 hardware. Acta Astronaut. 2013, 89, 179–188. [Google Scholar] [CrossRef]
  39. Hu, Y.; Liu, T.; Li, X.; Wang, S. Heat transfer enhancement of micro oscillating heat pipes with self-rewetting fluid. Int. J. Heat Mass Transf. 2014, 70, 496–503. [Google Scholar] [CrossRef]
  40. Wu, S.; Lee, T.; Lin, W.; Chen, Y. Study of self-rewetting fluid applied to loop heat pipe with PTFE wick. Appl. Therm. Eng. 2017, 119, 622–628. [Google Scholar] [CrossRef]
  41. Cecere, A.; Cristofaro, D.D.; Savino, R.; Ayel, V.; Sole-Agostinelli, T.; Marengo, M.; Romestant, C.; Bertin, Y. Experimental analysis of a flat plate pulsating heat pipe with self-rewetting fluids during a parabolic flight campaign. Acta Astronaut. 2018, 147, 454–461. [Google Scholar] [CrossRef]
  42. Zhu, M.; Huang, J.; Song, M.; Hu, Y. Thermal performance of a thin flat heat pipe with grooved porous structure. Appl. Therm. Eng. 2020, 173, 115215. [Google Scholar] [CrossRef]
  43. Abe, Y. Self-rewetting fluids: Beneficial aqueous solutions. Ann. N. Y. Acad. Sci. 2006, 1077, 650–667. [Google Scholar] [CrossRef]
  44. Chaurasiya, V.K.; Tripathi, R.; Singh, R. On the solutal and thermal Marangoni convection arising in the self-rewetting fluid flow under hydromagnetic consideration. Sci. Iran. 2024, 31, 1007–1019. [Google Scholar] [CrossRef]
  45. Hajabdollahi, F.; Premnath, K.N.; Welch, S.W.J. Central moment lattice Boltzmann method using a pressure-based formulation for multiphase flows at high density ratios and including effects of surface tension and Marangoni stresses. J. Comput. Phys. 2021, 425, 109893. [Google Scholar] [CrossRef]
  46. Chiu, P.; Lin, Y. A conservative phase field method for solving incompressible two-phase flows. J. Comput. Phys. 2011, 230, 185–204. [Google Scholar] [CrossRef]
  47. Sun, Y.; Beckermann, C. Sharp interface tracking using the phase-field equation. J. Comput. Phys. 2007, 220, 626–653. [Google Scholar] [CrossRef]
  48. Folch, R.; Casademunt, J.; Hernández-Machado, A.; Ramirez-Piscina, L. Phase-field model for Hele-Shaw flows with arbitrary viscosity contrast. i. theoretical approach. Phys. Rev. E 1999, 60, 1724. [Google Scholar] [CrossRef]
  49. Brackbill, J.U.; Kothe, D.B.; Zemach, C. A continuum method for modeling surface tension. J. Comput. Phys. 1992, 100, 335–354. [Google Scholar] [CrossRef]
  50. Kumar, A. Isotropic finite-differences. J. Comput. Phys. 2004, 201, 109–118. [Google Scholar] [CrossRef]
  51. Geier, M.; Greiner, A.; Korvink, J.G. Cascaded digital lattice Boltzmann automata for high reynolds number flow. Phys. Rev. E 2006, 73, 066705. [Google Scholar] [CrossRef] [PubMed]
  52. Premnath, K.N.; Banerjee, S. On the three-dimensional central moment lattice Boltzmann method. J. Stat. Phys. 2011, 143, 747–794. [Google Scholar] [CrossRef]
  53. Yahia, E.; Premnath, K.N. Central moment lattice Boltzmann method on a rectangular lattice. Phys. Fluids 2021, 33, 057110. [Google Scholar] [CrossRef]
  54. Geier, M.; Schönherr, M.; Pasquali, A.; Krafczyk, M. The cumulant lattice Boltzmann equation in three dimensions: Theory and validation. Comput. Math. Appl. 2015, 70, 507–547. [Google Scholar] [CrossRef]
  55. He, X.; Chen, S.; Zhang, R. A lattice boltzmann scheme for incompressible multiphase flow and its application in simulation of Rayleigh–Taylor instability. J. Comput. Phys. 1999, 152, 642–663. [Google Scholar] [CrossRef]
  56. Elseid, F.M.; Welch, S.W.J.; Premnath, K.N. A cascaded lattice boltzmann model for thermal convective flows with local heat sources. Int. J. Heat Fluid Flow 2018, 70, 279–298. [Google Scholar] [CrossRef]
  57. de Vahl Davis, G. Natural convection of air in a square cavity: A bench mark numerical solution. Int. J. Numer. Methods Fluids 1983, 3, 249–264. [Google Scholar] [CrossRef]
  58. Hortmann, M.; Perić, M.; Scheuerer, G. Finite volume multigrid prediction of laminar natural convection: Bench-mark solutions. Int. J. Numer. Methods Fluids 1990, 11, 189–207. [Google Scholar] [CrossRef]
Figure 1. Schematic diagram of the physical setup of two self-rewetting fluid layers enclosed inside a square cavity with sidewall heating.
Energies 18 03563 g001
Figure 2. Schematic diagram of natural convection in a differentially heated square cavity with the associated boundary conditions.
Energies 18 03563 g002
Figure 3. Computed streamlines at different values of Rayleigh numbers (a) Ra = 10 3 , (b) Ra = 10 4 , (c) Ra = 10 5 , and (d) Ra = 10 6 for natural convection in a square cavity.
Energies 18 03563 g003aEnergies 18 03563 g003b
Figure 4. Isotherms at different values of Rayleigh numbers (a) Ra = 10 3 , (b) Ra = 10 4 , (c) Ra = 10 5 , and (d) Ra = 10 6 for natural convection in a square cavity.
Energies 18 03563 g004
Figure 5. Temperature profiles at the horizontal centerline of the square cavity ( y / H = 0.5 ) for different Rayleigh numbers: Ra = 10 3 , Ra = 10 4 , Ra = 10 5 , and Ra = 10 6 .
Energies 18 03563 g005
Figure 6. Temperature profiles at the vertical centerline of the square cavity ( x / H = 0.5 ) for different Rayleigh numbers: Ra = 10 3 , Ra = 10 4 , Ra = 10 5 , and Ra = 10 6 .
Energies 18 03563 g006
Figure 7. Surface-tension-driven flow in two superimposed self-rewetting fluid (SRF) layers of an equal thickness in a domain of a length that is twice that of the total SRF thicknesses (W), with a thermal conductivity ratio of k ˜ = 1 and a viscosity ratio of μ ˜ = 1 . The dimensionless linear and quadratic coefficients of the surface tension variation with the temperature are M 1 = 0 and M 2 = 1.0 , respectively, corresponding to the values used in the simulations for the rest of this paper. (a) Streamlines based on an analytical solution [14], (b) streamlines based on an LBM simulation, and (c) velocity vector fields of the analytical solution and the LBM simulation.
Energies 18 03563 g007
Figure 8. Surface-tension-driven flow in two superimposed self-rewetting fluid (SRF) layers of an equal thickness in a domain of a length that is twice that of the total SRF thicknesses (W), with a thermal conductivity ratio of k ˜ = 1 and a viscosity ratio of μ ˜ = 1 . The the dimensionless linear and quadratic coefficients of the surface tension variation with the temperature are M 1 = 0 and M 2 = 1.0 , respectively, corresponding to the values used in the simulations for the rest of this paper. Comparison of the horizontal thermocapillary velocity component along the interface computed using an analytical solution (symbol) [14] and an LBM simulation (line).
Energies 18 03563 g008
Figure 9. The grid independence test. The results of the LBM simulations at two different grid resolutions of the surface-tension-driven flow in two superimposed self-rewetting fluid (SRF) layers of an equal thickness in a domain of a length that is twice that of the total SRF thicknesses (W), with a thermal conductivity ratio of k ˜ = 1 and a viscosity ratio of μ ˜ = 1 . The dimensionless linear and quadratic coefficients of the surface tension variation with temperature are M 1 = 0 and M 2 = 1.0 , respectively.
Energies 18 03563 g009
Figure 10. The streamlines (a) and isotherms (b) for the two-layer flow of normal fluids (NFs) for the case of localized heating ( L q / H = 0.1 ) with dimensional heat flux Q = 0.01 . Here, the viscosity ratio is μ ˜ = 1 , the thermal conductivity ratio is k ˜ = 1 , and the dimensionless linear and quadratic coefficients of the surface tension are M 1 = 0.1 and M 2 = 0 . The color bar represents the magnitude of the Marangoni convection’s velocity and the magnitude of the temperature field in the streamline and isotherm plots, respectively.
Energies 18 03563 g010
Figure 11. The streamlines (a) and isotherms (b) for the two-layer flow of normal fluids (NFs) for the case of the distributed heating ( L q / H = 1 ) with dimensional heat flux Q = 0.01 . Here, the viscosity ratio is μ ˜ = 1 , the thermal conductivity ratio is k ˜ = 1 , and the dimensionless linear and quadratic coefficients of the surface tension are M 1 = 0.1 and M 2 = 0 . The color bar represents the magnitude of the Marangoni convection’s velocity and the magnitude of the temperature field in the streamline and isotherm plots, respectively.
Energies 18 03563 g011
Figure 12. The Nusselt number profiles along the vertical lines in the cavity, i.e., Nu vs. y / H at (a) x = 0 , (b) x = H / 4 , (c) x = H / 2 , and (d) x = 3 H / 4 for the two-layer flow of normal fluids (NFs) for the case of localized heating ( L q / H = 0.1 ) with dimensional heat flux Q = 0.01 . Here, the viscosity ratio is μ ˜ = 1 , the thermal conductivity ratio is k ˜ = 1 , and the dimensionless linear and quadratic coefficients of the surface tension are M 1 = 0.1 and M 2 = 0 .
Energies 18 03563 g012
Figure 13. The streamlines (a) and isotherms (b) for the two-layer flow of self-rewetting fluids (SRFs) for the case of localized heating ( L q / H = 0.1 ) with dimensional heat flux Q = 0.01 . Here, the viscosity ratio is μ ˜ = 1 , the thermal conductivity ratio is k ˜ = 1 , and the dimensionless linear and quadratic coefficients of the surface tension are M 1 = 0 and M 2 = 1 . The color bar represents the magnitude of the Marangoni convection’s velocity and the magnitude of the temperature field in the streamline and isotherm plots, respectively.
Energies 18 03563 g013
Figure 14. The streamlines (a) and isotherms (b) for the two-layer flow of self-rewetting fluids (SRFs) for the case of distributed heating ( L q / H = 1 ) with dimensional heat flux Q = 0.01 . Here, the viscosity ratio is μ ˜ = 1 , the thermal conductivity ratio is k ˜ = 1 , and the dimensionless linear and quadratic coefficients of the surface tension are M 1 = 0 and M 2 = 1 . The color bar represents the magnitude of the Marangoni convection’s velocity and the magnitude of the temperature field in the streamline and isotherm plots, respectively.
Energies 18 03563 g014
Figure 15. The Nusselt number profiles along the vertical lines in the cavity, i.e., Nu vs. y / H at (a) x = 0 , (b) x = H / 4 , (c) x = H / 2 , and (d) x = 3 H / 4 for the two-layer flow of self-rewetting fluids (SRFs) for the case of localized heating ( L q / H = 0.1 ) with dimensional heat flux Q = 0.01 . Here, the viscosity ratio is μ ˜ = 1 , the thermal conductivity ratio is k ˜ = 1 , and the dimensionless linear and quadratic coefficients of the surface tension are M 1 = 0 and M 2 = 1.0 .
Energies 18 03563 g015aEnergies 18 03563 g015b
Figure 16. The Nusselt number profiles along the vertical lines in the cavity, i.e., Nu vs. y / H at (a) x = 0 , (b) x = H / 4 , (c) x = H / 2 , and (d) x = 3 H / 4 for the two-layer flow of self-rewetting fluids (SRFs) for the case of localized heating ( L q / H = 0.1 ) with dimensional heat flux Q = 0.02 . Here, the viscosity ratio is μ ˜ = 1 , the thermal conductivity ratio is k ˜ = 1 , and the dimensionless linear and quadratic coefficients of the surface tension are M 1 = 0 and M 2 = 1.0 .
Energies 18 03563 g016
Figure 17. The Nusselt number profiles along the vertical lines in the cavity, i.e., Nu vs. y / H at (a) x = 0 , (b) x = H / 4 , (c) x = H / 2 , and (d) x = 3 H / 4 for the two-layer flow of self-rewetting fluids (SRFs) for the case of distributed heating ( L q / H = 1 ) with dimensional heat flux Q = 0.01 . Here, the viscosity ratio is μ ˜ = 1 , the thermal conductivity ratio is k ˜ = 1 , and the dimensionless linear and quadratic coefficients of the surface tension are M 1 = 0 and M 2 = 1.0 .
Energies 18 03563 g017
Figure 18. The streamlines (a) and isotherms (b) for the two-layer flow of self-rewetting fluids (SRFs) for viscosity ratio μ ˜ = 0.5 in the case of distributed heating ( L q / H = 1 ) with dimensional heat flux Q = 0.01 . Here, the thermal conductivity ratio is k ˜ = 1 , and the dimensionless linear and quadratic coefficients of the surface tension are M 1 = 0 and M 2 = 1 . The color bar represents the magnitude of the Marangoni convection’s velocity and the magnitude of the temperature field in the streamline and isotherm plots, respectively.
Energies 18 03563 g018
Figure 19. The streamlines (a) and isotherms (b) for the two-layer flow of self-rewetting fluids (SRFs) for viscosity ratio μ ˜ = 2 in the case of distributed heating ( L q / H = 1 ) with dimensional heat flux Q = 0.01 . Here, the thermal conductivity ratio is k ˜ = 1 , and the dimensionless linear and quadratic coefficients of the surface tension are M 1 = 0 and M 2 = 1 . The color bar represents the magnitude of the Marangoni convection’s velocity and the magnitude of the temperature field in the streamline and isotherm plots, respectively.
Energies 18 03563 g019
Figure 20. The streamlines (a) and isotherms (b) for the two-layer flow of self-rewetting fluids (SRFs) for thermal conductivity ratio k ˜ = 0.5 in the case of distributed heating ( L q / H = 1 ) with dimensional heat flux Q = 0.01 . Here, the viscosity ratio ( μ ˜ = 1 ) and the dimensionless linear and quadratic coefficients of the surface tension are M 1 = 0 and M 2 = 1 . The color bar represents the magnitude of the Marangoni convection’s velocity and the magnitude of the temperature field in the streamline and isotherm plots, respectively.
Energies 18 03563 g020
Figure 21. The streamlines (a) and isotherms (b) for the two-layer flow of self-rewetting fluids (SRFs) for thermal conductivity ratio k ˜ = 2 in the case of distributed heating ( L q / H = 1 ) with dimensional heat flux Q = 0.01 . Here, the viscosity ratio ( μ ˜ = 1 ) and the dimensionless linear and quadratic coefficients of the surface tension are M 1 = 0 and M 2 = 1 . The color bar represents the magnitude of the Marangoni convection’s velocity and the magnitude of the temperature field in the streamline and isotherm plots, respectively.
Energies 18 03563 g021
Figure 22. Effects of the dimensionless linear coefficient of the surface tension ( M 1 ) and dimensionless heat flux (Q) on the magnitude of the normalized peak velocity at the interface in NFs at M 2 = 0 , k ˜ = 1 , μ ˜ = 1 , and L q / H = 1 .
Energies 18 03563 g022
Figure 23. Effects of the dimensionless quadratic coefficient of the surface tension ( M 2 ) and dimensionless heat flux (Q) on the magnitude of the normalized peak velocity at the interface in SRFs at M 1 = 0 , k ˜ = 1 , μ ˜ = 1 , and L q / H = 1 .
Energies 18 03563 g023
Figure 24. Effects of the thermal conductivity ratio ( k ˜ ) and dynamic viscosity ratio ( μ ˜ ) on the magnitude of the normalized peak thermocapillary velocity in SRFs at M 2 = 1 , L q / H = 1 , and Q = 0.01 .
Energies 18 03563 g024
Figure 25. Effects of the characteristic width of the heat flux distribution ( L q / H ) on the magnitude of the normalized peak thermocapillary velocity in SRFs at M 2 = 1 , μ ˜ = 1 , k ˜ = 1 , and Q = 0.01 .
Energies 18 03563 g025
Table 1. Summary of the model parameters and constants in the various LB solvers used in this study.
LB SolverParameters and Constants
Interfacial tracking ω m n ϕ = M ϕ c s ϕ 2 Δ t + 1 2 1 , ( m n ) = ( 10 ) , ( 01 )
ω m n ϕ = 1.0 , for   all   the   other   possible ( m n )
M ϕ = 0.2 , W = 5
Two-fluid motion ω m n = ν c s 2 Δ t + 1 2 1 , ( m n ) = ( 2 s ) , ( 11 )
ω m n = 1.0 , for   all   the   other   possible ( m n )
Energy transport ω m n T = α c s T 2 Δ t + 1 2 1 , ( m n ) = ( 10 ) , ( 01 )
ω m n T = 1.0 , for   all   the   other   possible ( m n )
Lattice parameters c s ϕ 2 = c s 2 = c s T 2 = 1 / 3
Δ t = Δ x = 1.0 ( lattice   units )
Table 2. Comparisons of the present results with the previous LB results [56] and benchmark solutions [57,58] at different Rayleigh numbers ( Ra = 10 3 10 6 ).
Ra u max y max v max x max Nu ¯ Nu max y Nu
10 3 Present3.59900.81103.65020.18111.12341.51230.91406
LBM [56]3.6050.8163.6540.1761.117NANA
FDM [57]3.6340.8133.6790.1791.116NANA
FVM [58]NANANANANANANA
10 4 Present16.13420.822019.54000.12042.25013.54920.8594
LBM [56]16.1820.82419.5510.122.237NANA
FDM [57]16.1820.82319.5090.122.23NANA
FVM [58]16.17590.825519.6240.122.244753.53090.8531
10 5 Present34.83850.854968.41010.06674.53317.77280.9219
LBM [56]35.1370.85668.5110.0644.509NANA
FDM [57]34.810.85568.220.0664.51NANA
FVM [58]34.73980.853168.64650.06564.5217.72010.9180
10 6 Present64.95200.8510220.03310.03928.844017.62157
LBM [56]65.570.856219.950.0328.797NANA
FDM [57]65.330.851216.750.03878.798NANA
FVM [58]64.86590.85312219.8610.04068.82517.53600.9608
Table 3. Summary of the choices for the dimensionless parameters used in the simulation of the Marangoni convection in SRFs in a heated square cavity.
ParameterMaPrCa M 1 M 2 μ ˜ k ˜
Value10100.101.00.50.5
1.01.0
2.02.0
Disclaimer/Publisher’s Note: The statements, opinions and data contained in all publications are solely those of the individual author(s) and contributor(s) and not of MDPI and/or the editor(s). MDPI and/or the editor(s) disclaim responsibility for any injury to people or property resulting from any ideas, methods, instructions or products referred to in the content.