1. Introduction
SF
6 gas is widely used in ultra-high-voltage power systems due to its extremely high dielectric strength, excellent chemical stability, and superior arc-quenching capability [
1,
2]. Ultra-high-voltage SF
6 circuit breakers play critical control and protective roles in power grids. During long-term operation, as the number of operation cycles increases, arc-induced erosion intensifies. The insulating medium within the arc-extinguishing chamber degrades and decomposes under the combined effects of arc ionization and thermal heating, leading to variations in pre-breakdown time during phase-controlled closing operations. These variations elevate the probability of inrush current and overvoltage. To enhance the electrical lifespan of switchgear and reduce insulation stress on power equipment, it becomes necessary to develop phase-controlled closing strategies that account for long-term breaker operation [
3,
4,
5].
Phase-controlled closing technology enables the moving and fixed contacts of circuit breakers to close at predetermined voltage waveform angles through actuator control. However, actual closing angle deviations arise from both mechanical dispersion caused by actuator instability and electrical dispersion induced by the degradation of insulation gas in arc-extinguishing chambers. During the closing operation, while there is no gas-blowing effect and the insulation medium exhibits low flow velocity with minimal density variations, the complex structure of arc-extinguishing chambers causes non-linear deterioration in insulation characteristics. This non-linearity stems from variations in electric field non-uniformity and breakdown field strength as contact gaps change. The insulation gas in arc-extinguishing chambers undergoes degradation under high-temperature arcs and particle collisions, generating fluorides and fluoride ions. Post-operation, as the arc extinguishes and temperature decreases, these fluorides rapidly recombine into SF
6. Metallic components, insulating materials, and trace moisture/oxygen in the chamber interact with arc-generated metal ions and reactive radicals during switching operations, forming impurity gases through reactions with fluorides. Although these impurities gradually decompose due to chemical instability and are partially adsorbed by scavengers, SF
6 purity remains high under limited switching cycles. With prolonged operation and accumulated switching actions, impurity gas concentrations progressively increase in arc-extinguishing chambers. Field measurements using SF
6 decomposition analyzers can track gas composition evolution, enabling assessment of insulation strength degradation patterns in arc-extinguishing chambers [
6,
7,
8].
Domestic and international researchers have analyzed the arc decomposition characteristics of SF
6 and investigated pre-breakdown characteristic evolution in circuit breakers after multiple operations. Based on arc-extinguishing chamber structures, researchers have conducted simulations of electric field intensity between contacts and chambers, obtaining pre-breakdown voltage variation patterns with time or contact gap. Several universities and research institutes designed dynamic breakdown characteristic tests to experimentally study pre-breakdown behaviors. Combining simulation and experimental results, researchers established optimized phase-controlled closing angles [
9,
10,
11,
12]. Monitoring SF
6 decomposition products enables insulation condition assessment in arc-extinguishing chambers. During normal interruption of kA-level currents, extreme temperatures in arc cores drive decomposition. Current research employs infrared spectroscopy, gas chromatography–mass spectrometry, and micro-moisture analyzers to characterize principal SF
6 decomposition products under arcing conditions [
13,
14,
15,
16,
17,
18]. The main gaseous products include SF
4 and SF
2, with trace amounts of CO
2, H
2S, and HF occasionally detected. The presence of moisture or oxygen in the environment leads to the detection of SOF
4, SO
2, CO
2, COS, and HF. SF
2 production increases substantially with elevated current levels [
19,
20,
21,
22,
23]. As switching cycles accumulate and ablation intensifies, limited research exists on two critical aspects: the evolving process of insulation gas properties in arc-extinguishing chambers, and the resultant impacts on both insulation strength degradation patterns and phase-controlled closing accuracy.
In terms of artificial intelligence algorithm applications, ABB optimized the phase selection control strategy by using the FPD strategy, which improves the response speed of the control system [
24]. Shenyang University of Technology adopted the BP neural network algorithm to predict the circuit breaker switching-on time. Dalian University of Technology used multi-thread analysis and BP neural network algorithm to make the switching-on time prediction error within ±1.5 ms. Bei-hang University proposed a switching-on time prediction model based on a distributed radial basis function neural network. Xi’an University of Science and Technology adopted the least squares method for piecewise fitting, which could effectively meet the time accuracy requirements of synchronous switches. China Coal Energy Research Institute used a dual-core driving mode combining a field-programmable gate array and ARM to measure the switching-on and switching-off time of circuit breakers, improving phase selection accuracy. These methods mainly focus on data processing, making it difficult to explain the physical change process [
25,
26,
27,
28,
29,
30].
In summary, the issues of insulation degradation in UHV SF6 circuit breakers and the decline in switching accuracy have become key bottlenecks restricting the stable operation of power grids. Existing studies still have room for improvement in dynamic adaptability and physical interpretability. Therefore, this paper proposes an adaptive switching algorithm that integrates physical mechanisms and dynamic correction, aiming to achieve precise optimization of the switching control strategy by quantifying the insulation degradation process.
The subsequent content of this paper is arranged as follows:
Section 2 will elaborate in detail on the derivation process of the breakdown voltage correction formula based on the synergistic effect of mixed gases, as well as the quantitative relationship modeling between contact gap and electric field distortion. Taking these two points as the basis, a switching phase variation model based on the change in insulation strength decline rate will be established.
Section 3 introduces the multi-round switching-on and switching-off test schemes on a 600 kV test platform, along with the data collection and analysis methods for voltage, current, gas decomposition products, and other parameters.
Section 4 compares the performance of the adaptive switching algorithm, least squares method, and machine learning algorithms in pre-breakdown time prediction, verifying the algorithm’s effectiveness from dimensions such as fitting effect, complexity, and generalization ability.
Section 5 discusses the practical value and limitations of the algorithm in engineering applications, and prospects the algorithm optimization directions and future research plans.
2. Dynamic Analysis of Switching Phase Variation
2.1. Selection of Decomposed Gas Species
According to the standard [
31], the detection of SO
2 originates from its role as a characteristic product of SF
6 arc decomposition. When arc discharge occurs in switchgear, SF
6 reacts with electrode materials and moisture to generate sulfur oxides such as SO
2. Its concentration is positively correlated with arc energy, serving as direct evidence for judging internal discharge faults in the arc quenching chamber. The standard explicitly lists it as a key indicator for on-site analysis, requiring the concentration of (SO
2 + SOF
2) to be lower than 2 μL/L.
The detection logic of CF4 is based on its dual nature: it is both a residual impurity possibly present in fresh gas production and a by-product of SF6 decomposition under arc action during operation. The standard specifies limits of ≤0.05% for CF4 content before commissioning and ≤0.1% during operation. Abnormal concentration of CF4 can indicate insufficient gas purity or deep decomposition caused by arcs.
For CO2, although not directly mentioned in the standard, from the perspective of impurity source mechanisms, carbonization of organic insulating materials in the arc quenching chamber under high-temperature arcs can generate CO2, and when equipment sealing is poor, CO2 in the air may also intrude. If CO2 increases alone, it indicates overheating of insulating materials or sealing defects; if it increases synergistically with SO2 and CF4, it suggests that arc ablation has triggered a composite fault of SF6 decomposition and insulation carbonization, which is consistent with the principle of combined diagnosis by multiple indicators in the standard.
Compared with other gases, HF, H2O, etc., mainly reflect gas dryness or corrosiveness, showing weak direct correlation with arc ablation. Metal fluorides are solid particle impurities, which require solid sampling analysis rather than gas detection. In summary, the detection system for SO2, CF4, and CO2 not only complies with the impurity control requirements in the standard but also supplements the evaluation dimensions of insulation status and equipment sealing through CO2, forming a multidimensional diagnosis of arc ablation in the arc quenching chamber.
2.2. Influence of Decomposed Gases at Different Stages on Insulation Strength
In the initial stage, when the number of circuit breaker operations is small and in the low decomposition product accumulation period, the concentration of SF6 decomposition products is lower than the on-site analysis threshold (SO2 + SOF2 < 2 μL/L, CF4 ≤ 0.05%), at which time CF4 preferentially captures free electrons due to its high electron affinity, suppressing ionization through inelastic scattering; a small amount of CO2 acts as a buffer gas, dissipating the energy of high-energy electrons through collisions, and the two synergistically optimize the insulation uniformity of the mixed gas. In this stage, the SF6 purity is ≥99.9%, and electronegative adsorption dominates the insulation mechanism.
With the increase in the number of operations, the intermediate stage is entered, where decomposition products accumulate critically, the SF6 purity drops to 99–99.9%, and the concentration of decomposition products breaks through the on-site analysis threshold (such as SO2 + SOF2 > 2 μL/L). At this time, the electronegative adsorption capacity of SF6 weakens with the decrease in concentration, and meanwhile, SO2 reacts with metal fluorides to form corrosive substances that adhere to the arc quenching chamber nozzle to damage the insulating surface, leading to a decrease in the insulation strength of the mixed gas compared with fresh gas.
When the number of operations increases and the system enters the late stage, with the total concentration of decomposition products ≥10 μL/L and CF4 > 0.1%, the permittivity of the gas mixture undergoes a sudden change due to CF4 accumulation, and the buffering effect of CO2 transforms into a breakdown-promoting factor at excessively high concentrations. Simultaneously, SO2 and its derivatives continuously corrode the contacts and nozzles, potentially leading to increased deviation in contact movement stroke and triggering phase-controlled switching failure. At this stage, regeneration treatment or gas replacement shall be carried out according to the standard.
2.3. Breakdown Voltage of Gas Mixtures
Due to factors such as discharge overheating, decomposed gases in the arc quenching chamber increase. Owing to the interactions between gas ions, parameters like the number of free electrons and their kinetic energy during SF
6 discharge are influenced by other gases, leading to the insulation performance of the gas mixture not being simply linearly additive. That is, the critical breakdown field strength of the mixed gas is not equal to the weighted critical breakdown field strength, and this interparticle interaction is defined as the synergistic effect [
32,
33,
34,
35,
36].
To calculate the breakdown voltage of SF
6 containing decomposed gases such as SO
2, CF
4, and CO
2, the equivalent volume fraction of impurity gases should first be calculated.
where
is the equivalent volume fraction,
i represents different gases (the same below),
is the volume fraction of different gases, and
is the volume fraction of SF
6. The equivalent breakdown voltage in this process is:
where
is the breakdown voltage of pure gas
i, and
is the breakdown voltage of the calculated equivalent impurity
D. The equivalent synergistic effect coefficient is:
where
is the synergistic effect coefficient of the binary mixed system, and
is the equivalent synergistic effect coefficient. The mixed breakdown voltage is:
where
represents the breakdown voltage of pure SF
6,
n is the arc energy, and
is the amplitude of breakdown voltage drop under the ablation of unit arc energy.
where
s is the distance between contacts,
is the proportionality coefficient related to medium characteristics, and
is the exponential coefficient reflecting the sensitivity of breakdown voltage to gap distance changes. When an arc is generated during contact breaking, the gap voltage is determined by the arc path volt-ampere characteristics. Arc energy can be expressed as the time integral of arc path voltage and current, where the arc path voltage increases with an increase in contact gap distance. Until the current passes through zero, SF
6 suppresses reignition by strongly electronegative adsorption of free electrons, causing the arc to extinguish.
The cumulative effect of arc energy is positively correlated with the number of operations: in each opening operation, the amplitude of interruption current and arcing time directly determine the arc energy. As the number of operations increases, metal vapor generated by arc ablation on the contact surface reacts with SF
6 decomposition products to form metal fluorides, which adhere to the arc quenching chamber nozzle, leading to the accumulation of decomposition product concentration with the number of operations. High-temperature arcs caused by short-circuit currents significantly exacerbate contact surface roughness, while the long-term cumulative effect of load current interruption indirectly affects arc energy release through contact resistance degradation. Arc energy is expressed as Equation (7).
Long-term multiple make-and-break operations cause degradation of the arc quenching chamber insulation medium, contact wear, and electric field distortion, making the insulation medium highly prone to breakdown. Thus, it is necessary to establish a phase-controlled switching strategy that accounts for the deepening degree of arc ablation with the increase in the number of circuit breaker operations, considering the non-linear variation in the rate-of-decay of dielectric strength (RDDS).
2.4. Calculation of Closing Interval
Previous studies have shown that arc ablation caused by the accumulation of high-voltage switch operations leads to degradation of the insulation gas in the arc quenching chamber, thereby reducing the breakdown voltage. Meanwhile, changes in electric field strength cause the dielectric strength to decline non-linearly, and this performance degradation ultimately affects the closing phase. Based on this, this section deeply explores the quantitative relationship between the rate-of-decay of dielectric strength (RDDS) and the closing interval, laying a theoretical foundation for the subsequent phase-controlled closing strategy [
37,
38,
39,
40,
41,
42].
During the closing operation of a circuit breaker, a pre-breakdown phenomenon occurs when the contact gap becomes smaller than a critical threshold and fails to withstand the applied voltage. Assuming the distance between the moving contact and fixed contact at pre-breakdown instant is
x(t), and the corresponding breakdown field strength between the contacts is
E, the breakdown voltage
uj(t) can be expressed as:
Conventional analysis holds that during circuit breaker closing operations, the closing velocity exhibits negligible variation relative to electric field strength changes and is approximated as a constant. The derivative of breakdown voltage with respect to time thus becomes
Therefore, the pre-breakdown voltage versus time relationship curve (closing characteristic curve) can be treated as a straight line, where the absolute value of its slope corresponds to the rate-of-decay of dielectric strength (RDDS). Parameter
kp is defined as:
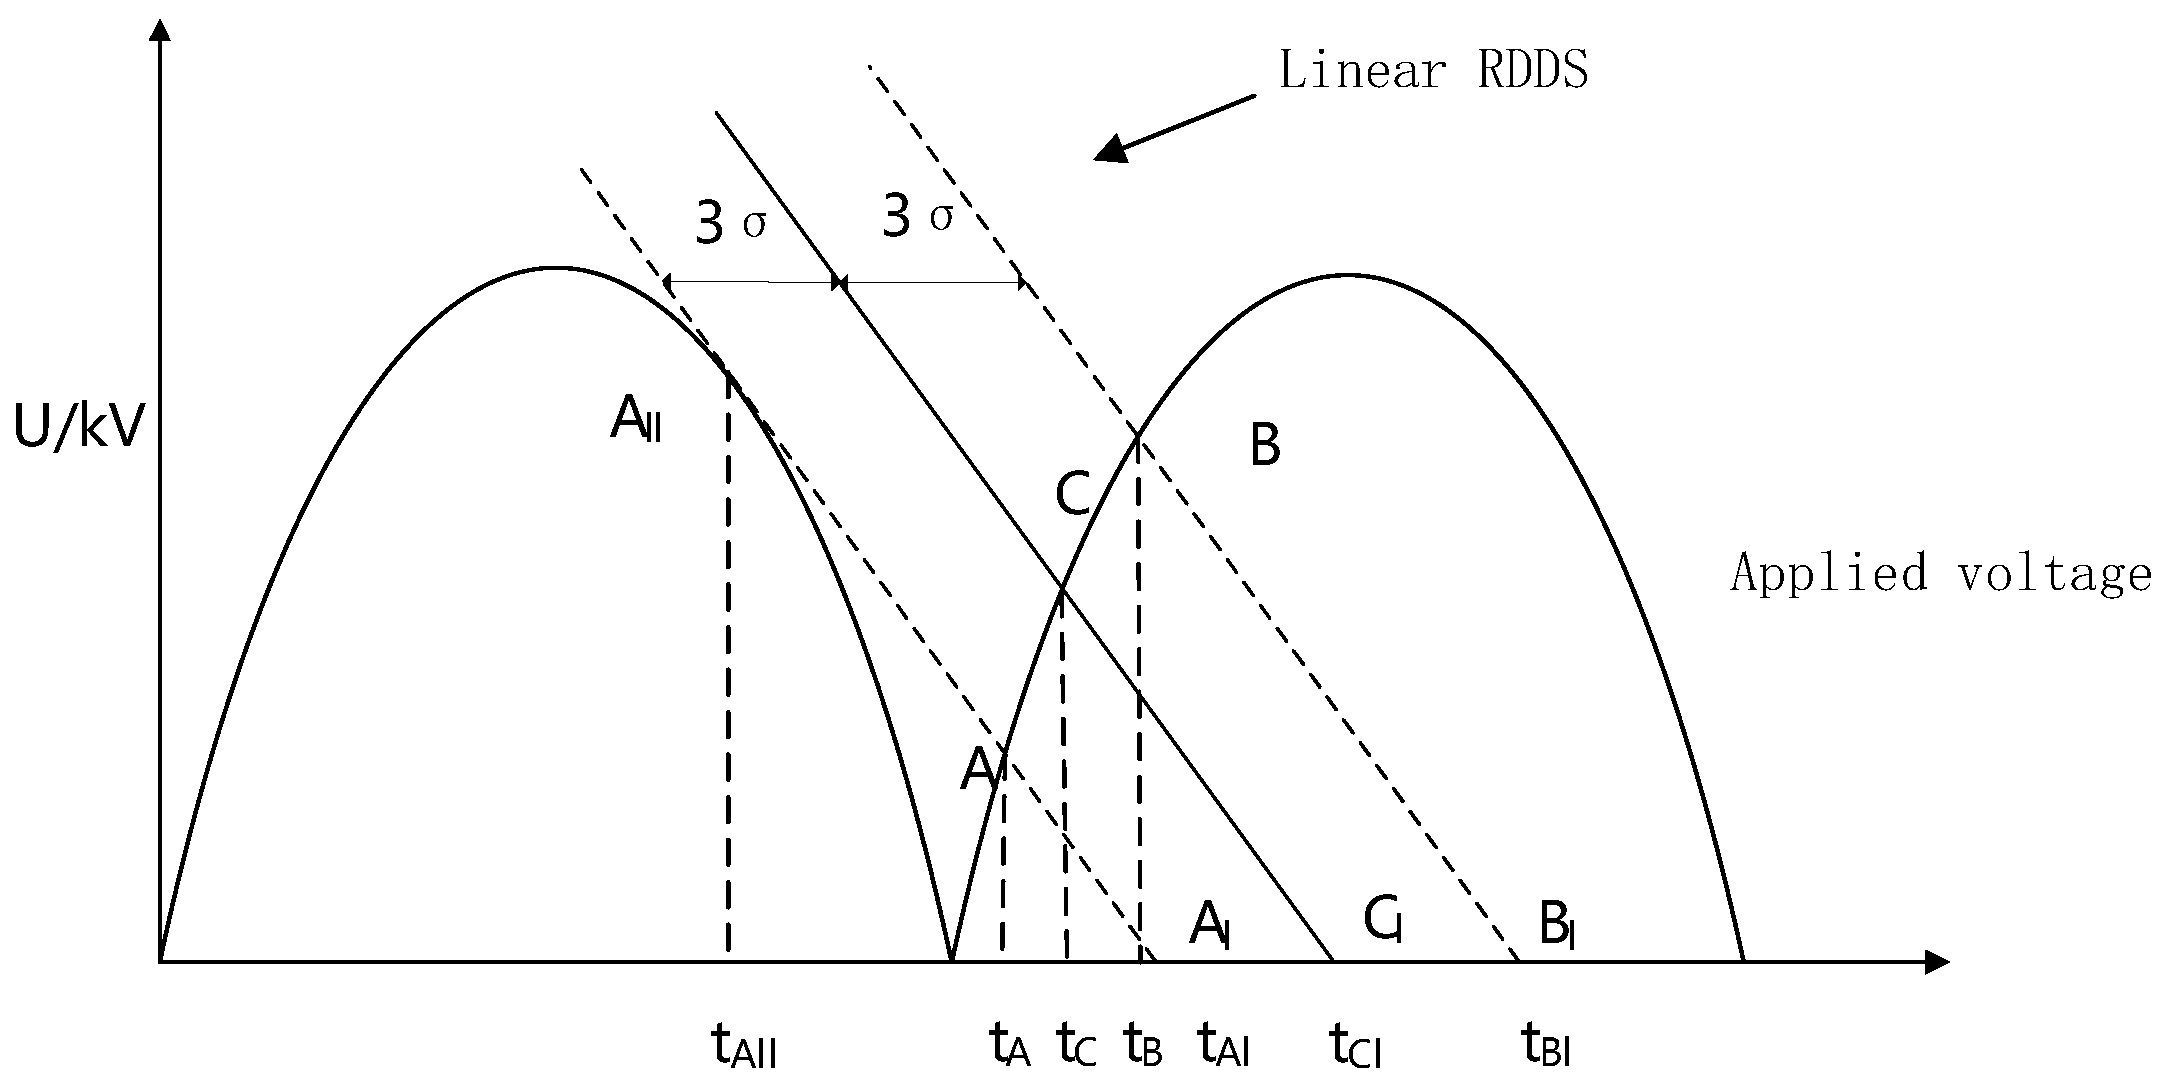
During actual closing operations of circuit breakers, RDDS manifests as a deterministic parameter exhibiting normal distribution, essentially unaffected by the polarity of applied voltage. After determining RDDS, ensuring precise and stable phase-selected closing requires simultaneous consideration of both the circuit breaker’s mechanical dispersion and the permissible inrush current range tolerated by the power grid system to establish the optimal closing target point. For ultra-high-voltage circuit breakers, when
k < 1, the RDDS curve lies below the tangent line at the system voltage zero-crossing. Theoretically, no intersection exists between RDDS and the voltage waveform’s zero point, implying that zero-voltage-crossing closing is fundamentally unattainable. When
k < 1, the pre-breakdown phenomenon at voltage zero-crossing and the optimal closing timing are illustrated in
Figure 1.
During phase-selected closing operation, the anticipated current emergence instants correspond to the electrical contact points
A,
C, and
B; the expected contact closure instants (mechanical contact points) are denoted as
Al,
Cl, and
Bl, with the optimal closing target point being
Cl. The pre-breakdown time durations
TA,
TC, and
TB represent temporal differences between mechanical and electrical contact instants, with the closing time window defined as [
tAl,
tBl]. It is assumed that the circuit breaker’s intrinsic mechanical dispersion equals 3σ. The line
AllAl tangentially contacts the applied voltage waveform at point
All. Given the applied voltage
u(t) = Umsin(ωt), the equation for the line
AllAl is formulated as
Equating the magnitude of the tangent line’s slope at point A
ll with the closing insulation characteristic yields
So, it can be concluded that:
Substituting the coordinates of point
All (
tAll,
Umsin(ω
tAll)) into Equation (14) yields
At the intersection point
A between the straight line
uAll(t) and the applied voltage
u(t), there is the following equation:
Solving the equation yields
tA. Setting
UallAl(t) to zero yields
tAl:
Translating the straight line
AllAl to the right by 3σ yields the straight line
CCl:
Setting
UCCl(t) to zero yields the optimal closing target point for the load when
k < 1:
At the intersection point
C1 between the straight line
UCCl(t) and the applied voltage
u(t), there is the following equation:
Solving the equation yields
tCl. Translating the straight line
CCl to the right by 3σ yields the straight line
BBl:
Setting
UBBl(t) to zero yields:
At the intersection point
Bl between the straight line
UBBl(t) and the applied voltage
u(t), there is the following equation:
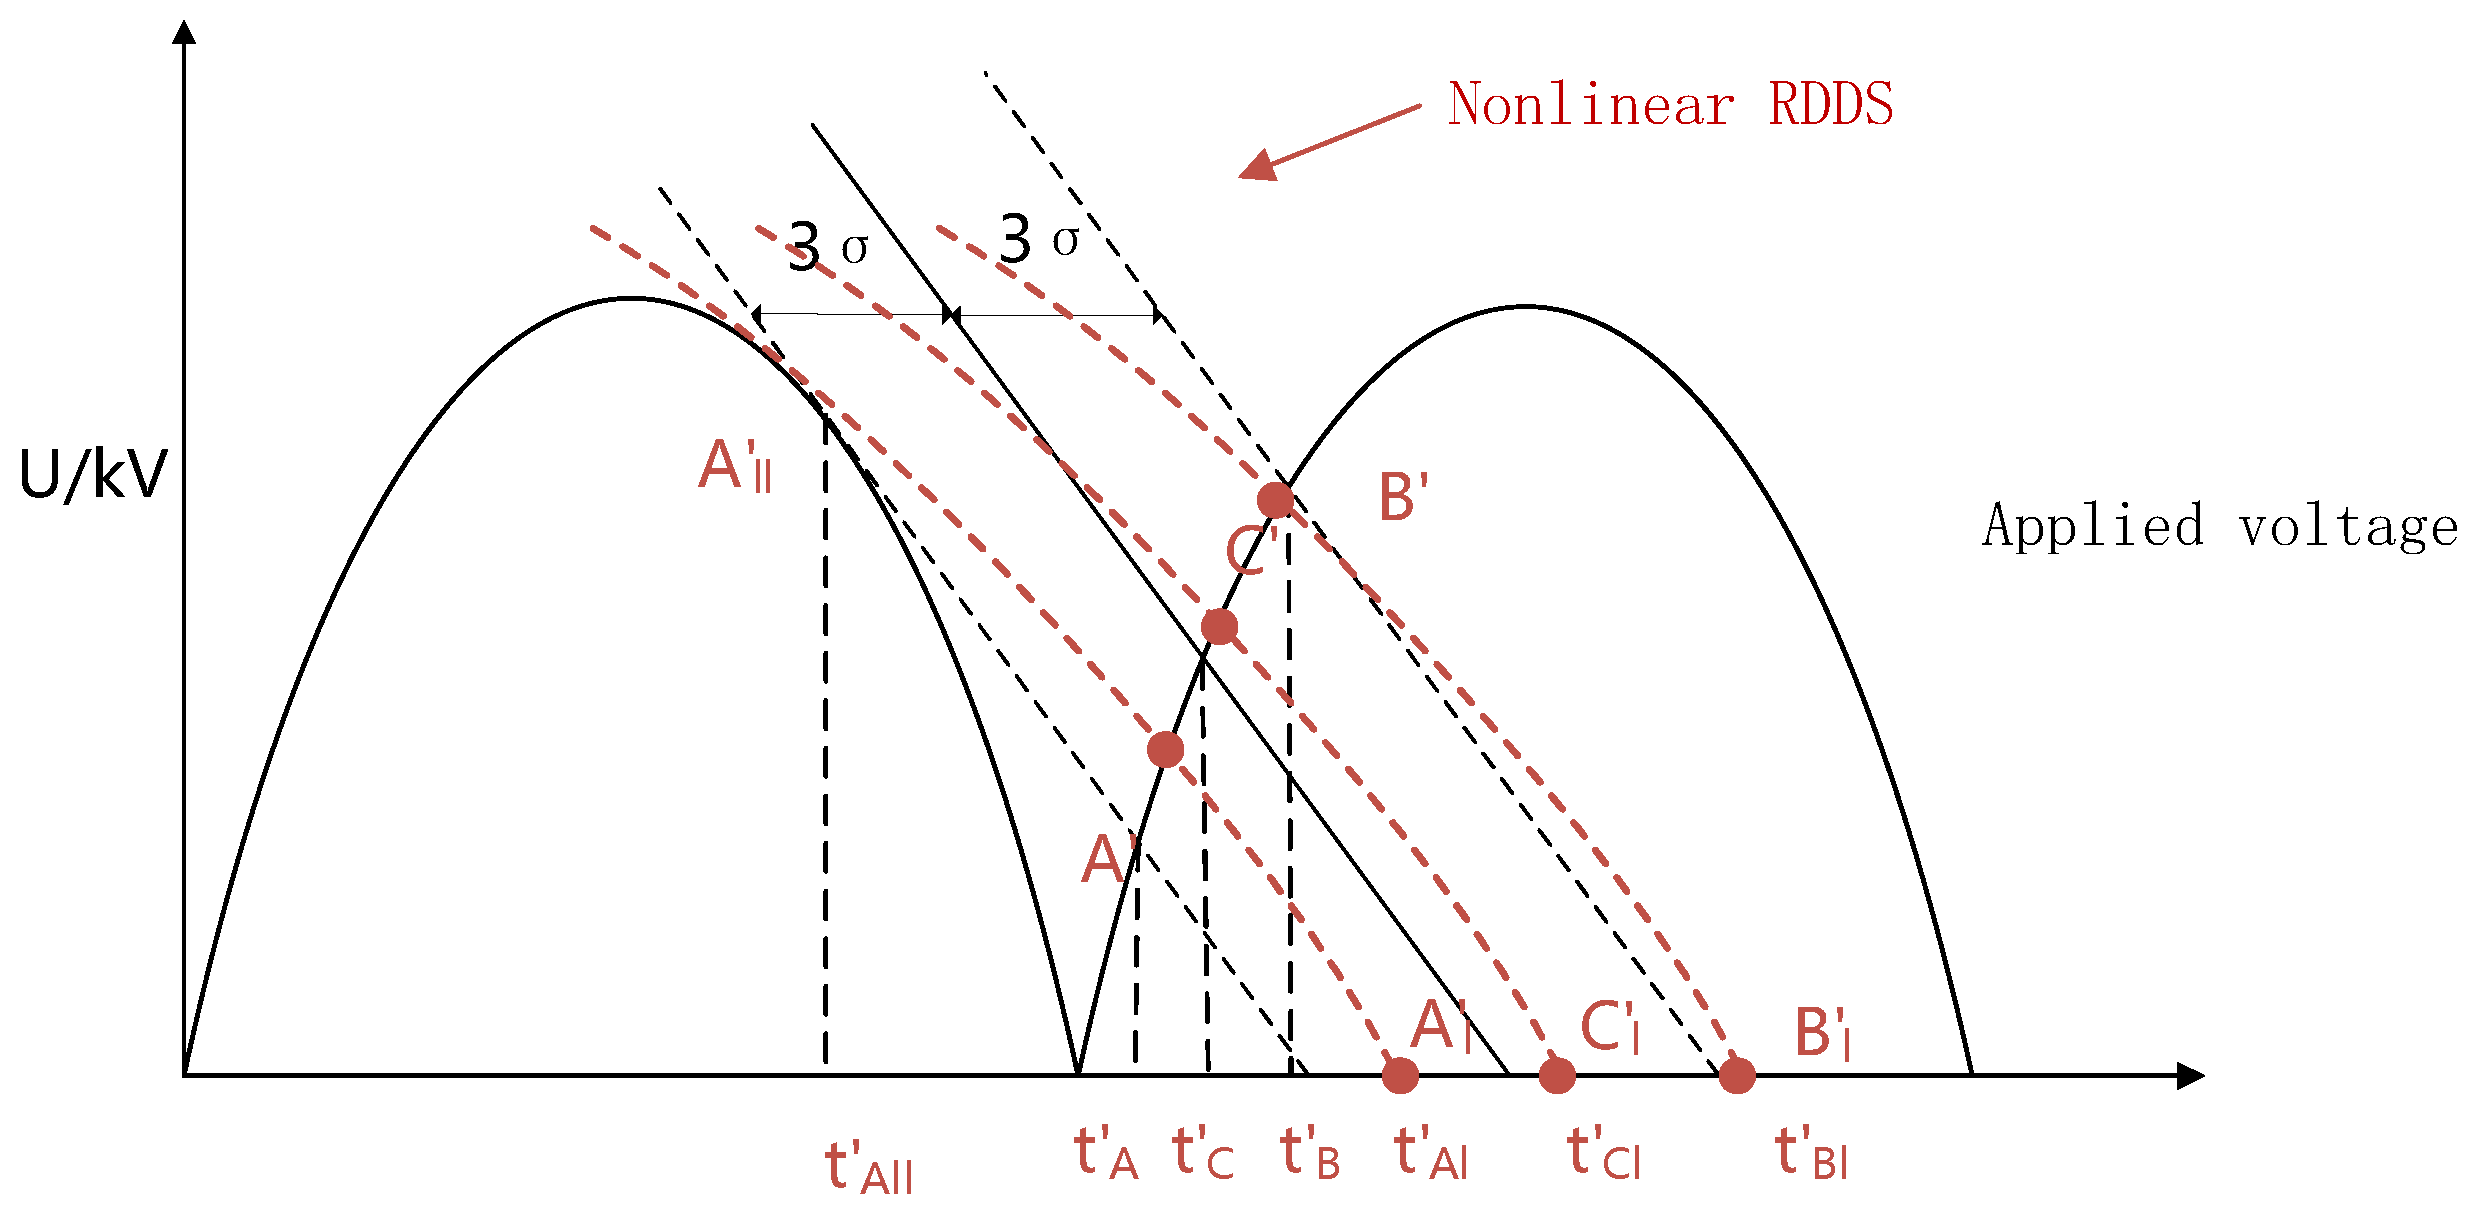
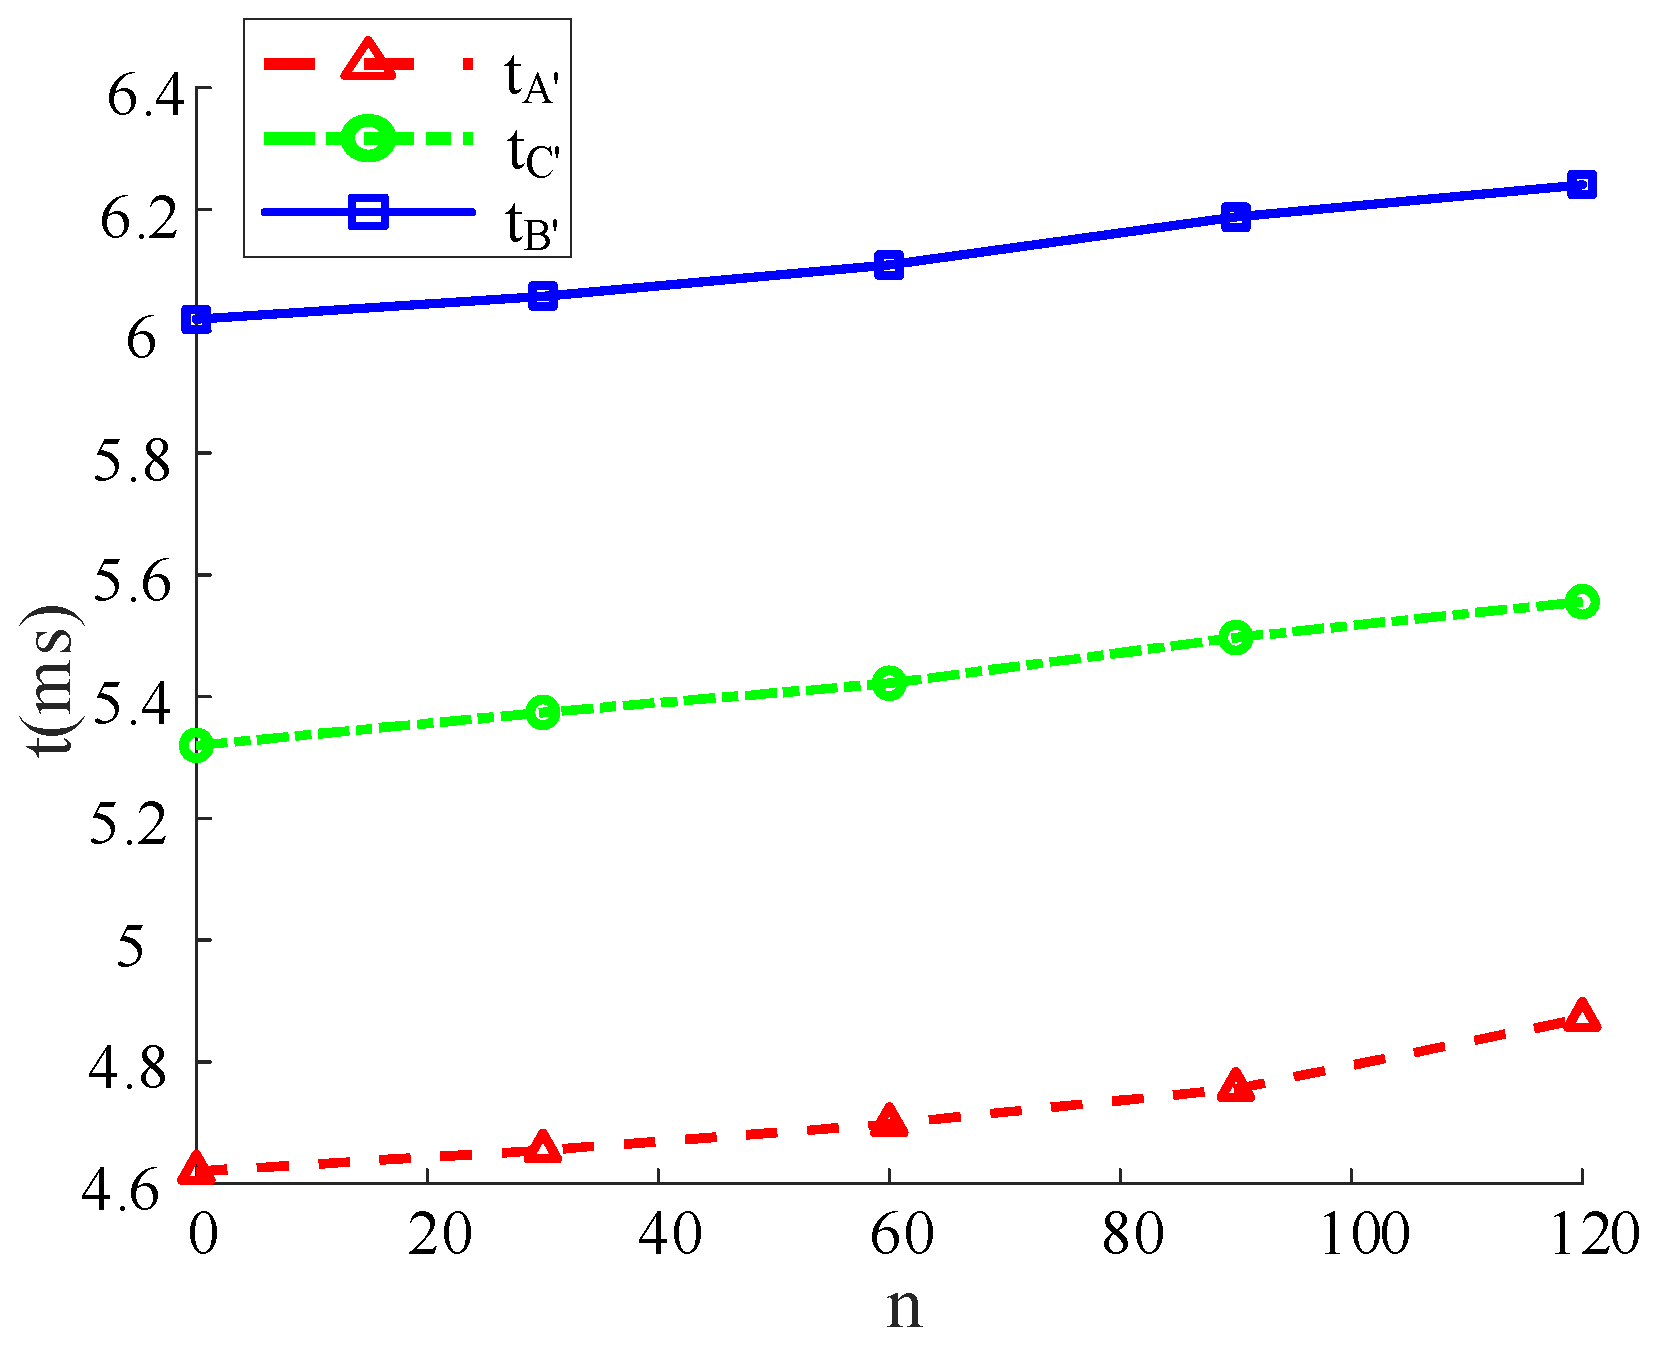
2.5. Impact of RDDS Non-Linearity on Closing Interval
As the number of operations increases, the degree of arc ablation deepens, and the variation in the rate-of-decay of dielectric strength (RDDS) becomes more pronounced. Due to the spatial variation in electric field strength in the arc quenching chamber of high-voltage SF
6 circuit breakers, the electric field non-uniformity intensifies as the contacts approach each other. In this scenario, RDDS cannot be approximated as a straight line, and the non-linear optimal closing window is as shown in
Figure 2.
Pre-breakdown events occur at points
A′,
C′, and
B′. Circuit breaker contact engagement occurs at points
t′
Al,
t′
Cl, and
t′
Bl. The optimal target closing instant is at point
t′
Cl, with pre-breakdown durations
TA′,
TB′, and
TC′. The tangent point
A′
ll between curve
A′
A′
ll and the applied voltage u(t) is expressed as:
The rate-of-decay of dielectric strength (RDDS) can be expressed as:
The curve
A′
A′
ll can then be expressed as:
At the tangent point
A′ between the curve
A′
A′
l and the applied voltage
u(t), there is the following equation:
Solving the equation yields parameters b and tA′ll.
Setting
uA′A′ll(t) to zero yields the closing instant
tA′l:
At the intersection point between the curve
A′
A′
ll and the applied voltage:
Solving the equation yields tA′.
Translating the curve
A′
A′
ll to the right by 3σ yields the curve
C′
lC′:
Setting
uC′lC′(t) to zero yields the optimal target closing instant
tc′l:
At the intersection point
C′ between the curve
uC′lC′(t) and the applied voltage
u(t), there is the following equation:
Solving the equation yields tC′.
Translating the curve
C′
C′
ll to the right by 3σ yields the curve
B′
B′
ll:
Setting
uB′lB′(t) to zero yields
At the intersection point
B′ between the curve
uB′lB′(t) and the applied voltage u(t), there is the following equation:
Solving the equation yields tB′.
3. Experimental Platform and Results
To verify the theoretical model of closing interval variation derived from the evolution of insulation gas decomposition products in the arc quenching chamber, a full-operating-condition simulation verification test was designed in accordance with the electrical life standard requirements for E2-class circuit breakers specified in the Standard Document [
43]. The test was conducted with a constant breaking current as the benchmark, performing 120 make-and-break cycle operations. The number of operations was set following the engineering design criterion of “expected life operation times × 1.2 safety factor”, ensuring compliance with the durability technical index of “main circuit breaking components maintenance-free” stipulated in the standard.
During the test, a high-precision gas analyzer was used to quantitatively detect the concentrations of characteristic decomposition products such as SO2, CF4, and CO2 after each operation. Key parameters including breaking current, arc voltage, and pre-breakdown time were simultaneously monitored to accurately calculate the single and cumulative breaking energy. By establishing a multi-parameter collaborative monitoring system, the evolution law of gas components in the arc quenching chamber throughout the circuit breaker’s service life and its influence mechanism on insulation performance were systematically studied, providing experimental verification and data support for the theoretical model.
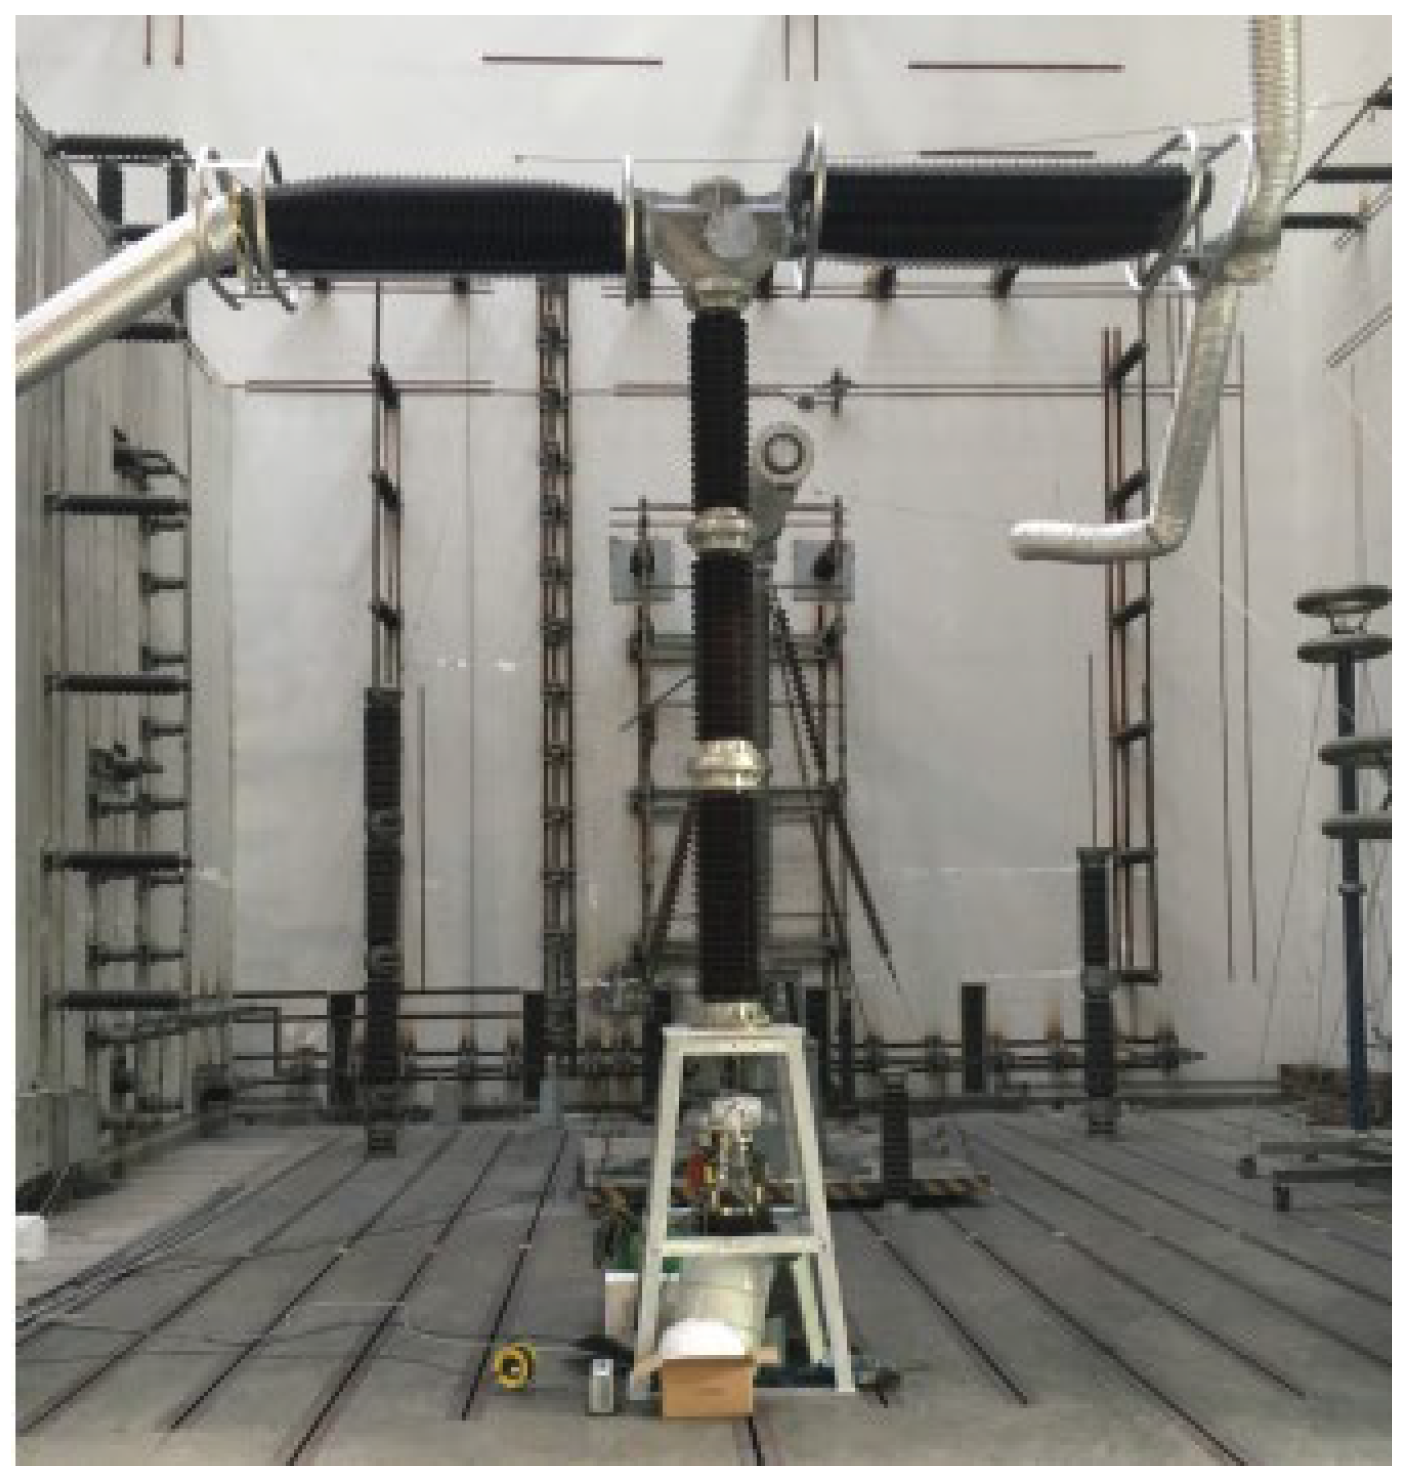
3.1. Construction of Test Platform
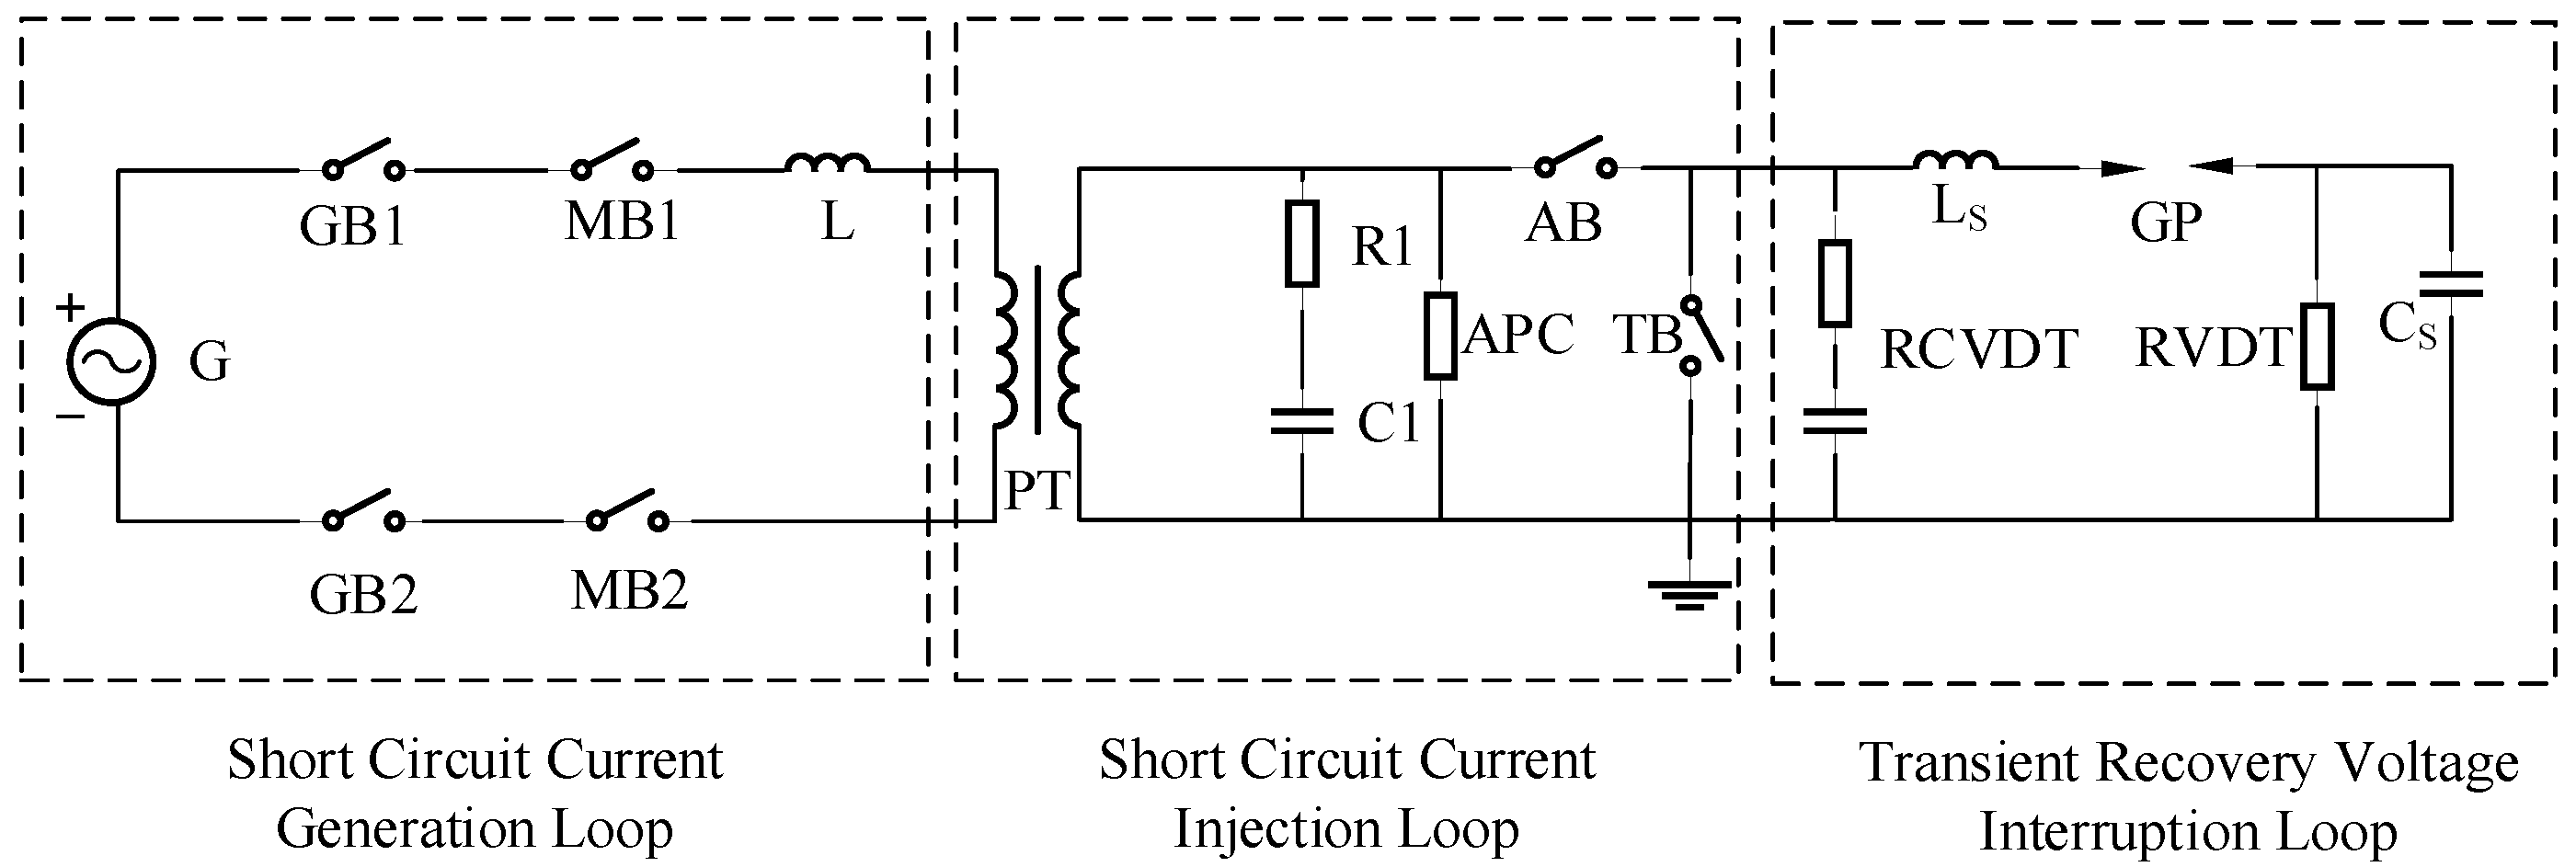
The degradation of insulation medium in the arc quenching chamber is primarily determined by arc ablation. The test scheme was designed to use a 550 kV circuit breaker as the test prototype, measuring the correlation between gas components in the arc quenching chamber and cumulative breaking energy. Short-circuit current breaking tests are conducted in a large-capacity laboratory using a current injection synthetic circuit, which consists of a current source and a voltage source. The schematic diagram is shown below, mainly divided into three parts: short-circuit current generation circuit, short-circuit current injection circuit, and transient recovery voltage breaking circuit. TB denotes the test prototype in this test.
Before the test, both the Auxiliary Breaker (AB) and Test Breaker (TB) are in the closed position. Closing the Make–Break Switch (MB) allows the short-circuit current (
ig) from the current source (G) to flow through both breakers. At time
t0, the contacts of AB and TB separate, and the Arc-Prolonging Circuit (APC) fixes the arcing time of the test prototype at 4 ms. At time
t1, the Spark Gap (GP) is triggered, and the pre-charged Voltage Source Capacitor Bank (Cs) discharges through Reactor (Ls), injecting a high-frequency current (
iv) that superimposes with
ig. The Resistive Voltage Divider (RVDT) measures the charging voltage of Cs, while the Resistive–Capacitive Voltage Divider (RCVDT) monitors the transient recovery voltage (TRV). The Spark Gap consists of two graphite hemispheres with a variable gap adjusted according to the charging voltage level. The schematic and field diagrams of the test circuit are shown in
Figure 3 and
Figure 4, with the voltage-current characteristics of the breaking gap illustrated in
Figure 5.
Since the excitation voltage of the current source is quite low, the TB test prototype only needs to withstand the ablation of the power-frequency short-circuit current arc after the contacts first separate. After the tested circuit breaker interrupts the short-circuit current (ig + iv) at time t2, the fracture also needs to withstand the transient recovery voltage provided by the voltage circuit and controlled by parameters Cs and Ls. Therefore, the two circuit breakers go through the following two stages:
From t0 to t1, the test prototype AB interrupts the short-circuit current ig, and the arcing time is 4 ms.
From t1 to t2, the tested circuit breaker TB interrupts the short-circuit current (ig + iv).
In this test scheme, the amplitude of the short-circuit current interrupted by the test prototype is fixed at 20 kA, the arcing time remains unchanged at 4 ms, and the breaking energy per time is 0.8 × 10
3 kJ. The parameters of the test circuit and the measured objects are shown in
Table 1 and
Table 2.
3.2. Test Results
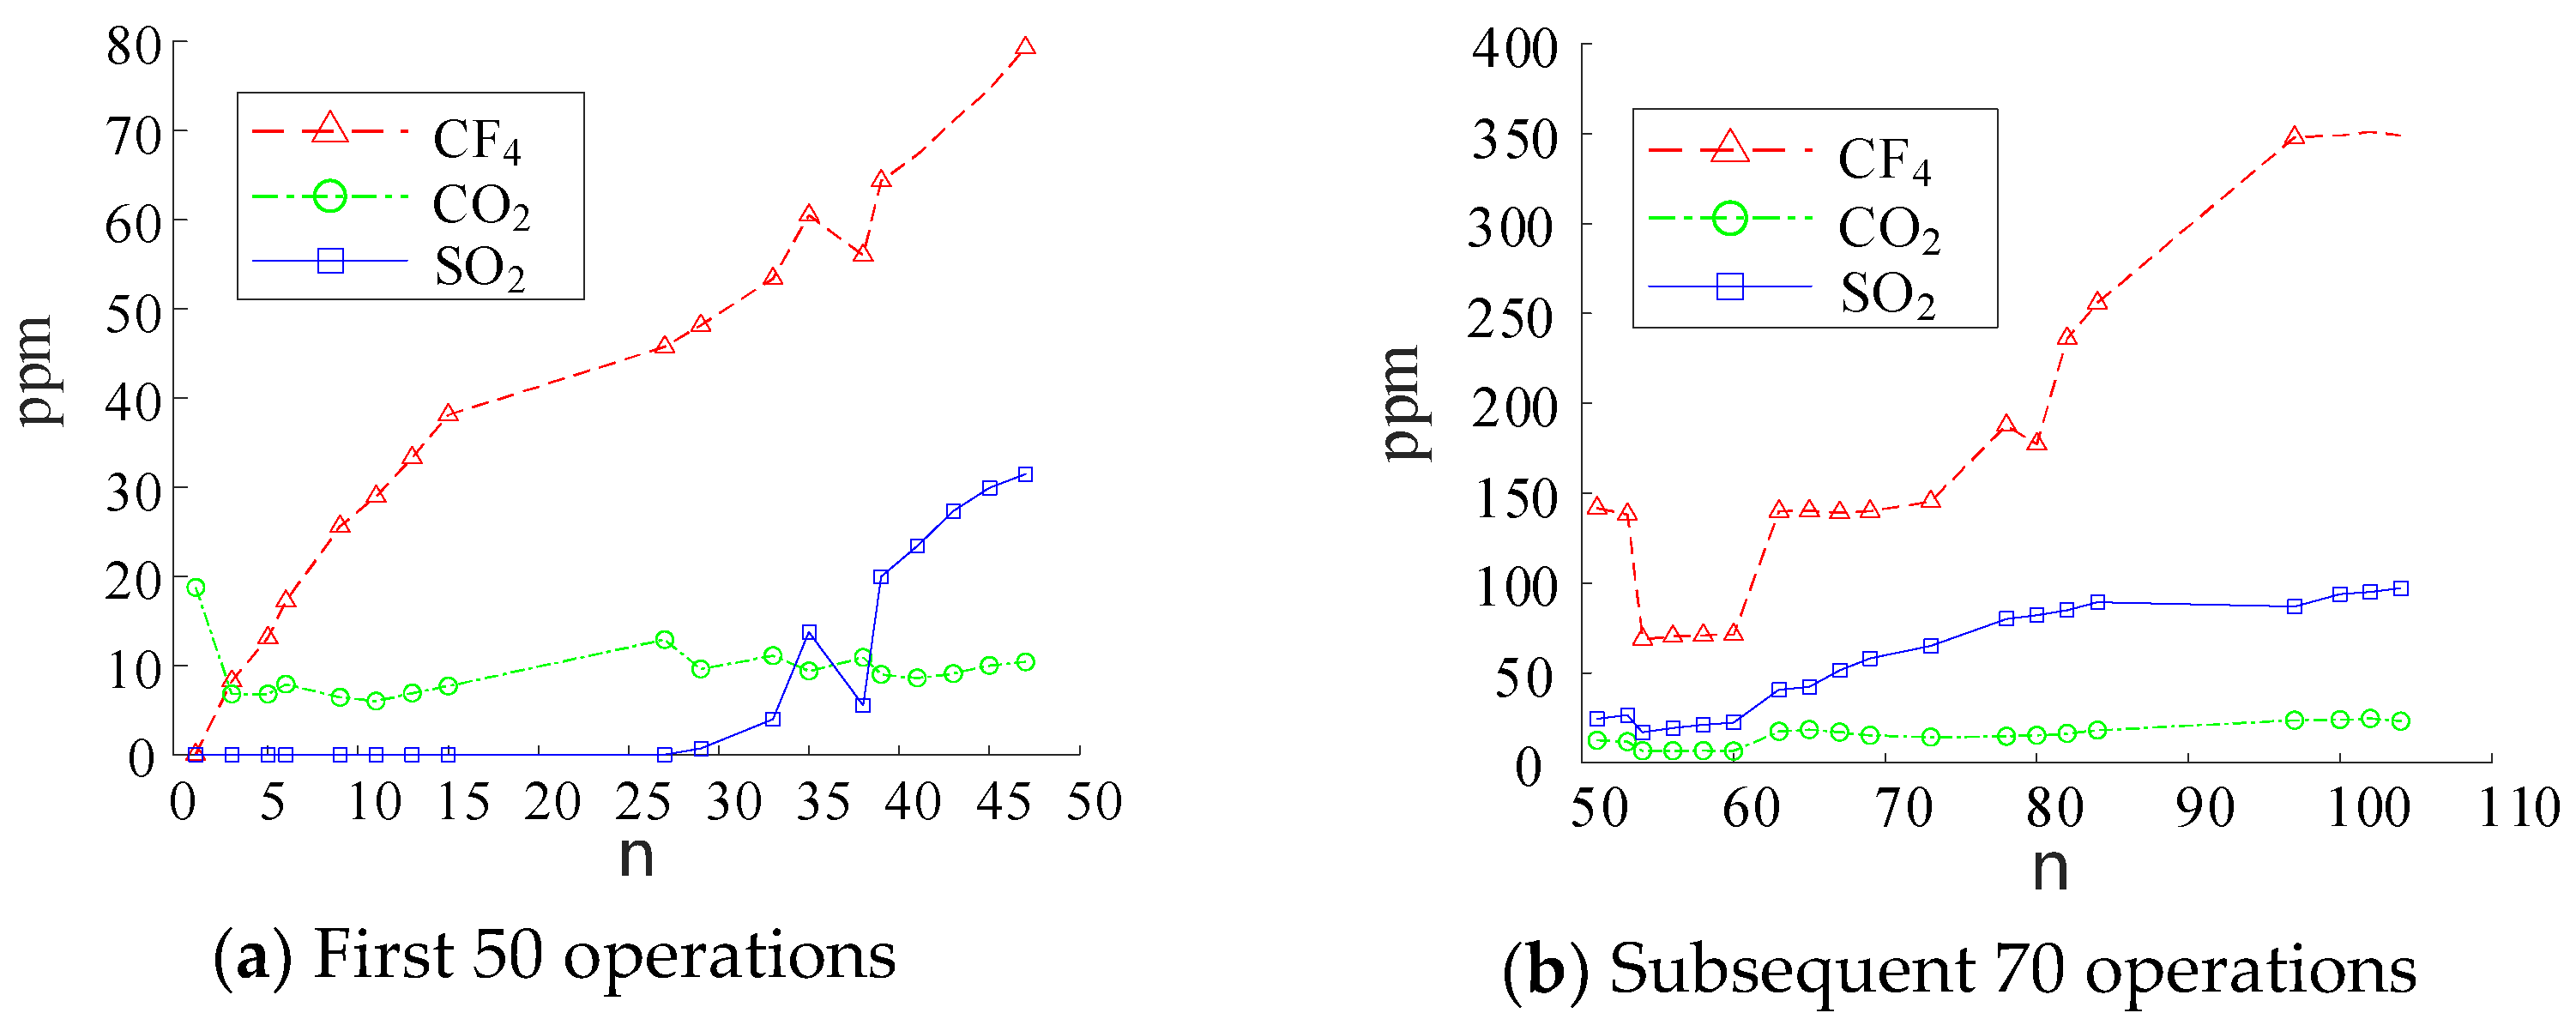
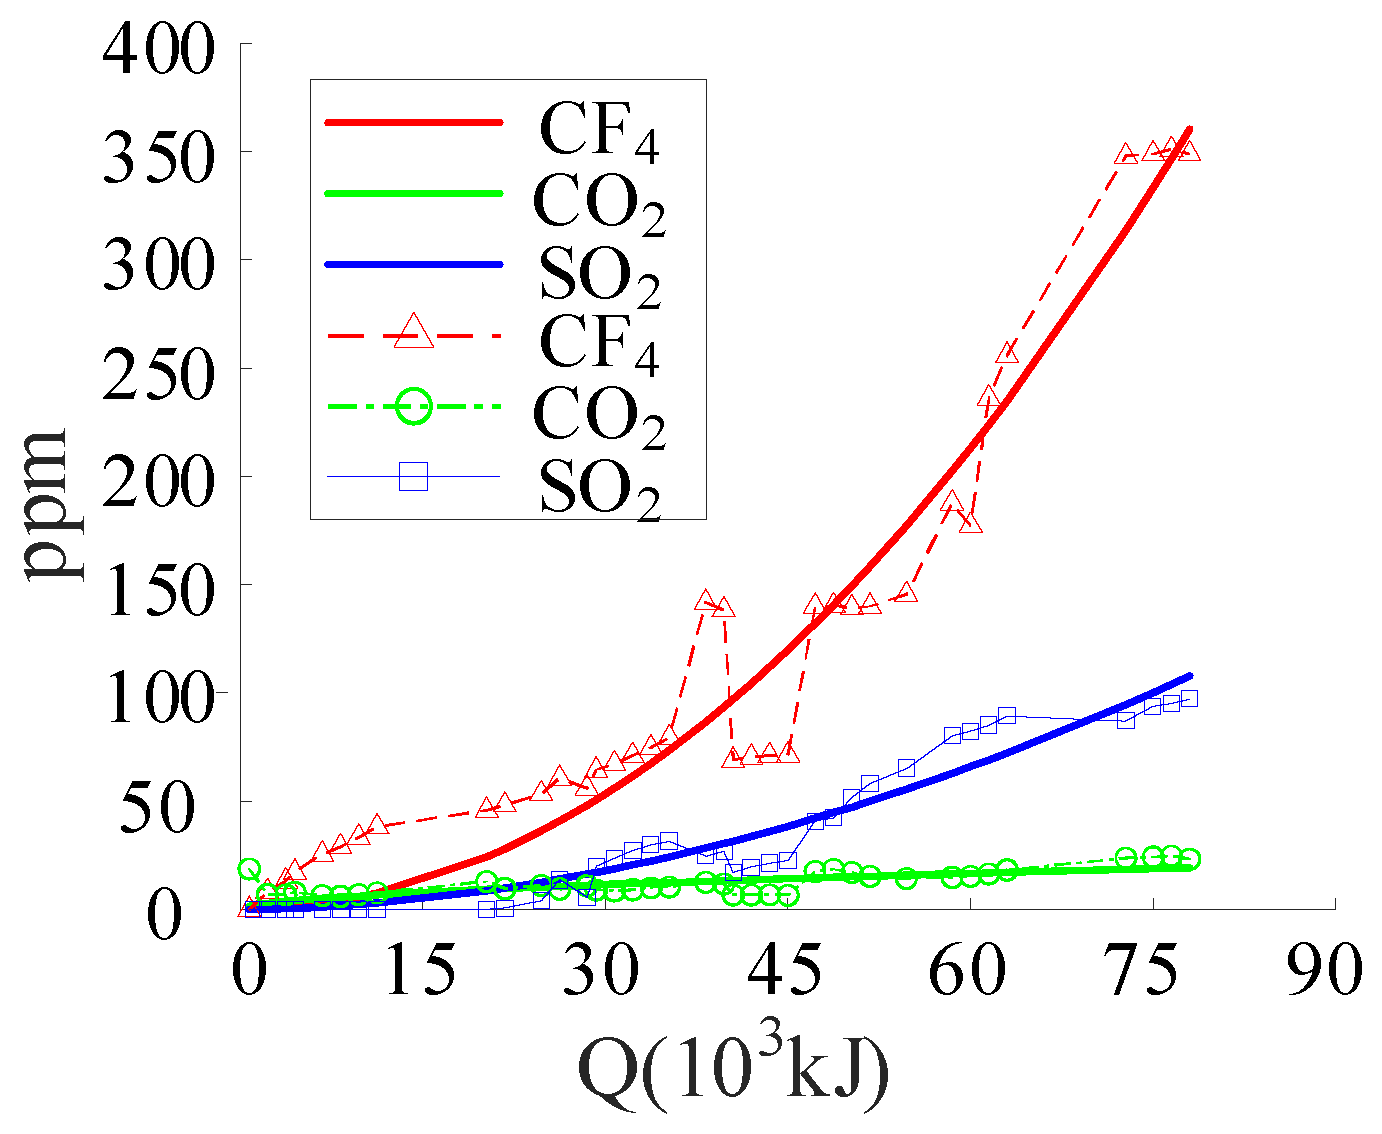
Through the data accumulated in the above test process, the relationships between the three gas components (SO2, CF4, and CO2) and the number of operations/arc energy were first analyzed as the number of operations increased and the degree of arc ablation deepened.
The variation laws of gas components with the number of operations and arc energy are shown in
Figure 6 and
Figure 7. Due to the long test duration, the test was conducted over two days: 50 making operations on the first day and 70 on the second, totaling 120 operations. As indicated by the figures, under the gas pressure of 0.6 MPa in the SF
6 arc quenching chamber, after 120 operations, the concentration of CF
4 reached the highest level at 350 ppm, followed by SO
2 at 90 ppm, and CO
2 at the lowest 18 ppm.
4. Discussion
This experiment used a 550 kV SF
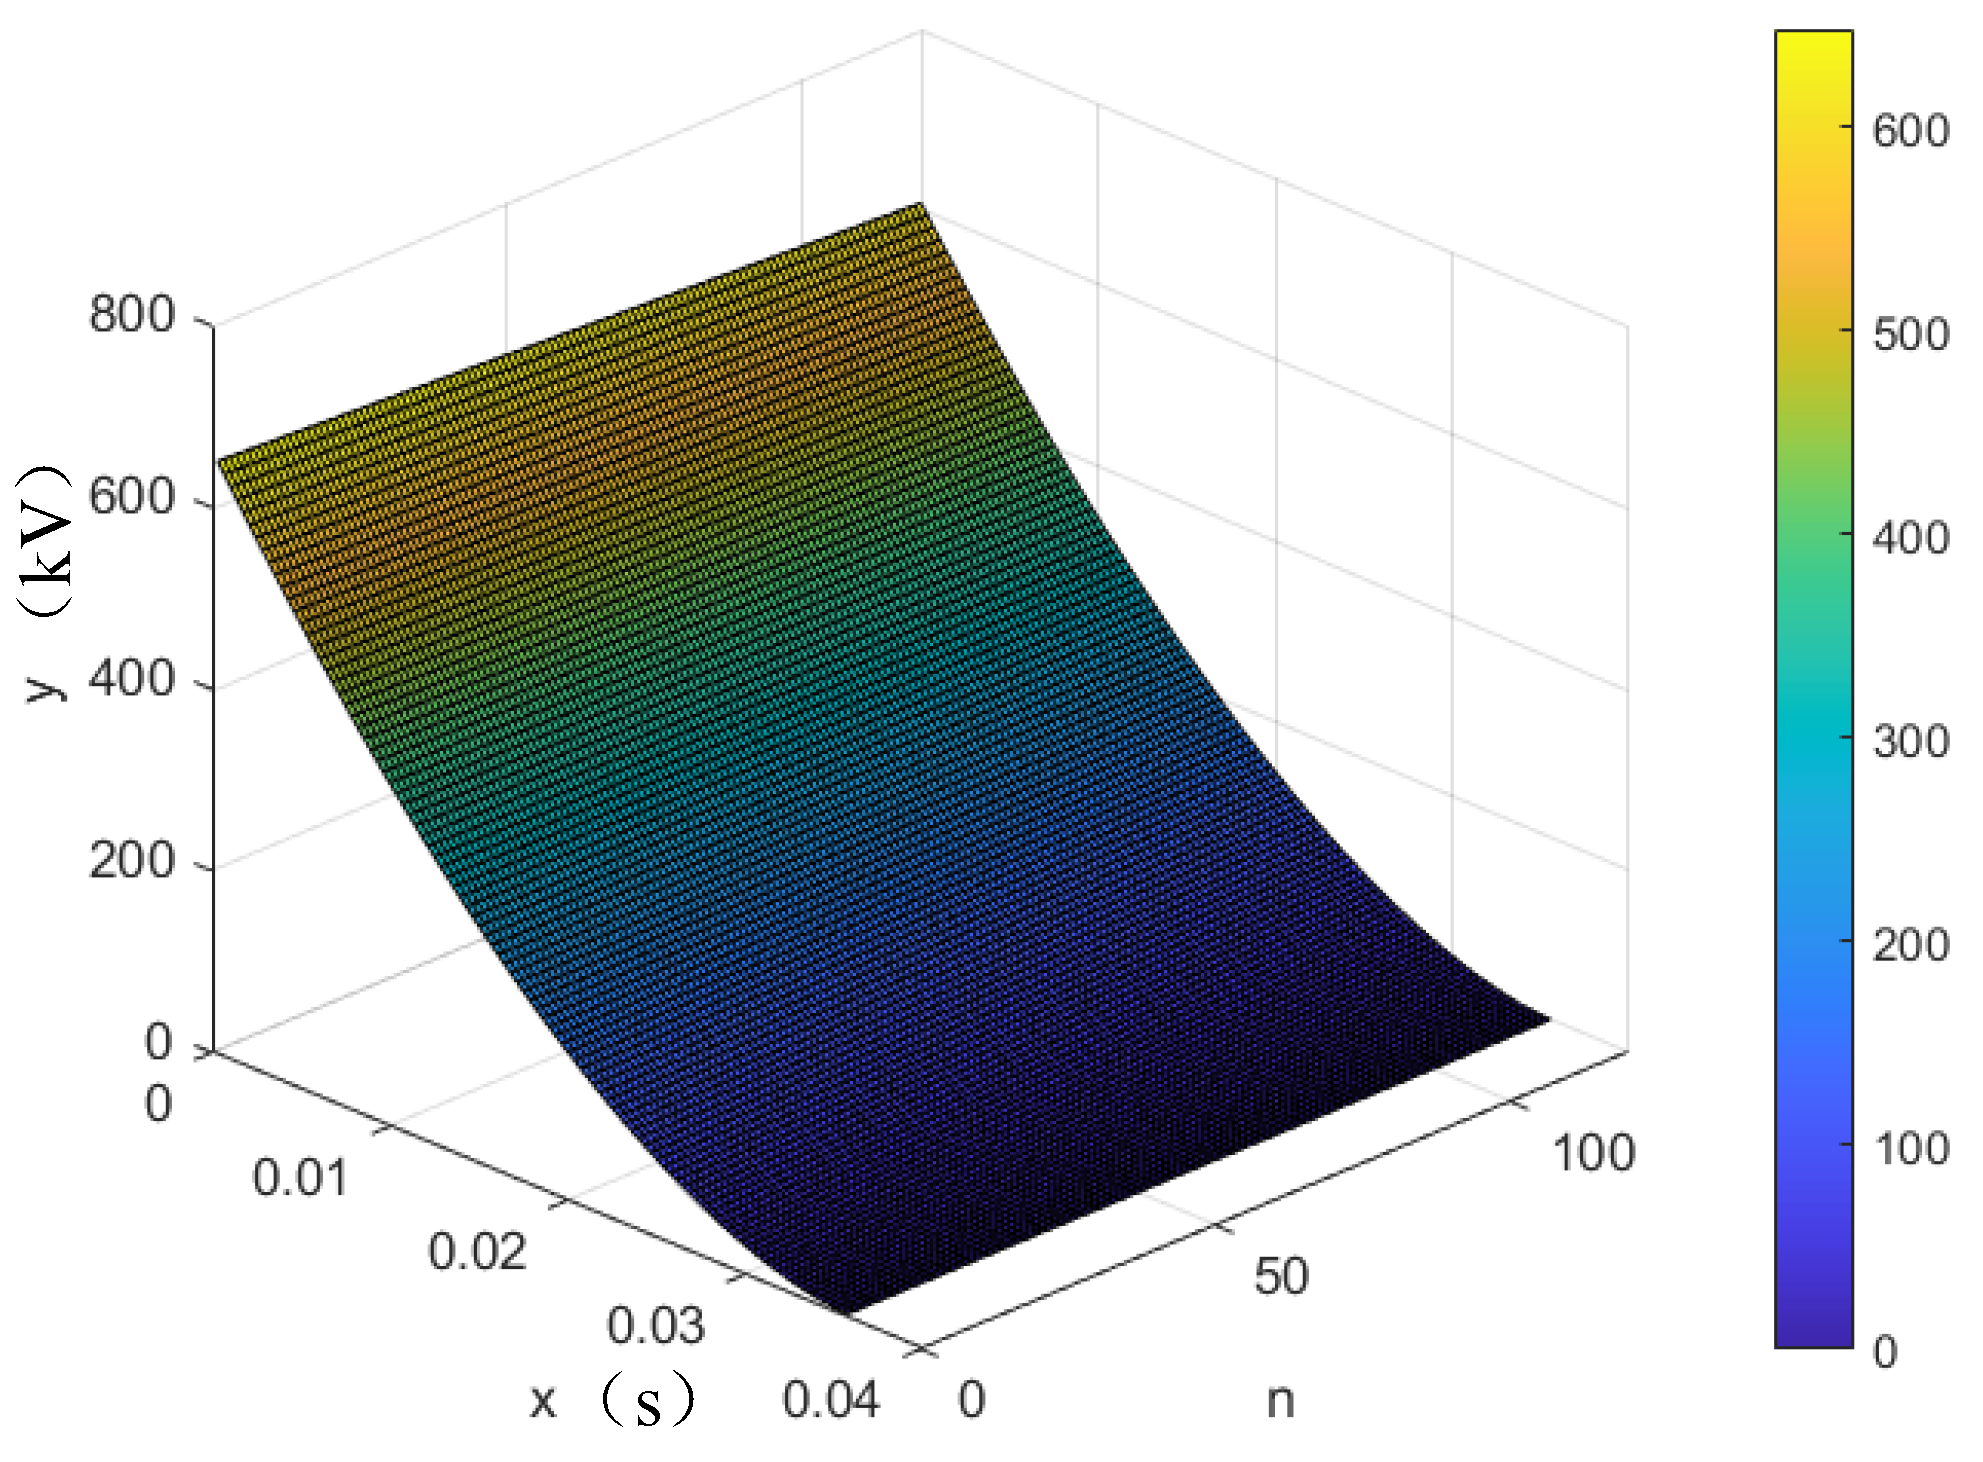
6 circuit breaker equipped with a hydraulic operating mechanism and a puffer-type arc quenching chamber. The initial gas filling pressure is 0.6 MPa, the compression cylinder diameter is 160 mm, the inner diameter of the moving arc contact is 20 mm, the total stroke is 200 mm, the overtravel is 40 mm, and the closing speed is 4.5 m/s. In the finite element simulation, the maximum electric field strength during the closing process of the arc contacts is shown in
Figure 8. The variation in breakdown voltage is calculated by the streamer theorem, and the relationship between breakdown voltage, number of operations, and contact gap is shown in
Figure 9.
By substituting the calculated breakdown voltage and electric field variation data into the analytical model in
Section 2.4, the variation law of the closing window can be explored. When only considering the condition that gas decomposition components increase with the number of operations, the variation law of pre-breakdown time with the number of operations is shown in
Table 3 and
Figure 10. It can be seen that as the number of operations increases, the degree of arc ablation intensifies. Under 120 operations, the pre-breakdown time at the optimal closing phase shows a gradual increasing trend, with a total increase of 0.1607 ms. Further introducing the electric field distortion effect caused by contact ablation, the analysis of the closing window variation is carried out, and the relevant results are shown in
Table 4 and
Figure 11. The results show that electric field distortion will further prolong the pre-breakdown time, and the increase amplitude of the closing window is more significant. This conclusion is clarified through mutual verification between experimental tests and simulation modeling.
Based on the above analysis, to address the impact of insulation medium degradation in the arc quenching chamber on the accuracy of phased closing, and to facilitate the field deployment of phased closing devices, the optimized phased closing strategy is shown in Equation (35).
In the equation, T denotes the instant when the closing command is issued, T0 represents the initial pre-breakdown value of the circuit breaker at the time of manufacture, stands for the delay time per operation, and n indicates the number of operations. During this study, the arc ablation energy associated with each operation was maintained at 0.8 × 10³ kJ to ensure consistent test conditions.
A comparison of the optimized closing strategy, original test data, and the linear function results fitted by the least squares method is shown in
Figure 12. The purple line represents the pre-breakdown time from the original test data, with the upper and lower envelope lines denoting the boundaries of two standard deviations—meaning 95.45% of the test data fall within this range. The green line is the curve fitted from the original data, while the red line shows the optimized closing strategy curve. Subplot a presents the first 50 tests, and subplot b shows the 70 tests conducted on the second day. The statistical metrics for each model are listed in
Table 5.
For the first 50 tests, the number of operations was small, so the decomposition of gas in the arc quenching chamber due to arc ablation was not significant, and the variation in pre-breakdown time was minimal. As a result, both the fitted curve and the closing strategy curve showed low consistency with the original data. In the subsequent 70 tests, after the gas in the arc quenching chamber had undergone sufficient flow and diffusion during the first 50 tests and the degree of arc ablation had deepened, the statistical metrics of the fitted curve and closing strategy with respect to the original test data were improved.
Regarding the fitted curve and closing strategy curve, the coefficient of determination (R2) measures the model’s explanatory power for data variation. In the subsequent 70 tests, the fitted curve exhibited stronger data interpretation capability, while the closing strategy still maintained high reliability. The root mean square error (RMSE) evaluates the average discrepancy between measured and true values: the fitted curve had smaller absolute errors, but the closing strategy featured a more balanced error distribution. The Akaike Information Criterion (AIC) assesses the balance between model goodness-of-fit and complexity, with the fitted curve showing better comprehensive goodness-of-fit. In terms of mean residual, both models had no significant mean difference, but the fitted curve had more concentrated errors, whereas the closing strategy curve had more dispersed errors.
In terms of the fit to original test data, the direct fitted curve shows superior statistical indicators. Although the statistical indicators of the closing strategy curve are slightly lower, its error distribution is more uniform without systematic drift. The parameters of the direct fitted curve lack clear physical meanings in mechanistic interpretation, making it difficult to reveal causal relationships between variables. In contrast, the parameters in the closing strategy curve correspond to specific physical quantities, reflecting the impact of arc ablation degree on the insulation strength of the arc quenching chamber, and can be derived based on the principle of phased closing. In terms of extrapolation prediction capability, the direct fitted curve is reliable within the range of test data but may fail due to overfitting beyond this range. The closing strategy curve can be modified according to the arc quenching chamber structure, gas components, and voltage level of the power system, demonstrating stronger generalization ability.
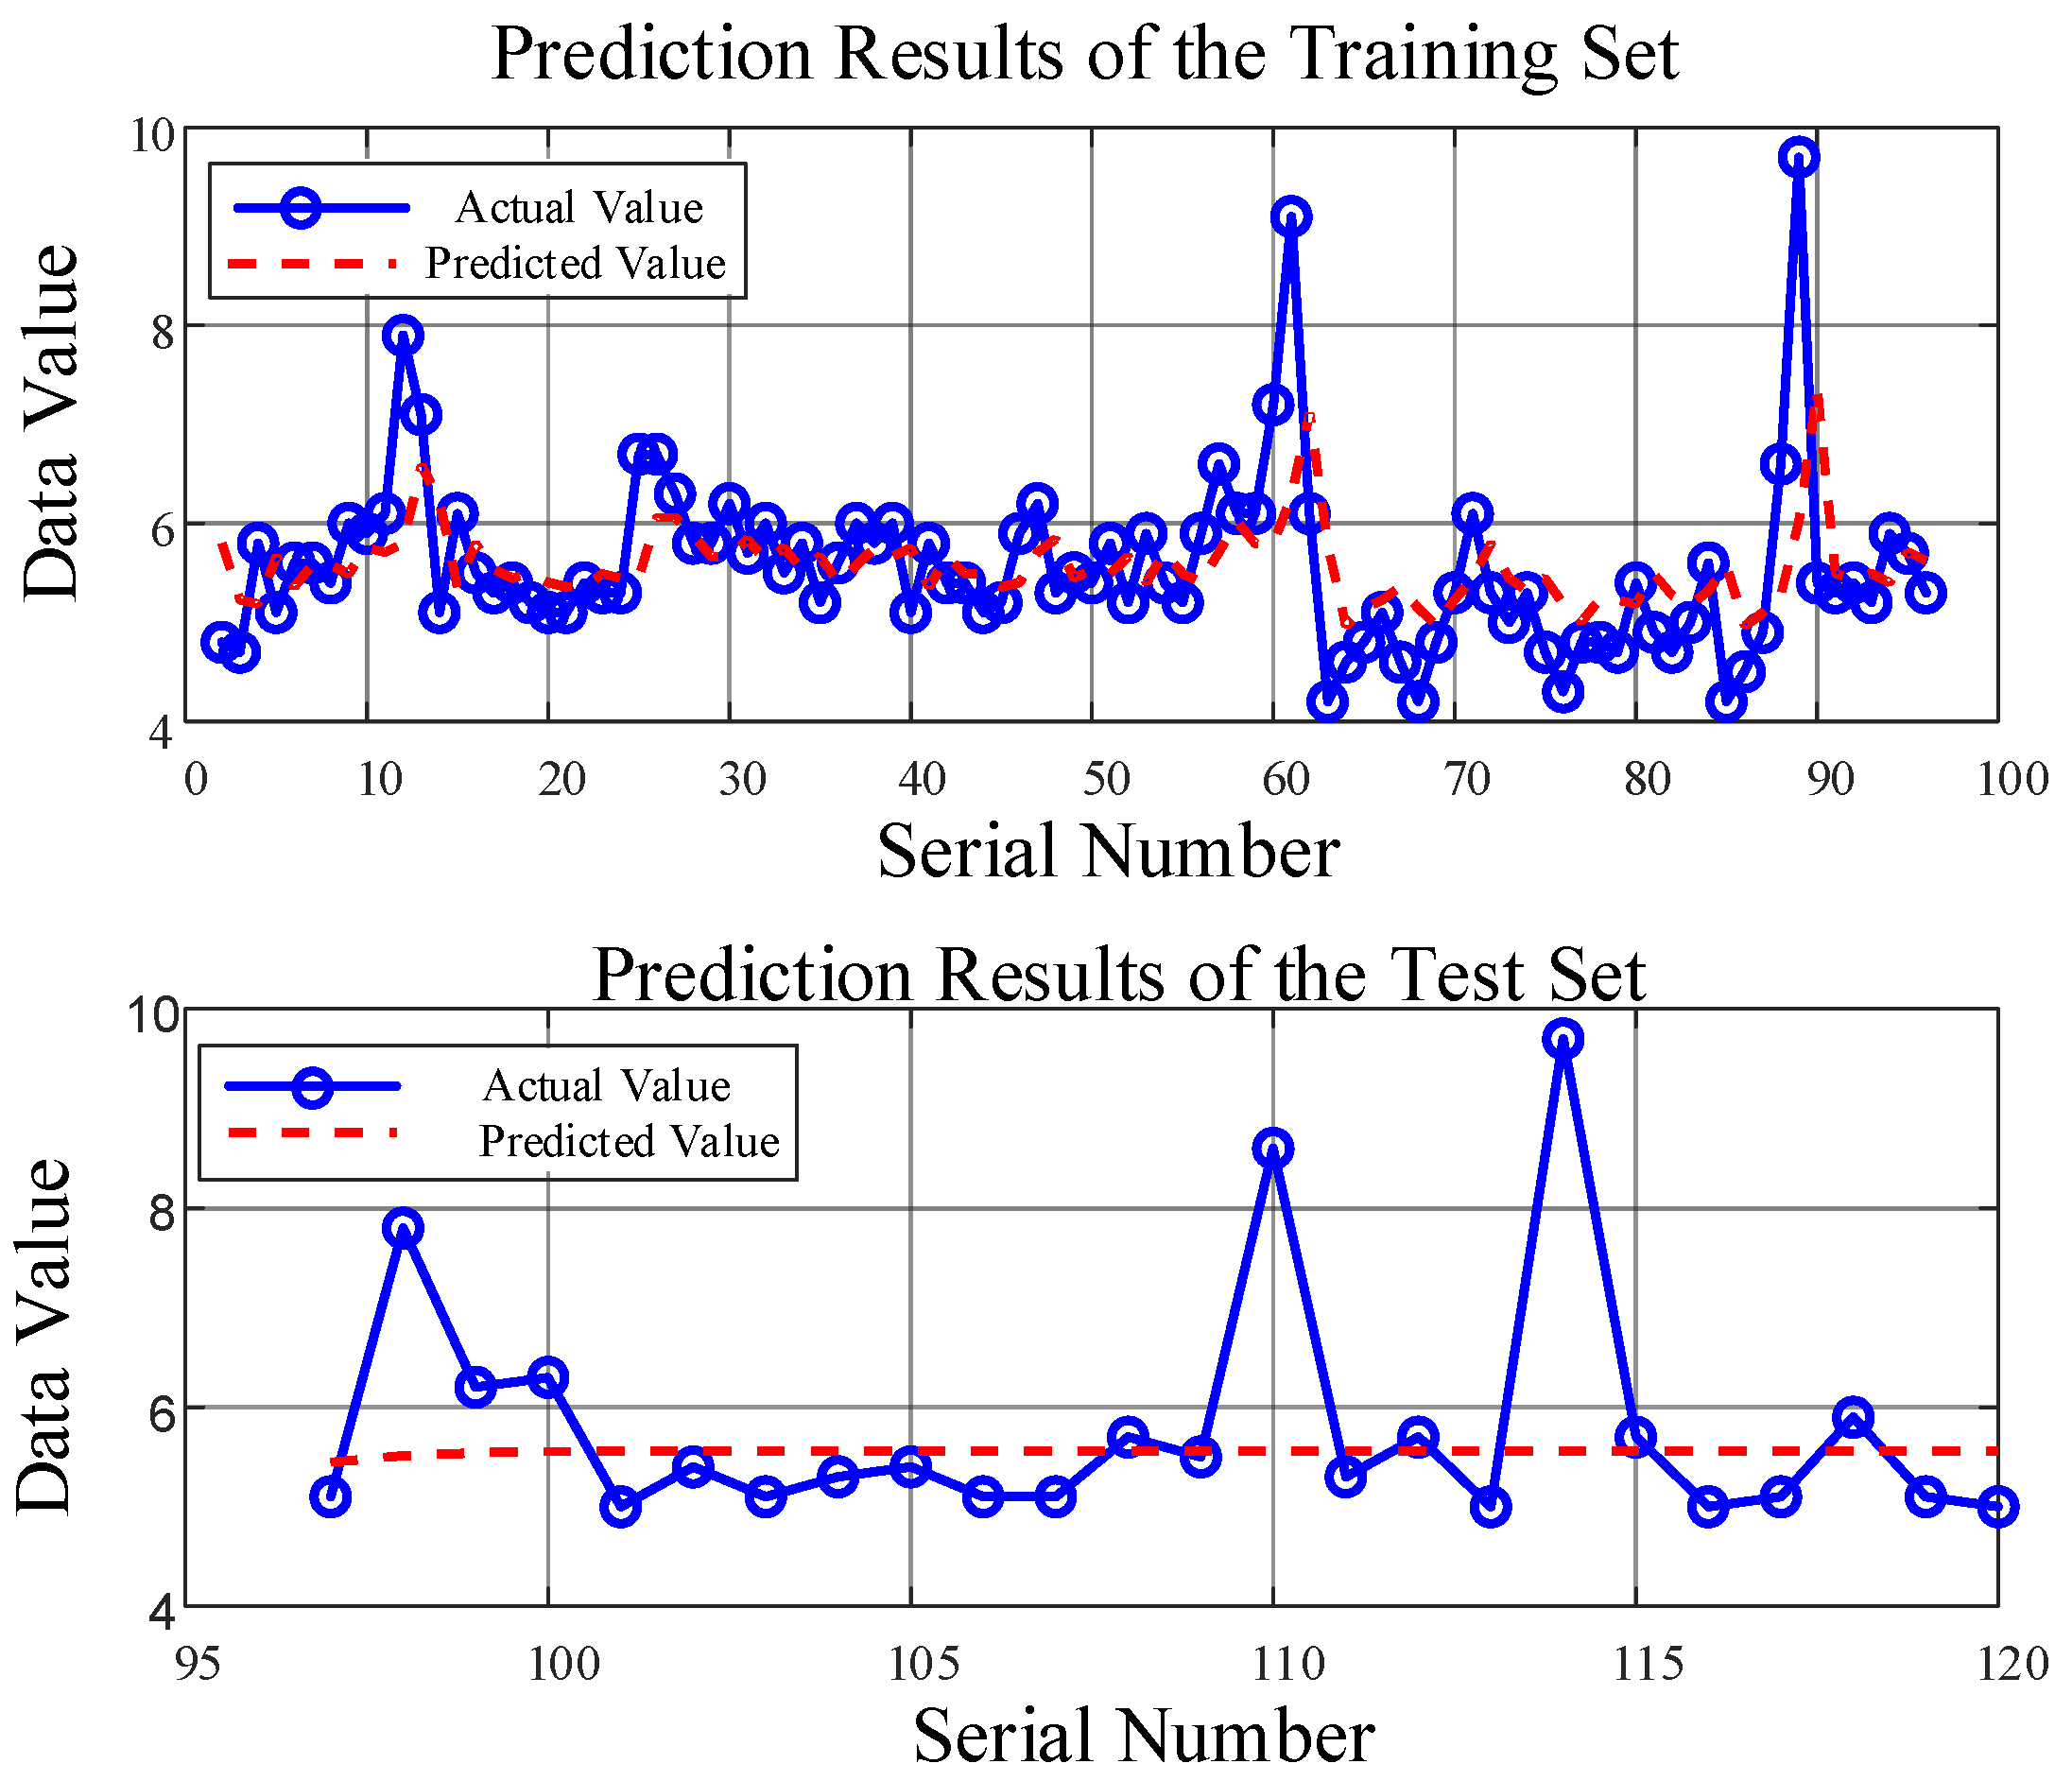
The following analysis evaluates the advantages and disadvantages of the closing strategy versus machine learning. A supervised learning method based on univariate autoregressive modeling was constructed, using 80% (96 data points) of the 120 total samples as the training set and the remaining 20% (24 points) as the test set. During prediction, a recursive iteration approach was adopted: the last point of the training set was first used to predict the first point of the test set, and subsequent predictions were generated iteratively using the previous prediction values. The prediction results for the training and test sets are shown in
Figure 13, with statistical metrics listed in
Table 6. The results indicate low R
2 values and severe overfitting, demonstrating that the current machine learning model performs unsatisfactorily and requires improvements in data preprocessing, model selection, and validation strategies. Therefore, the optimized closing strategy with clear physical meaning and superior statistical metrics is more suitable for practical operating conditions.
5. Conclusions
To address the issue of phased closing accuracy degradation in ultra-high-voltage SF6 circuit breakers, which is caused by insulation medium degradation in the arc quenching chamber due to frequent operations, this study optimizes the fixed-parameter control method and proposes an adaptive algorithm that integrates physical characteristics with dynamic adjustment. By constructing a multi-factor correlated insulation state model, the algorithm enables dynamic optimization of the closing control strategy throughout the circuit breaker’s whole life cycle, providing a new solution for enhancing power grid operation reliability.
In terms of theoretical modeling, this study focuses on the correlation between insulation degradation and closing phase. First, a breakdown voltage correction model based on the synergistic effect of mixed gases is established, which integrates the influence of variations in SF6 decomposition products (such as SO2, CF4, and CO2) to improve the accuracy of insulation strength calculations. Second, through finite element simulation of the relationship between contact gap and electric field distortion, the influence law of arc ablation-induced morphological changes on the contact surface at small gaps is revealed. Third, a correlation model considering the number of operations, insulation strength degradation rate, and closing phase is constructed, enabling an adaptive control strategy that adjusts the closing phase based on the circuit breaker’s historical operation data—this has notably mitigated the impact of insulation degradation on closing accuracy.
In the experimental verification stage, this study conducted on-line testing of interruption data and gas components for a 550 kV SF6 circuit breaker on a 600 kV test platform. Under the condition of fixed single-arc ablation energy, 120 consecutive make-and-break operations were performed to collect parameters including voltage, current, gas decomposition product concentrations, and pre-breakdown time. Analysis showed that as the number of operations increased, the fluctuation range of pre-breakdown time expanded, and a significant correlation existed between gas decomposition product concentrations and pre-breakdown time. When comparing the proposed adaptive closing algorithm with least squares and machine learning algorithms, the results indicated that the adaptive algorithm reduced the mean prediction error of pre-breakdown time, achieving a better balance between fitting performance and model complexity. This helps address issues in applying models across different equipment and environmental conditions.
The adaptive closing algorithm demonstrates practical value in engineering applications. By quantifying the insulation degradation process, it provides a reference for circuit breaker condition assessment, facilitating the development of more precise operation, maintenance, and control modes. The algorithm’s accuracy relies on the precise measurement of key parameters such as SF6 decomposition product concentrations, yet the accuracy and real-time performance of on-site monitoring equipment impose certain limitations. Additionally, the algorithm involves finite element simulation, which depends on input parameters such as contact morphology, material properties, and relative positions. Under environmental variables like high altitude and extreme temperatures, the algorithm requires further optimization by integrating specific environmental parameters.
In the future, this study will continue to improve related work by planning to introduce intensive learning techniques into the algorithm, further optimizing it by integrating on-site online monitoring data. Research on the influence of multiple environmental variables will be carried out, and cooperation with equipment manufacturers will be promoted to conduct more field tests to verify the algorithm’s effectiveness in complex environments. This is expected to provide a beneficial supplement to the development of extra-high-voltage circuit breaker control technologies.
Author Contributions
Data curation, H.L. (Hao Li), project administration and formal analysis, Q.L., resources and conceptualization, X.Y., investigation, X.J., methodology, H.L. (Haitao Li), software and validation, Z.L., writing—original draft, D.X., writing—review and editing, X.D. and M.L. All authors have read and agreed to the published version of the manuscript.
Funding
This project was supported by the Science and Technology Project of China Southern Power Grid (No. CGYKJXM20220346).
Data Availability Statement
The original contributions presented in this study are included in the article. Further inquiries can be directed to the corresponding author.
Conflicts of Interest
Author Hao Li, Qi Long, Xu Yang, Xiang Ju were employed by the company EHV Power Transmission Company China Southern Power Grid. Author Haitao Li, Zhongming Liu were employed by the company NR Electric Co., Ltd. Author Dehua Xiong, Xiongying Duan and Minfu Liao were employed by School of Electrical Engineering, Dalian University of Technology. The remaining authors declare that the research was conducted in the absence of any commercial or financial relationships that could be construed as a potential conflict of interest.
References
- Seeger, M.; Smeets, R.; Yan, J.; Ito, H.; Claessens, M.; Dullni, E.; Falkingham, L.; Franck, C.M.; Gentils, F.; Hartmann, W.; et al. Recent trends in development of high voltage circuit breakers with SF6 alternative gases. Plasma Phys. Technol. 2017, 4, 8–12. [Google Scholar] [CrossRef]
- Díaz, S.; Nuez, J.; Berdugo, K.; Gomez, K. Study of technologies implemented in the operation of SF6 switches. IOP Conf. Ser. Mater. Sci. Eng. 2020, 872, 012041. [Google Scholar] [CrossRef]
- Yanan, H.; Bin, H.; Zutao, X. Analysis of switching overvoltage and suppression measures in UHV transmission lines. Can. J. Electr. Comput. Eng. 2019, 42, 209–214. [Google Scholar] [CrossRef]
- Huang, H.; Liu, B.; Ding, Y.; Liu, K.; Bao, Y. Fault and Abnormal Analysis of Circuit Breakers Pre-insertion Resistor and Reliability Improvement Measures. In Proceedings of the 11th Frontier Academic Forum of Electrical Engineering (FAFEE2024), Chongqing, China, 20–22 June 2024; Springer: Singapore, 2025; pp. 584–595. [Google Scholar]
- Zhang, B.; Cao, M.; Wang, Z.; Zhou, R.; Deng, J.; Li, X.; Wang, Z.; Wang, P. Dielectric recovery characteristics of SF6 circuit breaker under repeated lightning strikes. Electr. Power Syst. Res. 2025, 241, 111348. [Google Scholar] [CrossRef]
- Cao, Y.; Xiao, S.; Ye, Z.; Wu, G.; Guo, Y.; Gao, G.; Sun, C.; Liu, J.; Chen, Z.; Hou, H.; et al. Analysis and suppression of operational overvoltage and inrush current for high-speed trains by automatic phase-switching technique. High Volt. 2024, 9, 733–748. [Google Scholar] [CrossRef]
- Li, H.; Liu, L.; Deng, J.; Liu, D.; Xu, L. A Scheme of Controlled Switching System in Converter Station. In Proceedings of the 2024 IEEE 6th Advanced Information Management, Communicates, Electronic and Automation Control Conference (IMCEC), Chongqing, China, 24–26 May 2024; IEEE: Piscataway, NI, USA, 2024; Volume 6, pp. 66–74. [Google Scholar]
- Qiang, Z.; Zha, L.; Jiang, X.; Han, J.; Yang, D.; Mao, W.; Wang, Y.; Pan, M.; Shan, S. Analysis of frequent switching of AC filters in multi-terminal DC transmission project. In Proceedings of the 2022 China International Conference on Electricity Distribution (CICED), Changsha, China, 7–8 September 2022; pp. 438–442. [Google Scholar]
- Minh, T.P.; Duc, H.B.; Hoai, N.P.; Cong, T.T.; Cong, M.B.; Thanh, B.D.; Quoc, V.D. Finite Element Modeling of Shunt Reactors Used in High Voltage Power Systems. Eng. Technol. Appl. Sci. Res. 2021, 4, 7411–7416. [Google Scholar] [CrossRef]
- Geng, Y.; Zhang, J.; Yao, X.; Fan, J.; Jin, Q.; Geng, Y.; Liu, Z. Capacitive making of vacuum circuit breakers: Double-break vacuum circuit breaker is superior to single-break vacuum circuit breaker. Electr. Power Syst. Res. 2022, 204, 107692. [Google Scholar] [CrossRef]
- Huang, J.; Geng, Y.; Jin, Q.; Chen, X.; Yan, J.; Geng, Y. The Influence of the Dispersion in Pre-arcing Time of Vacuum Circuit Breakers on the Controlled Switching of Capacitor Banks. In Proceedings of the 2022 6th International Conference on Electric Power Equipment-Switching Technology (ICEPE-ST), Seoul, Republic of Korea, 15–18 March 2022; IEEE: Piscataway, NI, USA, 2022; pp. 206–211. [Google Scholar]
- Yu, L.; Xue, X.; Wang, J.; Geng, Y.; Liu, Z.; Wei, S.; You, Z. Improvement of reliability of closing latch in spring type operating mechanism of high voltage circuit breakers. In Proceedings of the IEEE Power Engineering Society Transmission and Distribution Conference 2012, Orlando, FL, USA, 7–10 May 2012; IEEE: Piscataway, NI, USA, 2012; pp. 1–4. [Google Scholar]
- Camilli, G.; Gordon, G.S.; Plump, R.E. Gaseous insulation for high-voltage transformers. IEEE Trans. Power Appar. Syst. 1952, 71, 513. [Google Scholar] [CrossRef]
- Edelson, D.; Bieling, C.A.; Kohman, G.T. Electrical decomposition of Sulfur hexafluoride. Ind. Eng. Chem. 1953, 45, 2094–2096. [Google Scholar] [CrossRef]
- Rüegsegger, W.; Meier, R.; Kneubühl, F.K.; Schötzau, H.J. Mass spectrometry of arcs in SF6 circuit breakers. Appl. Phys. B 1985, 37, 115–135. [Google Scholar] [CrossRef]
- Belmadani, B.; Casanovas, J.; Casanovas, A.M.; Grob, R.; Mathieu, J. SF6 decomposition under power arcs: Physical aspects. IEEE Trans. Electr. Insul. 1991, 26, 1163–1176. [Google Scholar] [CrossRef]
- Bagherpoor, A.; Rahimi-Pordanjani, S.; Razi-Kazemi, A.A.; Niayesh, K. Online condition assessment of interruption chamber of gas circuit breakers using arc voltage measurement. IEEE Trans. Power Deliv. 2017, 32, 1776–1783. [Google Scholar] [CrossRef]
- Ye, R.; Dong, M.; Liu, J.; Ren, M.; Xie, J.; Ma, A.; Wang, L. Research on SF 6 gas decomposition detection method based on electrochemical sensors. In Proceedings of the 2016 International Conference on Condition Monitoring and Diagnosis (CMD), Xi’an, China, 25–28 September 2016; IEEE: Piscataway, NI, USA, 2016; pp. 530–533. [Google Scholar]
- Ji, Y.; Yuan, S.; Jiang, Y.; Bi, J.; Fang, H.; Xiu, S. Study on the Method of Analyzing Low Concentration SF 6 Gas Decomposition Products Using Cryogenic Enrichment-gas Chromatography. In Proceedings of the 2024 IEEE 2nd International Conference on Power Science and Technology (ICPST), Dali, China, 9–11 May 2024; IEEE: Piscataway, NI, USA, 2024; pp. 141–145. [Google Scholar]
- Miao, Y.; Wu, S.; Tang, J.; Zeng, F.; Yao, Q.; Zhang, C. Internal fault diagnosis of SF 6 high voltage circuit breaker based on gas composition analysis. In Proceedings of the 2018 IEEE International Conference on High Voltage Engineering and Application (ICHVE), Athens, Greece, 10–13 September 2018; IEEE: Piscataway, NI, USA, 2018; pp. 1–4. [Google Scholar]
- Wang, X.; Long, Y.; Xiu, S.; Chen, Z.; Sun, Z. Analysis of SF 6 Solid Decomposition Products after Breaking Tests. In Proceedings of the 2019 2nd International Conference on Electrical Materials and Power Equipment (ICEMPE), Guangzhou, China, 7–10 April 2019; IEEE: Piscataway, NI, USA, 2019; pp. 635–638. [Google Scholar]
- Fu, L.; Guan, Y.; Zhang, L.; Zhang, D.; Wang, H.; Chi, J.; Wei, B. A potential fault of circuit breaker found using SF6 decomposition products detection. J. Phys. Conf. Ser. 2022, 2246, 012004. [Google Scholar] [CrossRef]
- Wen, H.; Zhang, X. Overheating decomposition characteristics of epoxy dielectrics in SF6 atmosphere. IEEE Trans. Dielectr. Electr. Insul. 2019, 26, 1411–1417. [Google Scholar] [CrossRef]
- Liu, A.; Wu, Z.; Wang, Y.; Ma, S. A Novel Control Strategy of Phase-Controlled Switching Technology for Vacuum Circuit Breaker. IEEE Access 2022, 10, 43571–43582. [Google Scholar] [CrossRef]
- Chong, J.; Zhao, L.; Wang, L. Research and Analysis on the Sensor for Testing the Opening and Closing Speed of Circuit Breakers. In Proceedings of the 2023 IEEE 5th International Conference on Civil Aviation Safety and Information Technology (ICCASIT), Dali, China, 11–13 October 2023. [Google Scholar]
- Yan, H.; Lin, X.; Xu, J.; Valdez-Resendiz, J. Research on the Influencing Factors of Motion Characteristics and Buffering of Electromagnetic Repulsion Mechanism of High Voltage Circuit Breakers. Math. Probl. Eng. 2022, 2022, 7856299. [Google Scholar] [CrossRef]
- Fu, Z.; Chen, W.; Li, Z.; Liu, B.; Xing, G.; Li, B. Measurement Method and Influencing Factors of the Dynamic Contact Resistance of SF6 Circuit Breakers. Gaodianya Jishu/High Volt. Eng. 2017, 43, 1535–1542. [Google Scholar]
- Guo, Y.; Wang, Y.; Li, H.; Wang, M.; Wang, G. An Adaptive Reclosing Strategy for Mechanical DC Circuit Breaker. Gaodianya Jishu/High Volt. Eng. 2022, 48, 1961–1969. [Google Scholar]
- Su, H.; Mo, W.; Wang, Y.; Gan, L.; Liu, J.; Guo, Z.; Gu, L.; Zhu, L.; Chen, L.; Qiao, S. Influence of Different Factors on the Interruption Characteristics of Paralleled of High-Voltage SF6 Circuit Breakers with a Highly Coupled Split Reactor. Lect. Notes Electr. Eng. 2020, 598, 300–307. [Google Scholar]
- Duan, X.; Zhang, F.; Liao, M.; Zou, J. Closing Performance of Phase-control Circuit Breakers in Ultra-high Voltage Networks. Zhongguo Dianji Gongcheng Xuebao/Proc. Chin. Soc. Electr. Eng. 2019, 39, 5271–5278. [Google Scholar]
- GB/T 8905-2012; The Guide for Management and Measuring SF6 Gas in Electrical Equipment. Standards Press of China: Beijing, China, 2012.
- Mustata, F.; Tudorachi, N. Thermal behavior of epoxy resin cured with aromatic dicarboxylic acids. J. Therm. Anal. Calorim. 2016, 125, 97–110. [Google Scholar] [CrossRef]
- Ma, C.; Sánchez-Rodríguez, D.; Kamo, T. A comprehensive study on the oxidative pyrolysis of epoxy resin from fiber/epoxy composites: Product characteristics and kinetics. J. Hazard. Mater. 2021, 412, 125329. [Google Scholar] [CrossRef] [PubMed]
- Zhou, K.; Gao, R.; Qian, X. Self-assembly of exfoliated Molybdenum disulfide (MoS2) nanosheets and layered double hydroxide (LDH): Towards reducing fire hazards of epoxy. J. Hazard. Mater. 2017, 338, 343–355. [Google Scholar] [CrossRef] [PubMed]
- Wen, H.; Zhang, X.; Xia, R.; Yang, Z.; Wu, Y. Thermal decomposition properties of epoxy resin in SF6/N2 mixture. Materials 2019, 12, 75. [Google Scholar] [CrossRef]
- Wang, Y.; Liang, J.Q.; Yu, C.L.; Li, L.; Zhang, H.D.; Li, G.X. Research on the synergy of SF6/N2 mixture gas in low temperature environment. IOP Conf. Ser. Mater. Sci. Eng. 2019, 479, 012045. [Google Scholar] [CrossRef]
- CIGRÉ Working Group 13.07. Overall benefits of controlled switching. Electra 2002, 9, 1–4. [Google Scholar]
- Prikler, L.; Bánfai, G.; Bán, G.; Becker, P. Reducing the magnetizing inrush current by means of controlled energization and de-energization of large power transformers. Electr. Power Syst. Res. 2006, 76, 642–649. [Google Scholar] [CrossRef]
- Guan, Y.; Liu, W.; Xu, G.; Zheng, X.; Du, N.; Wu, J.; Yin, J.; Zhang, H.; Zhang, Y. Fundamental tests for 550 kV SF6 synchronous circuit breaker. In Proceedings of the 2009 IEEE International Conference on Mechatronics and Automation, Changchun, China, 9–12 August 2009; pp. 2602–2606. [Google Scholar]
- Parikh, U.; Bhalja, B.R. Challenges in field implementation of controlled energization for various equipment loads with circuit breakers considering diversified dielectric and mechanical characteristics. Int. J. Electr. Power Energy Syst. 2017, 87, 99–108. [Google Scholar] [CrossRef]
- Bhatt, K.A.; Bhalja, B.R.; Parikh, U.B. Evaluation of controlled energisation of an unloaded power transformer for minimising the level of inrush current and transient voltage distortion using PIR-CBs. IET Gener. Transm. Distrib. 2018, 12, 2788–2798. [Google Scholar] [CrossRef]
- Ma, F.; Xu, C.; Niu, B.; Wang, Y.; Xiang, Z.; Wu, Q.; Bao, J. SF6 Experimental Study on the Variation Characteristics of Closing Prebreak down Duration during Contact Deterioration of Circuit Breakers. Energies 2024, 17, 4389. [Google Scholar] [CrossRef]
- GB/T 11022-2020; Common Specifications for High-Voltage Alternating-Current Switchgear and Controlgear Standards. Standards Press of China: Beijing, China, 2020.
Figure 1.
Pre-breakdown at the voltage zero-crossing point and the optimal closing time.
Figure 1.
Pre-breakdown at the voltage zero-crossing point and the optimal closing time.
Figure 2.
Pre-breakdown at the voltage zero-crossing point and the optimal closing time under the non-linear condition of RDDS.
Figure 2.
Pre-breakdown at the voltage zero-crossing point and the optimal closing time under the non-linear condition of RDDS.
Figure 3.
Schematic diagram of test circuit.
Figure 3.
Schematic diagram of test circuit.
Figure 4.
Physical diagram of test circuit.
Figure 4.
Physical diagram of test circuit.
Figure 5.
Voltage and current diagram of the circuit breaker contact.
Figure 5.
Voltage and current diagram of the circuit breaker contact.
Figure 6.
The relationship between the number of closing operations and gas composition.
Figure 6.
The relationship between the number of closing operations and gas composition.
Figure 7.
Diagram of the relationship between cumulative arc energy and decomposed gas products.
Figure 7.
Diagram of the relationship between cumulative arc energy and decomposed gas products.
Figure 8.
The variation in maximum electric field strength during the closing process.
Figure 8.
The variation in maximum electric field strength during the closing process.
Figure 9.
Relationship between breakdown voltage, number of operations, and closing time.
Figure 9.
Relationship between breakdown voltage, number of operations, and closing time.
Figure 10.
The relationship between the number of operations and pre-breakdown time.
Figure 10.
The relationship between the number of operations and pre-breakdown time.
Figure 11.
The relationship between the number of operations and pre-breakdown time.
Figure 11.
The relationship between the number of operations and pre-breakdown time.
Figure 12.
The relationship between the number of operations and pre-breakdown time in experiments and simulation calculations.
Figure 12.
The relationship between the number of operations and pre-breakdown time in experiments and simulation calculations.
Figure 13.
Machine learning prediction results.
Figure 13.
Machine learning prediction results.
Table 1.
Main parameters of test circuit.
Table 1.
Main parameters of test circuit.
| Serial Number | Letter | Definition | Serial Number | Letter | Definition |
|---|
| 1 | G | Short-Circuit Generator | 8 | AB | Auxiliary Breaker |
| 2 | MB | Make–Break Switch | 9 | TB | Test Breaker |
| 3 | L | Reactor | 10 | RCVDT | Resistive–Capacitive Voltage Divider |
| 4 | PT | Transformer | 11 | Ls | Reactor |
| 5 | R1 | Resistor | 12 | Us | Capacitor |
| 6 | C1 | Capacitor | 13 | GP | Spark Gap |
| 7 | APC | Arc-Prolonging Circuit | 14 | RVDT | Resistive Voltage Divider |
Table 2.
Measured physical quantities.
Table 2.
Measured physical quantities.
| Serial Number | Letter | Definition | Serial Number | Letter | Definition |
|---|
| 1 | Uc | Charging Voltage | 6 | Iac | Cumulative Breaking Current |
| 2 | Ut | Test Voltage | 7 | Ebrk | Single Breaking Energy |
| 3 | Tcl | Making Time | 8 | CCF4 | CF4 Concentration |
| 4 | Tchg | Closing Time | 9 | CCO2 | CO2 Concentration |
| 5 | Tpb | Pre-Breakdown Time | 10 | CSO2 | SO2 Concentration |
Table 3.
Pre-breakdown time under different operation times.
Table 3.
Pre-breakdown time under different operation times.
| |
Pre-Breakdown
Time | TA/ms | TC/ms | TB/ms |
|---|
|
Operation Count |
|
|---|
| 0 | 4.897 | 5.556 | 6.311 |
| 30 | 4.943 | 5.596 | 6.338 |
| 60 | 4.985 | 5.631 | 6.388 |
| 90 | 5.026 | 5.676 | 6.396 |
| 120 | 5.082 | 5.725 | 6.519 |
| deviation | 0.185 | 0.1607 | 0.2083 |
Table 4.
Pre-breakdown time considering nonlinearity of RDDS.
Table 4.
Pre-breakdown time considering nonlinearity of RDDS.
| |
Pre-Breakdown
Time | TA′/ms | TC′/ms | TB′/ms |
|---|
|
Operation Count |
|
|---|
| 0 | 4.620 | 5.320 | 6.020 |
| 30 | 4.655 | 5.374 | 6.058 |
| 60 | 4.698 | 5.422 | 6.109 |
| 90 | 4.756 | 5.497 | 6.188 |
| 120 | 4.871 | 5.556 | 6.241 |
| deviation | 0.166 | 0.236 | 0.196 |
Table 5.
Comparison of fitting curves and switching strategy statistical indicators.
Table 5.
Comparison of fitting curves and switching strategy statistical indicators.
| |
Model | Fitting Curve (1st 50 No.) | Closing Strategy (1st 50 No.) | Fitting Curve (Last 70 No.) | Closing Strategy (Last 70 No.) |
|---|
|
Statistical Index |
|
|---|
| R2 | 0.63 | 0.52 | 0.95 | 0.90 |
| RMSE | 0.35 | 0.43 | 0.05 | 0.07 |
| AIC | 26 | 30 | 12.8 | 14.3 |
| Residual Mean | 0.13 | 0.15 | 0.002 | −0.001 |
| Residual Standard Deviation | 0.3 | 0.35 | 0.04 | 0.06 |
Table 6.
Machine learning statistical indicators.
Table 6.
Machine learning statistical indicators.
| |
Model | Test Set (Top 80%) | Prediction Set (Bottom 20%) |
|---|
|
Statistical Index |
|
|---|
| R2 | 0.1926 | −0.0435 |
| RMSE | 0.7739 | 1.214 |
| AIC | −44.71 | 13.32 |
| Residual Mean | 0 | 0.2415 |
| Residual Standard Deviation | 0.7780 | 1.215 |
| Disclaimer/Publisher’s Note: The statements, opinions and data contained in all publications are solely those of the individual author(s) and contributor(s) and not of MDPI and/or the editor(s). MDPI and/or the editor(s) disclaim responsibility for any injury to people or property resulting from any ideas, methods, instructions or products referred to in the content. |
© 2025 by the authors. Licensee MDPI, Basel, Switzerland. This article is an open access article distributed under the terms and conditions of the Creative Commons Attribution (CC BY) license (https://creativecommons.org/licenses/by/4.0/).


 ,
, 


