Review

Analysis of Infrastructure Requirements for Sustainable Transportation Technologies

by
Richard A. Dunlap
Department of Physics and Atmospheric Science, Dalhousie University, Halifax, NS B3H 4R2, Canada
Energies 2025, 18(13), 3556; https://doi.org/10.3390/en18133556
Submission received: 13 June 2025 / Revised: 30 June 2025 / Accepted: 2 July 2025 / Published: 5 July 2025
(This article belongs to the Special Issue The Future of Renewable Energy: 2nd Edition)

Abstract

At present, transportation energy comes primarily from fossil fuels. In order to mitigate the effects of greenhouse gas emissions, it is necessary to transition to low-carbon transportation technologies. These technologies can include battery electric vehicles, fuel cell vehicles and biofuel vehicles. This transition includes not only the development and production of suitable vehicles, but also the development of appropriate infrastructure. For example, in the case of battery electric vehicles, this infrastructure would include additional grid capacity for battery charging. For fuel cell vehicles, infrastructure could include facilities for the production of suitable electrofuels, which, again, would require additional grid capacity. In the present paper, we look at some specific examples of infrastructure requirements for battery electric vehicles and vehicles using hydrogen and other electrofuels in either internal combustion engines or fuel cells. Analysis includes the necessary additional grid capacity, energy storage requirements and land area associated with renewable energy generation by solar photovoltaics and wind. The present analysis shows that the best-case scenario corresponds to the use of battery electric vehicles powered by electricity from solar photovoltaics. This situation corresponds to a 47% increase in grid electricity generation and the utilization of 1.7% of current crop land.

1. Introduction

The transition to low-carbon energy technologies is essential for the mitigation of the effects of climate change. One of the most challenging aspects of this transition is the development and implementation of suitable alternatives to our current fossil fuel-dominated transportation system. In most cases, a suitable portable energy carrier is needed. Such a carrier may, for example, be batteries, hydrogen or a biofuel. In each case, appropriate infrastructure needs to be in place to effectively utilize each transportation technology. For example, battery electric vehicles require suitable materials for battery manufacture, a suitable charging infrastructure and appropriate grid capacity for charging. Hydrogen-based technologies require a suitable infrastructure for hydrogen storage and distribution along with the necessary grid capacity for hydrogen production. The present paper reviews the infrastructure requirements of different sustainable transportation technologies that utilize either batteries or electrofuels such as hydrogen and its derivatives with specific emphasis on an analysis of overall efficiencies, additional grid capacity requirements, energy storage requirements and land utilization. As renewable energy development is, at present, aimed primarily at developing additional solar photovoltaic and wind-generating capacity, we look specifically at the requirements for the application of these technologies to sustainable transportation needs. The analysis presented here provides an estimate of required resources to provide support for sustainable transportation technology. The required additional grid generation and capacity is compared to the current grid supply. Estimated electric grid storage capacity is compared to current pumped hydroelectric and battery storage capacity. Finally, additional land requirements are compared to current land used globally for crop production. The results presented here will provide insight into the way in which different transportation energy technologies would fit into our overall future energy systems. This will be of use to scientists and engineers working in this area, as well as managers and policy makers.

2. Overview of Current Transportation Technologies and Greenhouse Gas Emissions

A breakdown of past and current world primary energy consumption is shown in Figure 1. For 2023, the total energy consumption amounted to 164,385 TWh, which is equivalent to 5.92 × 10¹¹ GJ. Transportation accounts for 1.49 × 10¹¹ GJ, or about 25%, of primary energy use [1]. As seen in Table 1, fossil fuels account for the vast majority of primary energy use.
End user energy is less than primary energy as a result of conversion losses, transmission and distribution losses and end use equipment inefficiencies. This is illustrated schematically in Figure 2. These losses are particularly important for energy conversions that involve thermal generation of electricity and play an important role in the establishment of viable sustainable transportation systems. A more detailed analysis of the relationship between primary energy and end sector energy for the United States in 2023 is shown in the Sankey diagram in Figure 3. In this case, equipment losses are not included.
A breakdown of primary global transportation energy is shown in Figure 4. Currently, fossil fuels account for nearly all transportation energy, where diesel fuel represents about 37% of primary transportation energy and gasoline represents about 40%. Transportation, therefore, is an important contributor to greenhouse gas emissions. The contribution of transportation and other anthropogenic activities to greenhouse gas emissions is summarized in Figure 5. Any approach to mitigate the effects of greenhouse gas emissions must include efforts to decarbonize the transportation sector. In particular, road transportation is a major contributor to both transportation energy use, as well as greenhouse gas emissions. The relative importance of different modes of transportation is summarized in Table 2. In the remainder of the present section, we look at the details of the current energy sources and resulting greenhouse gas emissions for the different modes of transportation summarized in the table.

2.1. Road Transportation

A breakdown of world transportation energy showing the different classes of road vehicles is illustrated in Figure 6. Table 3 gives the percentages of energy utilized by these different classes of road vehicles. Passenger vehicles (i.e., light-duty road vehicles) account for about two thirds of road vehicle energy use and are largely fueled by gasoline. The remainder is primarily associated with freight and relies heavily on diesel fuel.
World transportation energy requirements are expected to increase continuously over the next few decades as shown in Figure 4. According to the U. S. Energy Information Administration predictions, transportation energy will remain dominated by gasoline and diesel fuel at least until 2040.
The case of road transportation by light-duty vehicle can be considered in more detail and the overall energy use changes can be seen to be the result of several competing factors. Over the past five decades or so, there has been significant improvement in the efficiency of internal combustion engine vehicles. This is illustrated by the graph in Figure 7 for different classes of passenger vehicles in the United States. Note that “Car SUV” (Sport Utility Vehicle) is defined by a gross vehicle weight of less than 6000 pounds and 2 WD, while “Truck SUVs” are defined as having a gross vehicle weight of over 6000 pounds or 4 WD. Significant improvement in fuel efficiency is shown for the period from the mid-1970s to the mid-1980s. Another period of improvement is seen to begin in the mid-2000s.
The improved vehicle fuel efficiency as shown in Figure 7 is countered by other factors. Firstly, the overall global transportation requirements that result from population increase and increased industrialization of developing countries. This is illustrated in Figure 8. As well, in many industrialized countries, there is a shift to the use of larger less fuel-efficient vehicles for private use. This is illustrated for the United States in Figure 9. The substantial increase in the use of Truck SUVs results in a relatively modest overall improvement in average vehicle fuel efficiency since 2000 as illustrated in Figure 10.

2.2. Rail Transportation

Table 2 shows that rail transportation accounts for 1.7% of global transportation energy use. Final global rail energy consists of about 53% diesel, about 45% electricity and the remainder is biodiesel. The regional distribution of rail energy is shown in Table 4.
In order to understand how future rail energy can be transitioned to low-carbon sources, it is essential to look at the regional distribution of rail energy sources. This is summarized in Table 5. Freight rail is categorized as either diesel freight or electric freight. Passenger rail is categorized as either conventional diesel or electric, urban electric or high-speed electric. Two extremes are illustrated in the table, one for Europe and Japan and the other for North America. In Japan and Europe, most rail transportation is passenger transport and utilizes electricity. In North America, most rail transportation is freight transport and utilizes diesel fuel. The reasons for these differences are mainly the result of differences in population density. Rail transportation that utilizes electricity as an energy source obtains electricity from either a ground-level third rail or from an overhead catenary. The large distances between population centers in North America (compared to Japan and Europe) mean that neither of these approaches is a viable means (at present) of providing energy for rail transportation. This is an important consideration for future approaches to reduce greenhouse gas emissions from rail transportation.

2.3. Maritime Transportation

Maritime transportation, as indicated in Table 2, accounts for 4.1% of primary transportation energy, but produces 10.7% of the greenhouse gas emissions. At present, maritime transportation energy sources are almost exclusively fossil fuels. Figure 11 shows a breakdown of recent and predicted maritime energy sources. Until the mid-2010s, maritime fuel was about 20% marine diesel oil and 80% heavy fuel oil. At present, maritime transportation uses a mixture of heavy fuel oil (with and without scrubbers), marine diesel oil, marine gas oil and liquefied natural gas. Renewable energy is expected to be a small component of maritime transportation energy up to 2030.

2.4. Air Transportation

As noted in Table 2, air transportation utilizes 9.5% of primary transportation energy and emits 11.9% of transportation greenhouse gases. At present, virtually all air transportation utilizes fossil fuels. There are basically two classes of aviation fuel, jet fuel and avgas. Overall, about 85% of aviation fuel use is jet fuel. Commercial jet aircraft utilize jet fuel, while avgas is predominantly used by smaller aircraft.
Jet fuel is a kerosene-based (Jet A) or naphtha-kerosene-based (Jet B) fuel with a carbon number between 5 and 16 that is used in turbine engines. It has properties that are similar to diesel fuel (typically 12 to 20 carbons per molecule) and is also suitable for use in compression ignition piston engines. Jet A is the most common jet fuel, while Jet B is utilized predominately in cold climates because of its greater flammability.
Avgas is a gasoline-based fuel that is similar to automobile gasoline (which has 4 to 12 carbons per molecule) and is used for spark ignition piston engines. It typically differs from automobile gasoline as it has a higher octane rating (around 100) and frequently contains a lead compound (tetraethyl lead) to aid in engine lubrication and to eliminate engine knock. New grades of avgas are moving away from the inclusion of lead compounds.

3. Sustainable Transportation Technologies

The use of various alternative, potentially low-carbon, transportation energy sources requires careful consideration of several factors, as have been discussed in detail by Dunlap [15]. Cost, safety and environmental sustainability are important for all modes of transportation. Energy and power density are also important, although rail transportation can avoid the use of portable stored energy through the application of external electrical connections. Here we review the properties of three promising portable energy storage technologies for transportation use, batteries, hydrogen and electrofuels. It is interesting to begin with a comparison of the energy density and power density for these technologies. Figure 12 shows a Ragone diagram for some common energy storage devices. In addition to the storage technologies mentioned above, other possibilities, such as supercapacitors, flywheels and compressed air, exist but are either in the early stages of development or are best suited for use as an additional energy source for hybrid vehicles. In most cases, other than some rail transportation systems, transportation energy sources must be portable. It is, therefore, essential that energy sources should have sufficient energy density. This is particularly important for road transportation, where there are limits to overall vehicle weight and size. In this case, energy density can be related to vehicle characteristics such as range. As well, transportation applications require energy sources that provide a suitable power level to ensure acceptable vehicle performance, such as acceleration and maximum speed.
The data in Figure 12 show the relationship between specific energy and power for some of the technologies discussed in this section. That is, batteries using different chemistries; hydrogen, as utilized in fuel cells and internal combustion engines; and methanol, which is characteristic of other electrofuels and biofuels. It is seen in the diagram that all of these fuel choices fall below the energy and power provided by the most common currently used fossil fuel, gasoline, and this must be considered in the development of vehicle technologies and the accompanying infrastructure.

3.1. Batteries

Battery electric vehicles have existed since the late 19th century. In fact, some of the first motorized road vehicles utilized batteries connected to an electric motor. Battery electric vehicles comprised the majority of road vehicles in many locations from the 1890s until the 1920s, when advances in internal combustion engines, as well as the need to travel longer distances, made gasoline-powered vehicles the dominant transportation technology. In recent years, battery electric vehicles have reappeared as a result of the transition away from fossil fuel use. These vehicles are either hybrid battery–gasoline or battery electric vehicles and use, almost exclusively, lithium-ion batteries. The increase in battery electric vehicle sales (including plug-in hybrids) is illustrated in Figure 13, where, for 2023, it is seen that there were about 13 million plug-in electric road vehicles sold. This is in comparison to the total number of passenger vehicles sold worldwide of about 77 million. It is, however, seen in the figure that electric vehicle sales are largely concentrated in China and, to a lesser extent in Europe, with significantly fewer vehicles sold in North America and elsewhere.
In recent years, batteries have also been utilized for other modes of transportation. In the rail sector, the most common approach has been the use of traditional diesel technology in conjunction with battery power to produce a hybrid locomotive [18]. In this case, fuel efficiency is improved through the use of energy recovery by regenerative braking, analogous to conventional hybrid gasoline–battery road vehicles.
In the case of maritime transportation, battery-operated ferries for crossings up to about 30 min (one way) have been successfully implemented in China, Norway and the United States. Such ferry routes typically provide sufficient time (e.g., 10 to 20 min) during loading to recharge the batteries for the subsequent crossing (see [19,20]).
Experimental aircraft have also been produced which utilize battery power. The first commercially available battery-powered aircraft became available in 2020. This was the Velos Electro produced by Pipistrel in Slovenia. The Velos Electro has a total permitted payload of 172 kg and a range of about 200 km. A prototype small battery electric commuter aircraft that can carry two pilots and nine passengers on flights up to 815 km is under development by the aviation company Eviation. Based on the low specific energy and power associated with batteries, as shown in Figure 12, other options, as discussed below, may find more success for air transportation.

3.2. Hydrogen

Hydrogen has been promoted as a viable energy storage medium to replace fossil fuels. At present, about 95% of all hydrogen is produced by steam reforming fossil fuel methane. While the use of hydrogen as a fuel does not emit greenhouse gases, carbon dioxide released during steam reforming must be sequestered in order to make hydrogen a carbon-neutral fuel. More appropriately, hydrogen can be produced by a number of methods that do not utilize fossil fuel precursors. It is convenient to “color” code hydrogen according to its method of production. Table 6 summarizes the definitions of the different colors of hydrogen in terms of their method of preparation. Green hydrogen, produced by electrolysis of water using renewable energy, is the most straightforward approach to the production of hydrogen without greenhouse gas emissions. Yellow hydrogen, produced using solar electricity, is a subset of green hydrogen. Electrolysis, in which hydrogen is produced from electricity by the process
2H2O + energy → 2H2 + O2
using an electrolyzer, can be anywhere from about 62% to 82% efficient. The most common electrolyzers currently in use are the proton exchange membrane (PEM) electrolyzer and the alkaline electrolyzer.
The use of energy from nuclear reactors is another potentially viable approach to the production of low-carbon hydrogen. Pink hydrogen follows from the method of production for green hydrogen by using electricity from a nuclear reactor to produce hydrogen by electrolysis. Red hydrogen utilizes heat from a high-temperature nuclear reactor (see [21]) to produce hydrogen using thermochemical reactions in the presence of a catalyst. This approach is in the fairly early stages of development (see [
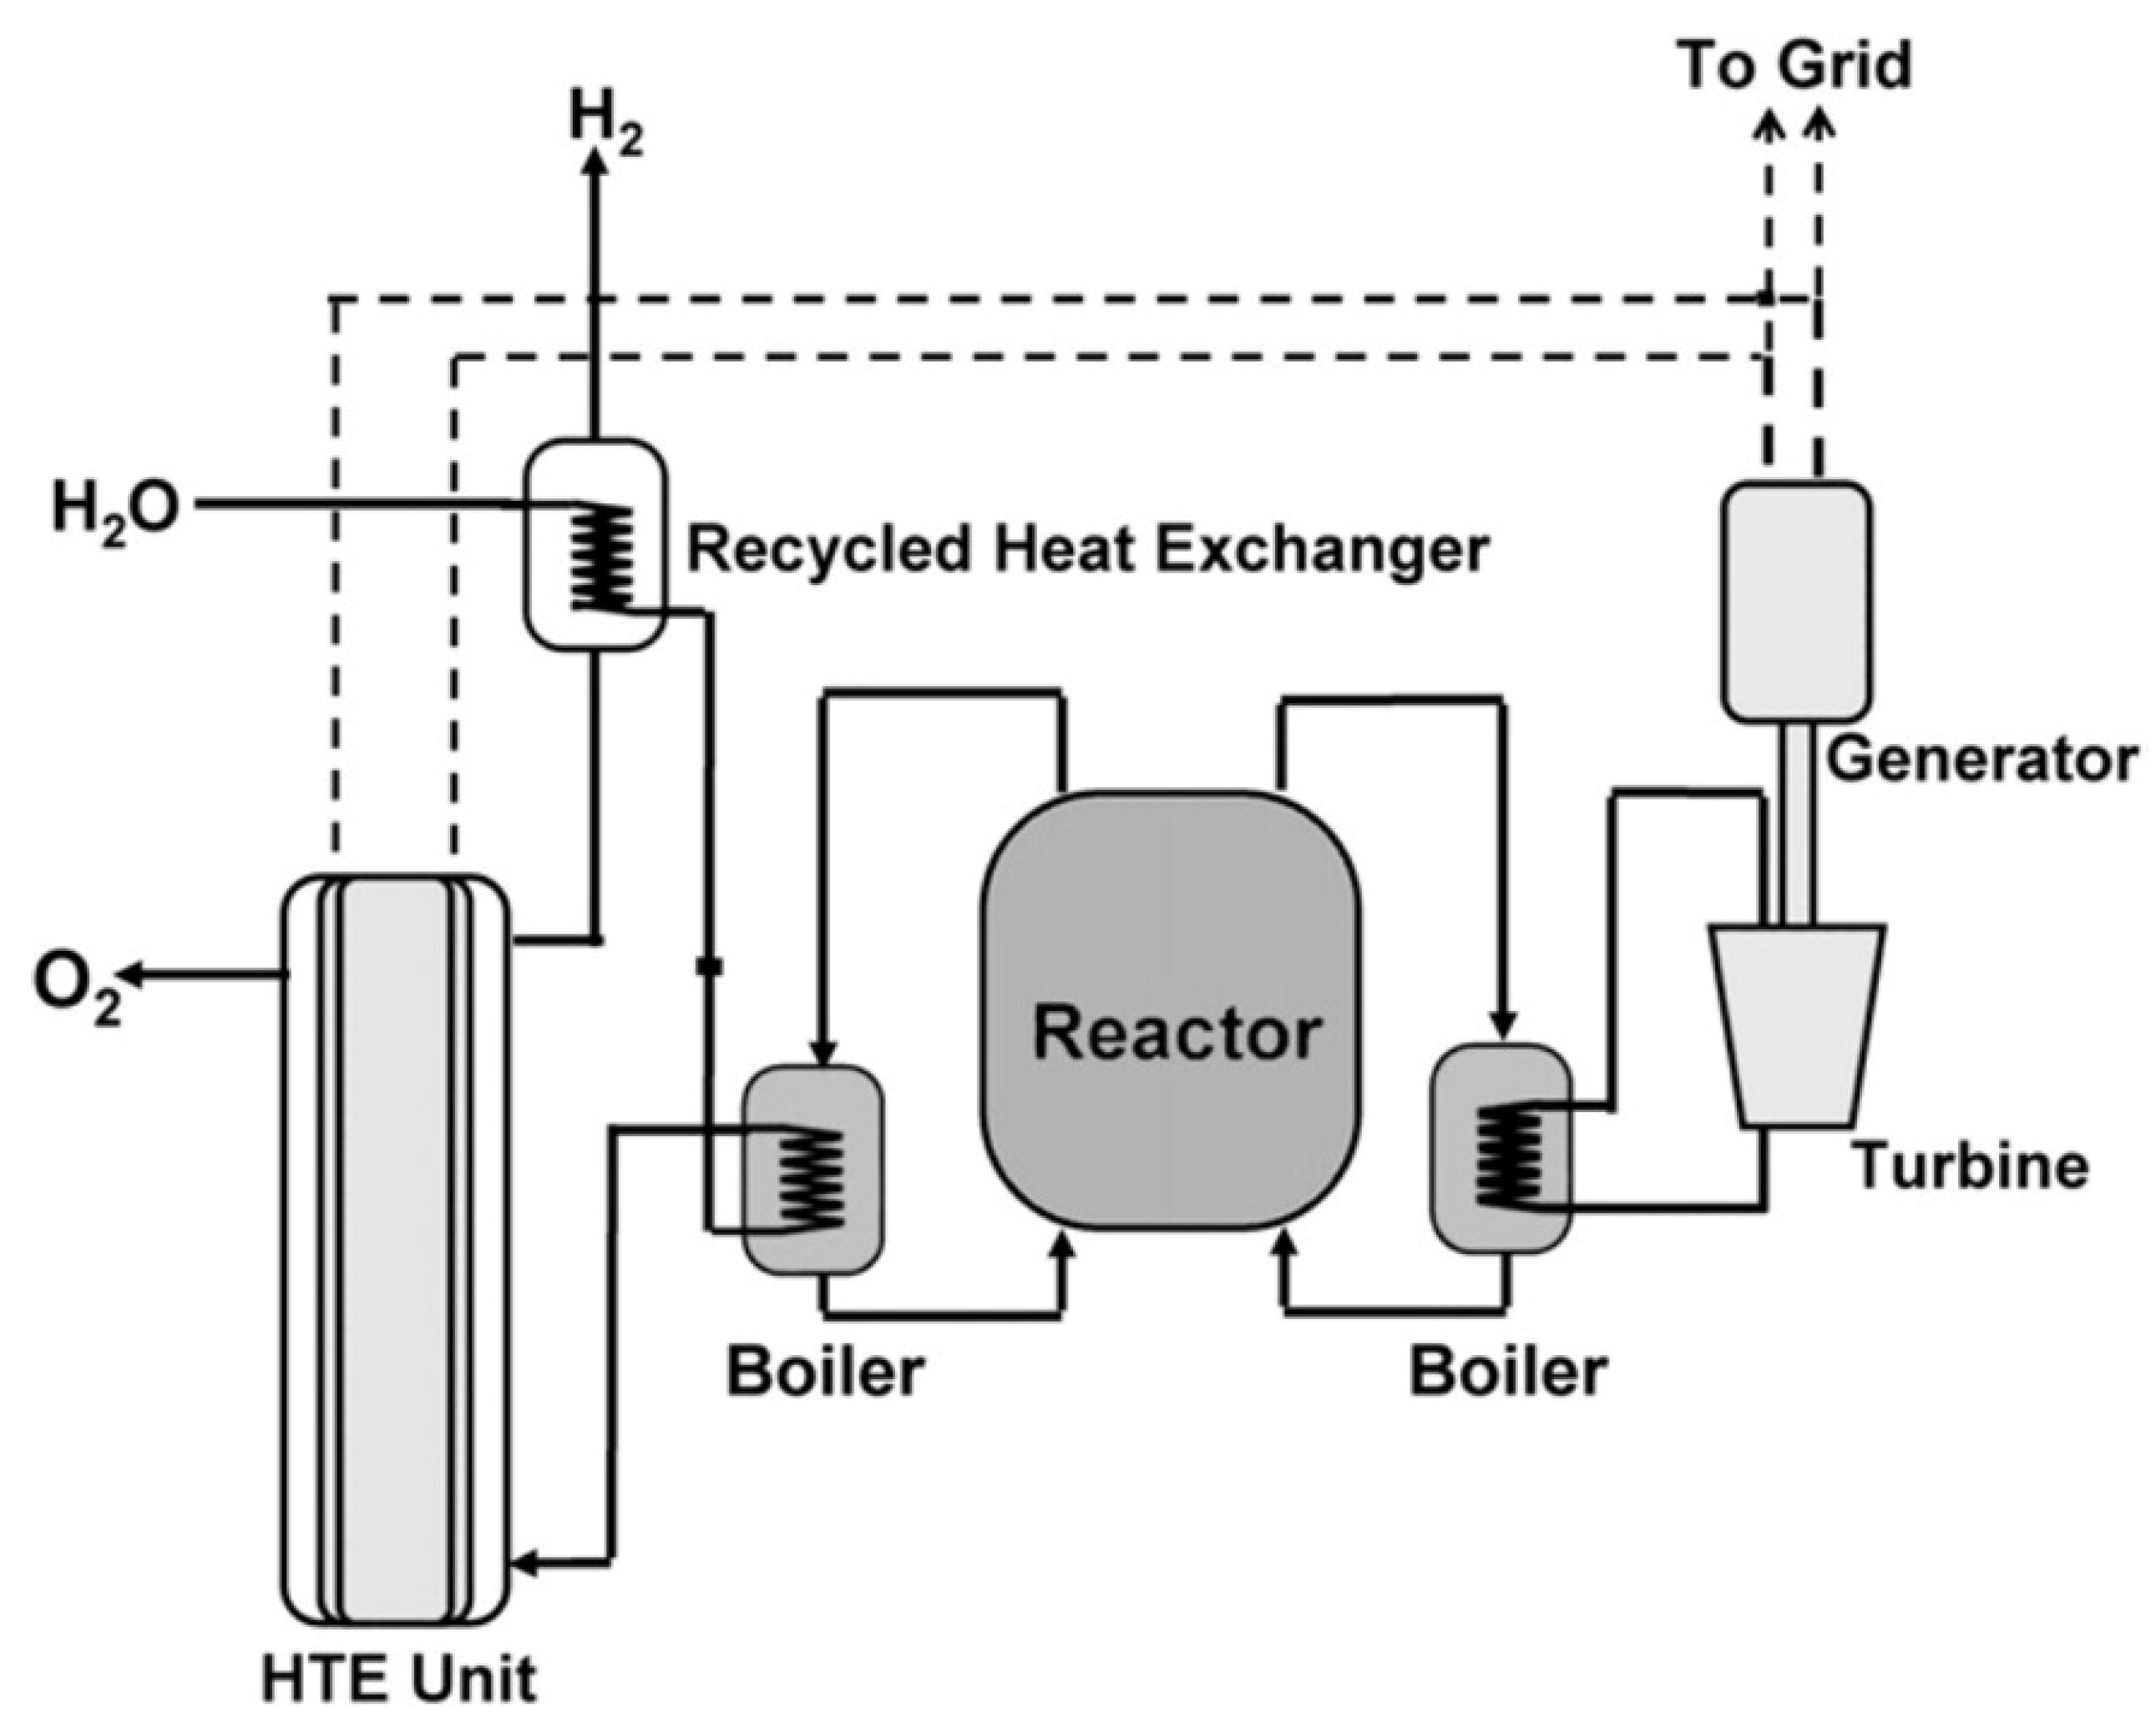
22]). A more straightforward approach to using nuclear thermal energy for hydrogen production is high-temperature electrolysis [23]. A basic schematic for such a system is illustrated in Figure 14. In this case, the electrical efficiency of electrolysis is improved through the use of surplus thermal energy from the reactor. 
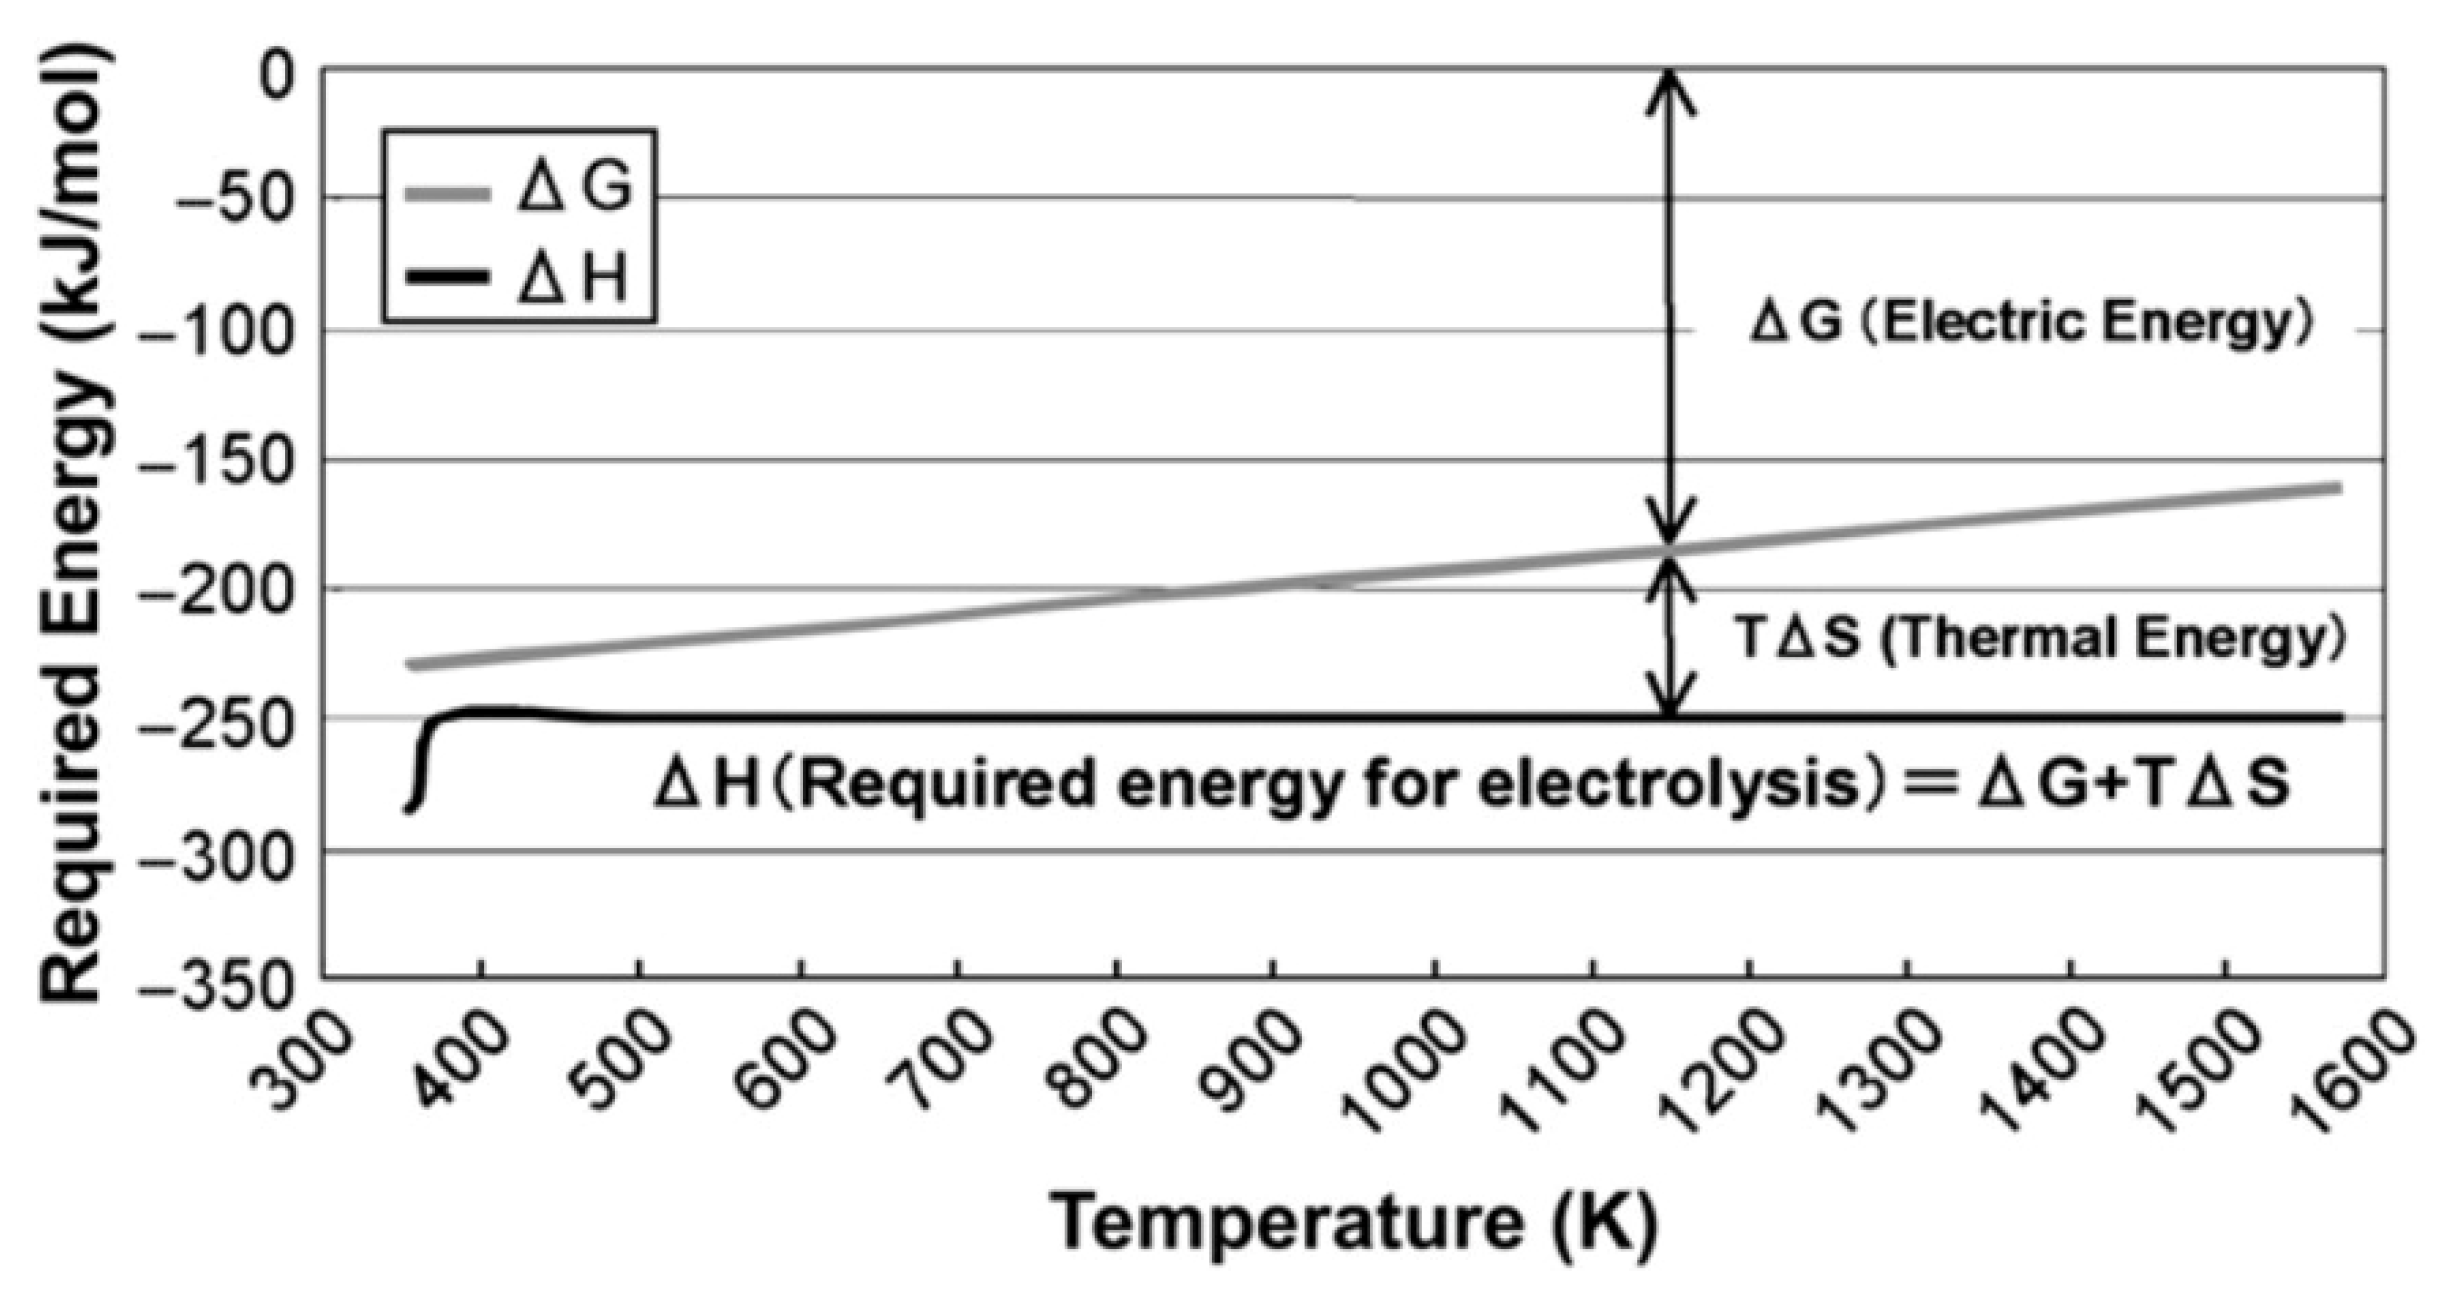
Figure 15 illustrates the typical reduction in required electrical energy for electrolysis that results from the addition of thermal energy. Dunlap [21] has recently reviewed the properties of Generation IV nuclear reactors that are under development. The typical output temperature for the six classes of Generation IV reactors is summarized in Table 7. Very high-temperature reactors and gas-cooled fast reactors are both cooled with helium gas and offer the highest available output temperatures. Figure 15 shows that utilizing the surplus thermal energy from a very high-temperature reactor at 1000 °C reduces the electrical input for electrolysis by about 30%.
Table 8 provides a summary of some of the properties of hydrogen that are relevant to its use as a fuel. Major difficulties in the use of hydrogen as a fuel result from its very low density and its low boiling temperature. Practical hydrogen transport and storage, particularly for transportation applications, involves liquefaction or storage as a high-pressure gas and such approaches must be considered in the development of appropriate infrastructure and in the assessment of overall energy efficiencies. These factors are discussed in detail in Section 4, below. Storing the energy content of hydrogen utilizing chemical reactions is considered in Section 3.3 below. Techniques that involve hydrogen adsorption in a solid may become important in the future. As shown in the table, the energy density of hydrogen as a high-pressure gas or as a liquid is still substantially less than that of conventional fossil fuels, e.g., gasoline has an energy density of about 35 MJ/L compared to hydrogen at 10 MJ/L in the liquid state and 5.7 MJ/L as a gas at 70 MPa.
Hydrogen may be utilized as a fuel for transportation (or other applications) by either combustion to produce heat or in a fuel cell to produce electricity. In either case, the net reaction is the oxidation of hydrogen to produce water,
2H2 + O2 → 2H2O
Experimental and commercially available road vehicles that utilize hydrogen as fuel have been produced. Some early examples of hydrogen-fueled road vehicles have used production internal combustion gasoline engine passenger automobiles with engines that have been modified to use dual fuels, hydrogen and gasoline. These include the 12-cylinder BMW Hydrogen 7 and the rotary engine Mazda RX-8 Hydrogen XE. More recently, hydrogen has been used in hybrid vehicles that use fuel cells in conjunction with lithium-ion batteries. Recent commercially available fuel cell vehicles include the Honda Clarity, Hyundai Nexo and Toyota Mirai. Other automobile manufacturers that are developing fuel cell vehicles that are expected to be available in the near future include Audi, BMW and Mercedes Benz. Using the Toyota Mirai as an example, it is possible to estimate the overall efficiency of hydrogen fuel cell vehicles. For comparison, we look at a similar size/weight gasoline vehicle (e.g., Toyota Camry) which has an overall EPA fuel consumption of 8.1 L/100 km. Using the energy content of gasoline (34.8 MJ/L) and an estimated internal combustion engine efficiency of 20% (see Section 4.4), we obtain an energy at the wheels of 0.56 MJ/km. The Mirai has a hydrogen fuel capacity of 5.0 kg and a manufacturer’s estimated range of 647 km. The overall efficiency of the Mirai can be expressed as
e f f i c i e n c y = 100 × 0.56   M J / k m × ( 647   k m ) 5   k g × H  
where H is the energy content per kg of the fuel. It is common to express the efficiency of a fuel cell using the lower heating value of the fuel [24], which, in the case of hydrogen, is 120 MJ/kg. This gives the LHV efficiency as 60% and the energy lost as thermal energy of the water by-product is ignored. In the present case, it would be more appropriate to include the lost thermal energy by considering the HHV efficiency [24], where H = 142 MJ/kg, in order to analyze the overall renewable electricity to wheel efficiency. This gives the HHV efficiency as 52%. While this example provides information concerning a specific production hydrogen fuel cell vehicle, a more general discussion of efficiency is provided in Section 4.4.
Hydrogen fuel cells have also been used for hybrid fuel cell-battery rail transportation. In the early 2000s, the Japan East Railway Company developed an experimental hydrogen fuel cell-lithium-ion battery railcar [15]. In 2009, the BNSF Railway Co. and Vehicle Projects Inc. in the United States unveiled an experimental hydrogen fuel cell locomotive that was to be used to evaluate the viability of fuel cell locomotives as a possible replacement for diesel locomotives. A more significant development occurred in 2018 when two hydrogen fuel cell trains became operational on a 100 km section of rail line between Buxtehude and Cuxhaven, Germany. The trains were Coradia iLint trains manufactured by the French multinational corporation Alstom SA [25].
Around 2000, a small experimental hydrogen fuel cell boat, the 12 m long Hydra, was tested in Leipzig, Germany [26]. Work to consider the viability of hydrogen fuel cells for the propulsion of larger maritime vessels is still in the very early stages.
While the high specific energy of hydrogen (142 MJ/kg) makes it an attractive fuel for air transportation, the low density of hydrogen, even in the compressed or liquefied states, makes its application less than straightforward. In fact, as noted above, the energy and power requirements for aircraft make the implementation of alternative low-carbon technologies particularly challenging. An inspection of Figure 12 shows that the specific energy that is available from both hydrogen internal combustion engines and hydrogen fuel cells is similar. However, as the figure indicates, available specific power is typically greater for hydrogen internal combustion engines than for hydrogen fuel cells.
The most notable aircraft to utilize a hydrogen internal combustion engine was the Tupolev Tu-155 constructed by Aviakor in Samara in the former Soviet Union. The Tu-154 was a modified version of the commercial Tu-154 aircraft that was adapted to use alternative aviation fuels in one of its three turbofan engines. It was first flown in 1988, and its initial test flights included the use of liquid hydrogen as a fuel. It was operational until 1991, although later flights concentrated on the use of liquefied natural gas as an alternative fuel.
The first hydrogen fuel cell aircraft that was capable of carrying a person was the Antares DLR-H2 [27]. A larger fuel cell aircraft was tested in 2020. This was the six-seat ZeroAvia HyFlyer I [28]. Both of these aircraft were fuel cell-lithium-ion battery hybrids. A careful analysis of power sources and power requirements for the ZeroAvia indicates that under heavy load conditions, such as during take-off, power is provided primarily by the batteries [29]. While hydrogen aircraft have not progressed beyond the experimental stage, Airbus has recently indicated an interest in developing this technology for commercial aircraft [30].

3.3. Electrofuels

Electrofuels, also called e-fuels, are produced from hydrogen and, if the hydrogen has been obtained using low-carbon technology, then the e-fuel can also be produced in a manner that does not contribute to greenhouse gases. Some possible electrofuels and their basic properties are summarized in Table 9. The method of preparation of these, along with a description of their use, follows.

3.3.1. Methane

The electrofuel methane (e-methane) can be produced from low-carbon hydrogen by the Sabatier reaction in the presence of a catalyst such as alumina or nickel at a temperature of 300 °C to 400 °C,
4H2 + CO2 → CH4 + 2H2O
This process is typically about 92% efficient. Energy may be recovered from the e-methane either by combustion or in the use of certain types of fuel cells, such as solid oxide fuel cells. In either case, the overall reaction is
CH4 + 2O2 → CO2 + 2H2O
The process is carbon-neutral provided the hydrogen production does not produce greenhouse gases.
The properties of e-methane are very similar to those of natural gas, which is typically about 90% methane. Extensive infrastructure exists for the storage, transport and utilization of natural gas. As methane is a gas at room temperature, it can be compressed to reduce its volume or it can be liquified, as is completed for the production of liquified natural gas (LNG).
There has been some use of natural gas as a fuel for road transportation and a few such vehicles have been commercially available. Most notably, the Honda Civic GX, available in the United States from 1998 to 2015, utilized a 4-cylinder gasoline engine that was modified to run on compressed natural gas. Several natural gas vehicles have been available in Brazil where they have been offered as multi-fuel vehicles capable of running on compressed natural gas as well as ethanol and ethanol–gasoline mixtures.
Methane (or natural gas) is a suitable fuel for use in a dual-fuel diesel locomotive engine. Such development is in its early stages [31].
Marine transportation has, perhaps, made the greatest use of methane as a fuel. In recent years, tankers, cargo ships and cruise ships have utilized liquified natural gas as an engine fuel [32,33]. Initial use of LNG as a fuel was implemented on LNG tankers, where LNG boil-off was utilized for ship propulsion. More recently, ships with engines designed for LNG or dual-fuel LNG-marine diesel have been in use. In particular, Carnival Corporation has been proactive in the construction of new ships that use LNG as fuel [34]. Natural gas (or methane) produces less CO2 per unit energy generated than heavier fossil fuels such as diesel. However, it is important to guard against the release of methane into the atmosphere. Since methane is a much more effective greenhouse gas than carbon dioxide, even small methane emissions can negate the positive effects of lower CO2 emissions. Such methane release can result from leaks in the fuel system but can also be the result of methane slips, where unburned methane escapes through the engine exhaust.
The use of methane or natural gas as an aviation fuel has been minimal. The Tupolev Tu-155, which has been used as a testbed for a hydrogen-fueled jet engine, has also been used to study the use of liquefied natural gas as an aviation fuel.

3.3.2. Ammonia

Ammonia may be prepared from hydrogen by the Haber–Bosch process,
3H2 + N2 → 2NH3
This reaction is most efficient at a temperature of around 450 °C and a pressure of 10 MPa. It is the only fuel, other than hydrogen, that can undergo oxidation, either by combustion or in a fuel cell, and not release carbon dioxide. The oxidation process is
4NH3 + 3O2 → 2N2 + 6H2O
In addition to the lack of greenhouse gas emissions, ammonia is also relatively easy to liquefy due to its fairly high boiling temperature. On the negative side, however, ammonia is highly toxic and corrosive, so that leaks to the atmosphere must be strictly avoided and equipment must be designed from suitably corrosion-resistant materials. From a practical standpoint, the construction of a suitable ammonia internal combustion engine must deal with the relatively low flammability of the fuel. For this reason, it is important to include a combustion promoter in the fuel mix. This can be completed by including a second fuel supply or onboard cracking on the vehicle with appropriate mixing of the fuel delivered to the engine. Onboard cracking consists of the inclusion of an appropriate component in the fuel system that breaks down some of the ammonia to produce hydrogen (and nitrogen) by the reaction
2NH3 → N2 + 3H2
The hydrogen is then mixed with the ammonia to act as a combustion promoter. Details of recent developments in ammonia internal combustion engines have been reviewed by Kobayashi et al. [35] and Qi et al. [36].
In 2023, the Chinese vehicle manufacturer Guangzhou Automobile Group Co. (GAC), of which Toyota owns 50%, announced the development of an ammonia-fueled passenger vehicle. The vehicle uses a four-cylinder ammonia engine that produces 120 kW [37]. Ammonia has also been considered as fuel for heavy-duty trucks. In 2019, the Canadian company Hydrofuel Inc announced that it would be undertaking a project to convert diesel generators and heavy-duty truck engines to operate on ammonia fuel [38]. More recently, in 2023, the United States company Amogy Inc. reported that they had constructed and tested a heavy-duty semi-truck powered by a 300 kW ammonia-fueled engine [39].
Perhaps the most suitable use of ammonia as a fuel has been in the maritime transportation sector. In this case, the cost and space required for additional equipment, as well as a suitable distribution network, may be less problematic than for road vehicles. A basic diagram of a marine ammonia engine with an onboard cracking system is illustrated in Figure 16. For such applications, ammonia engines may be either reciprocating (i.e., piston) engines or turbines. Recent examples of ammonia engines for marine applications include a two-stroke ammonia-fueled engine being developed by MAN Energy Solutions [40] and a four-stroke ammonia engine being developed by the Wärtsilä Corporation [41].
Reformed ammonia fuel cells utilize an onboard cracking system to convert ammonia fuel to hydrogen for use in a conventional hydrogen fuel cell. While this approach is fairly straightforward, the hydrogen that is produced by the cracking process contains some quantity of residual ammonia and this is inconsistent with the operational fuel requirements of hydrogen fuel cells.
Direct ammonia fuel cells, where ammonia fuel is fed directly into the fuel cell, are in the fairly early stages of development. Progress in this area has been reviewed by Afif et al. [43] and Jeerh et al. [44]. Amogy Inc. has recently entered into an agreement with the Canadian fuel cell manufacturer Ballard Power Systems to develop a 200 kW ammonia fuel cell system for marine applications.

3.3.3. Methanol

As noted in Table 9, methanol is the only simple electrofuel that is a liquid at room temperature and atmospheric pressure. It is also a fairly direct substitute for gasoline in spark ignition internal combustion engines. Although methanol’s energy density is only about half that of gasoline, methanol engines have the advantage of higher thermodynamic efficiency than gasoline engines. As well, methanol is more biodegradable than gasoline and much of the current fossil fuel infrastructure could be readily adapted to methanol.
Methanol is produced from hydrogen at elevated temperatures in the presence of a catalyst by the reaction
3H2 + CO2 → CH3OH + H2O
Methanol can be used to produce heat by combustion or electricity by means of a methanol fuel cell by the reaction
2CH3OH + 3O2 → 2CO2 + 4H2O
Thus, if hydrogen is produced in a carbon-free manner, then the use of methanol is carbon-neutral.
The earliest use of methanol as a fuel in road vehicles dates from the 1980s. Experimental studies were conducted in a number of countries including Canada, Norway, Sweden, the United Kingdon and the United States. In the early 2010s, extensive development of methanol road vehicles, primarily taxis, began in China. By around 2019, there were more than 10,000 methanol vehicles operating in China. This development was aimed primarily at the use of coal resources to produce methanol and not with the aim of reducing greenhouse gas emissions.
In 2016, a methanol program was initiated in Iceland. Methanol is produced at the George Olah Renewable Methanol Plant in Svartsengi Grindavik from electrolytic hydrogen generated using renewable energy (geothermal or hydroelectric) and carbon dioxide, which is a by-product of the geothermal energy infrastructure. Vehicles are sourced from China and are based on the methanol road vehicles developed there as taxis. A small tank of gasoline is incorporated in the vehicle as an aid to starting in cold weather.
Methanol (although not low-carbon methanol) has been used as a fuel for the internal combustion engines in the ferry Stena Germanica. This is a 240 m ferry that services the route from Kiel, Germany to Gothenburg, Sweden. The original marine diesel engines were converted to dual-fuel use in 2015. The ferry is capable of running on either conventional marine gas oil or methanol. As of the early 2020s, several major ocean transport companies including A. P. Moller-Maersk, CMA CGM, Cosco Shipping Lines and Cargill Ocean Transportation have been involved in the development of methanol maritime engines (see, e.g., [45]).
Methanol fuel cells may be either direct methanol fuel cells or reformed methanol fuel cells (often referred to as indirect methanol fuel cells). In the latter case, a reformer converts methanol into hydrogen, which is then utilized in a conventional (typically proton exchange membrane) hydrogen fuel cell. The basic design of a reformed methanol fuel cell is illustrated in Figure 17. A 2:1 mixture of methanol and water is input into the reformer and hydrogen is produced by the reaction
CH3OH → 2H2 + CO
followed by
CO + H2O → H2 + CO2
Reformed methanol fuel cells have been used in road vehicles. Mercedes-Benz has produced several experimental methanol fuel cell vehicles constructed on an A-Class platform. The most recent, the Necar 5, was produced in 2000 and utilizes a single stack reformed methanol fuel cell that produces 75 kW. The vehicle has a top speed of 150 km/h [47]. German automobile manufacturer Gumpert Aiways Automobile produces a limited-edition methanol fuel cell vehicle named the Gumpert Nathalie [48]. This vehicle is a fuel cell-battery hybrid that uses a 15 kW reformed methanol fuel cell in conjunction with a 60 kWh Li-ion battery. Four independent drive motors provide a total output of 400 kW to give a top speed of 300 km/h. The price is around USD 450,000.

3.3.4. Dimethyl Ether

Dimethyl ether is most easily prepared by the dehydration of methanol by the reaction
2CH3OH → CH3OCH3 + H2O
The energy content of dimethyl ether is recovered by the combustion process
CH3OCH3 + 3O2 → 2CO2 + 3H2O
A straightforward analysis based on Equations (9), (13) and (14) shows that if the hydrogen used to produce the methanol is carbon-free, then the use of dimethyl ether as a fuel is carbon-neutral.
Dimethyl ether, as shown in Table 9, is a gas at room temperature and pressure. However, its boiling point at −24 °C means that it can be easily liquified. In fact, its characteristics are fairly similar to those of propane. Propane has a boiling temperature of –42.2 °C and can be liquified at room temperature under a pressure of about 1 MPa (i.e., 10 atm). Dimethyl ether can be liquified at room temperature under a pressure of about 0.5 MPa (5 atm). Thus, the extensive existing infrastructure that is used for the distribution of propane can also be largely utilized for dimethyl ether.
Dimethyl ether is a suitable replacement for diesel fuel in compression ignition internal combustion engines with only fairly minor engine modifications. Therefore, it has applications for both light-duty and heavy-duty road vehicles. At present, however, the development of dimethyl ether as a transportation fuel is in its very early stages. Volvo developed a dimethyl ether-fueled heavy-duty vehicle engine and constructed several prototype vehicles in the early 2010s. These have been tested on roadways in Europe and in the laboratory in the United States as part of a collaborative project involving Oak Ridge National Laboratory, Volvo North America and Pennsylvania State University [49]. Further road tests of dimethyl ether-powered trucks have been conducted in Canada and the United States [50,51]. Thus far, results have been encouraging.

4. Transportation Efficiency Analysis

4.1. Fossil Fuel Vehicles

Based on the categories of alternative transportation technologies as described above, we look at the efficiency of each approach in the present section. For comparison, the overall efficiency (referred to as the tank to wheels efficiency) of a gasoline internal combustion engine vehicle (or diesel internal combustion engine vehicle) has been considered in a number of studies (e.g., [52,53,54]) and some results are summarized in Figure 18. For gasoline engines, the efficiency is about 28% to 30% at about 20% engine loading and this drops off to below 20% for high engine outputs. Li et al. [53] have suggested an efficiency of 16% to 20% for gasoline engines averaged over all operating conditions. Diesel engines are somewhat more efficient at low loading but drop off more at higher outputs. Figure 19 shows the measured diesel engine efficiency as a function of different operating conditions. Typical efficiencies of around 35% to 38% are observed over a fairly large range of conditions [55].
It is interesting to note that vehicle efficiency can be determined by the driver from the information that is available on the performance displays of some vehicles. For example, the instrumentation on a recent model BMW 3-series with a 180 kW 2.0 L gasoline engine provides the following information. At a constant highway speed of 115 km/h, the power to the wheels is 30 kW and the fuel consumption is 10 L/100 km. Fuel consumption per unit time is (115 km/h) × (10 L/100 km) = 11.5 L/h = 0.00319 L/s. Since the energy content of gasoline is 34.8 MJ/L, the rate at which the engine utilizes fuel energy is (34.8 MJ/L) × (0.00319 L/s) = 0.111 MJ/s = 111 kW. As the power delivered to the wheels is 30 kW, then the efficiency is (30 kW)/(111 kW) = 27%. As 30 kW represents 17% of the maximum energy output, the measured efficiency is consistent with the value given in Figure 18.

4.2. Battery Electric Vehicles

As Figure 18 illustrates, battery electric vehicles have an efficiency that drops off at very low power but remains between about 75% and 85% for most of the output power range. This results from the fairly high (~90%) efficiency of the electrical storage of the battery and the high (~90%) efficiency of the electric motor and drivetrain.

4.3. Hydrogen Internal Combustion Engine Vehicles

Hydrogen internal combustion engine vehicles, as described above in Section 3.2, are basically gasoline internal combustion engine vehicles with minor modifications. The most direct approach to a carbon-free process is the production of green hydrogen, as described above, using renewable electricity and electrolysis. Electrolysis, as noted above, is typically between 62% and 82% efficient. Hydrogen gas must be either liquefied (as used for the BMW Hydrogen 7) at an efficiency of about 70% or compressed (as used for the Mazda RX-8 Hydrogen XE) at an efficiency of about 75%. Since the hydrogen internal combustion engine has an efficiency similar to that of the gasoline internal combustion engine (~20%), the hydrogen internal combustion engine vehicle has a net efficiency of around 10%.

4.4. Hydrogen Fuel Cell Vehicles

All current and previously available commercial hydrogen fuel cell vehicles (e.g., Honda Clarity, Hyundai Nexo and Toyota Mirai) have used a proton exchange membrane (PEM) fuel cell and have utilized compressed hydrogen as the fuel. It is likely that this will be the most suitable type of fuel cell for hydrogen fuel cell vehicles going forward. Modern PEM fuel cells are around 60% efficient. For an electric motor efficiency of around 90%, this gives a hydrogen to wheels efficiency of 100 × 0.6 × 0.9 = 54%. If we include a typical electrolyzer efficiency (72%) and hydrogen compression efficiency (75%), as given in the section above, the total electricity to wheels efficiency is 100 × 0.54 × 0.72 × 0.75 = 29%.

4.5. Electrofuel Internal Combustion Engine Vehicles

Electrofuels are produced from hydrogen as described in Section 3.3. As an example of the electrofuel that has attracted the most attention thus far and is likely to continue to play a role in future transportation technologies, we consider the production and use of e-methanol (see Section 3.3.3). In this case, e-methanol is produced from green hydrogen. IRENA and Methanol Institute [56] have estimated the efficiency of methanol production from hydrogen to be 75% to 85%. Studies have shown that methanol internal combustion engines can have significantly higher thermal efficiency than gasoline engines. Vancoillie et al. [57] have reported efficiencies of up to 43% and Brusstar et al. [58] have reported efficiencies of up to 42% and efficiencies over 38% over a wide range of engine speeds and loadings. The higher efficiency of a methanol internal combustion engine is a direct result of the higher autoignition temperature of methanol (~585 °C) compared to gasoline (~222 °C). This allows for greater compression before fuel ignition. Including hydrogen electrolyzer, e-methanol production and methanol internal combustion engine efficiencies provides an estimated overall efficiency of 100 × 0.72 × 0.80 × 0.40 = 23% for methanol internal combustion engine vehicles.

4.6. Electrofuel Fuel Cell Vehicles

As an example of an electrofuel fuel cell vehicle, we consider a vehicle utilizing a reformed methanol fuel cell. This is the most advanced design in this category and has been used in the commercially available (although limited production) Gumpert Nathalie [48]. Although the reformed methanol fuel cell has a lower efficiency than a traditional hydrogen proton exchange membrane fuel cell (~60%), it has a higher efficiency and less stringent fuel requirements than a direct methanol fuel cell (~25%). Typical reformed methanol fuel cells have an efficiency in the range of 35% to 50% [59]. Using an average value of 40%, combined with an electrolyzer, methanol production and electric motor efficiencies, as discussed above, we obtain a net renewable electricity to wheels efficiency of 100 × 0.72 × 0.8 × 0.40 × 0.90 = 21%.

5. Land Requirements

We consider the two renewable energy sources that have shown the most growth in recent years and which have the greatest potential for future growth, solar photovoltaics and wind.

5.1. Solar Photovoltaics

The annual energy generated per unit land area for a photovoltaic facility depends on a number of factors. These include the latitude, as well as the local weather conditions. Denholm and Margolis [60] have considered the energy available for solar photovoltaic facilities in the United States. They have reported a national average of 85 kWh/m2 per year, with state averages ranging from 50 kWh/m2 per year for Alaska to 110 kWh/m2 per year for New Mexico. We can compare these values to some actual photovoltaic solar park outputs. Table 10 provides some data for some large solar parks worldwide. The average annual energy output of the data given in the table, 84.8 kWh/m2, is consistent with the value estimated for the United States by Denholm and Margolios [60]. While there is nearly a factor of three variation in the annual output per land area for the sites given in the table, there is no particular trend as a function of scale for these grid-size facilities. This follows from the fact that the majority of land area utilized for solar photovoltaic farms is for the collectors themselves. Using an average capacity factor for solar photovoltaics of 17% (see below) gives an average area per unit generating capacity of 0.018 km2/MW.

5.2. Wind

In the present section, we consider the area required for land-based wind turbines.
While the land area required for solar photovoltaic farms, as described in the section above, is fairly well defined, and is dominated by the actual area of the solar photovoltaic collectors, the area required for a wind farm is substantially less well defined [61]. In general, the environmental impact of a wind farm can be described in terms of three parameters, the area of the impact, the duration of the impact and the quality of the impact. The land use of a wind farm can be roughly divided into two categories, direct impact area and total area, and the assessments of the environmental effects of these two types of area can be quite different. The direct impact area may be permanent (i.e., for the lifetime of the facility) or temporary (i.e., during the construction of the project and time required for recovery of the impacted area). The former category refers to the area of the turbine pads and associated deforested areas around the turbines along with permanent access roads and support infrastructure (i.e., buildings). The latter may refer to temporary roads used for construction along with a lay-down area. The total area includes the direct impact area along with the area between turbines. This area is somewhat less defined and may be irregular in shape. Some of the factors that affect the total area include turbine spacing and the geometry of their arrangement, geographic features and setback from the edge of the project area.
The duration of the impact, as noted above, may be permanent, that is for the lifetime of the facility, or temporary, during the construction and recovery period. This temporary period may be a couple of years or more than a decade, depending on the local environment. In general, however, the quality of the impact typically involves lower environmental damage than (say) a coal mining operation or a high head hydroelectric facility. While some of the land area associated with a wind farm may be suitable for dual use, i.e., livestock grazing, etc., these details are not considered in the present analysis.
As suggested by Denholm et al. [61], the variability in wind farm designs means that an analysis based on the properties of existing wind facilities may be the most meaningful. The analysis that they have provided on the basis of 172 wind farms in the continental United States is summarized in Table 11. This gives a typical area per unit capacity of ~0.25 km2/MW. There is considerable individual variability in the land area required per unit generating capacity. This is more pronounced than for solar photovoltaics because of the diverse factors affecting the total impacted area. However, Denholm et al. [61] have reported that there is no statistically significant trend between land area and overall wind farm capacity between about 50 MW and 1 GW total capacity.

6. Summary of Infrastructure Requirements for Sustainable Transportation

6.1. Summary of Transportation Efficiencies

Based on the discussion in Section 4, we summarize the efficiency of different transportation technologies in Table 12. It should be noted that the values in the table are typical average values as determined above and these include some uncertainty on the basis of the assumptions concerning the efficiency of different processes. Some of the efficiencies given in Table 12 are based on relatively straightforward analyses and fairly extensive studies of these efficiencies have been reported. This is the case for gasoline, diesel and battery electric vehicles (see Section 4.1). In other cases, the energy conversion processes can be more complex. For example, an analysis of the methanol fuel cell vehicle requires information about electrolyzer efficiency, methanol production efficiency, fuel cell efficiency and drive motor efficiency. Assuming a ±5% uncertainty in each of these parameters, the 21% efficiency in the table can be anywhere between about 15% and 27%. It should also be noted that future technical developments, particularly in the case of technologies involving electrolyzers and/or fuel cells, could lead to somewhat improved efficiencies.

6.2. Generating Capacity

The total global primary transportation energy, as noted above, is 5.92 × 10¹¹ GJ per year of which 1.49 × 10¹¹ GJ (4.1 × 10¹⁶ Wh) is used for transportation [1]. Since primary transportation energy is, at present, virtually all fossil fuel energy and this is dominated, in approximately equal parts, by gasoline and diesel fuel (see Figure 4), we can use an average net efficiency of about 27%. This means that the net energy at the wheels (for road transportation, or equivalently for rail, marine or air transportation) is (0.27) × (4.1 × 1016 Wh) = 1.1 × 10¹⁶ Wh.
Based on the estimated overall efficiencies for alternative transportation technologies as summarized in Table 12, the net electricity requirement needed to provide the same energy to the wheels as determined for average fossil fuel use can be determined as given in Table 13. The table also shows this required annual electricity generation relative to the current global electricity generation of 2.97 × 10¹⁶ Wh per year (as a percentage).
The values in the last column of Table 13 are an estimate of the additional electricity generation that would be required to replace current fossil fuel use for transportation. It should be noted that these estimates are based on the preparation of alternative fuels using the renewable methods as described above. As noted in Section 6.1, there is some uncertainty in the results that arises because of the variability in the efficiencies of certain components of the different energy technologies. However, the results in Table 13 clearly show that battery electric vehicles require the least additional energy generation while hydrogen internal combustion engine vehicles require the most. Hydrogen fuel cell and electrofuel vehicles all fall between these extremes. Although the values in Table 13 are estimates of the additional electricity generation required for each transportation technology, it is likely that a single technology would not satisfy all our transportation needs. Rather, a combination of approaches may be appropriate, particularly for different modes of transportation, and biofuels may also be incorporated into the transportation energy mix. It should also be noted that the necessary additional generation does not necessarily translate into additional required generating capacity. In the case of traditional fossil fuel generation, additional generation can be accomplished without necessarily increasing generating capacity by increasing generation during low-demand periods and associated energy storage. In the case of generation using renewable technologies, it is necessary to implement appropriate energy storage technologies. Appropriate capacity factors must be considered in order to relate necessary generating capacity to actual electricity generated. Capacity factors have been discussed briefly above. Based on current technologies, they may be readily determined from rated capacities and annual generation of operating facilities. A global assessment is given in Table 14. It can be seen that the largest fraction of low-carbon electricity comes from hydroelectric facilities followed by nuclear energy.
In an overall evaluation of the viability of different energy sources, it is necessary to consider the cost of generated electricity. A recent report by the U.S. Energy Information Agency [64] has indicated that both solar photovoltaic and wind installations are cost-competitive with other generating technologies (see Figure 20).
It is certain that our low-carbon energy for the future will be a mix of different sources, as summarized in Table 14. However, we can look at two extreme examples where all electricity is produced by solar photovoltaics or by wind. Using the estimated capacity factors for solar photovoltaics (17%) and wind (28%) from Table 14, then the additional required installed capacity for different transportation technologies is summarized in Table 15. It is seen that the total low-carbon electricity shown in Table 14 is slightly smaller than the requirements for battery electric vehicles and substantially less than that required for other sustainable transportation technologies.

6.3. Storage Requirements

As most sources of renewable energy do not provide a continuous supply of electricity, a suitable means of energy storage is required for their effective implementation (see Dunlap [65,66]). The exact energy storage requirement depends on a number of different factors. These include the details of the renewable energy mix and the specific sustainable transportation energy technology. Solar energy shows clear daily fluctuations, and these are seen to a lesser extent in wind energy [67]. We assume that energy storage capacity on the order of one day of the annual energy requirement shown in Table 13 would provide a rough estimate of the magnitude of storage needed to accommodate these fluctuations and provide a consistent supply of electricity for transportation needs. These results are summarized in Table 16. For comparison, current electric grid storage is summarized in Table 17. Pumped hydroelectric energy provides the largest component of current storage, with smaller amounts provided by different battery technologies. It is clear that current storage capacities fall substantially short of this estimate. This discrepancy can be partially offset by the use of electrofuels and advantageous battery charging scheduling. Alternately, the use of other low-carbon generating technologies that provide a more constant source of electricity, such as hydroelectric, geothermal or nuclear, will reduce storage requirements.

6.4. Land Utilization

While low-carbon generating technologies such as geothermal and nuclear have a high energy density per unit land utilization, solar and wind generation are low energy density generating methods. As such, they require significant land resources. Here the land requirements for solar and wind generation are evaluated for different transportation technologies. Using the estimated capacities, as given in Table 15, and the typical area per unit capacity of 0.018 km2/MW for solar and 0.25 km2/MW for wind, the estimated land area is summarized in Table 18.
The land areas summarized in Table 18 can be compared to current land utilization. The total surface of the Earth is 5.1 × 10⁸ km2, of which 3.7 × 10⁸ km2 is ocean. This leaves a total land area of 1.4 × 10⁸ km2. A breakdown of current land use is shown in Figure 21. Comparing the results in Table 18 to the land used for crops (for example), 1.0 × 10⁷ km2, we can see that the results in the table range from about 1.7% of crop land for solar energy used for battery electric vehicles to around 100% for wind energy used for hydrogen internal combustion engine vehicles.
It is interesting to note that current nuclear reactor stations typically utilize an area of about 0.0003 km2/MW (in terms of electrical capacity), or less than 2% of that occupied by solar photovoltaics. Note also the high capacity factor of nuclear power additionally augments this difference.

7. Other Environmental Aspects of Transportation

The present paper has dealt with the relationship of energy and transportation, primarily in terms of the adverse environmental aspects of transportation energy use and the resource requirements needed to transition from fossil fuel-dominated transportation energy to more sustainable alternatives. It is also important to realize that transportation has other adverse environmental consequences that are not directly related to energy use. While the sustainable transportation technologies described above can help to mitigate some of these effects, they can actually augment some environmental concerns, as noted below. The present section provides a brief summary of the most important of these other environmental effects and how they relate to specific transportation modes.

7.1. Road Transportation

Tire pollution, that is emission of rubber particles into the environment, results from road surface abrasion during driving. As a result of atmospheric transport, particulates can be deposited into aquatic environments, where their toxicity is unknown. Battery electric vehicles typically weigh more than similar gasoline or diesel vehicles and, as a result, may produce more tire pollution.
Critical materials extraction—Battery electric vehicles and fuel cell vehicles utilize critical materials in greater quantities than typical fossil fuel vehicles. In the case of battery electric vehicles, batteries utilize lithium while drive motors typically utilize rare earth-based permanent magnets. Fuel cell vehicles also use rare-earth permanent magnet motors and also typically have battery hybrid energy storage. Mining and production activities related to lithium and rare-earth elements are both energy intensive and potentially polluting. In the case of rare-earth elements, radioactive uranium and thorium are often impurities and must be dealt with appropriately.

7.2. Rail Transportation

Noise pollution is a common concern for rail transportation. While the diesel engines that are in common use for rail transportation are responsible for much of the noise, electric trains also produce noise due to the wheels and vibration of cargo or train components. Railway noise pollution is primarily an annoyance for nearby residents or workers.
Air and water pollution—Freight trains carrying materials such as mineral ores and aggregate construction materials can release pollutants into the air which can also be carried to aquatic environments.

7.3. Maritime Transportation

Marine noise pollution which results primarily from commercial shipping can have detrimental effects on marine life. Many marine species rely on acoustic signals for communication and orientation and their activities can be seriously disrupted by high levels of ambient marine noise.
Ballast water discharge can have detrimental effects on the marine environment when ballast water used by large ships is taken on in one region and discharged in another. This process can release invasive species, as well as bacteria and viruses, that can harm the local ecological system and can represent a health hazard for humans.
Bilge water discharge—Water which collects in the bilge, the lowest part of a ship’s hull, must periodically be pumped out. This water typically contains oil which leaks from the engine or other machinery. While this contaminated water is filtered before pumping into the ocean, some oil will remain and will contribute to pollution that can adversely affect marine wildlife.
Wildlife collisions—Collisions with ships are a major concern for marine mammals. Such collisions are typically fatal for the animal involved and have been a significant contributor to the decline of several marine species. In particular, the North Atlantic right whale and whale shark populations have seen declines that can be attributed to ship collisions.
Wastewater discharge can involve the release of blackwater (i.e., water from toilet facilities) or greywater (i.e., water from sinks, laundries, etc.). In the former case, blackwater can contain harmful bacteria, viruses or other pathogens. If this water is not adequately treated before release, it can contaminate fish populations or shellfish beds and thereby create a public health hazard. Greywater can contain a variety of pollutants, including coliform bacteria, detergents, grease and food waste. These pollutants can interfere with the marine ecology by utilizing oxygen needed by marine organisms. These environmental hazards are most commonly related to cruise ships which carry large numbers of passengers.

7.4. Air Transportation

Noise pollution around airports is a major problem related to commercial air transportation. Battery electric or fuel cell aircraft would provide a significant reduction in aircraft noise. Engines utilizing the combustion of electrofuels or biofuels would likely do little to mitigate this problem.
Water pollution can result from various airport operations. These include fuel spills and, probably most importantly, de-icing fluids. Runoff of these de-icing fluids can pollute nearby waterways. Currently de-icing fluids used on aircraft are either ethylene glycol or propylene glycol. These are both toxic to humans and other mammals. They can also seriously disrupt aquatic life, as microbial populations that decompose glycol-based molecules deplete dissolved oxygen in the water and this can be fatal to macroscopic aquatic species.

8. Conclusions

The above analysis has looked at the resources necessary to supply renewable energy to different sustainable transportation technologies. In particular, generating capacity, energy production, energy storage capacity and land requirements have been considered. This analysis has concentrated on the needs for transportation technologies involving battery electric and electrofuel vehicles and has focused on the utilization of electricity produced by renewable solar photovoltaics and wind technologies. While the present work was aimed largely at road transportation, most of the conclusions can also be applied to other modes of transportation such as rail, marine and air transportation.
The resources that are required to replace the use of fossil fuels for current transportation needs include additional electricity generation, energy storage and land use. The general conclusions of the present analysis can be summarized as follows:
Based on the overall efficiencies of various transportation technologies that make use of batteries or electrofuels as storage media for electricity, the necessary additional electricity generation has been estimated. This analysis shows that battery electric vehicles have the highest efficiency and would require an increase of about 47% in electricity generation. This is a suitable approach to road transportation, which accounts for about 85% of transportation energy use. It is, however, likely not appropriate for much of maritime and air transportation. While hydrogen fuel cells would appear to be the next best choice from an efficiency standpoint, cost and convenience may favor other electrofuels.
If the future transition of the electric grid largely involves the development of intermittent renewable sources such as solar photovoltaics and wind, as present trends suggest, energy storage must accompany the development of additional renewable generating capacity. The simple approach as described above of storing a day of transportation energy would require, even in the most efficient scenario, more than an order of magnitude increase in present storage capacity. This can be reduced by the use of smart scheduling of battery charging or the timing of electrofuel production. Continuous base load capacity can be improved by the use of renewables such as hydroelectric and geothermal or low-carbon nuclear, and the utilization of biofuels can also reduce storage requirements.
Land requirements must also be carefully considered in the development of sustainable transportation infrastructure. The use of solar photovoltaics in conjunction with battery electric vehicles will utilize, at most, a land area equivalent to a few percent of current crop land. On the other hand, the use of other transportation technologies in conjunction with wind energy can require a substantial portion of the world’s viable land. Certainly, the implementation of higher energy density sources can alleviate land use concerns.
Overall, the above analysis shows that the development of renewable energy technologies that can contribute to our transportation infrastructure, particularly solar photovoltaics and wind energy, require the implementation of additional infrastructure. The present results show that this required infrastructure can be extensive. It is, therefore, necessary in the development of new sustainable transportation technologies to consider all aspects of this development.
The key points that arise from the present analysis are that battery electric vehicles will require the least additional infrastructure development and hydrogen internal combustion engine vehicles will require, by far, the most. Hydrogen fuel cell vehicles and electrofuel vehicles, including methanol internal combustion engine vehicles, may offer attractive alternatives to battery electric vehicles for some transportation applications. This may particularly be the situation where energy density is a crucial consideration, such as for air transportation, cases where conversion of existing transportation infrastructure is appropriate, as for maritime transportation, or where fueling requirements, such as long-distance road transportation, are an important consideration.
Undoubtedly, future sustainable transportation will be a mixture of technologies, and future renewable or other low-carbon energy will be from a mixture of sources. Therefore, an awareness of how transportation technologies and energy sources are integrated is essential in establishing a viable path forward.

Funding

This research received no external funding.

Conflicts of Interest

The author declares no conflicts of interest.

References

  1. Lindstad, E.; Ask, T.Ø.; Cariou, P.; Eskeland, G.S.; Rialland, A. Wise use of renewable energy in transport. Transp. Res. D Transp. Environ. 2023, 119, 103713. [Google Scholar] [CrossRef]
  2. Our World in Data. Global Direct Primary Energy Consumption. 2024. Available online: https://ourworldindata.org/grapher/global-primary-energy (accessed on 31 May 2025).
  3. Ritchie, H. Primary, Secondary, Final, and Useful Energy: Why Are There Different Ways of Measuring Energy? 2022. Available online: https://ourworldindata.org/energy-definitions (accessed on 31 May 2025).
  4. U.S. Energy Information Administration. U.S. Energy Facts Explained. 2024. Available online: https://www.eia.gov/energyexplained/us-energy-facts/ (accessed on 31 May 2025).
  5. U.S. Energy Information Administration. International Energy Outlook 2016. 2016. Available online: https://www.eia.gov/outlooks/ieo/pdf/0484(2016).pdf (accessed on 2 June 2025).
  6. Ritchie, H. Sector by Sector: Where Do Global Greenhouse Gas Emissions Come from? 2020. Available online: https://ourworldindata.org/ghg-emissions-by-sector (accessed on 31 May 2025).
  7. U.S. Energy Information Administration. International Energy Outlook 2016: Chapter 8 Transportation Sector Energy Consumption. 2016. Available online: https://www.eia.gov/outlooks/ieo/pdf/transportation.pdf (accessed on 29 June 2025).
  8. International Energy Agency. Energy Consumption in Transport in IEA Countries. 2020. Available online: https://www.iea.org/data-and-statistics/charts/energy-consumption-in-transport-in-iea-countries-2018 (accessed on 31 May 2025).
  9. U.S. Department of Energy. Fuel Economy for All Vehicle Classes Has Improved Substantially over the Past Two Decades. 2022. Available online: https://www.energy.gov/eere/vehicles/articles/fotw-1237-may-9-2022-fuel-economy-all-vehicle-classes-has-improved (accessed on 31 May 2025).
  10. Khalili, S.; Rantanen, E.; Bogdanov, D.; Breyer, C. Global transportation demand development with impacts on the energy demand and greenhouse gas emissions in a climate-constrained world. Energies 2019, 12, 3870. [Google Scholar] [CrossRef]
  11. RCraig09. Chart Showing Shares of US Vehicles Produced over Time, Based on Vehicle Type, Based on EPA Data. 2023. Available online: https://commons.wikimedia.org/wiki/File:1975-_US_vehicle_production_share,_by_vehicle_type.svg (accessed on 2 June 2025).
  12. U.S. Department of Transportation. Average Fuel Efficiency of U.S. Light Duty Vehicles. Available online: https://www.bts.gov/content/average-fuel-efficiency-us-light-duty-vehicles (accessed on 31 May 2025).
  13. International Energy Agency. The Future of Rail—Opportunities for Energy and the Environment. 2019. Available online: https://iea.blob.core.windows.net/assets/fb7dc9e4-d5ff-4a22-ac07-ef3ca73ac680/The_Future_of_Rail.pdf (accessed on 31 May 2025).
  14. Wang, H. The End of the Era of Heavy Fuel Oil in Maritime Shipping; International Council on Clean Transportation: Berlin, German, 2014; Available online: https://theicct.org/the-end-of-the-era-of-heavy-fuel-oil-in-maritime-shipping/ (accessed on 31 May 2025).
  15. Dunlap, R.A. Transportation Technologies for a Sustainable Future—Renewable Energy Options for Road, Rail, Marine and Air Transportation; IOP Publishing: Bristol, UK, 2023. [Google Scholar] [CrossRef]
  16. Ghoniem, A.F. Needs, resources and climate change: Clean and efficient conversion technologies. Prog. Energy Combust. Sci. 2011, 37, 15–51. [Google Scholar] [CrossRef]
  17. Mariordo. Annual Sales of Plug-in Electric Passenger Cars in the World’s Top Markets(Countries/Regions) Between 2011 and 2023. 2024. Available online: https://commons.wikimedia.org/wiki/File:Global_plug-in_car_sales_since_2011.png (accessed on 31 May 2025).
  18. Trainweb. Green Goat GG20B “Green Goat” Switchers. Available online: http://www.trainweb.org/greengoats/gg20b.html (accessed on 31 May 2025).
  19. Sicinski, J. Maid of the Mist Sets the Standard for Modern Zero-Emission Vessel Operations. 2023. Available online: https://www.maidofthemist.com/maid-of-the-mist-sets-the-standard-for-modern-zero-emission-vessel-operationsmaid-of-the-mist/ (accessed on 2 June 2025).
  20. Skredderberget, A. The First Ever Zero Emission, Autonomous Ship. 2025. Available online: https://www.yara.com/knowledge-grows/game-changer-for-the-environment/ (accessed on 2 June 2025).
  21. Dunlap, R.A. Generation IV Nuclear Reactors: Design, Operation and Prospects for Future Energy Production; IOP Publishing: Bristol, UK, 2024. [Google Scholar] [CrossRef]
  22. U.S Department of Energy. Hydrogen Production: Thermochemical Water Splitting. Available online: https://www.energy.gov/eere/fuelcells/hydrogen-production-thermochemical-water-splitting (accessed on 31 May 2025).
  23. Fujiwara, S.; Kasai, S.; Yamauchi, H.; Yamada, K.; Makino, S.; Matsunaga, K.; Yoshino, M.; Kameda, T.; Ogawa, T.; Momma, S.; et al. Hydrogen production by high temperature electrolysis with nuclear reactor. Prog. Nucl. Energy 2008, 50, 422–426. [Google Scholar] [CrossRef]
  24. Leo, T. Fuel Cell Efficiency Explained. 2023. Available online: https://www.fuelcellenergy.com/blog/fuel-cell-efficiency (accessed on 19 June 2025).
  25. Agence France-Presse. Germany Launches World’s First Hydrogen-Powered Train. The Guardian 2018. Available online: https://www.theguardian.com/environment/2018/sep/17/germany-launches-worlds-first-hydrogen-powered-train (accessed on 31 May 2025).
  26. Cchhrriissttiiaann. This Is a Photo of the World’s First Certified Fuel Cell Boat (HYDRA) Real-Ised by Christian Machens. 2000. Available online: https://commons.wikimedia.org/wiki/File:Die_Hydra_in_Leipzig_I.jpg (accessed on 31 May 2025).
  27. Rathke, P.; Kallo, J.; Schirmer, J.; Stephan, T.; Waiblinger, W.; Weiss-Ungethüm, J. Antares DLR-H2—Flying Test Bed for Development of Aircraft Fuel Cell Systems. ECS Trans. 2013, 51, 229–241. [Google Scholar] [CrossRef]
  28. Henderson, C. The Hydrogen Revolution in the Skies BBC Future Planet. 2021. Available online: https://www.bbc.com/future/article/20210401-the-worlds-first-commercial-hydrogen-plane (accessed on 31 May 2025).
  29. Harris, M.; TechCrunch. ZeroAvia’s Hydrogen Fuel Cell Plane Ambitions Clouded by Technical Chal-Lenges—Aspirations Remain Sky High. 2021. Available online: https://techcrunch.com/2021/04/14/zeroavias-hydrogen-fuel-cell-plane-ambitions-clouded-by-technical-challenges/ (accessed on 31 May 2025).
  30. Tidey, A.; Euronews. Airbus Unveils Concepts for Zero-Emission Planes Powered by Hydrogen. 2020. Available online: www.euronews.com/2020/09/21/airbus-unveils-concepts-for-zero-emission-planes-powered-by-hydrogen (accessed on 31 May 2025).
  31. U. S. Department of Transportation. Investigation of an Anti-Knock Index and Hydrocarbon Emissions of Various Natural Gas Blends (Report DOT/FRA/ORD-16/07); 2016. Available online: https://railroads.dot.gov/sites/fra.dot.gov/files/fra_net/15704/FRA%20Methane%20Number%20Final%20Report_final.pdf (accessed on 1 July 2025).
  32. Burel, F.; Taccani, R.; Zuliani, N. Improving sustainability of maritime transport through utilization of Liquefied Natural Gas (LNG) for propulsion. Energy 2013, 57, 412–420. [Google Scholar] [CrossRef]
  33. Zanobetti, F.; Pio, G.; Jafarzadeh, S.; Ortiz, M.M.; Cozzani, V. Decarbonization of maritime transport: Sustainability assessment of alternative power systems. J. Clean. Prod. 2023, 417, 137989. [Google Scholar] [CrossRef]
  34. Youd, F. Future Fuel: The Pros and Cons of LNG Cruise Ships. Ship Technology. 2021. Available online: https://www.ship-technology.com/features/future-fuel-the-pros-and-cons-of-lng-cruise-ships/?cf-view (accessed on 31 May 2025).
  35. Kobayashi, H.; Hayakawa, A.; Somarathne, K.D.K.A.; Okafor, E.C. Science and technology of ammonia combustion. Proc. Combust. Inst. 2019, 37, 109–133. [Google Scholar] [CrossRef]
  36. Qi, Y.; Liu, W.; Liu, S.; Wang, W.; Peng, Y.; Wang, Z. A review on ammonia-hydrogen fueled internal combustion engines. eTransportation 2023, 18, 100288. [Google Scholar] [CrossRef]
  37. lenrosen4. Toyota Develops an Internal Combustion Engine That Runs on Ammonia. 21st Century Tech Blog Science, Technology and the Future. 2023. Available online: https://www.21stcentech.com/toyota-develops-internal-combustion-engine-runs-ammonia/ (accessed on 31 May 2025).
  38. Brownon, T.; Ammonia Energy Association. Heavy-Duty Diesel Trucks to Be Converted to Use Ammonia Fuel in Canada. 2019. Available online: https://ammoniaenergy.org/articles/heavy-duty-diesel-trucks-to-be-converted-to-use-ammonia-fuel-in-canada/ (accessed on 31 May 2025).
  39. Atchison, J.; Ammonia Energy Association. Amogy: Ammonia-Powered Semi-Truck. 2023. Available online: https://ammoniaenergy.org/articles/amogy-ammonia-powered-semi-truck/ (accessed on 31 May 2025).
  40. Anner, N. At the Frontier of Ammonia Propulsion. MAN Energy Solutions ND. Available online: https://www.man-es.com/discover/ammonia-engine-testing (accessed on 31 May 2025).
  41. Wärtsilä Corporation. World’s First Full Scale Ammonia Engine Test—An Important Step Towards Carbon Free Shipping. 2020. Available online: https://www.wartsila.com/media/news/30-06-2020-world-s-first-full-scale-ammonia-engine-test---an-important-step-towards-carbon-free-shipping-2737809 (accessed on 31 May 2025).
  42. Imhoff, T.B.; Gkantonas, S.; Mastorakos, E. Analysing the Performance of Ammonia Powertrains in the Marine Environment. Energies 2021, 14, 7447. [Google Scholar] [CrossRef]
  43. Afif, A.; Radenahmad, N.; Cheok, Q.; Shams, S.; Kim, J.H.; Azad, A.K. Ammonia-fed fuel cells: A comprehensive review. Renew. Sustain. Energy Rev. 2016, 60, 822–835. [Google Scholar] [CrossRef]
  44. Jeerh, G.; Zhang, M.; Tao, S. Recent progress in ammonia fuel cells and their potential applications. J. Mater. Chem. A 2021, 9, 727–752. [Google Scholar] [CrossRef]
  45. Blomerus, P. Decarbonizing Marine Shipping: Clean Fuels for a Greener Future? Clear Seas. 2024. Available online: https://clearseas.org/insights/decarbonizing-marine-shipping-clean-fuels-for-a-greener-future/ (accessed on 31 May 2025).
  46. Prescop, T. Reformed Methanol Fuel Cell. (Block Diagram). 2007. Available online: https://en.wikipedia.org/wiki/File:Reformed_methanol_fuel_cell_(block_diagram).jpg (accessed on 31 May 2025).
  47. Sheperd, J. DaimlerChrysler Unveils New Necar 5 Fuel Cell Vehicle. 2000. Available online: https://eepower.com/news/daimlerchrysler-unveils-new-necar-5-fuel-cell-vehicle/# (accessed on 31 May 2025).
  48. Roland Gumpert. Nathalie—First Edition. 2024. Available online: https://www.rolandgumpert.com/en/ (accessed on 31 May 2025).
  49. Szybist, J.P.; McLaughlin, S.; Iyer, S. Emissions and Performance Benchmarking of a Pro-Totype Dimethyl Ether-Fueled Heavy-Duty Truck; Technical Report ORNL/TM-2014/59; Oak Ridge National Laboratory: Oak Ridge, TN, USA, 2014. Available online: https://afdc.energy.gov/files/u/publication/ornl_dme_tm-2014-59.pdf (accessed on 31 May 2025).
  50. Clark, J.; Canadian Mining and Energy. NAIT Applies DME to Long-Haul Trucks in Alberta. 2025. Available online: https://www.miningandenergy.ca/read/nait-applies-dme-to-long-haul-trucks-in-alberta (accessed on 31 May 2025).
  51. Volvo. Mack Trucks Tests Alternative Fuel DME. 2017. Available online: https://www.volvogroup.com/en/news-and-media/news/2017/jan/mack-trucks-tests-alternative-fuel-dme.html (accessed on 31 May 2025).
  52. Hjelkrem, O.A.; Arnesen, P.; Bø, T.A.; Sondell, R.S. Estimation of tank-to-wheel efficiency functions based on type approval data. Appl. Energy 2020, 276, 115463. [Google Scholar] [CrossRef]
  53. Li, H.; Khalfan, A.; Andrews, G. Determination of GHG Emissions, Fuel Consumption and Thermal Efficiency for Real World Urban Driving using a SI Probe Car. SAE Int. J. Engines 2014, 7, 1370–1381. [Google Scholar] [CrossRef]
  54. Thomas, J. Drive Cycle Powertrain Efficiencies and Trends Derived from EPA Vehicle Dynamometer Results. SAE Int. J. Passeng. Cars Mech. Syst. 2014, 7, 1374–1384. [Google Scholar] [CrossRef]
  55. Goswami, G.; Tupitsina, A.; Jaiswal, S.; Nutakor, C.; Lindh, T.; Sopanen, J. Compari-son of Various Hybrid Electric Powertrains for Non-Road Mobile Machinery Using Real-Time Multibody Simulation. IEEE Access 2022, 10, 107632–107648. [Google Scholar] [CrossRef]
  56. IRENA and Methanol Institute. Innovation Outlook: Renewable Methanol; International Renewable Energy Agency: Abu Dhabi, Saudi Arabia, 2021; p. 54. Available online: https://www.irena.org/-/media/Files/IRENA/Agency/Publication/2021/Jan/IRENA_Innovation_Renewable_Methanol_2021.pdf (accessed on 31 May 2025).
  57. Vancoillie, J.; Demuynck, J.; Sileghem, L.; Van De Ginste, M.; Verhelst, S.; Brabant, L.; Van Hoorebeke, L. The potential of methanol as a fuel for flex-fuel and dedicatedspark-ignition engines. Appl. Energy 2013, 102, 140–149. [Google Scholar] [CrossRef]
  58. Brusstar, M.; Stuhldreher, M.; Swain, D.; Pidgeon, W. High Efficiency and Low Emissions from a Port-Injected Engine with Neat Alcohol Fuels. SAE Trans. 2002, 111, 1445–1451. [Google Scholar]
  59. Siqens. How Does a Methanol Fuel Cell Work? 2023. Available online: https://siqens.de/en/methanol-fuel-cell/ (accessed on 31 May 2025).
  60. Denholm, P.; Margolis, R.M. Land-use requirements and the per-capita solar footprint for photovoltaic generation in the United States. Energy Policy 2008, 36, 3531–3543. [Google Scholar] [CrossRef]
  61. Denholm, P.; Hand, M.; Jackson, M.; Ong, S. Land-Use Requirements of Modern Wind Power Plants in the United States; Technical Report NREL/TP-6A2-45834; National Renewable Energy Laboratory: Golden, CO, USA, 2009. Available online: https://www.nrel.gov/docs/fy09osti/45834.pdf (accessed on 31 May 2025).
  62. Ember. Yearly Electricity Data. 2025. Available online: https://ember-energy.org/data/yearly-electricity-data/ (accessed on 31 May 2025).
  63. IRENA. Renewable Capacity Statistics; International Renewable Energy Agency: Abu Dhabi, Saudi Arabia, 2024; Available online: https://www.irena.org/-/media/Files/IRENA/Agency/Publication/2024/Mar/IRENA_RE_Capacity_Statistics_2024.pdf (accessed on 31 May 2025).
  64. U.S Energy Information Agency. Levelized Costs of New Generation Resources in the Annual Energy Outlook. 2025. Available online: https://www.eia.gov/outlooks/aeo/electricity_generation/pdf/AEO2025_LCOE_report.pdf (accessed on 28 June 2025).
  65. Dunlap, R.A. Renewable Energy Storage—Mechanical and Thermal Methods; Springer Nature: Cham, Switzerland, 2025. [Google Scholar] [CrossRef]
  66. Dunlap, R.A. Renewable Energy Storage—Electrical, Magnetic and Chemical Methods; Springer Nature: Cham, Switzerland, 2025; in press. [Google Scholar]
  67. Dunlap, R.A. Renewable Energy—Requirements and Sources; Springer Nature: Cham, Switzerland, 2025. [Google Scholar] [CrossRef]
  68. Ritchie, H.; Roser, M. Half of the World’s Habitable Land is Used for Agriculture. 2019. Available online: https://ourworldindata.org/global-land-for-agriculture (accessed on 31 May 2025).
Figure 1. World primary energy consumption and breakdown of sources from 1800 to 2023 [2]. (1) A watt-hour is the energy delivered by one watt of power for one hour. (2) Primary energy is the energy available as resources. CC BY 4.0.
Energies 18 03556 g001
Figure 2. Relationship of primary energy to useful energy showing losses at each stage [3]. CC BY 4.0.
Energies 18 03556 g002
Figure 3. Sankey diagram of energy sources and end use sector energy for the United States in 2023 [4]. (a) Primary energy consumption. (b) The electric power sector includes electricity-only and combined heat and power plants whose primary business is to sell elctricity, or electricity and heat, to the public. (c) End-use sector consumption of primary energy and electricity sales to ultimate consumers, excluding electrical system losses. Public domain.
Energies 18 03556 g003
Figure 4. Historical and projected world transportation energy from 2010 to 2040 [5]. Public domain.
Energies 18 03556 g004
Figure 5. Breakdown of global greenhouse gas emissions by sector for the year 2016 [6]. CC BY 4.0.
Energies 18 03556 g005
Figure 6. Breakdown of world transportation energy for 2018 showing the relative importance of passenger vehicles, road freight, buses and motorcycles [8]. CC BY 4.0.
Energies 18 03556 g006
Figure 7. Improvement in efficiency of different classes of passenger vehicles in the United States from 1975 to 2021 as indicated by fuel economy. Fuel economy in miles per gallon (mpg) as used in the United States is related to fuel consumption in liters per 100 km (L/100 km) as used in many other countries by the relation (L/100 km) = 235/mpg [9]. Public domain.
Energies 18 03556 g007
Figure 8. Development of global passenger transportation demand in person∙km (left) and freight transportation demand in Mt∙km (right) from 2015 to 2050 [10]. CC BY 4.0.
Energies 18 03556 g008
Figure 9. Share of different classes of passenger vehicles in the United States from 1975 to 2022 [11]. CC BY-SA 4.0.
Energies 18 03556 g009
Figure 10. Average fuel efficiency as a function of year for light-duty road vehicles in the United States from 2000 to 2022. Short wheelbase vehicles have a wheelbase of 121 inches (3.073 m) or less and long wheelbase vehicles have a wheelbase greater than 121 inches [12]. Public domain.
Energies 18 03556 g010
Figure 11. Historical and projected breakdown of marine fuel use from 2005 to 2030. EEDI = energy efficient design index (heavy fuel oil + scrubbers), in-use efficiency = efficiency improvements of existing infrastructure, HFO = heavy fuel oil, MDO = marine diesel oil, MGO = marine gas oil, LNG = liquefied natural gas. Other fuels include hydrogen, biofuels, methanol, ammonia and other renewables [14]. CC BY-SA 4.0.
Energies 18 03556 g011
Figure 12. Relationship of specific energy and specific power (Ragone plot) for some energy storage devices [16]. Copyright (2011) with permission from Elsevier.
Energies 18 03556 g012
Figure 13. Annual sales of battery electric and plug-in hybrid road vehicles for the top world markets from 2010 to 2023 [17]. CC BY-SA 4.0.
Energies 18 03556 g013
Figure 14. Basic schematic of high-temperature electrolysis system utilizing electricity and heat from a high-temperature nuclear reactor. This is the method for the production of purple hydrogen. HTE = high-temperature electrolysis [23]. Copyright (2008) with permission from Elsevier.
Energies 18 03556 g014
Figure 15. Relative importance of electrical and thermal energy for high-temperature electrolysis as a function of temperature [23]. Copyright (2008) with permission from Elsevier.
Energies 18 03556 g015
Figure 16. Layout of a marine ammonia powertrain [42]. CC BY 4.0.
Energies 18 03556 g016
Figure 17. Schematic diagram of a reformed methanol fuel cell [46]. Public domain.
Energies 18 03556 g017
Figure 18. Estimated overall efficiency (tank-to-wheels efficiency) as a function of the fraction of maximum engine output for gasoline, diesel and electric road vehicles [52]. CC BY 4.0.
Energies 18 03556 g018
Figure 19. Efficiency map for a diesel engine under different operating conditions [55]. CC BY 4.0.
Energies 18 03556 g019
Figure 20. Estimated levelized cost of electricity for new resources entering service in 2030 [64]. Public domain.
Energies 18 03556 g020
Figure 21. Breakdown of world land use as of 2018. Total = 1.37 × 10⁸ km2 [68]. CC BY 4.0.
Energies 18 03556 g021
Table 1. Breakdown of world primary energy use in 2023. Fossil fuels include coal, oil and natural gas. Traditional biomass is comprised predominantly of wood that is a major component of residential heating and cooking energy in developing countries. Data are adapted from [2] and references therein.
SourceGJPercent of Total
Fossil fuels5.048 × 101185.3
Traditional biomass0.400 × 10116.8
Renewables0.371 × 10116.3
Nuclear0.099 × 10111.7
Table 2. Percent primary energy use and greenhouse gas emissions for world transportation needs for the year 2016. Data are adapted from [6,7].
Transportation ModePercent Primary EnergyPercent Greenhouse Gas Emissions
Road84.674.8
Rail1.72.5
Maritime4.110.7
Air9.511.9
Table 3. Breakdown of global primary energy used for different classes of road transportation. Note that passenger vehicles include cars, sport utility vehicles and personal trucks. Data adapted from [8].
Vehicle ClassPercent Energy
Passenger66.3
Freight30.3
Bus2.2
Motorcycle1.1
Table 4. Breakdown of final rail energy in different regions as of 2017. Data adapted from [13] and references therein. Mtoe = million tonnes oil equivalent.
RegionEnergy (Mtoe)
North America14.7
China11.4
Europe7.1
Russia5.8
Japan2.8
India4.1
Rest of World8.4
Table 5. Breakdown of energy for rail types in different regions as of 2017. Data adapted from [13] and references therein. Values in Mtoe = million tonnes oil equivalent.
RegionFreight DieselConventional DieselFreight ElectricConventional ElectricUrban ElectricHigh Speed Electric
North America13.50.3-0.20.6-
China3.20.34.30.81.11.6
Europe0.61.02.61.01.10.8
Russia1.70.23.20.50.1-
Japan-0.10.11.90.50.3
India1.21.01.10.70.1-
Table 6. Colors of hydrogen and methods of preparation.
ColorPreparation Method
GraySteam reforming of fossil fuel methane
BlackGasification of coal
BrownGasification of lignite
BlueSteam reforming of fossil fuel methane with carbon capture
TurquoiseMethane pyrolysis
GreenElectrolysis using renewable energy
YellowElectrolysis using solar electricity
PinkElectrolysis using nuclear energy
PurpleHigh-temperature electrolysis using nuclear electricity and heat
RedThermochemical reactions using nuclear heat
WhiteNaturally occurring geological hydrogen
OrangeProduced by injecting water into geological ferrous iron deposits
GoldHydrogen produced by injecting bacteria into oil wells
Table 7. Typical outlet temperatures for Generation IV nuclear reactors. Adapted from data in [21].
ReactorTypical Outlet Temperature (°C)
Very high-temperature reactor900–1000
Molten salt reactor700–800
Supercritical water-cooled rector510–625
Gas-cooled fast reactor850
Sodium-cooled fast reactor500–550
Lead-cooled fast reactor480–570
Table 8. Properties of hydrogen (H2) relevant to its use as a fuel. Energy content is the higher heat of combustion.
PropertyValueUnits
Chemical formulaH2-
Molecular mass2.01588g/mol
Boiling temperature (1 atm)20.27K
Gas density (STP)0.08988kg/m3
Gas density (35 MPa)24kg/m3
Gas density (70 MPa)40kg/m3
Liquid density (20.27 K)70.99kg/m3
Higher heating value (HHV)141.88MJ/kg
Lower heating value (LHV)120MJ/kg
Energy density (gas STP)12.7MJ/m3
Energy density (gas 35 MPa)3405MJ/m3
Energy density (gas 70 MPa)5675MJ/m3
Energy density (liquid)10,072MJ/m3
Table 9. Properties of some electrofuels. Density is the density of the liquid phase at boiling for methane, ammonia and dimethyl ether and at STP for methanol. Energy content is the higher heat of combustion.
PropertyMethaneAmmoniaMethanolDimethyl EtherUnits
Chemical formulaCH4NH3CH3OHCH3OCH3-
Molecular mass16.04317.03132.04246.069g/mol
Boiling temperature (1 atm)−161.5−33.3464.7−24°C
Density (liquid)422.8682792735kg/m3
Energy content55.522.522.728.8MJ/kg
Energy density (liquid)23.515.318.021.2MJ/L
Table 10. Properties of some typical large solar photovoltaic facilities worldwide.
FacilityCountryLatitudeCapacity (MW)Area (km2)Annual Generation (GWh)Capacity Factor (%)kWh/m2 Per Year
Midong Solar ParkChina44.7° N4000133609017.445.8
Ruogiang Solar ParkChina38.9° N400088.27720020.581.6
Benban Solar ParkEgypt24.5° N165037380026.2102.7
Kalyon Karapinar Solar Power PlantTurkey37.8° N135020170014.485.0
Villanueva Solar ParkMexico25.6° N82827.5170023.461.8
Copper Mountain Solar FacilityUnited States35.8° N80216.2134819.183.2
Kamuthi Solar Power ProjectIndia9.3° N64810.1135023.7133.7
Table 11. Summary of most probable values in km2 per MW capacity of direct permanent, direct temporary and total impacted areas. Data adapted from results given in Denholm et al. [61].
AreaMost Probable (km2/MW)
Direct permanent0.001 to 0.002
Direct temporary0.005 to 0.01
Total impacted0.20 to 0.30
Table 12. Typical net efficiencies for different transportation technologies as determined by the discussion in Section 4.
TechnologyEfficiency
Gasoline20%
Diesel35%
Battery electric vehicle80%
Hydrogen internal combustion10%
Hydrogen fuel cell29%
Electrofuel internal combustion23%
Electrofuel fuel cell21%
Table 13. Electricity requirements to provide the same annual energy at the wheels as currently used by fossil fuels as determined using the efficiency of different alternative transportation technologies. Relative electricity compared to current global generation of 2.97 × 10¹⁶ Wh per year is given in the final column.
TechnologyEnergy (Wh)Relative
Battery electric vehicle1.4 × 101647%
Hydrogen internal combustion1.10 × 1017370%
Hydrogen fuel cell3.8 × 1016128%
Electrofuel internal combustion4.8 × 1016162%
Electrofuel fuel cell 5.2 × 1016175%
Table 14. Current (2023/2024) global low-carbon generating capacities, annual generation and average capacity factors. Data adapted from [62,63].
MethodCapacity (W)Annual Generation (Wh)Capacity Factor (%)
Solar1.419 × 10122.130 × 101517
Wind1.017 × 10122.497 × 101528
Hydroelectric1.408 × 10124.419 × 101536
Other renewable0.015 × 10120.089 × 101568
Nuclear0.392 × 10122.765 × 101580
Total low-carbon4.251 × 10121.19 × 101632
Table 15. Estimated additional annual generating capacity requirements for different transportation technologies and estimated additional generating capacity assuming only solar or wind generation. Capacity in Watts is given as (100 × energy)/(capacity factor × 8760 h) where energy is in Wh and capacity factor is in %.
TechnologyEnergy (Wh)Additional Capacity (W)
SolarWind
Battery electric vehicle1.4 × 10169.4 × 10125.7 × 1012
Hydrogen internal combustion1.10 × 10177.4 × 10134.4 × 1013
Hydrogen fuel cell3.8 × 10162.6 × 10131.6 × 1013
Electrofuel internal combustion4.8 × 10163.2 × 10131.9 × 1013
Electrofuel fuel cell5.2 × 10163.5 × 10132.1 × 1013
Table 16. Estimated storage requirements for different sustainable transportation technologies as described in the text.
TechnologyStorage Requirement (Wh)
Battery electric vehicle3.8 × 1013
Hydrogen internal combustion3.0 × 1014
Hydrogen fuel cell1.0 × 1014
Electrofuel internal combustion1.3 × 1014
Electrofuel fuel cell1.4 × 1014
Table 17. Approximate current electric grid storage capacity for different technologies.
TechnologyMaximum Output (W)Storage Capacity (Wh)
Pumped hydroelectric1.8 × 10111.6 × 1012
Lithium-ion battery5.6 × 10101.9 × 1011
Sodium battery2 × 10107 × 1010
Flow battery1.4 × 1085.3 × 108
Total2.56 × 10111.86 × 1012
Table 18. Solar and wind energy land area requirements for different transportation technologies. Areas are based on necessary generating capacity as in Table 15 and land requirements of 0.018 km2/MW for solar and 0.25 km2/MW for wind (see Section 5.1 and Section 5.2 above).
TechnologyLand Area Required (km2)
SolarWind
Battery electric vehicle1.7 × 1051.4 × 106
Hydrogen internal combustion1.3 × 1061.1 × 107
Hydrogen fuel cell4.7 × 1054.0 × 106
Electrofuel internal combustion5.7 × 1054.8 × 106
Electrofuel fuel cell6.3 × 1055.3 × 106
Disclaimer/Publisher’s Note: The statements, opinions and data contained in all publications are solely those of the individual author(s) and contributor(s) and not of MDPI and/or the editor(s). MDPI and/or the editor(s) disclaim responsibility for any injury to people or property resulting from any ideas, methods, instructions or products referred to in the content.

