Article

Governance, Energy Policy, and Sustainable Development: Renewable Energy Infrastructure Transition in Developing MENA Countries

by
Michail Michailidis
1,*,
Eleni Zafeiriou
2,*,
Apostolos Kantartzis
1,
Spyridon Galatsidas
1 and
Garyfallos Arabatzis
1
1
Department of Forestry and Management of the Environment and Natural Resources, Democritus University of Thrace, 68200 Orestiada, Greece
2
Department of Agricultural Development, Democritus University of Thrace, 68200 Orestiada, Greece
*
Authors to whom correspondence should be addressed.
Energies 2025, 18(11), 2759; https://doi.org/10.3390/en18112759
Submission received: 13 April 2025 / Revised: 21 May 2025 / Accepted: 22 May 2025 / Published: 26 May 2025
(This article belongs to the Special Issue The Future of Renewable Energy: 2nd Edition)

Abstract

:
This study provides a comparative analysis of the environmental and economic performance of Oman, Egypt, and Morocco, focusing on the critical interplay between their economic structures, governance frameworks, and energy policies. Morocco stands out as a regional leader in renewable energy, driven by significant investments in solar, wind, and hydroelectric projects, positioning itself as a model for clean energy transition. Egypt, despite its rapid industrialization and urbanization, faces mounting environmental pressures that challenge its economic diversification efforts. Oman, heavily dependent on hydrocarbons, confronts significant sustainability risks due to its reliance on fossil fuels, despite the political stability that could support renewable integration. The research underscores that while these nations share common challenges, including regulatory weaknesses and energy policy inconsistencies, their distinct economic contexts demand tailored approaches. Morocco’s path to energy leadership must focus on integrating renewables across all sectors, enhancing grid infrastructure, and expanding green technology innovations to maintain momentum. Egypt should prioritize scaling up renewable infrastructure, reducing dependency on fossil fuels, and investing in clean technology to address its carbon footprint. For Oman, the strategic diversification of its economy, combined with aggressive renewable energy integration, is critical to reducing CO2 emissions and mitigating climate impacts. This study contributes novel insights by highlighting the role of political stability, institutional quality, and policy coherence as critical enablers of long-term sustainability. It also identifies the importance of regional cooperation and knowledge sharing to overcome shared challenges like data limitations, geopolitical complexities, and methodological gaps in sustainability assessments. The findings advocate for a multi-method approach, integrating economic modeling, life-cycle analysis, and policy evaluation, to guide future sustainability efforts and foster resilient, low-carbon economies in the MENA region.

1. Introduction

The interplay between economic growth, energy consumption, and environmental sustainability has been extensively studied in the contemporary literature. The Environmental Kuznets Curve (EKC) hypothesis suggests that economic development initially leads to environmental degradation, but at higher income levels, economic growth fosters ecological improvements [1]. However, the validity of this hypothesis remains contested, particularly in the context of renewable energy adoption and technological innovation.
Nevertheless, the validity of the EKC hypothesis is not firmly established, particularly with regard to global pollutants like carbon emissions. While some studies have observed the EKC pattern for local pollutants, CO2 emissions have not consistently followed this trajectory. Variables such as renewable energy adoption and technological innovation may offer importance in forming the correlation between economic development and environmental quality, suggesting that the specific framework may not widely apply across all environmental conditions [2].
Oman, Egypt, and Morocco have been making strategic investments in infrastructure to strengthen their economies and enhance long-term resilience. Oman has placed significant emphasis on large-scale projects, particularly in the green hydrogen sector, with an investment of $11 billion in new developments in Dhofar. These initiatives play a crucial role in the country’s broader economic diversification efforts and its aspirations to become a key player in the global hydrogen industry. In Egypt, the government has launched extensive modernization programs within the petroleum and infrastructure sectors, aiming to improve energy security and economic stability. These efforts reflect a national strategy to create a more self-sufficient and resilient energy market. Meanwhile, Morocco has directed infrastructure investments toward economic diversification, particularly by enhancing governance in the electricity sector and encouraging domestic energy production. These improvements are designed to support the country’s transition toward greater energy independence and long-term economic stability [3].
Simultaneously, all three countries have been accelerating their renewable energy initiatives, recognizing the sector’s potential to drive economic growth and sustainability. Oman has set an ambitious goal of producing 1 million tons of green hydrogen annually by 2030, positioning itself as a frontrunner in the global hydrogen economy. Egypt has also made significant progress, securing $40 billion in agreements for green hydrogen and renewable energy projects as part of its broader transition toward clean energy. Morocco, already a leader in renewable energy, aims to generate 52% of its electricity from renewables by 2030. This goal is supported by its “Green Energy” program, which has received €50 million in funding to further drive sustainable energy adoption. These initiatives demonstrate a collective regional effort to integrate renewable energy into economic development strategies while enhancing energy security and environmental sustainability [3].
Climate change and its consequences have become key principles for the structure of regional and/or national plans. Most of the countries belong to the Paris Agreement, according to which they should shape their policies and development plans in order to contribute to the mitigation of the global warming below 2 °C above pre-industrial levels, and the temperature increase to 1.5 °C [3,4,5,6,7,8,9,10,11,12,13]. Parameters such as the economic growth in relationship with the environmental impact should be considered so to progress into efficient sustainable planning [12,14,15].
This manuscript aims to assess the sustainability progress of three strategically selected MENA countries—Morocco, Egypt, and Oman—representing different stages of economic development and varying degrees of dependency on fossil fuels [16]. These countries were chosen not only for their economic diversity but also for their critical geographical positions as maritime junctions: Morocco connects the Atlantic Ocean to the Mediterranean Sea, Egypt links the Mediterranean to the Red Sea via the Suez Canal, and Oman serves as a gateway between the Persian/Arabian Gulf, the Red Sea, and the Indian Ocean [3,17]. These strategic locations make them influential players in global trade routes, providing valuable insights into the intersection of economic growth, energy policies, and environmental sustainability.
In this study, we employ a Bayesian Vector Autoregression (BVAR) approach to quantify the interlinkages between economic growth, energy consumption, carbon emissions, and renewable energy investments across Morocco, Egypt, and Oman. The BVAR framework is particularly suited for this analysis as it effectively captures the dynamic interactions among multiple time series while incorporating prior beliefs, allowing for more robust inference in the presence of limited data, a common challenge in the MENA region. This methodology offers a flexible and data-driven means of understanding the complex relationships that drive economic and environmental outcomes, providing insights that are less sensitive to overfitting and multicollinearity issues than traditional VAR models [14,18,19,20].
Our BVAR model integrates key macroeconomic indicators, including Gross Domestic Product (GDP), carbon emissions, and renewable energy investment, alongside energy consumption measures, to assess the interplay between economic activity and environmental sustainability. The use of Bayesian shrinkage priors helps mitigate the over-parameterization risk, enhancing the reliability of impulse response functions and variance decompositions in identifying the causal pathways. This approach also allows for more precise estimation of the long-term effects of energy policy changes, offering critical insights for policymakers aiming to balance economic growth with sustainability goals [18,19,20].
Oman, Egypt, and Morocco have been strategically selected as representative case studies for analyzing the sustainability transitions in the MENA (Middle East and North Africa) region. These three countries offer a diverse cross-section of economic structures, energy dependencies, and geopolitical contexts, making them ideal for assessing the complex interplay between economic growth, energy policy, and environmental impact.
Oman, as a major oil exporter, represents the traditional hydrocarbon-dependent economies of the Gulf, characterized by significant fossil fuel reliance and high carbon emissions. This reliance presents substantial sustainability challenges, including economic vulnerability to oil price fluctuations and a high carbon footprint. However, Oman also holds significant potential for renewable energy integration, given its extensive solar and wind resources, making it a critical example of a country at a crossroads between conventional energy dependence and sustainable diversification [12,15,17,21,22].
Egypt, in contrast, has a more diversified economy, encompassing industrial, agricultural, and service sectors. It is also a key geopolitical player, controlling the Suez Canal, a vital maritime chokepoint linking the Mediterranean Sea to the Red Sea and the Indian Ocean. This strategic position amplifies its role in global trade and energy markets. Despite this, Egypt remains heavily reliant on fossil fuels, facing significant environmental pressures from rapid urbanization, industrial expansion, and high population growth, all of which complicate its path toward sustainability [12,15,17,21,22].
Morocco, on the other hand, stands out as a regional leader in renewable energy, with ambitious investments in solar, wind, and hydropower. It has established itself as a model for clean energy transition within the MENA region, leveraging its favorable geographical location for both solar and wind resources. Morocco’s experience provides valuable insights into the potential for energy transformation in emerging economies, offering lessons in regulatory reform, policy innovation, and green technology adoption [14,18,19,20].
Collectively, these countries capture the diverse economic, environmental, and geopolitical dynamics of the MENA region. Their varied pathways towards sustainability provide a comprehensive perspective on the challenges and opportunities facing similar economies. This study aims to draw meaningful comparisons and extract actionable insights to inform energy transition strategies, balancing economic growth with environmental stewardship across the region.
The novelty of the study lies in combining advanced econometric modeling with region-specific insights to evaluate sustainability outcomes. The results offer evidence-based guidance for policymakers seeking to align economic growth with environmental goals, particularly in the context of global energy transitions and regional development challenges.
Overall, the Bayesian VAR framework provides a comprehensive and sophisticated analytical lens for exploring the interdependence among economic growth, energy consumption, and environmental impact in the MENA region, supporting the development of tailored, evidence-based policy recommendations.

2. Literature Review

The global transition to renewable energy has become a cornerstone of sustainable development, catalyzing a wave of interdisciplinary research into its ecological, economic, and institutional implications. Central to this inquiry is the EKC hypothesis, which posits an inverted-U relationship between economic growth and environmental degradation: pollution intensifies at early development stages but declines once a certain income threshold is reached [23]. Although the EKC remains a popular framework, its empirical validity is increasingly contested. A range of studies finds mixed evidence, often influenced by methodological choices, country-specific conditions, and the role of renewable energy consumption (REC), technological innovation, and policy design [24,25,26].
Early panel analyses across OECD nations revealed varied EKC trajectories: while some confirmed the inverted-U pattern, others found N-shaped or region-specific trends. For instance, a quantile regression on 37 OECD countries (1960–2019) indicated that the EKC effect is absent at lower-income levels, takes a U-shape in middle-income brackets, and shifts toward an N-shape in higher-income economies [27]. A dynamic panel analysis of Annex I countries further challenged the universality of the EKC by revealing robust cointegration between GDP, fossil fuel consumption, and emissions, yet considerable variation in curve shape depending on the period and specification [28].
Recent empirical work underscores the dual role of REC in reducing emissions and supporting economic growth. In OECD contexts, threshold models reveal that once renewables surpass a critical share of total energy consumption, their impact on carbon mitigation becomes more pronounced [29]. Studies using ARDL approaches in G7 economies (1990–2020) demonstrate that rising shares of renewables are associated with long-run CO2 reductions, even amidst population and GDP growth [30,31]. Across the 37 OECD countries, empirical findings highlight that trade openness, technological innovation, and REC jointly exert a strong inverse effect on carbon intensity [32,33].
Country-level analyses further refine this picture. In Egypt, Morocco, and Oman, studies largely support the EKC pattern, showing initial positive correlations between GDP and emissions, followed by a plateau or decline as renewable investments mature [34,35]. However, Morocco’s aggressive rollout of solar and wind infrastructure appears to alter the expected EKC trajectory. The country demonstrates emission stabilization that does not follow the traditional inverted-U, pointing to the potential of early and targeted renewable energy interventions to bypass or compress the EKC [36].
Technology diffusion and innovation also play a pivotal role in shaping long-run environmental outcomes. Empirical studies show that “innovation shocks”—such as steep declines in photovoltaic costs or the introduction of grid-scale battery storage—accelerate carbon reductions more than income effects alone [37,38]. Structural break tests suggest that technological advancements can fundamentally alter emission trajectories [37]. Optimization techniques applied to wind and bioenergy systems further demonstrate that operational efficiency gains can improve lifecycle sustainability by up to 20 [39,40]. These findings emphasize the value of R&D investment and the importance of system-wide optimization in the energy sector [41].
From a policy standpoint, the success of renewable energy transitions hinges on well-structured regulatory mechanisms and market-based instruments. Green certificate policies and renewable portfolio standards (RPS) are widely used to enforce renewable energy quotas, fostering demand for clean power through tradable certificates [37]. Financial incentives, subsidies, and tax credits reduce upfront investment barriers and have proven effective in expanding renewable capacity [42,43,44]. Stable and predictable pricing policies are essential to ensure investor confidence and mitigate risk during the early stages of market development [45]. Countries that align carbon pricing, feed-in tariffs, and R&D support experience more accelerated decarbonization relative to GDP growth [46].
Nonetheless, barriers persist. Technical challenges like power grid congestion due to intermittent renewable output require strategic planning and grid modernization [47]. Institutional bottlenecks—including administrative inefficiencies and policy uncertainty—can slow deployment and undermine investor confidence [48]. Overcoming these hurdles demands governance innovation, capacity building, and consistent regulatory environments [49]. In parallel, technology diffusion across sectors and regions is influenced by public awareness, education, and robust linkages between academia, industry, and government [50,51]. The presence of knowledge spillovers, economies of scale, and financial market development also accelerates the uptake of green technologies [52].
The literature increasingly calls for a rethinking of the EKC framework in light of these evolving dynamics. While the EKC remains a useful heuristic, its explanatory power diminishes without accounting for renewable energy penetration, policy heterogeneity, and technological advancement. Multifactor econometric models that integrate REC, R&D intensity, and institutional quality offer more accurate and actionable insights than GDP-only specifications [26]. Moreover, few studies adequately disaggregate impacts across sectors such as power, transport, and industry—each of which exhibits different energy-use profiles and emission pathways [53]. Future research should also address the socio-economic dimensions of renewable transitions, including energy access, employment reallocation, and equity concerns [54].
In conclusion, the global shift toward renewable energy is reshaping the traditional growth-environment nexus. Empirical evidence suggests that the integration of REC, technological innovation, and effective policy instruments can decouple economic growth from environmental harm. While the EKC hypothesis provides a foundational framework, it must be augmented with dynamic, context-specific models that reflect the complexity of modern economies. To chart a sustainable path forward, future research must bridge macroeconomic modeling with sectoral, institutional, and social analyses—creating integrated strategies that not only reduce emissions but also promote inclusive and resilient development.
Within this framework, the present study examines three countries that differ in terms of economic growth trajectories and the extent of renewable energy adoption. It seeks to investigate how efforts to decouple economic growth from fossil fuel dependency—through investment in research and development, as well as through enhanced political stability—can contribute to environmental improvements without hindering economic progress. Furthermore, the study explores how specific development strategies may enable sustained economic growth without being accompanied by a deterioration in environmental quality, as measured by carbon emissions. The following sections outline the specific economic, energy, and environmental conditions of the countries under study, providing context that may help explain the empirical findings and interpret the results of the present analysis.

2.1. Economic Growth (EG) and GDP Trends

Economic growth is strictly correlated to sustainability, affecting energy consumption, CO2 emissions, and investment in renewable technologies [12,15,55,56,57].

2.1.1. EG—Morocco

Morocco’s projected GDP growth is identified at 3.5% and 4.0% in 2024 and 2025, respectively [3,12,14,58,59]. It is worth mentioning that Morocco is characterized as much more economically resilient against Egypt and Oman, as its economy is diversified and driven by renewable energy [8,10]. Specifically, its diversified economy, which includes industry (26%), agriculture (12%), mining (10%), and tourism (7%), and consequently, its economic growth is aligned with renewable energy investments and European Union sustainability targets, proceeding to efficient trade partnerships [3,18,19,20,21]. The relationship between energy consumption and GDP is weak, suggesting that Morocco’s transition toward renewables has decoupled economic growth from fossil fuel use.
Morocco’s renewable energy expansion has significantly influenced its economic resilience. Large-scale projects, such as the Noor Ouarzazate Solar Complex, have attracted foreign direct investment (FDI) and strengthened Morocco’s energy independence. Moreover, the Moroccan Green Plan has modernized its agriculture sector, reducing reliance on water-intensive farming and improving efficiency. The country’s trade agreements with the EU further facilitate access to clean technology and financial incentives for sustainability projects.

2.1.2. EG—Egypt

Egypt has maintained GDP growth at an average rate of 4.9% for the period between 2018 and 2022, significantly based on industrial expansion, infrastructure projects, and foreign direct investment (FDI) [3,11,12,14,59]. Although Egypt is targeting a 100% green public investment by 2030, its reliance on fossil fuel in combination with the increasing inflation, currency disorder, external shocks and national debt, makes the target very ambitious to achieve [10,20,21,55]. However, it remains one of the strongest economies in North Africa. For reference, Egypt’s economy is concentrated in services (52%), industry (34%), and agriculture (14%) [12,60]. Country’s GDP growth is driven by industrial expansion, particularly in aluminum and other energy-intensive industries, whereas various sustainability initiatives, including financial incentives and sustainable financing for small and medium enterprises (SMEs), are incorporated to boost the economic growth. It is also worth noting that economic inequality is still a significant concern, as 29.7% of Egyptians live below the poverty line. Despite strong economic growth, there is a negative correlation between energy consumption and GDP, indicating that increased energy use does not necessarily translate into economic prosperity.

2.1.3. EG—Oman

Oil and gas, at 74%, is still the primary revenue of Oman’s government, and driving the projected GDP growth to 3% for 2024 [11,12,14,15,16,17]. This affection has a severe impact on the economy’s fluctuations due to the global energy prices. Even if Oman is having an ambitious 2040 Vision that would incorporate renewables, tourism, hydrogen production and other growth sectors into it, it remains highly vulnerable due to its dependence on oil and gas, fiscal deficits and limited FDI in renewables [3,10,12,17,20,21,60]. Tourism is expected to contribute 10% of GDP by 2040 (up from 3% in 2022), but structural constraints, such as fiscal deficits and weak policy enforcement, hinder economic transformation. Unlike Morocco, Oman exhibits a strong correlation between economic growth and energy consumption, highlighting continued reliance on fossil fuels.

2.2. Carbon Emissions (CE) and Decarbonization Efforts

Carbon emissions are recognized as a primary driver for the three countries, incorporating it into their decarbonization plans with variable manners [15,18,19,60].

2.2.1. CE—Morocco

Morocco has been a regional leader in the reduction of carbon emissions, targeting a 45.5% reduction by 2030 and net-zero emissions by 2050 [3,9,10,11,14,19,58]. Even if coal energy, contributing almost two-thirds to the nation’s electricity production, is still significant for Morocco, it has managed to mitigate the emissions growth by adopting significant investments in renewables such as solar and wind energy [18,19,20,21].
Key projects include:
  • Noor Ouarzazate Solar Complex—one of the largest solar plants globally.
  • “Terre Verte” Initiative (€115 million)—promoting sustainable agriculture to reduce emissions [3,15].
  • Expansion of wind energy capacity, particularly in Tangier and Tarfaya.
However, a negative correlation seems to exist between emissions and GDP growth, likely due to the country’s aggressive renewable energy policies.

2.2.2. CE—Egypt

Egypt’s plan to significantly reduce its emissions by 2030, including electricity (−37%), transport (−7%), and oil and gas (−65%), seems quite ambitious, as currently they are one of the North Africa’s carbon emitters champions [3,10,11,13,55]. Their energy production is strongly correlated with coal and natural gas, despite the growth of renewables [6,15,19,21,57].
Despite strong economic growth, Egypt’s emissions remain relatively high. It follows an inverse U-shaped curve, meaning emissions rise with income but begin to fall after reaching a threshold. GHG emissions have increased faster than the global average, with per capita emissions reaching 2.6 tons per year.
Key decarbonization efforts include the following:
  • Over 20 sustainability projects in the petroleum sector to reduce emissions.
  • Commitment to the Global Methane Pledge to cut methane emissions.
  • Green hydrogen and wind energy development to transition away from fossil fuels.

2.2.3. CE—Oman

Oman ranks among the highest per capita carbon emitters globally (~29.99 tCO2 per person in 2022) [3,11,12]. Oman’s CO2 emissions per capita have stabilized despite income growth, indicating increasing energy efficiency and a transition toward cleaner energy sources. The country plans to increase gas-fired power efficiency to 63% by 2027 to reduce emissions, while they have also committed to the Global Methane Pledge in the effort to reduce methane emissions. Despite the country’s commitment to net-zero emissions by 2050 and the long term investment in green hydrogen, their weak policy enforcement and dependance on fossil fuel makes Oman’s transition a slow one [7,8,10,14,16,17,19,20,21,22].

2.3. Renewable Energy Investments

Renewable energy plays a critical role in reducing emissions and ensuring sustainable economic growth [3,13,15,18,19,61]. The manuscript titled A Comprehensive Review of Green Hydrogen Energy Systems [62] provides a thorough analysis of renewable energy technologies, including photovoltaic (PV), wind, and hydrogen energy systems, which are critical for the sustainable energy transition in the Middle East and North Africa (MENA) region. Given the region’s substantial solar and wind resources, these technologies hold significant potential for reducing carbon emissions, enhancing energy security, and driving economic growth. The issue is further analyzed in the following paragraph;
Photovoltaic (PV) systems play a central role in the MENA energy transition, leveraging the region’s high solar irradiance and expansive desert landscapes. The manuscript discusses recent advancements in PV technology, such as the development of perovskite solar cells, which offer higher efficiency and lower production costs compared to traditional silicon-based panels. These innovations are critical for scaling up solar energy production in the MENA region, making it more economically viable and competitive. Large-scale projects like the Noor Ouarzazate Solar Complex in Morocco and the Mohammed bin Rashid Al Maktoum Solar Park in Dubai exemplify this trend, demonstrating the potential for PV systems to significantly reduce the carbon intensity of regional power grids.
Wind energy also presents a substantial opportunity for the MENA region, particularly in areas with favorable wind conditions, such as the Gulf of Suez in Egypt and the Atlantic coast of Morocco. The manuscript highlights the need for advanced turbine technology and improved grid integration to address the inherent variability of wind power. This is crucial for ensuring the stability and reliability of power systems as the share of wind energy in the overall energy mix increases. The integration of modern energy storage solutions and smart grid technologies can further enhance the efficiency and resilience of wind power systems, making them a vital component of the MENA region’s renewable energy strategy [63].
Hydrogen energy, particularly green hydrogen produced using renewable electricity, is emerging as a key focus area for MENA countries looking to diversify their energy portfolios and reduce carbon emissions. The manuscript emphasizes the potential for MENA to become a global leader in green hydrogen production, leveraging its abundant renewable energy resources. However, it also acknowledges the challenges associated with hydrogen production, including the high cost of electrolysis, infrastructure requirements, and the need for efficient transportation and storage solutions. Overcoming these barriers will be critical for the widespread adoption of hydrogen as a clean energy carrier, capable of supporting both domestic energy needs and export opportunities [64].
In the context of renewable energy adoption and its economic impacts, it is essential to consider the technical and operational challenges associated with large-scale energy systems. For instance, Zhao, Zhu, and Jiang (2025) provide a comprehensive assessment of cavitation scale effects on energy conversion and stability in pumped hydro energy storage units, highlighting the importance of technological efficiency in maximizing the economic benefits of renewable energy systems [64]. Their findings underscore the critical role of advanced energy storage solutions in stabilizing power grids and enhancing the reliability of renewable energy sources, which is particularly relevant for MENA countries aiming to reduce their dependence on fossil fuels and improve energy security. Given the significant variability of solar and wind resources in this region, efficient energy storage systems like pumped hydro can play a pivotal role in supporting the long-term economic viability of large-scale renewable energy adoption. A summary of key indicators regarding renewable energy investments is developed in Table 1.

2.4. Economic Growth vs. Carbon Emissions
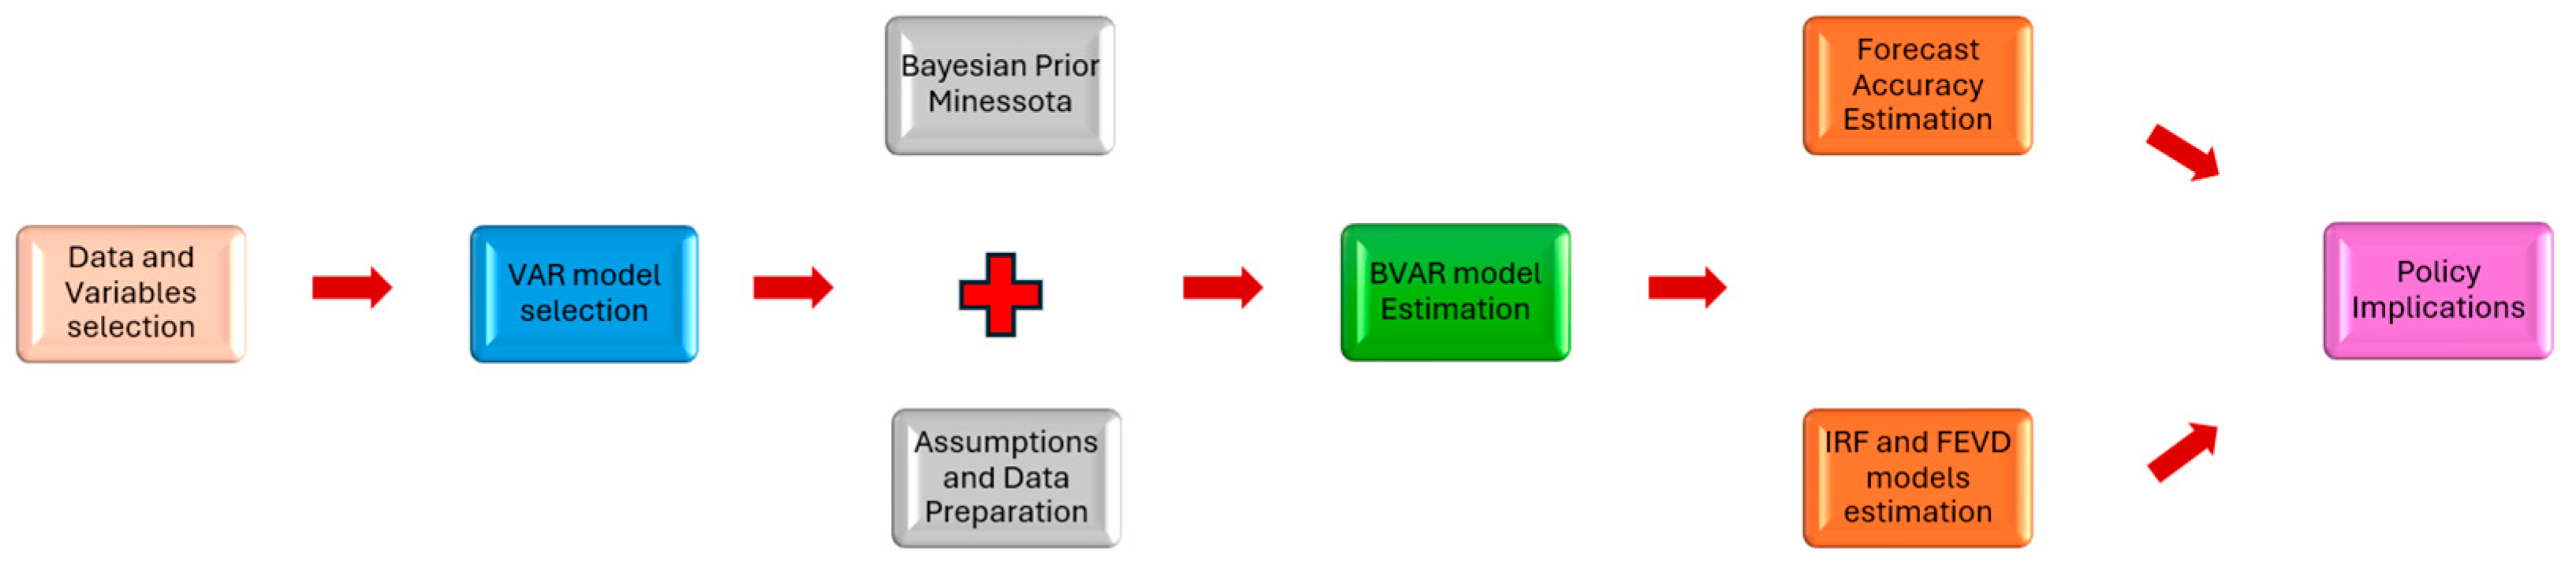
On the one hand, Egypt and Oman exhibit a strong correlation between GDP growth and emissions due to their dependence on fossil fuels [12,14,15,55]. In contrast, Morocco, has anticipated to decouple economic growth from emissions by investing in renewables [3,9,19,21]. Morocco’s partnership with the EU on green energy facilitates the development of sustainable industries and economic diversification. Concluding, Morocco and Egypt have efferently structured their plans and identified significant foreign investment in renewable energy, while Oman remains reliant on oil and gas revenues [7,12,14,20,57]. The relevant future outlook for each of the three countries is assessed against the relative sustainability targets on the following Table 2.

3. Methodology

The present study utilized datasets sourced from the World Data Bank, with the temporal scope expanded to encompass the years 2000 through 2022. To capture the nuanced dynamics and developmental trajectories of individual nations, we adopted a time series analysis approach for each country independently. This methodological choice allows for a more granular investigation of trends, patterns, and shifts within each nation, taking into account the unique socioeconomic conditions, policy environments, and varying rates of economic and social development. By treating each country as a distinct case, we aimed to highlight the heterogeneity in national contexts, offering a more accurate and context-sensitive interpretation of the observed data.
The Table 3 that follows describes the variables employed in the BVAR methodology for each individual country.
The analytical description of the data sources are provided in the Appendix A, Table A1.
In terms of the methodology, the Bayesian Vector Autoregression (BVAR) was selected as a robust analytical framework for examining the intricate interdependence between environmental sustainability and economic dynamics. This model refines the classical Vector Autoregression (VAR) framework by incorporating Bayesian statistical principles, enhancing parameter estimation stability, particularly in scenarios where datasets are constrained or noisy [65,66,67]. Unlike traditional VAR models that rely purely on observed data, BVAR introduces prior information derived from theoretical frameworks, historical observations, and expert knowledge, strengthening the reliability of the results. This Bayesian approach is particularly useful in assessing the economic and environmental trade-offs associated with policies such as the European Green Deal, which aims to achieve carbon neutrality while fostering economic resilience [68].
A fundamental assumption underpinning the BVAR framework is that economic and environmental variables exhibit interdependent, time-sensitive relationships. In this study, emissions, economic growth, and trade interactions are analyzed under the assumption that their influences are dynamically interconnected. The model assumes stationarity in the time-series data, ensuring that key statistical properties, such as mean and variance, remain stable over time. If the data fails to meet stationarity conditions, transformations like differencing are applied to stabilize their statistical properties [69]. The inclusion of prior distributions within BVAR is instrumental in mitigating the overfitting challenges often encountered in classical VAR models, where the estimation of a large number of parameters can lead to excessive model complexity, particularly when working with limited datasets [70,71,72]. By integrating Bayesian priors, BVAR imposes structural discipline on parameter estimates, preventing the model from being overly sensitive to fluctuations in the dataset.
BVAR holds several advantages over traditional econometric models, making it particularly effective in macroeconomic and sustainability assessments. First, it enhances forecast accuracy by incorporating both empirical data and prior knowledge, allowing for improved predictive performance in contexts where data limitations pose challenges [73,74]. Second, it effectively manages multicollinearity, a common issue in economic and environmental modeling where predictor variables exhibit high correlations. Third, BVAR provides a probabilistic framework that explicitly accounts for uncertainty in forecasts, offering credible intervals rather than single-point estimates, which enhances the interpretability and reliability of results [67]. These features make BVAR a particularly valuable tool for evaluating the impact of policy measures such as carbon pricing, emission reduction strategies, and green investment initiatives within the European Green Deal framework.
A key feature of this study is the application of the Minnesota prior within the BVAR framework, a well-established Bayesian shrinkage technique designed to enhance model efficiency. The Minnesota prior addresses overparameterization risks by assuming that a variable’s own past values play a more significant role in predicting its future trajectory than the lags of other variables. This shrinkage method is particularly beneficial in forecasting macroeconomic variables and high-dimensional systems where the inclusion of excessive parameters can lead to estimation instability [71,74]. The prior’s hyperparameters regulate the extent of shrinkage, ensuring that coefficients are drawn toward their expected values unless strong empirical evidence suggests otherwise. By leveraging the Minnesota prior, the model achieves a balance between parsimony and flexibility, making it an effective tool for evaluating the economic and environmental implications of sustainability policies.
To further analyze the dynamic interactions between green economic practices, trade, and growth, this study employs Impulse Response Functions (IRF) and Forecast Error Variance Decomposition (FEVD). Impulse Response Analysis is a fundamental econometric tool that assesses how shocks to one variable propagate throughout the system over time. This study utilizes the Generalized Impulse Response Analysis (GIRA) methodology, which does not impose restrictive variable ordering assumptions, allowing for a more flexible and realistic evaluation of how policy interventions influence economic and environmental outcomes [75]. FEVD complements IRF by quantifying the contribution of each variable to the total forecast variance, providing deeper insights into the driving forces behind economic and environmental fluctuations [76,77,78,79]. These methodologies are particularly relevant for understanding how European Green Deal policies, such as carbon taxation and renewable energy subsidies, influence macroeconomic indicators and trade dynamics.
The model evaluation process is conducted through forecast accuracy assessments using standard error metrics such as the Root Mean Square Error (RMSE) and the Mean Absolute Error (MAE). These measures are particularly useful for evaluating the predictive performance of both traditional VAR and BVAR models, providing quantitative insights into the reliability of the model’s forecasts [75]. RMSE measures the standard deviation of prediction errors, capturing the extent to which predicted values deviate from actual observations, while MAE quantifies the absolute differences between forecasted and observed values. By employing these accuracy measures, the study ensures the robustness of the BVAR model in predicting the economic and environmental outcomes of sustainability policies.
Overall, the Bayesian Vector Autoregression model, particularly when enhanced with Minnesota prior, emerges as a powerful and computationally efficient tool for evaluating the complex interdependencies between environmental sustainability and economic performance. By integrating prior knowledge, addressing overfitting concerns, and employing modern impulse response and variance decomposition techniques, BVAR facilitates a more precise and policy-relevant examination of economic and environmental implications. The study’s methodological contributions extend beyond the EU, offering a transferable approach for analyzing sustainability transitions in less developed economies, where data constraints and economic vulnerabilities necessitate robust forecasting techniques. These insights pave the way for more informed policy decisions, guiding global efforts toward a sustainable and resilient economic future. The overall methodology is depicted in Figure 1.
The results of the methodological implementation are presented in Section 4, which is organized into sub-sections dedicated to each of the three countries under study—Morocco, Egypt, and Oman. Each sub-section presents the country-specific findings along with corresponding policy implications, offering a contextualized interpretation of the result.

4. Results and Discussion (RD)
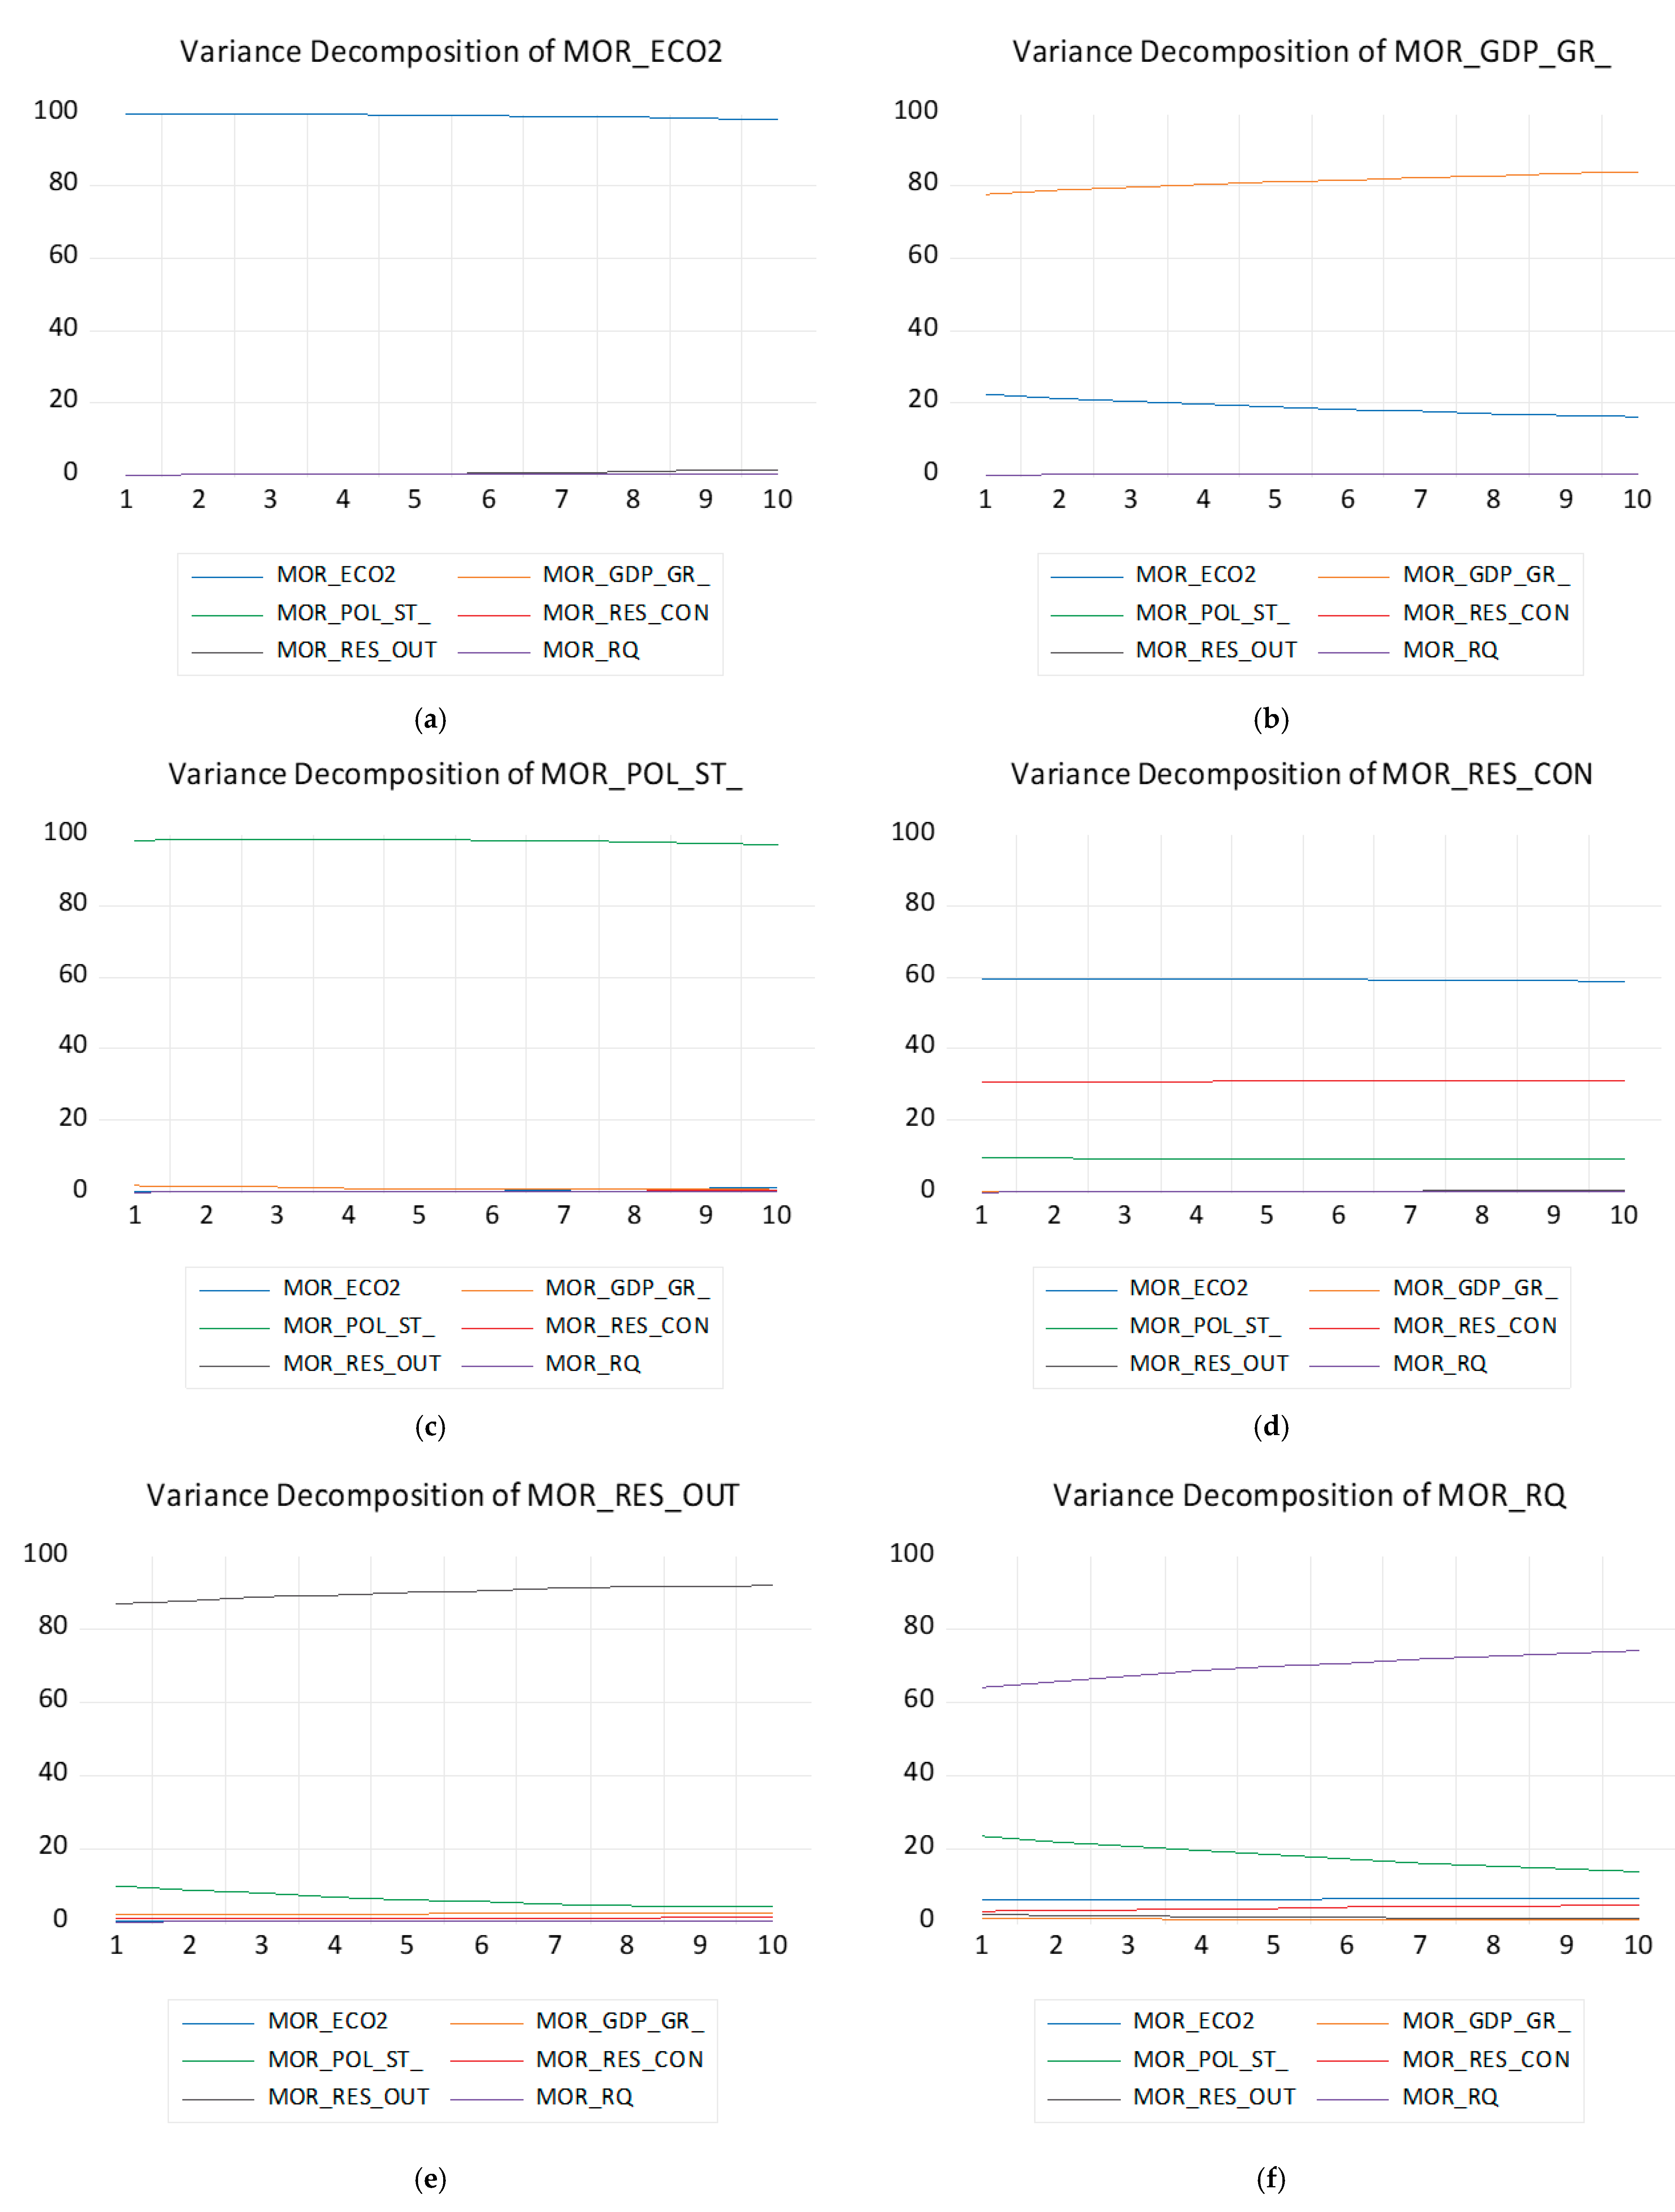
4.1. RD—Morocco

Break point Unit root tests were implemented to all the variables of the model, the results of which are provided in Table 4.
Based on the above findings, all employed variables are either I(1) or I(0), making it suitable to implement a Bayesian VAR model. Before presenting the specific results, it is essential to first examine the structural breaks and the socio-economic phenomena that may have contributed to these shifts. This contextual analysis will provide a clearer understanding of the underlying dynamics influencing the variables in our model.
The structural breaks identified in Morocco’s carbon emissions (2018), economic growth (2020), political stability (2013), renewable energy consumption (2016), and renewable energy output (2013) correspond to significant socio-economic and policy developments that reflect the country’s efforts in environmental policy, economic resilience, political reforms, and renewable energy initiatives. Morocco’s structural break in carbon emissions in 2018 reflects a critical turning point driven by a combination of policy shifts, economic transformations, and international commitments to sustainability. This break aligns with the broader strategic efforts Morocco has undertaken to reduce its carbon footprint and transition towards a low-carbon economy. One of the primary drivers of this shift is the Moroccan National Energy Strategy, launched in 2009, which set ambitious targets for renewable energy adoption, aiming for 52% of installed electricity capacity from renewable sources by 2030 [80]. This strategy included substantial investments in large-scale solar, wind, and hydropower projects, such as the Noor Ouarzazate Solar Complex, the world’s largest concentrated solar power plant, which became operational in phases from 2016 onwards [81]. These investments likely began to significantly reduce carbon intensity by 2018 as clean energy started to displace fossil fuel-based generation [82].
Additionally, Morocco’s commitment to the Paris Agreement, which it ratified in 2016, set aggressive national emissions reduction targets, reinforcing its role as a regional leader in climate action [83]. The agreement required Morocco to reduce its greenhouse gas emissions by 45% by 2030, contingent on international support, placing significant pressure on the country to accelerate its clean energy transition [84]. This period also saw enhanced regulatory frameworks, including the Energy Efficiency Law and the National Sustainable Development Strategy, which aimed to reduce carbon emissions across industrial, transportation, and residential sectors [85].
Economic diversification has also played a critical role in this structural shift. Morocco has rapidly developed its manufacturing base, particularly in automotive and aerospace industries, positioning itself as a key exporter to European and global markets [86]. While this industrial growth has increased overall energy demand, the parallel expansion of renewable energy capacity has likely offset a substantial portion of the potential emissions, reflecting a more balanced approach to industrialization [87]. Moreover, the structural break in 2018 coincides with broader institutional reforms aimed at improving climate governance and attracting private sector investment in clean energy. These reforms have strengthened the regulatory environment, creating more favorable conditions for renewable energy projects and enhancing the capacity to monitor and manage emissions [88]. The country’s growing integration into global markets, supported by trade agreements with the European Union and African economies, has also created external pressures to adopt more sustainable production practices, aligning Morocco’s domestic policies with international climate standards [89]. Social and political factors have also contributed to this shift, as rising public awareness of climate change and increasing environmental activism have placed additional pressure on policymakers to prioritize sustainability [90]. Morocco’s efforts to position itself as a regional climate leader have not only driven domestic policy reforms but have also enhanced its diplomatic leverage in international climate negotiations [91,92]. This period coincided with Morocco’s large-scale investments in renewable energy infrastructure and energy efficiency programs, which contributed to changes in emissions patterns. The 2020 structural break in economic growth aligns with the global economic downturn caused by the COVID-19 pandemic. Morocco, like many countries, experienced economic contractions due to disruptions in trade, tourism, and domestic activities. Prior to the pandemic, Morocco had made efforts to decouple economic growth from energy consumption, achieving an overall 9% reduction in energy intensity, indicating progress in energy efficiency that is crucial for long-term sustainable development [93].
The 2013 structural break in political stability is linked to the constitutional reforms initiated in 2011 in response to regional political movements. These reforms aimed to enhance political inclusivity and stability, leading to a period of relative political calm that facilitated the implementation of long-term economic and environmental policies, including renewable energy development and emission reduction initiatives [94]. The 2016 structural break in renewable energy consumption reflects Morocco’s extensive investments in renewable energy infrastructure as part of its national energy strategy. The country set ambitious targets to generate 52% of its electricity from renewable sources by 2030, leveraging its potential in hydro, solar, wind, and agricultural biomass energy [95]. This shift indicates a strategic transition towards sustainable energy consumption patterns and a reduction in reliance on fossil fuels. Similarly, the 2013 structural break in renewable energy output marks the beginning of substantial renewable energy projects, including the Noor Ouarzazate Solar Complex, which significantly contributed to Morocco’s increased renewable energy capacity. This period represents Morocco’s commitment to expanding renewable energy production, aligning with its broader environmental goals of carbon emissions reduction and sustainable economic growth [96].
The structural breaks observed in Morocco’s environmental and economic indicators reflect a proactive approach to integrating sustainability with economic and political strategies. The country’s commitment to renewable energy, political stability, and emission reduction policies has positioned it as a leader in sustainable development within the region. The identified breaks provide insights into the effectiveness of Morocco’s policy measures, emphasizing the importance of sustained investment in clean energy, economic diversification, and political stability to ensure long-term resilience and sustainability.
The next step of the analysis involves the BVAR estimation model. The BVAR estimation model results are provided in the next Table 5.
The Bayesian Vector Autoregression (BVAR) model for Morocco provides insights into the interdependencies among macroeconomic, political, and environmental variables. The model, estimated from 2004 to 2022 using a Minnesota prior, suggests that carbon emissions (MOR_ECO2) exhibit strong persistence, with a coefficient of 0.992, indicating that past emissions largely determine current levels. This highlights the structural challenges in reducing carbon intensity despite Morocco’s renewable energy investments. Economic growth (MOR_GDP_GR) is also highly autoregressive, with a coefficient of 0.915, reinforcing the idea that past economic performance strongly influences future growth. However, the impact of emissions on GDP growth appears negative (−1.797), though the large standard error suggests uncertainty. This could indicate a shift towards a lower-carbon economy or structural constraints. Political stability (MOR_POL_ST) is also persistent, with a coefficient of 0.959, reflecting a relatively stable political environment over time. However, its negative impact on renewable energy output (−1.762) suggests that political uncertainty or bureaucratic hurdles may slow renewable energy deployment, aligning with reports of delays in some renewable initiatives. Renewable energy consumption (MOR_RES_CON) has a strong autoregressive component (0.992), implying that once consumption patterns are established, they tend to persist. However, its limited impact on GDP growth (−0.0194) suggests that renewable energy has not yet become a major driver of economic expansion. Similarly, renewable energy output (MOR_RES_OUT) exhibits strong persistence (0.972), but its weak effect on emissions (−0.081) indicates that despite Morocco’s efforts in expanding renewable capacity, fossil fuel reliance remains a significant factor. Regulatory quality (MOR_RQ) also shows high persistence (0.964), meaning that institutional structures remain stable over time. The weak influence of renewables on regulatory quality (−0.134) suggests that governance reforms are not yet strongly driven by energy policy. The policy implications of these findings suggest that decarbonization efforts must be sustained over the long term, requiring carbon pricing, stricter regulations, and energy efficiency programs. The weak link between renewable energy and economic growth suggests the need for better industrial integration with clean energy sources, creating incentives for businesses to transition toward sustainable energy use. Political stability’s negative impact on renewable energy output highlights the importance of clear, long-term policy commitments to attract investment. Additionally, while regulatory quality is stable, its limited impact on renewables suggests that institutional reforms need to be accelerated to facilitate Morocco’s energy transition. Given the strong persistence observed across most variables, policies must be maintained consistently over long periods to be effective. The weak relationship between renewable energy and emissions reduction suggests that additional measures such as phasing out fossil fuel subsidies, improving grid infrastructure, and enhancing incentives for green industries are necessary to achieve Morocco’s sustainability goals.
The analysis of accumulated impulse response functions for Morocco provides valuable insights into the interactions between key economic, political, and environmental variables. The results indicate that regulatory quality, economic growth, political stability, renewable energy output, and CO2 emissions exhibit varying degrees of responsiveness to shocks, revealing important policy considerations, Figure 2.
The accumulated response of regulatory quality (MOR_RQ) suggests that improvements in governance frameworks and institutional reforms can have long-term benefits. However, the impact of external shocks on regulatory quality appears limited, suggesting that domestic policy measures will be the primary drivers of governance improvements. Given Morocco’s recent efforts to enhance business regulations and attract foreign investment, further policy reforms should focus on reducing bureaucratic inefficiencies, increasing judicial independence, and strengthening anti-corruption measures. Enhancing regulatory quality is crucial for fostering a stable investment climate and supporting long-term economic growth.
Economic growth (MOR_GDP_GR) exhibits a strong positive response to its own shocks, while other variables such as political stability and regulatory quality have a more limited influence over time. This indicates that Morocco’s growth trajectory is primarily self-sustaining but can benefit from structural reforms. To ensure sustainable and inclusive growth, policies should focus on economic diversification, industrialization, and technological innovation. Given Morocco’s strategic geographic position as a gateway between Europe and Africa, further integration into global supply chains and expansion of trade partnerships will be key to maintaining economic momentum.
Political stability (MOR_POL_ST) shows a positive accumulated response to shocks, with increasing influence from regulatory quality and economic conditions. This highlights the importance of economic stability in maintaining political cohesion. Morocco has experienced relative political stability compared to other North African nations, largely due to its gradual reform approach. However, ongoing challenges such as youth unemployment, social inequality, and regional disparities require targeted policy interventions. Expanding social safety nets, improving public service delivery, and fostering inclusive political participation will be essential for sustaining long-term stability.
Renewable energy output (MOR_RES_OUT) responds positively to its own shocks, indicating the country’s progress in developing renewable energy infrastructure. However, regulatory quality and economic growth also have an increasing influence over time, suggesting that effective policy frameworks and economic incentives are necessary to further accelerate Morocco’s renewable energy transition. The country has positioned itself as a leader in renewable energy, with major projects such as the Noor Ouarzazate Solar Complex. To build on this success, policymakers should focus on enhancing grid integration, reducing reliance on fossil fuel subsidies, and fostering innovation in energy storage and distribution.
CO2 emissions (MOR_ECO2) show a growing influence from renewable energy use and regulatory quality, underscoring the importance of environmental policies in reducing emissions. While Morocco has made strides in expanding renewable energy, its overall emissions remain influenced by industrial activity and transportation. Strengthening environmental regulations, promoting energy efficiency, and investing in sustainable urban planning will be critical to meeting Morocco’s climate commitments. Policies should also encourage green technology adoption, expand public transportation systems, and integrate sustainability into national development planning.
The interconnected nature of economic, political, and environmental variables in Morocco underscores the need for a comprehensive policy approach. Regulatory reforms, economic diversification, and renewable energy expansion should be pursued simultaneously to ensure sustainable development. Given Morocco’s growing role as a regional economic hub, policies should also emphasize digital transformation, trade liberalization, and infrastructure development to enhance competitiveness. Addressing social challenges such as unemployment, education quality, and income inequality will be essential for maintaining long-term stability and fostering inclusive growth. The government should continue leveraging international partnerships, development financing, and technological advancements to align its policy framework with global best practices, ensuring that Morocco remains on a path of stable and sustainable progress.
The variance decomposition results provide insights into the relative importance of different variables in explaining fluctuations in regulatory quality, renewable energy output and consumption, GDP growth, political stability, and CO2 emissions in Morocco. By examining how the forecast error variance of each variable evolves over time, we can assess the extent to which shocks to one variable influence others, thereby guiding policy interventions, Figure 3.
Morocco’s GDP growth (MOR_GDP_GR_) is largely self-determined, meaning that its fluctuations are mostly explained by past economic trends rather than external influences. However, as time progresses, regulatory quality and CO2 emissions are playing an increasing role in shaping economic performance. The rising impact of regulatory quality highlights the importance of governance and institutional stability in driving sustainable economic growth. Meanwhile, the growing contribution of CO2 emissions suggests a closer linkage between economic expansion and environmental factors, underscoring the need for policies that balance growth with ecological sustainability.
As far as the political stability (MOR_POL_ST_) is concerned, it exhibits a strong degree of self-dependence, meaning that past political conditions significantly shape present and future trends. However, there is a growing impact from GDP growth and CO2 emissions, highlighting a broader economic-political interplay. As Morocco continues to position itself as a leader in sustainable development within the MENA region, the interaction between economic expansion and political stability becomes increasingly critical. The impact of CO2 emissions further suggests that environmental and economic challenges could influence political dynamics, reinforcing the need for integrated policy approaches that address governance, economic development, and environmental sustainability.
The variance decomposition of renewable energy consumption (MOR_RES_CON_) highlights a strong interdependence to CO2 emissions and political stability. This correlation suggests that Morocco’s ambitious renewable energy initiatives are beginning to reshape its environmental landscape while being influenced by broader political and economic stability. The findings confirm that Morocco is actively working toward reducing its dependence on fossil fuels, yet the persistence of CO2 emissions as a significant factor highlights the challenges in fully transitioning away from conventional energy sources. This underscores the importance of continued policy support and investment in clean energy infrastructure.
Renewable energy output in Morocco (MOR_RES_OUT_) demonstrates a strong self-reinforcing trend, meaning that past levels of renewable energy production significantly influence future growth. However, the influence of political stability and GDP growth on renewable energy output is rising over time. This suggests that Morocco’s ability to expand its renewable energy sector is increasingly dependent on economic performance and institutional stability. Ensuring long-term investment in clean energy infrastructure will require a stable political climate and a supportive economic environment, reinforcing the need for continued government incentives and private sector engagement in the renewable energy sector.
The decomposition of the regulatory quality (MOR_RQ) is self-determined by its historical values, indicating that governance structures and institutional frameworks are relatively stable over time. However, the increasing influence of political stability and renewable energy consumption highlights the role of institutional reforms and clean energy policies in shaping governance. This trend further reinforces Morocco’s leadership in integrating renewable energy within its broader economic development strategy. As regulatory frameworks continue to evolve, ensuring their alignment with Morocco’s sustainability goals will be essential for strengthening environmental governance and promoting long-term economic stability.
Based on the variance decomposition analysis, the dynamics of CO2 emissions and GDP growth in Morocco reveal critical insights that align with, and in some cases extend, findings in existing literature on the green transition and sustainable development in emerging economies. CO2 emissions (MOR_ECO2) are shown to be largely self-determined, reflecting a strong path dependence, which is consistent with literature emphasizing the inertia of environmental degradation in fossil-fuel-reliant economies [25]. However, the gradual increase in explanatory power from renewable energy consumption and regulatory quality suggests Morocco’s ongoing environmental policies are beginning to produce tangible, albeit modest, impacts on emissions. This supports conclusions from scholars like Omri and Nguyen [97], who argue that the effectiveness of renewable energy policies in developing economies tends to manifest gradually due to structural constraints and investment lags. In terms of economic growth (MOR_GDP_GR_), the dominance of self-determination is in line with classical growth theory, where endogenous factors like capital accumulation and productivity play primary roles. Nevertheless, the increasing influence of regulatory quality and CO2 emissions suggests that Morocco’s economic trajectory is becoming increasingly entwined with environmental and institutional variables. This finding parallels arguments from Acemoglu et al. [98] and Dinda [24] who highlight the need for integrated institutional and environmental frameworks to sustain long-term growth in the face of ecological limits. The interplay between political stability (MOR_POL_ST_), economic growth, and emissions further underlines the complex governance-environment-development nexus, reinforcing insights from the political economy literature on sustainability transitions [99,100]. Moreover, the increasing interdependence between renewable energy output (MOR_RES_OUT_) and macroeconomic-political variables such as GDP and stability echoes the position of IRENA [101], which emphasizes that a supportive institutional context is critical for the scalability of clean energy sectors in the Global South. Finally, the self-determined nature of regulatory quality, alongside its growing dependence on political and energy variables, points to a gradual evolution of Morocco’s governance ecosystem in line with broader sustainability goals. This is reflective of theoretical models that view governance not as a static construct but as a dynamic outcome of interactions between policy, institutional performance, and socio-environmental pressures [102,103]. Collectively, the results suggest that while Morocco’s transition remains nascent, the foundations are being laid for a more synergistic relationship between environmental sustainability and economic resilience. This supports a growing body of empirical work calling for comprehensive, multisectoral policy strategies that link green investment, institutional reform, and governance innovation.

Policy Implications for Morocco
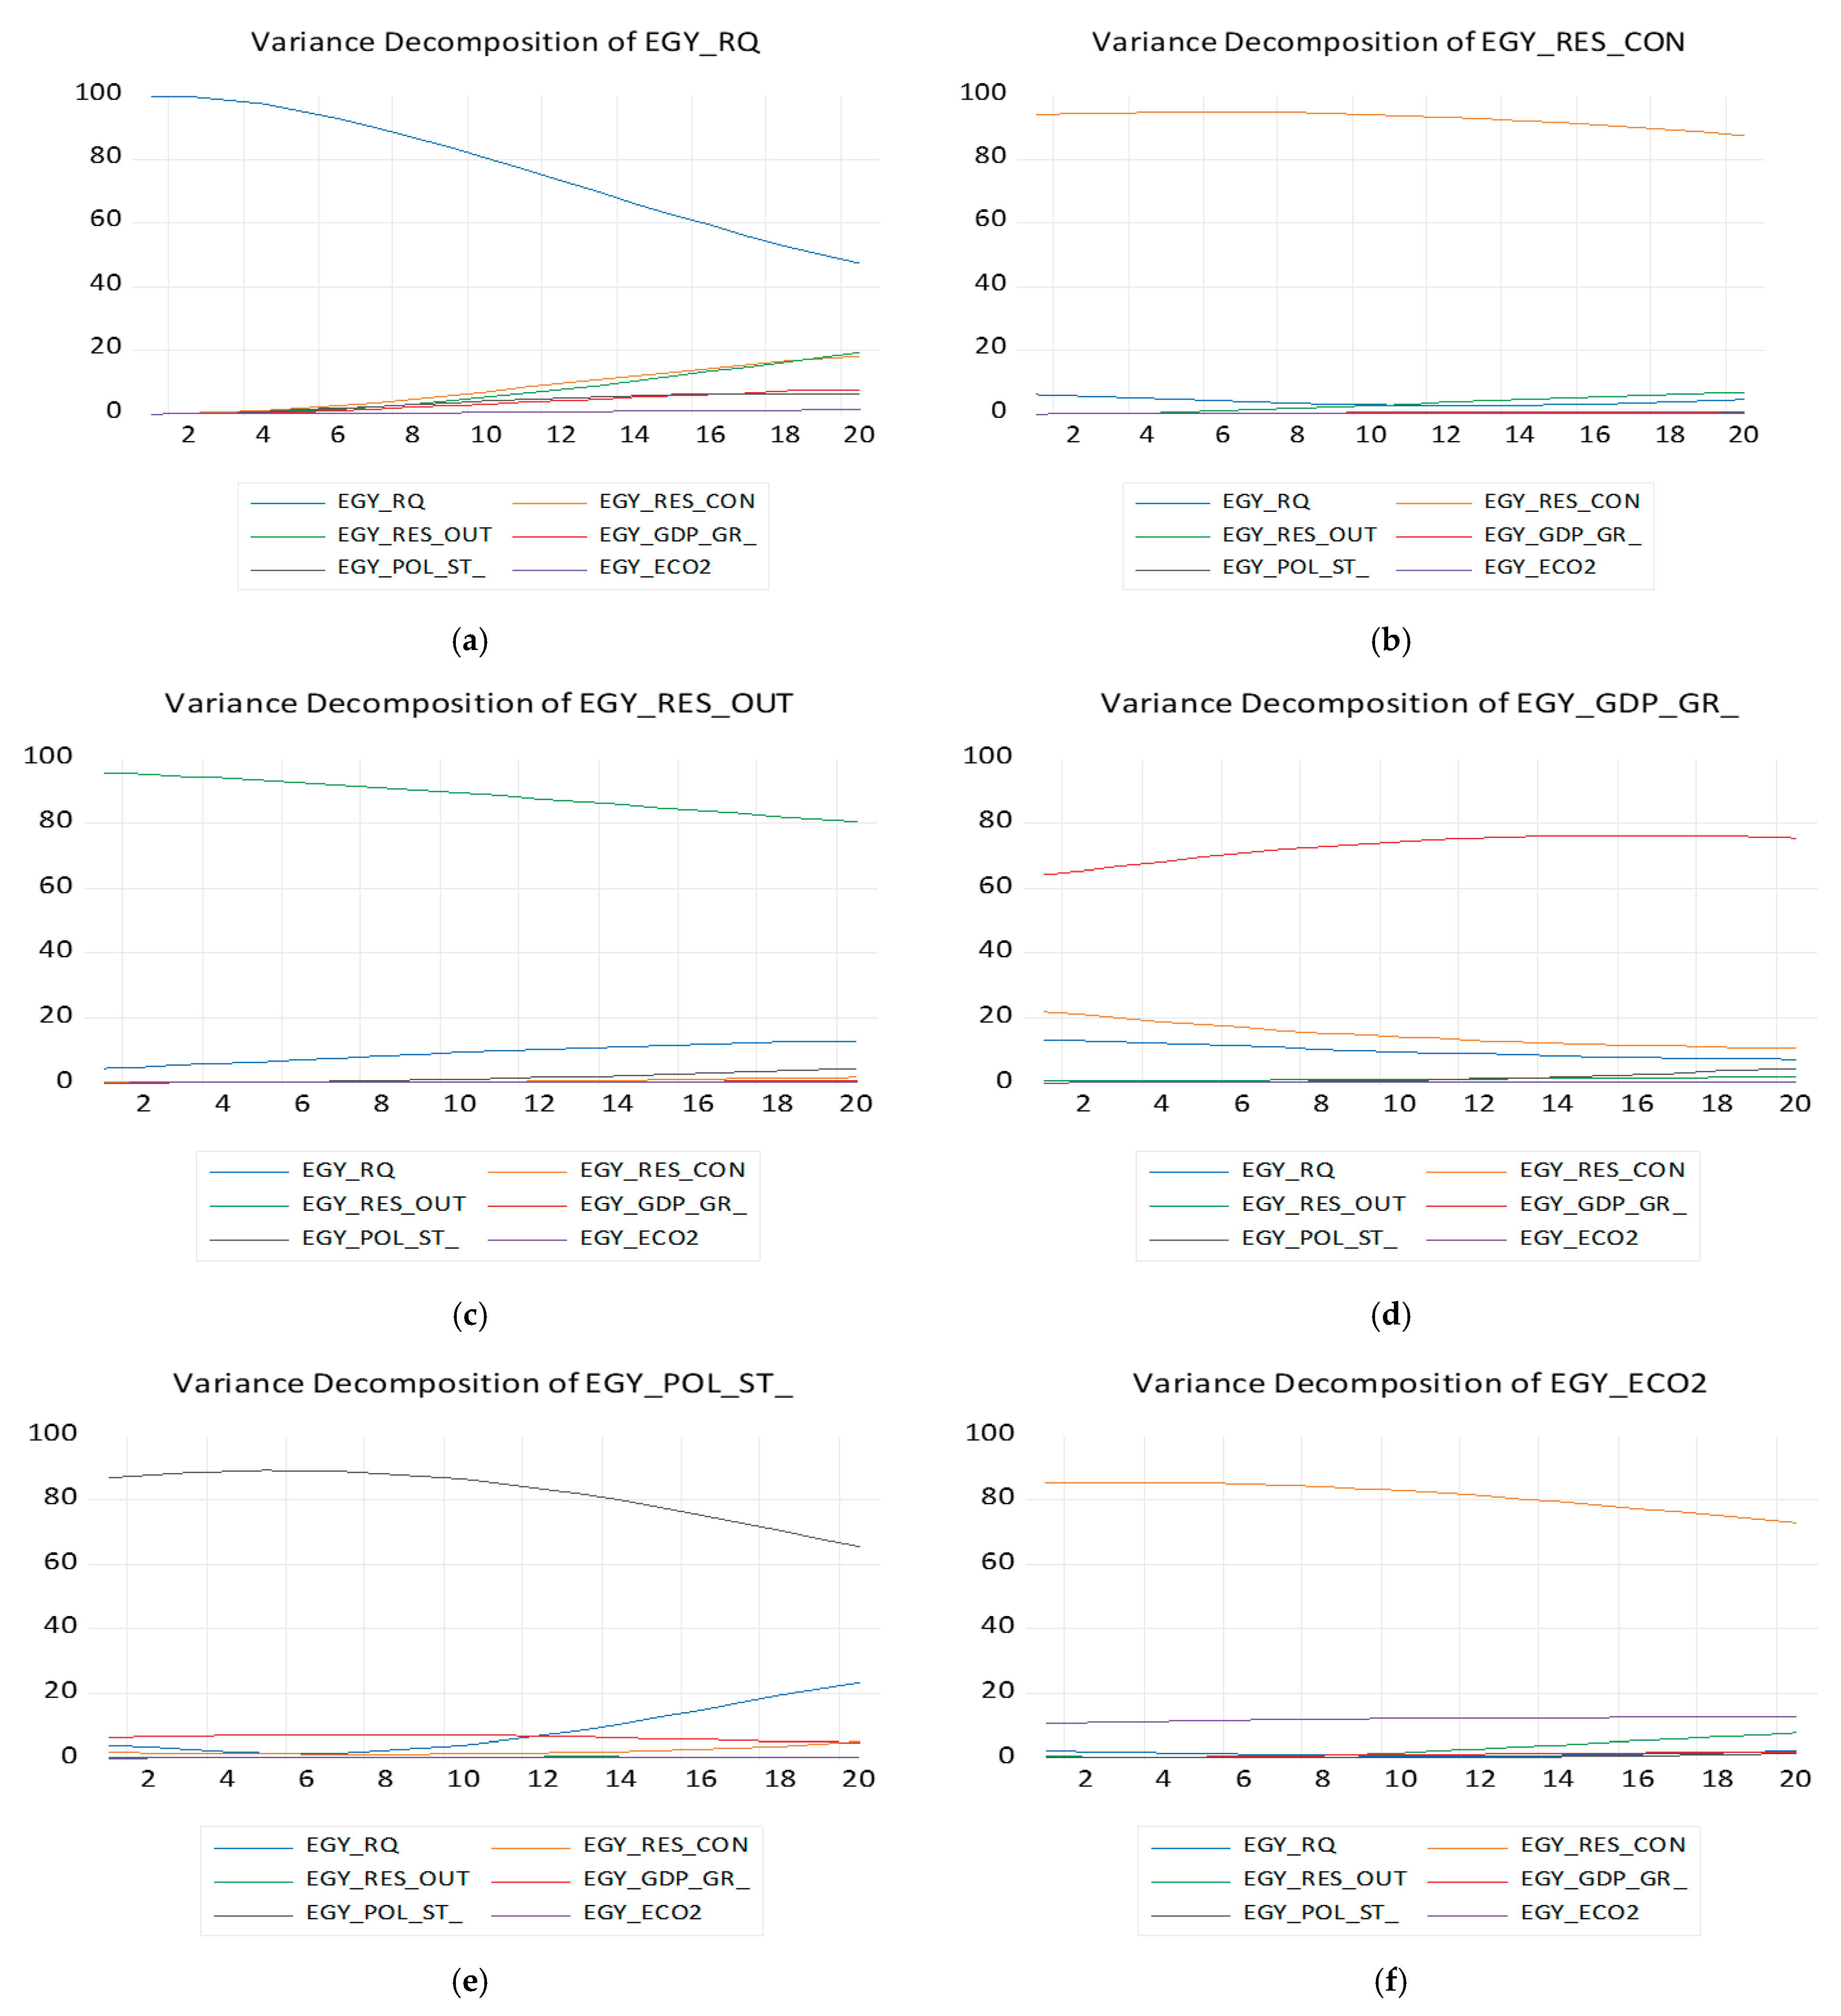
The Bayesian Vector Autoregression (BVAR) findings for Morocco provide valuable insights into the complex interactions between economic growth, political stability, regulatory quality, and carbon emissions. The high persistence of carbon emissions, with a coefficient of 0.992, underscores the structural challenges Morocco faces in reducing its carbon footprint despite significant investments in renewable energy. This strong path dependence indicates that past emissions continue to exert a dominant influence on current levels, suggesting that Morocco’s energy system remains heavily reliant on fossil fuels. This persistence reinforces the need for more aggressive decarbonization policies, including the gradual phase-out of fossil fuel subsidies, the introduction of carbon pricing mechanisms, and the adoption of stricter emissions regulations. Additionally, improving energy efficiency across industrial and residential sectors can help reduce overall carbon intensity, aligning Morocco’s energy profile with its ambitious climate targets.
Economic growth in Morocco also demonstrates strong path dependence, with a coefficient of 0.915, indicating that past economic performance significantly shapes future growth trajectories. However, the negative impact of carbon emissions on GDP growth (−1.797) suggests that environmental degradation could be constraining economic expansion. This finding highlights the importance of transitioning to a more sustainable growth model that reduces the economy’s reliance on carbon-intensive industries. To achieve this, Morocco should focus on economic diversification, investing in sectors like renewable energy, digital technologies, green manufacturing, and sustainable agriculture. Such diversification can reduce the economy’s vulnerability to external shocks and improve overall resilience, supporting long-term economic stability.
The findings also reveal a strong degree of persistence in political stability, with a coefficient of 0.959, reflecting Morocco’s relatively stable political environment. However, the negative impact of political stability on renewable energy output (−1.762) suggests that bureaucratic hurdles, policy uncertainty, or administrative delays may be slowing the deployment of renewable energy projects. To address this, policymakers should streamline regulatory frameworks, reduce administrative barriers, and improve interagency coordination. Establishing clear, long-term energy policies can reduce investor uncertainty and attract greater private sector participation in the renewable energy market. Morocco’s success in this area will depend on its ability to create a stable, predictable policy environment that supports innovation and long-term investment in clean energy infrastructure.
Renewable energy consumption (0.992) and output (0.972) also exhibit high persistence, indicating that once established, these energy patterns tend to persist over time. However, the weak impact of renewable energy on emissions reduction (−0.081) suggests that current projects may not be fully displacing fossil fuel use, limiting their overall environmental impact. This highlights the need for integrated energy policies that go beyond capacity expansion to include improvements in grid infrastructure, energy storage technologies, and demand-side management. Morocco should also focus on enhancing the efficiency of its power transmission systems and integrating smart grid technologies to optimize renewable energy use. Expanding interconnections with neighboring countries can further enhance energy security and create opportunities for renewable energy exports, supporting Morocco’s position as a regional energy leader.
Regulatory quality in Morocco, with a persistence coefficient of 0.964, remains relatively stable but appears to have limited influence on renewable energy deployment (−0.134). This suggests that while institutional frameworks are well-established, they may not yet fully support the rapid scaling of clean energy technologies. To address this gap, Morocco should enhance regulatory oversight, strengthen enforcement mechanisms, and integrate sustainability criteria into broader economic planning. This includes reducing bureaucratic inefficiencies, promoting transparency, and fostering public–private partnerships to drive innovation in clean technologies. Effective regulation is critical for creating a favorable investment climate, reducing policy risk, and ensuring long-term economic and environmental sustainability.
Overall, the findings indicate that Morocco’s energy transition is at a critical juncture, requiring comprehensive policy interventions to break the cycle of carbon dependency and promote sustainable growth. This includes aligning industrial policies with climate goals, enhancing institutional capacity, and leveraging international partnerships to access finance, technology, and expertise. Given the strong persistence observed across economic, political, and environmental variables, these efforts must be sustained over the long term to ensure meaningful progress towards Morocco’s sustainability targets.

4.2. RD—Egypt

Break point unit root tests were implemented to all the variables of the model the results of which are provided in Table 6.
For Egypt, the identified structural breaks in key economic, political, and environmental indicators reflect major historical and policy-driven shifts. These breaks provide insights into the country’s economic trajectory, political stability, and environmental policy evolution.
The 2019 break in carbon emissions corresponds likely to increased environmental awareness and policy changes. Egypt has been gradually adopting renewable energy policies, including the expansion of solar and wind power projects. The Benban Solar Park, one of the largest in the world, was fully operational by 2019, contributing to a reduction in emissions. Additionally, government initiatives to modernize transport, including metro expansion and electric vehicle incentives, may have played a role. However, economic slowdowns and the impact of the COVID-19 pandemic in early 2020 may have also led to reduced industrial emissions.
The 2010 break in economic growth aligns with the onset of the Arab Spring in 2011. Leading up to this period, Egypt had been experiencing strong economic growth driven by tourism, foreign direct investment (FDI), and economic liberalization policies. However, the revolution and subsequent political instability led to a sharp economic decline. Foreign investors withdrew, tourism collapsed, and economic activity slowed due to protests and disruptions. The post-revolution transition period brought economic uncertainty, impacting growth in the following years.
The 2009 break in political stability reflects the mounting tensions that led to the 2011 revolution. Rising youth unemployment, economic disparities, and growing dissatisfaction with governance under President Hosni Mubarak contributed to increasing instability. The global financial crisis of 2008 may have exacerbated social grievances, as economic hardships intensified. Additionally, media and digital platforms played a growing role in mobilizing public sentiment, setting the stage for the mass protests that erupted in early 2011.
The 2018 break in renewable energy use marks a turning point in Egypt’s commitment to clean energy expansion. With the country aiming to generate 42% of its electricity from renewables by 2035, 2018 saw the acceleration of large-scale solar and wind projects, including major foreign investments. The government’s push for private sector involvement in renewable energy production, combined with financial incentives and policy reforms, significantly boosted the sector. The decreasing cost of renewables and Egypt’s strategic position as an energy hub further contributed to this shift.
The 2001 break in regulatory quality likely reflects major economic and governance reforms initiated in the early 2000s. During this period, Egypt pursued market-oriented reforms, privatization, and trade liberalization, aimed at attracting foreign investment. However, concerns over corruption, bureaucratic inefficiencies, and political interference in economic decisions persisted. The early 2000s also saw shifts in global regulatory frameworks, particularly post-9/11, which influenced financial and security-related regulations in Egypt.
These structural breaks underscore Egypt’s dynamic economic and political landscape, shaped by both domestic and global factors. Policy implications include the need for sustained investment in renewable energy, economic diversification to reduce vulnerability to political shocks, and continued regulatory improvements to enhance governance and investor confidence.
The BVAR estimation model is provided in Table 7.
The Bayesian VAR (BVAR) results indicate strong persistence in key variables, suggesting that past values significantly influence their current states. The high coefficient for EGY_RQ(−1) (0.989) and EGY_RES_CON(−1) (0.988) confirms that resource quality and energy consumption exhibit strong path dependence, meaning that changes in policy or external shocks take time to reflect in these variables. Similarly, economic growth (EGY_GDP_GR_) is highly persistent (0.97), yet the low R2 value (0.197) suggests that its fluctuations are influenced by external factors beyond the scope of this model, such as international trade, technological advancements, or global economic conditions. The negative relationship between GDP growth and CO2 emissions (−0.48) suggests that economic expansion may contribute to lower emissions, potentially due to improved energy efficiency, technological advancements, or shifts towards cleaner energy sources. However, political stability (EGY_POL_ST_) shows almost no direct impact on emissions (−0.000947), reinforcing the notion that while stable governance can facilitate long-term policy implementation, it does not automatically lead to lower environmental impact. The high persistence of energy consumption (0.988) and CO2 emissions (0.994) further emphasizes the need for long-term policies rather than short-term interventions. The negative coefficient of energy consumption on CO2 emissions (−0.129) might indicate a gradual transition towards cleaner energy sources, reducing emissions despite ongoing resource use. Despite the strong explanatory power of the model for most variables (R2 > 0.7), the low R2 for GDP suggests the need for additional explanatory variables, such as international energy prices, investment in renewables, and technological innovation, to improve predictive accuracy. These findings highlight that reducing emissions requires targeted policies, investment in clean energy, and long-term strategic planning rather than relying solely on economic growth or political stability. The model could be refined by incorporating external shocks, structural breaks, or alternative priors in the Bayesian framework to enhance its robustness and policy relevance.
The next step in the analysis involved impulse response analysis the results of which are illustrated in Figure 4.
The analysis of the accumulated response functions derived from the Bayesian VAR model provides crucial insights into the dynamics between regulatory quality, renewable energy consumption, renewable energy output, GDP growth, political stability, and CO2 emissions in Egypt.
The response of regulatory quality to shocks exhibits a persistent positive trend, indicating that improvements in governance and institutional frameworks tend to be sustained over time. However, its influence on other variables appears limited, with only minor fluctuations observed in GDP growth, political stability, and CO2 emissions, suggesting that further structural reforms may be required to enhance its broader economic and environmental impact.
Renewable energy consumption responds strongly and positively to shocks, which implies that policies promoting sustainable energy use have lasting effects. However, the response of GDP growth and CO2 emissions to renewable energy consumption remains minimal, pointing to the need for additional policy measures that can better integrate renewable energy into economic and environmental strategies.
Similarly, renewable energy output shows a steep upward trajectory following a shock, emphasizing that investments in renewable energy infrastructure yield long-term benefits. This reinforces the argument that sustained policy support and financial incentives are essential for fostering a transition to a greener energy sector.
GDP growth exhibits a strong positive response to shocks, indicating resilience in Egypt’s economic framework. However, the weak link between GDP growth and renewable energy variables suggests that the economic benefits of renewable energy investments may not be immediate or substantial without complementary measures such as industrial integration and technological advancements.
The response of political stability to shocks demonstrates a generally increasing pattern, though its effect on other macroeconomic and environmental variables remains limited. While this suggests that external shocks can influence political stability, the spillover effects on economic and environmental factors may be constrained by institutional rigidities or socio-political dynamics.
The response of CO2 emissions to shocks is relatively small but positive, indicating that emissions are gradually influenced by economic and regulatory factors. However, the weak impact of renewable energy use on emissions reduction highlights the necessity for more aggressive decarbonization policies, including carbon pricing, emissions regulations, and targeted incentives for green technologies.
These findings underline the importance of designing a comprehensive policy framework that effectively links renewable energy expansion with economic growth and environmental sustainability. Strengthening regulatory quality, fostering a stable political environment, and implementing structural reforms that align energy policies with economic objectives will be essential for maximizing long-term benefits.
The findings of this analysis have significant policy implications for Egypt, particularly in the domains of economic growth, environmental sustainability, and governance. Given the observed dynamics between regulatory quality, renewable energy consumption, renewable energy output, GDP growth, political stability, and CO2 emissions, a multi-pronged policy approach is necessary to ensure sustainable development while mitigating environmental degradation.
A key takeaway is the persistent positive trend in regulatory quality, suggesting that governance reforms should continue to be a priority. Strengthening institutional frameworks, ensuring transparency, and enhancing regulatory enforcement will further support economic stability and attract foreign investment. However, the limited spillover effects of regulatory quality on other variables indicate that more targeted interventions are needed to translate institutional improvements into tangible economic and environmental benefits.
Renewable energy policies should be reinforced through increased investment in infrastructure, technology transfer, and financial incentives. While renewable energy consumption shows a strong and sustained response to shocks, its weak impact on GDP growth and CO2 emissions highlights the need for better integration with industrial and economic policies. The government should focus on incentivizing businesses to transition towards renewable energy sources, supporting innovation in green technologies, and strengthening the linkages between the energy sector and other productive sectors of the economy. Expanding the share of renewables in the national energy mix and ensuring grid stability through smart energy solutions will be crucial for long-term sustainability.
Economic growth in Egypt exhibits resilience, but its weak correlation with renewable energy factors suggests that the transition to a low-carbon economy is not yet fully aligned with broader economic objectives. To address this, policymakers should adopt green growth strategies that foster economic diversification while reducing environmental impact. Incentivizing green industries, developing sustainable transportation systems, and implementing fiscal measures such as green bonds or carbon taxes can ensure that economic expansion does not come at the cost of environmental degradation.
The political stability variable shows an increasing response to shocks, reinforcing the need for maintaining a stable socio-political environment to support long-term economic and environmental reforms. Social policies that address inequality, unemployment, and access to basic services should be prioritized to enhance social cohesion and political stability. A stable political landscape is essential for attracting investments in renewable energy and ensuring policy continuity.
CO2 emissions exhibit a weak but positive response, suggesting that current policies have not been sufficient in curbing environmental degradation. Strengthening emissions regulations, enforcing environmental compliance, and promoting carbon pricing mechanisms will be necessary to accelerate emissions reductions. The government should also consider integrating sustainability criteria into public procurement processes and promoting eco-friendly urban planning initiatives to limit environmental damage.
Overall, Egypt’s policy approach should be comprehensive and integrative, balancing economic, environmental, and governance objectives. By reinforcing regulatory frameworks, investing in renewable energy, aligning economic growth with sustainability goals, ensuring political stability, and implementing effective emissions reduction strategies, Egypt can achieve a more resilient and sustainable development pathway.
Variance decomposition analysis regarding each individual variable is provided in Figure 5.
The variance decomposition of regulatory quality (EGY_RQ) indicates that its own shocks dominate in the short term, but over time, the influence of other variables, particularly GDP growth (EGY_GDP_GR) and political stability (EGY_POL_ST), increases. This suggests that while regulatory quality is largely self-driven, economic and political conditions play a growing role in shaping its trajectory. Policies aimed at improving regulatory effectiveness should therefore take into account economic growth dynamics and political stability considerations. Given Egypt’s bureaucratic complexity and the influence of state-owned enterprises in key industries, regulatory reforms should focus on reducing administrative inefficiencies, improving transparency, and fostering a more competitive business environment.
The variance decomposition of renewable energy consumption (EGY_RES_CON) shows that its fluctuations are predominantly self-explanatory, with a limited but increasing contribution from GDP growth and regulatory quality. This implies that economic expansion and governance improvements can gradually impact renewable energy adoption. Egypt has taken significant steps in expanding its renewable energy sector, particularly in solar and wind power, with major projects like the Benban Solar Park. However, structural challenges remain, including grid integration issues, financial constraints, and the dominance of subsidized fossil fuels, which can slow down the transition to a more sustainable energy mix. Policymakers should therefore ensure that economic growth strategies are aligned with renewable energy objectives, promoting investment in clean energy infrastructure and regulatory incentives for businesses to transition to sustainable energy sources.
For renewable energy output (EGY_RES_OUT), the variance decomposition suggests that it remains largely self-determined over time, with minimal influence from other variables. This indicates the need for stronger linkages between renewable energy output and broader economic and political factors. Policies should focus on enhancing grid integration, improving the efficiency of renewable energy markets, and creating demand-side incentives to ensure that increased renewable energy production translates into tangible economic and environmental benefits. Egypt’s geographic location and abundant solar and wind resources provide a unique opportunity to become a regional energy hub, but this requires stronger institutional support, improved private sector participation, and better cross-border energy trade agreements.
The decomposition of GDP growth (EGY_GDP_GR) reveals that while its variance is initially driven by its own shocks, the contribution of regulatory quality and political stability grows over time. This underscores the importance of governance reforms and institutional stability in sustaining long-term economic expansion. Egypt’s economy has experienced significant fluctuations due to external shocks, such as the 2011 revolution, currency devaluations, and global crises affecting tourism and trade. Strengthening governance, reducing political uncertainty, and ensuring macroeconomic stability will be crucial for attracting long-term investments. Additionally, targeted policies to boost industrial productivity, support small and medium enterprises, and integrate more sectors into the formal economy will be essential for sustained growth.
The variance decomposition of political stability (EGY_POL_ST) highlights a declining self-dependence, with an increasing influence from regulatory quality and GDP growth. This reinforces the idea that economic and governance improvements are critical for maintaining political stability. Egypt has faced persistent challenges related to governance, social unrest, and political transitions. Social and economic policies that address income disparities, unemployment, and access to essential services can help mitigate political volatility and create a more stable environment for investment and development. Given the country’s high youth unemployment rate and rapid population growth, labor market reforms and inclusive economic policies will play a key role in fostering long-term stability.
Finally, CO2 emissions (EGY_ECO2) exhibit a high degree of self-determination, with limited contributions from other variables. However, the small but growing influence of renewable energy consumption and regulatory quality suggests that strengthening environmental regulations and expanding clean energy adoption can play a role in mitigating emissions over time. Egypt has made international commitments to reducing its carbon footprint, particularly under the Paris Agreement, but challenges such as heavy reliance on natural gas and persistent air pollution in urban centers remain significant. Policies should focus on enforcing stricter environmental regulations, promoting carbon pricing mechanisms, and integrating sustainability criteria into industrial and energy planning to accelerate the transition to a low-carbon economy.
Overall, the variance decomposition results highlight the interconnectedness of economic, political, and environmental factors in Egypt. The country’s particularities, including its large informal sector, state-driven economic model, high population growth, and exposure to geopolitical risks, must be taken into account when designing policies. Policymakers should adopt a holistic approach that strengthens regulatory frameworks, aligns economic growth with sustainability objectives, promotes political stability, and enhances the role of renewable energy in reducing emissions. By fostering these synergies, Egypt can achieve a more resilient and sustainable development trajectory.
The policy implications derived from the analysis of variance decomposition and impulse response functions highlight critical areas where Egypt must focus its policy interventions to enhance regulatory quality, economic growth, political stability, renewable energy adoption, and environmental sustainability.
Regulatory quality plays a fundamental role in shaping economic and political stability in Egypt. The findings suggest that while regulatory quality is initially self-determined, over time, economic growth and political stability influence its trajectory. This underscores the need for governance reforms that enhance transparency, reduce bureaucratic inefficiencies, and improve institutional effectiveness. Given Egypt’s history of state intervention in the economy and the large presence of state-owned enterprises, regulatory policies should focus on reducing market distortions, fostering private sector participation, and ensuring a level playing field for businesses. Streamlining administrative procedures and reinforcing anti-corruption measures would improve investor confidence and economic efficiency.
The results indicate that economic growth is significantly influenced by improvements in regulatory quality and political stability. Thus, policies aimed at sustaining long-term growth should prioritize institutional reforms that enhance business confidence, promote investment, and reduce economic volatility. Egypt has experienced major structural shifts in the past decades, with events such as the 2011 revolution, subsequent political transitions, and macroeconomic adjustments impacting growth patterns. Ensuring macroeconomic stability through sound fiscal policies, inflation control, and exchange rate management will be essential for maintaining investor confidence and attracting foreign direct investment. Additionally, growth policies should emphasize diversification beyond traditional sectors such as tourism and hydrocarbons, focusing on industrial development, digital transformation, and high-value manufacturing.
Political stability is found to be increasingly influenced by economic growth and regulatory quality, indicating that sustained development and good governance are essential for maintaining social cohesion and preventing political unrest. Given Egypt’s history of social and political turbulence, policies should focus on addressing economic inequality, unemployment, and social disparities. A critical challenge is the high youth unemployment rate, which poses risks to long-term stability. Investing in education, vocational training, and entrepreneurship programs can help integrate the growing youth population into the formal economy. Social protection policies should also be strengthened to support vulnerable populations and reduce economic grievances that could lead to instability.
Renewable energy consumption and output remain largely self-determined but show growing interdependencies with regulatory quality and economic growth. This suggests that Egypt’s renewable energy transition can be accelerated through stronger governance frameworks and economic incentives. The country has made notable progress in expanding its renewable energy capacity, with projects such as the Benban Solar Park positioning it as a regional leader in solar energy. However, challenges such as grid integration, fossil fuel subsidies, and financing constraints still hinder widespread adoption. Policymakers should focus on reforming energy markets, phasing out inefficient subsidies, and creating incentives for private investment in renewable energy projects. Expanding public–private partnerships and fostering technological innovation in energy storage and distribution can further enhance Egypt’s clean energy transition.
CO2 emissions remain largely self-determined, but renewable energy use and regulatory quality have a growing influence on emissions reduction. This highlights the need for stronger environmental policies that promote sustainable development. Egypt’s energy mix remains heavily reliant on fossil fuels, particularly natural gas, despite its commitments to climate change mitigation. Policy measures should focus on enforcing stricter environmental regulations, implementing carbon pricing mechanisms, and integrating sustainability goals into industrial and energy planning. Expanding public transportation infrastructure, promoting energy efficiency measures, and incentivizing green investments will be crucial for reducing emissions and improving air quality, particularly in densely populated urban areas.
The interconnected nature of economic, political, and environmental dynamics in Egypt underscores the importance of a holistic policy approach. Regulatory reforms, economic diversification, political stability, and environmental sustainability must be pursued in tandem to achieve long-term resilience and development. Given Egypt’s rapid population growth and urbanization, policies should also address infrastructure needs, social inclusion, and labor market reforms to ensure sustainable and inclusive development. The government should strengthen institutional capacities, promote digital governance, and leverage international cooperation to align its policy framework with global best practices, ensuring that Egypt remains on a path of stable and sustainable progress.

Policy Implications for Egypt
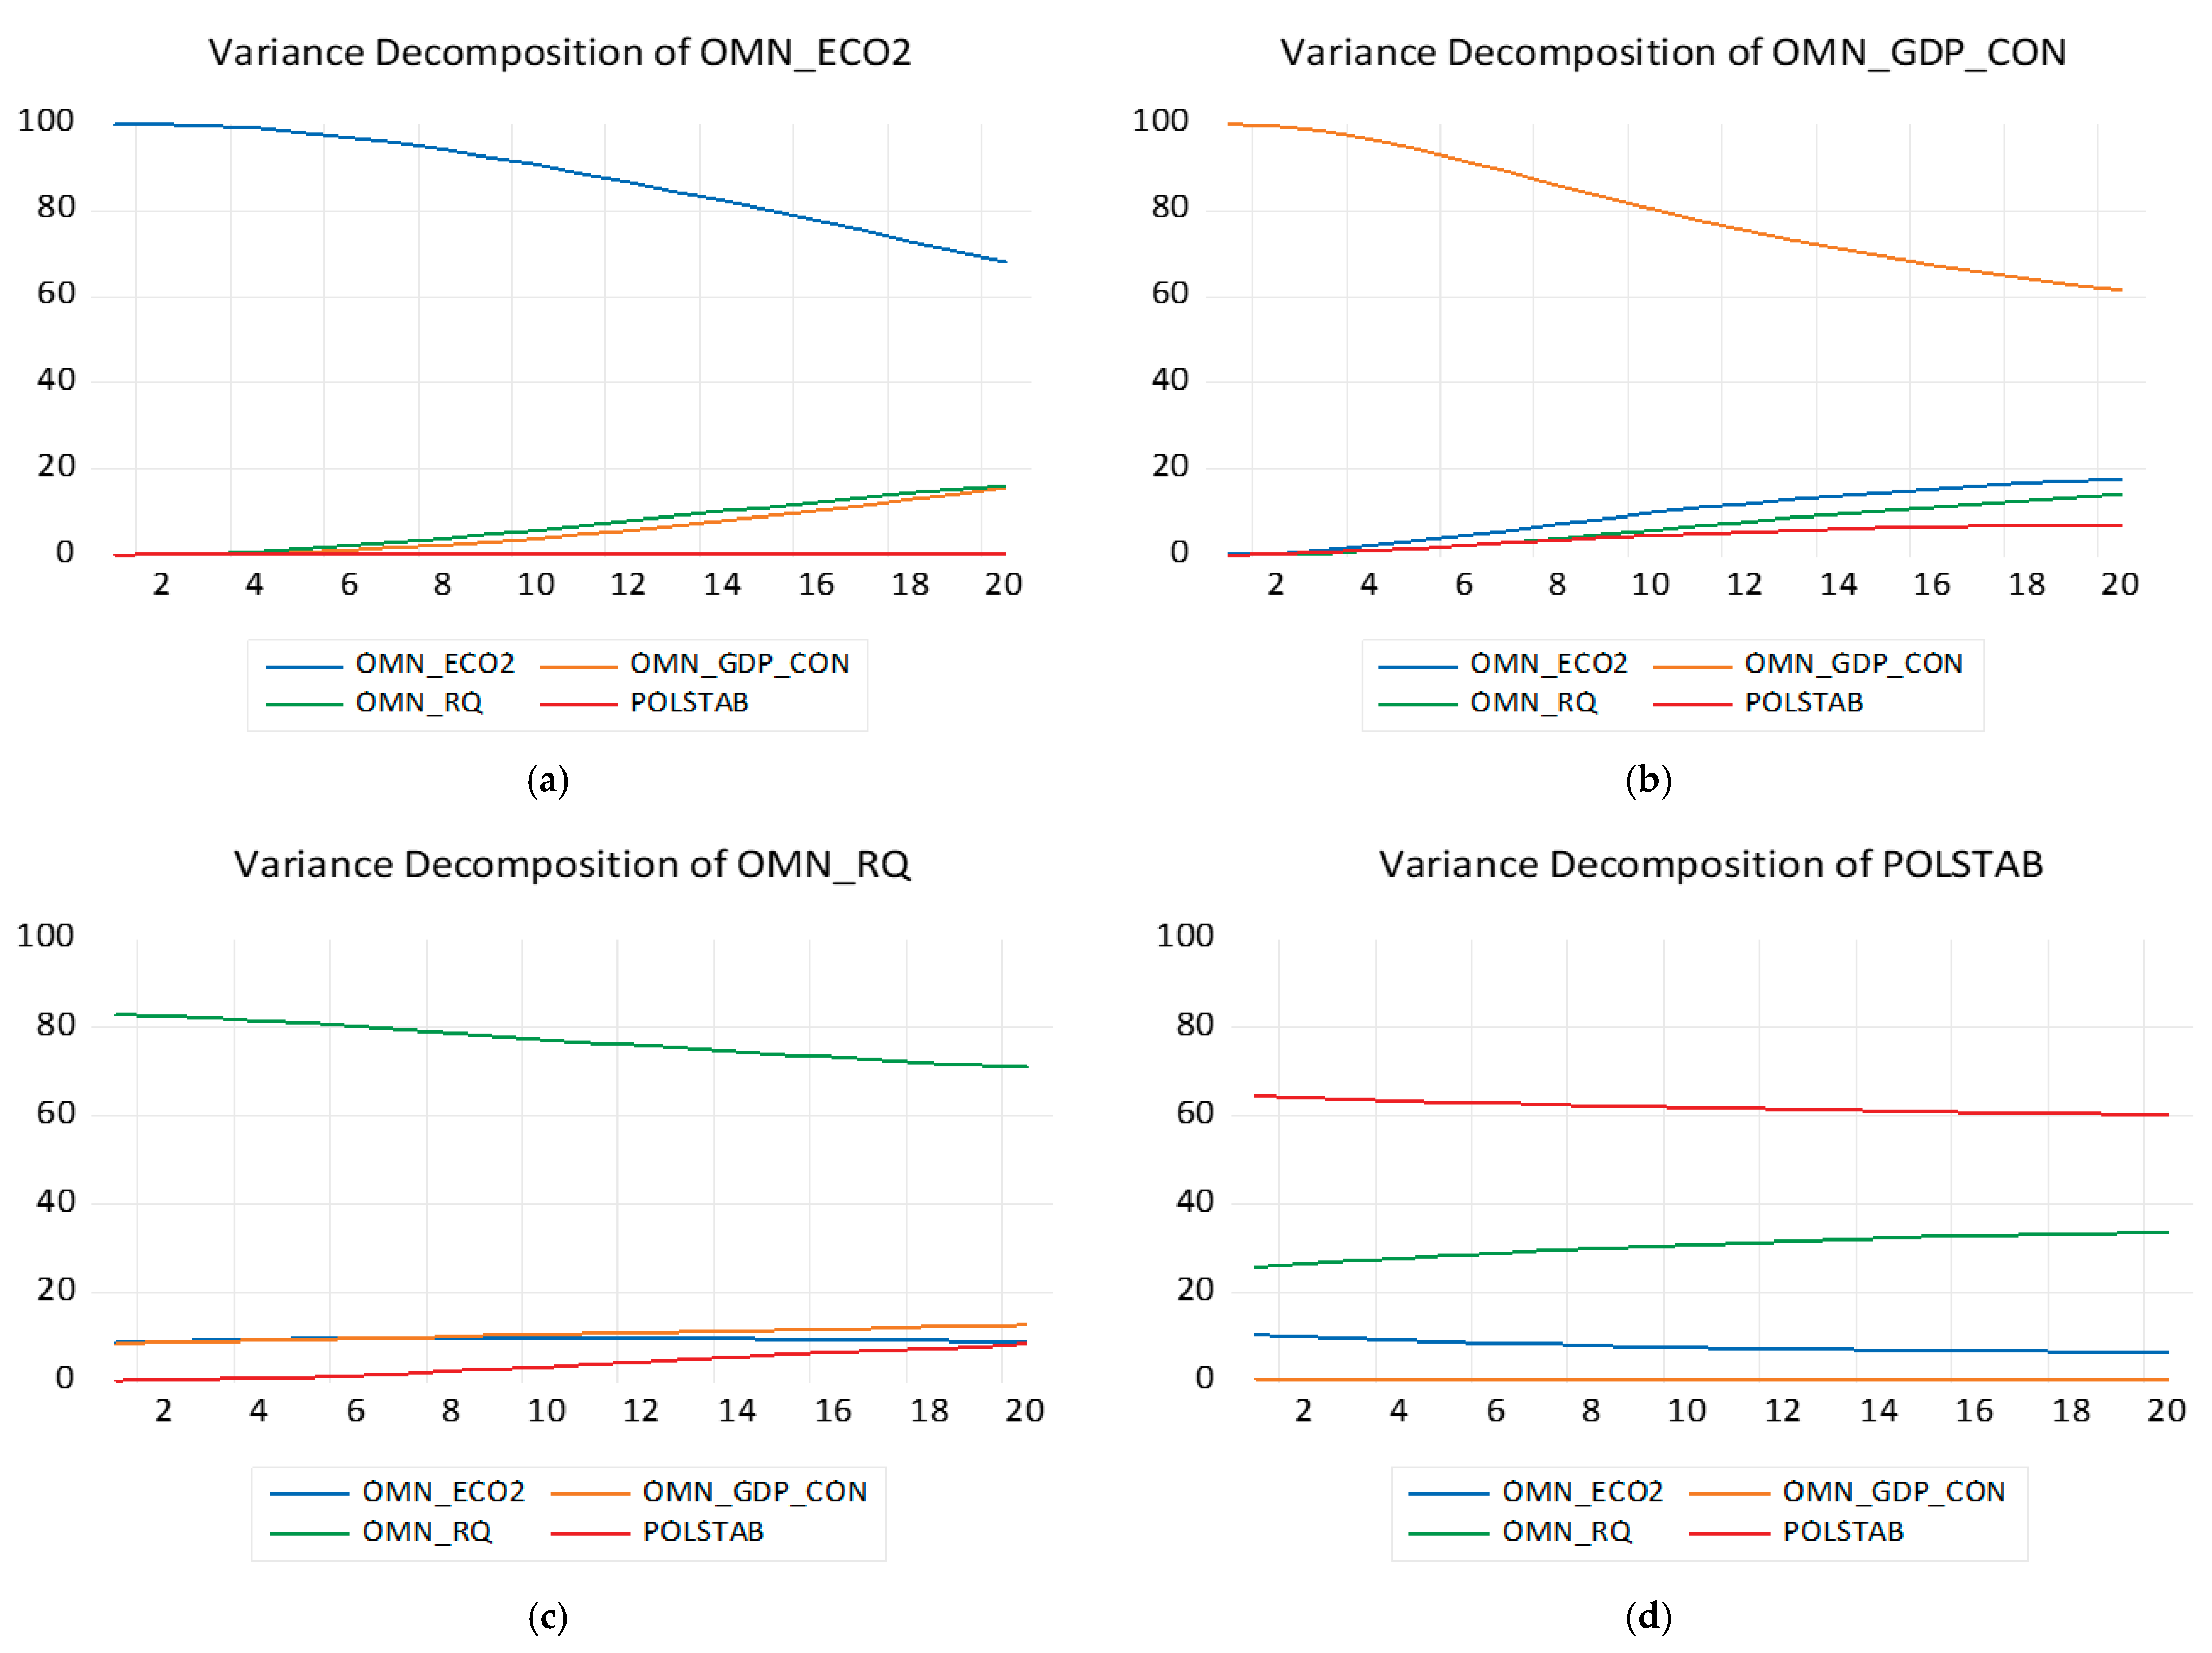
Based on the Bayesian VAR findings for Egypt, several critical policy implications emerge, highlighting the need for targeted interventions to enhance economic growth, promote renewable energy adoption, and improve institutional quality while ensuring long-term political stability.
First, the strong persistence observed in regulatory quality (EGY_RQ) and renewable energy consumption (EGY_RES_CON) indicates that past investments in governance and clean energy have long-lasting effects. This underscores the importance of maintaining momentum in regulatory reforms and clean energy initiatives. Policymakers should continue to strengthen institutional frameworks, reduce bureaucratic inefficiencies, and enhance transparency to build investor confidence and attract foreign direct investment. Given Egypt’s large public sector and state-owned enterprises, regulatory reforms should focus on leveling the playing field for private enterprises, reducing market distortions, and fostering competition. This will be crucial for sustaining long-term economic growth and ensuring the effective implementation of environmental policies.
Second, the weak link between economic growth and CO2 emissions, as indicated by the negative relationship (−0.48), suggests that Egypt is beginning to decouple its economic expansion from carbon emissions. This is a positive sign, potentially reflecting improved energy efficiency, technological advancements, and a gradual shift towards cleaner energy sources. However, the high persistence of energy consumption (0.988) and CO2 emissions (0.994) indicates that the current energy mix remains heavily reliant on fossil fuels. To accelerate decarbonization, Egypt should prioritize the transition to renewable energy by expanding investments in solar, wind, and hydrogen technologies. This includes scaling up projects like the Benban Solar Park, enhancing grid infrastructure, and supporting energy storage technologies to address intermittency issues.
The variance decomposition analysis also highlights the need for policies that link economic growth more directly with renewable energy adoption. Despite significant renewable energy investments, the weak impact of renewable energy consumption on GDP growth suggests that these projects have not yet fully integrated into the broader economy. Policymakers should focus on creating stronger industrial linkages, encouraging green manufacturing, and supporting innovation in clean technologies to maximize the economic benefits of renewable energy. Fiscal incentives, green bonds, and tax credits for businesses that invest in renewable energy can further strengthen these linkages.
Political stability, while essential for long-term policy implementation, shows minimal direct impact on emissions reduction, indicating that stability alone is insufficient for driving environmental improvements. To leverage political stability for sustainable growth, Egypt should focus on social policies that address inequality, unemployment, and access to basic services. These measures can enhance social cohesion, reduce political risk, and create a more predictable environment for long-term investment in green technologies.
Finally, the weak explanatory power for GDP growth (R2 = 0.197) suggests that traditional economic variables may not fully capture the drivers of Egypt’s economic performance. This indicates the need for a more comprehensive policy framework that includes innovation, digital transformation, and integration into global value chains. Given the external vulnerabilities exposed by recent global economic shocks, Egypt should also consider policies that reduce reliance on primary exports, enhance export diversification, and strengthen trade partnerships to build economic resilience.
In conclusion, Egypt’s path to sustainable development requires a multi-dimensional approach that simultaneously addresses economic diversification, renewable energy expansion, regulatory reforms, and social stability.
Key priorities should include Strengthening Regulatory Quality: Implementing anti-corruption measures, reducing administrative barriers, and enhancing institutional transparency to build a more competitive business environment. Accelerating Renewable Energy Adoption: Expanding clean energy projects, enhancing grid integration, and providing financial incentives to reduce carbon dependency. Linking Economic Growth with Sustainability: Promoting green industries, supporting technological innovation, and integrating sustainability criteria into industrial policies. Ensuring Political Stability Through Social Reforms: Addressing unemployment, social inequality, and access to public services to reduce political risks and foster long-term stability. Improving Economic Resilience: Diversifying exports, investing in digital infrastructure, and integrating more sectors into the formal economy to reduce vulnerability to external shocks.
By aligning these policy measures, Egypt can create a more resilient, low-carbon economy that supports both economic growth and environmental sustainability.

4.3. RD—Oman

Break point Unit root tests were implemented to all the variables of the model the results of which are provided in Table 8.
Based on the above findings 2 of the variables namely GDP and political stability are integrated of rank 1 while carbon emissions and regulatory quality are integrated of rank zero. Regarding the existence of structural breaks, the following issues should be mentioned;
The breaks in OMN_GDP_CON (GDP per capita) in 2019 and 2021 can be attributed to external and internal economic shocks. The 2019 break coincides with global economic slowdown concerns and fluctuations in oil prices, which significantly impact Oman’s oil-dependent economy. The 2021 break is likely due to the economic effects of the COVID-19 pandemic and Oman’s fiscal consolidation measures, including the introduction of a value-added tax (VAT) and subsidy reductions, which affected household consumption and business investment.
The break in OMN_ECO2 (CO2 emissions) in 2007 may be linked to increased industrialization and energy production following Oman’s economic diversification efforts under Vision 2020. During this period, energy-intensive industries, including petrochemicals and refining, expanded, leading to higher emissions. Additionally, population growth and rising energy consumption further contributed to the shift.
The break in OMN_RQ (Regulatory Quality) in 2002 likely reflects governance reforms initiated by Sultan Qaboos, including modernization efforts and economic liberalization policies aimed at improving business regulation, reducing bureaucratic inefficiencies, and attracting foreign investment. These reforms sought to enhance the regulatory framework, leading to a shift in governance quality indicators.
The break in OMN_POLSTAB (Political Stability) in 2014 corresponds with regional instability following the Arab Spring’s delayed effects. Although Oman remained relatively stable compared to neighboring countries, low oil prices and public dissatisfaction with economic conditions led to protests and increased government spending to maintain social stability. Additionally, regional geopolitical tensions, including the conflicts in Yemen and Qatar’s diplomatic crisis, likely influenced Oman’s political landscape. The next step in the current analysis involves BVAR estimation the results of which are provided in Table 9.
The Bayesian VAR estimates for Oman, based on data from 2005 to 2022, provide insights into the interactions between CO2 emissions (OMN_ECO2), GDP per capita (OMN_GDP_CON), regulatory quality (OMN_RQ), and political stability (POLSTAB). The results indicate that CO2 emissions exhibit strong persistence, with the first lag coefficient at 0.9750, suggesting that past emissions are a dominant factor in determining future emissions. However, the second lag is negligible, implying that the impact of past emissions diminishes relatively quickly. The effect of CO2 emissions on GDP per capita is positive but weak, as indicated by the large standard errors, suggesting that emissions growth does not significantly drive economic performance. The influence of emissions on regulatory quality and political stability is minimal, reinforcing the idea that environmental factors are not a major driver of governance outcomes in Oman.
GDP per capita follows a highly persistent pattern, with a first-lag coefficient of 1.0295, indicating strong momentum in economic performance. However, its impact on emissions, regulatory quality, and political stability is near zero, suggesting that economic growth alone is unlikely to lead to significant environmental or governance improvements. This highlights the need for active policy interventions to decouple economic expansion from carbon emissions and governance challenges.
Regulatory quality is also highly persistent, with a first-lag coefficient of 0.9559, meaning that past institutional conditions strongly influence future governance quality. However, its impact on emissions and GDP per capita is weak, and its negative influence on political stability suggests that governance reforms alone may not be sufficient to ensure stability. This points to the necessity of broader economic and social policies to reinforce institutional improvements.
Political stability exhibits the strongest persistence, with a first-lag coefficient of 0.9526, indicating that stability is largely self-reinforcing. However, its impact on regulatory quality is negative, suggesting that short-term political stability does not necessarily translate into improved governance. Its positive but weak influence on GDP suggests that while stability is essential for economic confidence, additional structural reforms are required for sustained economic growth.
The R-squared values indicate that political stability is the most predictable variable, with the model explaining approximately 70% of its variation. GDP per capita also has moderate predictability (52%), while CO2 emissions (34%) and regulatory quality (24%) are less well-explained by the model. The adjusted R-squared values suggest that some estimates may be unreliable, particularly for CO2 emissions and regulatory quality, where negative adjusted values indicate overfitting or weak explanatory power.
The results suggest that Oman’s environmental, economic, and governance dynamics are primarily driven by their own historical trends rather than strong interlinkages between these variables. This highlights the need for targeted policy interventions. Given the persistence of emissions, policies promoting energy transition and reducing carbon dependency are essential. Economic diversification beyond hydrocarbons is necessary to ensure that GDP growth is not solely reliant on fossil fuel exports. Regulatory quality improvements must be coupled with broader economic and social policies to enhance their effectiveness. Political stability provides a strong foundation for policy continuity, but without proactive reforms, it may not translate into long-term governance or economic benefits.
Prior to Variance decomposition analysis impulse response analysis is a necessary step to validate the interlinkages among the variables employed. More specifically, the accumulated response graphs from the Bayesian VAR model for Oman illustrate the long-term effects of shocks on CO2 emissions, GDP per capita, regulatory quality, and political stability over a 10-period horizon, Figure 6.
Based on the above findings, CO2 emissions show strong persistence, with a continuous increase following their own shock, indicating that past emissions are a primary driver of future levels. The weak response of emissions to GDP and regulatory quality suggests that economic growth and governance improvements alone are insufficient to curb emissions. Since the model does not account for renewables, the results indicate that Oman’s energy mix remains heavily reliant on fossil fuels, reinforcing a carbon-intensive growth pattern.
GDP per capita also exhibits strong persistence, with its own shocks leading to sustained increases, while its response to regulatory quality and political stability is limited. This suggests that institutional improvements alone may not generate immediate economic gains, highlighting the need for active diversification policies to reduce dependence on hydrocarbons.
Regulatory quality is self-reinforcing but has a weak impact on emissions and GDP, implying that stronger governance must be accompanied by direct policy measures such as incentives for green investments and energy efficiency programs.
Political stability follows a similar pattern, showing a strong self-reinforcing effect but little influence on emissions and economic performance, indicating that while stability provides a foundation for long-term policy implementation, additional interventions are necessary to drive sustainability outcomes.
The findings suggest that without renewable energy integration, Oman risks sustained emissions growth with limited economic diversification benefits. To break the fossil fuel dependency cycle, the country must implement strategic policy shifts such as carbon pricing, regulatory support for clean energy, and investment in sustainable infrastructure. Economic diversification efforts should focus on non-oil sectors like manufacturing, tourism, and technology to enhance resilience and reduce vulnerability to oil price fluctuations. Governance improvements must be paired with concrete incentives for green growth to ensure that regulatory enhancements translate into meaningful environmental and economic benefits. Stability alone is not sufficient to drive sustainability, and direct investments in renewable energy, emissions reduction policies, and economic diversification are necessary to achieve long-term sustainability and resilience.
The variance decomposition analysis for Oman provides insights into the relative contribution of different variables—CO2 emissions (OMN_ECO2), GDP per capita (OMN_GDP_CON), regulatory quality (OMN_RQ), and political stability (POLSTAB)—to their own and each other’s forecast error variance over a 20-period horizon, Figure 7.
The variance decomposition of CO2 emissions shows that most of the forecast variance is explained by its own past values, although its contribution gradually declines over time. The impact of GDP per capita and regulatory quality on emissions remains minimal, indicating that economic and governance changes alone are insufficient to drive significant shifts in emissions. The slight increase in the explanatory power of political stability over time suggests that stable political conditions may create an enabling environment for long-term environmental policies. However, given the dominant influence of historical emissions, active policy measures such as carbon pricing, renewable energy adoption, and industrial regulations are necessary to reduce emissions over time.
The variance decomposition of GDP per capita indicates that its own past values explain the majority of its variance, although this influence declines gradually. The increasing contributions of CO2 emissions and regulatory quality suggest that environmental and governance factors play a growing role in shaping economic performance. This underscores the need for sustainable economic policies that balance growth with environmental responsibility. Economic diversification and investment in green industries can help mitigate the long-term risks of carbon dependency.
The variance decomposition of regulatory quality shows that its own past values account for most of its variation, but the influence of political stability gradually increases. This suggests that stable political conditions contribute to long-term improvements in governance. However, the limited role of economic performance and emissions highlights the need for explicit institutional reforms and anti-corruption measures to strengthen governance beyond the effects of political stability. Strengthening regulatory frameworks, increasing transparency, and enhancing institutional efficiency are key areas for policy intervention.
The variance decomposition of political stability reveals that it is largely self-reinforcing, with past stability explaining most of its future variations. The relatively small influence of regulatory quality and economic performance suggests that political stability in Oman is not strongly driven by economic or institutional factors, implying that stability is maintained through other mechanisms such as government policies, social cohesion, or geopolitical considerations. This stability provides an opportunity for long-term policy implementation, but it must be leveraged to enact structural reforms that enhance governance, economic resilience, and environmental sustainability.
Overall, the findings indicate that Oman’s economic, environmental, and governance dynamics are largely shaped by their own historical trends rather than strong cross-variable interactions. This implies that passive policy approaches will not be sufficient to drive significant change. Targeted interventions are necessary to decouple economic growth from emissions, enhance institutional quality, and leverage political stability for sustainable development. Policymakers should focus on green economic diversification, governance reforms, and long-term sustainability strategies to ensure that stability translates into economic and environmental resilience.

Policy Implications for Oman

Based on the Bayesian VAR estimates for Oman, several critical policy implications emerge, highlighting the need for targeted interventions to address the country’s carbon dependency, economic diversification, and institutional development.
First, the strong persistence of CO2 emissions, indicated by a first-lag coefficient close to 1, underscores the urgent need for aggressive carbon reduction strategies. This persistence suggests that past emissions are a significant determinant of future levels, reinforcing a carbon-intensive growth path that is unsustainable in the long term. Given that emissions remain largely unaffected by economic growth, regulatory quality, or political stability, Oman must prioritize direct interventions such as carbon pricing, emissions trading systems, and stricter industrial pollution controls. Additionally, policies promoting renewable energy adoption and energy efficiency can help break this cycle, reducing the long-term environmental impact of economic activities.
Second, the weak link between GDP per capita and emissions indicates that economic growth alone will not necessarily lead to higher emissions, presenting an opportunity for Oman to pursue green economic diversification. This finding supports the case for targeted investments in non-oil sectors, such as manufacturing, technology, tourism, and renewable energy, which can drive economic growth without a proportional increase in carbon emissions. This approach aligns with global trends towards decarbonization and can enhance Oman’s resilience to oil price shocks.
The high persistence of regulatory quality, despite its limited influence on emissions and GDP, highlights the importance of strengthening institutional frameworks to support sustainable development. While regulatory improvements alone may not directly reduce emissions or spur economic growth, they are essential for creating a stable business environment, reducing corruption, and promoting transparency. Policies that enhance institutional capacity, streamline bureaucratic processes, and enforce environmental regulations can provide the foundation for long-term sustainability.
Political stability, while highly persistent, shows a limited direct impact on both economic growth and emissions. This suggests that stability alone is not sufficient to drive structural economic or environmental improvements. However, stable governance provides the necessary foundation for long-term policy implementation, offering a unique window for Oman to introduce structural reforms. This stability should be leveraged to implement comprehensive sustainability policies, including green infrastructure investments, climate adaptation measures, and social reforms that enhance public trust and political legitimacy.
The variance decomposition results further emphasize the need for proactive policies, as the self-reinforcing nature of emissions and political stability suggests that these dynamics will not change without deliberate intervention. Specifically, the strong self-dependence of emissions highlights the need for policies that directly target carbon sources, such as fossil fuel substitution, green building codes, and incentives for low-carbon technologies.
Overall, these findings point to the need for an integrated policy framework that addresses emissions reduction, economic diversification, and governance improvements simultaneously. Key priorities should include the following:
  • Decoupling Economic Growth from Carbon Emissions: Implementing carbon pricing, promoting clean energy investments, and supporting low-carbon industries to reduce emissions without compromising economic growth.
  • Strengthening Regulatory Frameworks: Enhancing institutional capacity, improving transparency, and enforcing environmental standards to create a more predictable and investor-friendly business environment.
  • Leveraging Political Stability for Structural Reforms: Using Oman’s stable political context to drive long-term sustainability policies, including green infrastructure, climate resilience planning, and social welfare programs.
  • Encouraging Private Sector Innovation: Providing financial incentives and regulatory support for clean technology startups and green businesses to diversify the economy and reduce oil dependency.
  • Integrating Long-Term Sustainability Goals: Aligning national development strategies with global climate targets to ensure that short-term economic gains do not undermine long-term environmental and social stability.
In conclusion, Oman’s economic and environmental resilience will depend on its ability to break the historical patterns identified in this analysis. Without proactive policy interventions, the country risks locking itself into a high-emissions, resource-dependent growth model that is increasingly vulnerable to global market shifts and climate risks.

5. Conclusions

This study conducted a comprehensive assessment of the environmental-economic dynamics in Oman, Egypt, and Morocco using Bayesian Vector Autoregression (BVAR) models to capture the complex interactions among economic growth, carbon emissions, political stability, regulatory quality, and renewable energy adoption. The analysis incorporated time series data from 2004 to 2022, allowing for the identification of persistent patterns and structural dependencies within each country’s economic and environmental systems. The findings reveal significant differences in the sustainability trajectories of these three nations, shaped by their unique economic structures, governance frameworks, and energy policies.
Oman remains heavily dependent on hydrocarbons, with economic growth closely tied to fossil fuel production. This dependency has contributed to high CO2 emissions and a delayed transition to renewable energy, despite the potential benefits of its political stability. Egypt, while more economically diversified, faces substantial environmental challenges due to rapid industrialization and urbanization. Despite recent regulatory reforms and investments in renewable energy, the country’s reliance on fossil fuels remains a critical barrier to sustainability. Morocco, in contrast, has positioned itself as a regional leader in renewable energy, leveraging political stability and strong institutional frameworks to drive significant investments in solar and wind power. However, economic vulnerabilities and the need for deeper industrial integration of clean energy remain ongoing challenges.
The results of this study can directly inform the design of Sustainable Development Goal (SDG)-responsive policies in Oman, Egypt, and Morocco, aligning their national energy strategies with global sustainability targets. Specifically:
For Oman, the findings highlight the need for aggressive carbon reduction strategies and economic diversification to reduce dependency on hydrocarbons, directly supporting SDG 7 (Affordable and Clean Energy), SDG 9 (Industry, Innovation, and Infrastructure), and SDG 13 (Climate Action). To achieve these goals, Oman should focus on integrating renewable energy into its power mix, promoting energy efficiency, and investing in emerging technologies like green hydrogen and carbon capture and storage (CCS). These measures will help Oman transition to a low-carbon economy, reduce its carbon footprint, and enhance energy security. Additionally, SDG 8 (Decent Work and Economic Growth) can be supported by creating green jobs in renewable energy sectors, fostering innovation, and promoting private sector investment. Regulatory reforms aimed at improving transparency, reducing bureaucratic inefficiencies, and strengthening environmental governance will also be critical for aligning economic growth with sustainability goals.
For Egypt, the study underscores the importance of expanding renewable energy infrastructure, eliminating fossil fuel subsidies, and strengthening institutional capacity to enforce environmental regulations, directly addressing SDG 7, SDG 11 (Sustainable Cities and Communities), and SDG 12 (Responsible Consumption and Production). Egypt should prioritize scaling up investments in solar, wind, and hydropower, while enhancing grid integration and energy storage solutions to ensure the stability and reliability of clean energy supply. This will reduce the carbon intensity of the power sector and support SDG 13 by mitigating climate change impacts. Additionally, Egypt should focus on reducing urban pollution and improving air quality in major cities to enhance public health outcomes, aligning with SDG 3 (Good Health and Well-being). Reforms in education and vocational training will also be necessary to build a skilled workforce for the green economy, supporting SDG 4 (Quality Education) and SDG 8.
For Morocco, the findings emphasize the need to deepen the integration of clean technologies across all sectors to enhance economic resilience, supporting SDG 7, SDG 9, and SDG 13. Morocco should focus on creating stronger industrial linkages between renewable energy production and high-value sectors like green hydrogen, sustainable manufacturing, and digital technologies. This will help reduce carbon emissions, increase economic diversification, and improve energy security. Additionally, Morocco should strengthen its regulatory frameworks to promote private sector participation in the renewable energy market, supporting SDG 16 (Peace, Justice, and Strong Institutions). Integrating sustainability into national development planning and expanding international trade in renewable energy can also support SDG 17 (Partnerships for the Goals), enhancing Morocco’s position as a global leader in clean energy.
While this study provides valuable insights, several limitations should be acknowledged. Data inconsistencies, incomplete records, and the complexity of isolating causal relationships in highly interconnected economic and environmental systems present challenges. The analysis is further complicated by geopolitical influences and the potential biases in self-reported government data, which may affect the accuracy of the findings. Additionally, short-term assessments may overlook long-term energy transitions, while external shocks such as financial crises or extreme weather events introduce further uncertainty. Future research should incorporate more comprehensive data sources, including satellite observations, independent assessments, and advanced econometric models that account for structural breaks, technological advancements, and policy shifts. A multi-method approach, integrating quantitative modeling with qualitative case studies, could enhance the robustness and reliability of sustainability evaluations.
To synopsize, aligning national energy policies with SDG objectives can significantly enhance the environmental resilience, economic diversification, and long-term prosperity of these three countries. By prioritizing clean energy investments, regulatory reforms, and institutional capacity building, Oman, Egypt, and Morocco can reduce their carbon footprints, promote sustainable economic growth, and contribute to global climate action [104,105]. Future research should focus on developing integrated policy frameworks that address the complex interplay between economic growth, energy transitions, and environmental sustainability, ensuring that these countries achieve their SDG targets by 2030.

Author Contributions

Conceptualization, M.M. and E.Z.; methodology, M.M. and E.Z.; software, M.M. and E.Z.; validation, A.K., S.G. and G.A.; formal analysis, M.M. and E.Z.; investigation, M.M. and E.Z.; resources, M.M. and E.Z.; data curation, E.Z.; writing—original draft preparation, M.M. and E.Z.; writing—review and editing, M.M. and E.Z.; visualization, M.M.; supervision, M.M.; project administration, M.M. All authors have read and agreed to the published version of the manuscript.

Funding

This research received no external funding.

Data Availability Statement

The raw data supporting the current investigation have been available as described in Appendix A.

Conflicts of Interest

The authors declare no conflicts of interest.

Appendix A

Raw data utilized for the investigation of interest was received from the libraries of the following table. World Bank includes data for all variables and thus the majority of the data of interest have been collected from the relevant library. Data were received also from the rest of the libraries and have been included in the relative models when World Bank data might not have been enough for the relevant evaluation techniques. Data have been qualitatively compared between libraries to make sure that no significant differences may be exhibited.
Table A1. Data Collection.
VariableData SourcesNotes
CO2 Emissions (kg per PPP $ of GDP)World Bank—World Development Indicators (WDI) [106]
Global Carbon Atlas [107]
Our World in Data [108]
IEA (International Energy Agency)—Free datasets [109]
World Bank provides CO2 emissions by PPP GDP, while IEA has energy-related CO2 emissions.
Renewable Energy Consumption (% of Total Final Energy Consumption)World Bank—WDI [106]
IRENA (International Renewable Energy Agency) [110]
IEA—Renewables Database [61]
BP Statistical Review of World Energy [111]
World Bank and IRENA provide national-level data, while BP and IEA offer global/regional reports.
Renewable Electricity Output (% of Total Electricity Output)World Bank—WDI [106]
IRENA [110]
IEA Electricity Statistics [112]
US EIA (Energy Information Administration) [113]
IRENA and IEA provide country-level and sectoral breakdowns.
Regulatory Quality (World Bank Estimate)World Bank—Worldwide Governance Indicators (WGI) [114]Covers governance effectiveness, regulatory quality, and rule of law indicators.
Political Stability and Absence of Violence/Terrorism (World Bank Estimate)World Bank—WGI [114]
Global Peace Index (Institute for Economics and Peace) [115]
Political Risk Map (Marsh McLennan) [116]
World Bank offers quantitative indicators, while Global Peace Index provides rankings and risk analysis.
GDP Growth (Annual %)World Bank—WDI [114]
IMF World Economic Outlook (WEO) [117]
OECD Economic Outlook [118]
UN Data [119]
IMF and OECD provide short-term and long-term GDP forecasts.

References

  1. Grossman, G.M.; Krueger, A.B. Environmental Impacts of a North American Free Trade Agreement. NBER Working Paper 1991, No. 3914. Available online: https://www.nber.org/papers/w3914 (accessed on 21 May 2025).
  2. Wang, Q.; Li, Y.; Li, R. Rethinking the Environmental Kuznets Curve Hypothesis across 214 Countries: The Impacts of 12 Economic, Institutional, Technological, Resource, and Social Factors. Humanit. Soc. Sci. Commun. 2024, 11, 292. [Google Scholar] [CrossRef]
  3. World Economic Forum. Prioritizing Sustainability in MENA: Mapping Critical Environmental Issues for Regional Businesses; White Paper; WEF: Geneva, Switzerland, 2024; Available online: https://www.weforum.org/publications/prioritizing-sustainability-in-mena-mapping-critical-environmental-issues-for-regional-businesses (accessed on 21 May 2025).
  4. United Nations Framework Convention on Climate Change (UNFCCC). Paris Agreement; UNFCCC: Paris, France, 2015; Available online: https://unfccc.int/sites/default/files/english_paris_agreement.pdf (accessed on 21 May 2025).
  5. United Nations Framework Convention on Climate Change (UNFCCC). Summary of COP29: Key Targets, Outcomes, and Results; UNFCCC: Baku, Azerbaijan, 2024; Available online: https://unfccc.int/cop29 (accessed on 21 May 2025).
  6. World Bank. Climate Action: A Catalyst for Egypt’s Prosperity and Sustainable Growth; World Bank: Washington, DC, USA, 2024; Available online: https://www.worldbank.org/en/news/feature/2024/11/25/climate-action-a-catalyst-for-egypt-s-prosperity-and-sustainable-growth (accessed on 21 May 2025).
  7. DNV. Energy Transition Outlook 2024; DNV: Høvik, Norway, 2024; Available online: https://www.dnv.com/energy-transition-outlook/ (accessed on 21 May 2025).
  8. International Energy Agency. World Energy Outlook 2024; IEA: Paris, France, 2024; Available online: https://www.iea.org/reports/world-energy-outlook-2024 (accessed on 21 May 2025).
  9. International Energy Agency. Renewables 2023; IEA: Paris, France, 2023; Available online: https://www.iea.org/reports/renewables-2023 (accessed on 21 May 2025).
  10. International Renewable Energy Agency; League of Arab States; Regional Center for Renewable Energy and Energy Efficiency. Pan-Arab Renewable Energy Strategy 2030: Roadmap of Actions for Implementation; IRENA: Abu Dhabi, United Arab Emirates, 2014; Available online: https://www.irena.org/publications/2014/Jun/Pan-Arab-Renewable-Energy-Strategy-2030-Roadmap-of-Actions-for-Implementation (accessed on 21 May 2025).
  11. Organisation for Economic Co-operation and Development. OECD Economic Surveys: Morocco 2024; OECD Publishing: Paris, France, 2024; Available online: https://www.oecd.org/en/publications/2024/09/oecd-economic-surveys-morocco-2024_d4786047.html (accessed on 21 May 2025).
  12. Mbarek, M.B. Energy Consumption, CO2 Emissions, and Economic Growth in Developed, Emerging, and Middle East and North Africa Countries. Energy 2019, 179, 232–245. [Google Scholar] [CrossRef]
  13. International Energy Agency. World Energy Outlook 2023; IEA: Paris, France, 2023; Available online: https://www.iea.org/reports/world-energy-outlook-2023 (accessed on 21 May 2025).
  14. Ntanos, S.; Skordoulis, M.; Kyriakopoulos, G.L.; Arabatzis, G.; Chalikias, M. Renewable Energy and Economic Growth: Evidence from European Countries. Sustainability 2018, 10, 2626. [Google Scholar] [CrossRef]
  15. Gorus, M.S.; Aydin, M. The Relationship Between Energy Consumption, Economic Growth, and CO2 Emission in MENA Countries: Causality Analysis in the Frequency Domain. Energy 2019, 168, 815–822. [Google Scholar] [CrossRef]
  16. Al-Ayouty, I. Economic Complexity and Renewable Energy Effects on Carbon Dioxide Emissions: A Panel Data Analysis of Middle East and North Africa Countries. J. Knowl. Econ. 2024, 15, 12006–12025. [Google Scholar] [CrossRef]
  17. Shehabi, M. Just Energy Transitions? Lessons From Oman and Morocco. Carnegie Endowment for International Peace, 30 May 2024. Available online: https://carnegieendowment.org/research/2024/05/morocco-oman-energy-transition-oil-exporting-renewable?lang=en (accessed on 21 May 2025).
  18. Moudene, K.; El-Oud, R.; Ejbari, R.; Amedjar, A. Renewable Energy and Economic Growth in Morocco. J. Hum. Resour. Sustain. Stud. 2023, 11, 401–413. [Google Scholar] [CrossRef]
  19. Erkut, B. Renewable Energy and Carbon Emissions: New Empirical Evidence from the Union for the Mediterranean. Sustainability 2022, 14, 6921. [Google Scholar] [CrossRef]
  20. International Energy Agency. World Energy Investment 2021; IEA: Paris, France, 2021; Available online: https://www.iea.org/reports/world-energy-investment-2021 (accessed on 21 May 2025).
  21. International Energy Agency. Renewable Energy Market Update—June 2023; IEA: Paris, France, 2023; Available online: https://www.iea.org/reports/renewable-energy-market-update-june-2023 (accessed on 21 May 2025).
  22. Omar, N.; Klose, J. The Response of CO2 Emissions to Macroeconomic Shocks: A Panel VAR Analysis. MAGKS Papers on Economics 2024, No. 05-2024. Available online: https://www.uni-marburg.de/en/fb02/research-groups/economics/macroeconomics/research/magks-joint-discussion-papers-in-economics/papers/2024/05-2024_klose.pdf (accessed on 21 May 2025).
  23. Grossman, G.M.; Krueger, A.B. Economic growth and the environment. Q. J. Econ. 1995, 110, 353–377. [Google Scholar] [CrossRef]
  24. Dinda, S. Environmental Kuznets Curve hypothesis: A survey. Ecol. Econ. 2004, 49, 431–455. [Google Scholar] [CrossRef]
  25. Stern, D.I. The rise and fall of the environmental Kuznets curve. World Dev. 2004, 32, 1419–1439. [Google Scholar] [CrossRef]
  26. Leal, M.C.; Marques, A.C. Renewable energy, economic growth and CO2 emissions: The role of policy. Renew. Energy 2022, 182, 119–128. [Google Scholar]
  27. Saini, A.; Singhania, M. Asymmetric link between renewable energy consumption and CO2 emissions across quantiles: Evidence from India. Resour. Policy 2019, 61, 592–603. [Google Scholar]
  28. Chang, T.; Gupta, R.; Inglesi-Lotz, R.; Simo-Kengne, B.D. Persistence of carbon emissions in the G7 countries: Evidence from a panel stationarity test with structural breaks. Energy Econ. 2017, 66, 198–207. [Google Scholar]
  29. Liobikienė, G. Renewable energy and CO2 emissions: The role of governance and country-specific factors. Renew. Sustain. Energy Rev. 2020, 121, 109689. [Google Scholar]
  30. Dogan, E.; Seker, F. Determinants of CO2 emissions in the European Union: The role of renewable and non-renewable energy. Renew. Energy 2016, 94, 429–439. [Google Scholar] [CrossRef]
  31. Saidi, K.; Hammami, S. The impact of energy consumption and CO2 emissions on economic growth: Fresh evidence from dynamic simultaneous-equations models. Sustain. Cities Soc. 2015, 14, 178–186. [Google Scholar] [CrossRef]
  32. Isa, A.; Yilanci, V.; Ozturk, I. Economic growth and energy consumption nexus: Evidence from OECD countries. Energy Rep. 2015, 1, 96–102. [Google Scholar]
  33. Apergis, N.; Payne, J.E. Renewable energy consumption and economic growth: Evidence from a panel of OECD countries. Energy Policy 2010, 38, 656–660. [Google Scholar] [CrossRef]
  34. Al-Mulali, U.; Saboori, B.; Ozturk, I. Investigating the environmental Kuznets curve hypothesis in Vietnam. Energy Policy 2015, 76, 123–131. [Google Scholar] [CrossRef]
  35. Ben Jebli, M.; Ben Youssef, S.; Apergis, N. The dynamic linkage between renewable energy, output, carbon emissions and trade: Evidence from a panel of 20 developed and developing countries. Renew. Energy 2016, 83, 166–175. [Google Scholar]
  36. Acheampong, A.O.; Amponsah, M.; Boateng, E. Does renewable energy consumption contribute to environmental sustainability? Renew. Sustain. Energy Rev. 2019, 112, 853–868. [Google Scholar]
  37. Wang, Q.; Su, M.; Li, R. Toward a low-carbon economy: The role of technological innovation and renewable energy in reducing CO2 emissions. Energy Econ. 2020, 91, 104901. [Google Scholar]
  38. Popp, D. Induced innovation and energy prices. Am. Econ. Rev. 2002, 92, 160–180. [Google Scholar] [CrossRef]
  39. Baños, R.; Manzano-Agugliaro, F.; Montoya, F.G.; Gil, C.; Alcayde, A.; Gómez, J. Optimization methods applied to renewable and sustainable energy: A review. Renew. Sustain. Energy Rev. 2011, 15, 1753–1766. [Google Scholar] [CrossRef]
  40. Borunda, M.; Hernández, A.; Sánchez, J.A. Decision-making for renewable energy systems using Bayesian networks. Renew. Sustain. Energy Rev. 2016, 60, 940–951. [Google Scholar]
  41. Gallagher, K.S.; Grübler, A.; Kuhl, L.; Nemet, G.; Wilson, C. The energy technology innovation system. Annu. Rev. Environ. Resour. 2012, 37, 137–162. [Google Scholar] [CrossRef]
  42. Ge, J.; Xu, X.; Pang, J. Evaluating renewable energy policy: A review and future directions. Renew. Sustain. Energy Rev. 2019, 113, 109248. [Google Scholar]
  43. Genus, A.; Iskandarova, M. Enabling and constraining factors in the development of renewable energy in Russia: A contextual and comparative view. Energy Policy 2020, 140, 111404. [Google Scholar]
  44. Ozge, O.; Akbas, Y.E.; Gedik, R. Financial support schemes for renewable energy development: A comparative review. Renew. Sustain. Energy Rev. 2020, 119, 109589. [Google Scholar]
  45. Wang, Y.; Qin, Y.; Luo, X. Pricing policy and investment decision-making in renewable energy markets. Renew. Energy 2016, 94, 365–372. [Google Scholar]
  46. Cheng, C.C.J.; Yi, H. The impact of green product innovation on firm performance: The mediating role of green process innovation. J. Bus. Ethics 2017, 140, 531–543. [Google Scholar]
  47. Reza, A.; Esmaeilian, G.; Behdad, S.; Cai, W. Congestion management of power systems with high penetration of renewable energy. Renew. Sustain. Energy Rev. 2017, 70, 316–326. [Google Scholar]
  48. Liu, H.; Wang, L.; He, Y. Evaluating the policy effectiveness of China’s renewable energy development. Energy Policy 2018, 113, 356–366. [Google Scholar]
  49. Tsoutsos, T.; Stamboulis, Y. The sustainable diffusion of renewable energy technologies as an innovation system. Renew. Sustain. Energy Rev. 2005, 9, 625–638. [Google Scholar]
  50. Negro, S.O.; Alkemade, F.; Hekkert, M.P. Why does renewable energy diffuse so slowly? A review of innovation system problems. Renew. Sustain. Energy Rev. 2012, 16, 3836–3846. [Google Scholar] [CrossRef]
  51. Wüstenhagen, R.; Wolsink, M.; Bürer, M.J. Social acceptance of renewable energy innovation: An introduction to the concept. Energy Policy 2007, 35, 2683–2691. [Google Scholar] [CrossRef]
  52. Tamazian, A.; Chousa, J.P.; Vadlamannati, K.C. Does higher economic and financial development lead to environmental degradation? Evidence from BRIC countries. Energy Policy 2009, 37, 246–253. [Google Scholar] [CrossRef]
  53. Dagoumas, A.S.; Koltsaklis, N.E. Review of Models for Integrating Renewable Energy in the Generation Expansion Planning. Appl. Energy 2019, 242, 1573–1587. [Google Scholar] [CrossRef]
  54. Fontes, J.; Freires, F.G.M. A sustainable supply chain framework for the wind energy sector. Renew. Sustain. Energy Rev. 2018, 82, 333–344. [Google Scholar]
  55. Arouri, M.E.H.; Youssef, A.B.; M’henni, H.; Rault, C. Energy Consumption, Economic Growth, and CO2 Emissions in Middle East and North African Countries. Energy Policy 2012, 45, 342–349. [Google Scholar] [CrossRef]
  56. Cardarelli, R.; Koranchelian, T. (Eds.) Morocco’s Quest for Stronger and Inclusive Growth; International Monetary Fund: Washington, DC, USA, 2023; Available online: https://www.imf.org/en/Publications/Books/Issues/2023/09/22/Moroccos-Quest-for-Stronger-and-Inclusive-Growth-525734 (accessed on 21 May 2025).
  57. Omri, A. CO2 Emissions, Energy Consumption, and Economic Growth Nexus in MENA Countries: Evidence from Simultaneous Equations Models. Energy Econ. 2013, 40, 657–664. [Google Scholar] [CrossRef]
  58. International Monetary Fund. Morocco: Request for an Arrangement Under the Resilience and Sustainability Facility—Press Release; Staff Report; Supplement; Staff Statement; and Statement by the Executive Director for Morocco; IMF Country Report No. 2023/354; International Monetary Fund: Washington, DC, USA, 2023; Available online: https://www.imf.org/en/Publications/CR/Issues/2023/10/26/Morocco-Request-for-an-Arrangement-Under-the-Resilience-and-Sustainability-Facility-Press-540896 (accessed on 21 May 2025).
  59. Organisation for Economic Co-operation and Development. OECD Green Growth Policy Review of Egypt 2024; OECD Environmental Performance Reviews; OECD Publishing: Paris, France, 2024. [Google Scholar] [CrossRef]
  60. Maku, O.A.; Ikpuri, P.O. A Multivariate Analysis between Renewable Energy, Carbon Emission, and Economic Growth: New Evidences from Selected Middle East and North Africa Countries. Int. J. Energy Econ. Policy 2020, 10, 440–450. [Google Scholar] [CrossRef]
  61. International Energy Agency. Renewables 2024; IEA: Paris, France, 2024; Available online: https://www.iea.org/reports/renewables-2024 (accessed on 21 May 2025).
  62. Zhang, W.; Wang, Y.; Zeeshan, M.; Han, F.; Song, K. Super-twisting sliding mode control of grid-side inverters for wind power generation systems with parameter perturbation. Int. J. Electr. Power Energy Syst. 2025, 165, 110501. [Google Scholar] [CrossRef]
  63. Curtiss, K. Increasing the Energy Efficiency of Photovoltaic Cells by Modifying the Building Envelope. Doctoral Dissertation, Lawrence Technological University, Southfield, MI, USA, 2023. [Google Scholar]
  64. Zhao, H.; Zhu, B.; Jiang, B. Comprehensive assessment and analysis of cavitation scale effects on energy conversion and stability in pumped hydro energy storage units. Energy Convers. Manag. 2025, 325, 119370. [Google Scholar] [CrossRef]
  65. Sarantis, N.; Stewart, C. Univariate versus multivariate forecasts of inflation: An application of Bayesian VAR models. J. Forecast. 1995, 14, 109–134. [Google Scholar]
  66. Karlsson, S. Forecasting with Bayesian Vector Autoregressions. In Handbook of Economic Forecasting; Elsevier: Amsterdam, The Netherlands, 2013; Volume 2, pp. 791–897. [Google Scholar]
  67. Koop, G. Bayesian Econometrics; John Wiley & Sons: Chichester, UK, 2003. [Google Scholar]
  68. European Commission. The European Green Deal; European Commission Policy Paper; European Commission: Brussels, Belgium, 2019. Available online: https://eur-lex.europa.eu/legal-content/EN/TXT/?uri=CELEX%3A52019DC0640 (accessed on 21 May 2025).
  69. Bloor, C.; Matheson, T. Real-time conditional forecasts with Bayesian VARs: An application to New Zealand. North Am. J. Econ. Financ. 2011, 22, 26–42. [Google Scholar] [CrossRef]
  70. Narayan, P.K.; Popp, S. Size and Power Properties of Structural Break Unit Root Tests. Appl. Econ. 2013, 45, 721–728. [Google Scholar] [CrossRef]
  71. Yan, C.; Zhang, Y.; Li, Y.; Wang, Y. Co-movement between Carbon Emissions and Forex Market: A Tale of COVID-19 Outbreak and Russia-Ukraine Invasion. Energy Econ. 2022, 112, 106–120. [Google Scholar] [CrossRef]
  72. Tsioptsia, K.-A.; Zafeiriou, E.; Niklis, D.; Sariannidis, N.; Zopounidis, C. The Corporate Economic Performance of Environmentally Eligible Firms Nexus Climate Change: An Empirical Research in a Bayesian VAR Framework. Energies 2022, 15, 7266. [Google Scholar] [CrossRef]
  73. Banbura, M.; Giannone, D.; Reichlin, L. Large Bayesian vector auto regressions. J. Appl. Econom. 2010, 25, 71–92. [Google Scholar] [CrossRef]
  74. Litterman, R.B. Forecasting with Bayesian vector autoregressions—Five years of experience. J. Bus. Econ. Stat. 1986, 4, 25–38. [Google Scholar]
  75. Pesaran, M.H.; Shin, Y. Generalized impulse response analysis in linear multivariate models. Econ. Lett. 1998, 58, 17–29. [Google Scholar] [CrossRef]
  76. Brahmasrene, T.; Huang, J.; Sissoko, Y. Effect of economic growth on carbon dioxide emissions in China: Empirical evidence from the ARDL approach. Int. J. Econ. Financ. 2014, 6, 140–147. [Google Scholar]
  77. Ivanov, V.; Kilian, L. A practitioner’s guide to lag order selection for VAR impulse response analysis. Stud. Nonlinear Dyn. Econom. 2005, 9. Available online: https://www.degruyterbrill.com/document/doi/10.2202/1558-3708.1219/html (accessed on 21 May 2025). [CrossRef]
  78. Jakada, A.H.; Usman, O.; Alola, A.A.; Bekun, F.V. The impact of renewable energy consumption on environmental sustainability in Sub-Saharan Africa. Environ. Res. Public Health 2022, 19, 1–18. [Google Scholar]
  79. Lanne, M.; Nyberg, H. Generalized forecast error variance decomposition for linear and nonlinear multivariate models. J. Econ. Dyn. Control. 2016, 62, 2–15. [Google Scholar] [CrossRef]
  80. Kingdom of Morocco. National Energy Strategy; Government of Morocco: Rabat, Morocco, 2009.
  81. World Bank. Morocco: Noor Solar Power Plant Project; World Bank: Washington, DC, USA, 2025; Available online: https://projects.worldbank.org/en/projects-operations/project-detail/P131256 (accessed on 21 May 2025).
  82. International Energy Agency. Morocco 2020—Energy Policy Review; IEA: Paris, France, 2020. [Google Scholar]
  83. United Nations Framework Convention on Climate Change (UNFCCC). Morocco’s First Nationally Determined Contribution under the Paris Agreement; United Nations Framework Convention on Climate Change: Bonn, Germany, 2016. [Google Scholar]
  84. Kingdom of Morocco. Updated Nationally Determined Contribution (NDC); Government of Morocco: Rabat, Morocco, 2020.
  85. Ministère de l’Énergie, des Mines et de l’Environnement. National Energy Efficiency Strategy; Government of Morocco: Rabat, Morocco, 2019.
  86. Organisation for Economic Co-operation and Development. OECD Economic Surveys: Morocco 2021; OECD Publishing: Paris, France, 2021. [Google Scholar]
  87. World Bank. Morocco Economic Monitor—From Recovery to Acceleration; World Bank: Washington, DC, USA, 2022. [Google Scholar]
  88. Renewable Energy Policy Network for the 21st Century. Renewables 2020 Global Status Report; REN21 Secretariat: Paris, France, 2020. [Google Scholar]
  89. European Commission. EU–Morocco Relations: Factsheet; European Commission: Brussels, Belgium, 2020. [Google Scholar]
  90. Ministère de l’Énergie, des Mines et de l’Environnement. Stratégie Nationale de Développement Durable—Résumé Exécutif; Government of Morocco: Rabat, Morocco, 2019.
  91. United Nations Environment Programme. Emissions Gap Report 2020; UNEP: Nairobi, Kenya, 2020. [Google Scholar]
  92. World Bank Group. Climate Risk Profile: Morocco; World Bank: Washington, DC, USA, 2021. [Google Scholar]
  93. International Energy Agency. Global Energy Review 2020; IEA: Paris, France, 2020. [Google Scholar]
  94. El-Katiri, L. Morocco’s Green Energy Opportunity; OCP Policy Center: Rabat, Morocco, 2016. [Google Scholar]
  95. Saidi, K.; Hammami, S. The Impact of CO2 Emissions and Economic Growth on Energy Consumption in 58 Countries. Energy Rep. 2022, 8, 1048–1058. [Google Scholar] [CrossRef]
  96. Cherkaoui, M.; Medromi, H.; El Ghazi, M. Modelling and Assessing the Performance of Hybrid PV-CSP Plants for Baseload Power Generation in Morocco. Int. J. Photoenergy 2019, 2019, 5783927. [Google Scholar]
  97. Omri, A.; Nguyen, D.K. On the Determinants of Renewable Energy Consumption: International Evidence. Energy 2014, 72, 554–560. [Google Scholar] [CrossRef]
  98. Acemoglu, D.; Aghion, P.; Bursztyn, L.; Hemous, D. The Environment and Directed Technical Change. Am. Econ. Rev. 2012, 102, 131–166. [Google Scholar] [CrossRef]
  99. Meadowcroft, J. What about the Politics? Sustainable Development, Transition Management, and Long-Term Energy Transitions. Policy Sci. 2009, 42, 323–340. [Google Scholar] [CrossRef]
  100. Scoones, I.; Leach, M.; Newell, P. The Politics of Green Transformations; Routledge: London, UK, 2015. [Google Scholar]
  101. International Renewable Energy Agency (IRENA). World Energy Transitions Outlook: 1.5 °C Pathway; IRENA: Abu Dhabi, United Arab Emirates, 2021; Available online: https://www.irena.org/publications/2021/Jun/World-Energy-Transitions-Outlook (accessed on 21 May 2025).
  102. North, D.C. Institutions, Institutional Change and Economic Performance; Cambridge University Press: Cambridge, UK, 1990. [Google Scholar]
  103. Kaufmann, D.; Kraay, A.; Mastruzzi, M. Governance Matters VIII: Aggregate and Individual Governance Indicators 1996–2008; World Bank Policy Research Working Paper No. 4978; World Bank: Washington, DC, USA, 2009. [Google Scholar] [CrossRef]
  104. World Bank. Sustainability Review 2023; The World Bank: Washington, DC, USA, 2023; Available online: https://openknowledge.worldbank.org (accessed on 21 May 2025).
  105. International Renewable Energy Agency (IRENA). World Energy Transitions Outlook 2022: 1.5 °C Pathway; IRENA: Abu Dhabi, United Arab Emirates, 2022; Available online: https://www.irena.org (accessed on 21 May 2025).
  106. World Bank. World Development Indicators; World Bank: Washington, DC, USA, 2025; Available online: https://databank.worldbank.org/source/world-development-indicators (accessed on 21 May 2025).
  107. Global Carbon Atlas. CO2 Emissions; Global Carbon Atlas. Laboratoire des Sciences du Climat et de l’Environnement (LSCE), Gif-sur-Yvette, France, 2025. Available online: http://www.globalcarbonatlas.org/en/CO2-emissions (accessed on 21 May 2025).
  108. Roser, M.; Ritchie, H.; Ortiz-Ospina, E. Our World in Data; Global Change Data Lab: Oxford, UK, 2025; Available online: https://ourworldindata.org/ (accessed on 21 May 2025).
  109. International Energy Agency. Data and Statistics; IEA: Paris, France, 2025; Available online: https://www.iea.org/data-and-statistics (accessed on 21 May 2025).
  110. International Renewable Energy Agency. Statistics; IRENA: Abu Dhabi, United Arab Emirates, 2025; Available online: https://www.irena.org/Statistics (accessed on 21 May 2025).
  111. BP. Statistical Review of World Energy; BP: London, UK, 2025; Available online: https://www.bp.com/en/global/corporate/energy-economics/statistical-review-of-world-energy.html (accessed on 21 May 2025).
  112. International Energy Agency. Electricity Information; IEA: Paris, France, 2023; Available online: https://www.iea.org/reports/electricity-information-2023 (accessed on 21 May 2025).
  113. U.S. Energy Information Administration. International Data; U.S. EIA: Washington, DC, USA, 2025. Available online: https://www.eia.gov/international/data/world (accessed on 21 May 2025).
  114. World Bank. Worldwide Governance Indicators; World Bank: Washington, DC, USA, 2025; Available online: https://info.worldbank.org/governance/wgi/ (accessed on 21 May 2025).
  115. Institute for Economics and Peace. Global Peace Index; IEP: Sydney, Australia, 2025; Available online: https://www.economicsandpeace.org/reports/ (accessed on 21 May 2025).
  116. Marsh McLennan. Political Risk Map; Marsh McLennan: New York, NY, USA, 2025; Available online: https://www.marsh.com/us/services/political-risk/insights/political-risk-map.html (accessed on 21 May 2025).
  117. International Monetary Fund. World Economic Outlook; IMF: Washington, DC, USA, 2025; Available online: https://www.imf.org/en/Publications/WEO (accessed on 21 May 2025).
  118. Organisation for Economic Co-operation and Development. OECD Economic Outlook; OECD Publishing: Paris, France, 2025; Available online: https://www.oecd.org/economic-outlook/ (accessed on 21 May 2025).
  119. United Nations. UN Data; United Nations: New York, NY, USA, 2025. Available online: https://data.un.org/ (accessed on 21 May 2025).
Figure 1. BVAR methodology: A step-by-step analytical framework for economic and environmental assessment. source; own elaboration.
Energies 18 02759 g001
Figure 2. Accumulated response to generalized one S.D. Innovations—Morocco: (a) CO2 emissions; (b) economic growth; (c) political stability; (d) renewable energy consumption; (e) renewable energy output; (f) regulatory quality.
Energies 18 02759 g002
Figure 3. Variance decomposition using Cholesky (d.f. adjusted) factors—Morocco: (a) CO2 emissions; (b) economic growth; (c) political stability; (d) renewable energy consumption; (e) renewable energy output; (f) regulatory quality. The decomposition results suggest that CO2 emissions in Morocco (MOR_ECO2) are primarily influenced by their own historical values, indicating a high level of self-determination. However, over time, a gradual but increasing contribution from renewable energy consumption and regulatory quality has been observed. This finding suggests that Morocco’s ongoing environmental policies and clean energy initiatives are beginning to impact emissions trends. While the overall effect remains relatively small, it reinforces the notion that strengthening environmental regulations and accelerating clean energy adoption could play a significant role in reducing emissions in the long term.
Energies 18 02759 g003
Figure 4. Accumulated response to generalized one S.D. innovations—Egypt: (a) regulatory quality; (b) renewable energy consumption; (c) renewable energy output; (d) economic growth; (e) political stability; (f) CO2 emissions.
Energies 18 02759 g004
Figure 5. Variance decomposition using Cholesky (d.f. adjusted) factors—Egypt: (a) regulatory quality; (b) renewable energy consumption; (c) renewable energy output; (d) economic growth; (e) political stability; (f) CO2 emissions.
Energies 18 02759 g005
Figure 6. Accumulated response to generalized one S.D. Innovations—Oman: (a) CO2 emissions; (b) GDP per capita; (c) regulatory quality; (d) political stability.
Energies 18 02759 g006
Figure 7. Variance decomposition using Cholesky (d.f. adjusted) factors—Oman: (a) CO2 emissions; (b) GDP per capita; (c) regulatory quality; (d) political stability.
Energies 18 02759 g007
Table 1. Renewable energy investments.
CountryRenewable Energy TargetMajor ProjectsChallengesGovernment IncentivesInvestment FiguresKey Insights
Morocco- 52% by 2030 [10,11]
- 80% by 2050
- Noor Ouarzazate Solar Complex (580 MW)—One of the world’s largest solar plants [11,21]
- Midelt Hybrid Solar-Wind Project
- Combining solar and wind energy
- Requires improved energy storage solutions to enhance grid stability.- Sovereign green bonds to finance renewable projects
- State subsidies for renewable energy development
- Private investment encouraged via PPPs
- Noor Ouarzazate Solar Complex: $2.5 billion
- Midelt Project: $2 billion
- Leads in renewable energy integration [9,18,60].
- 90% of fossil fuels are imported, being vulnerable to increasing energy security risks.
- Morocco’s proactive environmental policies and clean energy investments have successfully limited emissions growth despite economic expansion.
Egypt42% by 2035- Benban Solar Park (1.8 GW)—One of the largest globally [11,16,21]
- Gulf of Suez Wind Farm—Expanding wind capacity [10]
- High electricity demand still requires fossil fuel backup, slowing full-scale adoption.
- The EKC hypothesis suggests emissions will decline with higher income levels, but targeted policy interventions are required
- Feed-in tariffs for renewable energy producers
- Tax incentives for private sector investment in renewables
- Public–private partnerships (PPPs) encouraged
- 30% tax break for renewable energy investments
- Benban Solar Park: $4 billion
- Wind energy projects: $1.5 billion+
-Progressing but remains reliant on fossil fuels [6,57]
-Grid enhancement is required to include renewable sources efficiently.
-Hydrogen Economy Leader across MENA, securing partnerships for hydrogen-based ammonia production.
Oman10% by 2025, 35% by 2040 [11]- Ibri Solar Plant (500 MW) [11]
- Dhofar Wind Project (50 MW)
[21]
- Policy and infrastructure gaps delay large-scale adoption.- No subsidies for renewables, but tax exemptions for green projects
- Foreign investment encouraged in hydrogen sector
- Green Hydrogen Projects: $140 billion planned by 2050
- Ibri Solar Plant: $400 million
[8]
- Transition is slow, but hydrogen investments provide future potential [7,17].
- Lack of transmission infrastructure delays the relevant renewable integration.
- Water scarcity, relying on energy-intensive desalination is a major obstacle.
Table 2. Sustainability and future outlook.
CategoryMoroccoEgyptOman
Economic Growth and EnergyWeak correlation—economic growth is independent of fossil fuel useNegative correlation—more energy use does not always boost GDPPositive correlation—energy use drives GDP growth
Carbon EmissionsLower emissions growth, strong decarbonization effortsRising CO2 emissions linked to GDP growthHighest CO2 per capita in MENA
Renewable EnergyRegional leader, major solar and wind projects, decoupling energy from GDPExpanding solar and wind, green hydrogen investmentsHydrogen hub, solar and wind growth, surpassing 2030 targets
Policy EffectivenessMost successful in green energy transitionThe government is actively promoting renewables but still reliant on fossil fuelsProgressing towards renewables but remains highly carbon-intensive
Table 3. Selected variables per country.
MoroccoEgyptOmanVariable
MOR_ECO2EGY_ECO2OMN_ECO2 CO2 Emissions (kg per PPP $ of GDP)
MOR_RES_CONEGY_RES_CON Renewable Energy Consumption
(% of Total Final Energy Consumption)
MOR_RES_OUTEGY_RES_OUT Renewable Electricity Output
(% of Total Electricity Output)
MOR_RQEGY_RQOMN_RQRegulatory Quality
(World Bank Estimate)
MOR_POL_ST_EGY_POL_ST_OMN_POLSTABPolitical Stability and Absence of
Violence/Terrorism (World Bank Estimate)
MOR_GDP_GR_EGY_GDP_GR_OMN_GDP_CONGDP Growth (Annual %)
Table 4. Break point unit root tests—Morocco.
VariablesBreakADF Test Results (Level)ADF Test Results (First Differences)Rank of Integration
MOR_ECO22018, 2019−2.6109
(0.865)
−17.9
(<0.01) ***
I(1)
MOR_GDP_GR_2020−13.068
(<0.01) ***
=I(0)
MOR_POL_ST_2013, 2015−4.4312 *
(0.052) **
−7.6325
(<0.01) ***
I(1)
MOR_RES_CON2019,
2016
−2.916
(0.7311)
−5.155
(0.05) **
I(1)
MOR_RES_OUT2013, 2013−5.1555 *
(0.0531) *
−6.483
(<0.01) ***
I(0)
*, **, *** reject of null hypothesis of unit root test at 10, 5 and 1%, respectively.
Table 5. BVAR estimation Model—Morocco. Prior type: Litterman/Minnesota, Hyper-parameters: Mu1: 1, L1: 0.1, L2: 0.99, L3: 1, L4: inf.
MOR_ECO2MOR_GDP_GR_MOR_POL_ST_MOR_RES_CONMOR_RES_OUTMOR_RQ
MOR_ECO2(−1)0.992440 (0.09496)−1.797406
(4.96602)
−0.006910
(0.12397)
−0.235290
(5.30593)
−0.081109 (7.29555)−0.000559 (0.13942)
MOR_ECO2(−2)0.000424
(0.04960)
0.441436
(2.59165)
−0.004104
(0.06470)
0.080032
(2.76879)
−0.018014
(3.80735)
−0.005751
(0.07276)
MOR_GDP_GR_(−1)5.29 × 10⁻⁵
(0.00182)
0.915068
(0.09683)
0.000384
(0.00239)
0.006601
(0.10247)
−0.001537
(0.14091)
0.000425
(0.00269)
MOR_GDP_GR_(−2)3.59 × 10⁻⁶
(0.00093)
0.009264
(0.04967)
−0.000151
(0.00123)
−0.001067
(0.05254)
0.002062
(0.07225)
−7.62 × 10⁻⁵
(0.00138)
MOR_POL_ST_(−1)−0.005794
(0.07295)
−0.284033
(3.84961)
0.959020
(0.09701)
−0.326851
(4.11271)
−1.762564
(5.65540)
−0.038827
(0.10808)
MOR_POL_ST_(−2)−0.001742
(0.03724)
0.149840
(1.96503)
−0.000275
(0.04954)
0.102117
(2.09932)
−0.127685
(2.88680)
0.003842
(0.05517)
MOR_RES_CON(−1)4.44 × 10⁻⁵
(0.00163)
−0.019414
(0.08625)
−0.000611
(0.00215)
0.992634
(0.09294)
−0.005531
(0.12670)
−0.000195
(0.00242)
MOR_RES_CON(−2)1.68 × 10⁻⁵
(0.00087)
0.008394
(0.04572)
−4.71 × 10⁻⁵
(0.00114)
−0.000932
(0.04933)
0.002715
(0.06717)
3.57 × 10⁻⁵
(0.00128)
MOR_RES_OUT(−1)0.000278
(0.00122)
−0.002691
(0.06417)
4.16 × 10⁻⁵
(0.00160)
0.010941
(0.06856)
0.972347
(0.09514)
−0.000409
(0.00180)
MOR_RES_OUT(−2)6.93 × 10⁻⁵
(0.00063)
0.003013
(0.03331)
−5.32 × 10⁻⁵
(0.00083)
0.001709
(0.03559)
−0.005196
(0.04943)
−5.10 × 10⁻⁵
(0.00094)
MOR_RQ
(−1)
−0.001348
(0.06454)
0.135658
(3.40566)
0.001012
(0.08502)
−0.134909
(3.63852)
−0.121144
(5.00319)
0.964521
(0.09651)
MOR_RQ
(−2)
0.003100
(0.03310)
0.099654
(1.74681)
0.005674
(0.04361)
0.268330
(1.86620)
−0.270890
(2.56621)
2.60 × 10⁻⁵
(0.04953)
C−0.019862
(0.05186)
0.436770
(2.73316)
−0.001444
(0.06848)
−0.873271
(2.92249)
−1.081073
(4.01557)
0.000197
(0.07675)
R-squared0.672774−1.365009−0.2052070.7491020.4585900.126819
Adj.
R-squared
0.018321−6.095027−2.6156220.247306−0.624231−1.619543
Notes:(−1), (−2) denotes one and two lags of the variables employed, Standard errors in ( ).
Table 6. Break point unit root tests—Egypt.
VariablesBreakADF Test Results (Level)ADF Test Results
(First Differences)
Rank of Integration
EGY_ECO22019, 2020−3.65
(0.303)
−12.82 ***
(<0.01)
I(1)
EGY_GDP_GR_2010,
2011
−4.474 **
(0.046)
−7.973 ***
(<0.01)
I(1)
EGY_POL_ST_2009−5.078 ***
(<0.01)
-I(0)
EGY_RES_CON2018,
2019
−1.803565
>0.99
−13.15 ***
(<0.01)
I(1)
EGY_RES_OUT2015,−1.781
(>0.99)
EGY_RQ2001,
2019
−3.372
(0.459)
−3.978 **
(0.035)
I(1)
**, *** reject of unit root test null hypothesis for 5 and 1%, respectively.
Table 7. BVAR estimation Model—Egypt. Prior type: Litterman/Minnesota, Hyper-parameters: Mu1: 1, L1: 0.1, L2: 0.99, L3: 1, L4: inf.
EGY_RQEGY_RES_CONEGY_RES_OUTEGY_GDP_GR_EGY_POL_ST_EGY_ECO2
EGY_RQ(−1)0.989280
(0.09329)
0.147267
(0.87490)
0.242005
(1.37354)
−0.248353
(0.98564)
−0.061265
(0.13423)
0.002882
(0.03349)
EGY_RQ(−2)−0.007828
(0.04916)
0.048494
(0.46057)
0.038165
(0.72302)
−0.046960
(0.51887)
−0.017188
(0.07066)
0.001234
(0.01763)
EGY_RES_
CON(−1)
−0.003546
(0.00994)
0.988608
(0.09487)
−0.010383
(0.14759)
−0.018307
(0.10591)
−0.001052
(0.01442)
−0.000281
(0.00360)
EGY_RES_
CON(−2)
−0.001030
(0.00519)
−0.000956
(0.04956)
−0.000967
(0.07703)
−0.005523
(0.05528)
−3.13 × 10⁻⁵
(0.00753)
7.77 × 10⁻⁸
(0.00188)
EGY_RES_
OUT(−1)
−0.002786
(0.00577)
0.017611
(0.05464)
0.976505
(0.08642)
0.001810
(0.06154)
−0.001844
(0.00838)
0.000810
(0.00209)
EGY_RES_
OUT(−2)
−0.000660
(0.00322)
0.004940
(0.03051)
−0.005023
(0.04835)
−0.000286
(0.03437)
−0.000596
(0.00468)
0.000272
(0.00117)
EGY_GDP_GR_(−1)0.002054
(0.00897)
−0.011431
(0.08489)
−0.005481
(0.13327)
0.970003
(0.09654)
0.000924
(0.01302)
−0.000419
(0.00325)
EGY_GDP_GR_(−2)0.000341
(0.00460)
−0.002318
(0.04354)
0.002175
(0.06834)
−0.006859
(0.04953)
−0.000144
(0.00668)
−0.000131
(0.00167)
EGY_POL_
ST_(−1)
0.036276
(0.06211)
−0.050099
(0.58762)
0.134221
(0.92251)
−0.060570
(0.66204)
0.974766
(0.09091)
−0.000947
(0.02249)
EGY_POL_
ST_(−2)
0.004793
(0.03328)
−0.008942
(0.31487)
0.069822
(0.49430)
−0.039700
(0.35473)
−0.007523
(0.04877)
−2.42 × 10⁻⁵
(0.01205)
EGY_ECO2
(−1)
−0.099835
(0.25635)
−0.129800
(2.42565)
−0.050851
(3.80779)
−0.480708
(2.73231)
−0.037366
(0.37208)
0.994735
(0.09366)
EGY_ECO2
(−2)
−0.030762
(0.13529)
−0.010146
(1.27998)
0.012107
(2.00932)
−0.228431
(1.44198)
−0.003012
(0.19636)
−0.000441
(0.04948)
C0.134670
(0.14743)
−0.369081
(1.39446)
−0.080617
(2.18861)
0.357698
(1.57114)
−0.065984
(0.21427)
−0.017164
(0.05339)
R-squared0.7396510.7235030.8774150.1970530.7551260.792501
Adj. R-squared0.2189540.170500.632244−1.4088400.2653780.377502
(−1), (−2) one and two lags, respectively, Standard errors in ( ).
Table 8. Break point unit root tests—Oman.
VariablesBreakADF Test Results (Level)ADF Test Results (First Differences)Rank of Integration
OMN_GDP_CON2021,
2019
−1.758
(>0.99)
−5.153540 ***
(<0.01)
I(1)
OMN_ECO22007−4.824 **
(0.0325)
-I(0)
OMN_RQ2002−7.418248 ***
(<0.01)
-I(0)
OMN _POLSTAB2014−4.659 *
(0.0861)
−5.7 ***
(0.01)
I(1)
*, **,*** reject of null hypothesis of unit root test at 10, 5 and 1% level of significance.
Table 9. BVAR estimation Model—Oman. Prior type: Litterman/Minnesota. Initial residual covariance: Univariate AR. Hyper-parameters: Mu1: 1, L1: 0.1, L2: 0.99, L3: 1, L4: inf. Standard errors in ().
OMN_ECO2OMN_GDP_CONOMN_RQPOLSTAB
OMN_ECO2(−1)0.975027
(0.09532)
4076.170
(5051.41)
0.017967
(0.10716)
−0.004146
(0.09268)
OMN_ECO2(−2)−0.005973
(0.04976)
−374.7045
(2634.76)
−0.004074
(0.05589)
−0.001942
(0.04834)
OMN_GDP_CON(−1)3.12 × 10⁻⁷
(1.8 × 10⁻⁶)
1.029574
(0.09893)
2.52 × 10⁻⁸
(2.1 × 10⁻⁶)
−2.82 × 10⁻⁸
(1.8 × 10⁻⁶)
OMN_GDP_CON(−2)7.18 × 10⁻⁸
(9.2 × 10⁻⁷)
0.005895
(0.04990)
6.72 × 10⁻⁹
(1.0 × 10⁻⁶)
1.91 × 10⁻⁹
(9.1 × 10⁻⁷)
OMN_RQ(−1)0.031312
(0.08263)
432.0333
(4419.38)
0.955892
(0.09460)
0.017585
(0.08109)
OMN_RQ(−2)0.013147
(0.04304)
510.1810
(2301.61)
−0.008048
(0.04930)
−0.002245
(0.04223)
POLSTAB(−1)0.009791
(0.08713)
3546.417
(4659.70)
−0.042558
(0.09886)
0.952629
(0.08614)
POLSTAB(−2)0.000983
(0.04878)
460.0289
(2608.84)
−0.008599
(0.05534)
−0.020531
(0.04832)
C−0.051744
(0.11781)
−8052.580
(6316.94)
0.039759
(0.13364)
0.010881
(0.11571)
R-squared0.3390790.5195170.2358970.703976
Adj. R-squared−0.2484060.092421−0.4433050.440843
Disclaimer/Publisher’s Note: The statements, opinions and data contained in all publications are solely those of the individual author(s) and contributor(s) and not of MDPI and/or the editor(s). MDPI and/or the editor(s) disclaim responsibility for any injury to people or property resulting from any ideas, methods, instructions or products referred to in the content.

