Abstract
Accurate dynamic reserve estimation is essential for effective reservoir development, particularly in fractured vuggy carbonate reservoirs characterized by complex pore structures, multiple spatial scales, and pronounced heterogeneity. Traditional reserve evaluation methods often struggle to account for the coupled behavior of pores, fractures, and vugs, leading to limited reliability. In this study, a modified material balance equation is proposed that explicitly considers the contributions of matrix pores, fractures, and vugs, as well as the influence of varying aquifer multiples. To validate the model, physical experiments were conducted using cores with different fracture–vug configurations under five distinct aquifer multiples. A field case analysis was also performed using production data from representative wells in the Fuman Oilfield. The results demonstrate that the proposed model achieves a fitting accuracy exceeding 94%, effectively capturing the dynamics of fractured vuggy systems with active water drive. The model enables quantitative evaluation of single-well reserves and aquifer multiples, providing a reliable basis for estimating effective recoverable reserves. Furthermore, by comparing simulated formation pressures (excluding aquifer effects) with actual static pressures, the contribution of external aquifer support to reservoir energy can be quantitatively assessed. This approach offers a practical and robust framework for reserve estimation, pressure diagnosis, and development strategy optimization in strongly water-driven fractured vuggy reservoirs.
1. Introduction
The fractured vuggy carbonate reservoirs in the Tarim Basin exhibit diverse types of reservoir space and significant variations in scale. These types range from micron-scale intergranular dissolution pores and intercrystallite pores within the matrix to large-scale dissolution cavities that can span tens of meters, resulting in pronounced heterogeneity [1,2,3,4,5,6]. The dynamic estimation of reserves in such reservoirs has long been a key focus of reservoir development efforts. The primary theoretical methods for dynamic reserve estimation include the material balance method [7,8,9,10], the well-test analysis method [11,12], and the production transient analysis method [13,14,15]. Notably, the well-test analysis method is highly sensitive to reservoir heterogeneity, which complicates the differentiation between oil and water phases, thereby reducing the accuracy of interpretation. Conversely, the production transient analysis method utilizes dynamic production data collected during the natural flow stage. While it allows for corrections based on measured flowing pressure data, it is highly influenced by production rate fluctuations and the accuracy of pressure conversions. In contrast, the material balance method is applicable to various reservoir types and provides high computational accuracy, although it requires substantial static pressure data and accurate knowledge of the reservoir recovery factor.
Fractured vuggy carbonate reservoirs are characterized by a variety of reservoir bodies, which include the development of large dissolution cavities, dissolution pores, and multi-scale fractures. These reservoirs exhibit strong heterogeneity and complex flow behavior, often requiring the equivalent treatment of certain parameters to facilitate calculations. Lv et al. [16] proposed a method for evaluating well-controlled reserves in fractured vuggy reservoirs based on the Pressure Derivative Analysis (PDA) method. They fitted multiple typical curves using the PDA method and improved accuracy by correcting bottom-hole flowing pressures, refining well-controlled boundaries, and calculating PVT properties under pseudo-steady state conditions. This method effectively utilizes both dynamic and static data from single wells to enable multi-curve fitting for dynamic testing and production data analysis. While the method achieves high accuracy for specific reservoirs, its applicability is limited by the extensive production data required for fitting.
Yu et al. [17,18,19] developed a coupled seepage-free flow mathematical model based on the production transient analysis method using actual production data from oil wells. In this approach, the large-scale vuggy reservoir is conceptualized as a dual-medium composite model, which consists of a large dissolution cavity surrounded by small-scale pore-fracture networks. The complex fluid flow within the surrounding small-scale pore-fracture systems is approximated using Darcy’s law. Solving this model yields production transient analysis curves for wells in fractured vuggy reservoirs and allows for sensitivity analysis of various parameters. However, the accuracy of the model requires further enhancement due to the equivalent treatment applied.
For fractured vuggy reservoirs, it is essential to establish mathematical models tailored to the specific characteristics of different reservoir types. Wan [20] proposed three distinct fractured vuggy combinations for carbonate reservoirs: (1) a single-pore and dual-vug spatial combination, (2) a dual-pore and dual-vug series combination, and (3) a dual-pore and dual-vug parallel combination. Jiao [14] integrated geological, logging, mud logging, drilling, completion, dynamic production, and well-testing data to develop well-test interpretation models for various subsurface fractured vuggy structural combinations. These models include (1) the well-fracture single-vug model, (2) the well-fracture dual-vug parallel model, and (3) the well-vug fractured vuggy series model. Fu Bing [15] addressed the issue of non-uniqueness in reservoir dynamic characterization when relying solely on well-test analysis or production transient analysis. To overcome this limitation, he proposed a comprehensive dynamic characterization method for carbonate reservoirs that integrates analytical and numerical well-testing with modern decline curve analysis. This approach allows multiple methods to constrain each other, facilitating a more accurate evaluation of the reservoir parameter.
Due to the complex distribution of reservoirs in fractured vuggy carbonate formations, the material balance equation, renowned for its high accuracy, is one of the most widely applied methods. Li et al. [21] proposed an improved material balance equation that incorporates dynamic production data and considers the characteristics of fractured vuggy carbonate reservoirs with confined aquifers. Their approach neglects irreducible water saturation and introduces confined aquifer saturation, integrating it with static reserve predictions to enhance the material balance equation. This method enables reasonable calculations of dynamic oil reserves and aquifer volume, even in cases where the oil–water contact position is unknown, and no measured PVT data are available. However, its applicability is limited, as it heavily relies on extensive dynamic data and disregards irreducible water saturation. Zhu et al. [22] developed a methodology for estimating the total recoverable reserves of well groups based on the Pressure Derivative Analysis (PDA) production data analysis approach. By fitting flow-normalized pressure and material balance time curves, they established a methodology for determining the total recoverable reserves in gas displacement well groups. Although this approach allows for reserve estimation using actual dynamic data, it is only applicable to gas displacement reservoirs that are unaffected by water influx. Song et al. [23] addressed the challenge of determining internal reservoir pressure variations by converting wellhead pressure into bottom-hole flowing pressure. Subsequently, reservoir pressure changes were calculated based on variations in bottom-hole flowing pressure to estimate the well-controlled reserves within injection-production units. This method accounts for the elastic behavior of vuggy media; however, its applicability is constrained by the multiple assumptions required for model construction.
Studies have shown that oil–water distribution within fractured vuggy reservoir systems, together with energy contributions from externally connected aquifers, has a significant impact on reserve calculations using the material balance equation. Li et al. [24] addressed the challenges associated with evaluating reservoir energy in fractured vuggy units, owing to the complex fluid distribution and flow dynamics in these reservoirs. They classified the drive mechanisms into four types: (1) closed elastic drive, (2) elastic drive with aquifer influx, (3) elastic drive with confined aquifers, and (4) elastic drive with both confined aquifers and aquifer influx. For each drive type, they formulated a corresponding material balance equation to characterize reservoir energy and drive mechanisms and quantitatively calculate energy contributions and water influx. Ma et al. [25] derived a material balance equation for fractured vuggy reservoirs based on fundamental principles of reservoir material balance. Their model incorporates formation pressure variations and elastic expansion through the introduction of compressibility coefficients. This model accounts for both oil and water phases and is applicable to reserve estimation in reservoirs influenced by aquifer influx, water injection, or confined aquifers. Li et al. [26] developed a theoretical framework for dynamic reserve evaluation under pseudo-steady-state aquifer influx, integrating the Blasingame method with the flowing material balance approach. They proposed a methodology to dynamically identify aquifer influx and quantitatively assess both reserves and aquifer size. Their approach evaluates dynamic reserves using production data prior to water influx and determines aquifer size using production data from the early stage of water influx. Shahamat and Clarkson [27] proposed a novel flowing material balance method for naturally fractured reservoirs that incorporates flowing pressure and distinguishes between matrix and fracture pressure behaviors. This method enhances the accuracy of original oil in place (OOIP) estimation by addressing the limitations of conventional single-porosity models and emphasizing the significance of fracture–matrix interaction. Le et al. [28,29,30] introduced the aquifer water–reservoir oil ratio (Rwo) as a parameter to derive a material balance equation for calculating dynamic reserves in fractured vuggy reservoirs. This equation translates aquifer energy into the magnitude of Rwo, allowing for the analysis of aquifer size connected to the fractured vuggy reservoir body and facilitating dynamic reserve estimation. This method considers the effects of both internal oil–water systems and external aquifers connections. The material balance equations established by Li [24] and Ma [25] provide a well-defined classification framework, offering high-precision models for various reservoir types. Li’s flowing material balance method [26] enhances practical applicability by integrating it with the Blasingame method for evaluation. Furthermore, Le’s approach [28], which utilizes Rwo to describe aquifer energy strength, refines the compressibility coefficient to improve estimation accuracy. However, these material balance equations are limited to an oil–water two-phase system and do not account for supersaturated conditions or the presence of a gas cap due to oil degassing. The detailed formation is shown in Table 1.

Table 1.
Application of the material balance method in statistics.
In recent years, material balance models for reserve estimation in fractured vuggy reservoirs have become increasingly refined, with various methods introduced to enhance computational accuracy and adaptability. These advancements have significantly improved the modeling of reservoir performance. However, existing approaches still fall short of fully capturing the inherent complexity of fractured vuggy systems, particularly the coupled behavior of pores, fractures, and vugs, which varies across different scales and connectivity. Moreover, the contribution of edge and bottom aquifers to reservoir energy during production remains insufficiently characterized, leading to uncertainties in reserve calculations.
Accurate quantification of reserves and aquifer support is critical for the efficient development of fractured vuggy reservoirs, especially under conditions influenced by water influx. To address this issue, the present study systematically considers the spatial distribution and volumetric matching relationships among pores, fractures, and vugs while also incorporating the dynamic influence of aquifer systems. A series of physical simulation experiments was conducted to assess recoverable reserves under varying water influx multiples. Based on the experimental observations, a corresponding material balance equation was established for fractured vuggy reservoirs, enabling the estimation of single-well reserves and associated water influx multiples. Additionally, the study analyzed depletion patterns under varying aquifer support conditions to quantify the extent of external water contribution to reservoir energy maintenance. These findings not only enhance the understanding of multi-scale flow behaviors and aquifer interactions in complex carbonate systems but also provide a theoretical basis for optimizing reserve estimation and improving the development strategies for fractured vuggy reservoirs.
2. Data and Methods
The Fuman Oilfield, located in the Tarim Basin, is a typical fault-controlled carbonate reservoir system. It is characterized by substantial oil column thickness, complex structural features, and significant reservoir heterogeneity. The reservoir structure is dominated by major trunk faults with significant vertical extensions ranging from 90 to 330 m, in sharp contrast to subsidiary branches, which extend only 10 to 80 m. This pronounced vertical disparity reflects a strong degree of vertical connectivity, which facilitates efficient vertical fluid migration and pressure communication throughout the reservoir. The fault zones are associated with substantial aquifer energy, particularly in areas connected to the main faults and structural highs.
Reservoir zones located near main trunk faults, uplifted positive landforms, and long bead-like well patterns demonstrate excellent pressure maintenance, with formation pressures consistently above 95% and oil production per unit pressure drop generally exceeding 4200 t. In comparison, zones linked to subsidiary faults and short, discontinuous well patterns show weaker aquifer support, with formation pressure typically maintained between 65% and 85%. This comparison highlights the significant influence of structural configuration on both reservoir energy and production performance.
Despite the generally poor matrix quality—reflected in low porosity (<5%) and ultra-low permeability (<1 mD)—the reservoir exhibits highly heterogeneous characteristics due to the presence of well-developed fractured vuggy zones. These zones, often distributed along fault belts, exhibit significantly enhanced reservoir properties by several orders of magnitude. The fluid flow is primarily governed by a fault–fracture–cavity system, with fractured vuggy bodies forming horizontally banded patterns and vertically bead-like accumulations, which contribute to the formation of preferential flow channels and localized high-productivity zones.
The Fuman Reservoir is classified as a medium-deep system, with reservoir temperatures ranging from 146.93 to 153.86 °C and pressures between 82.35 and 84.82 MPa. The reservoir fluid comprises both volatile oil and undersaturated crude oil, with an average surface oil density of 0.8243 g/cm3 and a gas–oil ratio (GOR) of approximately 440 m3/t. Due to the low saturation pressure, the reservoir exhibits a substantial pressure differential under in situ conditions, ranging from 38.15 to 68.53 MPa. This large drawdown not only promotes rapid oil production in the early stages but also introduces challenges in managing pressure depletion and secondary recovery planning.
2.1. Experimental Cores and Samples
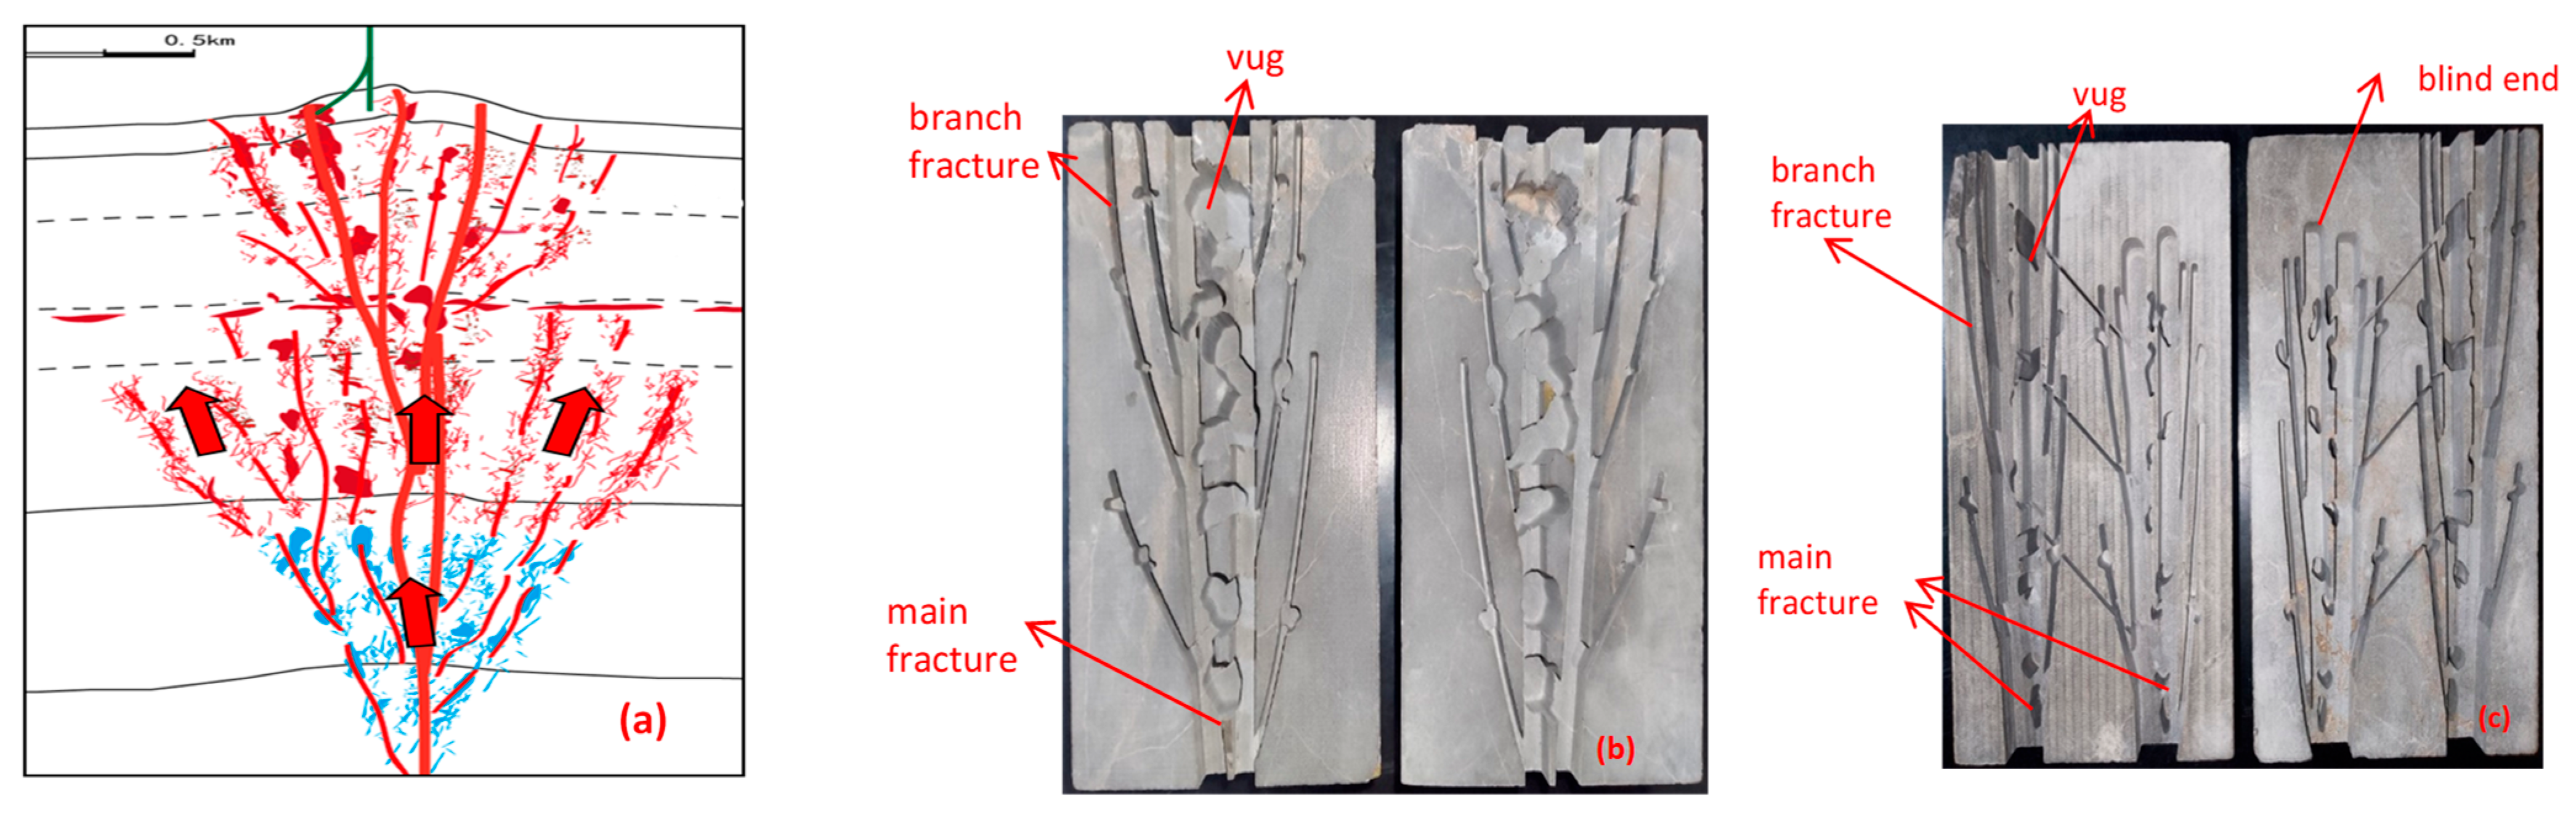
This study focuses on a fault-controlled fractured vuggy reservoir that exhibits strong heterogeneity and a highly complex distribution of fractures and vugs. Due to the challenges associated with obtaining representative cores from such reservoirs, artificially carved cores were designed and fabricated to replicate the structural features of fractured vuggy systems. To ensure geological representativeness, outcrop cores were carefully selected based on three criteria: lithological similarity to the target reservoir, comparable diagenetic evolution, and analogous pore–fracture–vug development characteristics. Referring to the reservoir profile schematic (Figure 1a), two distinct core models were designed. The first model, a single-fracture–vug core, consists of one main fracture, several branch fractures, and interconnected vugs. The second model, a multi-fracture–vug core, includes two main fractures, a blind-end fracture, multiple branch fractures, and three high-angle connecting fractures oriented at approximately 65°.
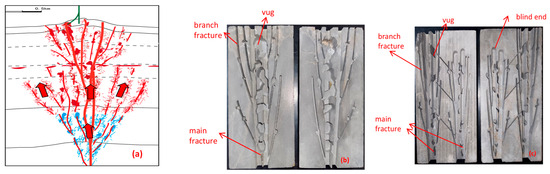
Figure 1.
A digitized schematic of the reservoir profile (a) and physical images of a single- and multi-fracture–vug core (b,c), respectively.
Each core sample was machined to standardized dimensions of 10 cm in diameter and 15 cm in length, as shown in Figure 1b,c. The internal geometries of the fracture–vug systems were digitally constructed using AutoCAD (version 2020) based on geological cross-section interpretations and then precisely fabricated via Computer Numerical Control (CNC) machining. This approach ensured high consistency between the designed structures and the final physical models, allowing for reproducible laboratory experiments to evaluate flow behavior and recovery performance in complex fractured vuggy media.
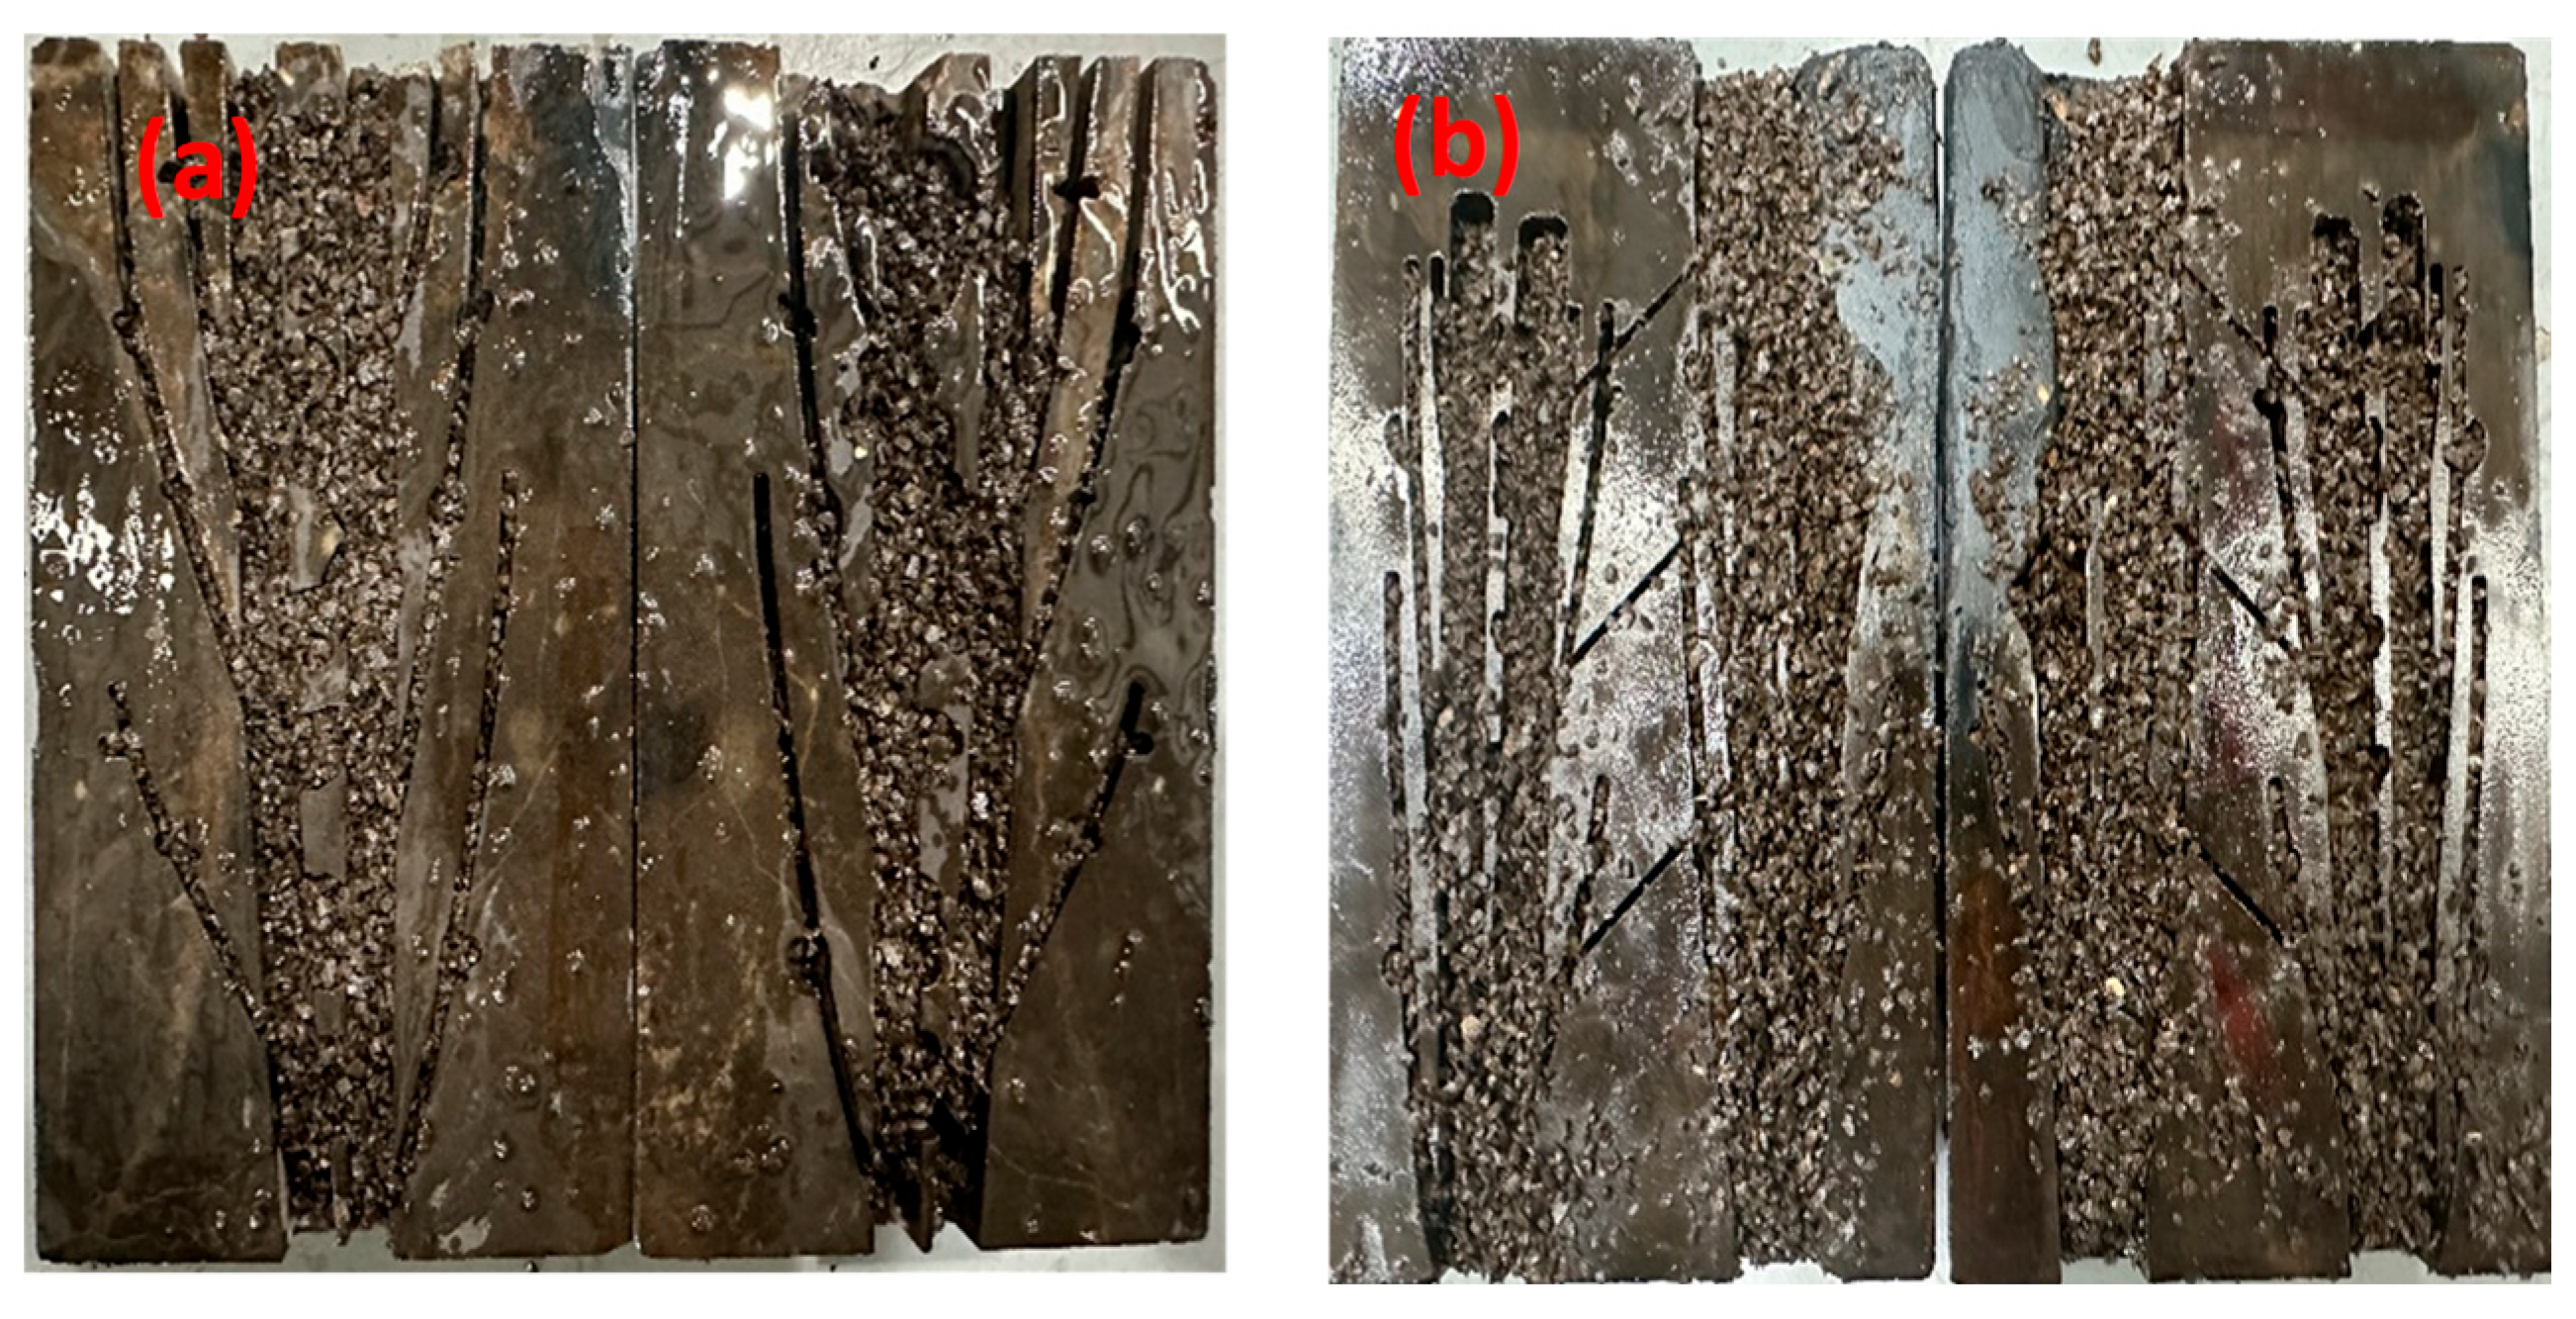
According to standard laboratory procedures for core property measurement, the prepared single-fracture–cavity core exhibited a porosity of 11.21% and a permeability of 927 mD. The corresponding values for the multi-fracture–vug core were slightly higher, with a porosity of 11.96% and a permeability of 833.8 mD. To better reproduce the heterogeneity observed in actual fractured vuggy reservoirs, the internal cavities of both core types were filled with rock fragments. The fill material was designed based on well-test data to approximate reservoir matrix properties and flow resistance. A mixture of 10–14 mesh and 16–20 mesh rock cuttings was prepared in a 1:1 mass ratio and used as the packing medium.
After filling, the physical properties of the cores were re-measured. The sand-filled single-fracture–vug core exhibited a porosity of 5.60% and a permeability of 61.2 mD, while the multi-fracture–vug core showed a porosity of 5.76% and a permeability of 59.6 mD. These adjusted values are more representative of reservoir-scale flow conditions and ensure realistic resistance during displacement experiments. The final sand-filled core models are illustrated in Figure 2.
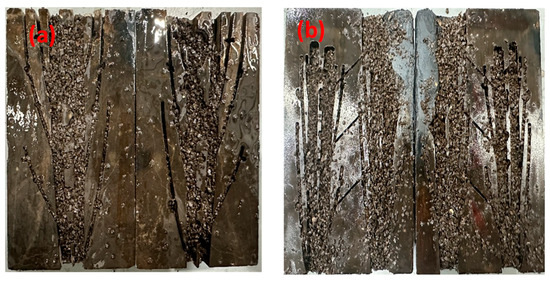
Figure 2.
Sand-filled single-fracture–vug core (a) and multi-fracture–vug core (b).
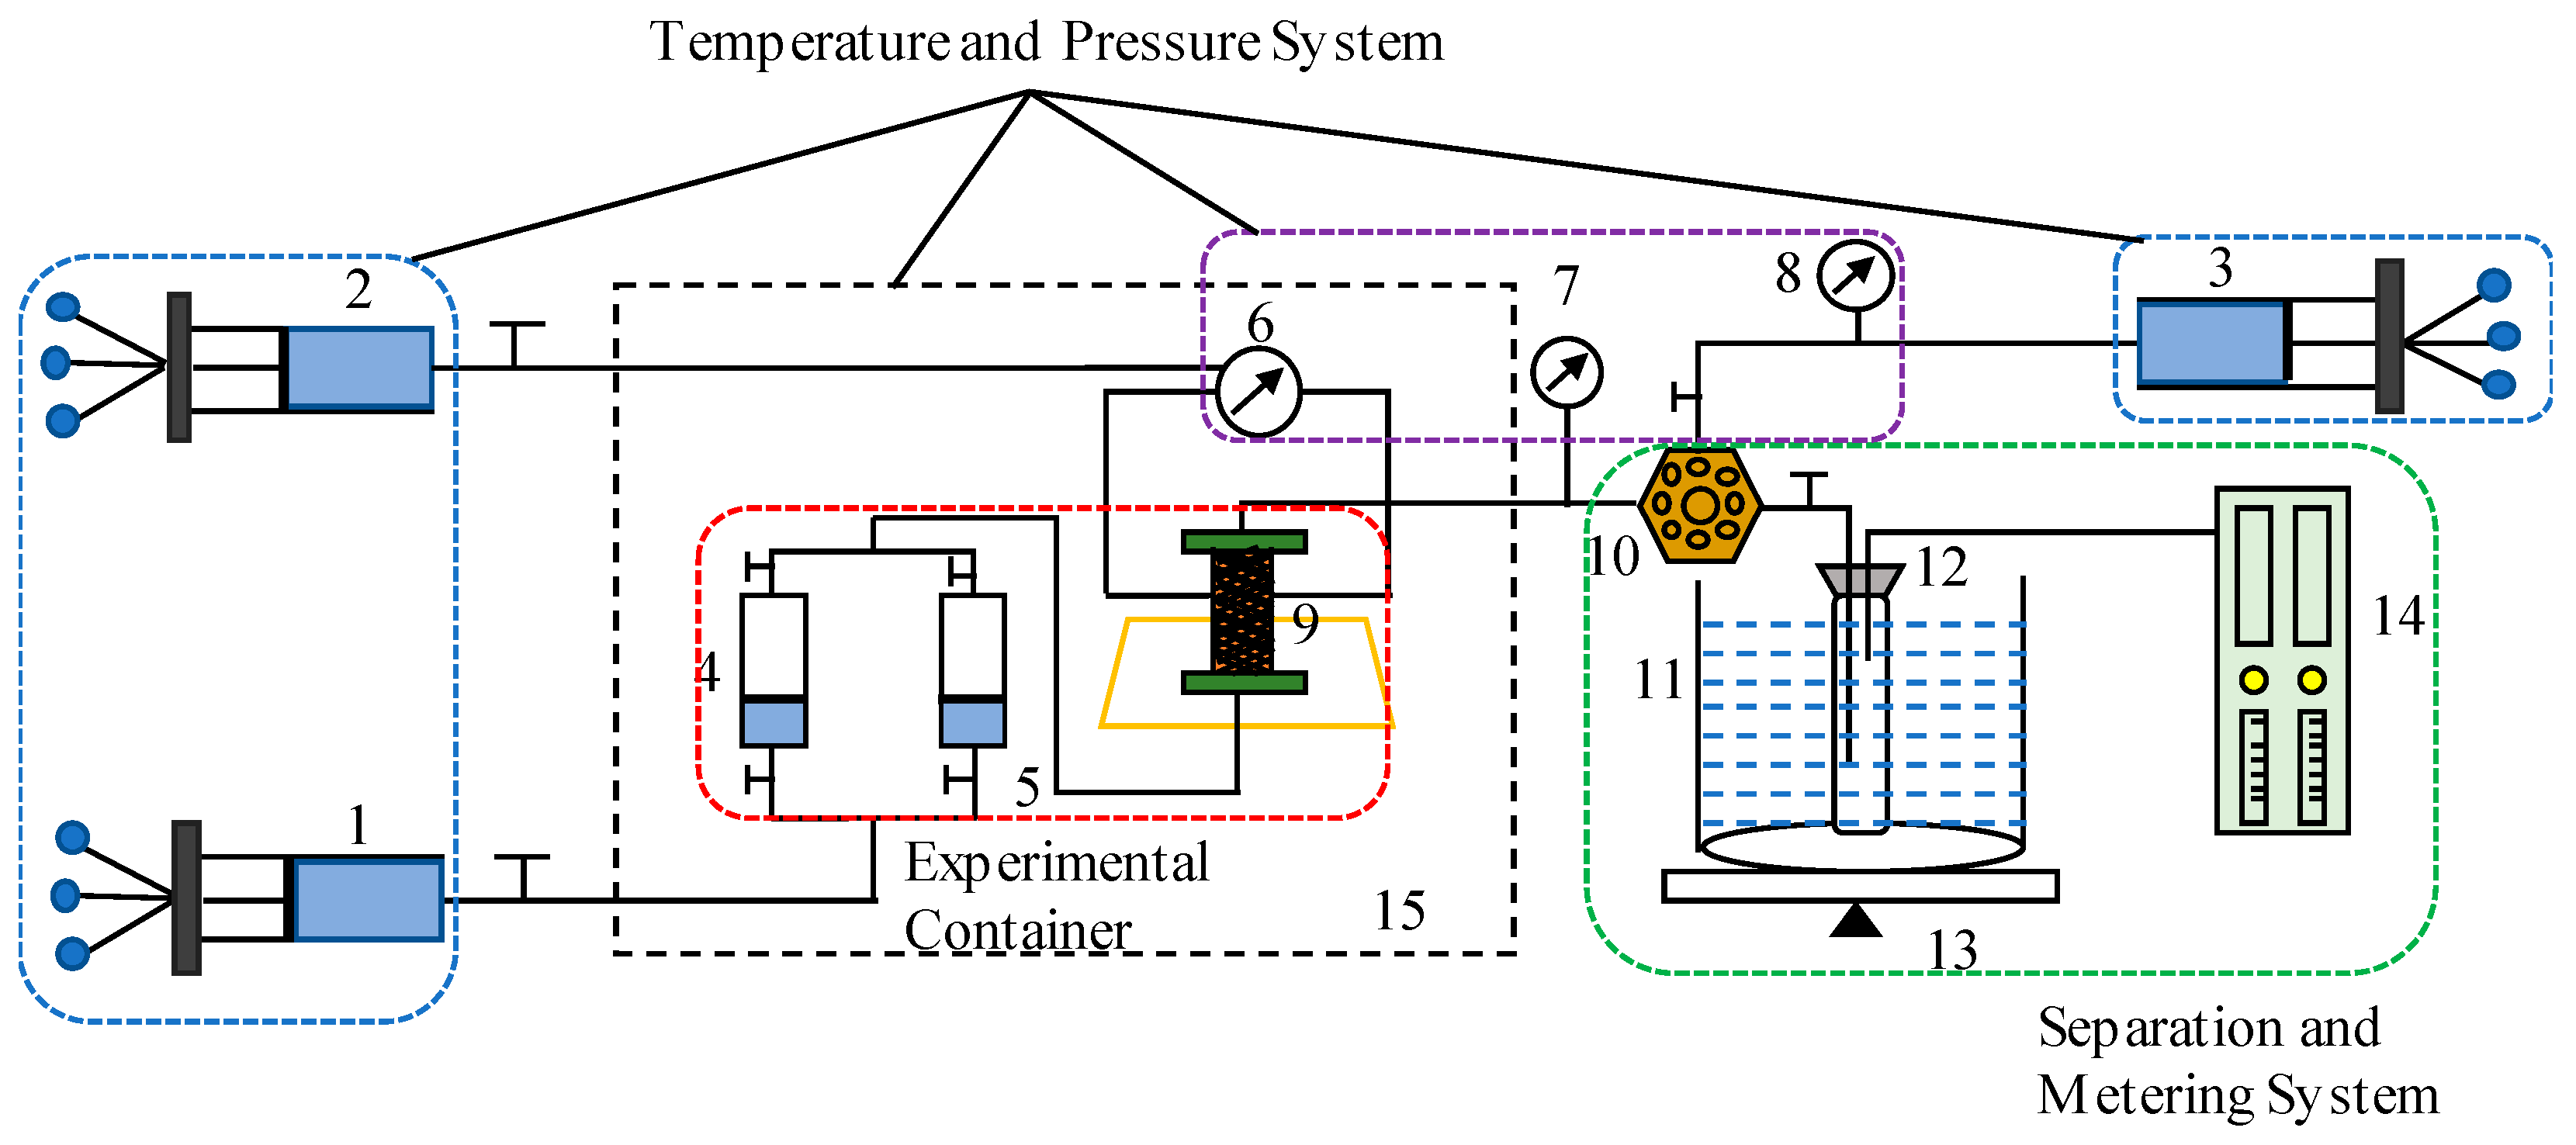
The crude oil utilized in this study was prepared following the national standard GB/T 26981-2020 [31] and was based on the original PVT report from Well M1. To replicate in situ reservoir conditions, degassed crude oil collected from Well M1 was recombined with laboratory-prepared associated gas. This recombination process was conducted under reservoir-simulated conditions of 150.3 °C and 84.05 MPa, as illustrated in Figure 3.
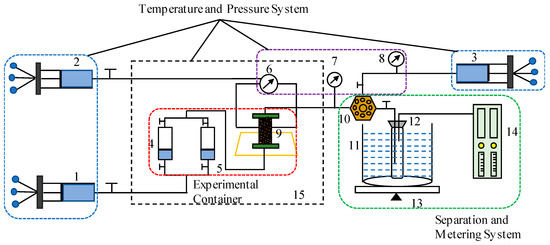
Figure 3.
Experimental flowchart for evaluating multiples of different water bodies. 1—Displacement pump; 2—confining pressure pump; 3—backpressure pump; 4—formation condensate gas intermediate container; 5—displacement gas intermediate container; 6, 7, 8—confining pressure, outlet pressure, and backpressure gauges; 9—full-diameter core holder; 10—backpressure valve; 11—cold water bath; 12—separator; 13—electronic balance; 14—gas meter; 15—oven.
The recombined formation crude oil had a gas–oil ratio (GOR) of 502 cm3/cm3, a bubble point pressure of 36.36 MPa, a density of 0.5013 g/cm3, and a viscosity of 0.411 mPa·s. These physical properties closely match the behavior of the reservoir fluid, ensuring the accuracy of subsequent experimental simulations. The detailed compositional analysis of the recombined fluid included 1.57% N2, 2.51% CO2, 63.16% methane (C1), and 10.15% heavy hydrocarbons (C8+). A detailed component analysis of the wellstream fluid is presented in Table 2.
Table 2.
Composition of reservoir crude oil wellstream fluid.
The formation water utilized in this experiment was prepared to replicate the chemical characteristics of the actual reservoir aquifer. The prepared solution exhibited a total salinity of 249,800 mg/L and was classified as CaCl2-type water, which is representative of the ionic composition observed in field measurements. Detailed information regarding the water quality is presented in Table 3.
Table 3.
Water quality information of the prepared formation water.
2.2. Experimental Equipment
The experimental procedure for evaluating recoverable reserves under different aquifer support conditions is schematically illustrated in Figure 3. The experimental setup primarily comprises an injection system, a high-temperature and high-pressure full-diameter core holder, a pressure control and measurement system, and a gas–liquid separation and metering device.
- (1)
- High-temperature and high-pressure full-diameter core holder: This is the central unit of the apparatus, designed to accommodate full-diameter, multi-fracture-vug cores. It simulates the temperature and pressure conditions of the actual reservoir, allowing for reliable measurement of fluid flow and pressure response in a confined environment.
- (2)
- Injection system: This subsystem is responsible for building up the initial reservoir pressure and delivering formation water into the core sample at a controlled rate.
- (3)
- Pressure control and measurement system: This system consists of multiple components, including inlet pressure gauges, confining pressure regulators, backpressure valves, and real-time pressure sensors. It enables precise control and continuous monitoring of pressure at the inlet, outlet, and annular regions of the core holder, thereby ensuring experimental stability and data accuracy.
- (4)
- Gas–liquid separation and metering device: Installed at the outlet of the core holder, this unit separates the produced gas and liquid phases. It enables the independent measurement of cumulative gas and water production volumes, providing essential data for reserve calculations and energy balance analyses.
2.3. Experimental Design and Procedures
To systematically investigate the impact of external aquifer support on reservoir depletion behavior and reserve recovery, the experimental parameters were designed to simulate five distinct levels of aquifer energy, corresponding to aquifer multiples of 5×, 10×, 20×, 50×, and 100×. These aquifer multiples represent the ratio of aquifer volume to oil pore volume and reflect increasing degrees of external water support during reservoir production. By controlling the injected water volume to match each target aquifer multiple, the experiment enables a comparative analysis of production performance, pressure maintenance capacity, and recoverable reserves under progressively stronger aquifer influences. The specific experimental design parameters are summarized in Table 4.
Table 4.
Experimental design for evaluating recoverable reserves under different aquifer multiples.
The testing procedures for the evaluation experiment are as follows:
- (1)
- Establishment of Initial Reservoir Conditions
The sand-filled fractured vuggy core is placed into the full-diameter core holder, and the experimental apparatus is assembled according to the specified testing procedure. The core holder is oriented vertically, with all valves closed. The inlet valve is then opened, and the system is evacuated for 8 h before the inlet valve is closed. Subsequently, the oven is activated to raise the temperature to 150.3 °C. Dead oil is injected into the core to establish pressure, gradually increasing the pore pressure to 84.05 MPa while ensuring that the backpressure remains equal to the pore pressure. The confining pressure is consistently maintained at 3 MPa higher than the pore pressure.
The recombined crude oil is sequentially injected through both the outlet and inlet ends of the core to displace the dead oil in the pore space. Once the gas–oil ratio at the outlet stabilizes and aligns with the predetermined recombination gas–oil ratio, the initial reservoir conditions are considered established.
- (2)
- Depletion Under Different Aquifer multiples (5, 10, 20, 50, and 100 PV)
An intermediate container filled with formation water, corresponding to aquifer multiples of 5, 10, 20, 50, and 100 pore volumes (PV), is connected to the bottom of the core holder to simulate bottom water conditions. The formation water pressure is increased to 84.05 MPa, and the temperature is raised to 150.3 °C. After opening the upper valve of the intermediate container (located on the formation water side) to connect it to the bottom of the core system (inlet end), the lower valve of the intermediate container (located on the variable pressure oil side) is closed, and the system is allowed to stabilize.
Depletion begins with a gradual reduction of backpressure from the initial reservoir pressure of 84.05 MPa to 0.5 Pb (18 MPa). Throughout this pressure reduction, the confining pressure is consistently maintained at 3 MPa above the pore pressure. The depletion process is executed in increments of 4 MPa, with backpressure stabilization occurring at each pressure step. Gas and oil production volumes at the outlet are recorded once gas production ceases for 5 min. This procedure continues until the breakthrough of bottom water occurs, concluding the depletion experiment. Measurements at the outlet are conducted under ambient conditions of 20 °C and 1 atm.
- (3)
- Post-Test Processing
After each experimental run, the core is cleaned with petroleum ether and anhydrous ethanol. Subsequently, the core is removed and placed in a constant-temperature oven for 24 h to dry, after which it proceeds to the next experimental group.
3. Establishment of Material Balance Equation for Fractured Vuggy Reservoirs
The Ordovician fractured vuggy carbonate reservoirs in the Tarim Basin are reformed reservoirs that have been shaped by multiple tectonic events and superimposed karstification. These geological features have resulted in a highly complex reservoir architecture with diverse types of storage space and significant spatial heterogeneity. The reservoir space exhibits a wide range of scales, from micron-scale intergranular dissolution pores and intercrystalline pores within the matrix to centimeter- and meter-scale fractures and dissolution vugs, extending to large-scale dissolution caves that span up to tens of meters. This broad spectrum of pore systems contributes to extreme heterogeneity in both porosity and permeability, complicating fluid flow and reservoir characterization.
Within this complex framework, discrete, fractured vuggy bodies composed of interconnected pores, vugs, and fracture networks serve as the basic units of hydrocarbon accumulation. These bodies control local fluid storage and migration pathways and are considered the smallest effective units for evaluating reservoir productivity. Figure 4 presents three conceptual models illustrating the corresponding oil–water interaction mechanisms in fractured reservoirs. The first model assumes that fractures are confined within the oil-bearing zone and are disconnected from the aquifer. Pressure support is minimal, leading to rapid depletion and limited water influx. The second model involves the matrix directly contacting the aquifer, while fractures remain within the oil zone. Moderate pressure support is provided through matrix–aquifer interaction, with delayed water breakthrough. The third model involves fractures extending into the aquifer, creating a direct hydraulic link. This enhances pressure maintenance but causes early water breakthrough due to the strong aquifer drive. Fractures extend into the aquifer, creating a direct hydraulic link that enhances pressure maintenance but causes early water breakthrough due to the strong aquifer drive.
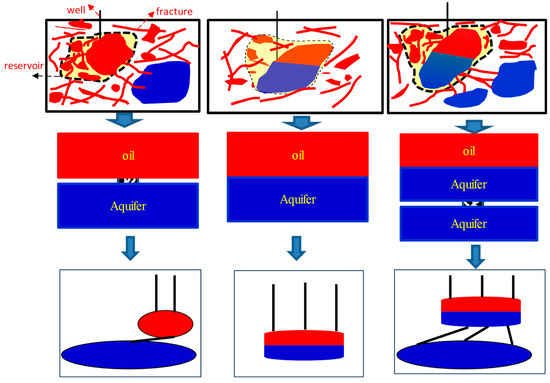
Figure 4.
Oil and water distribution patterns in different fracture–vug units.
3.1. Model Assumptions
Based on the reservoir model of a waterflooded fractured vuggy reservoir, a material balance equation was established by considering the geological characteristics of pores, fractures, and vugs, as well as the influence of the aquifer. The fundamental assumptions are as follows:
- (1)
- The fractured vuggy reservoir does not contain a gas cap. The primary sources of natural drive energy are crude oil expansion, aquifer elasticity, and rock deformation.
- (2)
- A uniform pressure system is assumed to exist within the fractured vuggy body.
- (3)
- The external boundary of the fractured vuggy body is considered closed.
- (4)
- The coexistence of oil and water within the fractured vuggy reservoir is considered, along with the influence of externally connected aquifers.
- (5)
- Variability in initial water saturations is present across the matrix, fractures, and vugs.
- (6)
- The model incorporates artificial water injection.
- (7)
- The compressibility coefficients of rock and water are assumed to be constant, whereas the compressibility coefficients of oil and gas are pressure-dependent.
3.2. Model Development
Fractured vuggy reservoirs exhibit considerable storage capacities. To assess the energy contribution of the internal oil–water systems within the reservoir and the externally connected aquifer during development, the aquifer water–reservoir oil ratio (Rwo) was introduced
where Vci represents the reservoir volume under initial conditions, and Vw denotes the volume of the aquifer multiples, which may be located either within the reservoir or externally connected to it.
The porosity of vugs, fractures, and matrix is defined as follows:
During reservoir development, the total pore volume occupied by the remaining hydrocarbons and the pore volume occupied by invading water is equal to the initial oil-bearing pore volume of the reservoir.
The initial reservoir volume was determined by the difference between the pore volume and the irreducible water volume, expressed as:
After a specified cumulative oil production (Np), the reservoir pressure decreases from its initial value to the current pressure. During this process, the change in reservoir volume corresponds to the reduction in pore volume, the expansion of irreducible water, and the volumes of remaining gas and water in the reservoir:
The reduction in reservoir pore volume can be quantified as follows:
The expansion volume of irreducible water is calculated as:
The remaining gas volume in the reservoir is expressed as:
The remaining water volume in the reservoir is defined as:
The change in reservoir volume throughout the development process is articulated as:
The material balance equation for volatile fractured vuggy reservoirs considering aquifers, water influx, and water injection can be expressed as follows:
The two-phase volumetric compressibility coefficient of crude oil is defined as follows:
The comprehensive compressibility coefficient Cc for fractured vuggy reservoirs can be expressed as:
The material balance equation for volatile fractured vuggy reservoirs is simplified in the following manner:
The established material balance equation allows for the simultaneous determination of the original oil in place (OOIP) and aquifer support strength. The specific solution process is outlined as follows: The material balance equation is first expressed in linear form:
Y = NX
In this formulation, X represents the pressure-related expansion of the oil system and is calculated based on the compressibility of oil and rock under pressure decline:
Y corresponds to the total fluid production expressed in reservoir barrels, accounting for cumulative oil, gas, and water production. It is defined as:
Both variables X and Y are constructed based on production data and the PVT properties of the reservoir fluid. Equation (14) establishes a linear relationship between these variables that passes through the origin and is commonly referred to as the production performance indicator curve in material balance analysis. In this linear formulation, the slope of the line is directly related to the original oil in place (OOIP), denoted as N, making it a valuable tool for estimating reserves under varying drive mechanisms.
To apply this method, a series of X–Y data pairs was computed at successive production time steps using Equations (15) and (16). By iteratively adjusting the values of N and the aquifer multiple Rwo, a best-fit straight line can be obtained for the Y versus X plot. The slope of this line reflects the OOIP, while the degree of linearity indicates the appropriateness of the assumed water influx contribution. This graphical fitting approach allows for the simultaneous estimation of both the reservoir volume and the aquifer support strength.
4. Results
4.1. Experimental Results Discussion
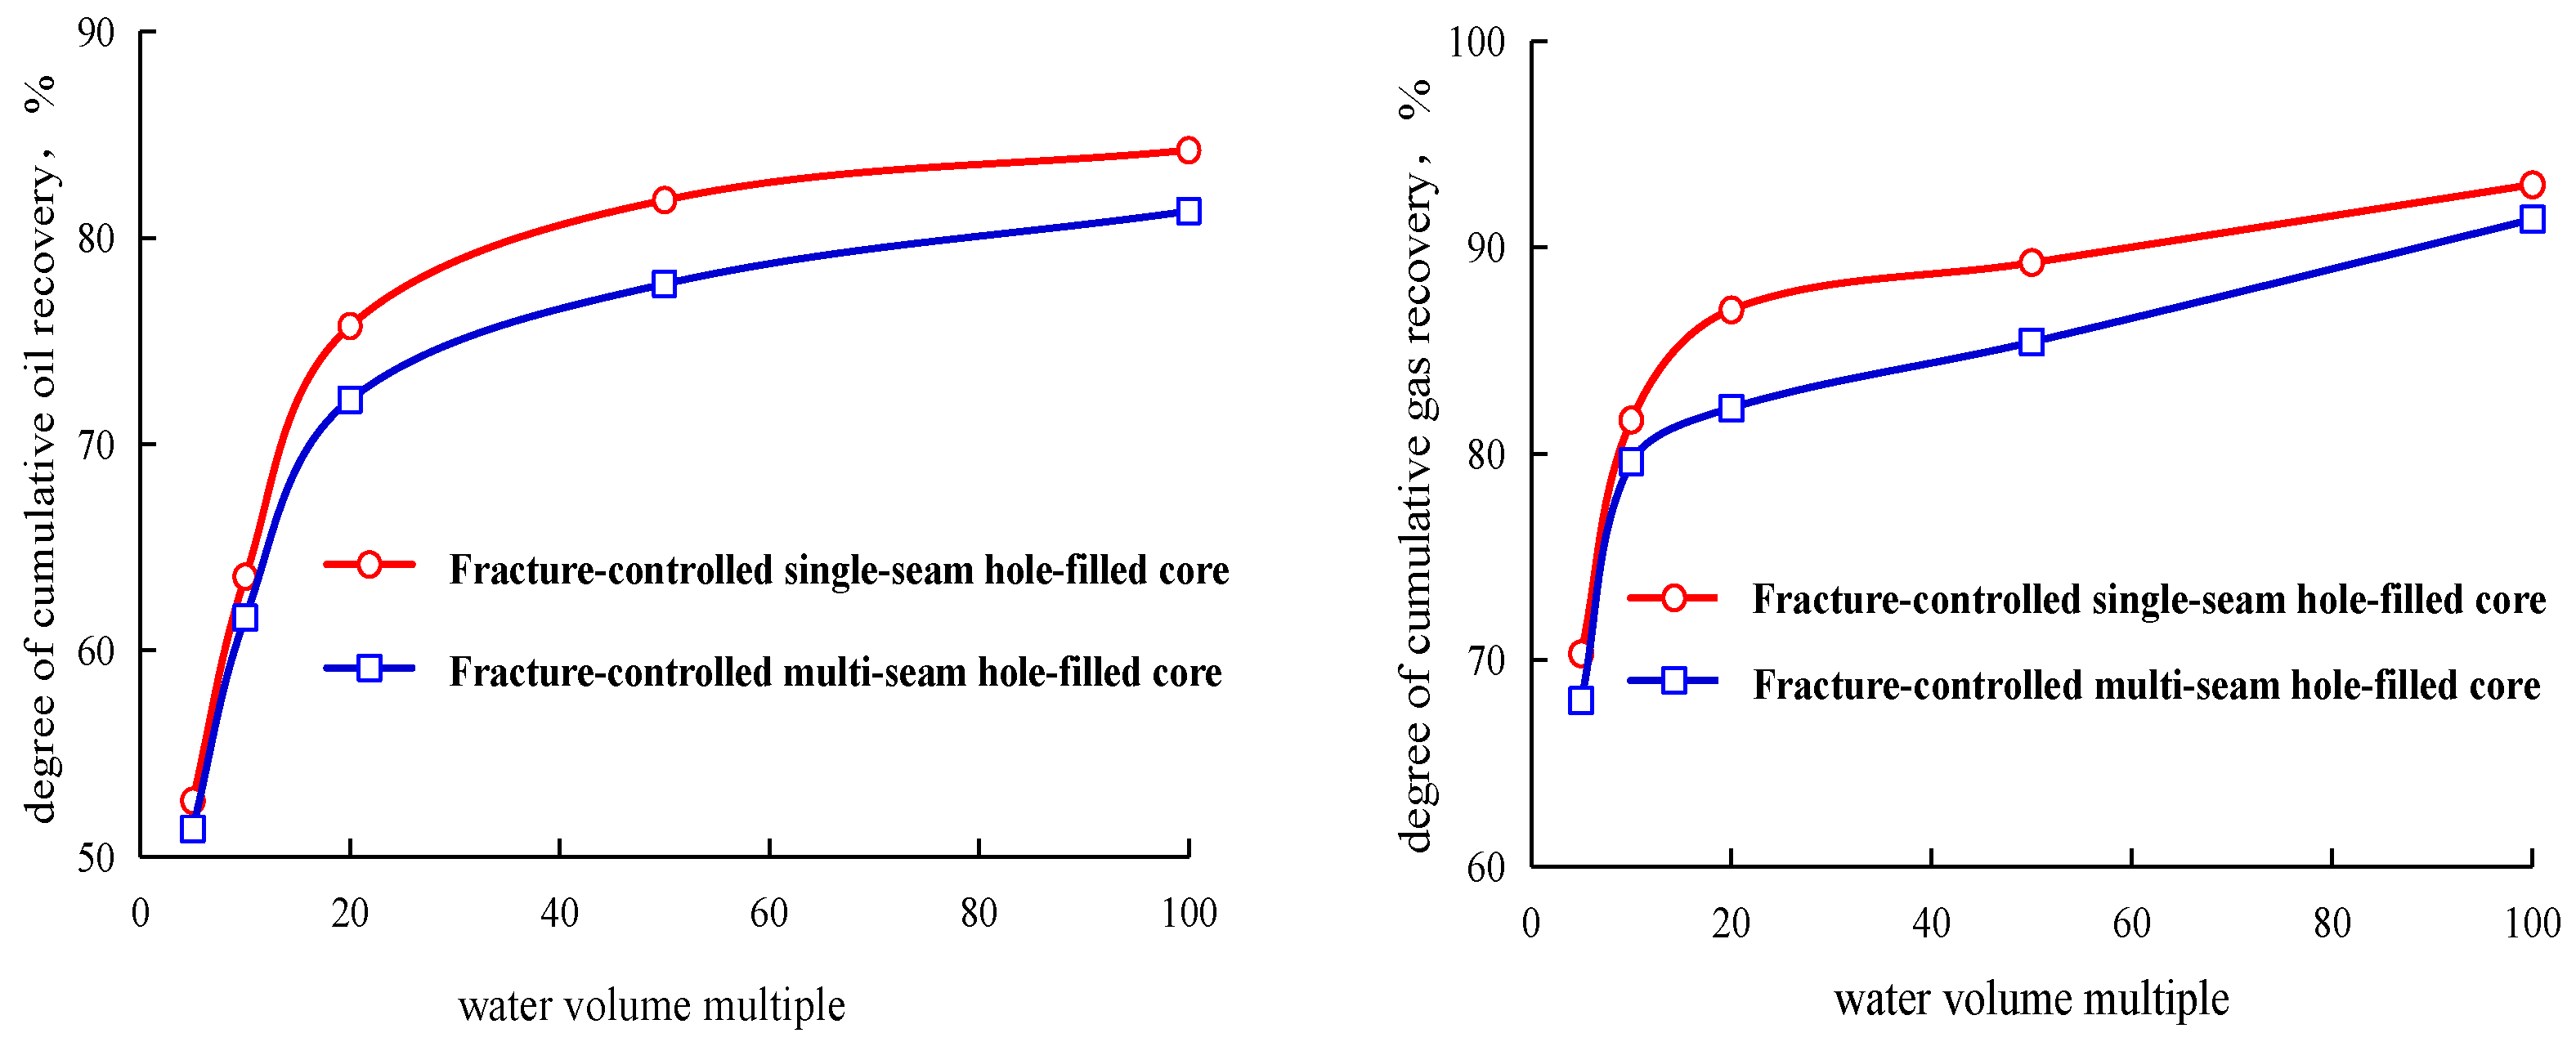
Under varying aquifer multiples, the oil and gas recovery rates for both the single-fracture–vug core and the multi-fracture–vug core exhibit a progressive increase with the aquifer multiple. Recovery increases rapidly at low aquifer multiples, but the rate of increase gradually diminishes, forming a characteristic curve of sharp initial growth followed by a plateau. At an aquifer multiple of 100 PV, the cumulative oil recovery reaches 84.3% for the single-fracture–vug core and 81.3% for the multi-fracture–vug core. The 1.6% difference in recovery is attributed primarily to the presence of “blind ends” zones near the top of the multi-fracture–vug core. These dead-end structures are not effectively contacted by the injected formation water, particularly when the injection is conducted from the top, resulting in localized bypassing and reduced sweep efficiency.
When the aquifer multiple is less than 20 PV, the expansion capacity of the aquifer is limited, and the resulting displacement is primarily driven by the oil’s elastic energy and early-stage aquifer support. Under these conditions, the influence of structural complexity, such as fracture connectivity and vug arrangement, is minimal, and the recovery performance between the two cores remains comparable.
As the aquifer multiple increases beyond 20 PV, the external water energy begins to dominate the displacement process, substantially improving sweep efficiency. However, at high aquifer multiples (≥50 PV), breakthrough phenomena and water channeling begin to occur. These effects result in premature water production and the bypassing of residual oil, ultimately leading to a decline in displacement efficiency. Consequently, although oil and gas recovery continues to increase with aquifer multiple, the gain diminishes significantly. This behavior is clearly illustrated in the trend observed in Figure 5.
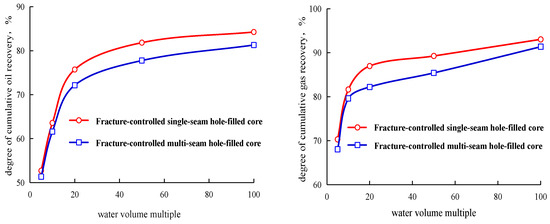
Figure 5.
Cumulative oil recovery and natural gas recovery of two core types under different aquifer multiples.
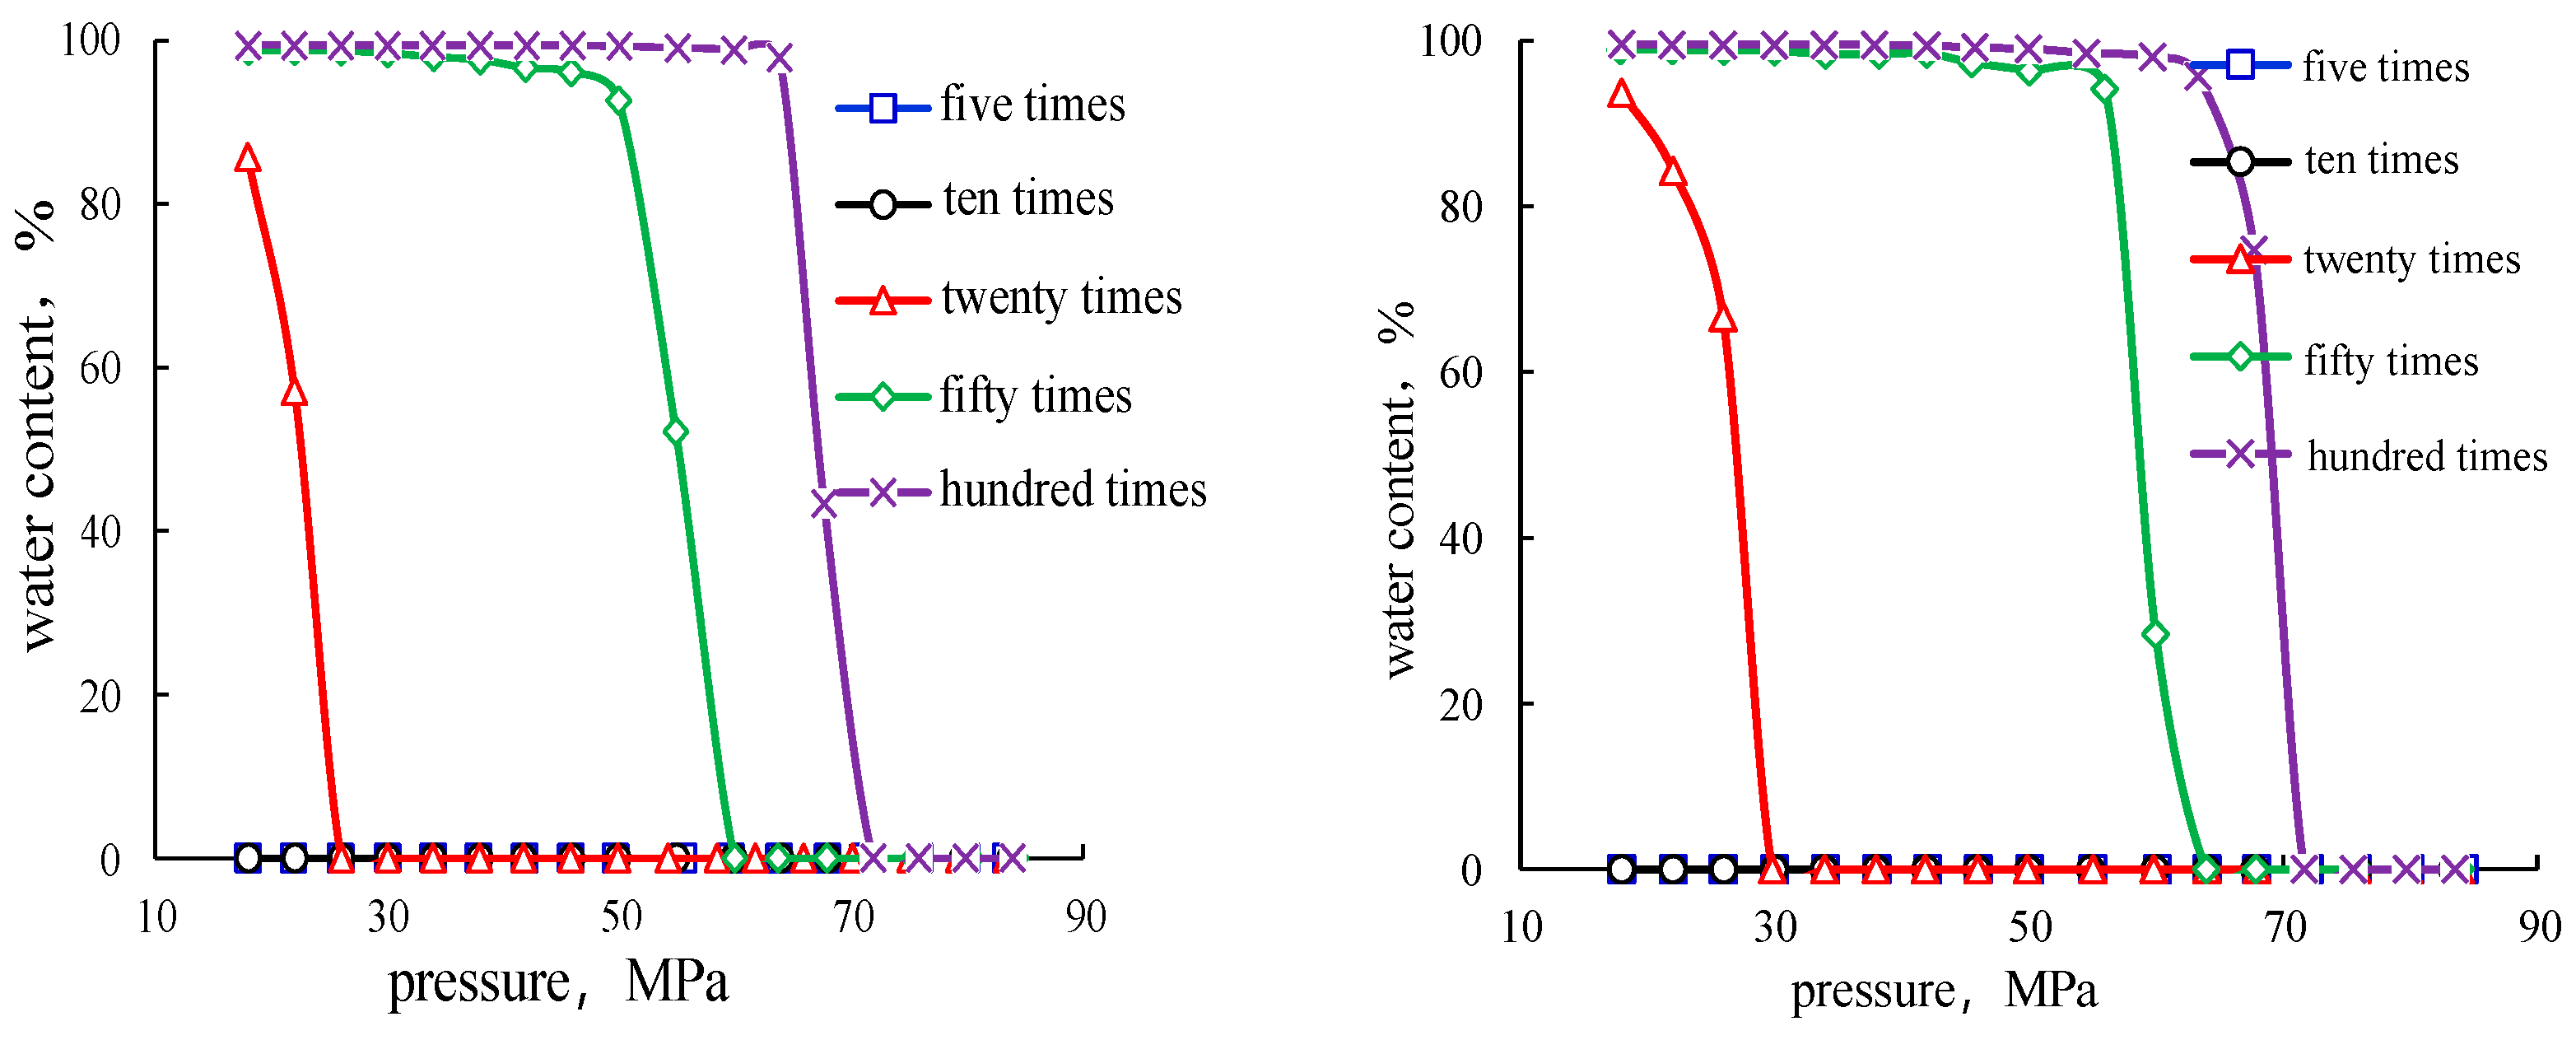
The aquifer multiple has a significant impact on the internal waterflooding process and the evolution of water cuts within the cores. At low aquifer multiples (5 PV and 10 PV), the limited volume of injected water restricts the displacement primarily to the dominant flow channels. Under these conditions, the water influx is insufficient to fully invade the pore network, resulting in low overall sweep efficiency. Consequently, water fails to reach the outlet during the experimental period, and no water production is observed. This indicates a weak water breakthrough potential and incomplete saturation of the porous medium.
In contrast, when the aquifer multiple exceeds 20 PV, the injected water volume becomes sufficient to substantially expand the sweep range within the core. Once a water breakthrough occurs, the water cut rises sharply. This trend is especially evident at higher aquifer multiples (≥50 PV), where the elevated waterflooding pressure and increased aquifer energy promote earlier breakthroughs and more aggressive water channeling, leading to a steep and sustained increase in water cut, as illustrated in Figure 6. Given that both the single-fracture–vug and multi-fracture–vug cores were constructed from the same parent rock and possess similar petrophysical properties, the timing of water breakthrough was found to be comparable between the two core types at identical aquifer multiples. This observation confirms that under controlled conditions, water breakthrough behavior is predominantly governed by aquifer support intensity rather than by minor structural variations between core configurations.
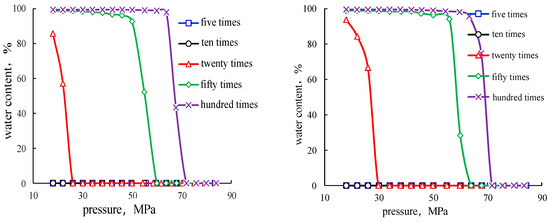
Figure 6.
Water cut variation curves for single- and multi-fracture–vug cores under different aquifer multiples.
4.2. Model Validation
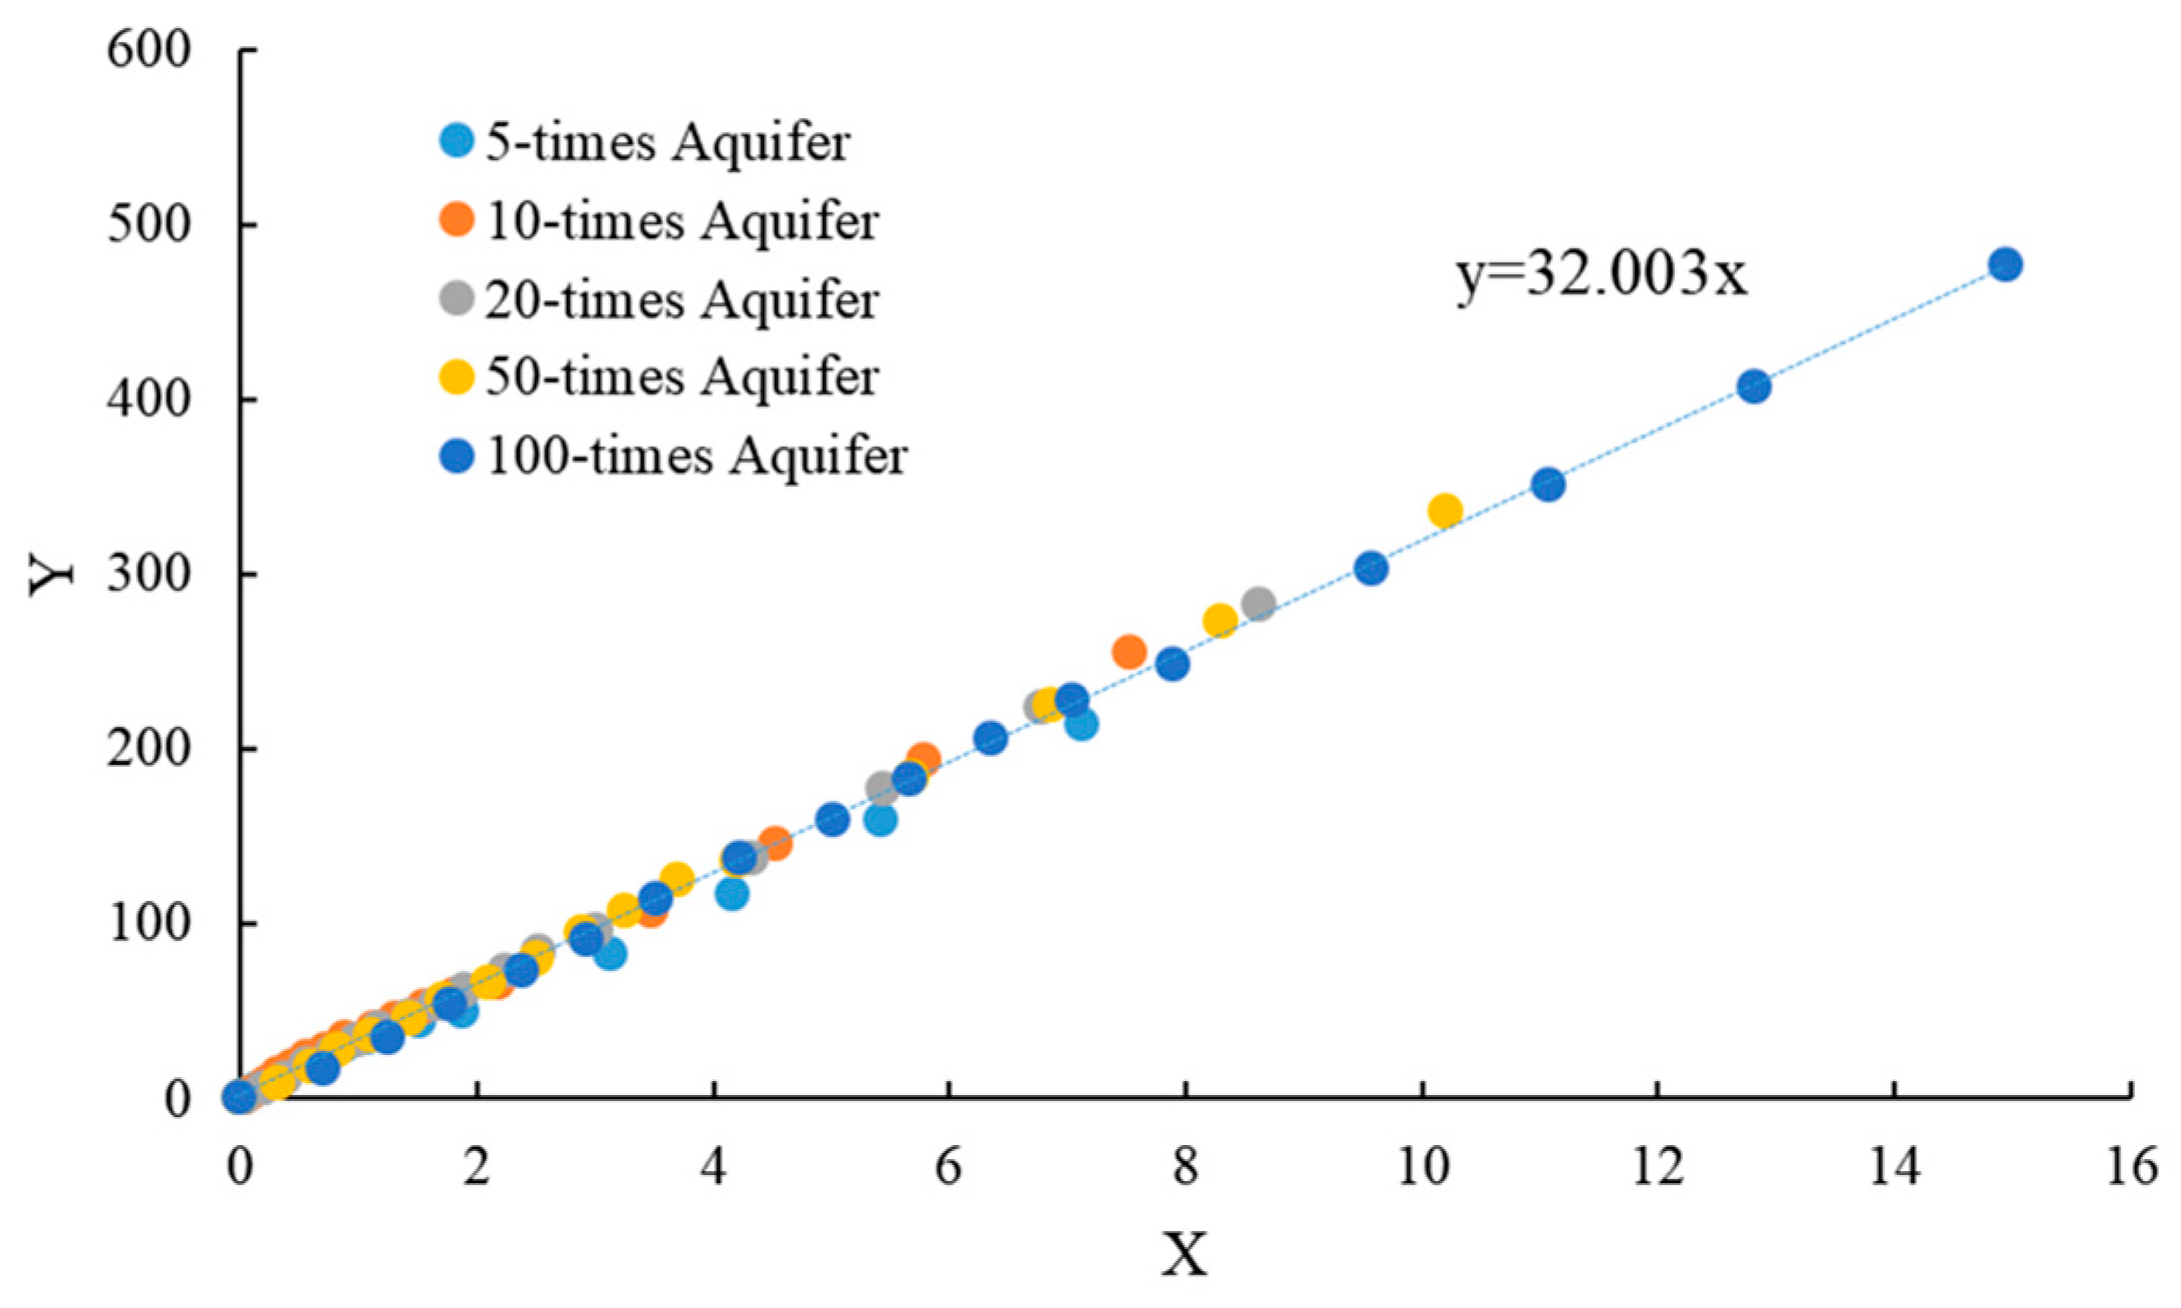
The established material balance equation model for fractured vuggy, fault-controlled volatile oil reservoirs was applied to physical experiments conducted under five aquifer supports (5, 10, 20, 50, and 100 times). The production performance indicator curves were constructed for both the single-fracture–cavity and multi-fracture–cavity core experiments, as illustrated in Figure 7 and Figure 8, respectively. In these experiments, the dynamic parameters X and Y were calculated using production fluid data and reservoir PVT property correlations. The resulting Y-X plots were evaluated for linearity using the material balance equation in its graphical form, allowing for reserve estimation via slope fitting.
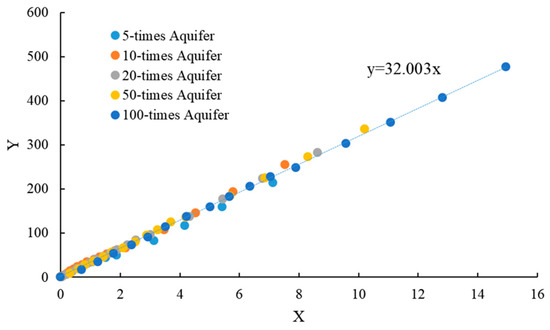
Figure 7.
Fitting results for single-fracture–vug core under different aquifer multiples.
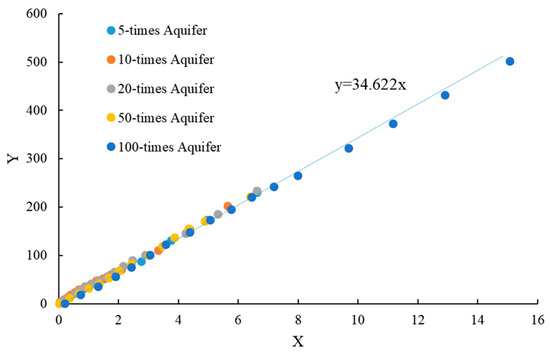
Figure 8.
Fitting results for multi-fracture–vuggy core under different aquifer multiples.
Figure 7 shows the results for the single-fracture–cavity core, where the fitted slope of the production indicator curve was 32.003. This corresponds to a calculated reserve that closely approximates the experimentally measured value of 33.63 mL, with a relative error of approximately 4.8%. Figure 8 presents the results for the multi-fracture-cavity core, yielding a fitted slope of 34.622, which is also in excellent agreement with the measured reserve of 34.40 mL, corresponding to a relative error of only 0.6%.
The influence of varying water influx multiples was consistently reflected in the linear trends of the fitted curves, with all data points tightly distributed around the regression lines. The close agreement between the fitted and measured reserves in both cases demonstrates the applicability and accuracy of the material balance indicator method for estimating reserves in complex fractured vuggy systems. Moreover, the high linearity observed in the Y–X curves confirms the validity of the linear material balance formulation under controlled physical simulation conditions.
5. Discussion
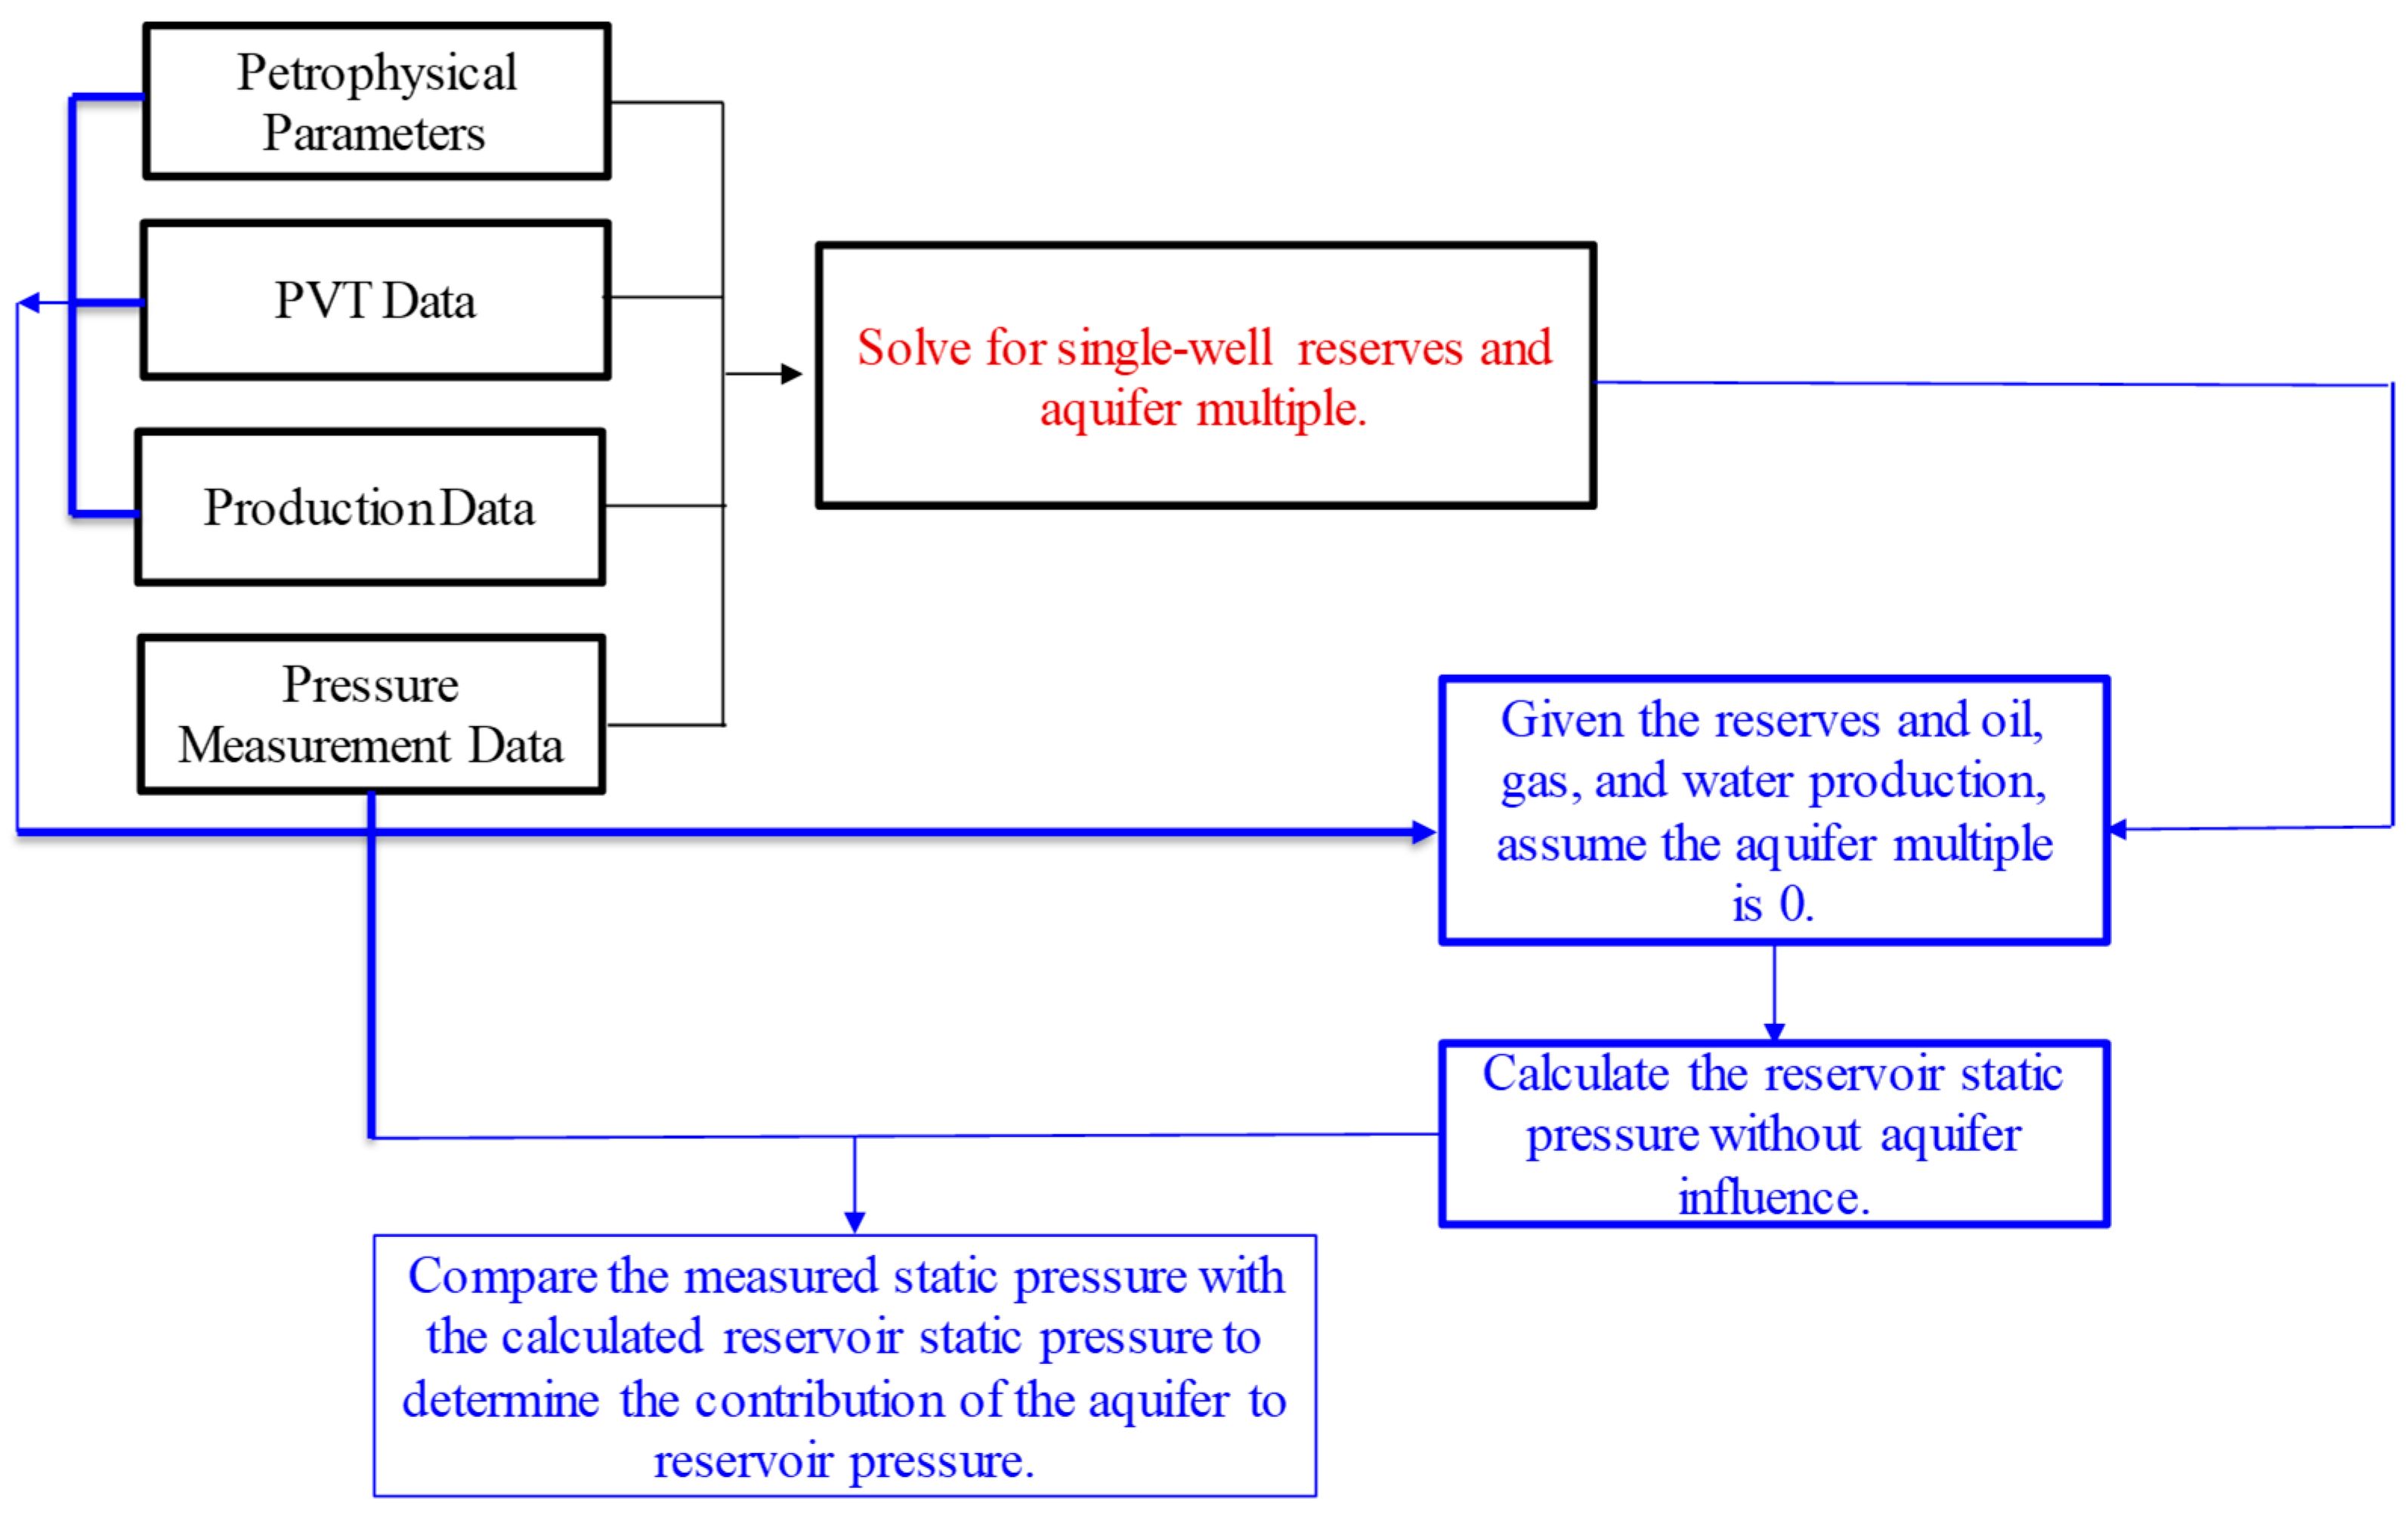
In fractured vuggy volatile reservoirs, accurate reserve estimation is essential for effective reservoir management and the optimization of development strategy. However, under strong edge or bottom water drive, traditional reserve calculation methods often fail to account for the dynamic interaction between the reservoir and external aquifer systems. To address this challenge, a systematic workflow (illustrated in Figure 9) has been developed to calculate reliable reserves and aquifer multiples in water-invaded reservoirs while also quantifying the energy contribution of external aquifers. The methodology is based on petrophysical parameters, PVT data, production history, and pressure measurements. By employing a coupled material balance approach, the model calculates single-well reserves and the corresponding aquifer multiple.
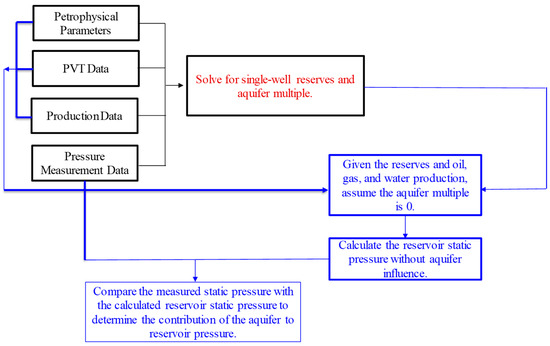
Figure 9.
Material balance equation method for calculating single-well reserves and aquifer multiples.
To quantitatively evaluate the energy contribution of external aquifers, it is essential to establish a reference pressure condition that excludes the influence of aquifers. In this study, the static reservoir pressure without aquifer support was calculated by setting the aquifer multiple to zero in the material balance equation. This theoretical pressure reflects the depletion behavior, which is solely governed by internal reservoir energy, including oil compressibility, solution gas expansion, and the elastic expansion of the rock matrix. The difference between the calculated internal reference pressure and the actual measured static pressure reflects the net pressure support provided by the external aquifer. This differential is defined as the aquifer contribution pressure, which can be used to quantify the degree of external energy supplementation during production. The proposed method presents a novel analytical framework for evaluating water drive mechanisms in fractured vuggy volatile reservoirs, providing important theoretical guidance for the efficient development of similarly complex reservoir systems.
5.1. Reserve Estimation
The wells YM5, RP14, and YM10 are three individual wells located in a fractured vuggy volatile reservoir of the Fuman Oilfield. The formation water volume factor for this reservoir is 1.05, and the compressibility coefficient of formation water is 5.07 × 10⁻⁴ MPa−1. The fundamental petrophysical parameters for these three wells, obtained from field measurements and data analysis, are summarized in Table 5. These parameters form the basis for the subsequent reserve estimation and evaluation of aquifer support strength using the established material balance model.
Table 5.
Basic petrophysical parameters for wells YM5, RP14, and YM10.
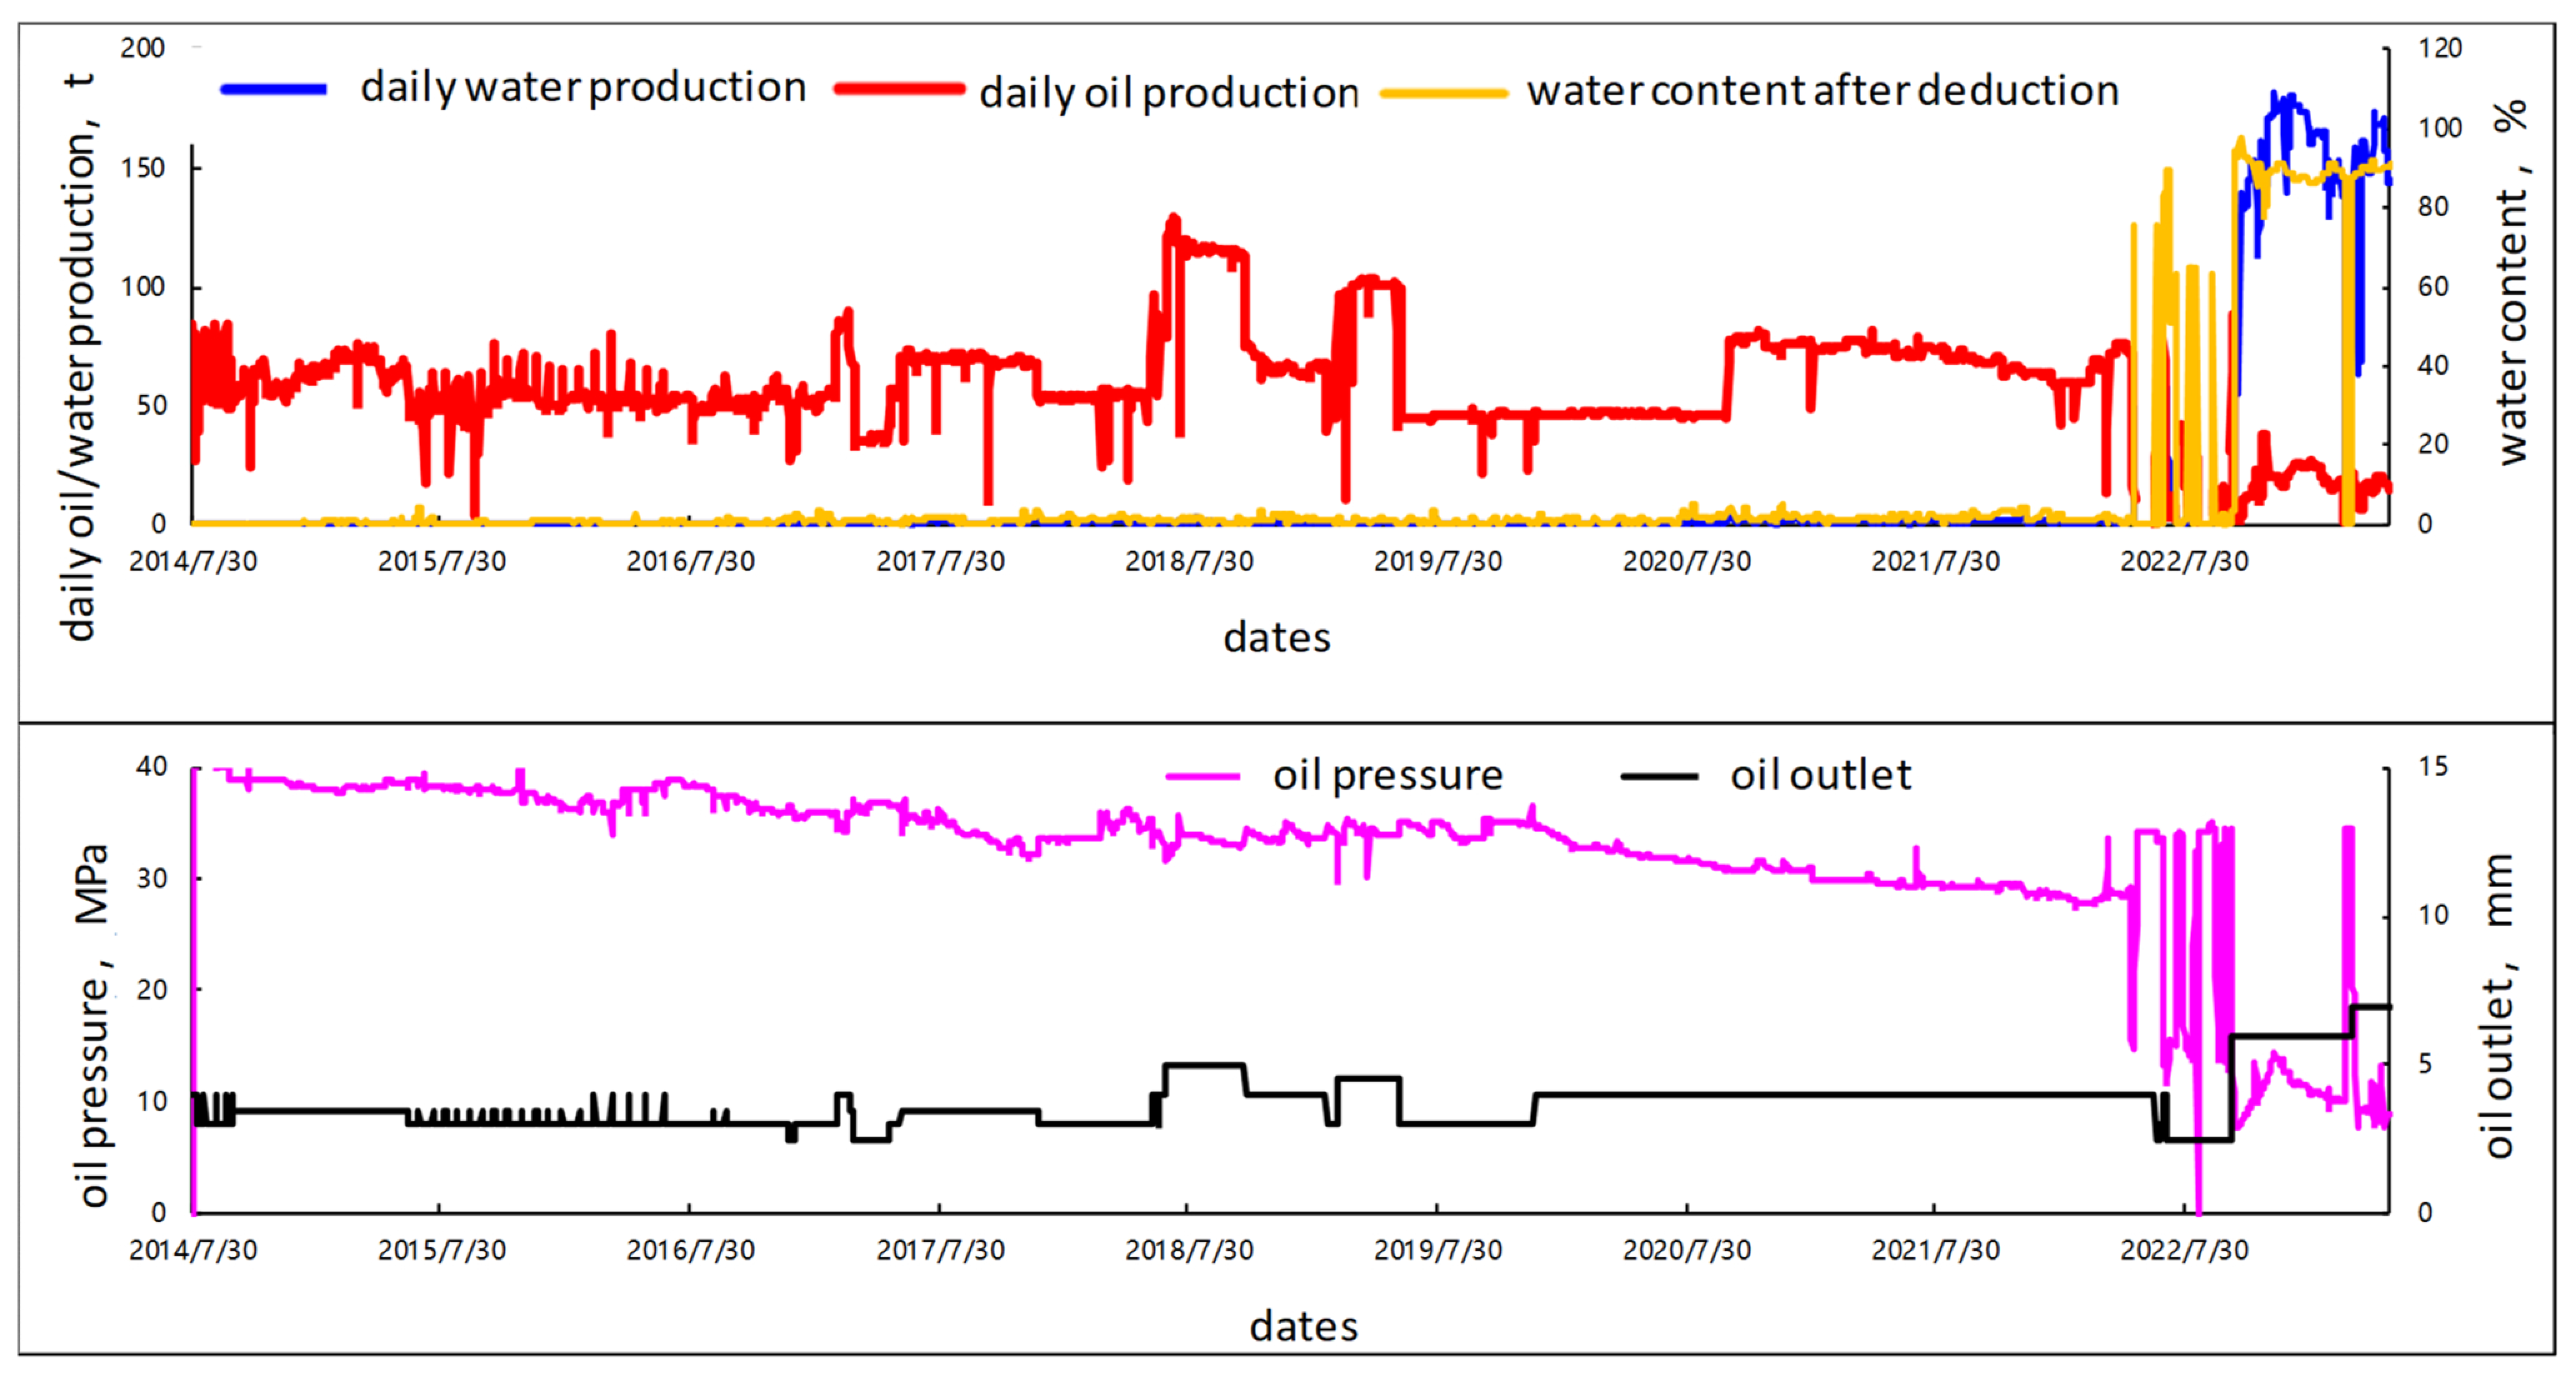
Well YM5 commenced production on 30 July 2014. As of 29 May 2023, the accumulated oil production reached 225,379.75 m3, total gas production was 8798.39 × 104 m3, and cumulative water production totaled 34,954.37 m3. Figure 10 illustrates the historical production performance of well YM5, including daily fluid rates of oil, gas, and water, water cut trends, and variations in wellhead pressure over time.

Figure 10.
The production data of well YM5.
During the production period, well YM5 exhibited relatively stable oil and gas production with minimal water output and a gradually declining wellhead pressure, indicating a depletion-driven energy system. A significant operational change occurred on 17 May 2022, when the wellhead pressure suddenly dropped to 15.65 MPa, accompanied by a noticeable decline in daily oil production and a marked surge in water output. This shift signals the onset of water breakthrough, likely due to the invasion of bottom or edge water. In response, the well was shut in on 19 May, resulting in rapid pressure recovery, which reached above 34 MPa by 24 May. This swift rebound in pressure indicated that the reservoir retained considerable elastic energy, although effective water management had become critical to sustaining production performance.
Production resumed on 19 June 2022, with wellhead pressure at 34.27 MPa. However, beginning on 1 July, the well experienced another pressure decline, which was accompanied by a sharp decrease in oil production and a steep increase in water output starting on 2 July 2022. To mitigate excessive water production and enhance oil recovery, the tubing diameter was reduced from 4 mm to 2.5 mm on 7 July 2022. This intervention led to a temporary increase in daily oil production and a corresponding decrease in water output, as shown by the production curves.
A shut-in pressure buildup test was conducted on 17 July, and production was restarted on 28 July, followed by multiple shut-in and reopening cycles. Each cycle exhibited consistent pressure recovery, indicating that the reservoir continued to retain significant elastic energy and suggesting that water control remained a critical factor in sustaining stable production.
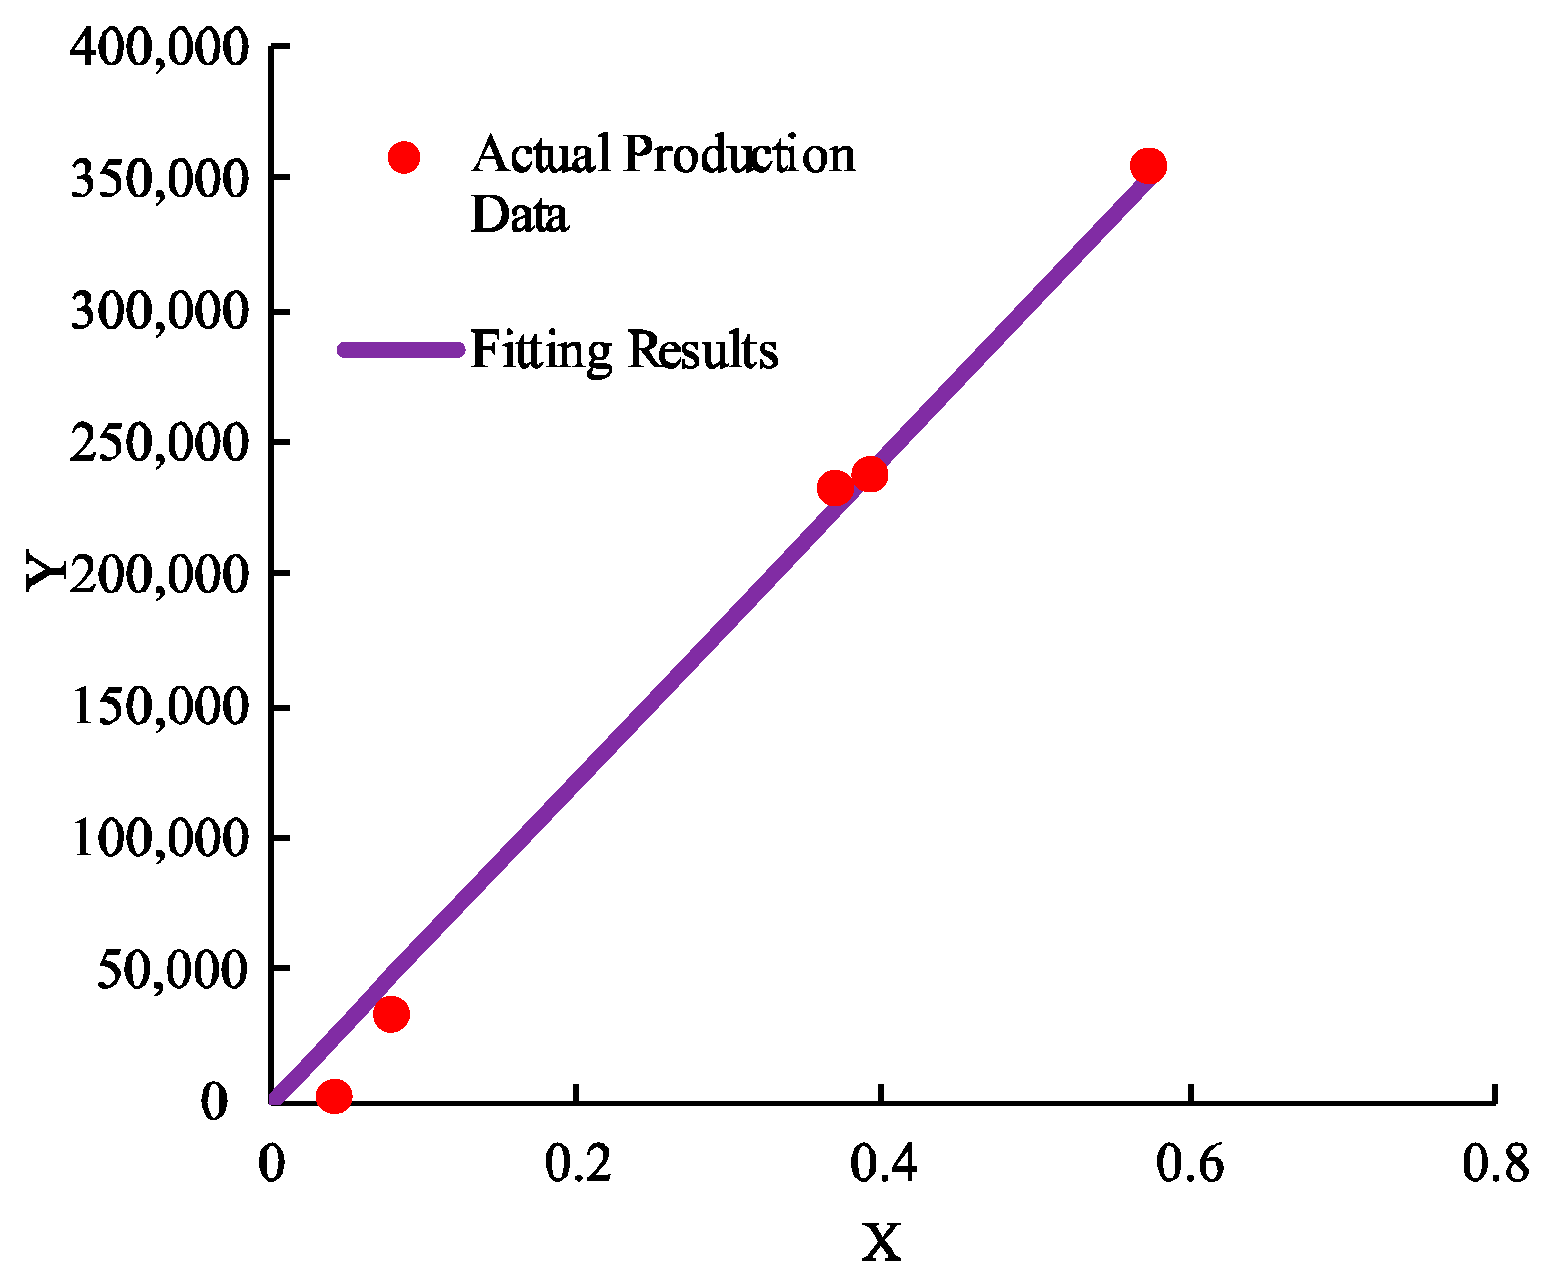
Figure 11 presents the material balance fitting results for well YM5 using the proposed method. The actual production data aligns well with the fitted line, yielding a relative fitting error of 8.1%. Based on the fitting results, the calculated geological reserves are 1.15 × 10⁶ m3, and the corresponding aquifer multiple is determined to be 18.7. Figure 12 illustrates the relationship between cumulative oil recovery and reservoir pressure for well YM5, reflecting the impact of changes in reservoir pressure and external aquifer support throughout the production process. In the early stages of production, reservoir pressure declined steadily, primarily governed by the internal elastic energy of the oil–rock system, with limited contribution from the aquifer. As production progressed, the continuous extraction of reservoir fluids led to a rapid decline in the theoretical reservoir pressure, assuming no aquifer. However, the actual measured reservoir pressure exhibited a markedly slower decline, highlighting the increasing role of aquifer influx in stabilizing pressure.

Figure 11.
Fitting results for the production data of well YM5.
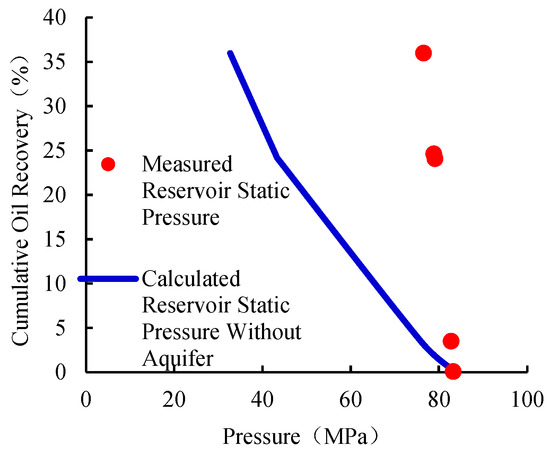
Figure 12.
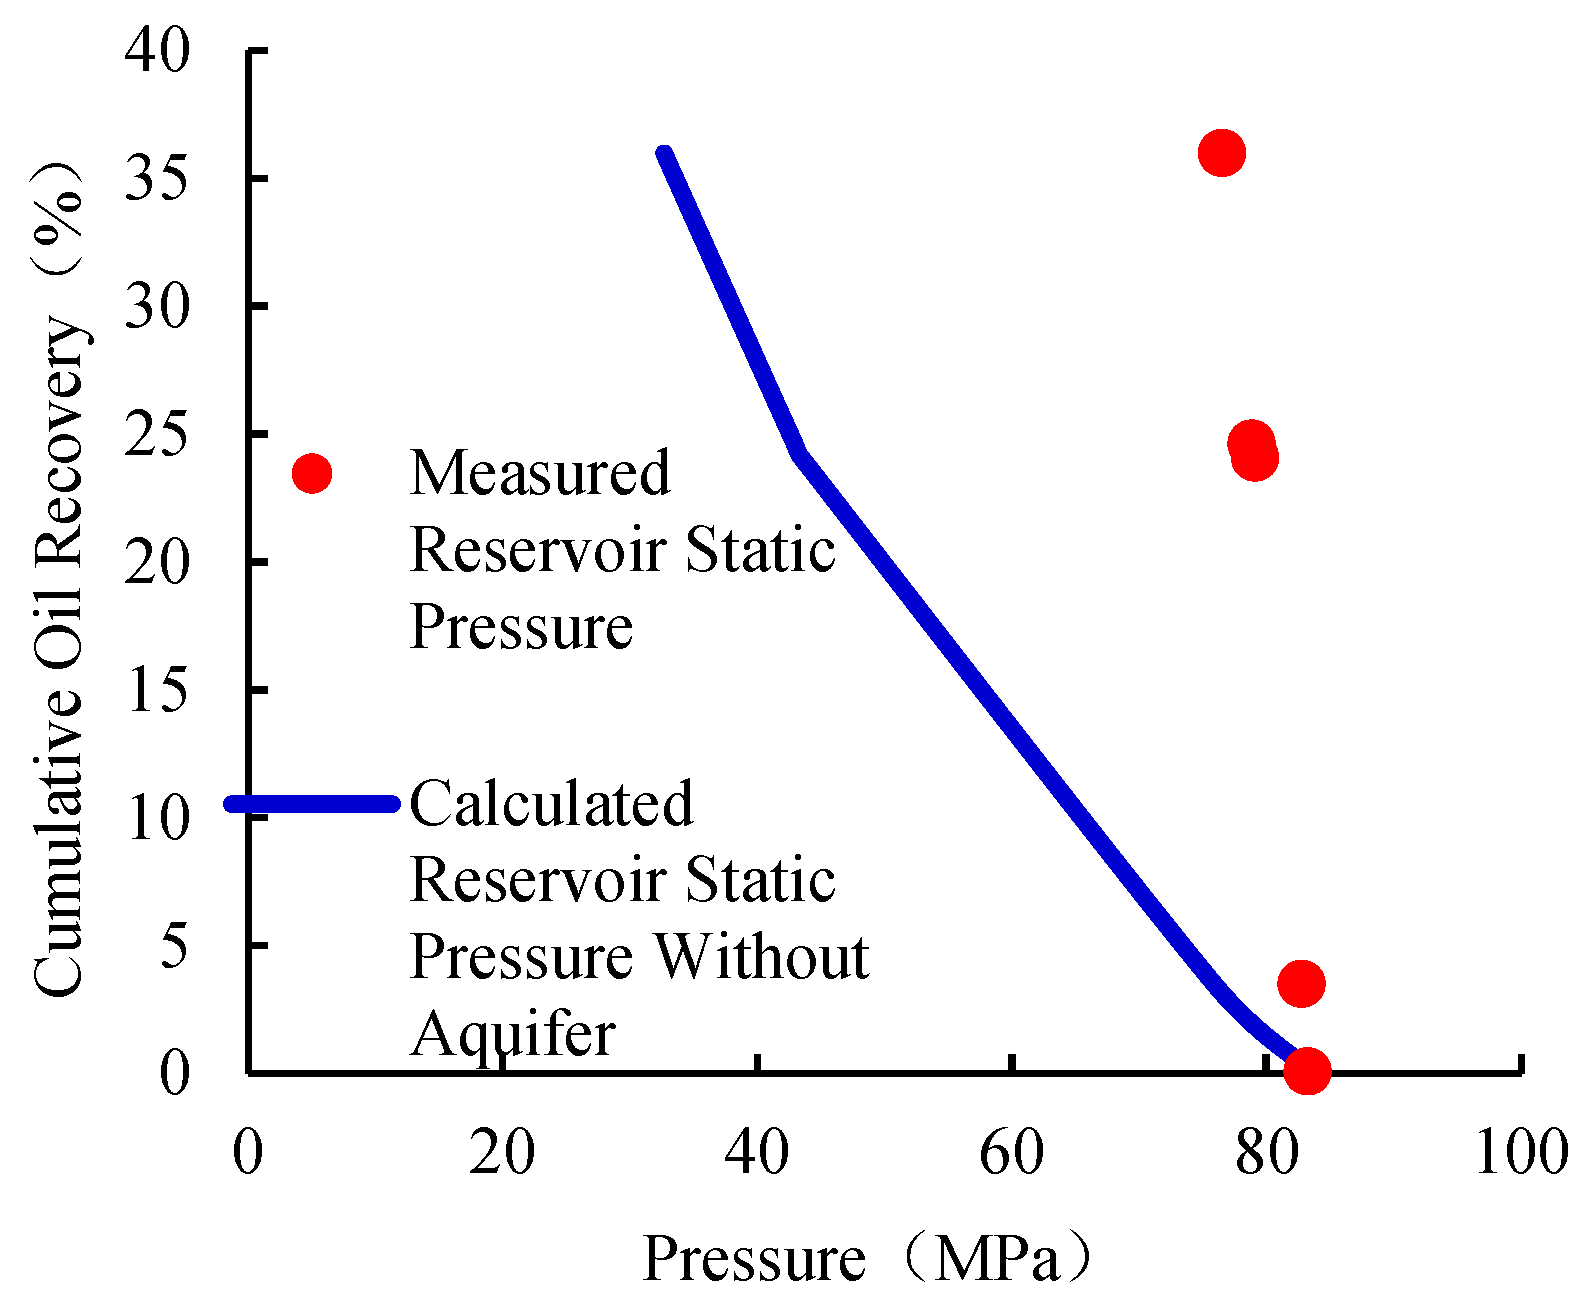
Calculated reservoir static pressure without aquifer for well Y5.
As of the most recent pressure measurement, the measured reservoir pressure of well YM5 is 76.56, while the simulated pressure without aquifer support would have declined to 32.68 MPa, indicating a pressure difference of 43.88 MPa. This substantial disparity quantitatively demonstrates the critical role of the external aquifer in sustaining reservoir pressure and providing supplementary energy. The aquifer’s capacity to maintain pressure effectively delayed reservoir depletion and enhanced displacement efficiency. This effect became particularly evident after the onset of the water breakthrough, during which water production increased rapidly. The observed pressure support from the aquifer mitigated the decline in production performance and helped maintain reservoir energy levels. Such quantitative evaluation is essential in fractured vuggy reservoirs, where external water drive mechanisms significantly influence reservoir energy dynamics, and must be accounted for when formulating development strategies.
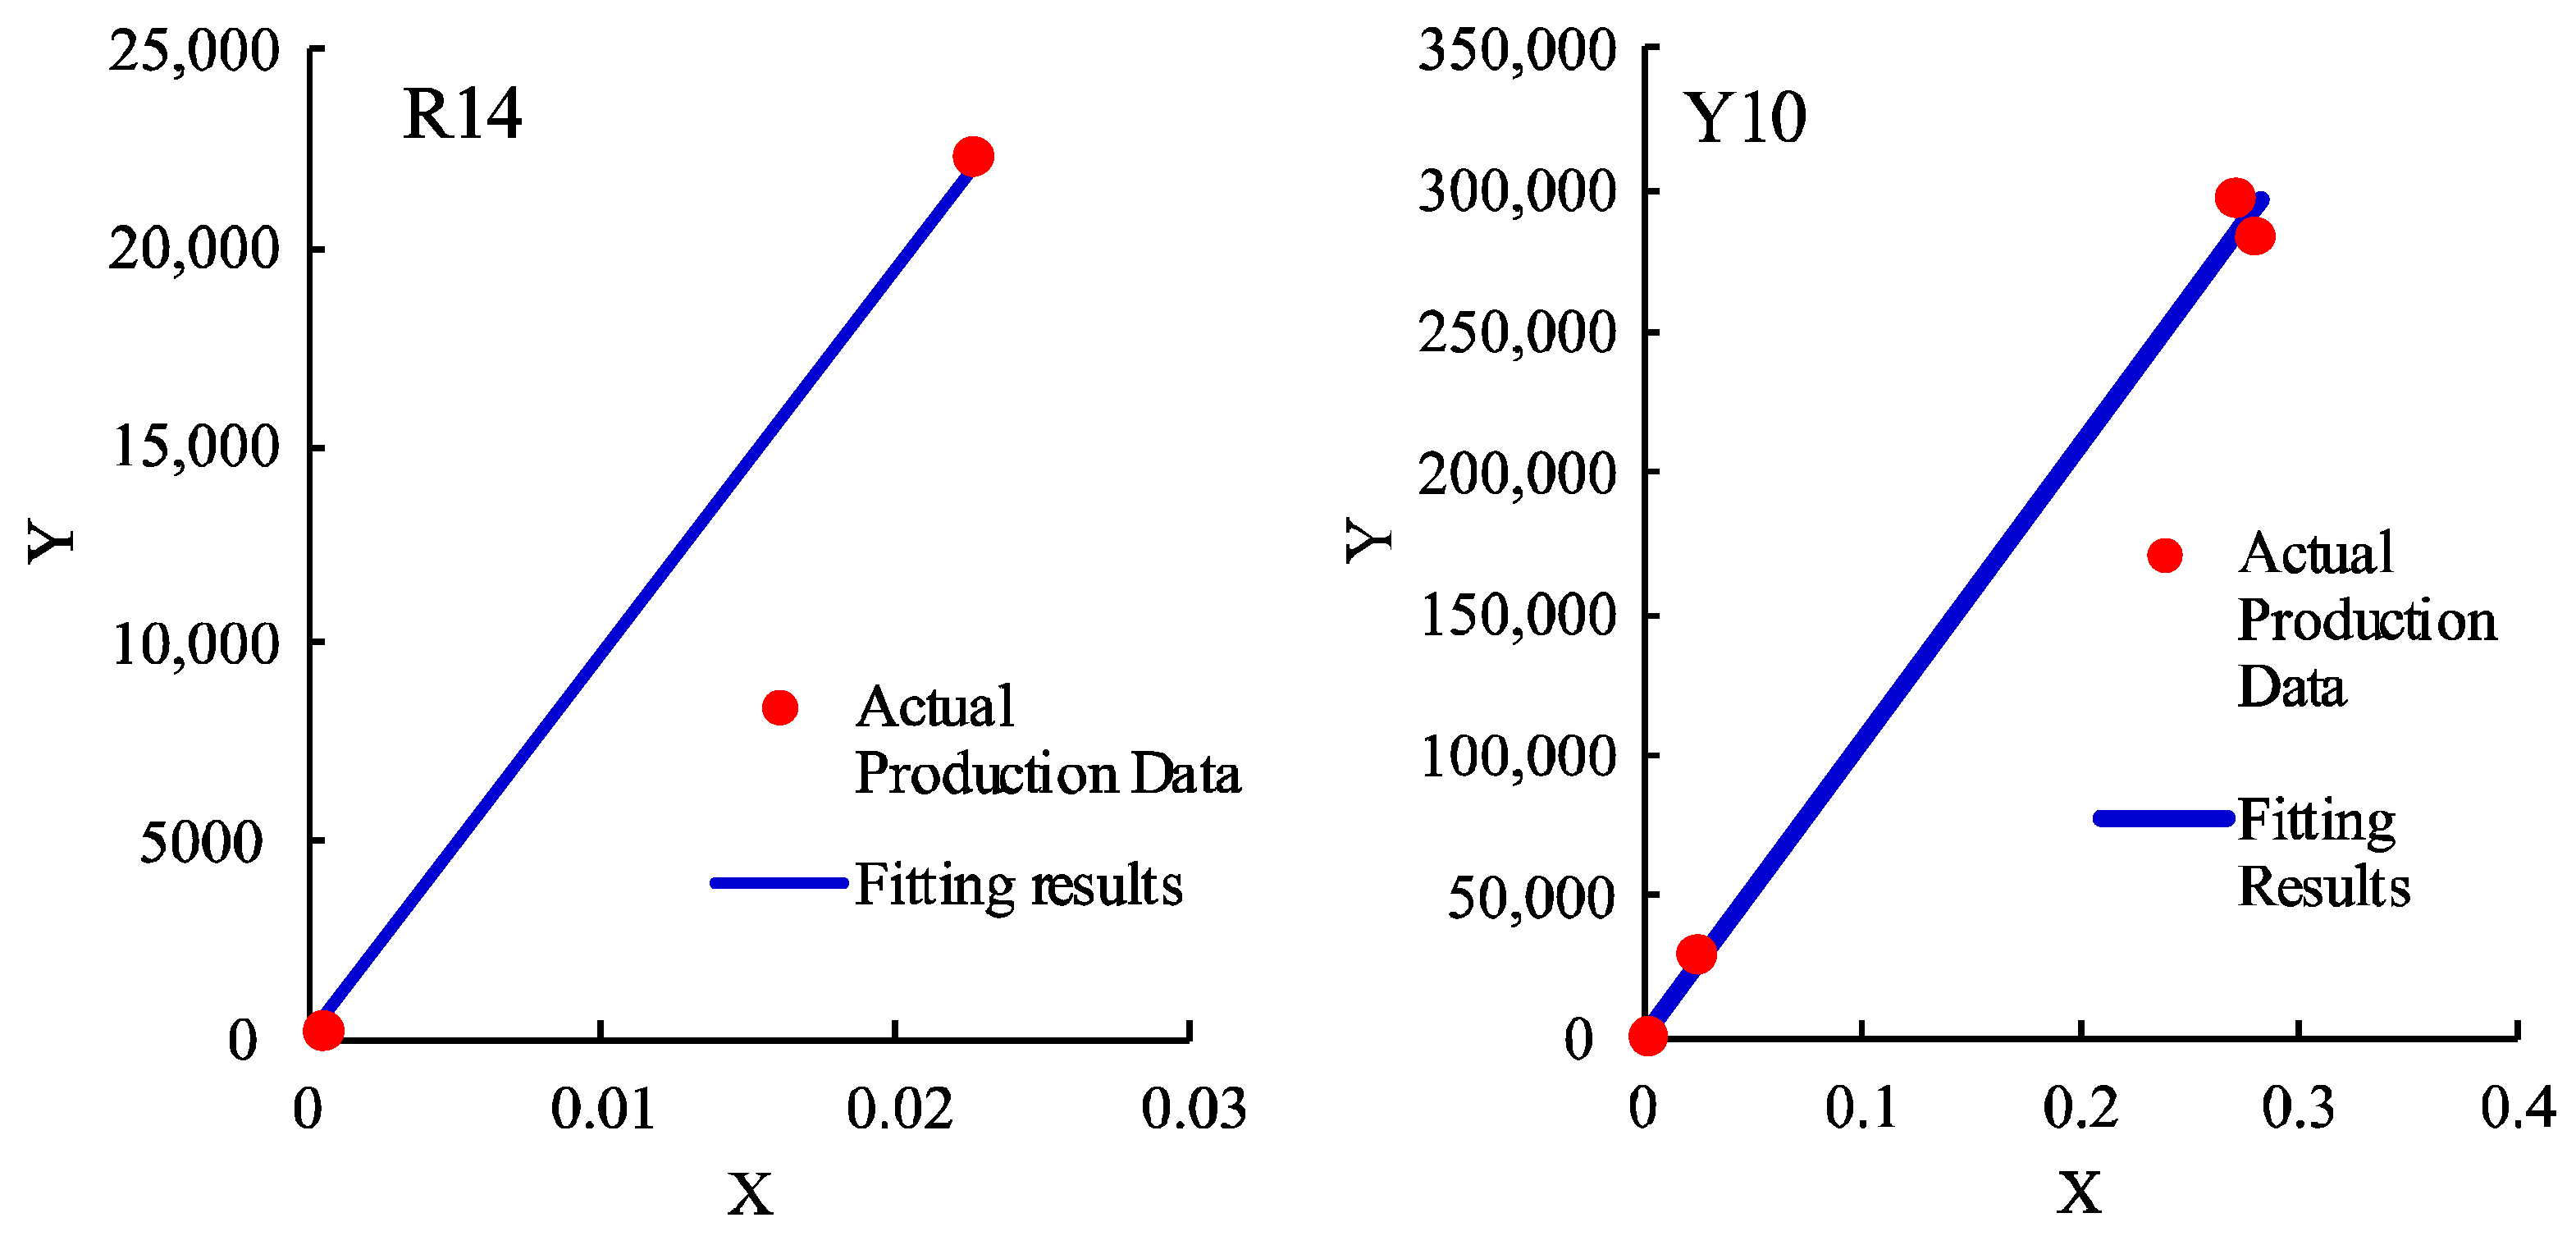
Figure 13 presents the fitting results for production data and the calculated reservoir pressure without aquifer support for wells R14 and Y10. The relative fitting errors for these two wells are 5.92% and 7.36%, respectively. The strong agreement between the fitted curves and actual data indicates that the proposed model is applicable and reliable in capturing the production behavior of fractured vuggy reservoirs.

Figure 13.
Fitting results of production data for wells R14 and Y10, respectively.
Table 6 summarizes the reserve estimates for five representative wells (Y5, R14, Y10, F10, and L7) using five different approaches: (1) the crude oil expansion method, which considers only oil compressibility and solution gas drive; (2) the depletion-only method, which neglects aquifer support; (3) the proposed coupled material balance method developed in this study; (4) the Blasingame method; (5) the rate transient analysis (RTA) method.
Table 6.
The results of the calculation of the reservoir reserve.
The results clearly indicate that both the crude oil expansion and depletion-only methods significantly overestimate the recoverable reserves. For example, reserve estimates for wells F10 and L7 reach 1220 × 104 t and 11,950.8 × 104 t, respectively, when the influence of aquifer influx is neglected. These estimates are considerably inflated compared to the actual production performance. In contrast, the proposed method yields more realistic and conservative reserve values of 38.35 × 10⁴ t and 88.8 × 10⁴ t for the same wells, closely aligning with reservoir performance data and aquifer diagnostics.
Moreover, when compared with results from the Blasingame and RTA methods, the proposed method provides a more conservative estimate that better reflects the effective reservoir-controlled production capacity. Although both the Blasingame and RTA methods incorporate transient flow behavior and have been widely used in unconventional and low-permeability systems, they exhibit limitations when applied to fractured vuggy reservoirs influenced by strong water drive.
These results not only validate the theoretical rationality of the proposed coupled material balance approach but also establish a more practical and realistic framework for reserve estimation in fractured vuggy reservoirs with active aquifer systems. By effectively differentiating between intrinsic reservoir energy and external water drive, the method enhances the accuracy of development planning and contributes to more robust risk mitigation strategies in strongly water-supported carbonate reservoirs.
5.2. Influence of Aquifer Multiple and Contribution Pressure
The aquifer multiple represents the degree of external water influx relative to the OOIP, whereas the aquifer contribution pressure indicates the degree of pressure support provided by the water-bearing formations. These two indicators offer insights into the energy dynamics of each well. Table 7 and Figure 14 present the results of the aquifer multiple and contribution pressure calculations, respectively.
Table 7.
The results of the calculation of the aquifer multiple and the contribution pressure.
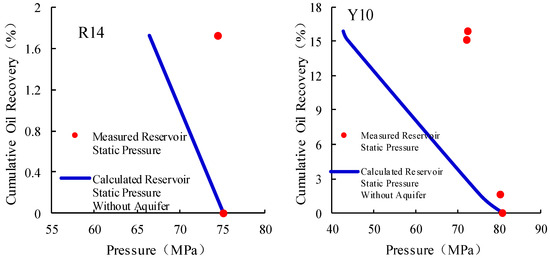
Figure 14.
Calculated reservoir static pressure without aquifer for wells R14 and Y10, respectively.
Wells Y5 and R14 display aquifer multiples of 18.7 and 19.53, respectively, along with substantial aquifer contribution pressures of 43.88 MPa and 7.92 MPa. These values confirm that external aquifers provide significant pressure support, which enhances sweep efficiency and sustains reservoir pressure over time.
In contrast, well Y10 exhibits a moderate aquifer multiple of 11 and a contribution pressure of 30.11 MPa. The smaller difference between the depletion-only estimate and the model-derived reserve indicates relatively limited aquifer support, resulting in reduced displacement efficiency and a more moderate pressure maintenance effect.
Although wells F10 and L7 have extremely high aquifer multiples of 62.16 and 212.13, respectively, they yield relatively low effective recoverable reserves when using the proposed model. This suggests that strong aquifer support does not necessarily translate into high reserve recovery, particularly if the reservoir exhibits strong heterogeneity and weak connectivity, or if production is constrained to early-time data without significant depletion progression.
This analysis illustrates the importance of incorporating dynamic aquifer energy into reserve estimation models, particularly in complex, fractured vuggy systems. The proposed material balance method provides a more realistic representation of reservoir behavior by quantifying the contribution of edge and bottom water. It avoids the significant overestimation commonly introduced by models that ignore aquifer influx and better aligns with actual production performance.
Moreover, while high aquifer multiples generally indicate stronger external support, effective reserve recovery still depends on reservoir connectivity, fracture distribution, and depletion history. As such, reserve models must integrate both geologic characteristics and dynamic pressure data to improve prediction accuracy.
6. Conclusions
This study combines physical experiments with a coupled material balance model to investigate the effect of varying aquifer multiples on reserve recovery in fractured vuggy reservoirs. The proposed model accurately predicts reserve recovery under different water drive intensities and offers a practical tool for optimizing reservoir development and water injection strategies. The main findings are summarized as follows:
- (1)
- Oil and gas recovery increases with rising aquifer multiples in both single- and multi-fracture–vug cores, but the growth rate gradually declines. At 100 PV, cumulative oil recovery reaches 84.3% and 81.3% for the single- and multi-fracture–vug cores, respectively, with the difference mainly attributed to structural complexity and blind-end effects in the latter.
- (2)
- Aquifer strength strongly influences water-cut evolution. Below 20 PV, limited water influx confines displacement to main flow paths, delaying water breakthrough. Above 20 PV, earlier and sharper water breakthrough occurs, especially under strong aquifer support, resulting in a rapid escalation of the water cut.
- (3)
- The model fits the experimental data with over 94% accuracy, effectively capturing the relationship between the reserve and the aquifer. It enables precise calculations of reserve and aquifer multiple values, verifying its applicability to fractured vuggy reservoirs.
- (4)
- In field conditions, aquifer support significantly delays pressure depletion. Higher aquifer multiples provide greater pressure maintenance, prolonging reservoir life. Comparing simulated pressure without aquifer support quantifies this contribution, confirming the aquifer’s critical role in sustaining reservoir energy.
Author Contributions
Conceptualization, X.D.; Methodology, Z.L. and P.W. (Peng Wang 1); Validation, Y.D.; Formal analysis, P.W. (Peng Wang 1) and Z.W.; Investigation, P.W. (Peng Wang 1); Data curation, Z.L. and Z.W.; Resources, X.D. and P.W. (Peng Wang 2); Software, X.D., Z.L. and P.W. (Peng Wang 2); Supervision, Z.W.; Funding acquisition, P.W. (Peng Wang 2); Writing—original draft, H.T.; Writing—review & editing, H.T., J.L., and Y.D.; Project administration, J.L. All authors have read and agreed to the published version of the manuscript.
Funding
This work was supported by China National Petroleum Corporation’s Key Applied Technology Project: “Research on Benefit Development and Enhanced Recovery of Ultra Deep Fault Controlled Carbonate Oil Reservoirs” (2013ZZ16YJ02).
Data Availability Statement
The original contributions presented in the study are included in the article, further inquiries can be directed to the corresponding author.
Conflicts of Interest
Authors Xingliang Deng, Zhiliang Liu, Peng Wang, Peng Wang, Jun Li and Yao Ding were employed by PetroChina Tarim Oilfield Company. Authors Xingliang Deng and Zhiliang Liu were employed by R&D Center for Ultra Deep Complex Reservoir Exploration and Development, CNPC. The remaining authors declare that the research was conducted in the absence of any commercial or financial relationships that could be construed as a potential conflict of interest. The authors declare that this study received funding from China National Petroleum Corporation. The funder was not involved in the study design, collection, analysis, interpretation of data, the writing of this article or the decision to submit it for publication.
Nomenclature
| Rwo | aquifer water–reservoir oil ratio |
| Vw | volume of aquifer multiples |
| Vci | reservoir volume under initial conditions |
| Vvi | volume of vug |
| Vfi | volume of fracture |
| Vmi | volume of matrix pore |
| Vb | rock volume |
| φv | porosity of vug |
| φf | porosity of fracture |
| φm | porosity of matrix |
| Np | cumulative oil production |
| Swmc | saturation of irreducible water in matrix |
| Swfc | saturation of irreducible water in fracture |
| Swvc | saturation of irreducible water in vug |
| ΔV | change in reservoir volume |
| ΔVp | reduction in reservoir pore volume |
| ΔVwc | expansion volume of irreducible water |
| ΔVg | remaining gas volume |
| W | remaining water volume in reservoir |
| Vp | total volume of pore space |
| Cp | compressibility factor of reservoir rock |
| Δp | differential pressure |
| ΔVwc | volume expansion of irreducible water |
| Vwc | volume of irreducible water |
| Cw | compressibility of irreducible water |
| ΔVg | reservoir gas storage capacity |
| N | reservoir reserves |
| Rsi | dissolved gas–oil ratio of crude oil under primitive conditions |
| Rs | dissolved gas–oil ratio of crude oil under current conditions |
| Bg | volume coefficient of gas phase |
| Np | cumulative oil production |
| Rp | accumulated gas–oil ratio of reservoir production |
| W | total reservoir water storage |
| Winj | injected water volume into reservoir |
| Wp | accumulated water production |
| Bw | volume coefficient of water |
| Co | compressibility coefficient of oil phase |
| Bt | two-phase volume coefficient, Bt = Bo + (Rsi − Rs)Bg |
| Bo | volume coefficient of oil phase |
| Cc | comprehensive compressibility coefficient of fractured vuggy reservoirs |
References
- Lu, X.B.; Cai, Z.X. A study of the paleo-cavern system in fractured-vuggy carbonate reservoirs and oil/gas development: Taking the reservoirs in Tahe oilfield as an example. Oil Gas Geol. 2010, 31, 22–27. [Google Scholar]
- Yan, X.F.; Zou, W.H.; Chen, G.; Luo, X.Y.; Dai, C.R. Calculation method of oil-water interface in carbonate slit-hole type reservoirs—A case study of Lungu 15 block in Tarim Oilfield. Pet. Geol. Eng. 2012, 26, 67–69. [Google Scholar]
- Zhao, R.; Zhao, T.; Li, H.L.; Deng, S.; Zhang, J.B. Fault-controlled fracture-cavity reservoir characterization and main-controlling factors in the Shunbei hydrocarbon field of Tarim Basin. Spec. Oil Gas Reserv. 2019, 26, 8–13. [Google Scholar]
- Zhang, J.; Bao, D.; Yang, M.; He, C.J.; Deng, G.X.; Zhang, H.T. Analysis on fracture-cave structure characteristics and its controlling factor of palaeo subterranean rivers in the western Tahe Oilfield. Pet. Geol. Recovery Effic. 2018, 25, 33–39. [Google Scholar]
- Kang, Z.J.; Li, H.K. Characteristics of Ordovician carbonate reservoirs in the Tahe Oilfield. Daqing Pet. Geol. Dev. 2014, 33, 21–26. [Google Scholar]
- Lv, X.R.; Sun, J.F.; Li, H.K.; Xia, D.L.; Wu, X.W.; Han, K.L.; Hou, J.G. Fine geological modeling technology of deep carbonate seam-hole reservoirs in the Tarim Basin. Oil Gas Geol. 2024, 45, 1195–1210. [Google Scholar]
- Merchan, P.S.; Carrillo, Z.C.; Ordonez, A. The New, Generalized material balance equation for naturally fractured reservoirs. In Proceedings of the Latin American and Caribbean Petroleum Engineering Conference, Cartagena de Indias, Colombia, 31 May–30 June 2009. [Google Scholar]
- Penuela, G.; Idrobo, E.A.; Ordonez, A.; Medina, C.E.; Meza, N.S. A New Material-Balance Equation for Naturally Fractured Reservoirs Using a Dual-System Approach. In Proceedings of the SPE Western Regional Meeting, Bakersfield, CA, USA, 26–30 March 2001. [Google Scholar]
- Li, L.; Du, C.H.; Hou, X.H.; Fu, Y.F.; Liu, D.C. Research on the application of the calculation method of water body parameters in carbonate reservoirs. J. Guangdong Inst. Petrochem. Technol. 2021, 31, 5–8. [Google Scholar]
- Wang, S.S.; Ogbonnaya, O.; Chen, C.; Yuan, N.; Shiau, B.; Harwell, J.H. Low-temperature in situ CO2 enhanced oil recovery. Fuel 2022, 329, 125425. [Google Scholar] [CrossRef]
- Xiong, Y.; Teng, P.; Niu, X.N.; Cai, M.J. Research on new model of well test interpretation for seam-hole type reservoirs in Tarim Oilfield. Oil Gas Well Test. 2017, 26, 1–4+75. [Google Scholar]
- Cheng, H.L.; Wang, L.S.; Yang, W.M.; Wang, X.; Wang, X.; Liu, Z.B. Numerical well test analysis of seam-hole type reservoirs with the presence of neighboring well influence. In Proceedings of the 2015 International Conference on Oil and Gas Field Exploration and Development, Xi’an Petroleum University, Shaanxi Petroleum Society, Xi’an, China, 20–21 September 2015; PetroChina: Beijing, China, 2015; pp. 248–254. [Google Scholar]
- Wang, S.S.; Chen, C.L.; Li, K.R.; Yuan, N.; Shiau, B.; Harwell, J.H. In situ CO2 enhanced oil recovery: Parameters affecting reaction kinetics and recovery performance. Energy Fuels 2019, 33, 3844–3854. [Google Scholar] [CrossRef]
- Jiao, J.W. Estimation of Dynamic Reserves by Well Test Method in Tahe Fractured-Vuggy Carbonate Reservoir. Master’s Thesis, Chengdu University of Technology, Chengdu, China, 2020. [Google Scholar]
- Fu, B. Research on Dynamic Reserves Evaluation and Well Test Interpretation of Carbonate Reservoirs. Master’s Thesis, China University of Petroleum, Beijing, China, 2019. [Google Scholar]
- Lv, X.R.; Liu, Z.C.; Zhu, G.L. Well-controlled reserves evaluation of fractured-vuggy reservoirs based on PDA method. Fault Block Oil Gas Fields 2017, 24, 233–237. [Google Scholar]
- Yu, Q.Y.; Hu, X.Y.; Li, Y.; Jia, Y. Dynamic evaluation method of oil well parameters and reservoir parameters for drilling large karst caves. Pet. Nat. Gas Geol. 2020, 41, 647–654. [Google Scholar]
- Yu, Q.Y.; Liu, P.C.; Li, Y.; Xia, J.; Hao, M.Q.; Li, B.Z. Research on the mathematical model of water intrusion dynamics and influencing factors of horizontal wells in seam-hole type bottomwater gas reservoirs. Mod. Geol. 2017, 31, 614–622. [Google Scholar]
- Yu, Q.Y.; Liu, P.C.; Li, Y.; Hao, M.Q.; Xia, J.; Li, B.Z. Quantitative evaluation of water body and reservoir parameters in marginal bottom water reservoirs. Oil Gas Geol. Recovery 2017, 24, 85–90. [Google Scholar]
- Wan, W. Dynamic Reserves of Carbonate Fractured-Vuggy Reservoirs in Tahe Oilfield Estimated by Water Injection Indicator Curve Method. Master’s Thesis, Chengdu University of Technology, Chengdu, China, 2020. [Google Scholar]
- Li, H.B.; Wang, C.L.; Niu, G.; Liang, H.T.; Bu, L.L.; Gu, J.Y. Dynamic reserve evaluation of fractured-vuggy reservoirs with closed water-taking Halahatang Oilfield in Tarim Basin as an example. Xinjiang Pet. Geol. 2020, 41, 321–325. [Google Scholar]
- Zhu, G.L.; Sun, J.F.; Liu, Z.C. Reserve calculation method for gas drive in fractured-vuggy reservoirs in Tahe Oilfield. Pet. Nat. Gas Geol. 2019, 40, 436–442+450. [Google Scholar]
- Song, H.W.; Zhang, Z.; Ren, W.B. Discussion on reserve calculation of fractured-vuggy carbonate reservoir by material balance method. Nat. Gas Explor. Dev. 2012, 35, 32–35+49+81. [Google Scholar]
- Li, J.L.; Zhang, H.F. Application of material balance method in energy evaluation of fractured-vuggy carbonate reservoirs. Pet. Nat. Gas Geol. 2009, 30, 773–778+785. [Google Scholar]
- Ma, L.P.; Li, Y. Study on calculation method of material balance equation for fractured-vuggy reservoir. J. Southwest Pet. Univ. 2007, 29, 66–68. [Google Scholar]
- Li, Y.; Yu, Q.Y.; Li, B.Z.; Chen, L.X. Quantitative evaluation method for dynamic reserves and water body size of fractured-vuggy water-bearing reservoirs. China Sci. Tech. Sci. 2017, 47, 708–717. [Google Scholar]
- Shahamat, M.S.; Clarkson, C.R. Multiwell, Multiphase Flowing Material Balance. SPE Reserv. Eval. Eng. 2017, 31, 445–461. [Google Scholar] [CrossRef]
- Le, P.; Yang, R.Y.; Guo, Z.L.; Zhang, W.; Wang, X.L.; Wang, X.M. An improved dynamic reserve calculation method for seam-hole type reservoirs. In Proceedings of the 2022 International Conference on Oil and Gas Field Exploration and Development, Urumqi, China, 16–18 August 2022. [Google Scholar]
- Geng, J.; Le, P.; Yang, W.M.; Yang, B.; Zhao, B.; Zhang, S.J. Calculation method of dynamic reserves in fracture-controlled carbonate reservoirs. Xinjiang Pet. Geol. 2024, 45, 499–504. [Google Scholar]
- Yuan, F.Y.; Wang, H.P.; Le, P.; Zhang, S.H.; Fang, Q.Z.; Zeng, H.B. Simulation analysis of factors affecting gas injection in single wells of seam-hole carbonate reservoirs. Unconv. Oil Gas 2023, 10, 86–94. [Google Scholar]
- GB/T 26981-2020; Analysis Methods for Reservoir Fluid Physical Properties. Standardization Administration of China (SAC): Beijing, China, 2020.


Disclaimer/Publisher’s Note: The statements, opinions and data contained in all publications are solely those of the individual author(s) and contributor(s) and not of MDPI and/or the editor(s). MDPI and/or the editor(s) disclaim responsibility for any injury to people or property resulting from any ideas, methods, instructions or products referred to in the content. |
© 2025 by the authors. Licensee MDPI, Basel, Switzerland. This article is an open access article distributed under the terms and conditions of the Creative Commons Attribution (CC BY) license (https://creativecommons.org/licenses/by/4.0/).