Article

Integrating Laboratory-Measured Contact Angles into Time-Dependent Wettability-Adjusted LBM Simulations for Oil–Water Relative Permeability

1
Shenzhen Branch of China National Offshore Oil Corporation Limited, Shenzhen 518054, China
2
ICORE GROUP INC, Shenzhen 518057, China
3
Research Institute of Tsinghua University in Shenzhen, Shenzhen 518057, China
4
School of Computer Science, Nanjing University of Information Science and Technology (NUIST), Nanjing 210044, China
*
Author to whom correspondence should be addressed.
Energies 2025, 18(9), 2404; https://doi.org/10.3390/en18092404
Submission received: 27 March 2025 / Revised: 28 April 2025 / Accepted: 5 May 2025 / Published: 7 May 2025

Abstract

:
Oil–water relative permeability is essential for reservoir development and enhanced oil recovery (EOR). Traditional core displacement experiments assume static wettability, whereas in real reservoirs, wettability evolves over time due to waterflooding and rock–fluid interactions, significantly altering flow behavior. Existing numerical methods, including conventional lattice Boltzmann models (LBM), fail to account for these changes and lead to inaccurate predictions. This study integrates laboratory-measured contact angles into a time-dependent wettability-adjusted LBM framework, ensuring real-time wettability updates during simulation. Micro-CT imaging captures oil–water displacement and contact angle evolution at different flooding stages, which are incorporated into the Shan–Chen LBM model. Results show that neglecting the time-dependent wettability overestimates the residual oil saturation and underestimates the water-phase permeability. In contrast, our method reduces the residual oil saturation by up to 35% and expands the two-phase flow region by 15%, aligning closely with experimental observations. This approach enhances the accuracy of relative permeability modeling, providing a more reliable tool for optimizing waterflooding strategies and improving oil recovery efficiency.

1. Introduction

Oil–water relative permeability is a fundamental parameter for evaluating multiphase flow in porous media, playing a crucial role in reservoir characterization and enhanced oil recovery (EOR) strategies. Traditional core displacement experiments remain the primary method for obtaining relative permeability curves [1,2]. However, these experiments typically assume static wettability and fixed pore structures, neglecting the fact that wettability evolves over time in real reservoirs due to prolonged waterflooding, mineral dissolution, and fluid–rock interactions [3,4,5]. Also, it is recognized that core samples represent only localized heterogeneity, and extrapolation to reservoir scale requires further integration with larger-scale models.
Neglecting time-dependent wettability changes can lead to significant errors in estimating relative permeability, residual oil saturation, and displacement efficiency. In water-wet formations, continuous water injection can displace oil from larger pores while leaving behind a fraction of oil trapped in smaller pores due to capillary forces. Over time, interactions between injected water and rock minerals can modify the surface wettability, potentially leading to increased water-phase connectivity and enhanced displacement efficiency. Conversely, in oil-wet or mixed-wet reservoirs, injected water preferentially flows through water-wet pathways, bypassing oil-saturated regions and resulting in lower sweep efficiency and higher-than-expected residual oil saturation [6]. These wettability transitions significantly impact oil–water distribution but are challenging to capture using traditional experiments alone, which are not only time-consuming but also limited in observing pore-scale interactions in real-time.
Recent advancements in pore-scale modeling have significantly deepened our understanding of multiphase flow dynamics in porous media, particularly concerning wettability effects and relative permeability [7,8,9,10,11,12,13]. Among the various modeling techniques, the lattice Boltzmann method (LBM) has gained prominence due to its capability to simulate multiphase flow at the pore scale while incorporating microscopic interactions [14,15,16,17,18]. The Shan–Chen multiphase LBM model, in particular, is widely utilized for simulating oil–water systems because it inherently accounts for interfacial tension, capillary forces, and multiphase interactions [19,20]. A comprehensive review emphasizing micro- and nanoscale effects in numerical modeling approaches for multiphase flow in porous media is available in [21]. The authors highlighted the challenges in capturing fluid–fluid and fluid–solid interactions at these scales and the necessity for models that can accurately represent these complex dynamics.
To address these challenges, two-phase lattice Boltzmann simulations were conducted on a Ketton carbonate image to investigate surface wetting conditions, comparing different effective wetting models against pore-scale experimental data [22]. The findings underscore the importance of accurately characterizing surface wetting to predict multiphase flow behaviors effectively. Building upon this, a comprehensive framework for multiphase pore-scale modeling was developed by integrating high-resolution micro-CT imaging with lattice Boltzmann and pore network models [23]. By calibrating contact angles to match observed fluid distributions in Bentheimer sandstone and a reservoir rock under mixed-wet conditions, the authors successfully predicted relative permeability and capillary pressure, demonstrating the framework’s robustness in simulating multiphase flow in porous media. Further exploring displacement mechanisms, the effect of wettability heterogeneity on the relative permeability of two-phase flow in porous media was investigated using a lattice Boltzmann approach [24]. It was found that wettability variations significantly influence fluid distribution and flow pathways, affecting the overall permeability and highlighting the need to consider such heterogeneities in modeling efforts. Complementing these pore-scale approaches, an open-source micro-continuum model for multiphase flow in multiscale porous media was introduced [25]. The multiphase Darcy-Brinkman model was found to bridge the gap between pore-scale and continuum-scale simulations, allowing for accurate representation of flow in systems containing both solid-free regions and porous matrices.
Collectively, these studies emphasize the critical role of accurate wettability characterization and the incorporation of micro- and nanoscale effects in modeling multiphase flow in porous media. Advancements in imaging techniques, such as micro-CT, combined with robust simulation frameworks, like the lattice Boltzmann method, have paved the way for more precise predictions of fluid behavior, which are essential for optimizing processes like enhanced oil recovery and groundwater remediation.
Despite these advancements, a common limitation in many lattice Boltzmann method (LBM) studies is the assumption of constant wettability conditions throughout the simulation [26,27,28]. This assumption fails to capture the time-dependent evolution of contact angles observed in real reservoirs, leading to inaccuracies in predicting fluid distribution, residual oil saturation, and displacement efficiency. While some models attempt to incorporate wettability effects, they often oversimplify these changes or use static parameters that do not reflect real-time variations. Consequently, existing models frequently deviate from experimental observations, particularly in long-term waterflooding scenarios where wettability alterations play a crucial role.
To address these challenges, this study integrated laboratory-measured contact angles into a time-dependent wettability-adjusted LBM framework. Unlike previous works that assume static wettability, we experimentally measured the evolution of oil–water contact angles at different flooding stages using micro-CT imaging and displacement experiments. These measured contact angles were then incorporated into the Shan–Chen multiphase LBM model, adjusting wettability conditions throughout the simulation. This approach offers enhanced accuracy, improved predictive capability, and optimized waterflooding strategies.

2. Methods

2.1. Experimental Procedure

The physical experiments in this study were conducted using core samples from the LH16 and LH20 well areas in the Liuhua Oilfield, Eastern South China Sea. A total of eight sandstone core samples were selected from each well area, ensuring that they represented typical mineralogical and petrophysical properties. From these, homogeneous core plugs with a diameter of 5 mm and a length of 20 mm were prepared for waterflooding experiments.
Prior to the experiments, all core samples underwent a thorough preparation process. They were first cleaned using a Soxhlet extraction method to remove residual hydrocarbons, followed by drying at 110 °C for 24 h. The cores were then vacuum-saturated with 5% KCl brine to ensure full pore-space saturation, after which crude oil was introduced under vacuum conditions to establish the initial oil saturation required for the displacement experiments.
Waterflooding experiments were carried out in a high-pressure core holder designed to replicate reservoir conditions. The experimental setup included a confining pressure of 20 MPa, a back pressure of 10 MPa, and a temperature of 80 °C. The displacing fluid, a KI-brine solution used to enhance contrast in micro-CT imaging, was injected to simulate the waterflooding process at a controlled flow rate of 0.005 mL/min. To capture the oil displacement process, a sequence of injection volumes ranging from 0.5 PV to 1000 PV (0.5, 1, 2, 5, 10, 20, 30, 50, 100, and 1000 PV) was applied. After each flooding stage, high-resolution micro-CT imaging with a 5 μm resolution was performed to visualize pore-scale oil–water distribution. The entire experiment for each sample lasted approximately 20 days. High-resolution micro-CT images of the core samples are presented in Figure 1, while their corresponding petrophysical properties and mineralogical compositions are summarized in Table 1.

2.2. Image Processing and Contact Angle Measurement

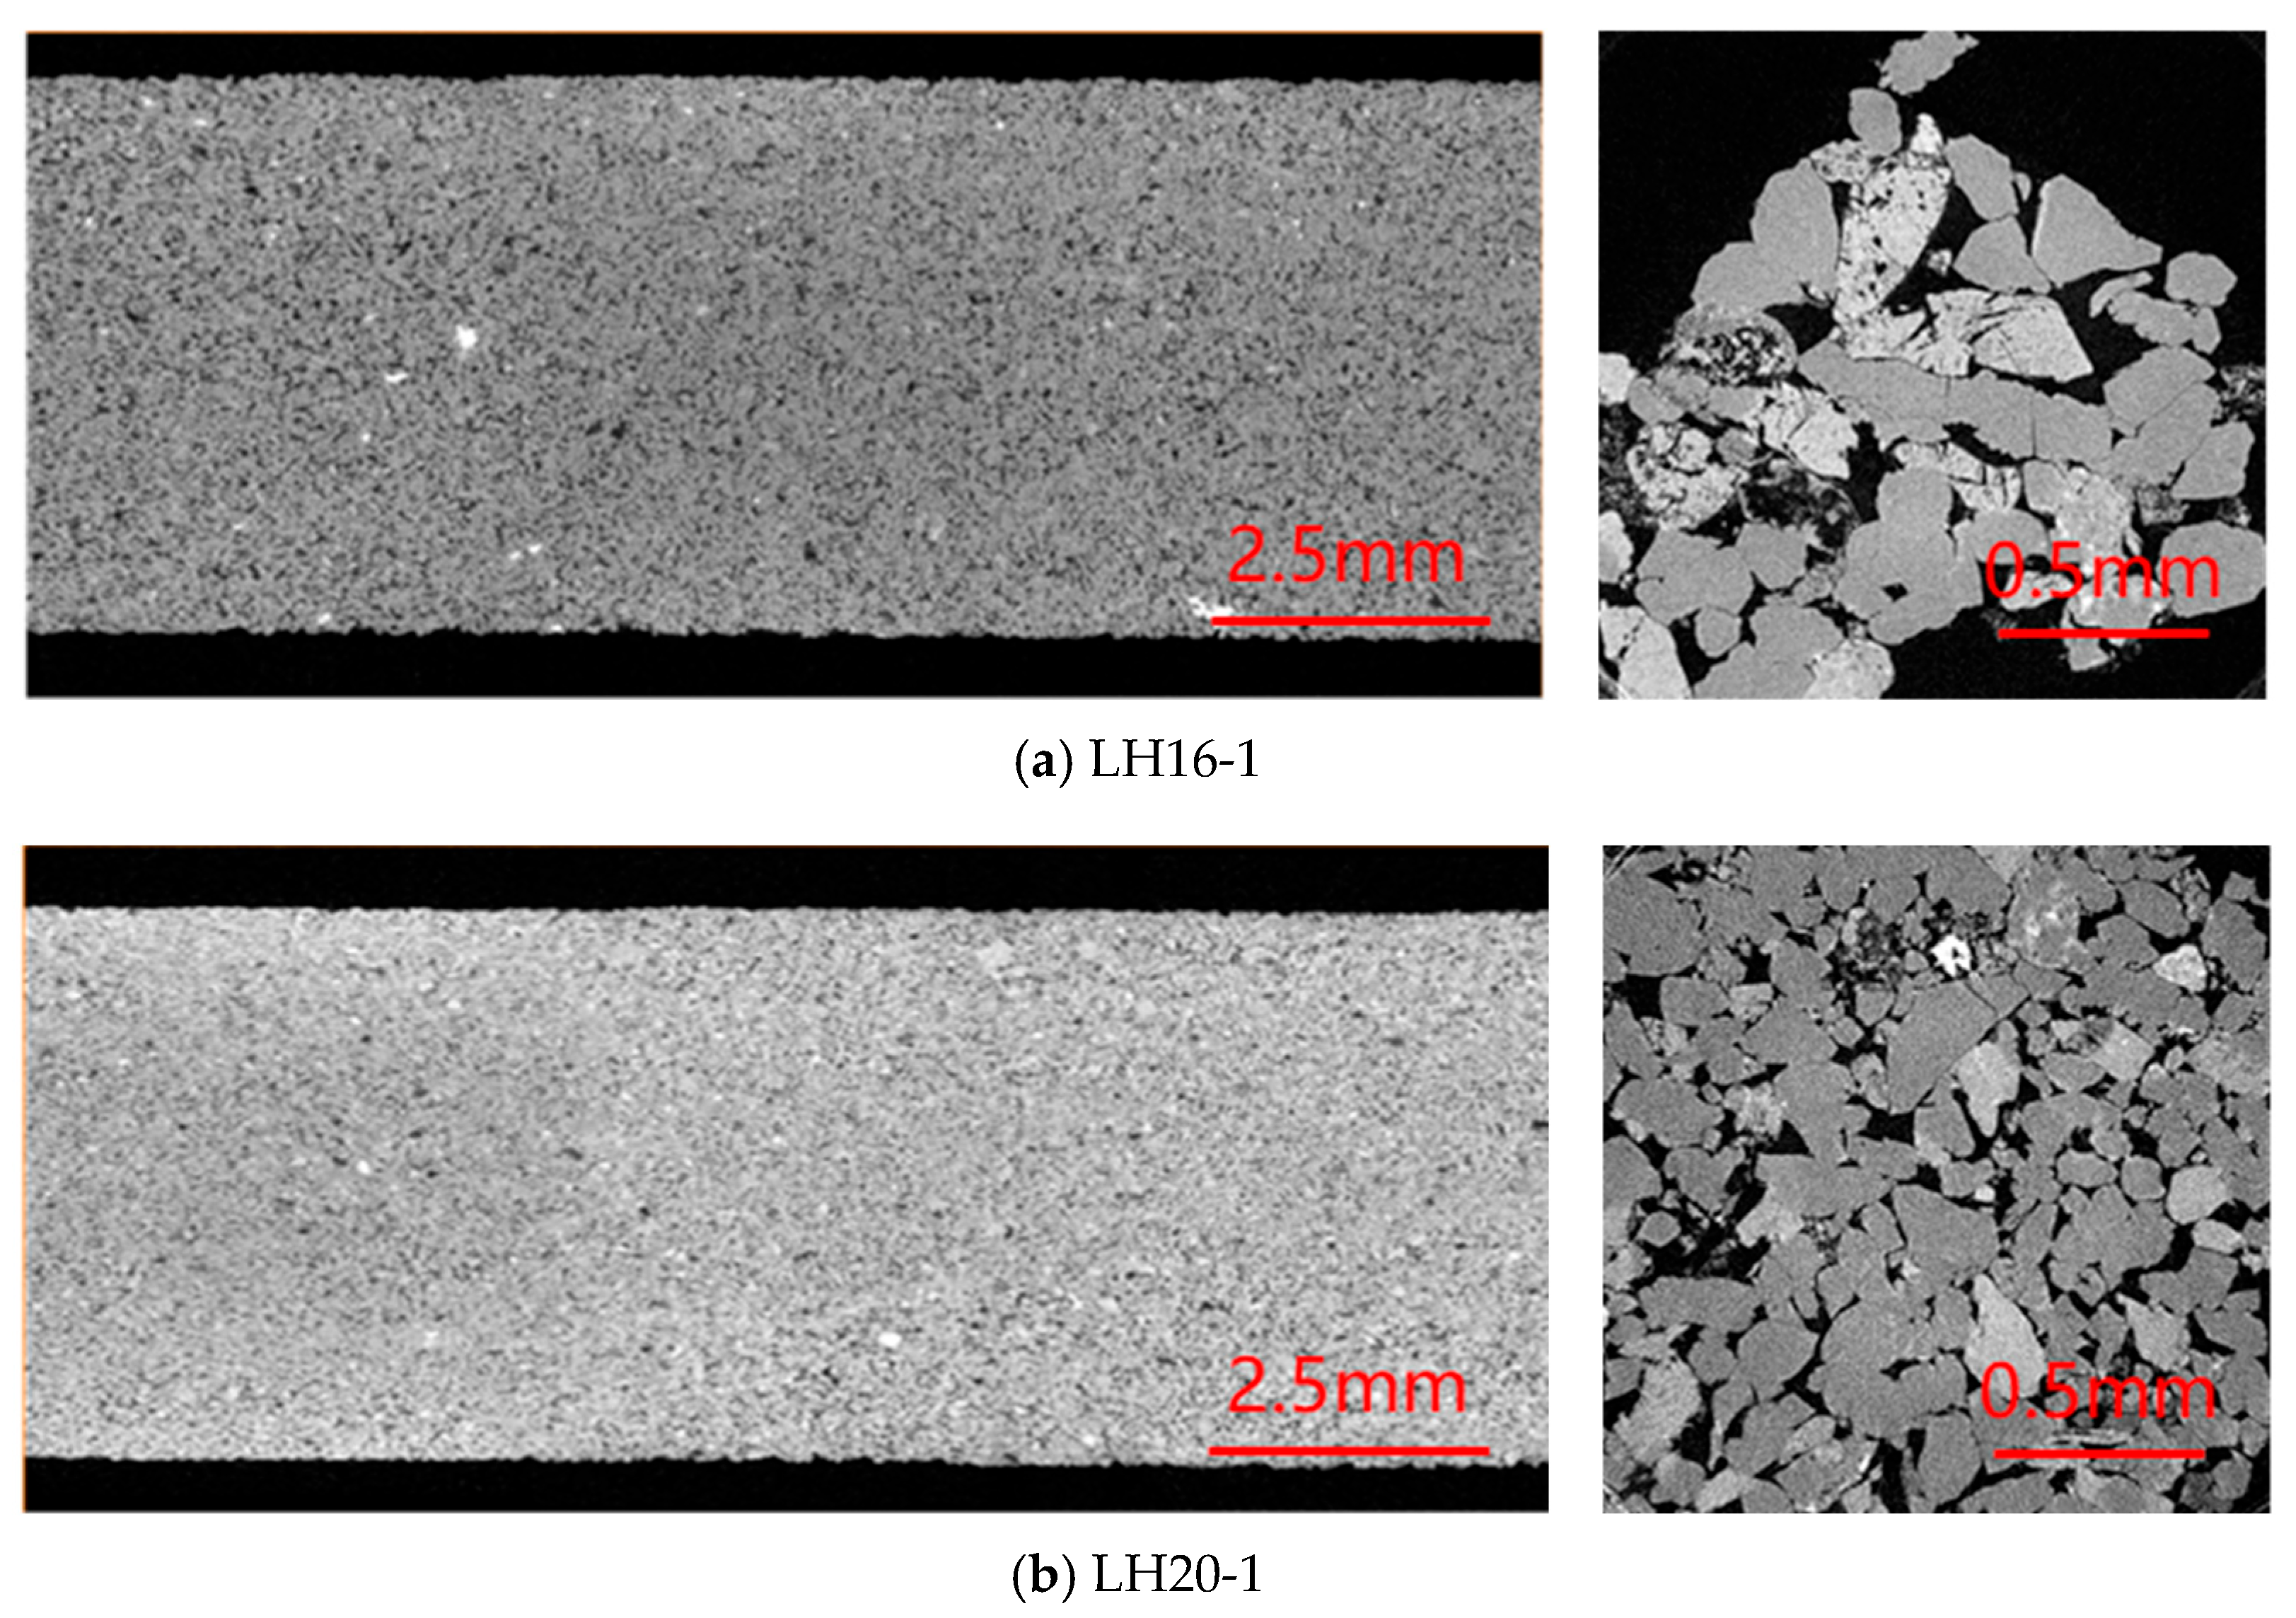
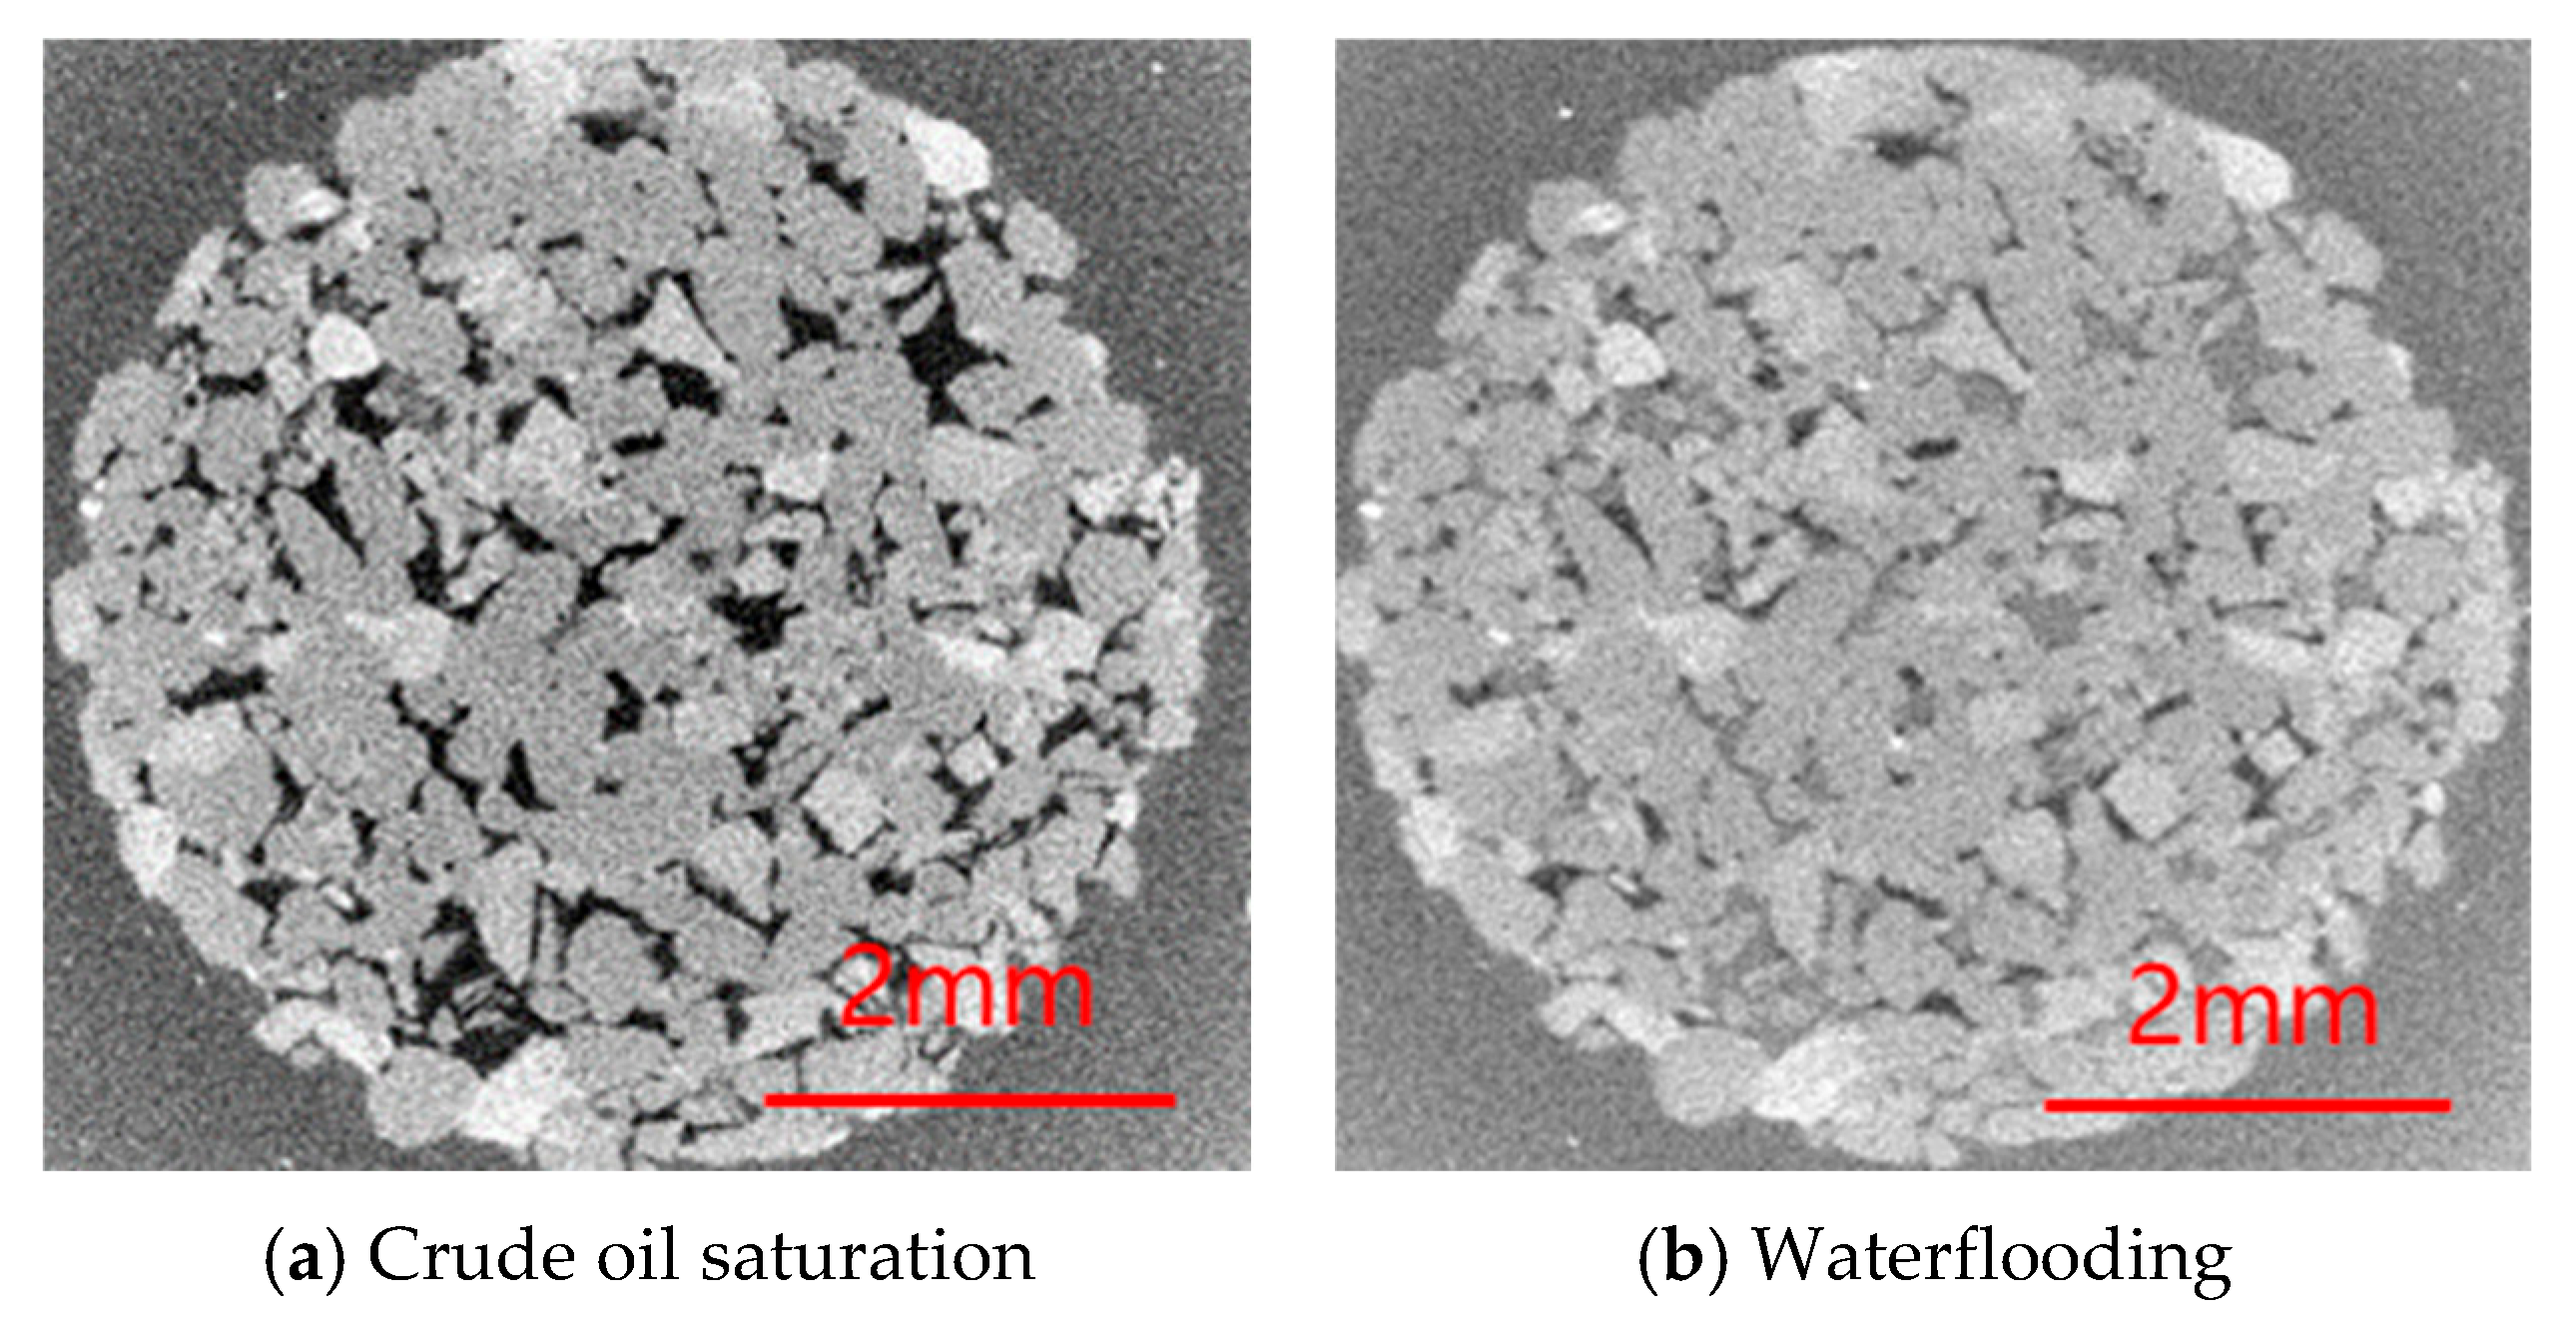
2.2.1. Micro-CT Image Processing

Micron-scale computed tomography (micro-CT) is a non-destructive 3D imaging technique that provides high-resolution visualization of a sample’s internal structure. In this study, micro-CT imaging was employed to analyze pore-scale oil–water distribution and characterize fluid displacement dynamics during waterflooding. To enhance image clarity and improve segmentation accuracy, a multi-step preprocessing workflow was applied to the raw CT scans, which were acquired using a QingNeng micro-CT scanner (Tianjin, China). The original scans exhibited noise and grayscale variations, necessitating the use of advanced image enhancement and segmentation techniques to ensure precise phase differentiation between the rock matrix, oil phase, and water phase. Noise reduction was performed using total variation denoising [29,30], which effectively suppresses background noise while preserving key structural features. Image segmentation was then conducted using Otsu’s thresholding method [31], which automatically determines the optimal grayscale threshold to distinguish the rock matrix, oil phase, and water phase.
Following segmentation, morphological operations were applied to refine phase boundaries and eliminate small artifacts introduced during thresholding. These operations included binary opening and closing to smooth interfaces and removing isolated noise pixels. The processed 3D images were then reconstructed into voxel-based digital rock models, enabling further analysis of fluid distributions at different flooding stages.
To quantify the evolution of oil and water saturation, volumetric analysis was performed on the segmented images. The proportion of oil and water phases within the pore space was calculated for each flooding stage, providing a direct measurement of displacement efficiency. Additionally, pore connectivity analysis was conducted to evaluate how water pathways expanded over time, particularly in response to wettability alterations.

2.2.2. Contact Angle Measurement

The contact angle between oil, water, and the rock surface serves as a critical parameter for characterizing wettability changes during waterflooding. In this study, contact angles were measured directly from the micro-CT images using a geometric analysis approach. The following procedure was employed to ensure accuracy and consistency across multiple flooding stages:
  • Extraction of oil–water interface regions—From the segmented 3D micro-CT datasets, localized regions containing clear oil–water-rock interfaces were selected. These regions were chosen based on pore-scale features where phase boundaries were well-defined and unaffected by image noise.
  • 2D slice generation and binarization—To facilitate geometric analysis, cross-sectional slices perpendicular to the displacement direction were extracted from the selected regions. The oil and water phases were converted into binary representations, highlighting the phase boundaries relative to the rock matrix.
  • Interface curvature fitting—The oil–water interface in each selected 2D slice was analyzed using curvature fitting algorithms to determine the tangent at the three-phase contact line. A polynomial or circular fitting method was applied depending on the interface shape, ensuring an accurate representation of the contact angle.
  • Angle calculation—The contact angle was measured as the angle between the fitted oil–water interface tangent and the normal vector of the rock surface. This step was repeated across multiple slices within the same flooding stage to obtain a statistically representative average contact angle.
  • Correction for resolution and curvature effects—To account for potential distortions caused by image resolution limitations, correction factors were applied based on known calibration standards. Additionally, local surface roughness and mineralogical variations were considered when interpreting contact angle trends.
To quantify wettability changes at different flooding stages, three-dimensional rock skeleton–oil–water datasets were analyzed by slicing along the displacement direction to extract binary 2D slices. This approach was adopted due to the current limitations in accurately reconstructing 3D contact angles from micro-CT images, which can be computationally intensive and may not always yield reliable results. Prior studies demonstrated that averaging 2D contact angles from micro-CT slices can provide reasonable approximations of 3D contact angles when full 3D reconstruction is not feasible. For instance, an automated method for measuring contact angles directly from 2D pore-space images was developed, demonstrating that this technique can effectively characterize wettability at the pore scale [32]. Similarly, a link between microscale contact angle measurements and core-scale wettability was established, supporting the validity of using 2D measurements for approximating 3D wettability characteristics [33]. Furthermore, an automatic method for estimating effective contact angles in situ was presented, reinforcing the applicability of 2D measurements in complex porous media [34]. Thus, the averaging approach from 2D contact angles served as a practical and validated method for estimating wettability in our study.
In this study, both the confining and back pressure conditions were set to facilitate the unsteady-state measurement of relative permeability. These pressure settings were kept consistent across all tests to maintain experimental comparability and to isolate the effect of wettability evolution under controlled flow regimes. If modified significantly, new measurements would be required to recalibrate contact angle and saturation input for simulation. The measured contact angles were analyzed as a function of pore volume injected (PV) to quantify how wettability evolved during the displacement process. Statistical analysis, including boxplot visualization and variance assessment, was performed to evaluate the consistency of contact angle measurements across different pores and flooding stages. By integrating these experimentally measured contact angles into the lattice Boltzmann simulations, the study ensured that numerical modeling reflected the real-time wettability alterations observed in the experiments. This approach significantly improved the accuracy of the relative permeability predictions compared to traditional models that assume static wettability conditions.

2.3. Numerical Simulation Using the Lattice Boltzmann Method

The numerical simulation of oil–water two-phase flow was conducted using the Shan–Chen multiphase multicomponent LBM model, which is well-suited for modeling interfacial tension and capillary forces in porous media. In this study, we employed the D3Q19 lattice structure, which is a commonly used discretization scheme in the lattice Boltzmann method for simulating three-dimensional fluid flows. The term “D3Q19” refers to a three-dimensional (D3) lattice with 19 discrete velocity directions (Q19). These include one resting direction, six directions along the Cartesian axes (±x, ±y, ±z), and twelve diagonal directions that connect nearest neighbors in three-dimensional space. The D3Q19 model offers a good balance between numerical stability and computational efficiency and is widely adopted in multiphase and porous media flow simulations. The governing equation for the LBM model is expressed as follows:
f i σ x + e i t , t + t = f i σ x , t 1 τ σ f i σ x , t f i σ , e q x , t + F i σ
where f i σ x , t is the density distribution function for phase σ, τ σ is the relaxation time related to kinematic viscosity, and F i σ is the external force term. The equilibrium distribution function follows:
f i σ , e q x , t = w i ρ σ 1 + e i · u σ e q c s 2 + e i · u σ e q 2 2 c s 4 u σ e q 2 2 c s 2
where w i represents the lattice weight, c s is the lattice sound speed, and μ is the macroscopic velocity. In the multiphase and multicomponent model, the total force acting on fluid particles, F σ , consists of two components, the interparticle force F c , σ and the fluid–solid interaction force F a d s , σ , expressed as follows:
F σ = F c , σ + F a d s , σ
The interparticle force is given by the following:
F c , σ x , t = G c φ σ x , t i w i φ σ x + e i t , t e i
where G c is the interaction strength parameter, which defines the force between like and unlike fluid particles. This parameter is related to interfacial tension, and selecting appropriate interaction strengths for water and oil phases enables effective phase separation. The function φ σ represents the average interaction potential, which follows an exponential relationship with density:
φ σ = ρ 0 ( 1 e x p ρ σ x / ρ 0 )
where ρ 0 is a reference density parameter that controls the nonlinearity and scaling of the interaction potential, and ρ σ is the local density of fluid component σ, which describes how much of that fluid is present in a given voxel or node. The fluid–solid interaction force, which determines wettability effects, is expressed as follows:
F a d s , σ x , t = G a d s , σ φ σ x , t i w i s x + e i t e i
where G a d s , σ is the strength of the fluid–solid interaction, and s x + e i t is an indicator function that takes the value 1 for solid nodes and 0 for fluid nodes. The parameter G a d s , σ controls the interaction intensity between each fluid component and the solid surface. For non-wetting fluids, G a d s , σ is positive, while for wetting fluids, it is negative, making it directly related to the contact angle. This dynamic update ensured that wettability evolution observed in the experiments was accurately reflected in the numerical simulation. Boundary conditions were carefully selected to maintain numerical stability and accuracy.
  • The bounce-back boundary condition was applied at solid boundary nodes to enforce the no-slip condition.
  • Periodic boundary conditions were used at flow domain boundaries to maintain continuity. The mirror boundary conditions were tested along the main flow axis, and their influence on the interior flow field and output parameters was found to be negligible.
  • At the inlet and the outlet, a static boundary condition [35] was used to control flow pressure.

2.4. Simulation Workflow and Parameter Calibration

The numerical simulations followed a structured workflow to ensure accuracy and consistency with experimental observations. First, micro-CT-derived pore structures were imported into the LBM simulation framework. Initial contact angles were assigned based on pre-flooding experimental measurements. As water injection proceeded, the contact angle was updated at each flooding stage (e.g., 0.5 PV, 1 PV, 2 PV, etc.) to match experimentally observed values obtained from micro-CT image analysis.
To achieve this, the experimentally measured contact angles were mapped to the corresponding fluid–solid interaction strength parameters G a d s , σ using a calibration procedure [36]. These calibrated G a d s , σ values were then applied at each stage of simulation to adjust the wettability conditions in real time. This approach enabled the LBM model to directly incorporate the effects of wettability evolution, accurately reflecting the time-dependent rock–fluid interactions observed in physical displacement experiments. In contrast, G c , which controls oil–water interfacial tension, is held constant throughout the simulation, as the fluid properties remain unchanged.
Relative permeability was calculated by measuring steady-state phase fluxes at each injection stage and applying Darcy’s law. The results were normalized by the absolute permeability obtained under single-phase flow conditions. The simulation results were validated against experimentally derived data, ensuring consistency in residual oil saturation and phase permeability trends. Table 2 summarizes the key simulation parameters used in this study.
The parameters listed in Table 2 were selected based on a combination of experimental calibration, literature validation, and numerical stability considerations specific to the Shan–Chen multiphase LBM framework. The lattice resolution (600 × 600 × 800) was determined based on the voxel resolution of the micro-CT scans, which was 5 μm, ensuring a 1:1 mapping between the image data and the LBM simulation lattice. This direct mapping preserves the fidelity of the pore geometry and mineral interfaces critical for accurately capturing multiphase flow behavior. While the full micro-CT datasets cover volumes of approximately 600 × 600 × 2400 voxels, simulating the entire scanned domain would require extremely high computational resources, making it impractical with the current capabilities. Therefore, a representative subvolume of 600 × 600 × 800 was extracted for simulation. This size was selected carefully based on a representative elementary volume (REV) analysis, which confirmed that key pore-scale properties such as porosity and permeability were stabilized within this volume size.
The relaxation time τ = 1.0 was adopted to maintain numerical stability and corresponds to a standard viscosity setting used in LBM for incompressible flow regimes. The density ratio between water and oil (1.92) reflects typical experimental conditions for the fluids used in the core displacement tests and falls within a stable operational range for Shan–Chen LBM simulations. The fluid–fluid interaction strength (0.65) was determined through parametric testing to achieve stable phase separation and realistic interfacial tension behavior. The fluid–solid interaction strength G a d s , σ was dynamically adjusted at each stage of the simulation based on experimentally measured contact angles, as described earlier in this section. Finally, the pressure gradient (0.001) was set to ensure a steady-state low-capillary number flow regime without introducing inertial effects.

3. Results and Discussion

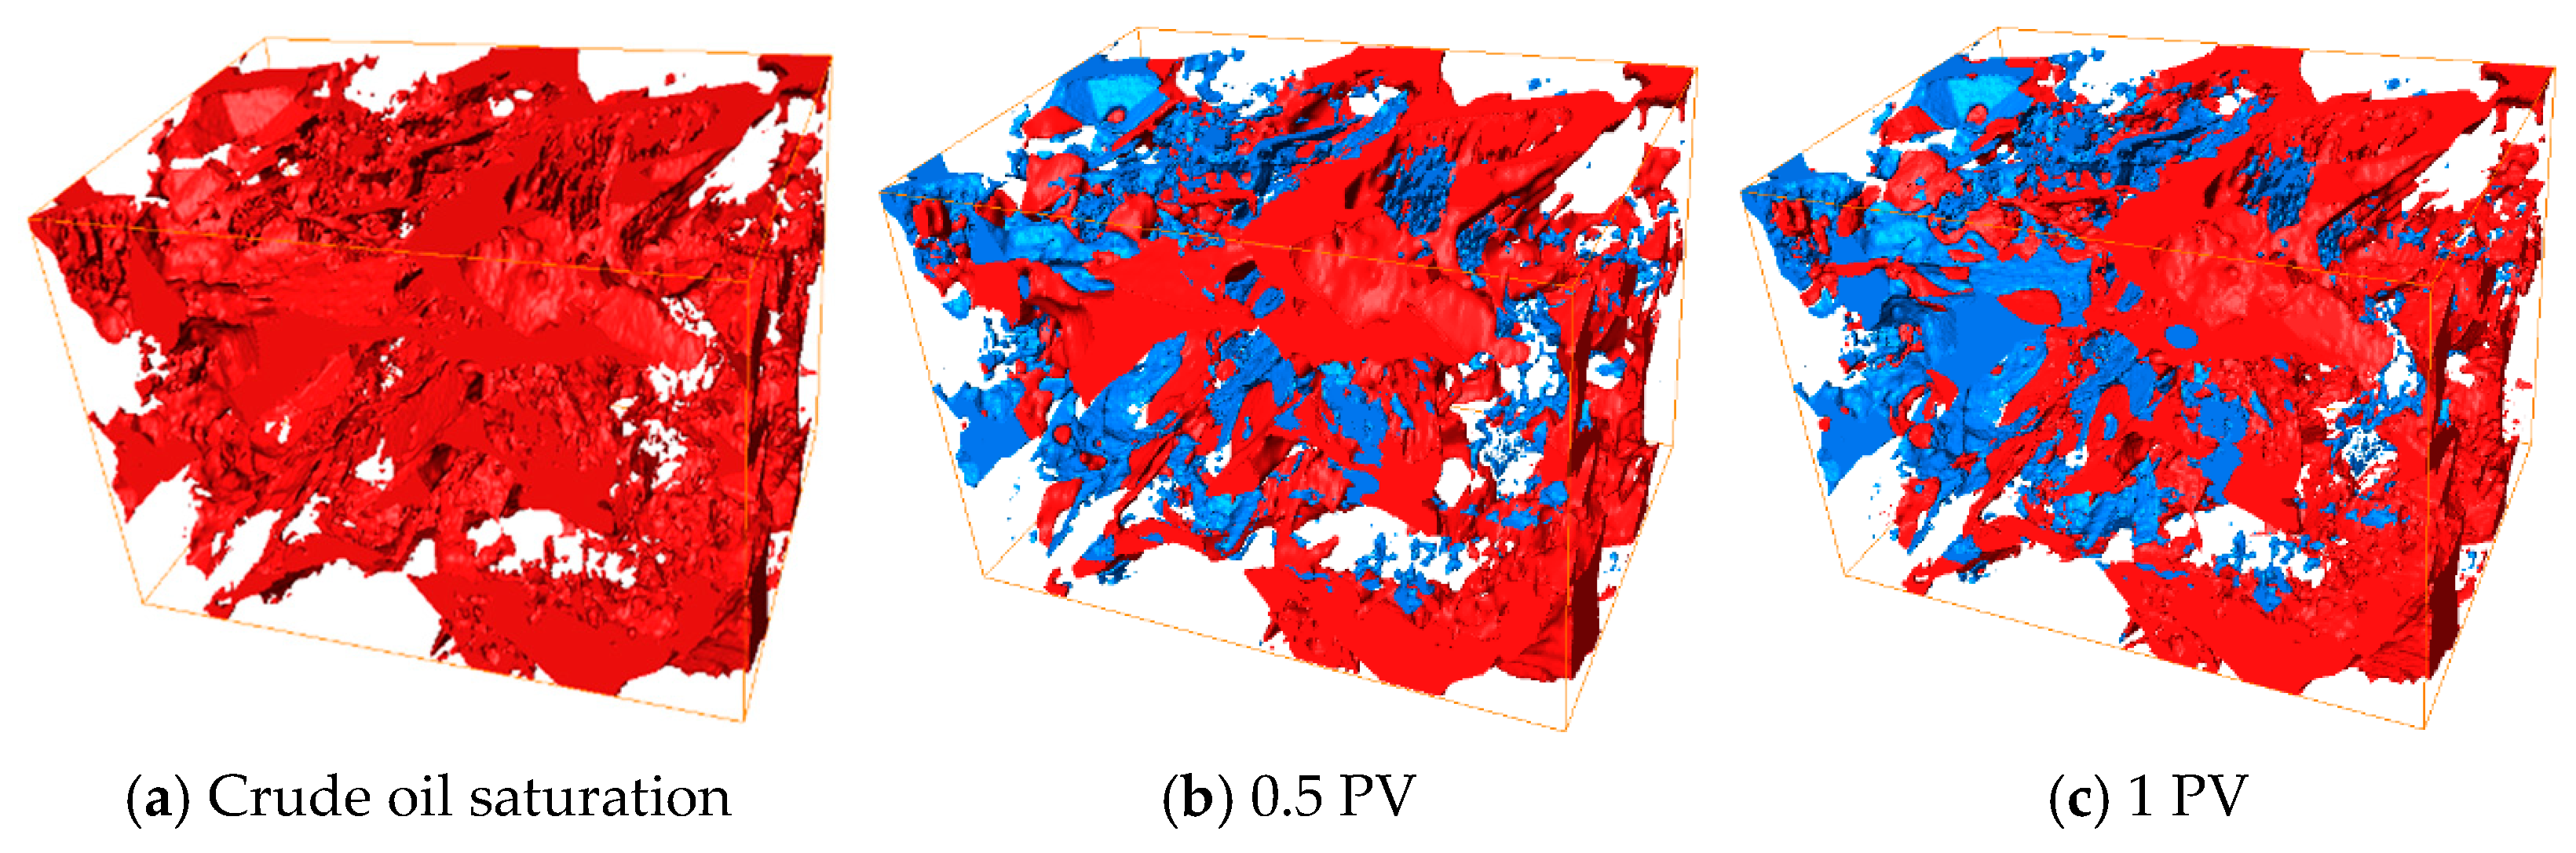
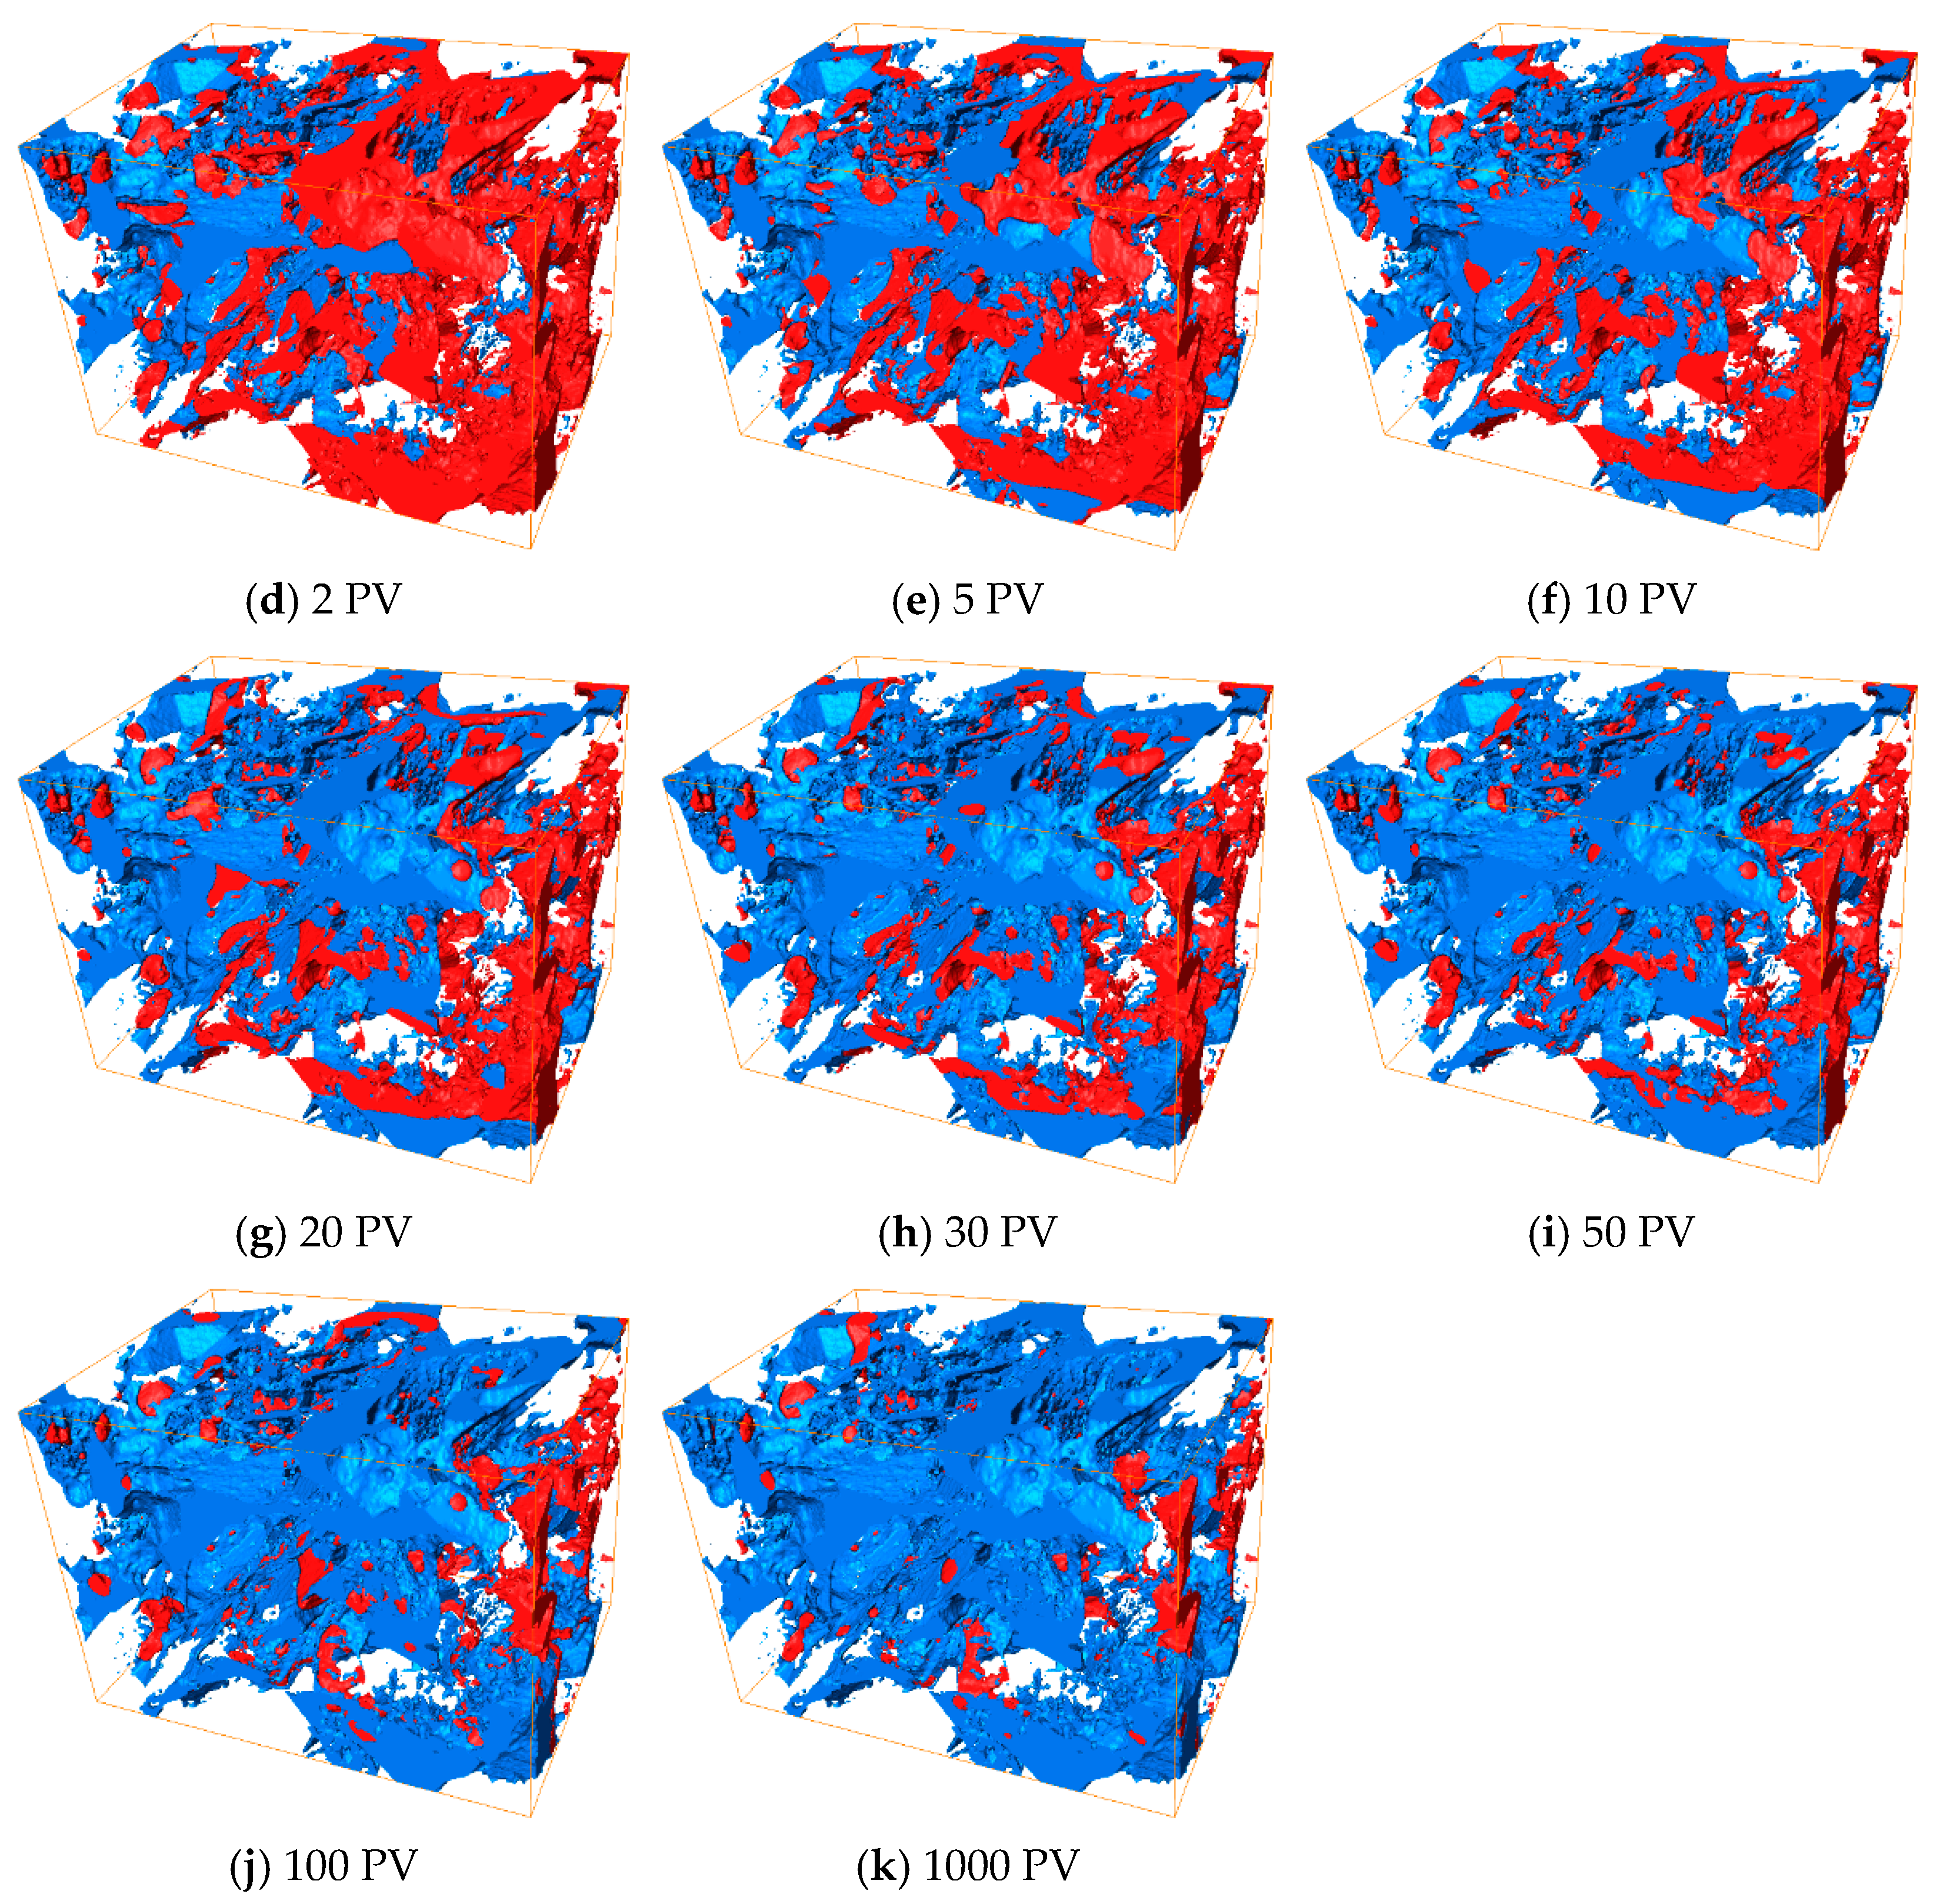
3.1. Observation of the Waterflooding Displacement Process

Micro-CT imaging at different flooding stages revealed the progressive redistribution of oil and water within the core samples, illustrating the dynamic nature of waterflooding. Initially, crude oil occupied most of the pore space, with water confined to isolated regions. As water injection proceeded, preferential flow paths developed through larger, well-connected pores, while smaller pores exhibited delayed water invasion due to capillary effects.
The spatial distribution of the oil and water phases was strongly influenced by the wettability variations. In strongly water-wet conditions, water preferentially adhered to the pore walls, forming continuous channels that enhanced oil displacement. In mixed-wet conditions, oil retention was more pronounced in small throats and isolated pore spaces, leading to higher residual oil saturation. These observations align with the experimental relative permeability measurements, reinforcing the impact of wettability evolution on fluid distribution.
The core cross-section of LH16 during crude oil saturation and subsequent water injection is presented in Figure 2. The contrast agent in the water phase provided enhanced visualization of the displacement process, revealing that water gradually invaded the pores initially saturated with crude oil. Through denoising and threshold segmentation, distinct phases—rock skeleton, oil, and water—were identified, allowing for a detailed analysis of phase distributions and saturation changes throughout the waterflooding process.
Figure 3 and Figure 4 present cross-sectional views perpendicular to the displacement direction, with water injected from the bottom boundary and flowing upward, based on a 600 × 600 × 2400 grid dataset. At 0.5 PV injection, water primarily occupied the large pores, significantly displacing oil in the highly permeable regions. By 10 PV, only a small fraction of the large pores retained oil, while water continued to expand into the previously oil-filled regions. At 20 PV, most of the oil in the large pores had been displaced, but the smaller pores still exhibited progressive oil displacement as water injection continued. By 1000 PV, the system had reached near-residual conditions, leaving only isolated oil clusters.
These results confirm that water displacement efficiency is closely linked to both pore structure and wettability. The preferential invasion of water in strongly water-wet regions facilitated continuous flow pathways, whereas mixed-wet zones exhibited capillary trapping of oil, influencing overall oil recovery. The ability to observe these pore-scale interactions through micro-CT imaging provides valuable insights into the mechanisms governing multiphase flow during waterflooding.

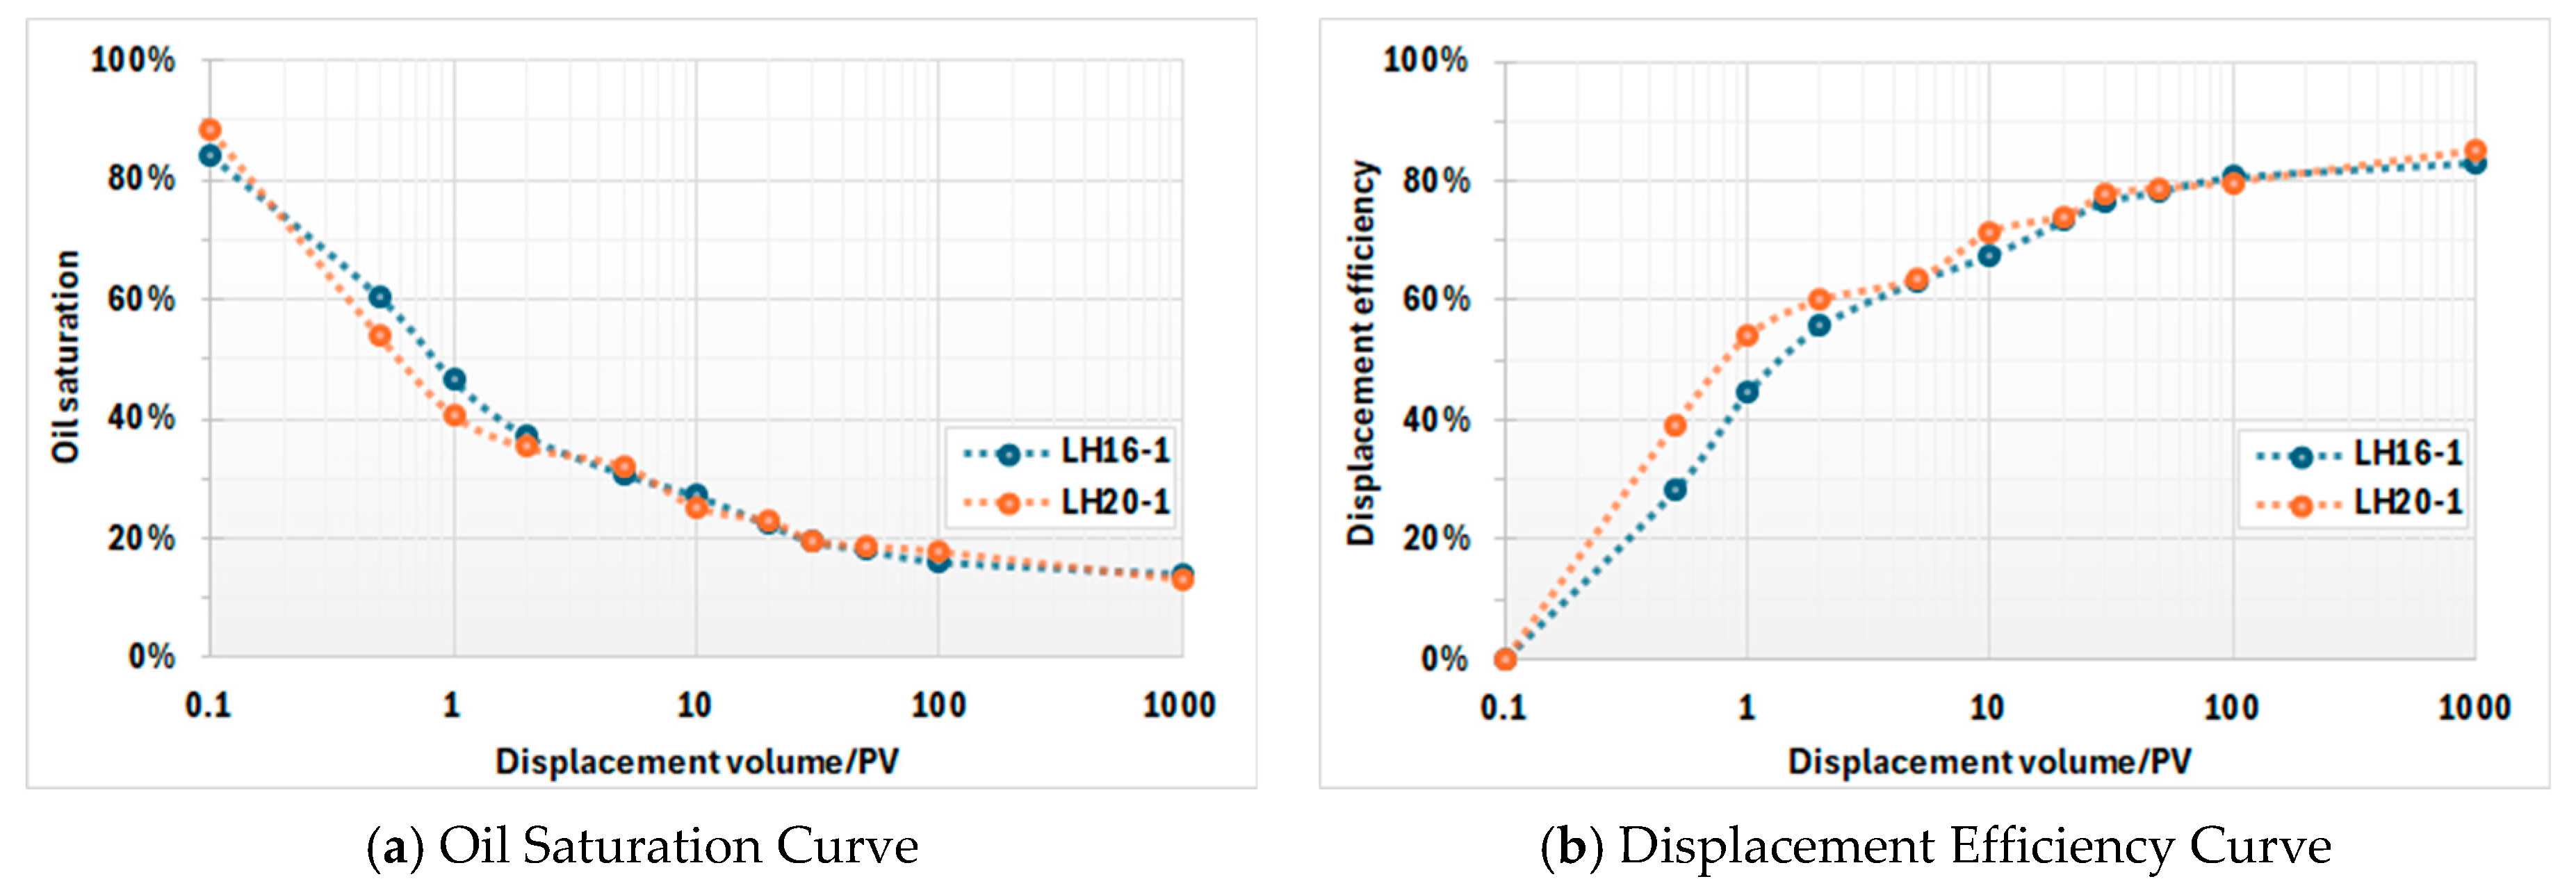
3.2. Analysis of Waterflooding Efficiency

By analyzing the oil and water phase contents at different waterflooding stages, the oil saturation and displacement efficiency curves were obtained (Figure 5). The results show a clear relationship between injected pore volume and oil recovery efficiency. At 0.5 PV injection, oil saturation was approximately 60%, corresponding to a displacement efficiency of 30%. As water injection progressed, oil saturation decreased to 40% at 1 PV, with displacement efficiency increasing to 50%. At this stage, an inflection point emerged, indicating a reduced rate of oil displacement. By 10 PV, oil saturation had further declined to 27%, and displacement efficiency reached 71%. Beyond 1000 PV, oil saturation dropped to 13%, achieving a maximum displacement efficiency of 85%, signifying near-complete displacement of the mobile oil phase.
Statistical analysis of contact angle variations (Figure 6) demonstrates a progressive shift in wettability. The oil-phase contact angle increased from 108° to 121° at 10 PV and further to 128° at 100 PV, indicating a systematic transition from weakly water-wet to strongly water-wet conditions as waterflooding progressed. This change directly influenced the displacement efficiency, as stronger water-wettability facilitated the expansion of water-phase connectivity and enhanced oil mobilization.
Clay mineral analysis before and after waterflooding (Figure 7) further supports this wettability evolution. High-rate water injection led to a 20–30% reduction in total clay content, with illite decreasing by 6–21%, kaolinite by 10–40%, and chlorite by 50–60%. The removal of clay minerals exposed underlying hydrophilic quartz and feldspar surfaces, reinforcing the rock’s intrinsic water-wet nature. This process correlates directly with the observed increase in contact angles, from 108° to 128° between 10 PV and 100 PV, as shown in Figure 6. The resulting wettability shift enhanced residual oil mobilization, contributing to improved displacement efficiency in the later stages of waterflooding.
These findings emphasize the strong correlation between wettability alteration, clay mineral redistribution, and enhanced oil recovery efficiency. The progressive transition to a more water-wet state played a key role in reducing residual oil saturation and increasing the effectiveness of the waterflooding process.

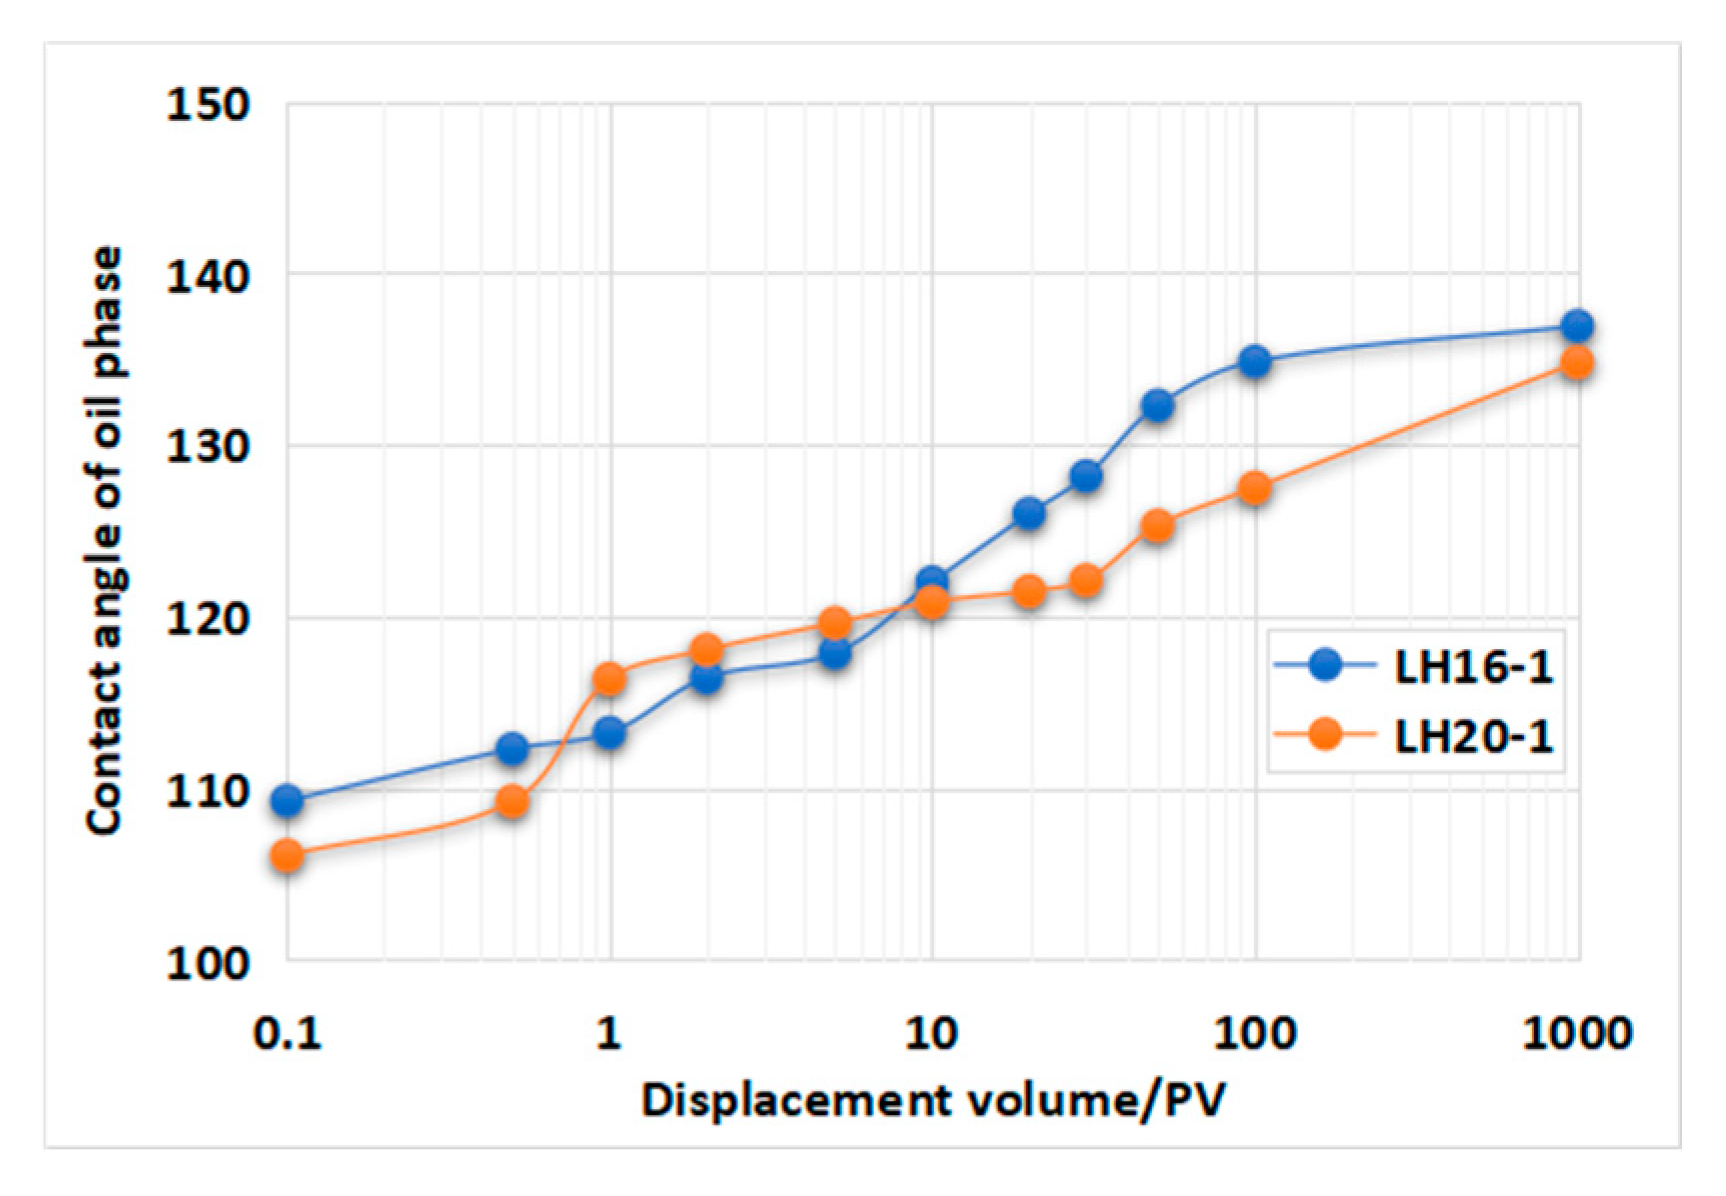
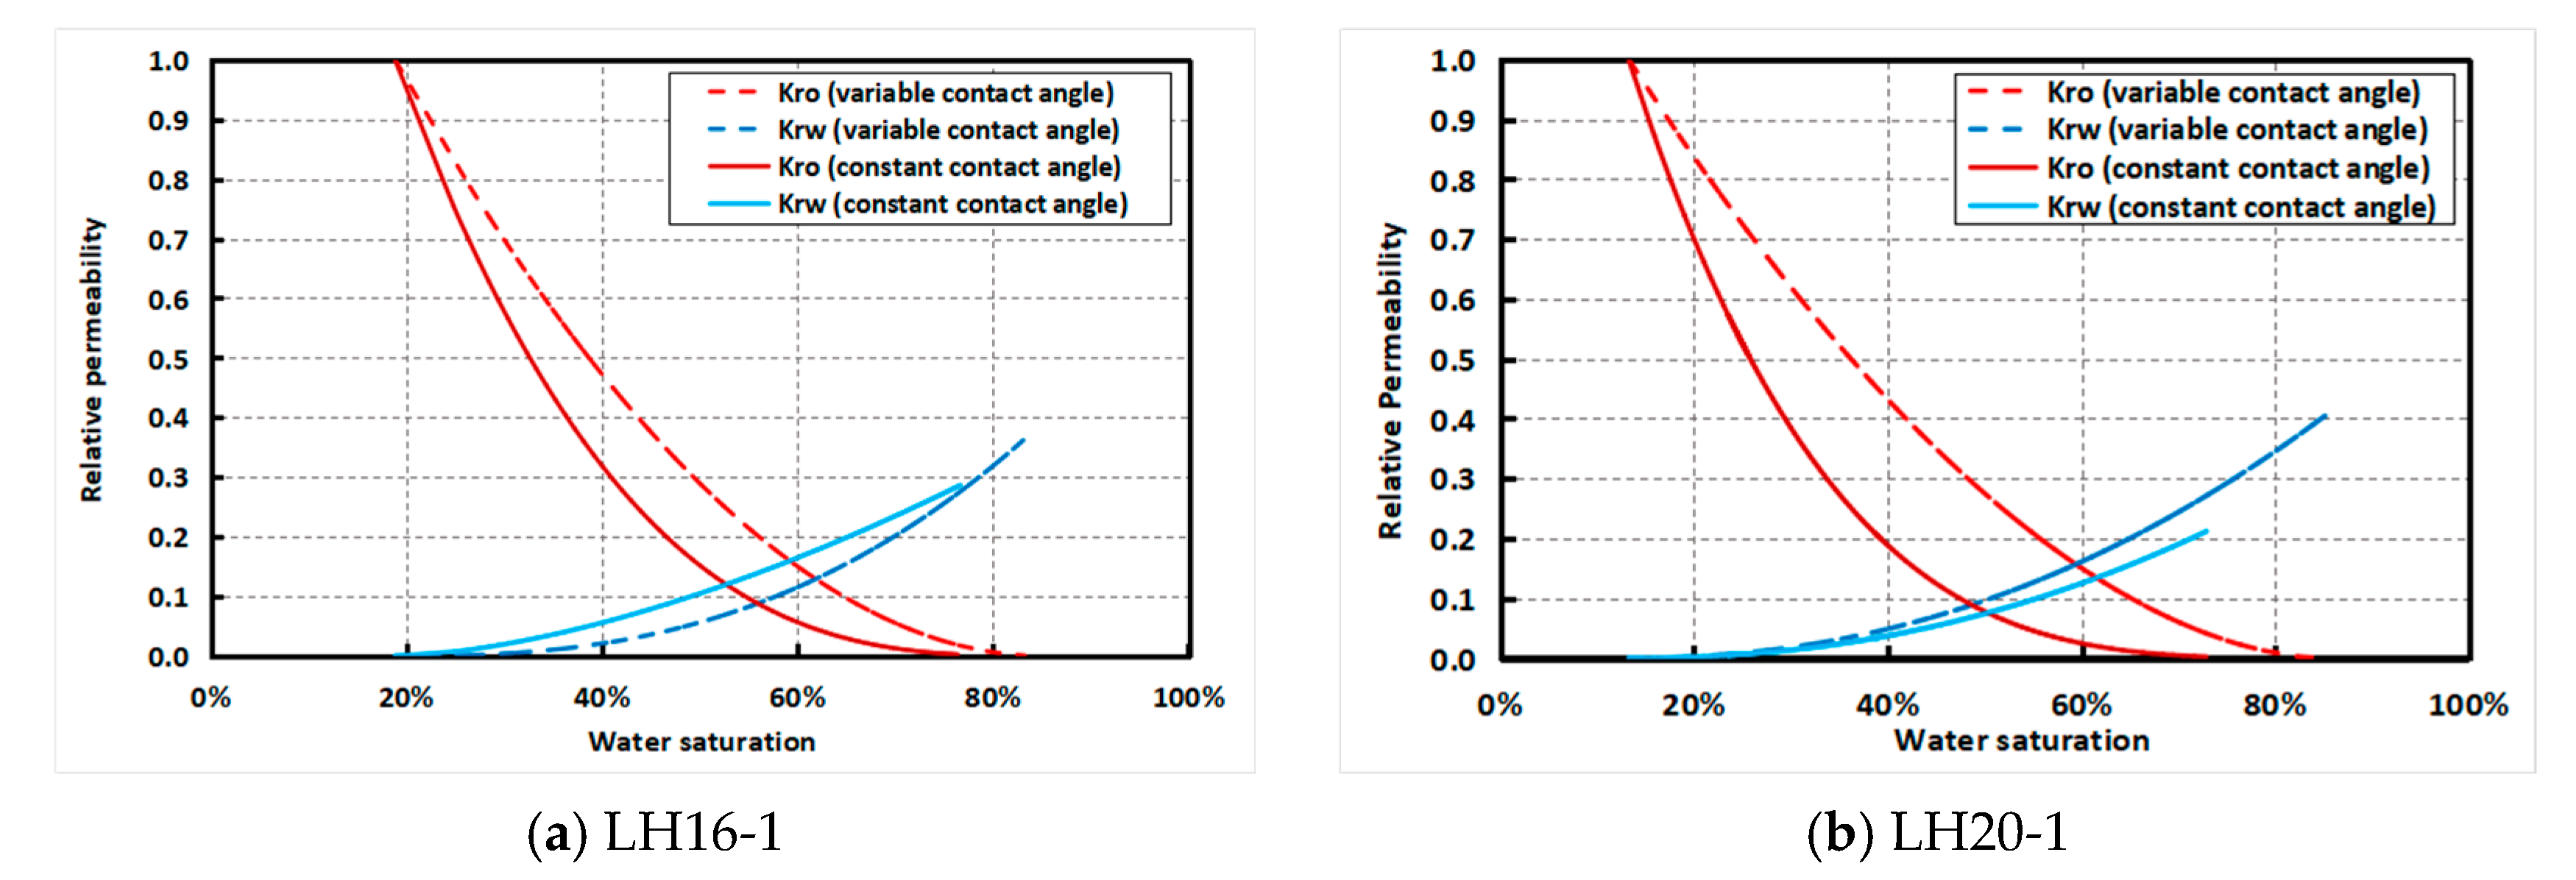
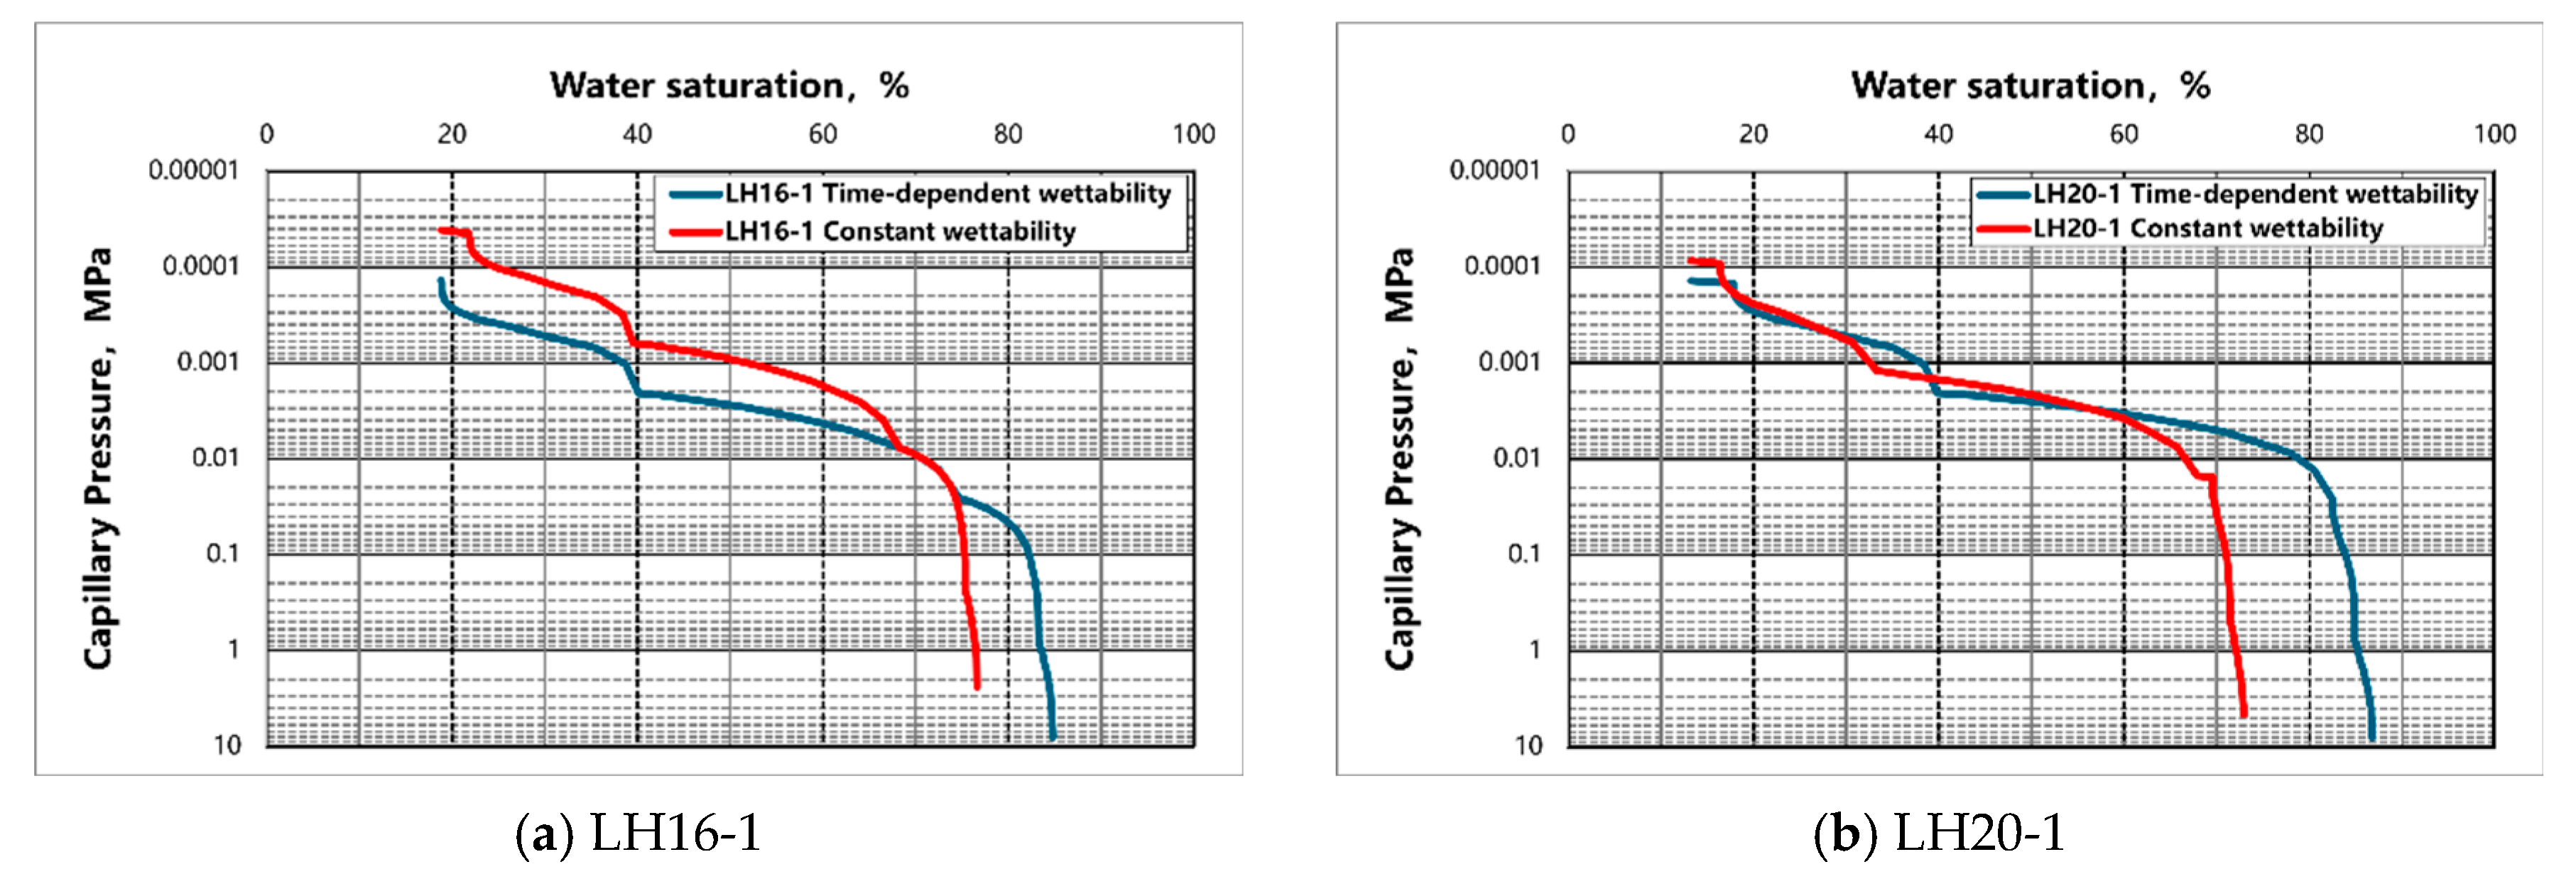
3.3. Evolution of Wettability and Its Impact on Relative Permeability

Waterflooding simulations were conducted based on CT-scanned pore skeleton models of core samples. Throughout the simulation process, the wettability conditions were adjusted in response to the contact angle variations observed in the displacement experiments. Specifically, the fluid–solid interaction strength parameter was modified to reflect the evolving wetting states, ensuring that the wettability shifts influenced multiphase flow behavior in a manner consistent with the experimental observations.
For the LH16-1 sample, a 600 × 600 × 800 grid pore skeleton model was extracted from the CT data. After establishing initial oil saturation, the contact angle was set to the experimentally measured value at pre-flooding conditions. Water injection was simulated up to 0.5 PV, followed by an adjustment of the contact angle to match the experimentally observed oil-phase contact angle at this stage. This iterative process was repeated for subsequent injection stages (1.0 PV, 2.0 PV, etc.), ensuring that the contact angle was updated over time according to the displacement experiment data. The same procedure was applied to the LH20-1 sample, allowing for the generation of relative permeability curves by correlating water saturation (or oil saturation) with water-phase (or oil-phase) permeability at each displacement stage.
Figure 8 illustrates the spatial distribution of the oil and water phases at different injection volumes during LH16-1 waterflooding, providing insight into how dynamic wettability adjustments influence fluid distribution within the pore network. The simulation results demonstrate that incorporating wettability evolution into the model significantly affects the fluid connectivity and displacement efficiency, particularly in the later flooding stages.
The relative permeability simulation results highlight notable differences between samples (Figure 9). For LH16-1, irreducible water saturation was 18.8%, residual oil saturation was 15.2%, and water-phase permeability at residual oil saturation (Krw) was 0.38. The oil–water flow transition region (coalescence zone) covered 66.0% of the saturation range. In comparison, for LH20-1, irreducible water saturation was 13.6%, residual oil saturation was 14.8%, and Krw at residual oil saturation reached 0.41, with an expanded coalescence zone of 71.9%. These variations indicate that differences in pore structure and wettability evolution significantly impact the efficiency of water displacement.
By incorporating time-dependent contact angle adjustments, the numerical simulations closely replicate the experimentally observed trends in relative permeability and residual oil distribution. These findings reinforce the critical role of wettability evolution in multiphase flow behavior, demonstrating that a realistic, dynamic representation of wettability changes enhances the predictive accuracy of oil recovery models.

3.4. Analysis of Relative Permeability Simulation Results

Contact angle measurements at different displacement stages, combined with clay mineral composition analysis, demonstrate that prolonged waterflooding gradually alters rock wettability. Water injection strips the oil films from the mineral surfaces, exposing hydrophilic minerals such as quartz and clay. Concurrently, polar components in crude oil, including resins and asphaltenes, dissolve and migrate, destabilizing the oil films and promoting a transition toward water-wet conditions. These modifications to mineral surfaces significantly impact the fluid mobility and relative permeability curves by altering capillary forces and phase connectivity.
To assess the influence of wettability changes on relative permeability, waterflooding simulations for LH16-1 and LH20-1 samples were conducted under identical conditions. Notably, constant contact angles were maintained throughout these simulations to isolate the effect of wettability evolution. The resulting relative permeability curves were compared to those obtained under dynamically evolving contact angles from previous studies, illustrating how wettability evolution affects multiphase flow behavior.
A comparative analysis was performed between simulations with constant wettability (representing weakly water-wet conditions) and time-dependent wettability (capturing the transition from weakly to strongly water-wet conditions). We then performed Corey equation fitting under different wettability conditions, enabling us to quantitatively describe the impact of the wettability evolution. The results in Figure 9 and Table 3 highlight key differences in residual oil saturation, water-phase permeability, and the coalescence zone (oil–water flow transition region).
For LH16-1, the residual oil saturation decreased from 23.6% to 15.2%, while the water-phase permeability (Krw) at residual oil saturation increased from 0.28 to 0.38. The coalescence zone expanded from 57.5% to 66.0%. Similarly, for LH20-1, the residual oil saturation decreased from 27.1% to 14.8%, the water-phase permeability at residual oil saturation increased from 0.21 to 0.41, and the coalescence zone expanded from 59.6% to 71.9%.
The results confirm that wettability evolution significantly influences displacement efficiency. In strongly water-wet rocks, water preferentially wets the pore walls, forming continuous water films. During displacement, capillary forces enable the water to efficiently invade the small pores, leading to lower residual oil saturation. Conversely, in weakly water-wet rocks, the water struggles to establish complete pore coverage, allowing the oil to persist as thin films or trapped droplets. This weak capillary-driven displacement reduces the efficiency of the water entering the smaller pores or narrow throats, resulting in higher residual oil retention. Consequently, simulations conducted under constant contact angles exhibit higher residual oil saturation compared to those incorporating wettability transitions.
Under weakly water-wet conditions, the water phase primarily occupies larger pore channels, creating well-connected flow pathways while the residual oil remains trapped in the smaller pores or throats. This allows the water phase to maintain relatively high permeability even at residual oil saturation. In contrast, in strongly water-wet rocks, the residual oil is often present as dispersed droplets, which may block the pore throats and physically impede the water flow, thereby reducing the water-phase permeability. Therefore, simulations incorporating time-dependent contact angles (reflecting evolving wettability) exhibit higher water-phase permeability at residual oil saturation compared to constant contact angle cases.
Wettability evolution also influences the coalescence zone, which represents the saturation range where two-phase flow occurs. In strongly water-wet conditions, the water preferentially invades the pore spaces, displacing the oil into larger pores, where it remains mobile over a broader saturation range. This leads to an expanded coalescence zone, allowing the oil to remain mobile at high water saturations. Conversely, under weakly water-wet conditions, the oil phase dominates more of the pore space, and the water phase struggles to establish continuous flow paths. At low water saturations, the oil mobility declines sharply, and at high water saturations, the residual oil becomes trapped in the pore throats, significantly narrowing the effective coalescence zone.
To validate the predictive capability of the time-dependent wettability-adjusted LBM model, a direct quantitative comparison between the experimental measurements and the simulation results was conducted. The displacement efficiency curves, representing the reduction in oil saturation with increasing water injection, are presented in Figure 10. The comparison shows good agreement between the simulated and experimental trends. Both datasets exhibit a rapid decrease in oil saturation at the early waterflooding stages, followed by a gradual stabilization as the system approaches residual oil conditions. The simulation accurately captures the overall displacement efficiency evolution, with the minor deviations attributed to local heterogeneities not fully captured in the digital models.
To further analyze the impact of time-dependent wettability on multiphase flow behavior, we conducted additional simulations to extract capillary pressure curves for the two core samples under different wettability conditions. These curves were calculated by averaging the pressure difference between the non-wetting phase (oil) and the wetting phase (water) across the entire simulation domain at each waterflooding stage.
The simulated capillary pressure curves are presented in Figure 11. The reduction in capillary entry pressure and the broadening of the capillary transition zone are evident in the time-dependent wettability cases, reflecting enhanced water-phase connectivity and easier displacement of oil through the finer pores. Conversely, in constant wettability conditions, higher capillary barriers are maintained, leading to more abrupt transitions and greater residual oil trapping. These simulation results highlight the importance of accurately capturing wettability evolution. Time-dependent wettability shifts facilitate more effective oil displacement by reducing capillary resistance and expanding the two-phase flow region, thereby improving the sweep efficiency during waterflooding.
While the modeling framework is calibrated using specific experimental inputs, the underlying method is generalizable to similar formations by applying representative wettability and pore structure data. These findings provide valuable insights for wettability control strategies in low-permeability reservoirs. The results suggest that manipulating wettability transitions through targeted waterflooding techniques or chemical treatments could improve oil recovery efficiency by promoting a more favorable wetting state. Additionally, the simulation results validate the reliability of the proposed LBM-based wettability model, confirming its capability to accurately capture pore-scale wettability transitions and their macroscopic impact on multiphase flow behavior.

4. Conclusions

This study presents a time-dependent wettability-adjusted LBM simulation framework, integrating laboratory-measured contact angles to investigate the influence of wettability evolution on oil–water relative permeability during waterflooding. Unlike traditional simulation models that assume static wettability conditions, this approach accounts for real-time wettability transitions observed in displacement experiments, ensuring a more accurate representation of fluid distribution, displacement efficiency, and residual oil saturation.
  • A key innovation of this study is the experimental validation of the wettability evolution during waterflooding. Micro-CT imaging and displacement experiments confirmed that prolonged water injection gradually shifts the rock wettability by stripping the oil films, dissolving polar crude oil components, and exposing hydrophilic minerals such as quartz and feldspar. Contact angle measurements demonstrated a systematic transition from weakly water-wet to strongly water-wet conditions, with angles increasing from 108° to 128° between 10 PV and 100 PV injection stages, highlighting the dynamic nature of wettability alterations in porous media.
  • Another major contribution is the development of a dynamic wettability-adjusted LBM model that incorporates experimentally measured contact angles into numerical simulations. By continuously updating the fluid–solid interaction strength parameter based on experimental data, the model captures real-time wettability transitions and their direct influence on fluid displacement. Comparative simulations showed that neglecting wettability evolution leads to an overestimation of residual oil saturation and an underestimation of water-phase permeability, underscoring the necessity of accounting for the wettability changes in the relative permeability modeling.
  • The study also provides new insights into the impact of wettability evolution on relative permeability. By comparing simulations with constant and dynamic wettability, it was found that dynamic conditions significantly enhance oil displacement efficiency. From a practical perspective, these findings have important implications for reservoir engineering and oil recovery optimization. Managing wettability transitions during waterflooding can significantly improve oil displacement efficiency, particularly in mixed-wet and low-permeability reservoirs. The proposed dynamic wettability model serves as a more reliable predictive tool for optimizing waterflooding strategies and developing targeted wettability control techniques, such as chemical treatments and fluid composition adjustments. By integrating dynamic wettability effects into reservoir simulations, operators can improve forecasting accuracy and design more effective enhanced oil recovery (EOR) strategies.
  • Future research should prioritize experimental validation and field-scale verification to confirm that relative permeability evolves dynamically with wettability changes under realistic reservoir conditions. Long-term core flooding experiments using formation rock and reservoir fluids will be essential for directly measuring the wettability-dependent variations in the relative permeability. In addition, future studies should examine the influence of confining and back pressure conditions on pore-scale wettability dynamics and flow behavior. As these pressures affect capillary forces and interfacial phenomena, variations in their values may require recalibration of the experimental inputs to ensure reliable numerical prediction. Beyond laboratory-scale investigations, field-scale validation using production data and history-matching techniques will be critical for evaluating the broader impact of wettability evolution at the reservoir level. While pore-scale analysis offers high-resolution insight, capturing full-field heterogeneity will require multiscale modeling strategies and the integration of upscaled simulation frameworks. Incorporating time-dependent wettability changes into reservoir-scale numerical models—and benchmarking predictions against actual recovery trends—will significantly improve the predictive accuracy and practical utility of wettability-aware flow simulations. By combining experimental measurements, pore-scale modeling, and field-scale data analysis, future studies can deepen the understanding of dynamic wettability–relative permeability coupling and support the development of adaptive EOR strategies that enhance recovery efficiency under complex reservoir conditions.

Author Contributions

Methodology, C.L.; Software, W.L. (Wei Li); Validation, L.D.; Formal analysis, H.S.; Investigation, C.S.; Writing—original draft, W.L. (Wei Long); Writing—review & editing, G.W. All authors have read and agreed to the published version of the manuscript.

Funding

This research received no external funding. And The APC was funded by ICORE GROUP INC.

Data Availability Statement

Data available on request due to restrictions of privacy and legal reasons.

Conflicts of Interest

Authors Chenglin Liu, Changwei Sun and Ling Dai were employed by the company Shenzhen Branch of China National Offshore Oil Corporation Limited. Authors Guanqun Wang and Haipeng Shao were employed by the company ICORE GROUP INC. The remaining authors declare that the research was conducted in the absence of any commercial or financial relationships that could be construed as a potential conflict of interest.

References

  1. Al-Quraishi, A.; Khairy, M. Pore pressure versus confining pressure and their effect on oil–water relative permeability curves. J. Pet. Sci. Eng. 2005, 48, 120–126. [Google Scholar] [CrossRef]
  2. Mirzaei-Paiaman, A.; Faramarzi-Palangar, M.; Djezzar, S.; Kord, S. A new approach to measure wettability by relative permeability measurements. J. Pet. Sci. Eng. 2022, 208, 109191. [Google Scholar] [CrossRef]
  3. Botermans, C.W.; van Batenburg, D.W.; Bruining, J. Relative Permeability Modifiers: Myth or Reality? In Proceedings of the SPE European Formation Damage Conference, The Hague, The Netherlands, 21–22 May 2001; OnePetro: Richardson, TX, USA, 2001. [Google Scholar] [CrossRef]
  4. Guo, R.; Dalton, L.; Crandall, D.; McClure, J.; Wang, H.; Li, Z.; Chen, C. Role of heterogeneous surface wettability on dynamic immiscible displacement, capillary pressure, and relative permeability in a CO2-water-rock system. Adv. Water Resour. 2022, 165, 104226. [Google Scholar] [CrossRef]
  5. Pan, B.; Liu, K.; Ren, B.; Zhang, M.; Ju, Y.; Gu, J.; Zhang, X.; Clarkson, C.R.; Edlmann, K.; Zhu, W.; et al. Impacts of relative permeability hysteresis, wettability, and injection/withdrawal schemes on underground hydrogen storage in saline aquifers. Fuel 2023, 333, 126516. [Google Scholar] [CrossRef]
  6. Alizadeh, A.H.; Piri, M. Three-phase flow in porous media: A review of experimental studies on relative permeability. Rev. Geophys. 2014, 52, 468–521. [Google Scholar] [CrossRef]
  7. Saito, S.; Yoshino, M.; Suzuki, K. Numerical simulation of bubbly flows by the improved lattice Boltzmann method for incompressible two-phase flows. Comput. Fluids 2023, 254, 105797. [Google Scholar] [CrossRef]
  8. Wang, H.; Wu, W.; Chen, T.; Yu, J.; Pan, J. Pore structure and fractal analysis of shale oil reservoirs: A case study of the Paleogene Shahejie Formation in the Dongying Depression, Bohai Bay, China. J. Pet. Sci. Eng. 2019, 177, 711–723. [Google Scholar] [CrossRef]
  9. Chen, F.; Ge, W.; Wang, L.; Li, J. Numerical study on gas–liquid nano-flows with pseudo-particle modeling and soft-particle molecular dynamics simulation. Microfluid. Nanofluid 2008, 5, 639–653. [Google Scholar] [CrossRef]
  10. Fang, C.; Zhang, F.; Qiao, R. Invasion of gas into mica nanopores: A molecular dynamics study. J. Phys. Condens. Matter 2018, 30, 224001. [Google Scholar] [CrossRef]
  11. Javadpour, F. Nanopores and Apparent Permeability of Gas Flow in Mudrocks (shales and Siltstone). J. Can. Pet. Technol. 2009, 48, 16–21. [Google Scholar] [CrossRef]
  12. Lanetc, Z.; Zhuravljov, A.; Armstrong, R.T.; Mostaghimi, P. Estimation of relative permeability curves in fractured media by coupling pore network modelling and volume of fluid methods. Int. J. Multiph. Flow 2024, 171, 104668. [Google Scholar] [CrossRef]
  13. Liu, B.; Qi, C.; Zhao, X.; Teng, G.; Zhao, L.; Zheng, H.; Zhan, K.; Shi, J. Nanoscale Two-Phase Flow of Methane Water in Shale Inorganic Matrix. J. Phys. Chem. C 2018, 122, 26671–26679. [Google Scholar] [CrossRef]
  14. Bin, G.; Xuan, L.I.U.; Guan, Q.I.N. A Lattice Boltzmann model for multi-component vapor-liquid two phase flow. Pet. Explor. Dev. 2014, 41, 695–702. [Google Scholar] [CrossRef]
  15. Xie, C.; Raeini, A.Q.; Wang, Y.; Blunt, M.J.; Wang, M. An improved pore-network model including viscous coupling effects using direct simulation by the lattice Boltzmann method. Adv. Water Resour. 2017, 100, 26–34. [Google Scholar] [CrossRef]
  16. Zakirov, T.R.; Khramchenkov, M.G. Characterization of two-phase displacement mechanisms in porous media by capillary and viscous forces estimation using the lattice Boltzmann simulations. J. Pet. Sci. Eng. 2020, 184, 106575. [Google Scholar] [CrossRef]
  17. Balashov, V.; Savenkov, E.; Khlyupin, A.; Gerke, K.M. Two-phase regularized phase-field density gradient Navier–Stokes based flow model: Tuning for microfluidic and digital core applications. J. Comput. Phys. 2025, 521, 113554. [Google Scholar] [CrossRef]
  18. Yi, J.; Liu, L.; Xia, Z.; Wang, J.; Jing, Y.; Duan, L. Effects of wettability on relative permeability of rough-walled fracture at pore-scale: A lattice Boltzmann analysis. Appl. Therm. Eng. 2021, 194, 117100. [Google Scholar] [CrossRef]
  19. Shan, X.; Chen, H. Simulation of nonideal gases and liquid-gas phase transitions by the lattice Boltzmann equation. Phys. Rev. E 1994, 49, 2941–2948. [Google Scholar] [CrossRef]
  20. Shan, X.; Chen, H. Lattice Boltzmann Model for Simulating Flows with Multiple Phases and Components. Phys. Rev. E 1993, 47, 1815–1819. [Google Scholar] [CrossRef]
  21. Cai, J.; Qin, X.; Xia, X.; Jiao, X.; Chen, H.; Wang, H.; Xia, Y. Numerical modeling of multiphase flow in porous media considering micro- and nanoscale effects: A comprehensive review. Gas Sci. Eng. 2024, 131, 205441. [Google Scholar] [CrossRef]
  22. Wang, T.; Wang, Y.D.; Sun, C.; McClure, J.E.; Mostaghimi, P.; Armstrong, R.T. Surface wetting characterization in pore-scale multiphase flow simulations: A Ketton carbonate case study. Geoenergy Sci. Eng. 2024, 240, 212933. [Google Scholar] [CrossRef]
  23. Foroughi, S.; Shojaei, M.J.; Lane, N.; Rashid, B.; Lakshtanov, D.; Ning, Y.; Zapata, Y.; Bijeljic, B.; Blunt, M.J. A framework for multiphase pore-scale modeling based on micro-CT imaging. Transp. Porous Media 2025, 152, 18. [Google Scholar] [CrossRef]
  24. Zhao, J.; Kang, Q.; Yao, J.; Viswanathan, H.; Pawar, R.; Zhang, L.; Sun, H. The effect of wettability heterogeneity on relative permeability of two-phase flow in porous media: A lattice Boltzmann study. Water Resour. Res. 2018, 54, 1295–1311. [Google Scholar] [CrossRef]
  25. Carrillo, F.J.; Bourg, I.C.; Soulaine, C. Multiphase flow modeling in multiscale porous media: An open-sourced micro-continuum approach. J. Comput. Phys. 2020, 8, 100073. [Google Scholar] [CrossRef]
  26. Chen, L.; Wang, S.-Y.; Xiang, X.; Tao, W.-Q. Mechanism of surface nanostructure changing wettability: A molecular dynamics simulation. Comput. Mater. Sci. 2020, 171, 109223. [Google Scholar] [CrossRef]
  27. Ezzatneshan, E. Study of surface wettability effect on cavitation inception by implementation of the lattice Boltzmann method. Phys. Fluids 2017, 29, 113304. [Google Scholar] [CrossRef]
  28. Huang, H.; Krafczyk, M.; Lu, X. Forcing term in single-phase and Shan–Chen-type multiphase lattice Boltzmann models. Phys. Rev. E 2011, 84, 046710. [Google Scholar] [CrossRef]
  29. Rudin, L.; Lions, P.-L.; Osher, S. Multiplicative Denoising and Deblurring: Theory and Algorithms. In Geometric Level Set Methods in Imaging, Vision, and Graphics; Springer: New York, NY, USA, 2003; pp. 103–119. [Google Scholar] [CrossRef]
  30. Rudin, L.I.; Osher, S.; Fatemi, E. Nonlinear total variation based noise removal algorithms. Phys. D: Nonlinear Phenom. 1992, 60, 259–268. [Google Scholar] [CrossRef]
  31. Xu, X.; Xu, S.; Jin, L.; Song, E. Characteristic analysis of Otsu threshold and its applications. Pattern Recognit. Lett. 2011, 32, 956–961. [Google Scholar] [CrossRef]
  32. AlRatrout, A.; Raeini, A.Q.; Bijeljic, B.; Blunt, M.J. Automatic measurement of contact angle in pore-space images. Adv. Water Resour. 2017, 109, 158–169. [Google Scholar] [CrossRef]
  33. Sun, C.; McClure, J.E.; Mostaghimi, P.; Herring, A.L.; Shabaninejad, M.; Berg, S.; Armstrong, R.T. Linking continuum-scale state of wetting to pore-scale contact angles in porous media. J. Colloid Interface Sci. 2020, 561, 173–180. [Google Scholar] [CrossRef] [PubMed]
  34. Scanziani, A.; Singh, K.; Blunt, M.J.; Guadagnini, A. Automatic method for estimation of in situ effective contact angle from X-ray micro tomography images of two-phase flow in porous media. J. Colloid Interface Sci. 2017, 496, 51–59. [Google Scholar] [CrossRef] [PubMed]
  35. Hou, Y.; Deng, H.; Du, Q.; Jiao, K. Multi-component multi-phase lattice Boltzmann modeling of droplet coalescence in flow channel of fuel cell. J. Power Sources 2018, 393, 83–91. [Google Scholar] [CrossRef]
  36. Benzi, R.; Biferale, L.; Sbragaglia, M.; Succi, S.; Toschi, F. Mesoscopic modeling of a two-phase flow in the presence of boundaries: The contact angle. Phys. Rev. E 2006, 74, 021509. [Google Scholar] [CrossRef]
Figure 1. High-resolution micro-CT images of the core samples.
Energies 18 02404 g001
Figure 2. Micro-CT images of Core LH16-1 during crude oil saturation and waterflooding.
Energies 18 02404 g002
Figure 3. Oil–water distribution in Core LH16-1 during waterflooding (Blue: rock skeleton, Green: water, Red: oil). Water flow is oriented from bottom to top.
Energies 18 02404 g003aEnergies 18 02404 g003b
Figure 4. Oil–water distribution in Core LH20-1 during waterflooding (Blue: rock skeleton, Green: water, Red: oil). Water flow is oriented from bottom to top.
Energies 18 02404 g004aEnergies 18 02404 g004b
Figure 5. Oil saturation and displacement efficiency curves at various waterflooding stages.
Energies 18 02404 g005
Figure 6. Wettability evolution analysis.
Energies 18 02404 g006
Figure 7. Changes in clay mineral composition before and after waterflooding.
Energies 18 02404 g007
Figure 8. Oil–water distribution and relative permeability results for LH16-1 (Blue: oil, Red: water).
Energies 18 02404 g008aEnergies 18 02404 g008b
Figure 9. Simulated relative permeability curves for constant and time-dependent contact angles.
Energies 18 02404 g009
Figure 10. Comparison of displacement efficiency curves between simulated and experimental results.
Energies 18 02404 g010
Figure 11. Comparison of capillary pressure curves.
Energies 18 02404 g011
Table 1. Petrophysical properties and mineralogical compositions of the cores.
SamplePorosity
ε, %
Permeability
k, mD
Minerals
CalciteDolomiteQuartzClayPotassium Feldspar
LH16-123.321156.8902.177.87.013.1
LH20-123.121003.281.51.483.14.99.1
Table 2. The key simulation parameters.
ParameterValue
Lattice resolution600 × 600 × 800
Relaxation time τ1.0
Water-to-oil density ratio1.92
Fluid–fluid interaction strength G c 0.65
Fluid–solid interaction strength G a d s , σ Adjusted based on measured contact angle
Injection pressure gradient0.001
Table 3. The fitted Corey correlation.
SamplesFitted Corey Correlation
LH16-2, constant wettability k r w = 0.2844 S w 18.84 % 57.55 % 2.67
k r o = 1 S w 23.37 % 57.55 % 2.06
LH16-2, time-dependent wettability k r w = 0.3869 S w 18.84 % 65.95 % 2.56
k r o = 1 S w 15.21 % 65.95 % 1.93
LH20-2, constant wettability k r w = 0.2119 S w 13.27 % 59.63 % 2.32
k r o = 1 S w 27.11 % 59.63 % 1.92
LH20-2, time-dependent wettability k r w = 0.4056 S w 13.27 % 71.94 % 2.14
k r o = 1 S w 14.80 % 71.94 % 1.80
Disclaimer/Publisher’s Note: The statements, opinions and data contained in all publications are solely those of the individual author(s) and contributor(s) and not of MDPI and/or the editor(s). MDPI and/or the editor(s) disclaim responsibility for any injury to people or property resulting from any ideas, methods, instructions or products referred to in the content.

