Article

Validation of PCHE-Type CO2–CO2 Recuperative Heat Exchanger Modeling Using Conductance Ratio Method

by
Viktoria Carmen Illyés
1,*,
Francesco Crespi
2,
Xavier Guerif
3 and
Andreas Werner
1
1
Institute for Energy Systems and Thermodynamics, Technische Universität Wien, Getreidemarkt 9, 1060 Wien, Austria
2
Department of Energy Engineering, University of Seville, Camino de los descubrimientos s/n, 41092 Seville, Spain
3
Kelvion Thermal Solutions, 25 Rue du Ranzay, 44300 Nantes, France
*
Author to whom correspondence should be addressed.
Energies 2025, 18(13), 3547; https://doi.org/10.3390/en18133547
Submission received: 27 April 2025 / Revised: 22 June 2025 / Accepted: 25 June 2025 / Published: 4 July 2025
(This article belongs to the Special Issue Supercritical CO2 Power Cycles)

Abstract

Printed-circuit heat exchangers (PCHEs) are compact exchangers with exceptional heat-transfer properties that are important for supercritical CO2 technology. Recalculating the heat transfer under off-design conditions is a common task. Thus, in this paper, traditional and PCHE-specific correlations are analyzed in a conventional, discretized one-dimensional model using the conductance ratio method. The predicted heat transfer is compared with the experimental data of a CO2–CO2 heat exchanger with zigzag-type channels and one with s-shaped fin channels under various working conditions. The results demonstrate that all selected heat-transfer correlations predicted the transferred heat within +/−20% using the conventional model. The much simpler conductance ratio method yields better results, with heat transfer within +/−10%, even with conservative inputs to the model.

1. Introduction

Printed-circuit heat exchangers as recuperators for sCO2 cycles
sCO2 cycles exhibit high efficiencies, especially when enabled by cycle modifications tailored to a specific target application. To recover heat within the cycle, all efficiency-enhancing cycle modifications feature one or more recuperators for heat regeneration [1].
Printed-circuit heat exchangers (PCHEs), which are compact heat exchangers well-suited for high pressures and high temperatures while reaching small temperature approaches, match the sCO2 cycle very well [2,3].
These characteristics are due to the manufacturing process. Figure 1 shows the construction process of a PCHE. Here, thin metal plates undergo chemical etching to create (mini or micro) channels with maximum diameters of only a few millimeters. Then, the etched plates are stacked and diffusion bonded to produce a heat-exchange block. Typically, PCHEs are classified according to the shape of their channels. In addition to straight channels, the most common channel types are zigzag, wavy, s-shaped fin, and airfoil channels. The typical cross-section is semicircular; however, other approaches, e.g., rectangular, circular, or a stretched semicircle, are used. Figure 2 shows an overview of the channels, cross-sections, and arrangements.
Calculation methods—heat-exchanger models
Flexibility, which can be provided by sCO2 power cycles, will be crucial in future power generation; thus, recalculating the cycle during the design process for various conditions (typically steady-state) is necessary. When selecting a method, the engineer must balance complexity and accuracy. The simplest model relies on an overall heat-transfer coefficient and a logarithmic mean temperature difference. However, good results can only be obtained if the heat-transfer coefficients and fluid properties remain the same along the heat exchanger, even under recalculated conditions. More sophisticated models utilize heat-transfer correlations to predict the heat-transfer coefficients that are dependent on the fluid conditions. These models discretize the heat exchanger in smaller sections to consider the trend of the properties along the length. Solving this problem is an iterative process based on heat transmission, simplified at a plate or an ideal pipe, and it requires extensive knowledge of the heat exchanger’s geometry. Each input to this model, e.g., the selection of the heat-transfer correlation, wall thickness, effective length, and the calculation of the hydraulic diameter, will slightly affect the result. Despite the complexity and many inputs, if executed correctly this conventional model represents the physical events effectively.
The relatively new conductance ratio method [4] follows a discretized approach of scaling the heat transfer relative to a reference case, using only a single value to characterize the heat exchanger and requiring no geometrical data. Several previous studies have used this model for off-design evaluations of sCO2 power cycles [5,6,7].
Figure 2. An overview of channel types and arrangement to the full heat exchanger (inspired by the study [8]; see further details in same reference). Black areas represent hot channels, white areas cold channels.
Energies 18 03547 g002
Heat-transfer correlations
Review papers on heat-transfer correlations have identified the challenge faced by researchers today [2,9,10,11]. In the absence of a single easy-to-use correlation that fits all, countless correlations have been developed, adapted, and employed in different forms for various applications. The main challenge is to select the best fitting correlation. In this paper, to calculate the heat transfer in PCHEs, a collection of widely known correlations for turbulent flow inside tubes and correlations developed only for zigzag PCHEs are evaluated. The correlations are discussed in the following, and a summary of the correlations considered in this paper is presented in Section 2 Methodology.
Many of the empirical correlations for heat transfer follow a power-law correlation. In their survey, Pioro et al. [12] presented the following general structure:
N u T , x = C 1 R e T , x m 1 P r T , x m 2 ρ t ρ T x m 3 μ t μ T x m 4 k t k T x m 5 c p ¯ c p , T x m 6 1 + C 2 d h L h m 7 ,
where R e is the Reynolds number, P r is the Prandtl number, ρ denotes density, μ the dynamic viscosity,   k denotes the thermal conductivity, c p denotes the specific heat at constant pressure, c p ¯ denotes the specific heat averaged over the cross-section of the channel, d h denotes the hydraulic diameter, L h denotes the heated length, C 1 and C 2 are constants, and m 1 to m 7 are the exponents. Note that the dimensionless numbers and correction terms can be evaluated at different conditions present at the position   x . Here, the different temperature T and t values may be used depending on the correlation: the bulk temperature T b , the wall temperature T w , the pseudocritical temperature T p c , or the film temperature T f , typically calculated as the mean of the bulk and wall temperatures as follows:
T f = T b + T w 2 .
It is evident that the simplest version of Equation (1) can only be a fair approximation [13]; thus, the following correlation, which was introduced by McAdams [14] in 1942, generally yields good results [15] while being remarkably simple:
N u = 0.023 R e 0.8 P r 0.4 .
This formula is referred to as the Dittus and Boelter correlation (the formulas by Dittus and Boelter [16] are slightly different and are not the same for heating and cooling; see [17]. McAdams most likely cites Dittus and Boelter for their use of the bulk temperature in their correlations; at first, McAdams used 0.0225 as the coefficient C_1, but later, he reported 0.023. The change might originate from the Colburn equation, which comes from an equation for shear stress in smooth pipes and the Reynolds–Colburn analogy). It is intended to be evaluated at the bulk temperature. However, previous studies [15] have employed this (or a similar) correlation evaluated at the film temperature and with the coefficient 0.3 for m 2 , as reported by Dittus and Boelter for cooling [16].
In 1975, Gnielinski presented another, now widely used, heat-transfer correlation based on the work of former researchers, and many forms of this correlation can be found in the literature. For a local Nusselt number, Gnielinski reported the following formula in the VDI Heat Atlas [18] in 2013:
N u x = ( f / 8 ) ( R e 1000 ) P r 1 + 12.7 f / 8 1 / 2 P r 2 / 3 1 ( 1 + 1 3 d i x 2 / 3 ) .
Here, the dimensionless numbers are evaluated at the bulk temperature and the final term accounts for the enhanced heat transfer at the inlet of the tubes; however, this term is frequently neglected.
When Equation (2) was first published, Gnielinski [19] gave the Filonenko equation to calculate the friction factor:
f = 1.82 log 10 R e 1.64 2 .
Later, in [18], he suggested the following formula by Konakov:
f = 1.8 log 10 R e 1.5 2 .
The geometries of PCHEs have been studied for their heat-transfer capabilities using mainly CFD, and studies have reported heat-transfer correlations [2,20]. Only a few authors have featured experimental work. New methods are being explored to predict heat transfer, such as machine learning for supercritical methane PCHEs [21]. The CFD studies were primarily conducted using helium or sCO2 as a working fluid; however, some utilized water on one side. Kim et al. [22] developed correlations of the power-law type for a specific geometry of a sCO2 zigzag PCHE, basing the correlation on experiments but extending their validity via CFD. Meshram et al. [23] developed specific heat-transfer correlations of the power-law type using CFD for zigzag channel PCHEs for a fixed geometry and a correlation with the input for the geometry, i.e., the linear pitch of the channels and the bend angle.
Objective and outline
In this study, two PCHE-type sCO2 recuperators, i.e., one with zigzag and one with s-shaped finned channels, were evaluated experimentally. Employing a conventional heat-exchanger model to recalculate the experimental conditions facilitates the effective assessment of the evaluation of several heat-transfer correlations, including traditional ones, and some specifically developed for PCHEs. The results are compared against predicting the off-design conditions of the zigzag-channel PCHE using the conductance ratio method. The ultimate goal of this study is to assess the conductance ratio method under limited information about the inputs (i.e., the geometry, reference, and characteristic heat-exchanger value) for an s-shaped PCHE.
The remainder of this paper is organized as follows. Section 2.1 presents the method employed to collect and prepare the experimental data for the validation of the models, including the descriptions of the test facility, the two PCHEs, and the measurement equipment.
Then, the conventional heat-exchanger model and conductance ratio method are described in Section 2.2 and Section 2.3, respectively. The options regarding the inputs to the conductance ratio method are also discussed and evaluated in greater detail than previously done by the authors who developed the conductance ratio method [4,24].
The method employed to evaluate fit of the models is discussed in Section 2.4.
Section 3.1 presents and discusses a comparison of the models employed for both PCHEs versus the experimental data. Then, an extensive analysis of the individual results of the zigzag PCHE modeled conventionally and the conductance ratio method for the zigzag and s-shaped PCHE are presented in Section 3.2, Section 3.3, and Section 3.4, respectively.

2. Methodology

In this study, the following methodology was employed to assess the most important inputs to the conductance ratio method.
  • The experiments were performed using two different PCHEs (sCO2 recuperators), one with a zigzag configuration and one with s-shaped fins.
  • By comparing the experimental results with the results from a conventional heat-exchanger model, three traditional and three zigzag PCHE specific heat-transfer correlations were reviewed.
  • By comparing the experimental results with those of the conductance ratio method, different approaches to find the characteristic parameter, i.e., the conductance ratio, were evaluated.
  • The versatility of this method was then tested by applying the best-suited heat-transfer correlation to the conductance ratio method.

2.1. Experimental Methodology

2.1.1. sCO2 Test Facility

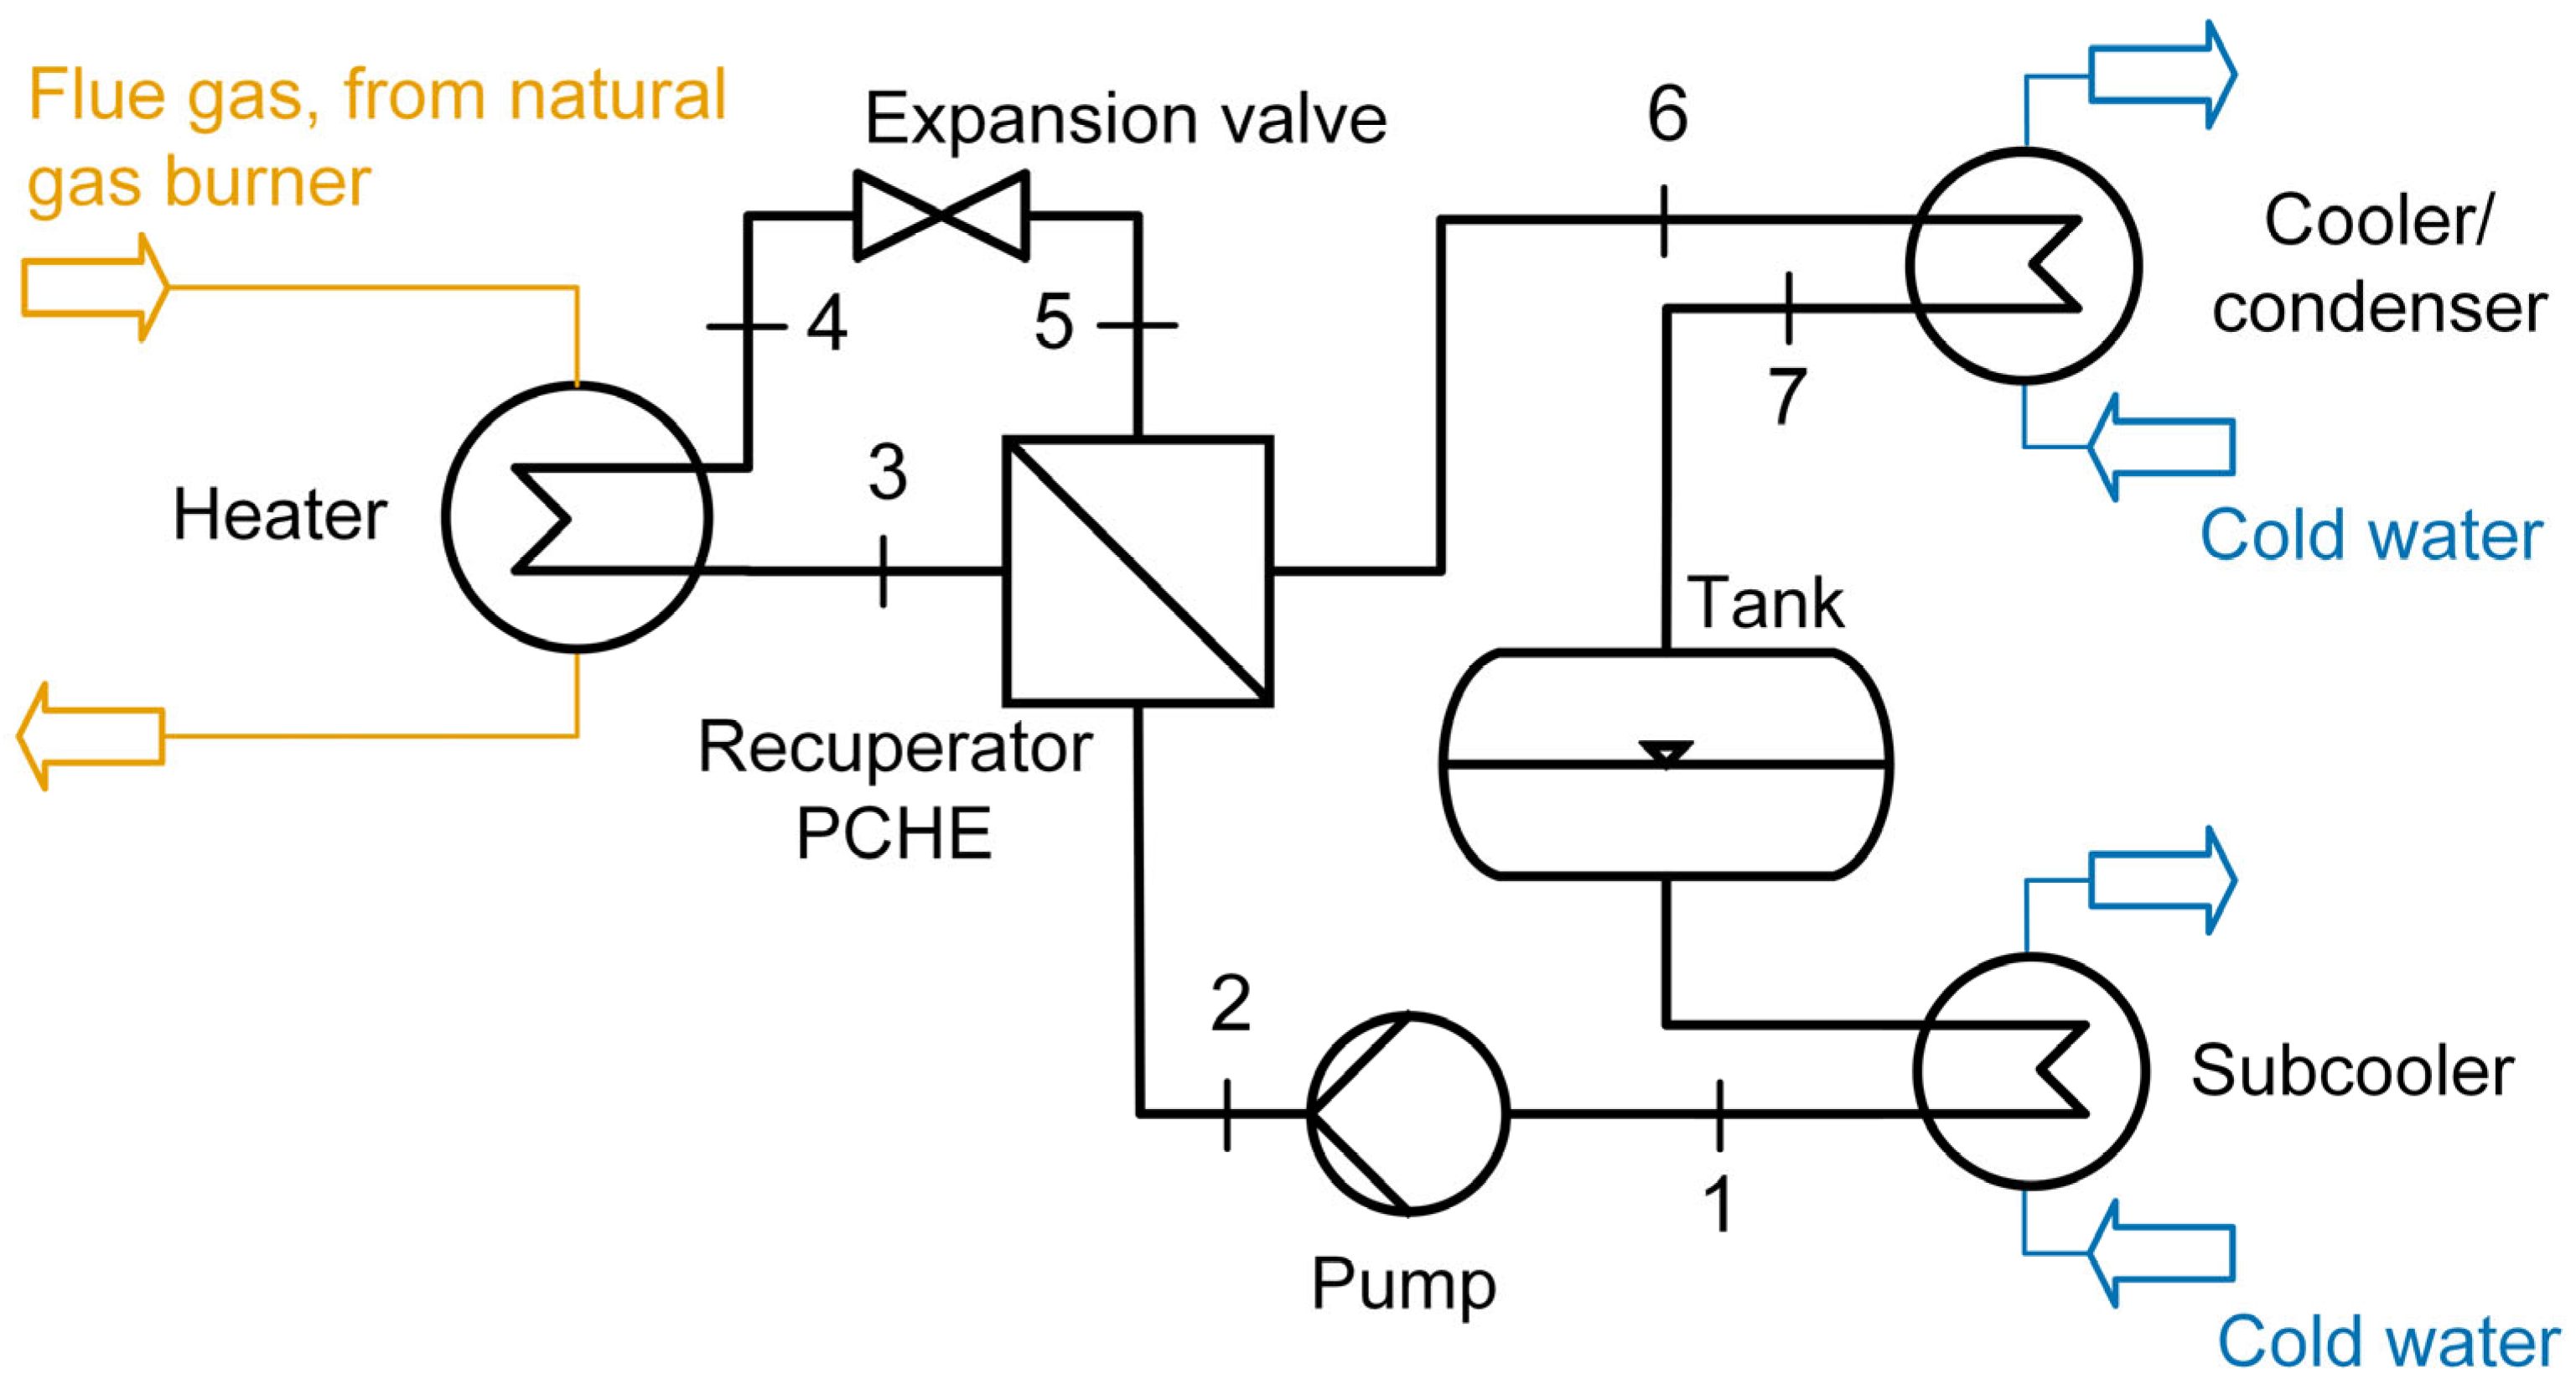
The experiments conducted in this study were performed at a test facility for supercritical CO2. In Figure 3, the layout of the closed process shows a recuperated Rankine cycle. In addition, the measurement devices employed in this study are presented in Table 1. Here, liquid CO2 (state 7) was subcooled prior to entering the piston pump (state 1). At the cold inlet of the PCHE (state 2), the CO2 was liquid at a supercritical pressure. The heater provided the heat input into the cycle and was powered by natural gas. The expansion valve simulates the pressure loss of a turbine. At state 5, the working fluid was at a subcritical pressure that is a function of the condensation (states 6 and 7) and the pressure losses in the PCHE, coolers/condensers, and the piping. Note that two coolers/condensers were operated in series between states 6 and 7. At state 7, the CO2 was fully condensed. A more detailed description of the test facility can be found in the literature [25].

2.1.2. sCO2 Recuperator

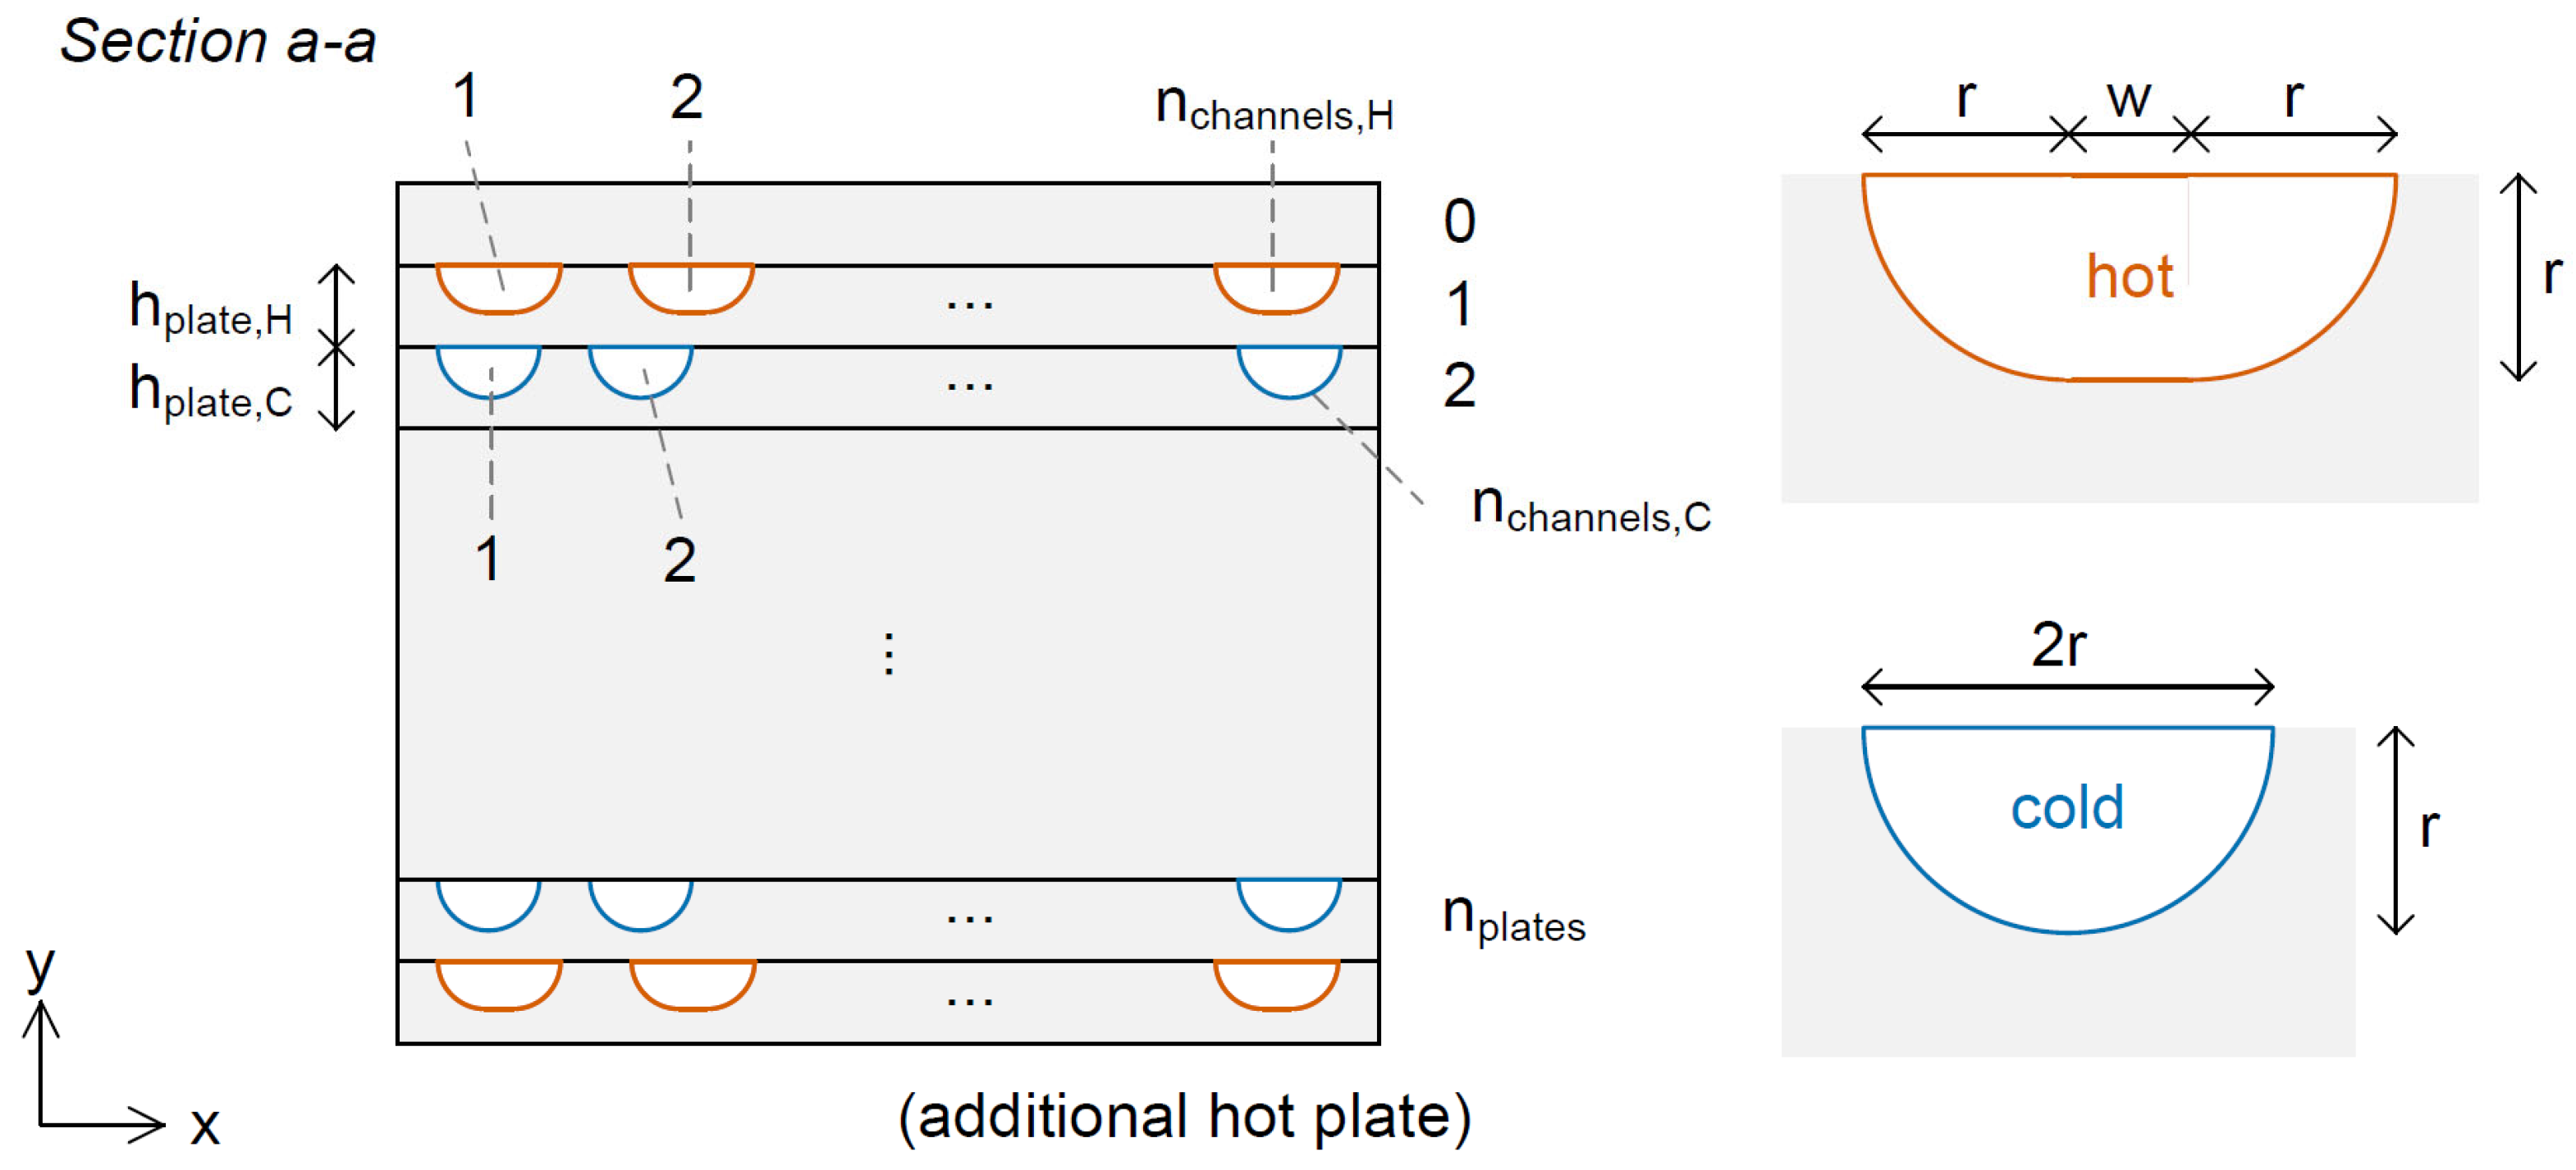
The sCO2 recuperator is a counterflow PCHE with zigzag-shaped channels (Figure 4). Unfortunately, the exact geometry cannot be disclosed. The flow is a crossflow in the inlet and outlet zones where the flanges are located. The cross-section is shown in Figure 5. Here, plates for hot and cold fluids are stacked alternately, with hot plates located at the first and last positions. The channels for the cold fluid are half-circles, and two quarter-circles are combined by a rectangle for the hot fluid. Note that there are different numbers of hot and cold channels per plate. The rounding in the zigzag channels are visualized in Figure 4 (sketch not to scale). In addition, there is one more hot plate than cold plates, which means that the outermost plates are the hot plates. To calculate the hot area for the conventional model, the conservative approach of counting the first and last plate as one was taken. In other words, the effective area of these plates is only one half the actual area. Figure 6 shows a photograph of the PCHE as installed before the thermal insulation.

2.1.3. Experimental Campaign

The inlet parameters were varied within the limitations of the achievable cycle in the test facility. Note that not all parameters can be selected independently.
  • The mass flow is the same for both sides.
  • The cold-side inlet temperature results from the liquid condition before the pump (condition 1 in Figure 3).
  • The cold-side pressure is limited by the achievable pressure drop at the expansion valve, which is dependent on valve inlet conditions (condition 4 in Figure 3).
  • The hot-side pressure is a function of the temperature of the low-pressure part (condition 7 in Figure 3) and was not varied considerably in this study. The limited range of hot-side pressure narrows the impact on the heat transfer.
The range of the collected data points at the main parameters is shown in Table 2. In the following discussions, the data points are labeled as numbered cases.

2.1.4. Data Reduction

Data reconciliation was performed on the experimental data. With the temperatures and pressures measured at all inlets and outlets of the recuperator, the system was overdetermined from a calculation standpoint, resulting in different values for the transmitted heat when calculating the cold and hot sides separately. The data-reconciliation process was performed to identify the corrected temperatures T H i n , T H o u t , T C i n , and T C o u t to minimize the following function with their accuracy as an auxiliary condition.
min T f T H i n , T H o u t , T C i n , T C o u t
Here, the energy balance is a function of temperature only, because the pressures were treated as fixed inputs due to their negligible influence.
f T = h T H i n , p H i n h T H o u t , p H o u t + h T C i n , p C i n h T C o u t , p C o u t
The corrected temperatures, measured mass flow rate m ˙ , and measured pressures p i n and p o u t lead to the transferred heat on the hot and cold sides of the heat exchanger:
Q ˙ e x p e r i m e n t a l = m ˙ ( h T i n , p i n h T o u t , p o u t ) .
In this study, the uncertainty analysis was conducted by calculating the standard deviation via the general law of error propagation [26] using the accuracy of the involved measurement equipment.

2.2. Conventional Heat-Exchanger Modeling

Conventional heat-exchanger modeling can be performed according to the VDI Heat Atlas [18] methodology. Here, the inputs are the (effective) areas of the hot and cold sides, the thickness of the plate between the sides, the fluid inlet conditions at both sides (temperatures and pressures), the correlations for the heat-transfer calculation, the number of sections for the discretization, and the starting conditions for the calculation.
Note that the pressure losses were neglected in the calculation because the pressure losses in the heat exchanger are small, i.e., approximately 0.3 bar for the design conditions. In addition, the pressure was assumed to be constant and equal to the mean between the absolute pressure measurements at the inlet and outlet.
The heat exchanger is discretized along its length into sections where the fluid conditions are treated as constant. To calculate the starting conditions, the transferred heat measured from the experiments was used and it is assumed that each section transfers the same heat. With the resulting conditions (temperatures), in the first iteration, the heat transfer was calculated using a correlation. For the heat-transfer coefficient, heat transfer and conduction at a flat plate were assumed. This transferred heat will lead to new temperatures in the sections to be used in the next iteration. The difference between the calculated transferred heat at the cold and hot sides was used as the criterion to stop the iterations.
The channel hydraulic diameter as the characteristic length for the Reynolds number can be calculated as follows using the area A and perimeter P of the channel:
d h = 4 A / P
Baik et al. [27] defined a modified hydraulic diameter based on a circle with the same area A as the cycle:
d h , m o d = 2 A / π
Various traditional and zigzag PCHE-specific heat-transfer correlations were programmed to be used with the model. They are listed with corresponding identification numbers in Table 3. Meshram et al. and Kim et al. determined the formulas experimentally and with CFD, respectively, for the geometries, as reported in Table 3. Note that the dimensions of the zigzag channel considered in the current study are different. They are within +88% and +160% of the values used by Meshram and Kim, respectively.

2.3. Conductance Ratio Method for Off-Design Calculation

The conductance ratio method [24] is a fast and easy way for the off-design calculation of heat exchangers without requiring a heat-exchange area. Instead, a single value, i.e., the conductance ratio, characterizes the heat exchanger in its reference case. The off-design heat transfer is scaled from this reference case, where all conditions at the inlets and outlets are known.
The calculation is based on only a few formulas. The step-by-step explanation is given after the establishment of main formulas.
The conductance ratio h A r a t i o indicates the heat transfer relative to the hot h A H and the cold h A C sides and is defined as follows:
h A r a t i o = h A H h A C .
The relation between the overall heat-transfer conductance ( U A -value) U A and the thermal conductance h A on both sides is expressed as follows:
1 U A = 1 h A H + R w + 1 h A C ,
where U denotes the overall heat-transfer coefficient. Thermal conductivity through the wall is negligible in respect to the heat transfer on either side of the heat exchanger. Neglecting the conductive resistance R w across the heat-exchanger wall yields:
1 U A = 1 h A H + 1 h A C .
A heat-transfer scaling formula is derived from dimensionless numbers with the definition of the Nusselt number N u , the characteristic length L , the heat-transfer coefficient h and the thermal conductivity k :
N u = h L k .
When setting the N u -numbers of a reference and an off-design case in relation, by adding the area A to the equation, one can write the equation using the thermal conductance h A , treating ( h A ) as a single variable:
N u o f f N u r e f = h A o f f k r e f h A r e f k o f f .
Using the correlation of Nusselt being a function of R e - and P r -numbers (for example, the Dittus–Boelter equation III in Table 3) and rearranging leads to the thermal conductance for the off-design conditions h A o f f , based on the thermal conductance in the reference case h A r e f , the thermal conductivity k , the Reynolds number, and the Prandtl number for the reference and off-design case, as well as two constants m 1 and m 2 :
h A o f f = h A r e f ( k o f f k r e f ) R e o f f R e r e f m 1 P r o f f P r r e f   m 2
When canceling out the characteristic length and the cross-sectional area (hidden in the velocity) in the Reynolds number, one obtains the following formula for the thermal conductance in off-design conditions, now including the mass flow rate m ˙ and the dynamic viscosity μ at reference case and off-design case conditions:
h A o f f = h A r e f ( k o f f k r e f ) m ˙ o f f / μ o f f m ˙ r e f / μ r e f m 1 P r o f f P r r e f   m 2 .
So far in the literature, the conductance ratio method has been used per default with the Dittus–Boelter coefficients m 1 = 0.8 , m 2 = 0.4 on the cold and m 2 = 0.3 on the hot side. Crespi et al. [4] suggested m 1 = 0.56 for a better fit for a water-CO2 PCHE, and Rodríguez-deArriba et al. [32] used m 1 = 0.604 and m 2 = 0.33 for a molten salt-CO2 shell-and-tube heat exchanger. Note that the other correlations and their coefficients can be employed with the scaling formula as long as the geometrical parameters are canceled out. Thus, Gnielinski’s correlation is not suitable for the conductance ratio method.
In this study, the following pressure-drop scaling formula was used:
Δ p o f f = Δ p r e f m ˙ o f f 2 / ρ o f f m ˙ r e f 2 / ρ r e f
Step-by-step explanation
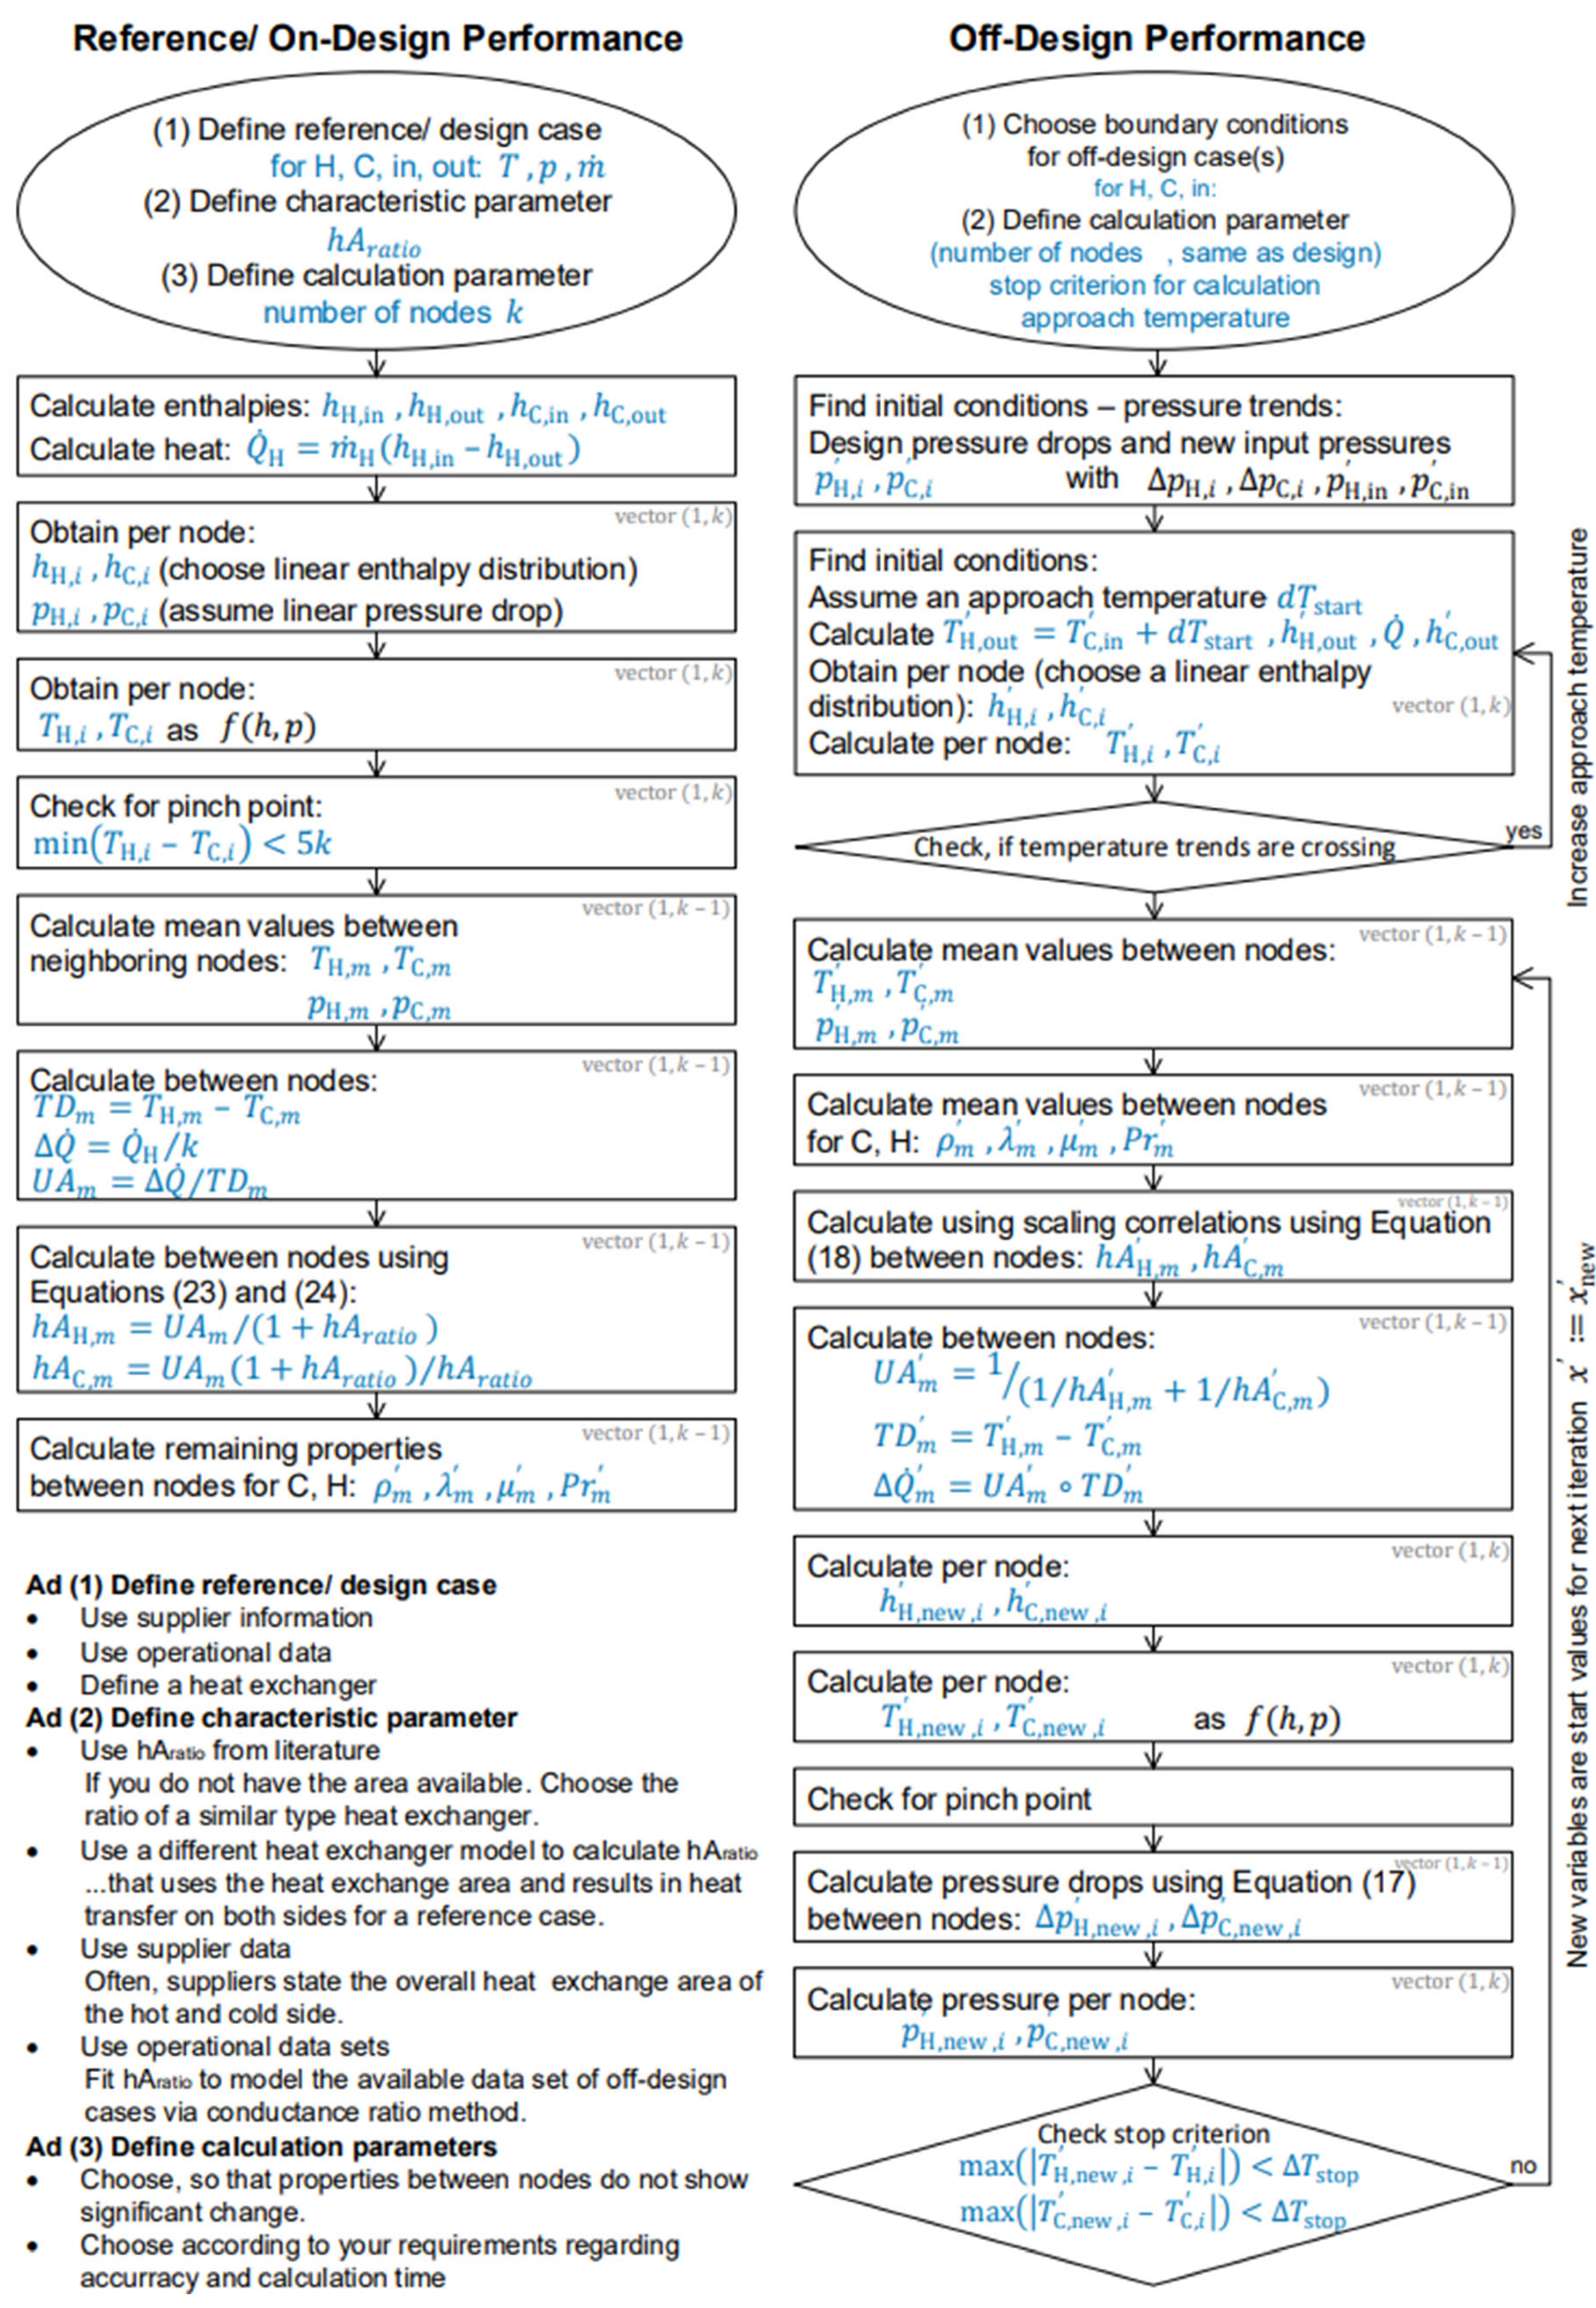
The calculation is performed in two steps: (1) specifying and calculating a reference case and (2) calculating one or more off-design cases. The flow sheet in Figure 7 demonstrates the individual steps of the method.
Three inputs are needed for the reference case calculation, with several options to obtain them:
  • A reference case: Temperatures, pressures, and mass flow rates at the inlets and outlets of both sides of the heat exchanger.
    • Option: Use supplier information (the design case of the heat exchanger);
    • Option: Use operational data (pick a data set most likely to be representative for the off-design cases you want to calculate);
    • Option: Define the conditions (which means designing a “virtual” heat exchanger).
  • The characteristic parameter  h A r a t i o  : The conductance ratio is a single value characteristic for the heat-transfer ratio between the hot and cold side.
    • Option: Use h A r a t i o from literature (Pick this option if you do not have the area available. Choose the ratio of a similar type heat exchanger).
    • Option: Use supplier data. (Often, suppliers state the overall heat-transfer conductance of the hot and cold side h A H and h A C . With Equation (12), one derives the conductance ratio).
    • Option: Use a different heat-exchanger model to calculate h A r a t i o that uses the heat-exchange area and results in heat transfer on both sides for a reference case.
    • Option: Use operational data sets. (Fit h A r a t i o to the available data set of off-design cases via the conductance ratio method. Use this h A r a t i o then to calculate more off-design cases).
  • The calculation parameter—number of nodes  k : For discretization of the heat exchanger.
    • Choose according to your requirements regarding accuracy and calculation time.
    • Choose so that properties change not significantly between nodes.
For on-design calculation, follow the flow sheet in Figure 7 and determine the enthalpies at inlets and outlets and an overall transferred heat Q ˙ H . Discretize the heat exchanger according to the enthalpy—choosing a linear correlation between inlet and outlet enthalpy:
Obtain the trends of enthalpy h i on the hot and cold side at each node i . Assume a trend of pressures p i by using a linear correlation between inlet and outlet on hot and cold side at each node i . Then, find the temperatures on hot T H , i and cold T C , i side as a function of the properties enthalpy and pressure at every node and check for any pinch point smaller than 5 K. Calculate the mean value of temperatures T H , m , T C , m , and pressures p H , m , p C , m between the nodes. For every section between neighboring nodes, calculate a temperature difference T D m
T D m = T H , m T C , m ,
the transferred heat Δ Q ˙ per section
Δ Q ˙ = Q ˙ H / k ,
and, with these values, an overall heat-transfer conductance U A m
U A m = Δ Q ˙ / T D m .
Using Equations (12) and (14), calculate the thermal conductance for the sections between the nodes on the hot h A H , m and cold h A C , m side
h A H , m = U A m / ( 1 + h A r a t i o )   a n d
h A C , m = U A m ( 1 + h A r a t i o ) / h A r a t i o .
Determine the remaining properties on both hot and cold sides between the nodes: density ρ m , thermal conductivity λ m , viscosity μ m , and Prandtl number P r m .
The trends of thermal conductance h A H , m , h A C , m , the densities ρ H , m , ρ C , m , the Prandtl numbers P r H , m , P r C , m , the viscosities μ H , m , μ C , m , and thermal conductivities λ H , m , λ C , m evaluated for the reference case become the reference values for the off-design calculation.
For the off-design calculation, additional calculation parameters need to be chosen: a stop criterion Δ T s t o p to break the iterative calculation loop, and an approach temperature d T s t a r t to determine the initial conditions.
With the pressure drops between nodes from the design case Δ p r e f , i , calculate initial pressure trends p H , i ,   p C , i of the off-design case for hot and cold side (properties at off-design conditions are marked with ‘).
With the approach temperature, calculate an initial hot outlet temperature T H , o u t for the off-design case
T H , o u t = T C , i n d T s t a r t
and the enthalpies at the in- and outlet as a function of the temperatures and pressures, as well as the transferred heat Q ˙ using the energy balance.
For the start conditions, choose a linear enthalpy distribution and obtain the trends of enthalpies h H , i ,   h C , i and temperatures T H , i ,   T C , i per node for both sides. Check for any crossing of the temperature trends between the hot and cold side; if yes, increase the approach temperature and start again at T H , o u t .
Determine the mean values for the sections between neighboring nodes for the trends of density ρ m , thermal conductivity λ m , viscosity μ m , and the Prandtl number P r m .
Calculate the thermal conductance trends h A H , i ,   h A C , i , using the scaling formula of Equation (16) for both sides of the heat exchanger.
Then, calculate the total thermal conductance for each section between nodes:
U A m = 1 / ( 1 h A H , m + 1 h A C , m )
For each section between nodes, determine the temperature difference T D m and calculate an element-wise product for the transferred heat per section:
Δ Q ˙ m = U A m T D m
With the transferred heat, for each node, first obtain new trends for the enthalpies h H , n e w , i ,   h C , n e w , i , then the temperature trends. Check for the pinch point. Update the pressure drops based on Equation (17).
Check the stop criterion for hot and cold temperature trends:
max T H , n e w , i T H , i < Δ T s t o p     a n d
max T C , n e w , i T C , i < Δ T s t o p .
If these criteria are not met, start again at calculating the mean values for temperatures and pressures for the sections between nodes with the newly obtained values.
Table 4 shows the inputs for the current study. Here, two reference cases were compared to evaluate the impact of this input on the method, i.e., the design case and an experimental case. For the zigzag PCHE, a data sheet from the supplier, i.e., Kelvion Thermal Solutions, is available. The data sheet information originates from the company’s internal software using non-public, self-developed heat-transfer correlations from other PCHE prototypes. Although the conditions for the zigzag PCHE could not be reached in the test facility (this does not undermine the validity of the study. It only limited the range of operating conditions slightly) due to issues with the heat input, they were chosen as a reference case. A large volume of experimental data was recorded; thus, one of these could function as a reference case. Case 33 was chosen because it was the closest to the average among all cases in terms of the mass flow rate and hot inlet temperature. For the s-shaped fin PCHE, case 17 was used as a reference case. The conditions of the reference cases are given in Appendix A, Table A1.
The zigzag PCHE data sheet also states hA-values for the hot and cold side, allowing us to calculate the hAratio. Another approach for the conductance ratio is to use values from the literature of similar heat exchangers. Crespi et al. [4] reported 1/9 for a water-CO2 PCHE with undisclosed channels. This value is likely too small for the CO2–CO2 heat exchanger used in this study. Rodríguez-de Arriba uses 0.875 for a high-temperature (up to 400 °C) CO2–CO2 recuperator of the PCHE-type with straight, semicircular channels. He obtained the value by simulating the heat exchanger with the Thermoflex software (v.30). Hoopes et al. [24] used an hAratio of 8 for a PCHE-type CO2–CO2 recuperator. This value was obtained by fitting the conductance ratio to experimental data from a shell-and-tube water-sCO2 heat exchanger.

2.4. Values for Comparison

The root-mean-square deviation R M S D reduces the differences between the experimental and predicted Q ˙ into one value for an entire recalculated set:
R M S D = 1 n i = 1 n Q ˙ e x p e r i m e n t a l ( i ) Q ˙ p r e d i c t e d ( i ) 2 ,
with the number of total experiments in a set n .
The differences can be related to the experimental result. Then, the normalized RMSD is given as follows:
N R M S D = 1 n i = 1 n Q ˙ e x p e r i m e n t a l i Q ˙ p r e d i c t e d i 2 / Q ˙ e x p e r i m e n t a l 2 ( i ) .

3. Results and Discussion

3.1. Overall Results

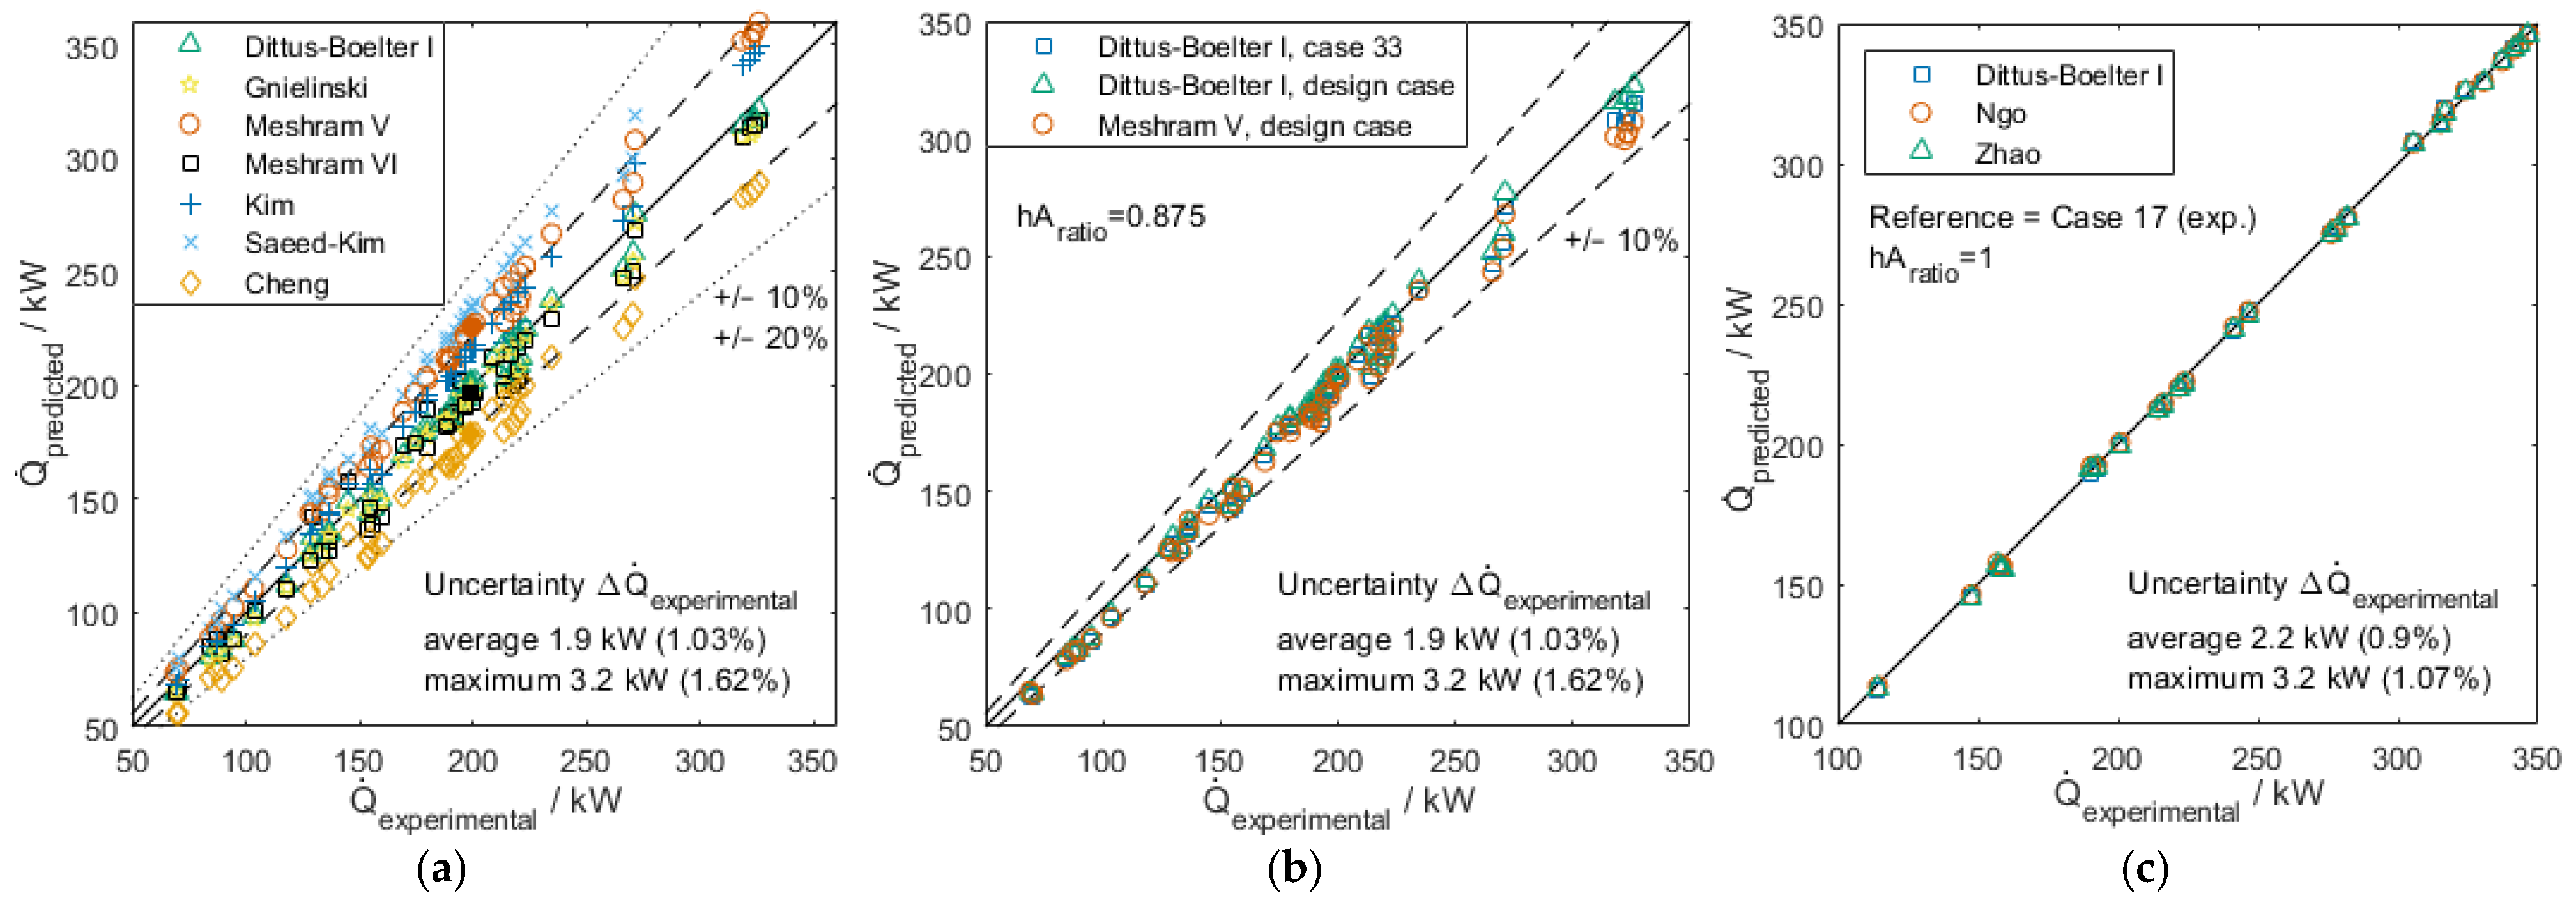
Figure 8a shows the results for the zigzag PCHE calculated with the conventional modeling. The average uncertainty of the experimental results is low, at 1%, with the maximum uncertainty of a single case at 1.6%. As shown, the results of all correlations lie within +/−20%. Meshram V, Kim, and Saeed-Kim overpredicted while Cheng underpredicted. The best performing correlations were Meshram VI, Dittus–Boelter I, and Gnielinski.
Some results obtained by the conductance ratio method for the zigzag PCHE are shown in Figure 8b. The results are shown for an hAratio of 0.875, a characteristic number at which the hot thermal conductance is assumed to be lower than the cold one in each cell. As can be seen, the results lie within +/−10%. Dittus–Boelter I is among the best correlations for the scaling formula and performs best when using the design case as the reference case.
Figure 8c shows the results of the conductance ratio method for the s-shaped fin PCHE when using the experimental Case 17 as the reference and an hAratio of 1. Both correlations developed for this PCHE geometry and Dittus–Boelter I yielded excellent results, lying nearly perfectly at the 45° line.

3.2. Conventional Modeling for Zigzag PCHE

The advantage of the conventional modeling technique is that all results, including the Reynolds number, are calculated in each cell, which is representative of equal distances along the heat exchanger. Figure 9 shows the results for the experimental case 33. The temperature, Reynolds number, and Prandtl number trends are very similar for the best performing heat-transfer correlations, i.e., Dittus–Boelter I, Gnielinksi, and Meshram VI. High spikes in properties/the Prandtl numbers are visible at the pseudocritical temperature at the cold, high-pressure side.
Note that the PCHE-specific correlations were frequently not developed for such a wide range of Prandtl numbers. For example, Kim reported their correlation for Prandtl numbers at a maximum of 1. The correlations may still be applicable despite not being tested at these conditions by the authors who developed them. However, Gnielinski’s correlation is valid up to Prandtl numbers of 105, and there is no range for the Dittus–Boelter correlation.
Meshram reported that temperature ranges for his correlations begin at higher temperatures than those applied in the current study. For Meshram V, the temperature condition at the entire cold side is outside the reported range, which may explain the poor fit. The temperature range of Meshram VI was not met for all conditions on either side.
Meshram VI’s heat-transfer coefficients are distributed differently than those of Dittus–Boelter I and Gnielinski with higher coefficients at the hot inlet, thereby placing more emphasis on hot temperatures than the high pressures and property spikes of Dittus–Boelter I and Gnielinski.

3.3. Conductance Ratio Method for Zigzag PCHE

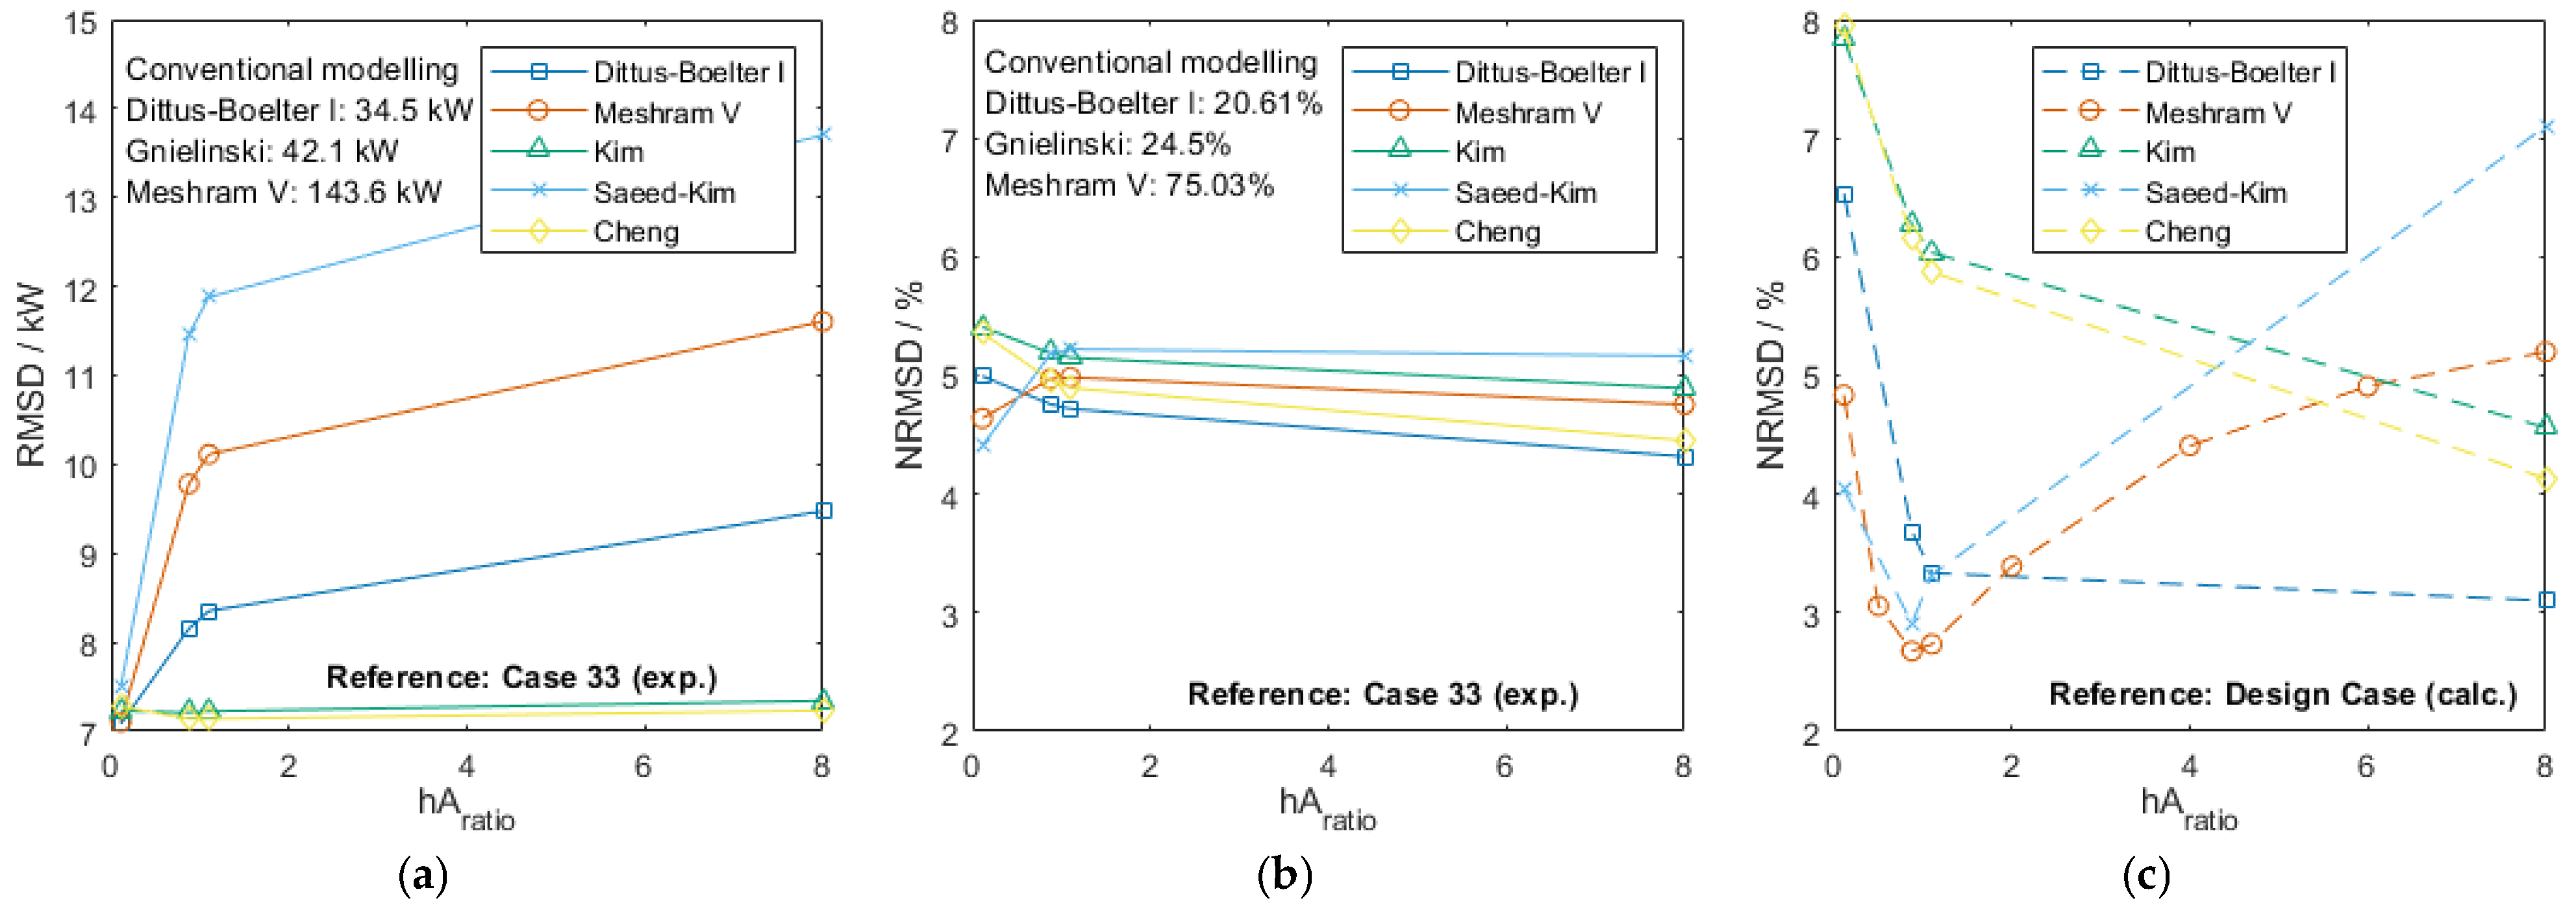
For the zigzag PCHE, the conductance ratio method relies on the scaling function based on a heat-transfer correlation, a reference case, and the hAratio. A minimum in the trends shown in Figure 10 indicates the hAratio is characteristic for the zigzag PCHE. For case 33 as the reference case, no such minimum is observed; however, for the reference design case (Figure 10c), two correlations, i.e., Meshram V and Saeed–Kim, point to 0.875 as the characteristic hAratio and show a very low average RMSD of 2.7%.
The resulting RMSD and NRMSD values for all methods are shown in Appendix B.
The method is not strongly dependent on either the hAratio or the heat-transfer correlation when using an experimental case as the reference (Figure 10b). However, the results with an RMSD of approximately 5% generally indicate that the conductance ratio method outperforms the conventional model, with its best performing correlation being Dittus–Boelter I at 20.6% (see the upper left corner for values of the conventional method).
The design reference case demonstrated better results, i.e., a lower RMSD value, which may seem counterintuitive because its conditions are further from the recalculated cases than using case 33. The main difference in the reference cases is that the hot inlet temperature (621.7 °C vs. 386.3 °C) and the cold-side pressure (215.0 bar vs. 90.6 bar) are much higher in the design case than in case 33. The lower pressure of case 33 leads to a higher spike of properties at the pseudocritical temperature, which disproportionally impacts the results under these conditions because the cells are selected for equal enthalpy steps at the hot side, which is not representative of the actual distribution of the properties.
Case 33 may not have been the most suitable reference case because of the very large property spikes. The case with the highest pressure on the cold side likely produces smaller spikes; thus, it would be a better reference case. Therefore, this approach was used to select a reference case for the s-shaped fin PCHE.
A disadvantage of the conductance ratio method is that, because of the lack of geometry and velocity, Reynolds numbers cannot be calculated and checked for the applicability of the HT correlation. However, conventional modeling demonstrated no issue with the Re number range in terms of applicability but rather with temperatures, which can be checked at least for one correlation, i.e., Meshram, for the conductance ratio method.

3.4. Conductance Ratio Method for S-Shaped Fin PCHE

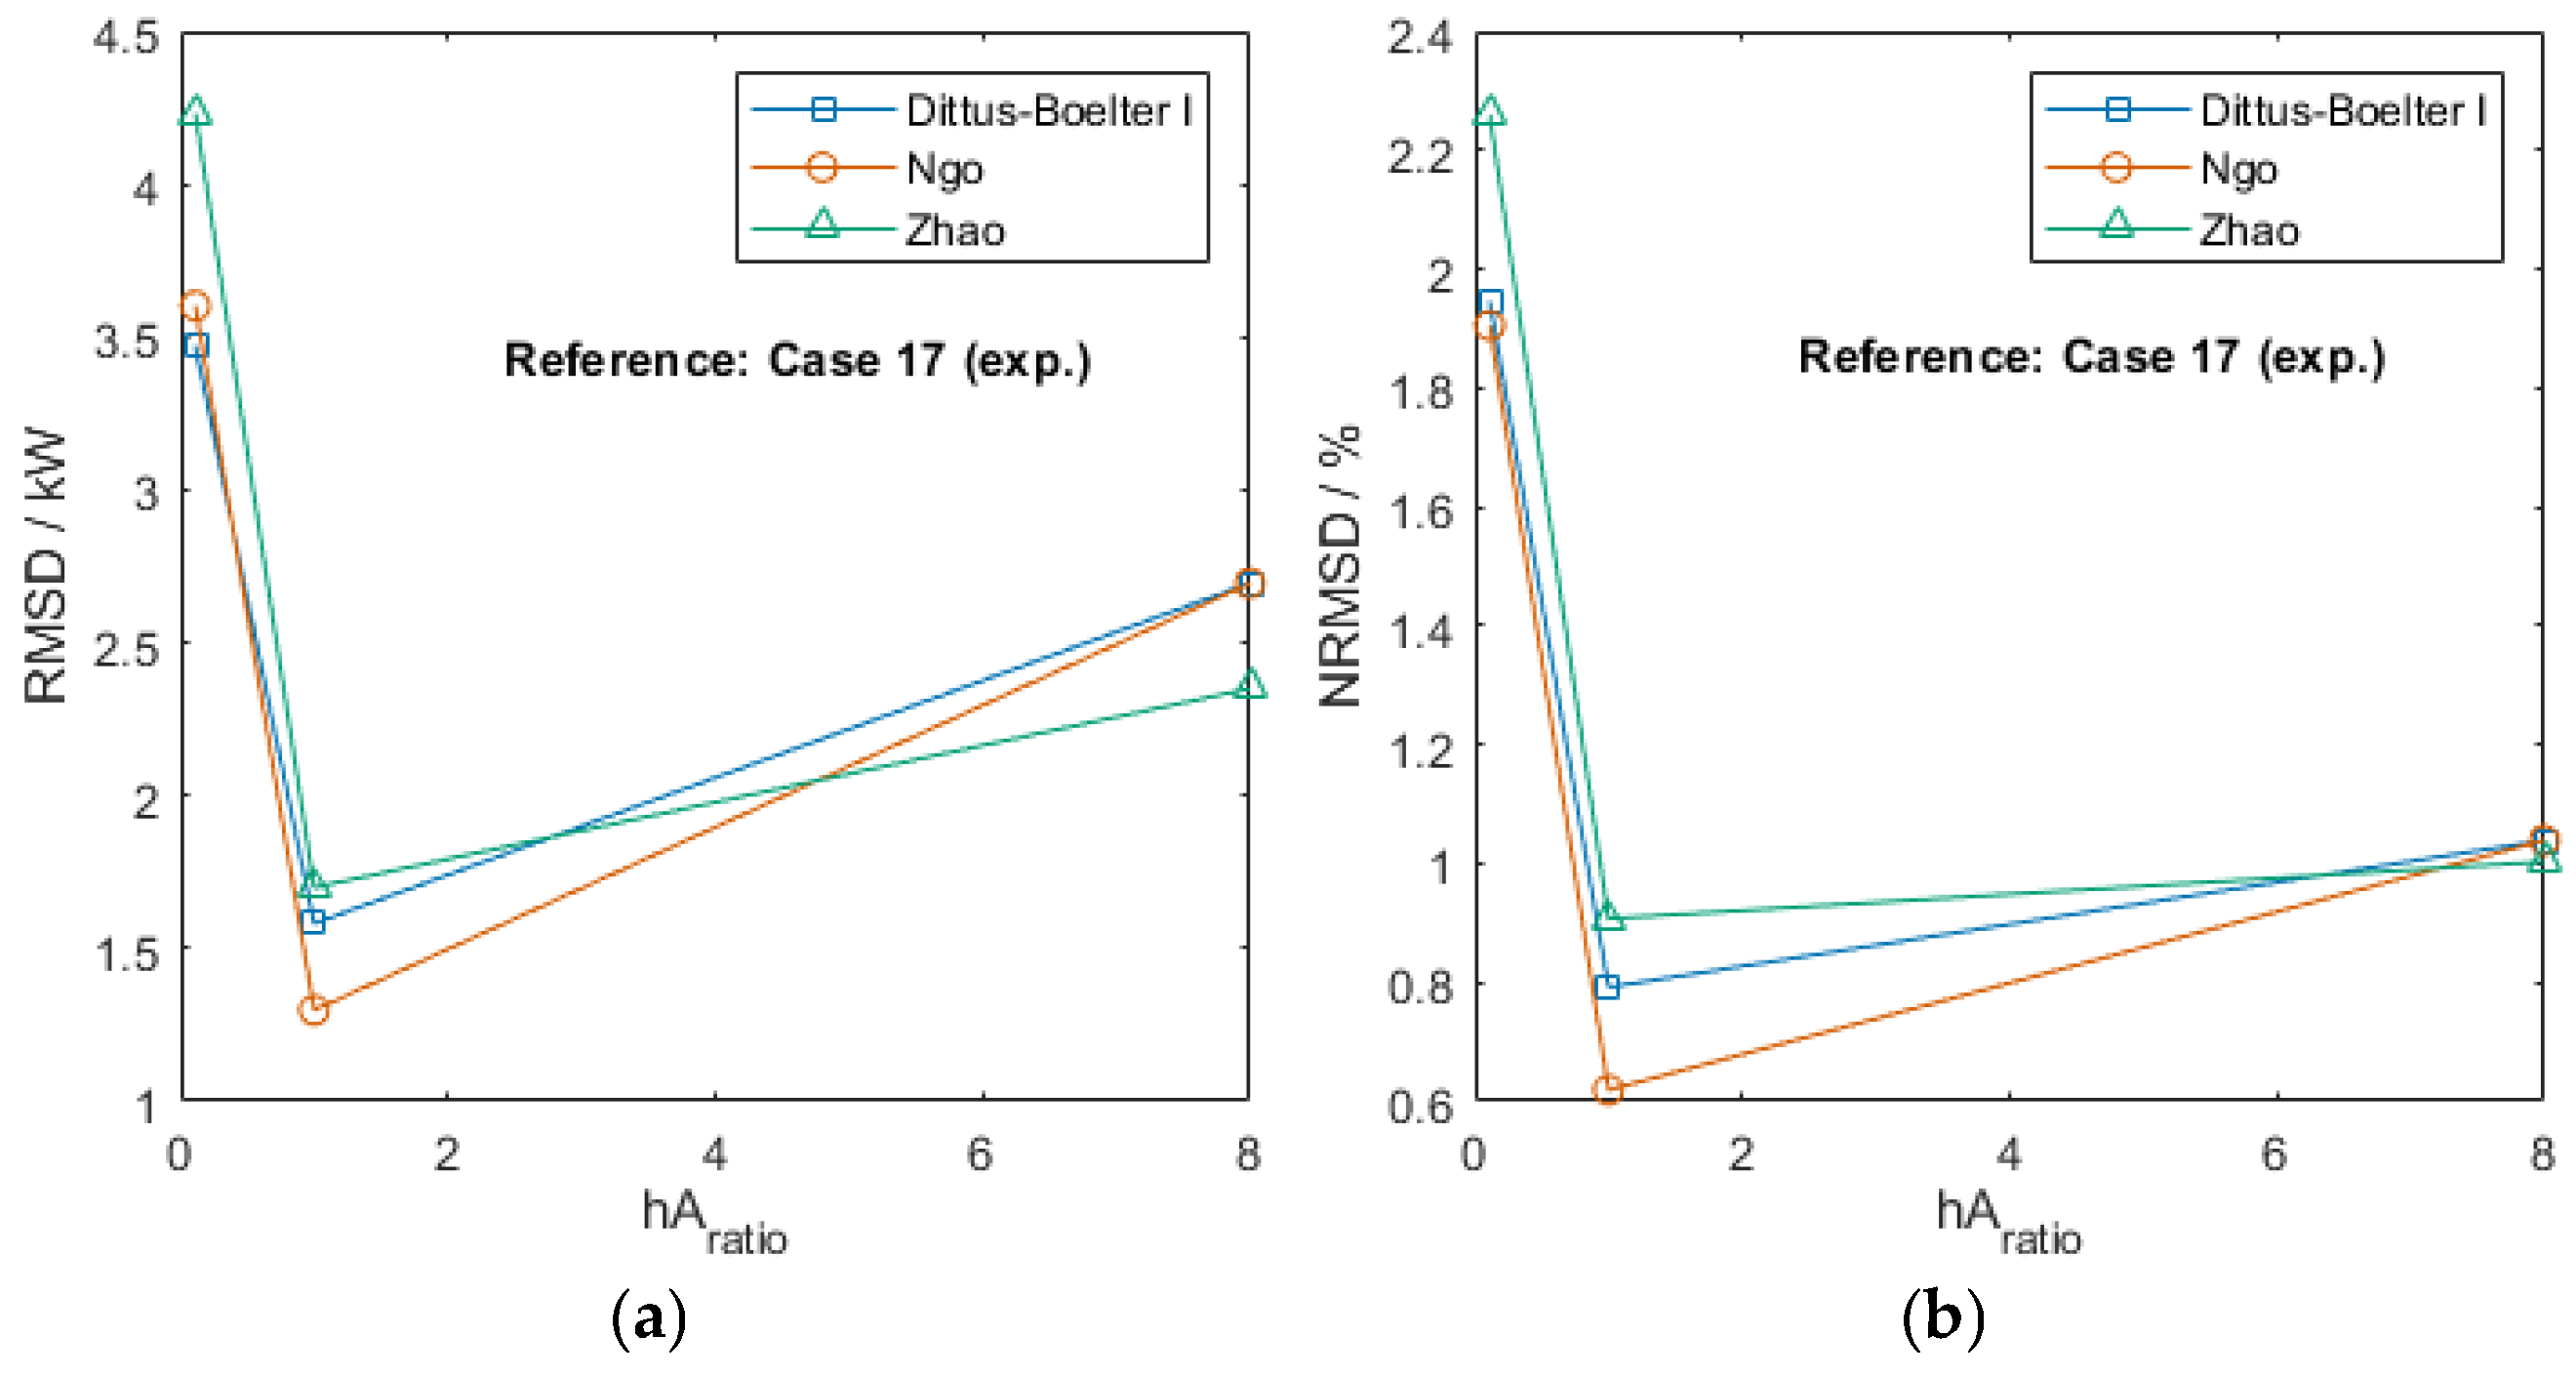
A minimum at hAratio = 1 is clearly visible in Figure 11. All correlations are equally well performing, with Ngo, which is a PCHE-specific correlation, exhibiting the best performance.
Figure 12 shows the relative difference for all cases on their own for Ngo’s correlation and all three hAratio values. As can be seen, the smallest hAratio value underpredicted the transferred heat, and the highest hAratio value overpredicted the transferred heat. In addition, the deviations are slightly smaller, with higher hot inlet temperatures/being closer in conditions to the reference case.

4. Conclusions and Outlook

The conductance ratio method is a simpler model with better results for the off-design calculations of PCHE-type CO2–CO2 heat exchangers. Fewer inputs are required, especially regarding the geometry. This is a clear advantage for theoretical system analysis, where the geometry does not need to be specified, and for the recalculation of heat exchangers where the geometry has not been documented or is not disclosed by the suppliers.
Only a few decisions are required to implement the conductance ratio method, i.e., (1) which reference case to use, (2) a characteristic value for the conductance ratio to select, and (3) which heat-transfer correlation to base the scaling formula upon.
Using the design data from the supplier as a reference case is an effective approach, leading to results that outperform the conventional heat-exchanger model in this study. If available for at least one operating point, the experimental data may act as the reference case. For sCO2 recuperators, where the conditions pass the pseudocritical temperature, reference cases with higher pressures, thereby limiting the impact of property spikes, were found to work most effectively. In the case of strong discrepancies between on- and off-design cases, which are more likely if either case is close to the pseudocritical temperature, the method’s ability to predict off-design conditions may be deteriorated. With more than one set of experimental data, the hAratio can be fit to best characterize the heat exchanger. As expected, the results are better for data sets with narrow ranges of the operating conditions. For PCHE-type CO2–CO2 heat exchangers, a conductance ratio of approximately 1 will give good results.
To date, one of the best options for the heat-transfer correlation is the Dittus–Boelter correlation. PCHE-specific correlations may yield better results; however, better results can likely only be expected when the off-design conditions are within the specified range and the channel geometries are similar.
In the future, the conductance ratio method should be extended to condensation. The authors work on CO2-based mixture power cycles where optimized conditions require the recuperator to partially condensate the working fluid well into the two-phase region. Here, the goal is to implement condensation without compromising the simplicity of the current model. Using the conductance ratio method as an off-design calculation tool is expected to enhance the results of system analysis for such power cycles.

Author Contributions

Conceptualization, V.C.I.; methodology, V.C.I.; software, V.C.I.; validation, V.C.I.; formal analysis, V.C.I.; investigation, V.C.I.; resources, V.C.I., X.G. and A.W.; data curation, V.C.I.; writing—original draft preparation, V.C.I.; writing—review and editing, V.C.I. and F.C.; visualization, V.C.I. and X.G.; supervision, F.C. and A.W.; project administration, funding acquisition X.G. and A.W. All authors have read and agreed to the published version of the manuscript.

Funding

The SCARABEUS project received funding from European Union’s Horizon 2020 research program under grant agreement N° 814985. The authors acknowledge TU Wien Bibliothek for financial support through its Open Access Funding Program and for financial support for editing/proofreading.

Data Availability Statement

The original data presented in the study are openly available at Zenodo (DOI: 10.5281/zenodo.15252151). The software is available on Github and can be cited via Zenodo. Zenodo includes: (1) the measurement data and uncertainty analysis, (2) results, and (3) the MATLAB code (version R2024b) for the analysis. Github includes the MATLAB code: (a) for the conventional heat-exchanger model (DOI: 10.5281/zenodo.15271565), (b) for the conductance ratio method (DOI: 10.5281/zenodo.15271585), and (c) for the error analysis and data reconciliation (DOI: 10.5281/zenodo.15271595).

Acknowledgments

Open Access Funding by TU Wien. The authors thank Stefan Thanheiser (TU Wien) and Theresa Brunauer (BOKU University) for sharing their conventional heat-exchanger model, upon which the PCHE-specific code is based. The authors also thank Stefan Thanheiser for his valuable insights and discussions. Our appreciation goes to Paul Schwarzmayr (TU Wien) who provided feedback on Section 2.3 during the revision stage of publishing.

Conflicts of Interest

Author Xavier Guerif was employed by the company Kelvion Thermal Solutions. The remaining authors declare that the research was conducted in the absence of any commercial or financial relationships that could be construed as a potential conflict of interest.

Abbreviations

The following abbreviations are used in this manuscript:
CFDComputational Fluid Dynamics
NRMSDNormalized Root-Mean-Square Deviation
PCHEPrinted-Circuit Heat Exchanger
RMSDRoot-Mean-Square Deviation
sCO2Supercritical Carbon Dioxide
The following symbols are used in this manuscript:
A area, m2
C 1 ,   C 2 constants in general structure of heat-transfer power-law correlation, -
c p specific heat at constant pressure, J/kgK
c p ¯ specific heat averaged over the cross-section of the channel, J/kgK
d i inner diameter, m
d h hydraulic diameter, m
d h , m o d modified hydraulic diameter, m
f friction factor, m
h enthalpy, J/kgK
h A r a t i o conductance ratio, -
h A thermal conductance, W/K
k t   o r   k T   thermal conductivity, W/mK
L h heated length, m
L p linear pitch (of the mini channel), m
m 1   t o   m 7 exponents in general structure of heat-transfer power-law correlation, -
m ˙ mass flow, kg/s
ppressure, Pa
P perimeter, m
Q ˙ transferred heat, W
R w thermal resistance, K/W
T   o r   t temperature, K
U A heat transfer conductance, W/K
α bend angle (of the mini channel), -
difference operator, -
μ dynamic viscosity, Pas
ρ density, kg/m3
The following dimensionless numbers are used in this manuscript:
NuNusselt number, -
PrPrandtl number, -
ReReynolds number, -
The following subscripts are used in this manuscript:
xindicating position where properties are evaluated, e.g., bulk
bbulk
Ccold (side of the heat exchanger)
ffilm
Hhot (side of the heat exchanger)
iinner
ininlet
mmean value in a section between calculation nodes
offoff-design
outoutlet
pcpseudocritical
refreference (case)
T, tindicating which temperatures are used in correlations
wwall

Appendix A. Reference Case Parameters for Input to Conductance Ratio Method

Table A1. Reference case parameters.
ParameterZigzag Channel PCHE
Design case
Zigzag Channel PCHE
Case 33
S-Shaped Fin PCHE
Case 17
m ˙ /kg/s0.60.550.6
T H i n /°C621.7386.3578.5
T H o u t /°C143.067.575.9
T C i n /°C25.913.419.6
T C o u t /°C358.0160.1363.2
p H i n /bar65.062.561.7
p H o u t /bar64.061.461.1
p C i n /bar215.090.6146.6
p C o u t /bar214.890.3146.1

Appendix B. Results for Recalculated Data Sets

Table A2. Results of conventional model.
Recalculated Set:
Conventional Model, Zigzag PCHE
RMSD/kWNRMSD/%
Meshram VI58.532.9
Meshram V143.675.0
Dittus–Boelter I34.520.6
Gnielinski42.124.5
Kim80.538.9
Saeed–Kim202.0106.9
Cheng173.596.8
Table A3. Results for s-shaped fin PCHE with conductance ratio method.
Recalculated Set:
CR Method, S-Shaped Fin PCHE
RMSD/kWNRMSD/%
Dittus–Boelter I, hAratio = 1/93.51.9
Dittus–Boelter I, hAratio = 11.60.8
Dittus–Boelter I, hAratio = 82.71.0
Ngo, hAratio = 1/93.61.9
Ngo, hAratio = 11.30.6
Ngo, hAratio = 82.71.0
Zhao, hAratio = 1/94.22.3
Zhao, hAratio = 11.70.9
Zhao, hAratio = 82.41.0
Table A4. Results for zigzag PCHE with conductance ratio method, reference case: case 33.
Recalculated Set:
CR Method, Zigzag PCHE, Case 33
RMSD/kWNRMSD/%
Dittus–Boelter I, hAratio = 1/97.15.0
Dittus–Boelter I, hAratio = 0.8758.24.8
Dittus–Boelter I, hAratio = 1.18.44.7
Dittus–Boelter I, hAratio = 89.54.3
Meshram V, hAratio = 1/97.14.6
Meshram V, hAratio = 0.8759.85.0
Meshram V, hAratio = 1.110.15.0
Meshram V, hAratio = 811.64.8
Kim, hAratio = 1/97.25.4
Kim, hAratio = 0.8757.25.2
Kim, hAratio = 1.17.25.2
Kim, hAratio = 87.34.9
Saeed–Kim, hAratio = 1/97.54.4
Saeed–Kim, hAratio = 0.87511.55.2
Saeed–Kim, hAratio = 1.111.95.2
Saeed–Kim, hAratio = 813.75.2
Cheng, hAratio = 1/97.35.4
Cheng, hAratio = 0.8757.15.0
Cheng, hAratio = 1.17.14.9
Cheng, hAratio = 87.24.5
Table A5. Results for zigzag PCHE with conductance ratio method, reference case: design case.
Recalculated Set:
CR Method, Zigzag PCHE, Design Case
RMSD/kWNRMSD/%
Dittus–Boelter I, hAratio = 1/99.86.5
Dittus–Boelter I, hAratio = 0.8755.83.7
Dittus–Boelter I, hAratio = 1.15.43.3
Dittus–Boelter I, hAratio = 86.03.1
Meshram V, hAratio = 1/97.34.8
Meshram V, hAratio = 0.55.03.1
Meshram V, hAratio = 0.8754.92.7
Meshram V, hAratio = 1.15.22.7
Meshram V, hAratio = 26.63.4
Meshram V, hAratio = 48.34.4
Meshram V, hAratio = 69.14.9
Meshram V, hAratio = 89.65.2
Kim, hAratio = 1/911.67.8
Kim, hAratio = 0.8759.26.3
Kim, hAratio = 1.18.86.0
Kim, hAratio = 86.74.6
Saeed–Kim, hAratio = 1/96.54.0
Saeed–Kim, hAratio = 0.8755.72.9
Saeed–Kim, hAratio = 1.16.43.3
Saeed–Kim, hAratio = 812.57.1
Cheng, hAratio = 1/911.97.9
Cheng, hAratio = 0.8759.36.2
Cheng, hAratio = 1.18.95.9
Cheng, hAratio = 86.64.1

References

  1. Crespi, F.; Gavagnin, G.; Sánchez, D.; Martínez, G.S. Supercritical carbon dioxide cycles for power generation: A review. Appl. Energy 2017, 195, 152–183. [Google Scholar] [CrossRef]
  2. Huang, C.; Cai, W.; Wang, Y.; Liu, Y.; Li, Q.; Li, B. Review on the characteristics of flow and heat transfer in printed circuit heat exchangers. Appl. Therm. Eng. 2019, 153, 190–205. [Google Scholar] [CrossRef]
  3. Chai, L.; Tassou, S.A. A review of printed circuit heat exchangers for helium and supercritical CO2 Brayton cycles. Therm. Sci. Eng. Prog. 2020, 18, 100543. [Google Scholar] [CrossRef]
  4. Crespi, F.; Sánchez, D.; Hoopes, K.; Choi, B.; Kuek, N. The Conductance Ratio Method for Off-Design Heat Exchanger Modeling and its Impact on an sCO2 Recompression Cycle. In Volume 9: Oil and Gas Applications; Supercritical CO2 Power Cycles; Wind Energy; American Society of Mechanical Engineers: Charlotte, NC, USA, 2017. [Google Scholar] [CrossRef]
  5. Kwon, J.S.; Bae, S.J.; Heo, J.Y.; Lee, J.I. Development of accelerated PCHE off-design performance model for optimizing power system operation strategies in S-CO2 Brayton cycle. Appl. Therm. Eng. 2019, 159, 113845. [Google Scholar] [CrossRef]
  6. Neises, T. Steady-state off-design modeling of the supercritical carbon dioxide recompression cycle for concentrating solar power applications with two-tank sensible-heat storage. Sol. Energy 2020, 212, 19–33. [Google Scholar] [CrossRef]
  7. Alfani, D.; Binotti, M.; Macchi, E.; Silva, P.; Astolfi, M. sCO2 power plants for waste heat recovery: Design optimization and part-load operation strategies. Appl. Therm. Eng. 2021, 195, 117013. [Google Scholar] [CrossRef]
  8. Xie, L.; Zhuang, D.; Li, Z.; Ding, G. Technical Characteristics and Development Trend of Printed Circuit Heat Exchanger Applied in Floating Liquefied Natural Gas. Front. Energy Res. 2022, 10, 885607. [Google Scholar] [CrossRef]
  9. Cabeza, L.F.; De Gracia, A.; Fernández, A.I.; Farid, M.M. Supercritical CO2 as heat transfer fluid: A review. Appl. Therm. Eng. 2017, 125, 799–810. [Google Scholar] [CrossRef]
  10. Duffey, R.B.; Pioro, I.L. Experimental heat transfer of supercritical carbon dioxide flowing inside channels (survey). Nucl. Eng. Des. 2005, 235, 913–924. [Google Scholar] [CrossRef]
  11. Ehsan, M.M.; Guan, Z.; Klimenko, A.Y. A comprehensive review on heat transfer and pressure drop characteristics and correlations with supercritical CO2 under heating and cooling applications. Renew. Sustain. Energy Rev. 2018, 92, 658–675. [Google Scholar] [CrossRef]
  12. Pioro, I.L.; Khartabil, H.F.; Duffey, R.B. Heat transfer to supercritical fluids flowing in channels—Empirical correlations (survey). Nucl. Eng. Des. 2004, 230, 69–91. [Google Scholar] [CrossRef]
  13. Lienhard, J.H.I.; Lienhard, J.H.V. A Heat Transfer Textbook; Phlogiston Press: Cambridge, MA, USA, 2020. [Google Scholar]
  14. McAdams, W.H. Heat Transmission; McGraw-Hill Book Company, Inc.: New York, NY, USA; London, UK, 1942. [Google Scholar]
  15. Kruizenga, A.; Anderson, M.; Fatima, R.; Corradini, M.; Towne, A.; Ranjan, D. Heat Transfer of Supercritical Carbon Dioxide in Printed Circuit Heat Exchanger Geometries. J. Therm. Sci. Eng. Appl. 2011, 3, 031002. [Google Scholar] [CrossRef]
  16. Dittus, F.W.; Boelter, L.M.K. Heat transfer in automobile radiators of the tubular type. Univ. Calif. Publ. Eng. 1930, 2, 443–461. [Google Scholar] [CrossRef]
  17. Winterton, R.H.S. Where did the Dittus and Boelter equation come from? Int. J. Heat Mass Transf. 1998, 41, 809–810. [Google Scholar] [CrossRef]
  18. Gnielinski, V. G1: Heat Transfer in Pipe Flow. In VDI Heat Atlas, 2nd ed.; VDI-Gesellschaft Verfahrenstechnik und Chemieingenieurwesen, Ed.; Springer: Berlin, Germany; London, UK, 2010. [Google Scholar]
  19. Gnielinski, V. Neue Gleichungen für den Wärme- und den Stoffiübergang in turbulent durchströmten Rohren und Kanälen. Forsch. Ing.-Wes. 1975, 41, 1. [Google Scholar] [CrossRef]
  20. Ma, Y.; Xie, G.; Hooman, K. Review of printed circuit heat exchangers and its applications in solar thermal energy. Renew. Sustain. Energy Rev. 2022, 155, 111933. [Google Scholar] [CrossRef]
  21. Li, Q.; Zhan, Q.; Yu, S.; Sun, J.; Cai, W. Study on thermal-hydraulic performance of printed circuit heat exchangers with supercritical methane based on machine learning methods. Energy 2023, 282, 128711. [Google Scholar] [CrossRef]
  22. Kim, S.G.; Lee, Y.; Ahn, Y.; Lee, J.I. CFD aided approach to design printed circuit heat exchangers for supercritical CO2 Brayton cycle application. Ann. Nucl. Energy 2016, 92, 175–185. [Google Scholar] [CrossRef]
  23. Meshram, A.; Jaiswal, A.K.; Khivsara, S.D.; Ortega, J.D.; Ho, C.; Bapat, R.; Dutta, P. Modeling and analysis of a printed circuit heat exchanger for supercritical CO2 power cycle applications. Appl. Therm. Eng. 2016, 109, 861–870. [Google Scholar] [CrossRef]
  24. Hoopes, K.; Sánchez, D.; Crespi, F. A new method for modelling off-design performance of sCO2 heat exchangers without specifying detailed geometry. In Proceedings of the 5th International Symposium—Supercritical CO2 Power Cycles, San Antonio, TX, USA, 28–31 March 2016. [Google Scholar]
  25. Illyés, V.; Thanheiser, S.; Schwarzmayr, P.; David, P.-L.; Guerif, X.; Werner, A.; Haider, M. sCO2 test facility at TU Wien: Design, operation and results. In Proceedings of the 5th European sCO2 Conference for Energy Systems, Prague, Czech Republic, 14–16 March 2023; p. 22. [Google Scholar] [CrossRef]
  26. Drosg, M. Dealing with Uncertainties: A Guide to Error Analysis; Springer: Berlin/Heidelberg, Germany, 2009. [Google Scholar] [CrossRef]
  27. Baik, S.; Kim, S.G.; Lee, J.; Lee, J.I. Study on CO2—Water printed circuit heat exchanger performance operating under various CO2 phases for S-CO2 power cycle application. Appl. Therm. Eng. 2017, 113, 1536–1546. [Google Scholar] [CrossRef]
  28. Saeed, M.; Kim, M.-H. Thermal-hydraulic analysis of sinusoidal fin-based printed circuit heat exchangers for supercritical CO2 Brayton cycle. Energy Convers. Manag. 2019, 193, 124–139. [Google Scholar] [CrossRef]
  29. Cheng, K.; Zhou, J.; Huai, X.; Guo, J. Experimental exergy analysis of a printed circuit heat exchanger for supercritical carbon dioxide Brayton cycles. Appl. Therm. Eng. 2021, 192, 116882. [Google Scholar] [CrossRef]
  30. Ngo, T.L.; Kato, Y.; Nikitin, K.; Ishizuka, T. Heat transfer and pressure drop correlations of microchannel heat exchangers with S-shaped and zigzag fins for carbon dioxide cycles. Exp. Therm. Fluid Sci. 2007, 32, 560–570. [Google Scholar] [CrossRef]
  31. Zhao, J.-W.; Zhao, R.; Nian, Y.-L.; Cheng, W.-L. Experimental study of supercritical CO2 in a vertical adaptive flow path heat exchanger. Appl. Therm. Eng. 2021, 188, 116597. [Google Scholar] [CrossRef]
  32. Arriba, P.R.-D.; Crespi, F. Assessment of part-load operation strategies of supercritical power cycles using carbon dioxide mixtures in CSP plants, including air-cooled condenser optimisation. In Proceedings of the ASME Turbo Expo 2023: Turbomachinery Technical Conference and Exposition, Volume 12: Supercritical CO2, Boston, MA, USA, 26–30 June 2023. [Google Scholar]
Figure 1. A photograph of a commercial PCHE (Kelvion Thermal Solutions, Nantes, France) showing the stacking of plates with straight and zigzag channels and inlet- and outlet headers.
Energies 18 03547 g001
Figure 3. The main components of the sCO2 test facility. The recuperator is a PCHE with zigzag-type channels. Numbers indicate the state of the working fluid.
Energies 18 03547 g003
Figure 4. The layout of the PCHE. This overview includes the inlet conditions, channel details, and crossflow and counterflow areas (mixed-plate arrangement). Orange and blue lines show the direction of hot and cold channels, respectively.
Energies 18 03547 g004
Figure 5. A cross-section of the PCHE: an overview of alternating plates and shapes of the hot and cold channels.
Energies 18 03547 g005
Figure 6. A photograph of the PCHE during construction (before heat insulation).
Energies 18 03547 g006
Figure 7. A flow sheet showing the individual calculation steps with variables in blue of the conductance ratio method.
Energies 18 03547 g007
Figure 8. Predicted versus experimental results of the overall transferred heat, conductance ratio method results for exemplary hA-ratios, and reference cases. The uncertainty of the experimental results is shown as the average and maximum of all cases. (a) Conventional modeling for the zigzag PCHE. Case 33 is indicated by filled markers. (b) Conductance ratio method for the zigzag PCHE, for the best performing hAratio. (c) Conductance ratio method for the s-shaped fin PCHE.
Energies 18 03547 g008
Figure 9. The results for case 33 of the zigzag PCHE calculated with conventional modeling for three example correlations: Meshram, Dittus–Boelter, and Gnielinski. The results include the Reynolds numbers (in contrast to the conductance ratio method), which allows us to check whether the correlation can be applied under these conditions. (a) Temperature distribution. (b) Reynolds numbers. (c) Prandtl numbers. (d) hAratios.
Energies 18 03547 g009
Figure 10. The results of conductance ratio method for the zigzag PCHE as a function of hAratio for scaling functions based on different correlations. The respective rms for conventional modeling are shown for comparison in the left corners. (a) Root-mean-square deviation using case 33 as a reference. (b) Normalized root-mean-square deviation. (c) Normalized root-mean-square deviation (in relation to transferred heat) using the design case and case 33 as a reference.
Energies 18 03547 g010
Figure 11. The results of conductance ratio method for s-shaped fin PCHE as a function of the hAratio for scaling functions based on different correlations. (a) Root-mean-square deviation using case 17 as a reference. (b) Normalized root-mean-square deviation using case 17 as a reference.
Energies 18 03547 g011
Figure 12. The individual results of each case of the conductance ratio method for the s-shaped fin PCHE using case 17 as a reference case with different hAratio values. The cases are sorted by increasing hot inlet temperature.
Energies 18 03547 g012
Table 1. Measurement devices.
Type and Location (See Figure 3)Type
FI at 2Coriolis sensor from Endress & Hauser, Reinach, Switzerland
TI at 2Temperature measurement from Coriolis sensor from Endress & Hauser; accuracy ±0.5 ± 0.005 T (°C)
TI at 5Thermocouple (TE) from TCDirect, Mönchengladbach, Germany, Type J, tolerance class 2 according to DIN EN 60 584-2, with converter to 4–20 mA signal
TI at 3, 6 Resistance thermometer (PT100) from TCDirect;
Pt100, 4-wire, class A
PI at 2, 3, 5, 6Pressure transmitter from ICCP Messtechnik, Wien, Austria, PCE-28
Table 2. The range of collected data points at the main measurement positions.
LocationRange Zigzag Channel PCHERange S-Shaped Fin PCHE
m ˙ (at pos. 2)0.26–0.6 kg/s0.4–0.6 kg/s
T H i n (at pos. 5)161.9–576.9 °C254.1–576.9 °C
T C i n (at pos. 2)11.2–19.6 °C12.4–19.6 °C
p H i n (at pos. 5)57.6–65.2 bar59.6–61.7 bar
p C i n (at pos. 2)75.1–147.8 bar79.4–147.8 bar
Number of recorded data points5328
Table 3. Correlations as used for the calculations of this paper and their applicability. Correlations I, II, IV are traditional, general correlations and III, V–XI PCHE-specific.
IDReferenceFormulasAdditional RemarksChannelsApplicability
I“Dittus and Boelter” as introduced by McAdams [14] N u = 0.023 R e 0.8 P r 0.4 Evaluated at bulk temperature T b ; often used (only) for heating (cold side) Single-phase HT,
heating, cooling;
non-fluid specific,
non-geometry-specific
II“Dittus and Boelter” for cooling N u = 0.023 R e 0.8 P r 0.3 Evaluated at bulk temperature T b ; often used for cooling (hot side) in combination with (I) Cooling; non-fluid specific, non-geometry-specific
III“Dittus and Boelter” for PCHEHot side: N u = 0.023 R e 0.56 P r 0.3
Cold side: N u = 0.023 R e 0.56 P r 0.4
Adapted for the conductance ratio method for CO2-CO2 PCHE by Crespi [4]Mini-channels (geometry not disclosed)
IVGnielinski [18] N u = ( f / 8 ) ( R e 1000 ) P r 1 + 12.7 f / 8 1 2 ( P r 2 3 1 )
f = 1.8 log 10 R e 1.5 2
Evaluated at bulk temperature T b ;
friction factor f from Konakov
Smooth, circular macrotube (in-tube)Single-phase HT, turbulent,
2300 < Re < 106, 0.6 < Pr < 105; non-fluid specific,
non-geometry-specific
VMeshram [23]Hot side (470 K < Tb < 630 K):
N u = 0.0174 R e 0.893 P r 0.7
Hot side (580 K < Tb < 730 K):
N u = 0.0205 R e 0.869 P r 0.7
Cold side (400 K < Tb < 520 K):
N u = 0.0177 R e 0.871 P r 0.7
Cold side (500 K < Tb < 640 K):
N u = 0.0213 R e 0.876 P r 0.7
For zigzag-channel PCHEs; developed for CO2-CO2; in this paper: in overlapping temperature ranges (580–630 K; 500–520 K): mean value of both correlationsSemicircular zigzag minichannels
D = 2 mm, α = 110°,
Lp = 10 mm
Hot: 470 < Tb < 730 K,
5000 < Re < 32,000
Cold: 500 < Tb < 640 K,
5000 < Re < 32,000
VIMeshram [23]Hot side:
N u = 87.56 L p 12 0.178 α 116 0.9306 Cold side:
N u = 85.95 L p 12 0.171 α 116 0.8912
For zigzag-channel PCHEs;
developed for CO2-CO2
Semicircular zigzag minichannels
D = 2 mm, 110° < α < 120°, 8 < Lp < 10 mm
Hot: 470 < Tb < 630 K,
5000 < Re < 32,000
Cold: 400 < Tb < 520 K,
5000 < Re < 32,000
VIIKim [22]Hot side:  N u = 0.0292 R e 0.8138
Cold side: N u = 0.0188 R e 0.8742
For zigzag-channel PCHEs;
developed for CO2-CO2
Semicircular zigzag minichannels; D = 1.9 mm
Hot: α = 115°, Lp = 9 mm
Cold: α = 100°,
Lp = 7.24 mm
0.7 < Pr < 1
Hot: 2300 < Re < 58,000
Cold: 2300 < Re < 55,000
VIIISaeed and Kim [28] N u = 0.041 R e 0.83 P r 0.95 For zigzag-channel PCHEs;
developed for CO2-CO2
Semicircular zigzag minichannels;
α = 100°
0.7 < Pr < 1.2
3000 < Re <60,000
IXCheng [29]Hot side: N u = 0.02475 R e 0.76214
Cold side: N u = 0.02063 R e 0.7678
For zigzag-channel PCHEs;
developed for CO2-CO2
Semicircular zigzag minichannels;
α = 115°, D/Lp = 6
0.765 < Pr < 0.784
3000 < Re <60,000
XNgo [30]Hot and cold side:
N u = 0.1740 R e 0.593 P r 0.43
For s-shaped fin-channel PCHEsStaggered, s-shaped fin minichannels; same geometry for both sides (see Table 1 [30] for specific values)3500 < Re < 23,000
0.75 < Pr < 2.2
XIZhao [31]Hot side:
N u = 0.1772 R e 0.6051 P r 0.2127
Cold side:
N u = 0.1001 R e 0.6637 P r 0.3536
For s-shaped fin-channel PCHEsIntended to be used to calculate overall heat-transfer coefficient; staggered, s-shaped fin minichannels (see Table 1 [31] for specific geometry); cold upward flow, hot downward flowHot: 2700 < Re < 7000,
0.9593 < Pr < 1.1184
Cold: 1000 < Re < 2700,
1.6816 < Pr < 1.9917
Table 4. The tested inputs for the conductance ratio method.
InputZigzag Channel PCHES-Shaped Fin PCHE
Reference case
  • design case: from the supplier
  • experimental case: case 33
  • experimental case: case 17
h A r a t i o
  • 1/9 acc. to [4]
  • 0.875 acc. to [32]
  • 1.1 acc. to supplier data
  • 8 acc. to [24]
  • 1/9
  • 1
  • 8
Only for Meshram V and reference design case; additionally: {0.5, 2, 4, 6}
HT correlationDittus–Boelter I, Gnielinski,
Meshram V, Meshram VI, Kim, Saeed-Kim, Cheng
Dittus–Boelter I, Ngo, Zhao
Disclaimer/Publisher’s Note: The statements, opinions and data contained in all publications are solely those of the individual author(s) and contributor(s) and not of MDPI and/or the editor(s). MDPI and/or the editor(s) disclaim responsibility for any injury to people or property resulting from any ideas, methods, instructions or products referred to in the content.