Abstract
This paper analyzes the influence of the number of ignition coils and spark discharge energy on the Coefficient of Variation of Indicated Mean Effective Pressure (COVIMEP) of an SI internal combustion piston engine. A modern electronically controlled induction ignition system is used during the test. Two fuels are used in the experiment. The reference fuel is gasoline and the tested fuel is ammonia. For the traditional fuel, using an additional ignition coil does not improve COVIMEP. This parameter for gasoline has an almost constant value for different ignition system charging times. The situation is different for ammonia. This fuel requires high ignition energy. The use of one ignition coil demands a long charging time. For short charging times, unrepeatability of the engine cycles is unacceptable. The use of an additional ignition coil allowed to the charging coil timing to be shortened and the unrepeatable engine cycles to be reduced. This paper determined the maximum charging time of the used ignition coil, above which the spark parameters are worse. In addition, the influence of charging time and number of ignition coils on total spark energy, spark discharge duration, maximum spark power, and voltage during spark discharge for ammonia is presented. The data presented in this paper are developed based on measurements of current and voltage in the secondary winding of the ignition coil. A self-developed electronic device enabling the change in spark energy is used to control the ignition system. This paper also presents the construction of modern ignition systems, describes the functions of selected components, and briefly discusses their diagnostics.
1. Introduction
The ignition system in cars is responsible for effectively igniting the fuel–air mixture supplied to the cylinder at a specific time instant [1]. The instant at which the spark discharge is to occur is called the ignition timing angle (ITA) and is expressed in relative units: the degrees of rotation of the crankshaft are related to the TDC (top dead center) of the piston position in the compression stroke [2]. The ignition timing angle varies and depends on the current engine operating conditions, including, among others, engine speed, load, accelerator pedal position, and type of fuel supplied [1,2,3]. The ignition system has changed over the last few decades, and currently consists of several basic elements responsible for the following tasks:
- Energy storage, a car accumulator, is an element electrically connected to the ignition system, from which the energy needed to spark discharge is supplied. This energy can be stored in a capacitor in the form of an electric charge or in the core of a coil in the form of a magnetic field. This energy in the ignition system is located immediately before the spark is triggered [3].
- The high voltage is generated in ignition coils made of two windings wound on the same core (magnetically connected). The voltage increase is due to the much greater number of turns on the high-voltage side (secondary side) about the primary winding than on the low-voltage side [3].
- Spark plug ignition wires are responsible for delivering electric charge to the spark plug. In modern ignition systems, the spark plug ignition wires are integrated with the ignition coils, which were moved above to the spark plugs [3].
- The spark plug, which is directly responsible for igniting the mixture as a result of a spark discharge (an electric spark jumps between two spark plug electrodes), must be resistant to many damaging conditions (high temperatures reaching over eight hundreds degrees Celsius, high pressures of several bars, or deposits and impurities resulting from inefficient combustion) [3].
- The electronic system controls the correct operation of the ignition system, regulating and determining, among others, spark energy, ignition timing, diagnostics of ignition system components, etc. [3].
Currently used modern ignition systems are made in a distributor-less form (the mechanical voltage distributor, which was previously used in classic ignition systems and had to be replaced every few dozen thousand kilometers, has been eliminated). Modern ignition systems contain electronic modules responsible for controlling, diagnosing, and sending information to the car’s central computer in the event of a failure (e.g., reporting and reacting in the event of misfiring or damage to ignition modules). In addition, individual ignition modules are currently used directly above the spark plugs, which allows the high-voltage cables to be eliminated [3,4].
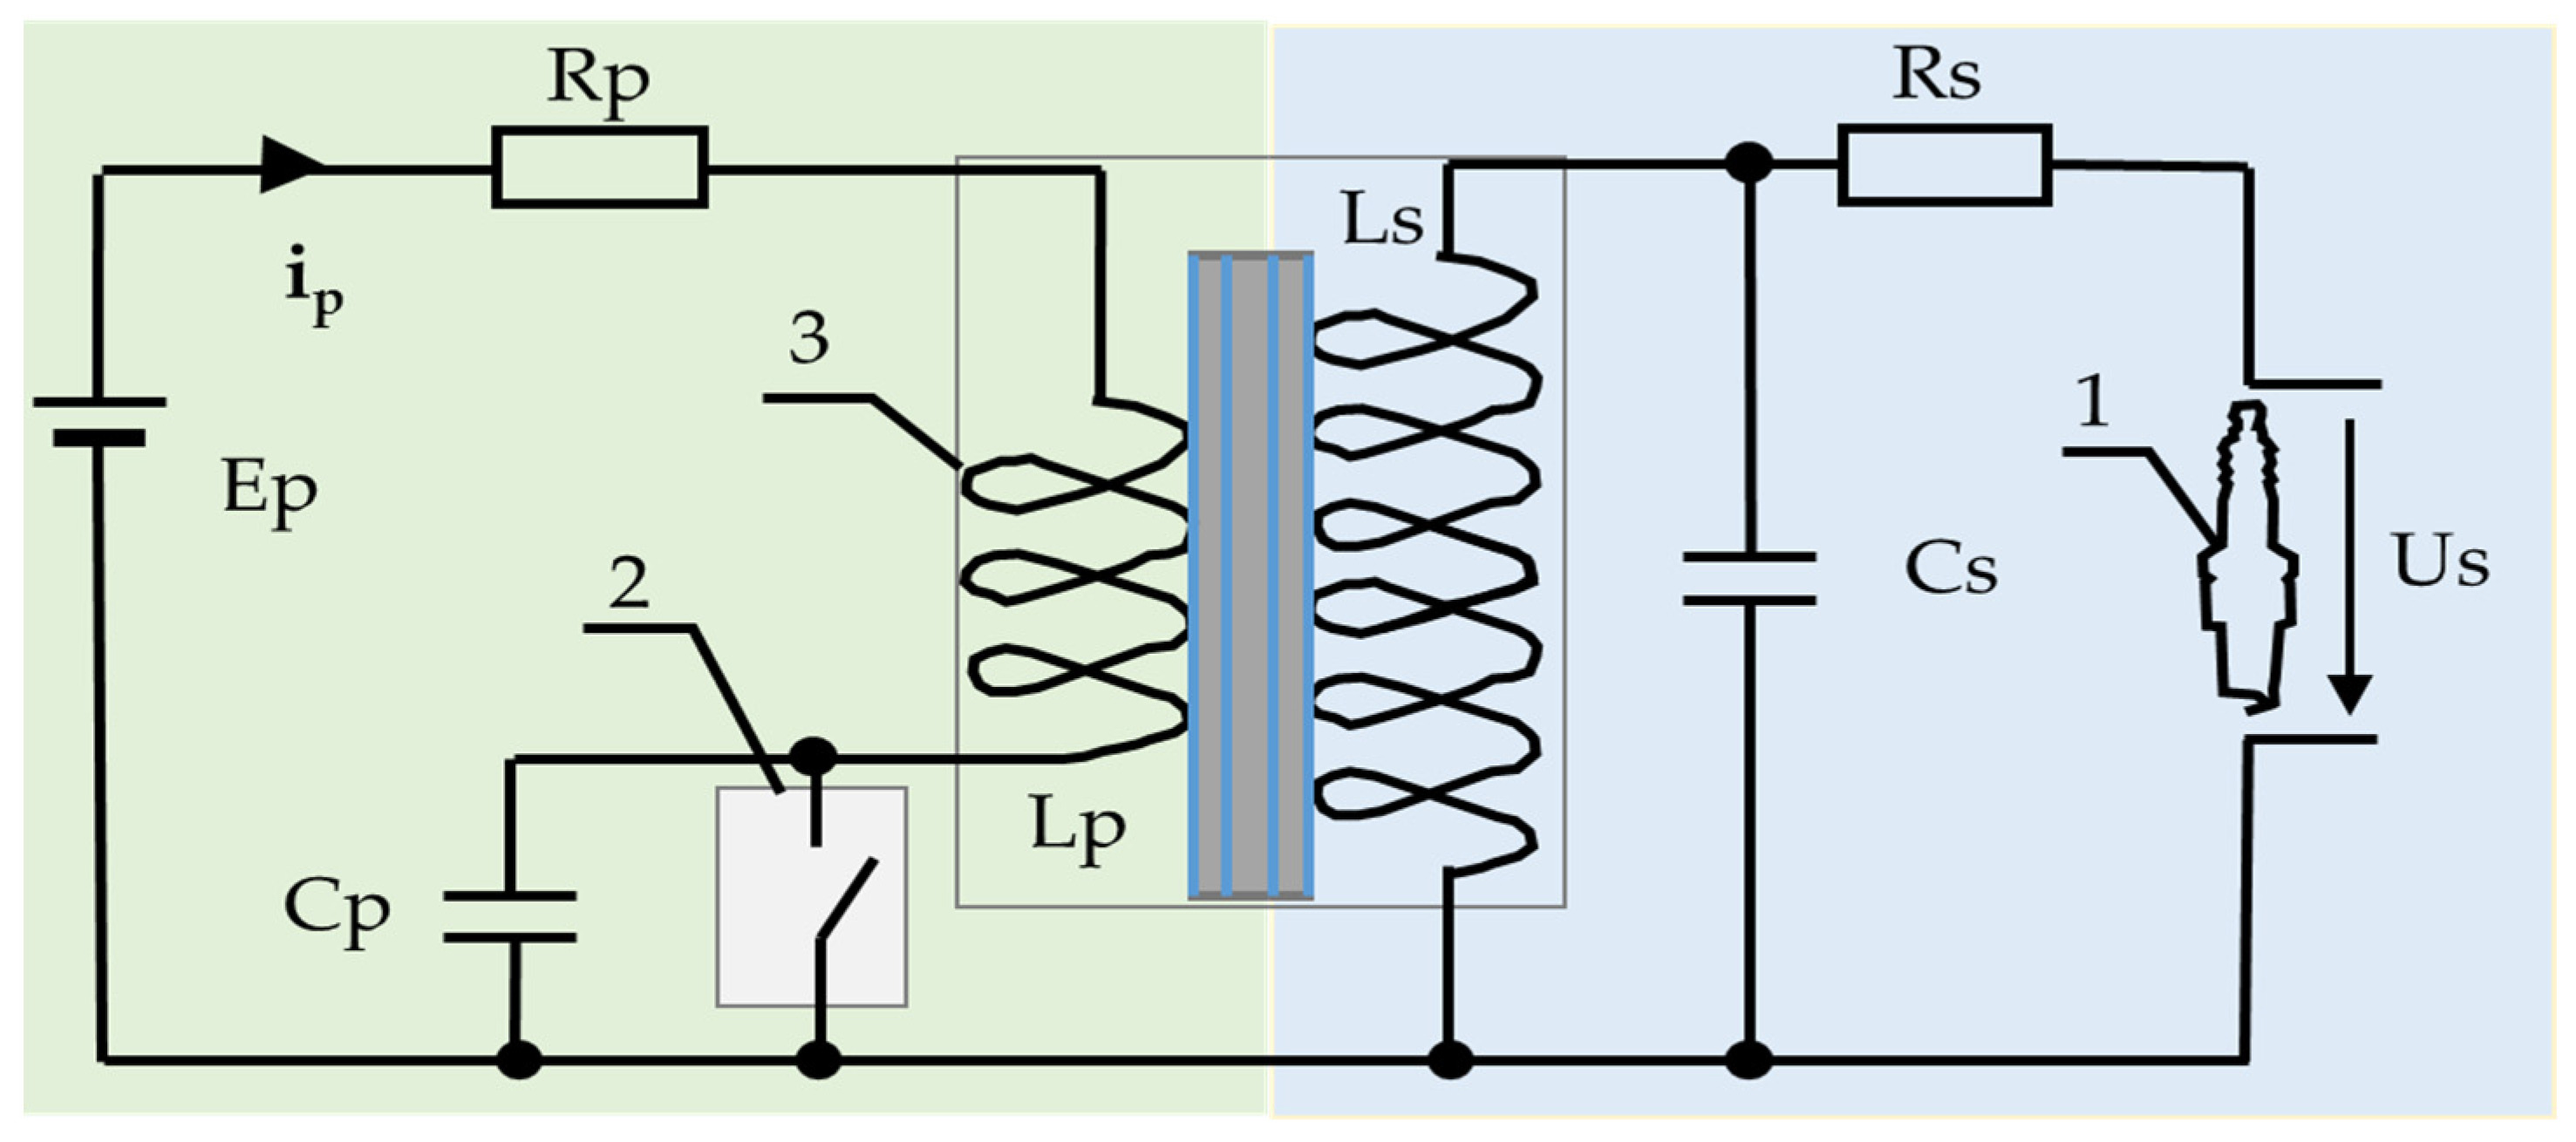
The diagram of the described general ignition system is shown in Figure 1.
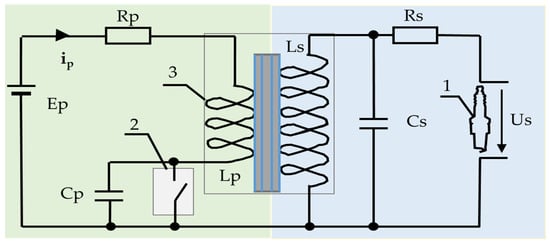
Figure 1.
General ignition system diagram [5,6].
The presented ignition system in Figure 1 consists of two parts. The low-voltage section is marked with a green background and the high-voltage section is marked with a blue background. In the presented diagram, the source of electromotive force is marked as Ep. The equivalent resistance of the primary circuit is marked as Rp, and the inductance of the ignition coil on the primary side is marked as Lp. Cp is an auxiliary capacitor that limits sparking on element no. 2. For the high-voltage circuit Rs is the equivalent resistance of the secondary circuit, Ls the inductance on the secondary side, and Cs the equivalent capacitance of the secondary circuit. The element in which the spark discharge occurs is marked as 1. Element number 2, in the drawing symbolically drawn as a switch, is the part responsible for controlling the moment of spark generation; it can be a circuit breaker or an electronic element (transistor or thyristor). The spark is created when the current ip flowing in the primary winding disappears. The primary and secondary windings wound on a common core and enclosed in one housing comprise the ignition coil marked number 3.
For the active (conducting) element 2 in the primary circuit, the current ip flowing through the coil can be described by the following Equation (1) [5,6,7].
When the primary circuit is interrupted, deactivation of element 2 causes the current flow to suddenly cease, which causes a change in the magnetic flux in the primary winding of the ignition coil, and as a consequence, energy Esmax is released in the secondary winding following Equation (2).
By transforming Equation (2), we can determine the maximum voltage that will be generated in the secondary winding. The equation is marked with the number (3).
The energy stored in the primary winding can be calculated from Equation (4)
Assuming that all the energy stored in the primary circuit will be transferred to the secondary circuit, the maximum voltage Us on the secondary side of the circuit can be determined using Equation (5).
The equivalent capacitance of the secondary circuit is largely dependent on the conditions in the cylinder, the condition of the spark plug, and many other parameters. The equivalent capacitance is difficult to determine in real conditions, which is why in the experiment it was decided to directly measure the voltage and current on the high-voltage side of the ignition system. The energy released in the form of a spark can therefore be calculated according to Equation (6).
The adopted methodology is often used by scientists [7,8,9,10,11]. The development of a theoretical model based on the completed research is included in the research plans.
2. Spark Ignition System Diagnostics
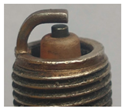
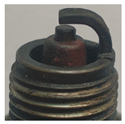
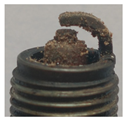
Correct operation of the ignition system is crucial for reliable and efficient engine running. An incorrectly functioning ignition system degrades the combustion engine, weakens its performance, increases fuel consumption, and in extreme cases may cause the engine to shut down [1,2,3,4]. Diagnostics of the ignition system first consists of organoleptic inspection of individual ignition system elements: checking the gap and appearance of the spark plugs allows one to detect what may be the cause of the ignition system failure (Table 1), and then the condition of the connections and ignition elements, coils, modules, and wires is assessed to eliminate damage resulting from external factors (e.g., animals chewing through wiring harnesses). Each engine ignition module should be subjected to diagnostics; in this way the replacement of efficient ignition coils is eliminated, and the damaged, worn ones are found [3,4].

Table 1.
Incorrect appearance of exploited spark plugs and their diagnosis [12,13].
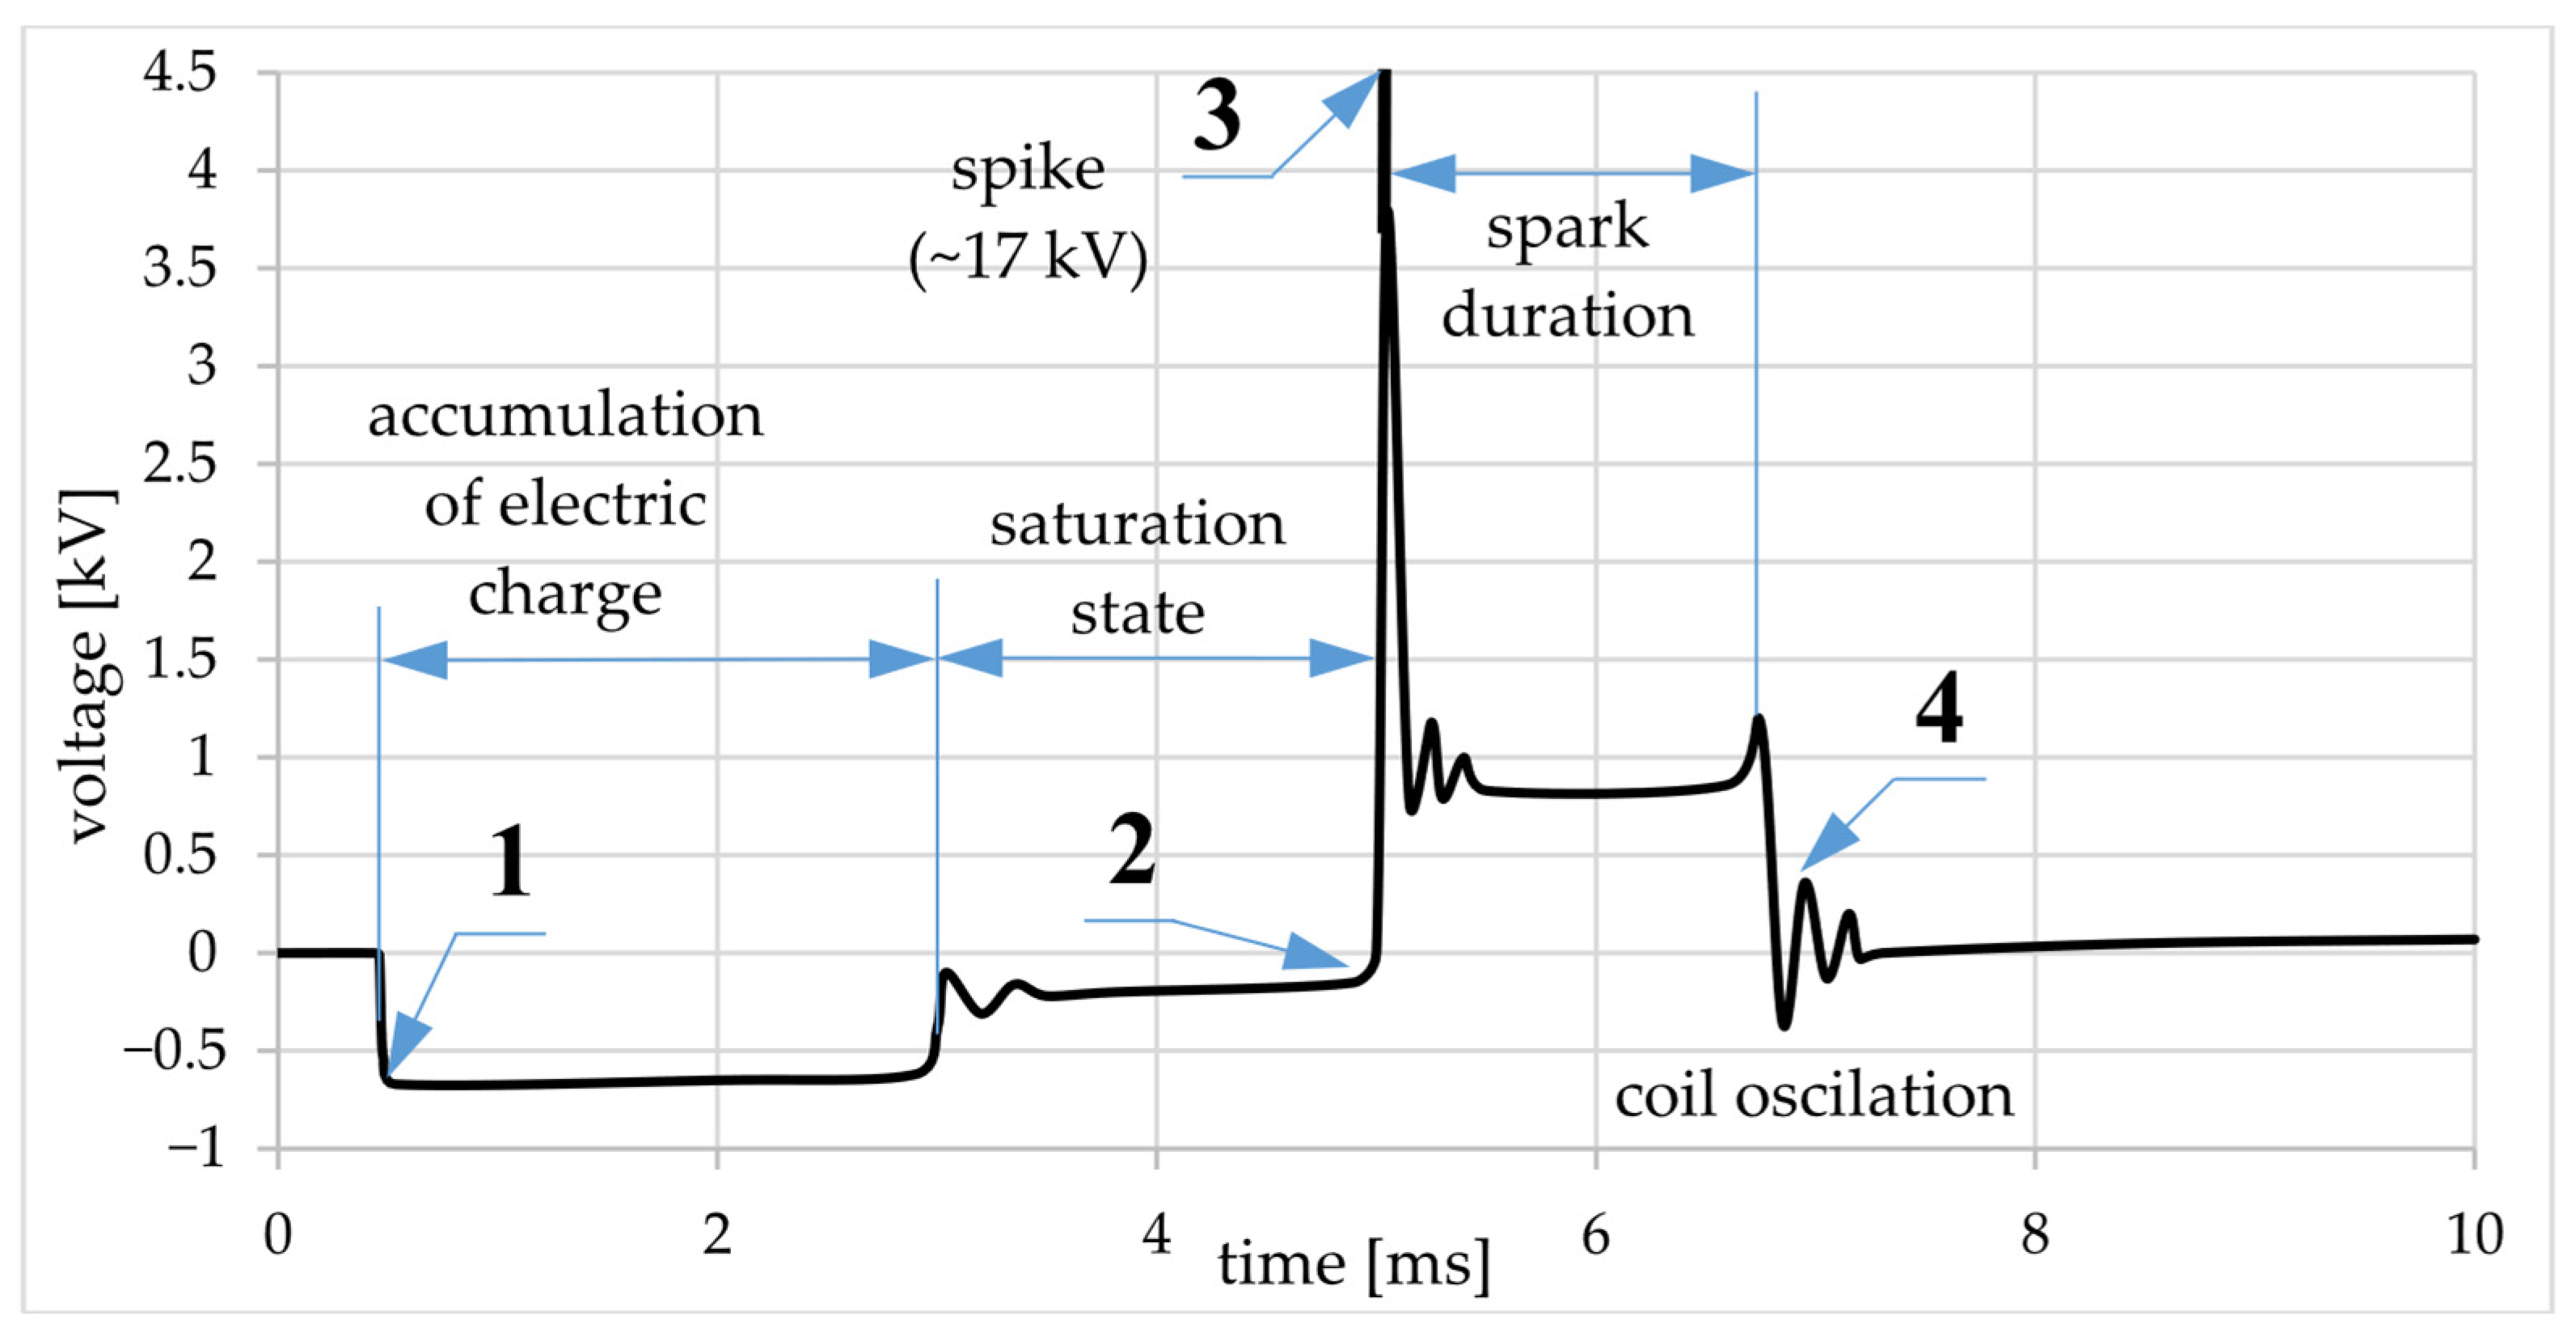
In advanced diagnostics of ignition systems, the ignition system parameters are checked using specialist measuring devices, the ignition coil supply voltage and connections to the vehicle mass are measured, the resistance of the primary and secondary coil windings are checked, and the ignition energy and discharge duration are measured. An oscilloscope equipped with measuring probes is used to record the voltage waveform in the ignition system. Particular caution should be exercised when measuring the voltage on the secondary winding, where the voltage can reach several kilovolts. An example of the voltage waveform in the secondary circuit of the ignition system is shown in Figure 2.
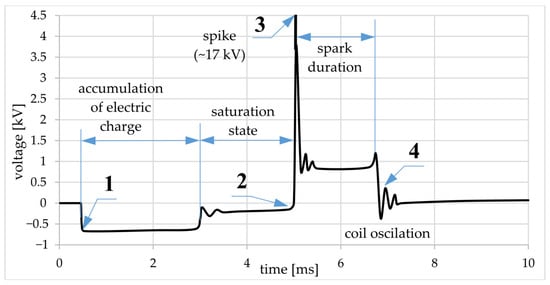
Figure 2.
Example of a reference voltage waveform in the ignition system with characteristic points and zones marked, 1-start of ignition system charging, 2-ignition coil current decay, 3-voltage increase and spark discharge start, 4-spark end and dissipation of residual energy stored in the ignition coil.
It consists of several characteristic points and areas [14]. The activation and flow of current through the ignition coil on the primary side begins at point 1. Energy is collected in the magnetic field of the coil core (or the charge is collected in the capacitor in CDI ignition systems [9]). This occurs after the transistor responsible for charging the ignition system is activated. A pulse of negative polarity is visible in the secondary circuit compared to the pulse causing the spark jump. The charging coil continues until saturation is achieved (this time is often called dwell time). The maximum current flowing through the coil is reached. At that time instant, the variable electromagnetic field disappears and no voltage is generated in the secondary circuit. At the moment of deactivation of the control transistor, there is a sudden loss of current flowing through the primary winding of the ignition coil, as a result of which a high voltage is induced in the secondary circuit (2), reaching a value of several dozen kilovolts. Then the spark jumps between the spark plug electrodes (3) and the spark discharge begins, which lasts until the energy in the ignition system is exhausted [10]. The spark is generated at a voltage much lower than initially required by the jump in electric charge. The voltage during the spark discharge ranges from several hundred volts to several thousand volts. In the final phase of the spark, the voltage increases, which is characteristic of properly functioning ignition systems. After the spark disappears, the remaining accumulated charge in the ignition system is discharged, which is shown by oscillations marked with a number (4) [14,15].
Based on the deviation of the voltage waveform with respect to the reference graph, it is possible to determine the potential causes of incorrect operation of the ignition system [12,13,14,15], as shown in Figure 3.
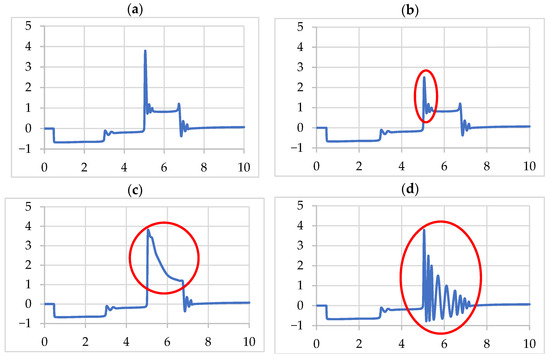
Figure 3.
Voltage waveform (kV) over time (ms) for the ignition system: correct (a), abnormal voltage areas are marked in red, low breakdown voltages (b), high resistance (c), breakdown voltage for low or no spark (d) [12,13,14,15].
The condition of the spark plug and the voltage curve in the secondary winding of the ignition coil are closely related. The correct voltage curve shown in Figure 3a corresponds to a spark plug in good condition, as shown in Table 1 (a). The incorrect voltage curve shown in Figure 3b represents a case in which there is a soot deposit on the surface of the spark plug (Table 1 (b)). Contamination of the spark plug lowers the breakdown voltage of the electric discharge. The voltage curve shown in Figure 3c represents a state of affairs in which the spark plug electrodes are significantly contaminated with insulating material. This causes an increase in voltage during the spark duration phase (Table 1 (c)). The voltage curve shown in Figure 3d corresponds to a case in which there is a gap between the ignition coil and the spark plug. There is no spark discharge, and the energy is dissipated in the ignition coil.
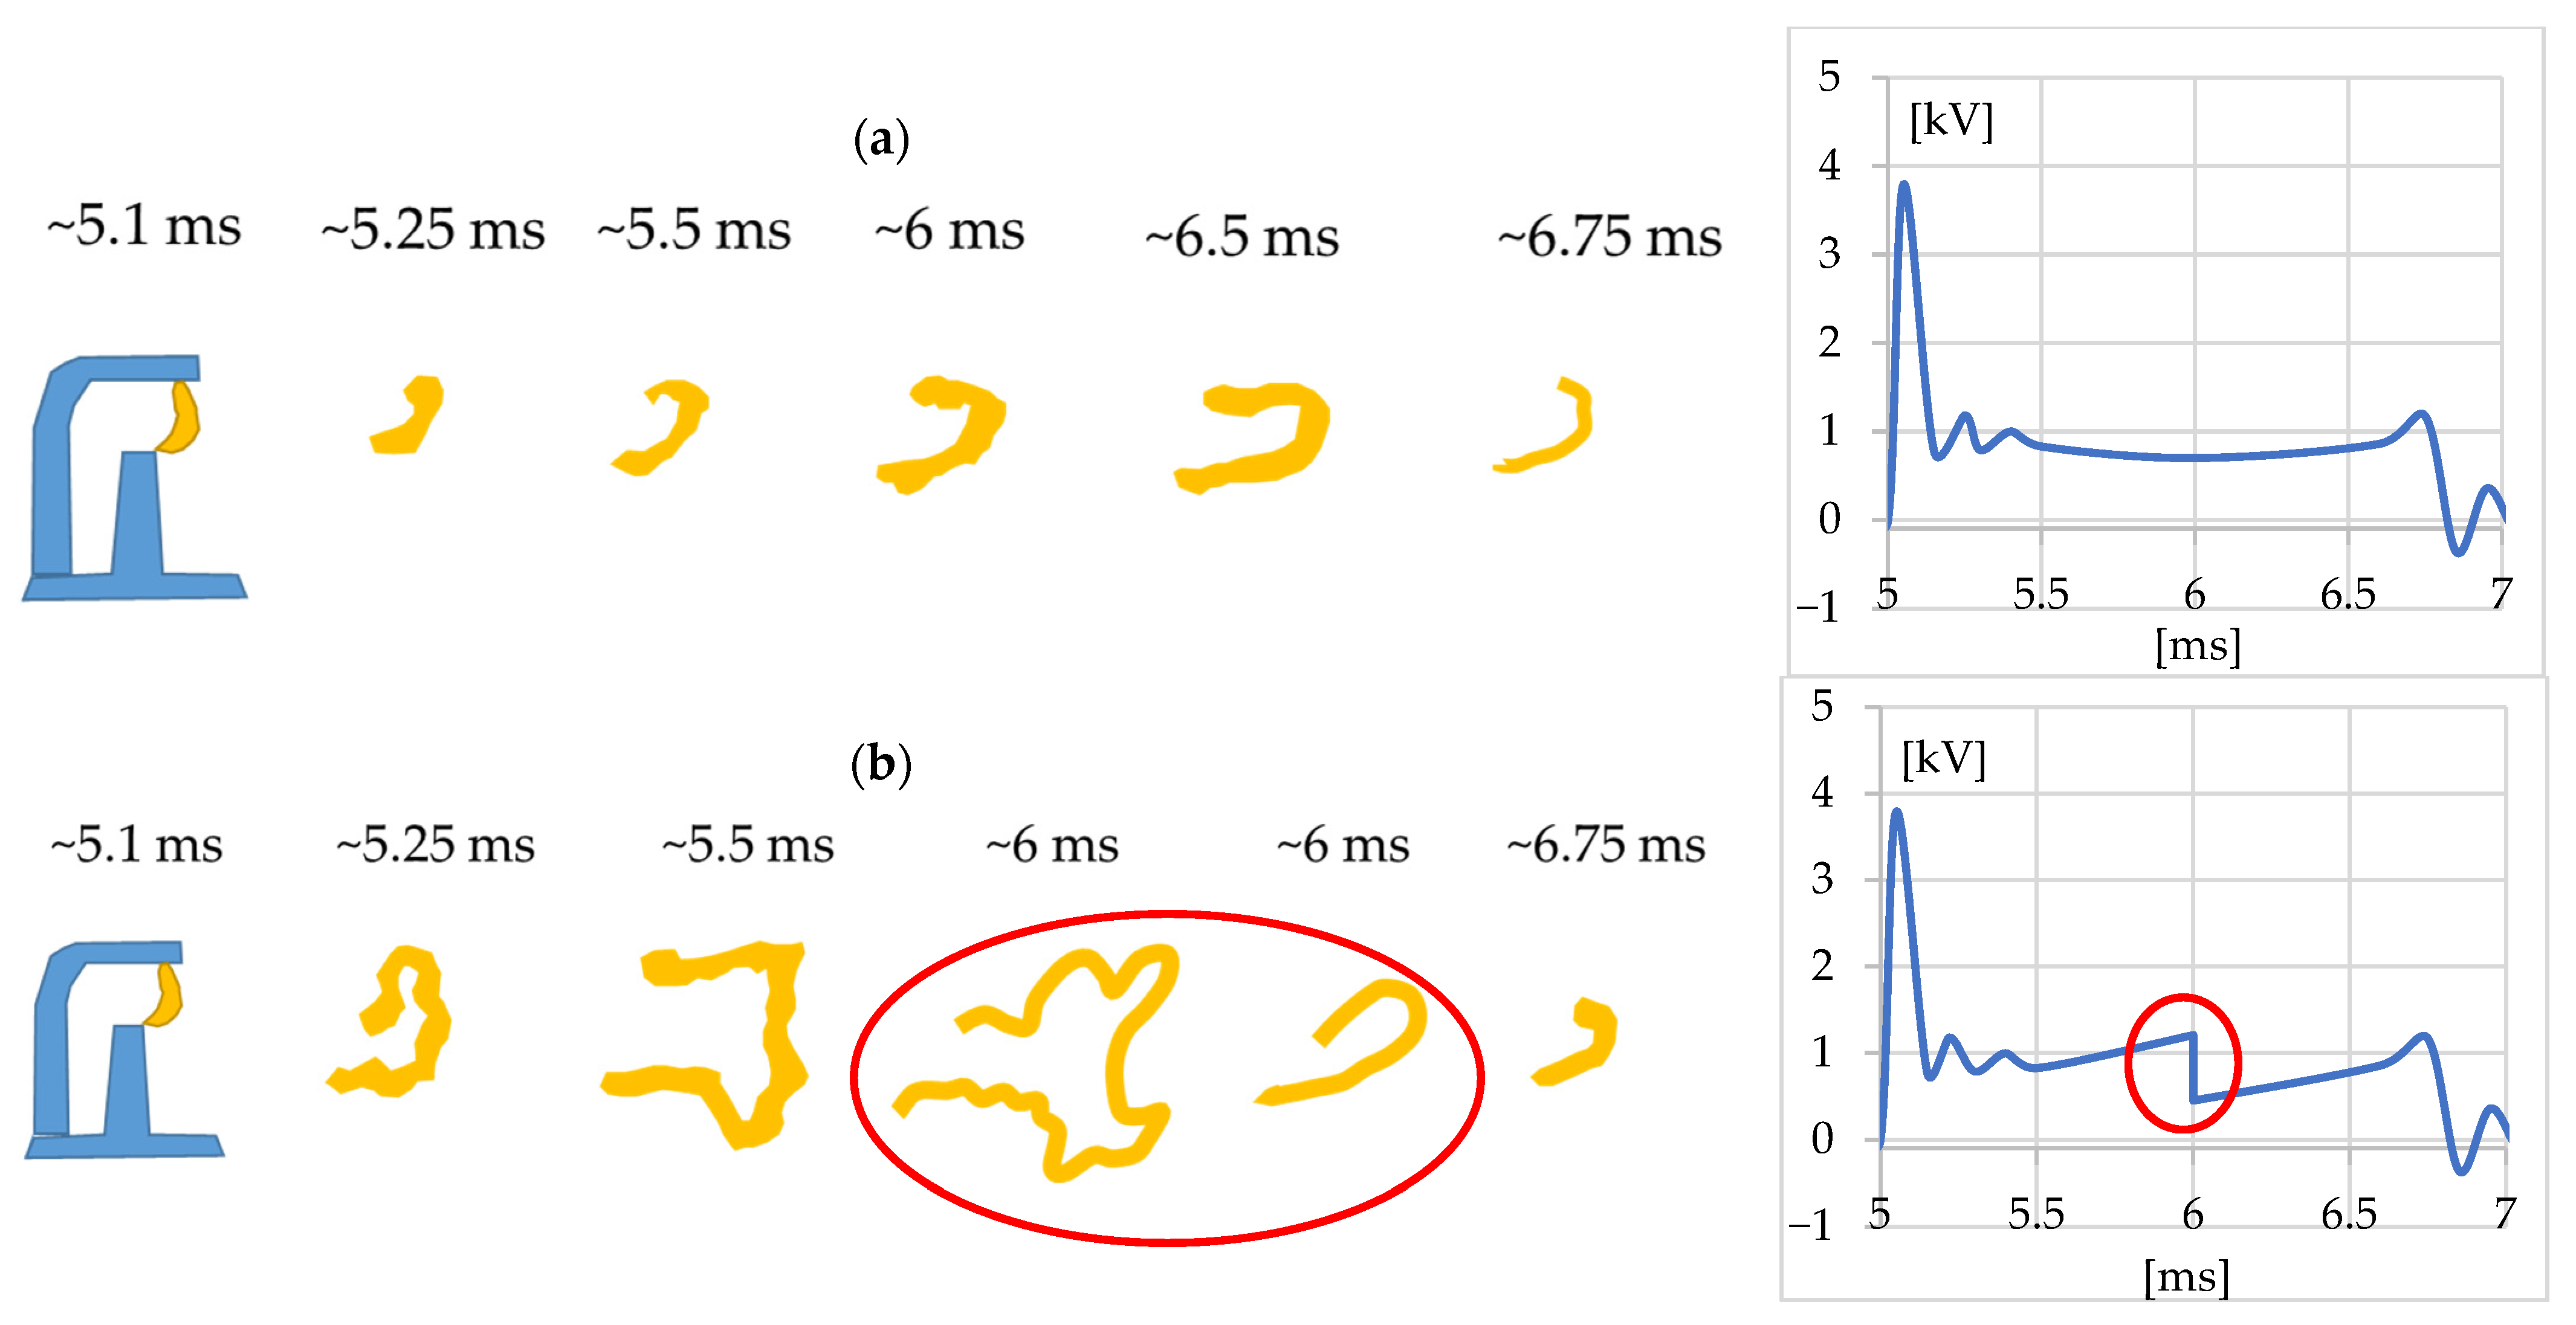
As Myoungsoo, K. et al. [16] showed, the voltage curve during a spark discharge is affected by the fluid flow around the spark plug. The flowing fluid causes the electric arc to move and its length to change. This situation consequently causes voltage jumps, as shown in Figure 4b. The voltage jump and the change in the length of the electric arc, which occurred at the same time, are marked in red. The jumps do not occur at small fluid flows around the spark plug (Figure 4a). Voltage jumps were also recorded during the experiment on a working engine, which resulted from the intensive swirling of the fuel and air mixture in the cylinder [17]. The voltage curve can therefore provide a preliminary indication of the fluid flow around the spark plug during the spark discharge.
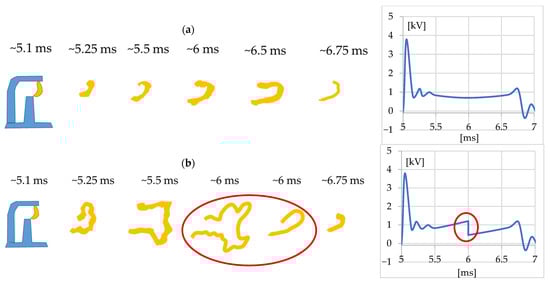
Figure 4.
The change in voltage recorded on the secondary winding of the coil (a), a sudden change in voltage value due to a change in the length of the electric arc, changes marked in red (b) [16].
3. Materials and Methods
The detailed plan of the experiments is presented in Table 2. The experiment consisted of two measurement series for each fuel. Further description is given on the next page.
Table 2.
Experiment parameters.
During the tests, the engine was powered by traditional engine fuel, i.e., gasoline (commercial designation E5), and alternative fuel, ammonia (NH3). While testing, voltage and current waveforms were recorded on the secondary winding of the ignition system for variable charging coil times. The difference between the measurement series is the use of one or two ignition coils. The ITA was set at 15 deg CA before TDC for gasoline (E5). For the alternative fuel, i.e., ammonia, the ITA was set at 35 deg CA before TDC. Based on the recorded in-cylinder pressure versus CAD for this ITA, the highest IMEP was calculated. The SI engine operated at a constant rotational speed of 605 rpm. The load of the combustion engine was an electric asynchronous three-phase motor, which worked as a generator. Fuel was injected into the intake manifold. Additionally, the test stand enables multi-phase injection directly into the cylinder [18].
The research stand shown in Figure 5 was used to record and analyze the presented phenomena. The stand consists of a spark-ignition piston engine equipped with the necessary measuring equipment.
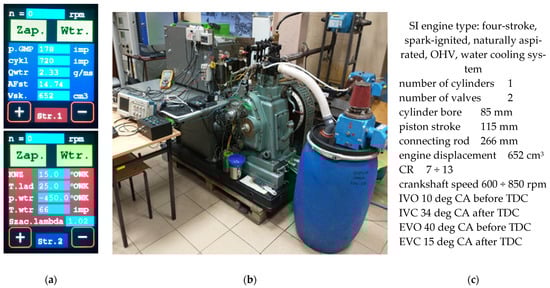
Figure 5.
Views of the controller’s touch screens (a), photo of the test stand with a SI engine (b), technical data of the UIT-85 (c).
The ignition system was controlled by a microcontroller built from an Arduino Uno with AVR ATmega328. The system has 32 kB of flash memory and 2 kB of RAM. The microcontroller is clocked with a 16 MHz signal, which allows for precise recording of input data and an appropriate resolution of ignition settings. The device is operated using a capacitive touchscreen display with a resolution of 230 × 320 pixels and a diagonal of 2.8”, shown in Figure 4. The electronic control system determines the most important ignition parameters. It can set the ITA and the time of electric charge accumulation in the ignition coil (dwell). The charging time is expressed in CA pulses, so the charging time is a relative value calculated from the engine speed and the number of pulses during which the ignition system is to be charged. In addition, the research station can connect one ignition module or two in parallel (two of the same 6N0906104 ignition modules are installed). The system has common control of the ignition coils; i.e., there is an equal charging time of the ignition modules and a simultaneous moment of spark discharge for both of them. The spark plug used on the test stand is RC9YC. The gap between the spark plug electrodes was set to 0.7 mm. The spark plug has a copper center electrode and a M14 × 1.25 mm thread. The resistance of the plug is from 3 to 9 kΩ. The transistor controlling the ignition module is of the PNP type; i.e., it is controlled by the negative pole of the battery. The current position of the piston is read from an encoder, which is built into the camshaft. Before the tests, it was determined what angular position corresponds to the piston position in TDC. A Tektronix P6015A voltage probe (Beaverton, OR, USA) was used to measure high voltage (on the secondary winding of the ignition module). This is an industrial passive high-voltage diode probe. The measurement range for pulse signals is 40 kV. The output voltage from the probe is a thousand times smaller than the measured value (voltage ratio 1000:1). A Pearson transducer with a ratio of 1A:1V was used to measure the current flowing in the ignition wire on the high-voltage side. Voltage and current were recorded using a Rigol DHO924S oscilloscope (Suzhou, China). This is a four-channel oscilloscope with a resolution of 12 bits and a sampling rate of 250 MSa/s. In addition, the oscilloscope recorded pulses from the encoder and the voltage at the control input responsible for charging for the ignition system. Using the capabilities of the oscilloscope, the total spark energy was calculated using mathematical functions such as the current time’s voltage and the spark discharge duration. The values are presented in the graphs in the subsequent section.
During the experiment, measuring devices were used, the names, ranges, and measurement accuracy of which are presented in Table 3.
Table 3.
Accuracy of measuring devices.
These are necessary devices for accurately recording information from the ignition system and capturing the parameters that exist during the experiment.
4. Results
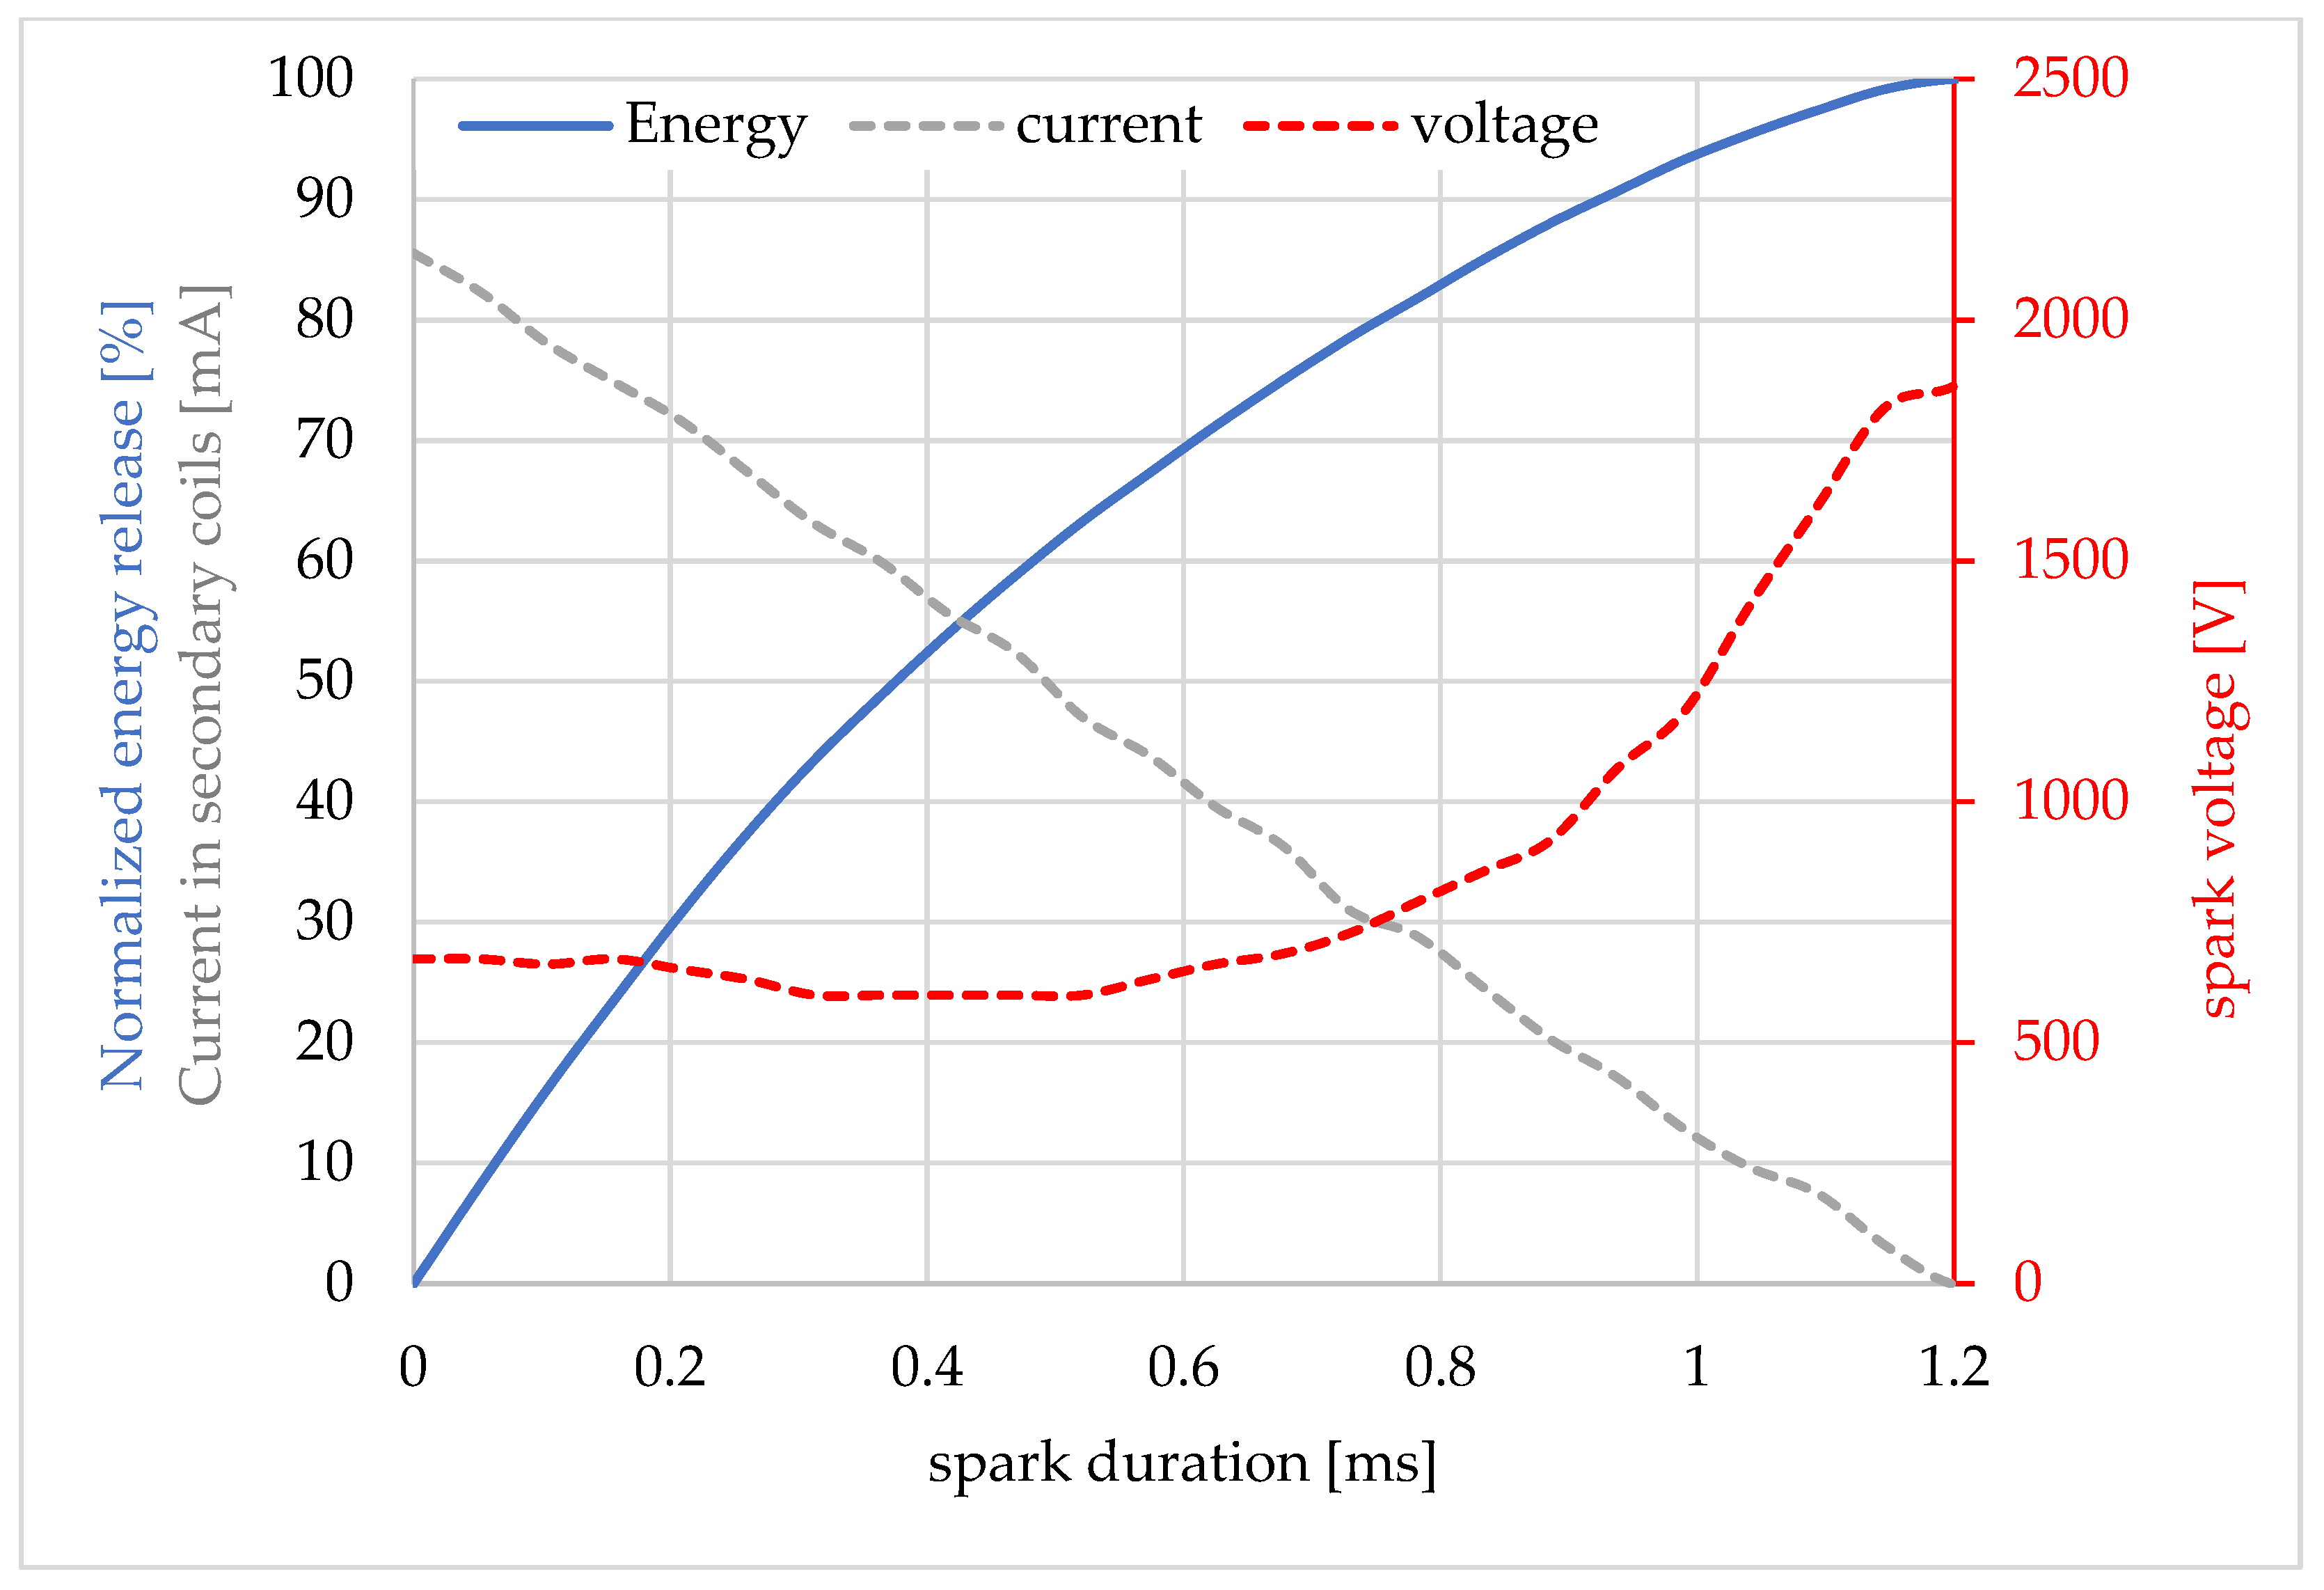
Initially, the voltage and current curves in the secondary winding were recorded. On their basis, the normalized energy release curve during the spark discharge was calculated, which is shown in Figure 6. This is a part of the reference waveform (from Figure 2) located between points 3 and 4. The graphs presented later in this paper concern the operation of an ammonia-fueled engine.

Figure 6.
Example of the current, voltage, and energy released during the spark discharge.
After reaching the breakdown voltage (approximately 16 kV) and starting the current flow between the two spark plug electrodes, spark discharge is ongoing. The voltage value changes during spark generation; its lowest value usually occurs around the middle of the spark duration, and in the final phase the holding voltage always increases. This is the effect of maintaining the spark with decreasing current flow. The current flowing through the spark plug has the highest value in the initial phase and decreases almost linearly to zero. The total energy of the spark needed to ignite the air–fuel mixture ranges from a few to several hundred millijoules [19,20]. The required minimum spark energy depends on the composition of the mixture in the cylinder, the fuel used, and the conditions prevailing in the engine and has a decisive influence on the efficient operation of an SI engine.
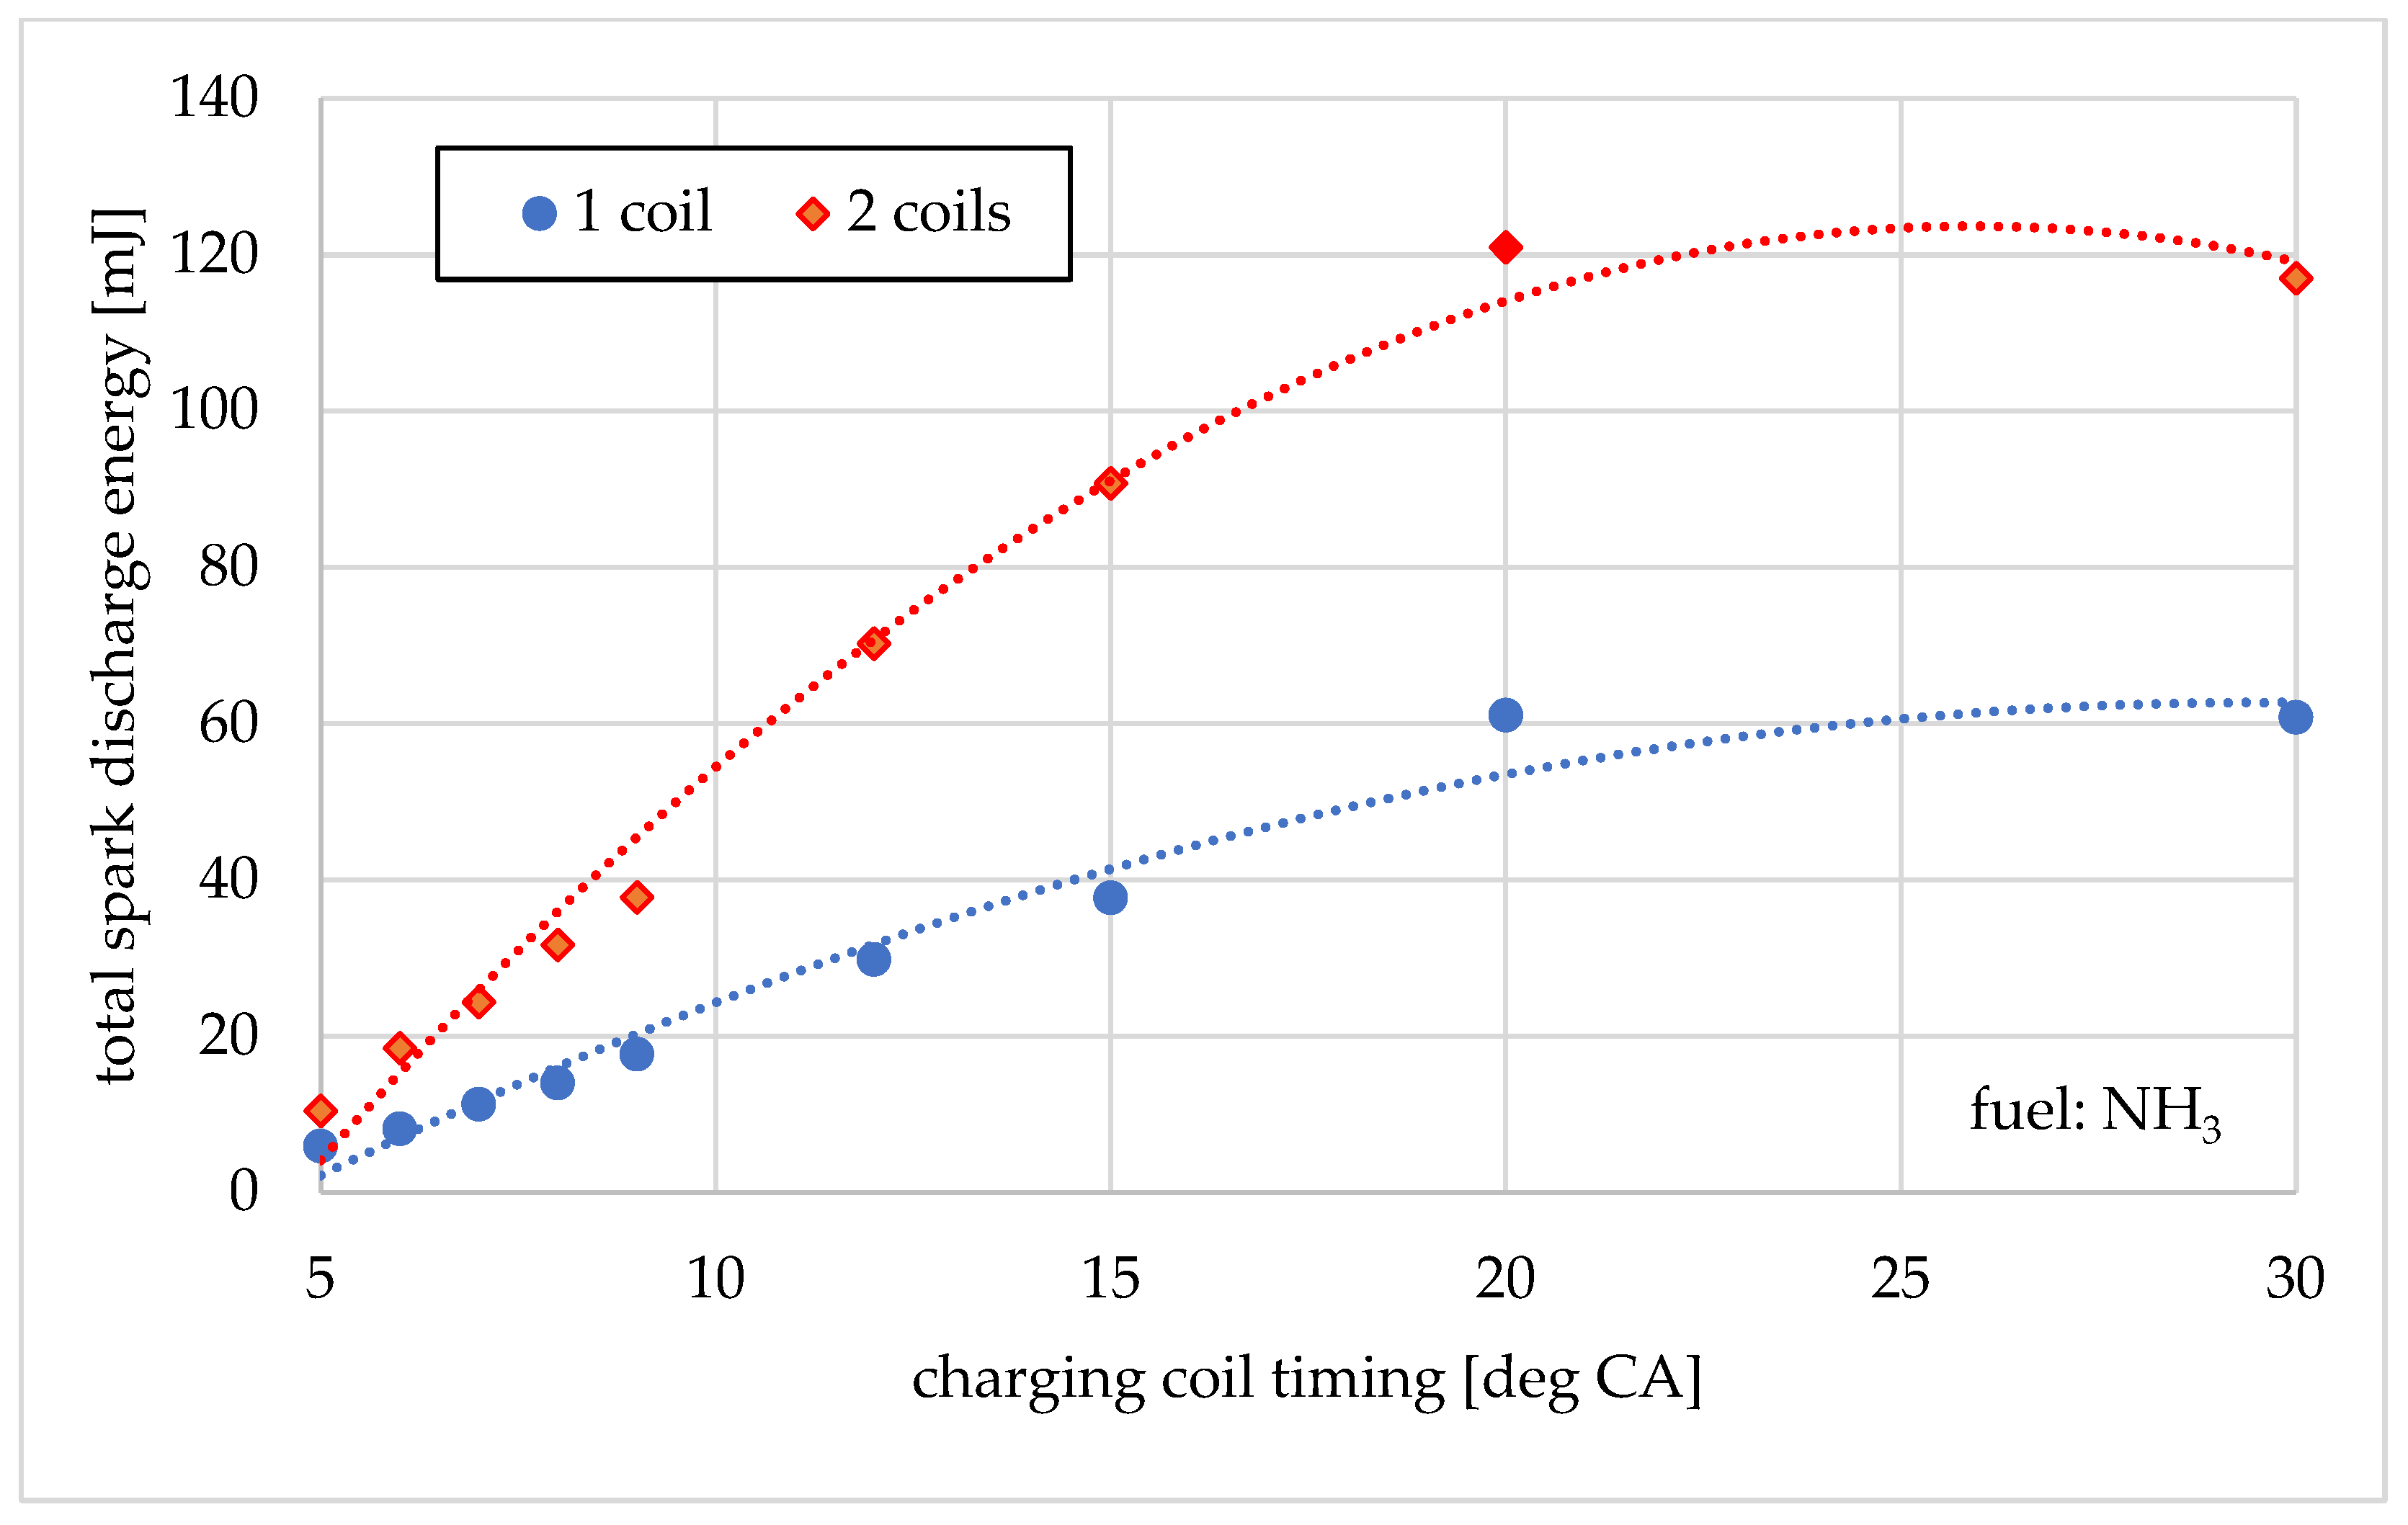
Figure 6 shows the total energy of the spark depending on the ignition module charging time. In this work, the terms module and coil will be used interchangeably to denote the same element. The ignition module charging time was given as a value in crankshaft rotation degrees, and the number of pulses from the encoder was counted (resolution one degree of CA). Converted into time, the ignition system charging value was in the range of 1.38 ÷ 8.26 ms. The value of the total energy increases in the ignition module charging range from 5 to 20 deg CA. For charging times shorter than 1.38 ms, no spark was generated. For ignition module charging times over 20 deg CA, the measured total energy decreased. On this basis, it can be assumed that the working range of the ignition system is up to 20 deg CA (5.51 ms) and the maximum energy stored in a single ignition module is 61.1 mJ. For hard-to-ignite fuels, higher energy may be required, hence an additional ignition coil in which an additional about 60 mJ of electrical energy is stored. After connecting two ignition coils in parallel, the total spark energy as a function of charging time is shown as the red curve in Figure 7.
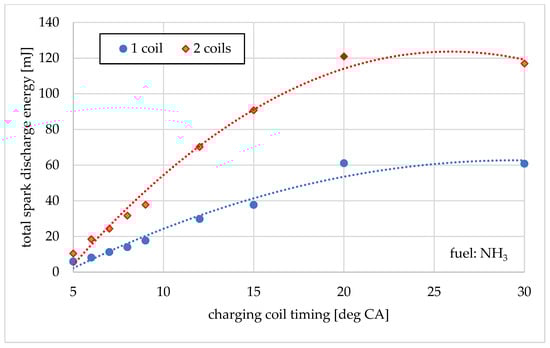
Figure 7.
Total spark discharge energy vs. ignition coil charging timing for one and two ignition coils.
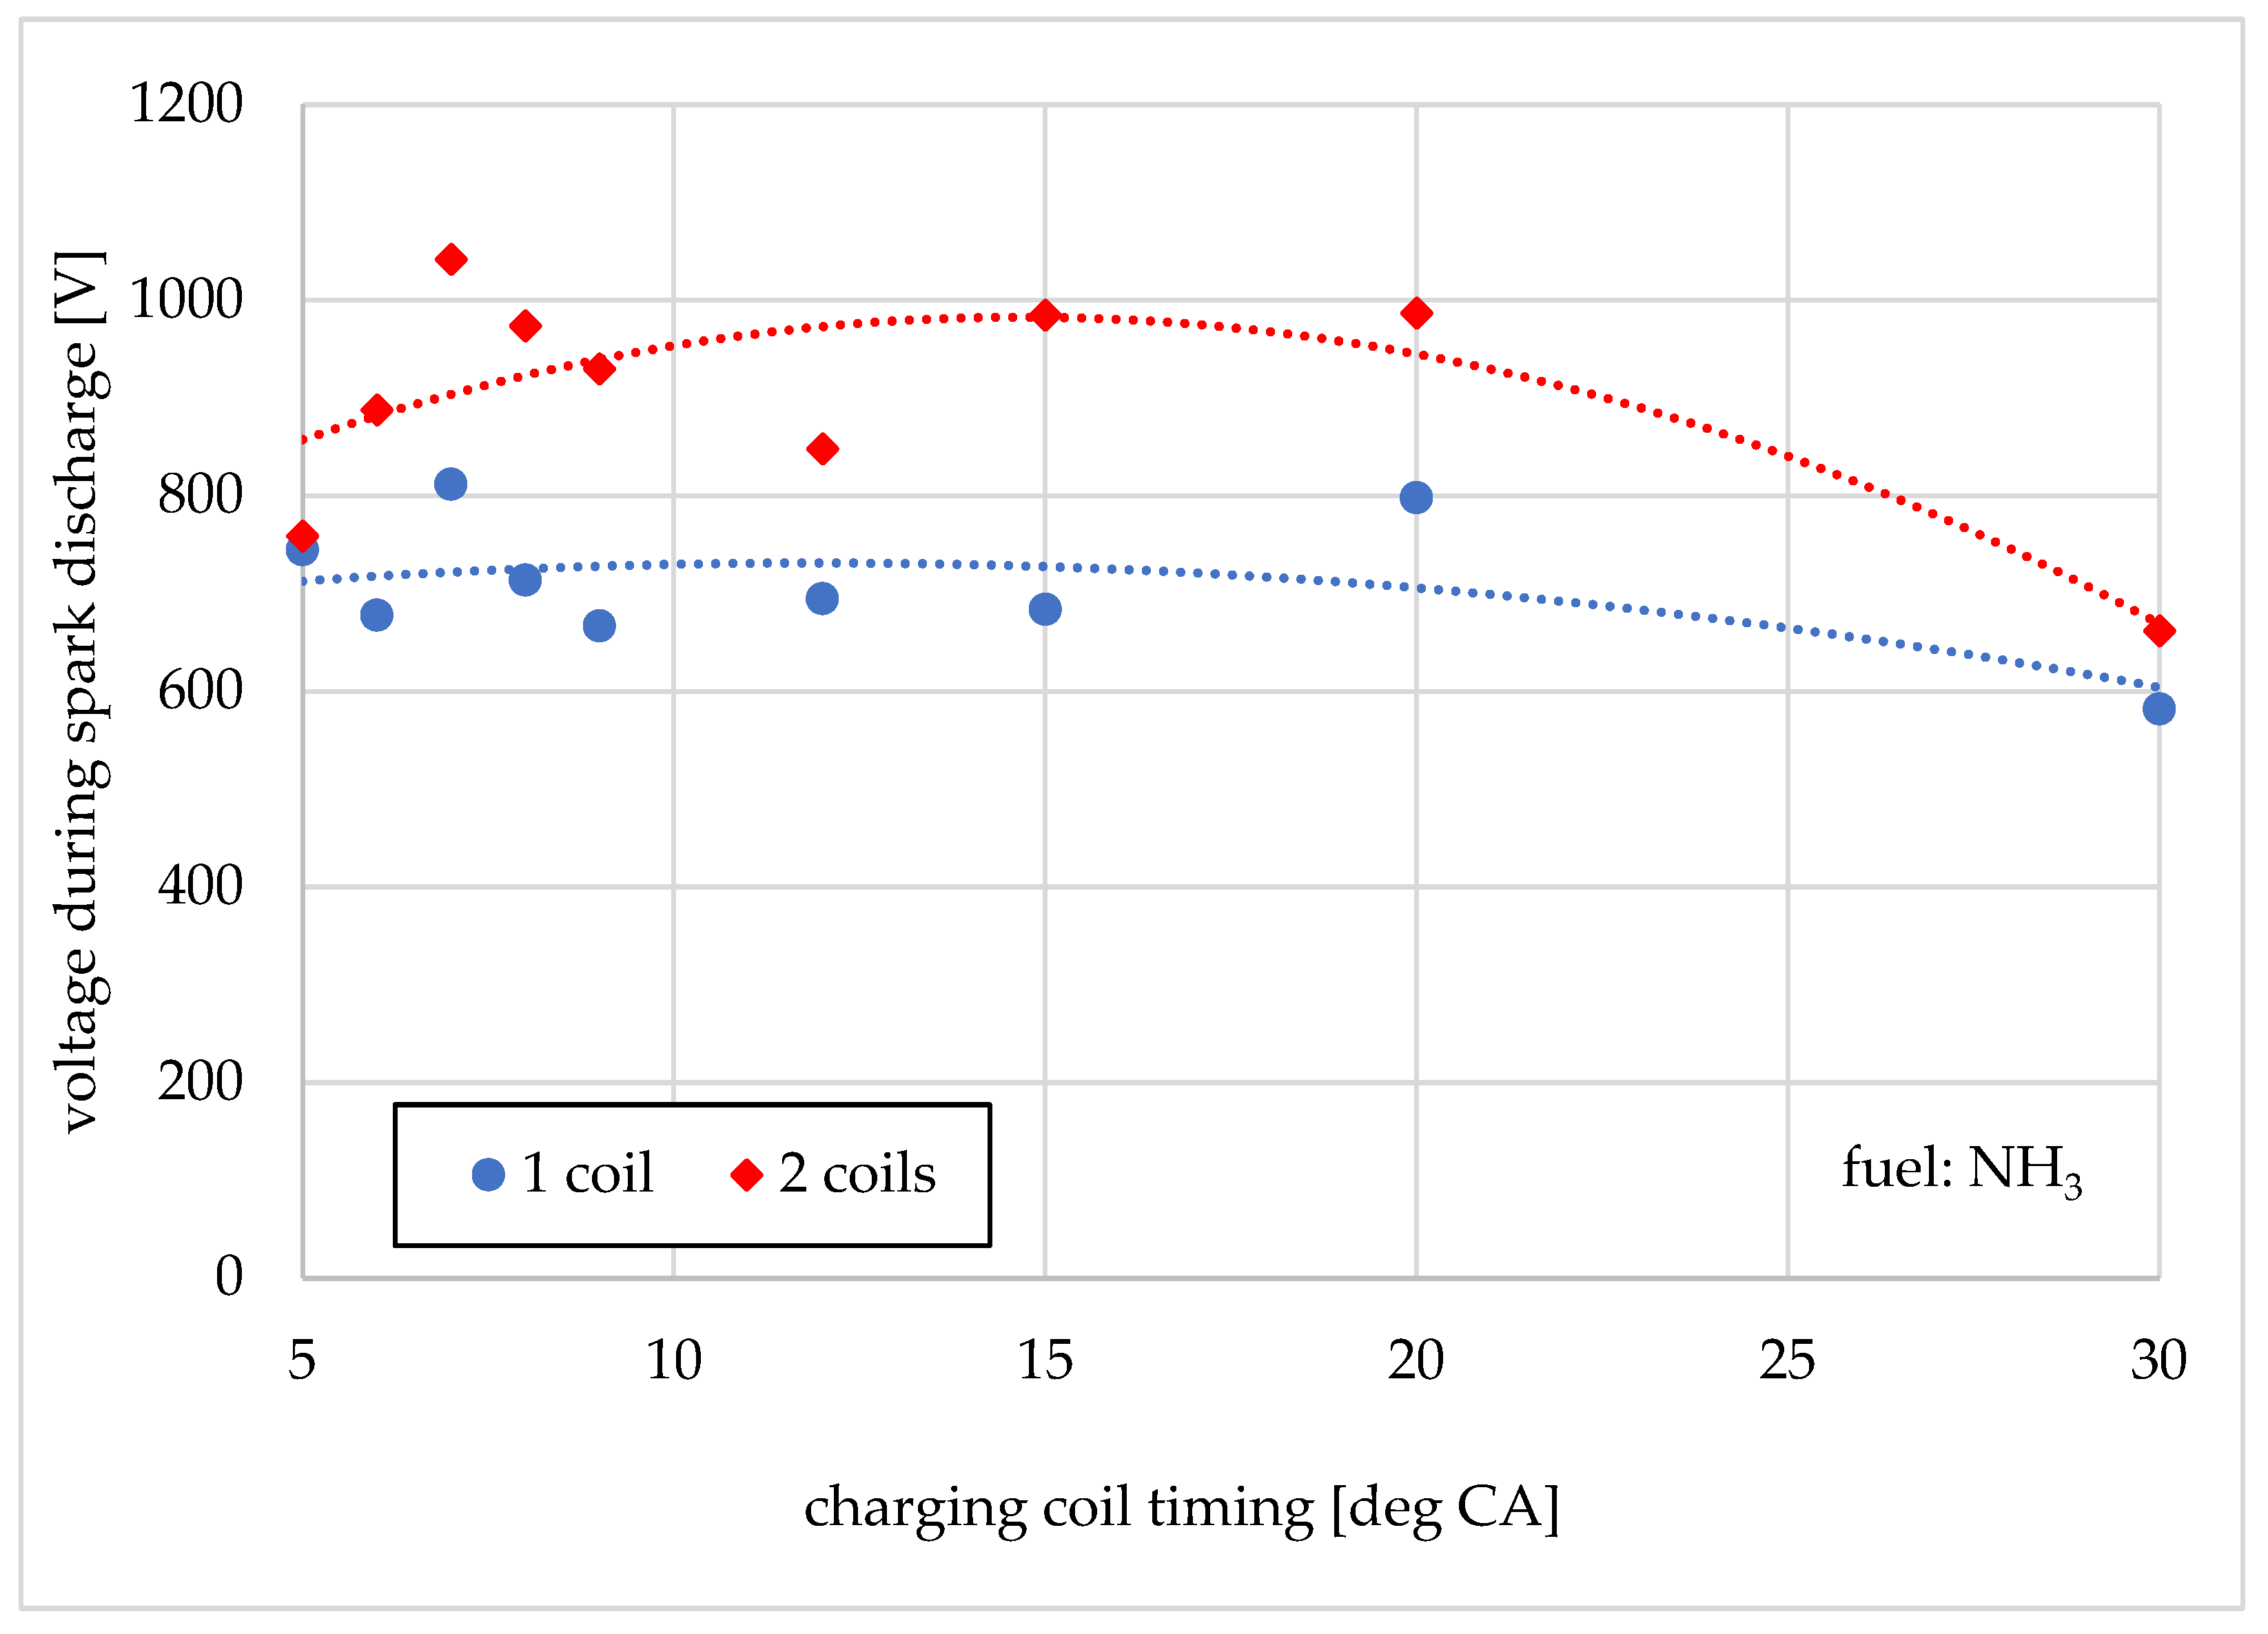
The number of ignition modules used also affects the holding voltage. For two ignition modules, the voltage is higher than when using one ignition module. The voltage value for a single module is in the range of 582 ÷ 812 V, and for two modules this voltage takes values in the range of 662 ÷ 1042 V (shown in Figure 8).

Figure 8.
Voltage during spark discharge vs. charging time and number of coils used.
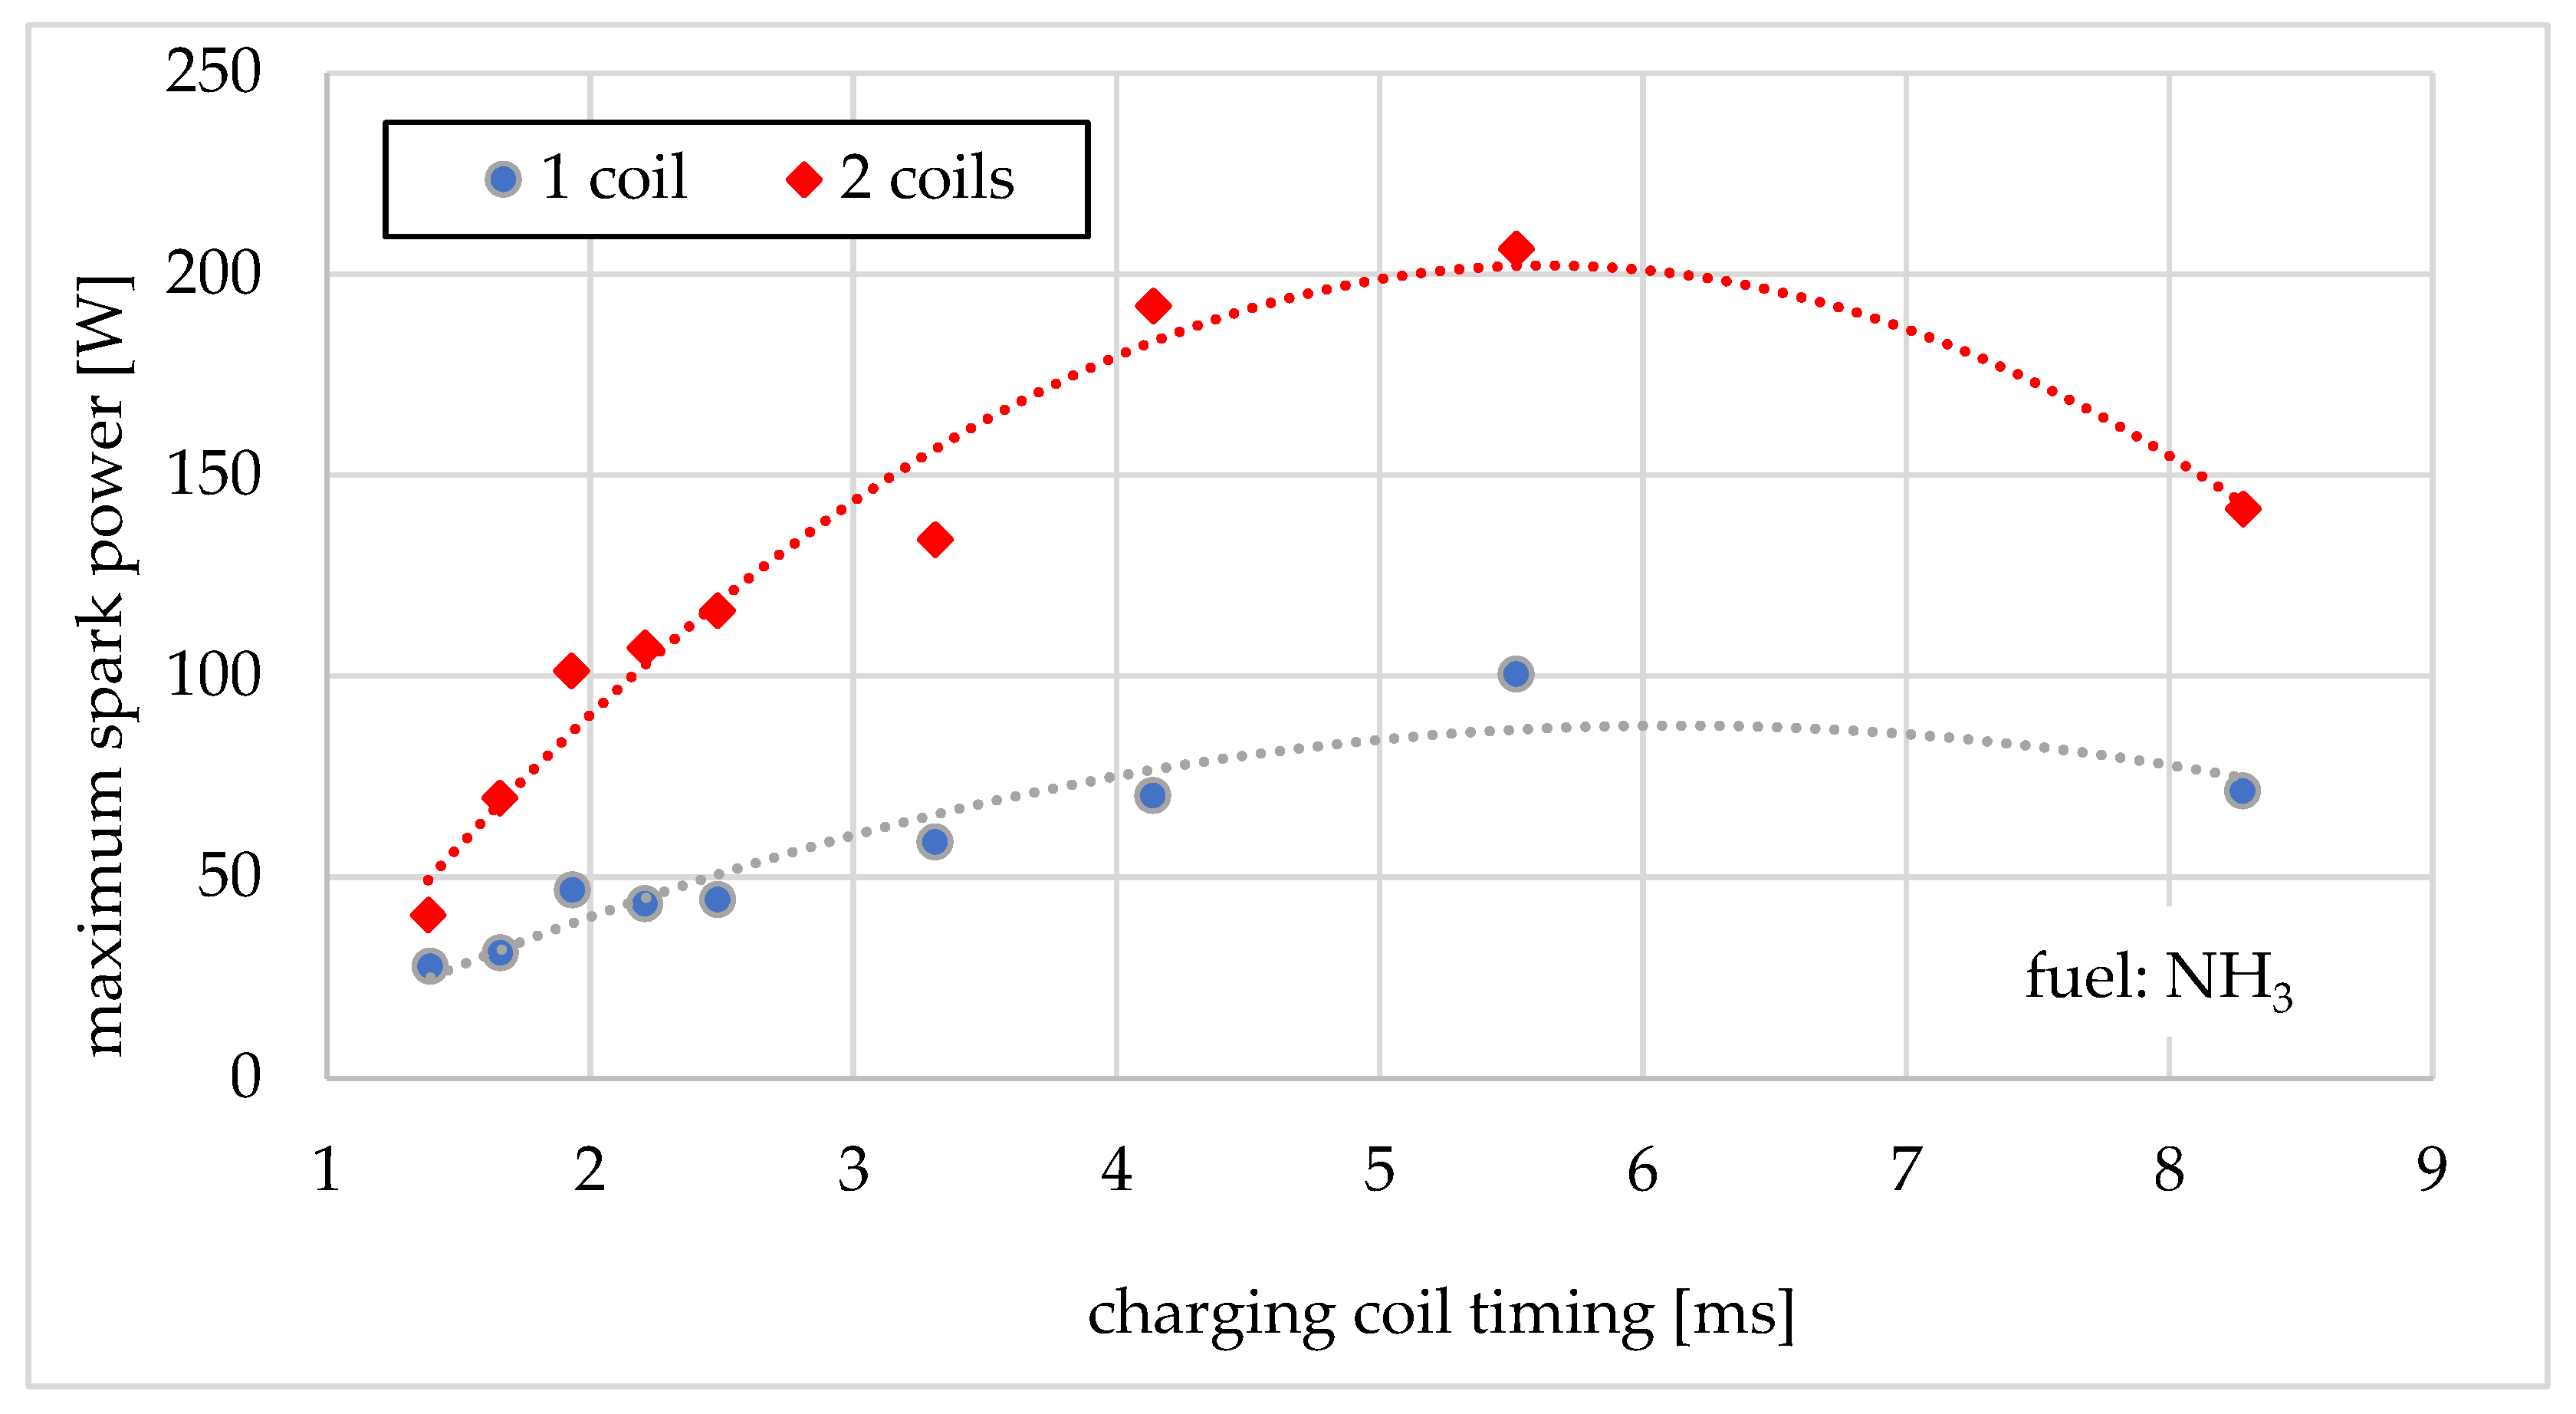
The initial voltage and initial current determine the maximum spark power [20]. The highest maximum spark power is achieved at the first moment of spark discharge. The highest current then flows and the voltage is high. The maximum power is influenced by the ignition coil charging time, as shown in Figure 9. The maximum spark power for one ignition module is 100 W and for two connected ignition coils 206 W (dwell time 5.51 ms, i.e., 20 deg CA).

Figure 9.
Maximum spark power vs. charging coil timing.
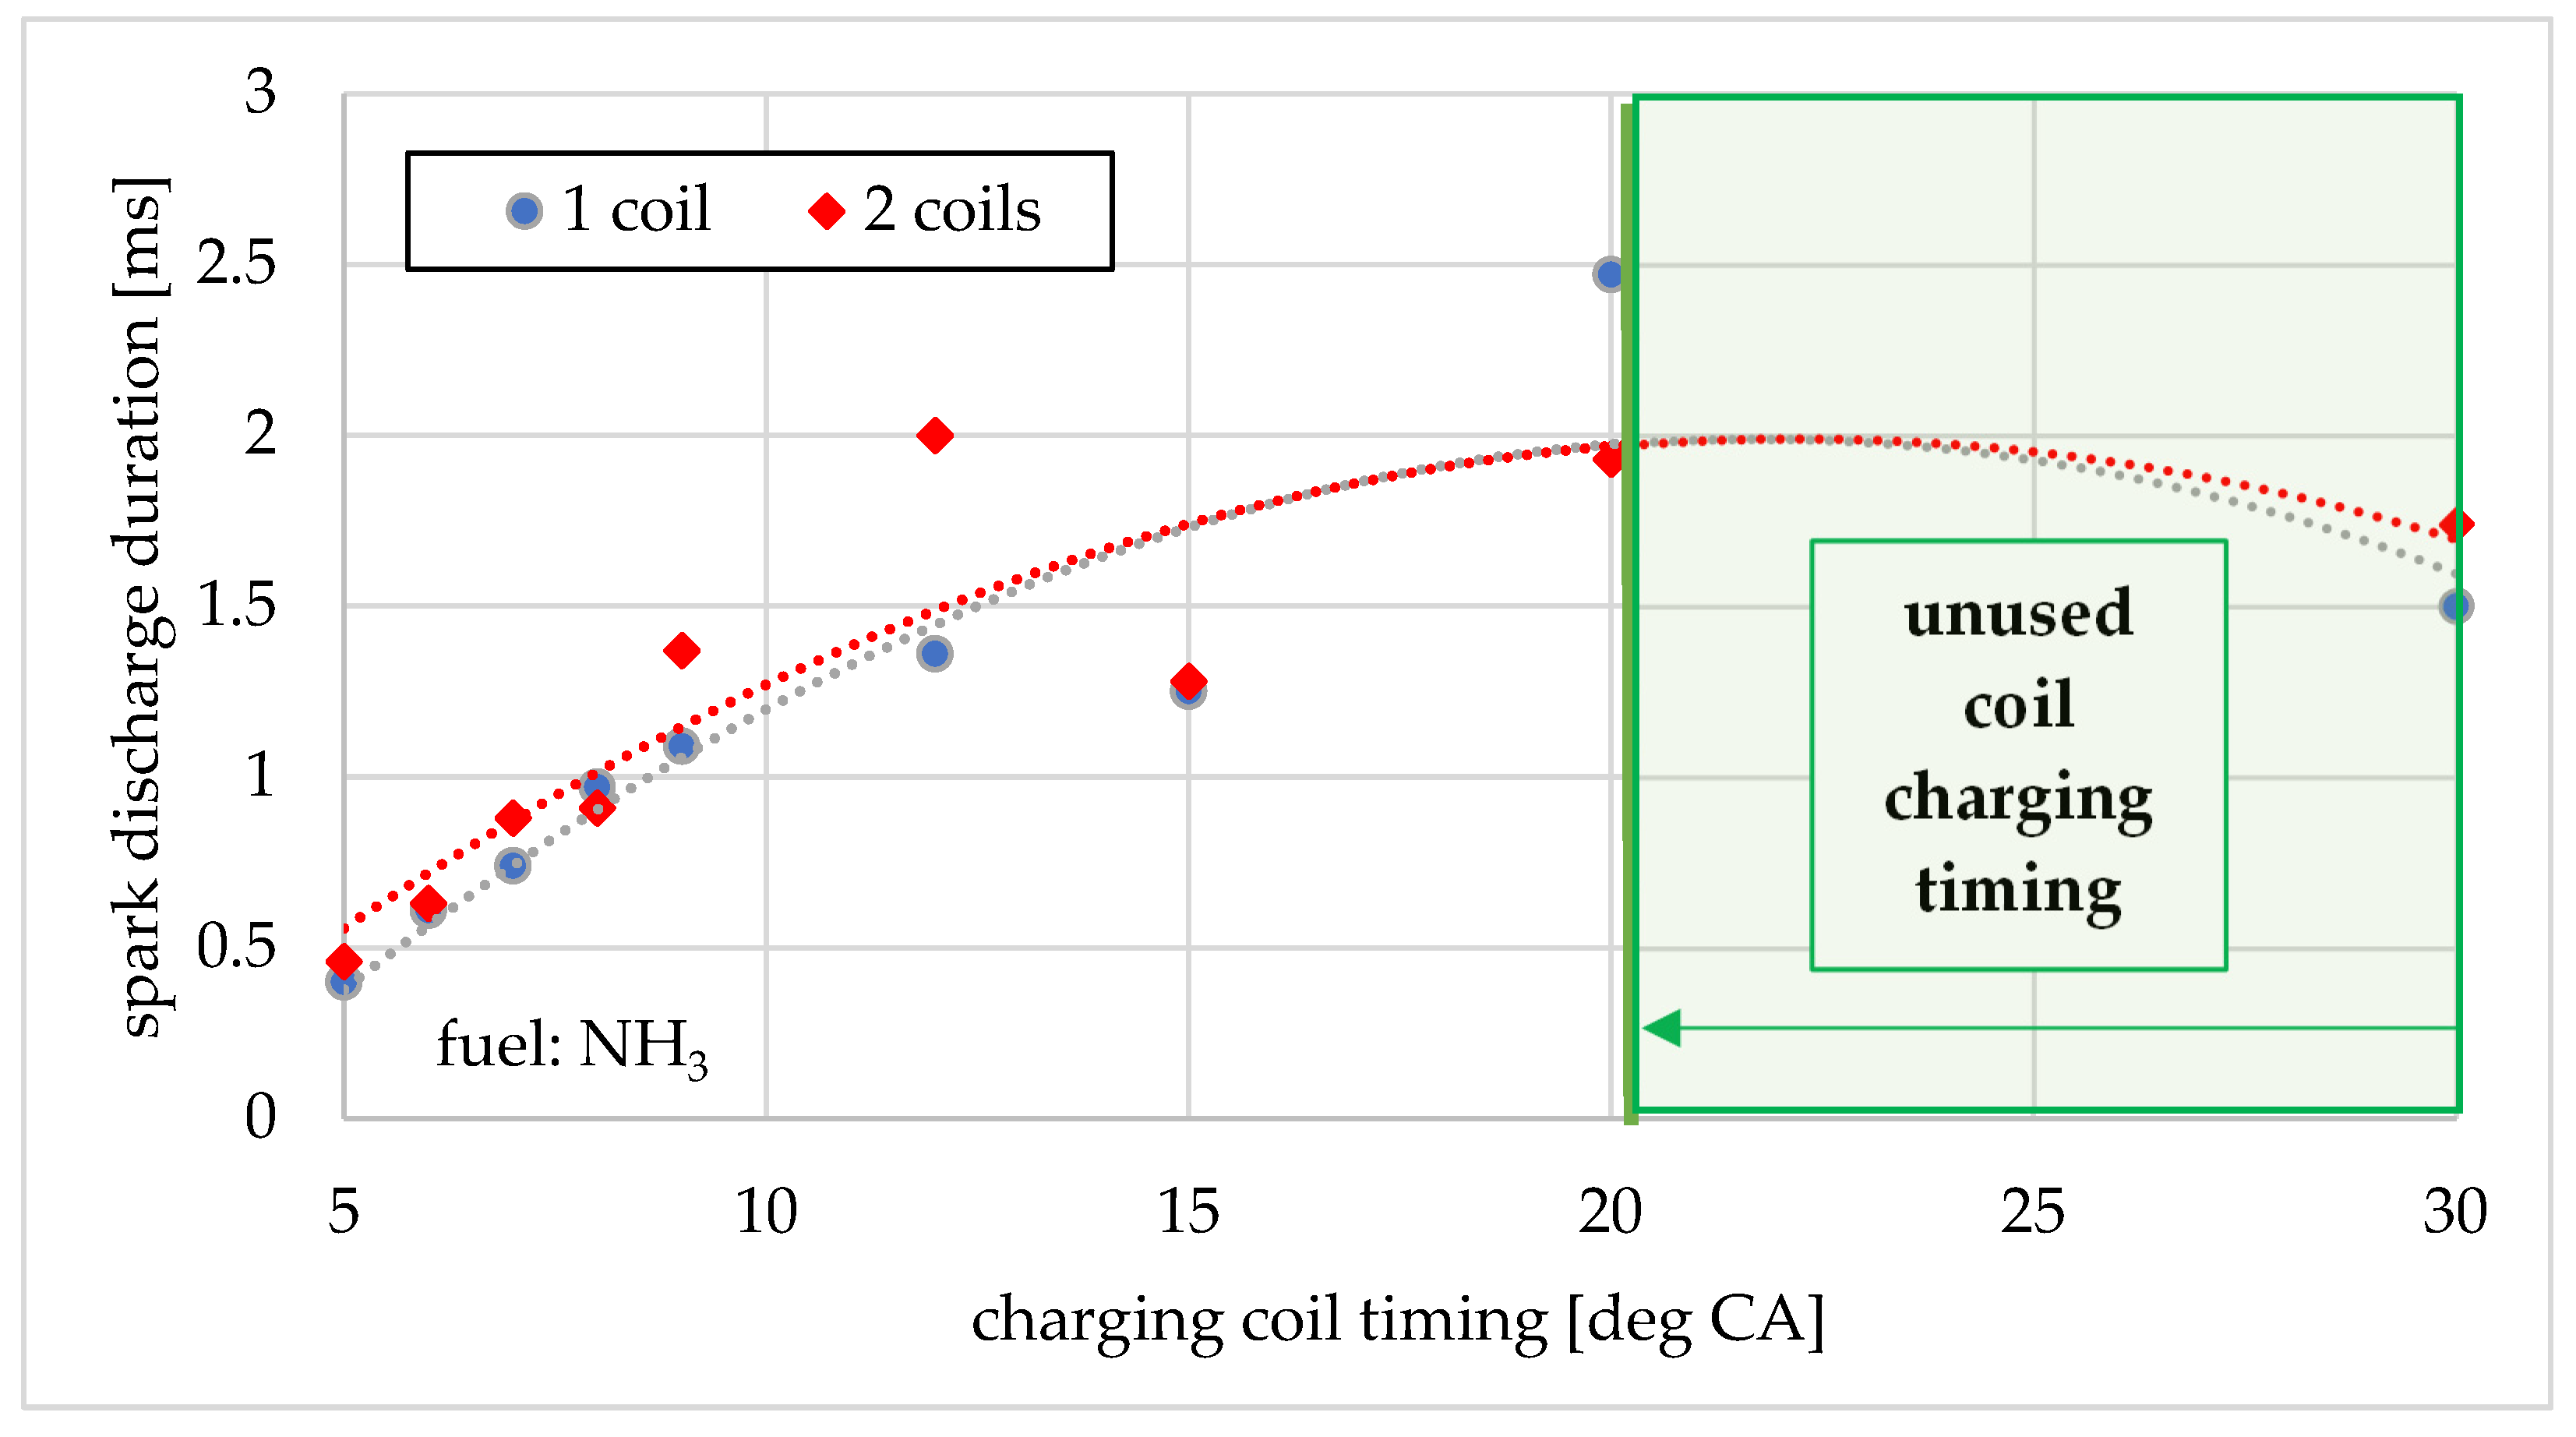
The spark duration increases with the ignition coil charging time in the usable range (Figure 10). Above the charging limit marked on the graph with a green line, the value decreases (limit value 20 deg CA, which corresponds to 5.51 ms). Based on the recorded waveforms, no correlation was observed between the number of ignition coils used and the spark duration. It should be remembered that after the spark discharge, the fuel mixture in the cylinder starts to ignite, the conditions in which the spark is created dynamic change, the pressure and temperature increase, and the gas composition surrounding the electric arc changes. The dynamic increase in turbulent gas flow around the spark plug affects the duration of the electric arc [20].
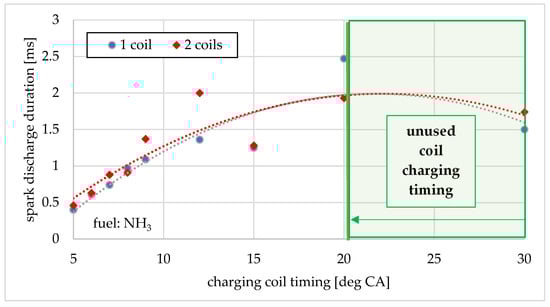
Figure 10.
Spark discharge duration vs. charging coil timing.
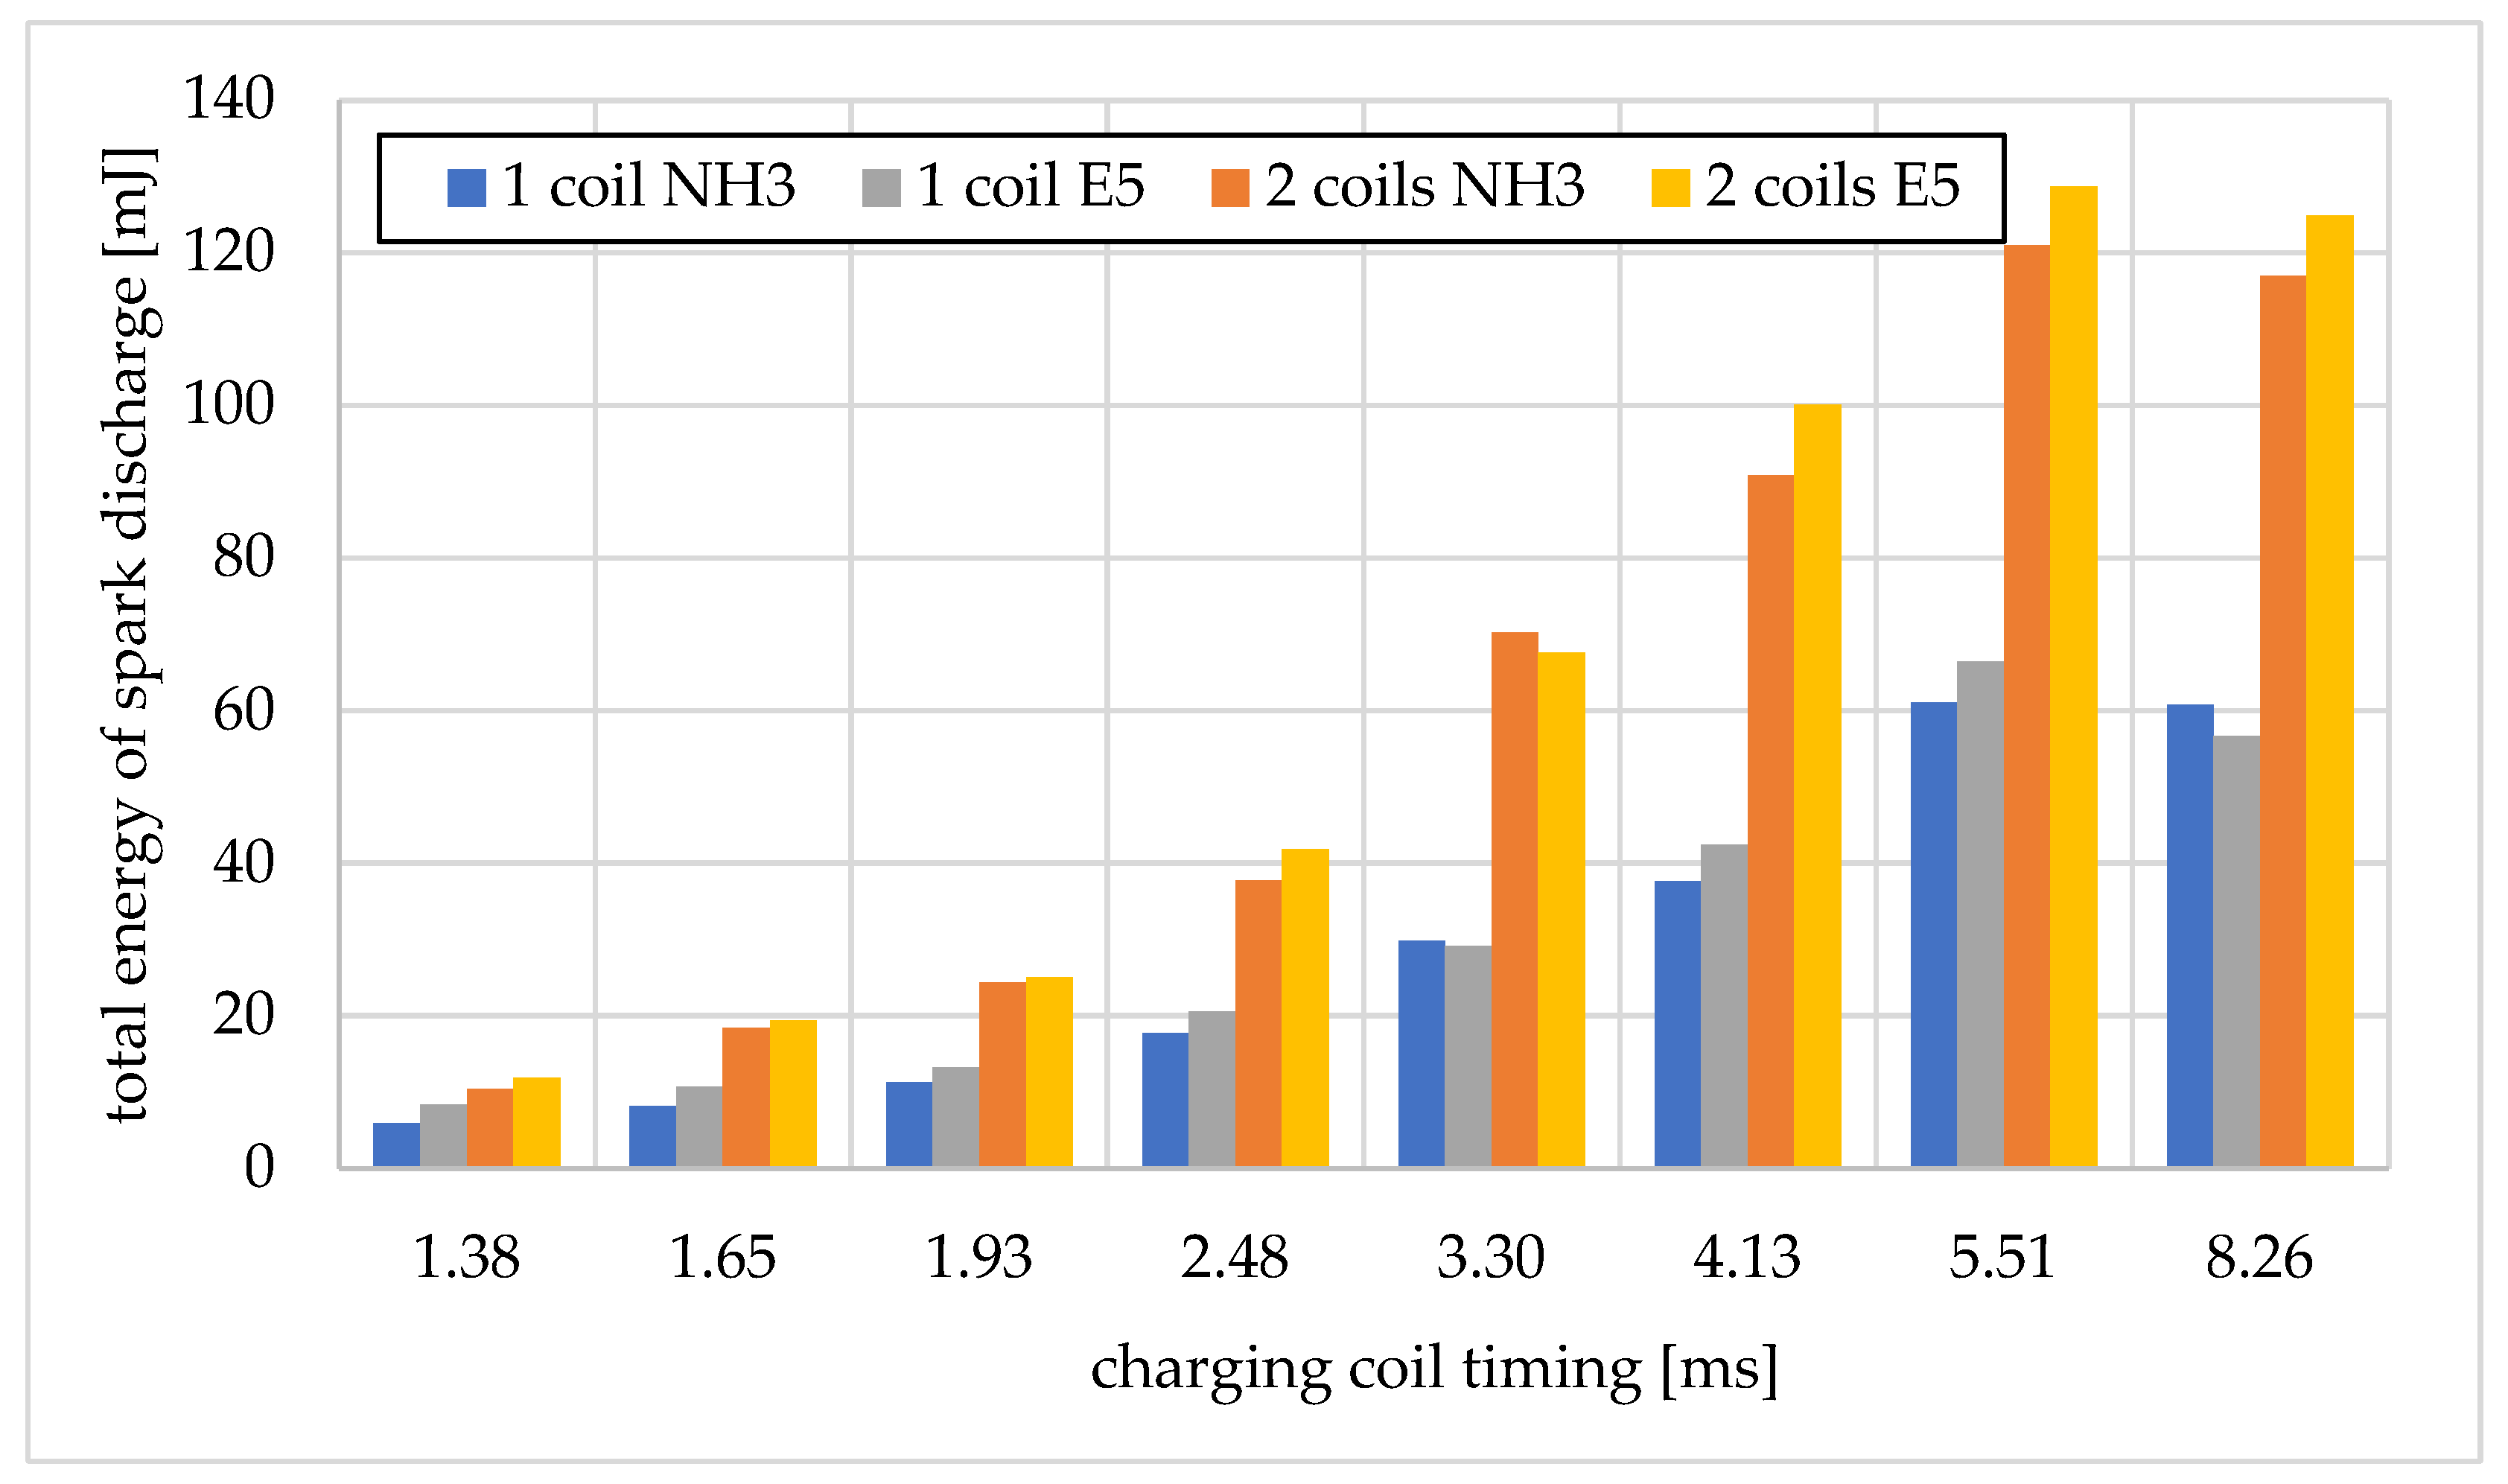
Based on the data recorded for the second fuel tested (gasoline E5), a graph of the total energy of spark ignition was obtained, as shown in Figure 11. The graph compares the total energy of spark discharge values for both fuels tested. For both the case of single and dual ignition coils, usually lower spark energy values were obtained for ammonia compared to gasoline. For both analyzed fuels, the longest ignition system charging time (8.26 ms) caused a decrease in total energy compared to the results obtained for the limit charging time of 5.51 ms. The difference between the energies of the selected fuels is small. The difference in total energy values between the fuels is influenced by the different spark timing. For ammonia, the ITA was set at 35 deg CA before TDC, and for gasoline, the ITA was set at 15 deg CA before TDC. As a consequence of this, the spark is produced in different conditions.
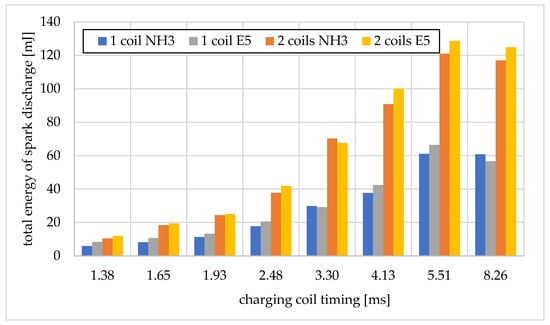
Figure 11.
Total energy of spark discharge vs. charging coil timing for ammonia (NH3) and gasoline (E5).
Spark plugs ignite various fuels. SI engines can operate on traditional liquid fuels, E5, E10, alcohol fuels, and gas fuels (LPG, LNG, CNG, H2, etc.) [2,21]. These fuels differ in terms of ignition energy; in the case of insufficient ignition energy, combustion is not correct, increased emission of toxic exhaust components occurs, and engine performance decreases [2,8]. Combustion of the same fuel in different conditions requires different spark energies (different compression ratios of the same fuel in different engine designs, different excess air coefficients, and variable temperature in the engine cylinder at start-up and during the achievement of optimal thermal conditions). In a combustion engine, subsequent work cycles differ from each other. The parameter defining the difference between the analyzed cycles is the unrepeatable engine operation. This parameter is influenced by many factors, including the condition of the spark plug, the energy generated by the spark, the varying degree of the cylinder filling with air, the uneven outlet of exhaust gases from the cylinder, the unpredictable gas turbulence in the engine, and the unrepeatable air–fuel distribution in the engine cylinder [22,23].
The ignition system must be selected so that the spark energy is sufficient for various operating conditions. One of the indicators defining the nonrepeatability of the engine operation is the coefficient of variation of the indicated mean effective pressure of individual cycles from the mean value of the measurement series (COVIMEP). In the case of insufficient spark energy, the nonrepeatability of the engine operation increases. The limit value of nonrepeatability of the engine operation is assumed to be 5% [2]. The E5 gasoline used in the tests is characterized by low ignition energy, as shown in Figure 12. It can be seen that regardless of the spark energy, subsequent engine operation cycles were repeatable, and the calculated COVIMEP was lower than the limit value. COVIMEP assumed a similar value for all different ignition system charging times.
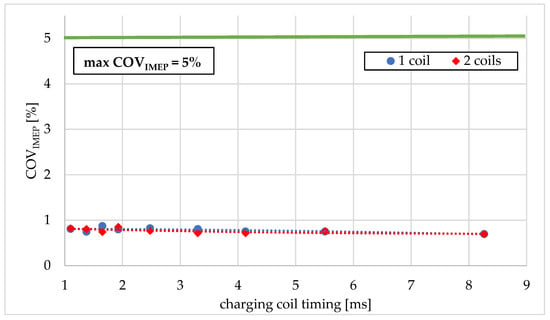
Figure 12.
COVIMEP vs. charge duration for gasoline E5.
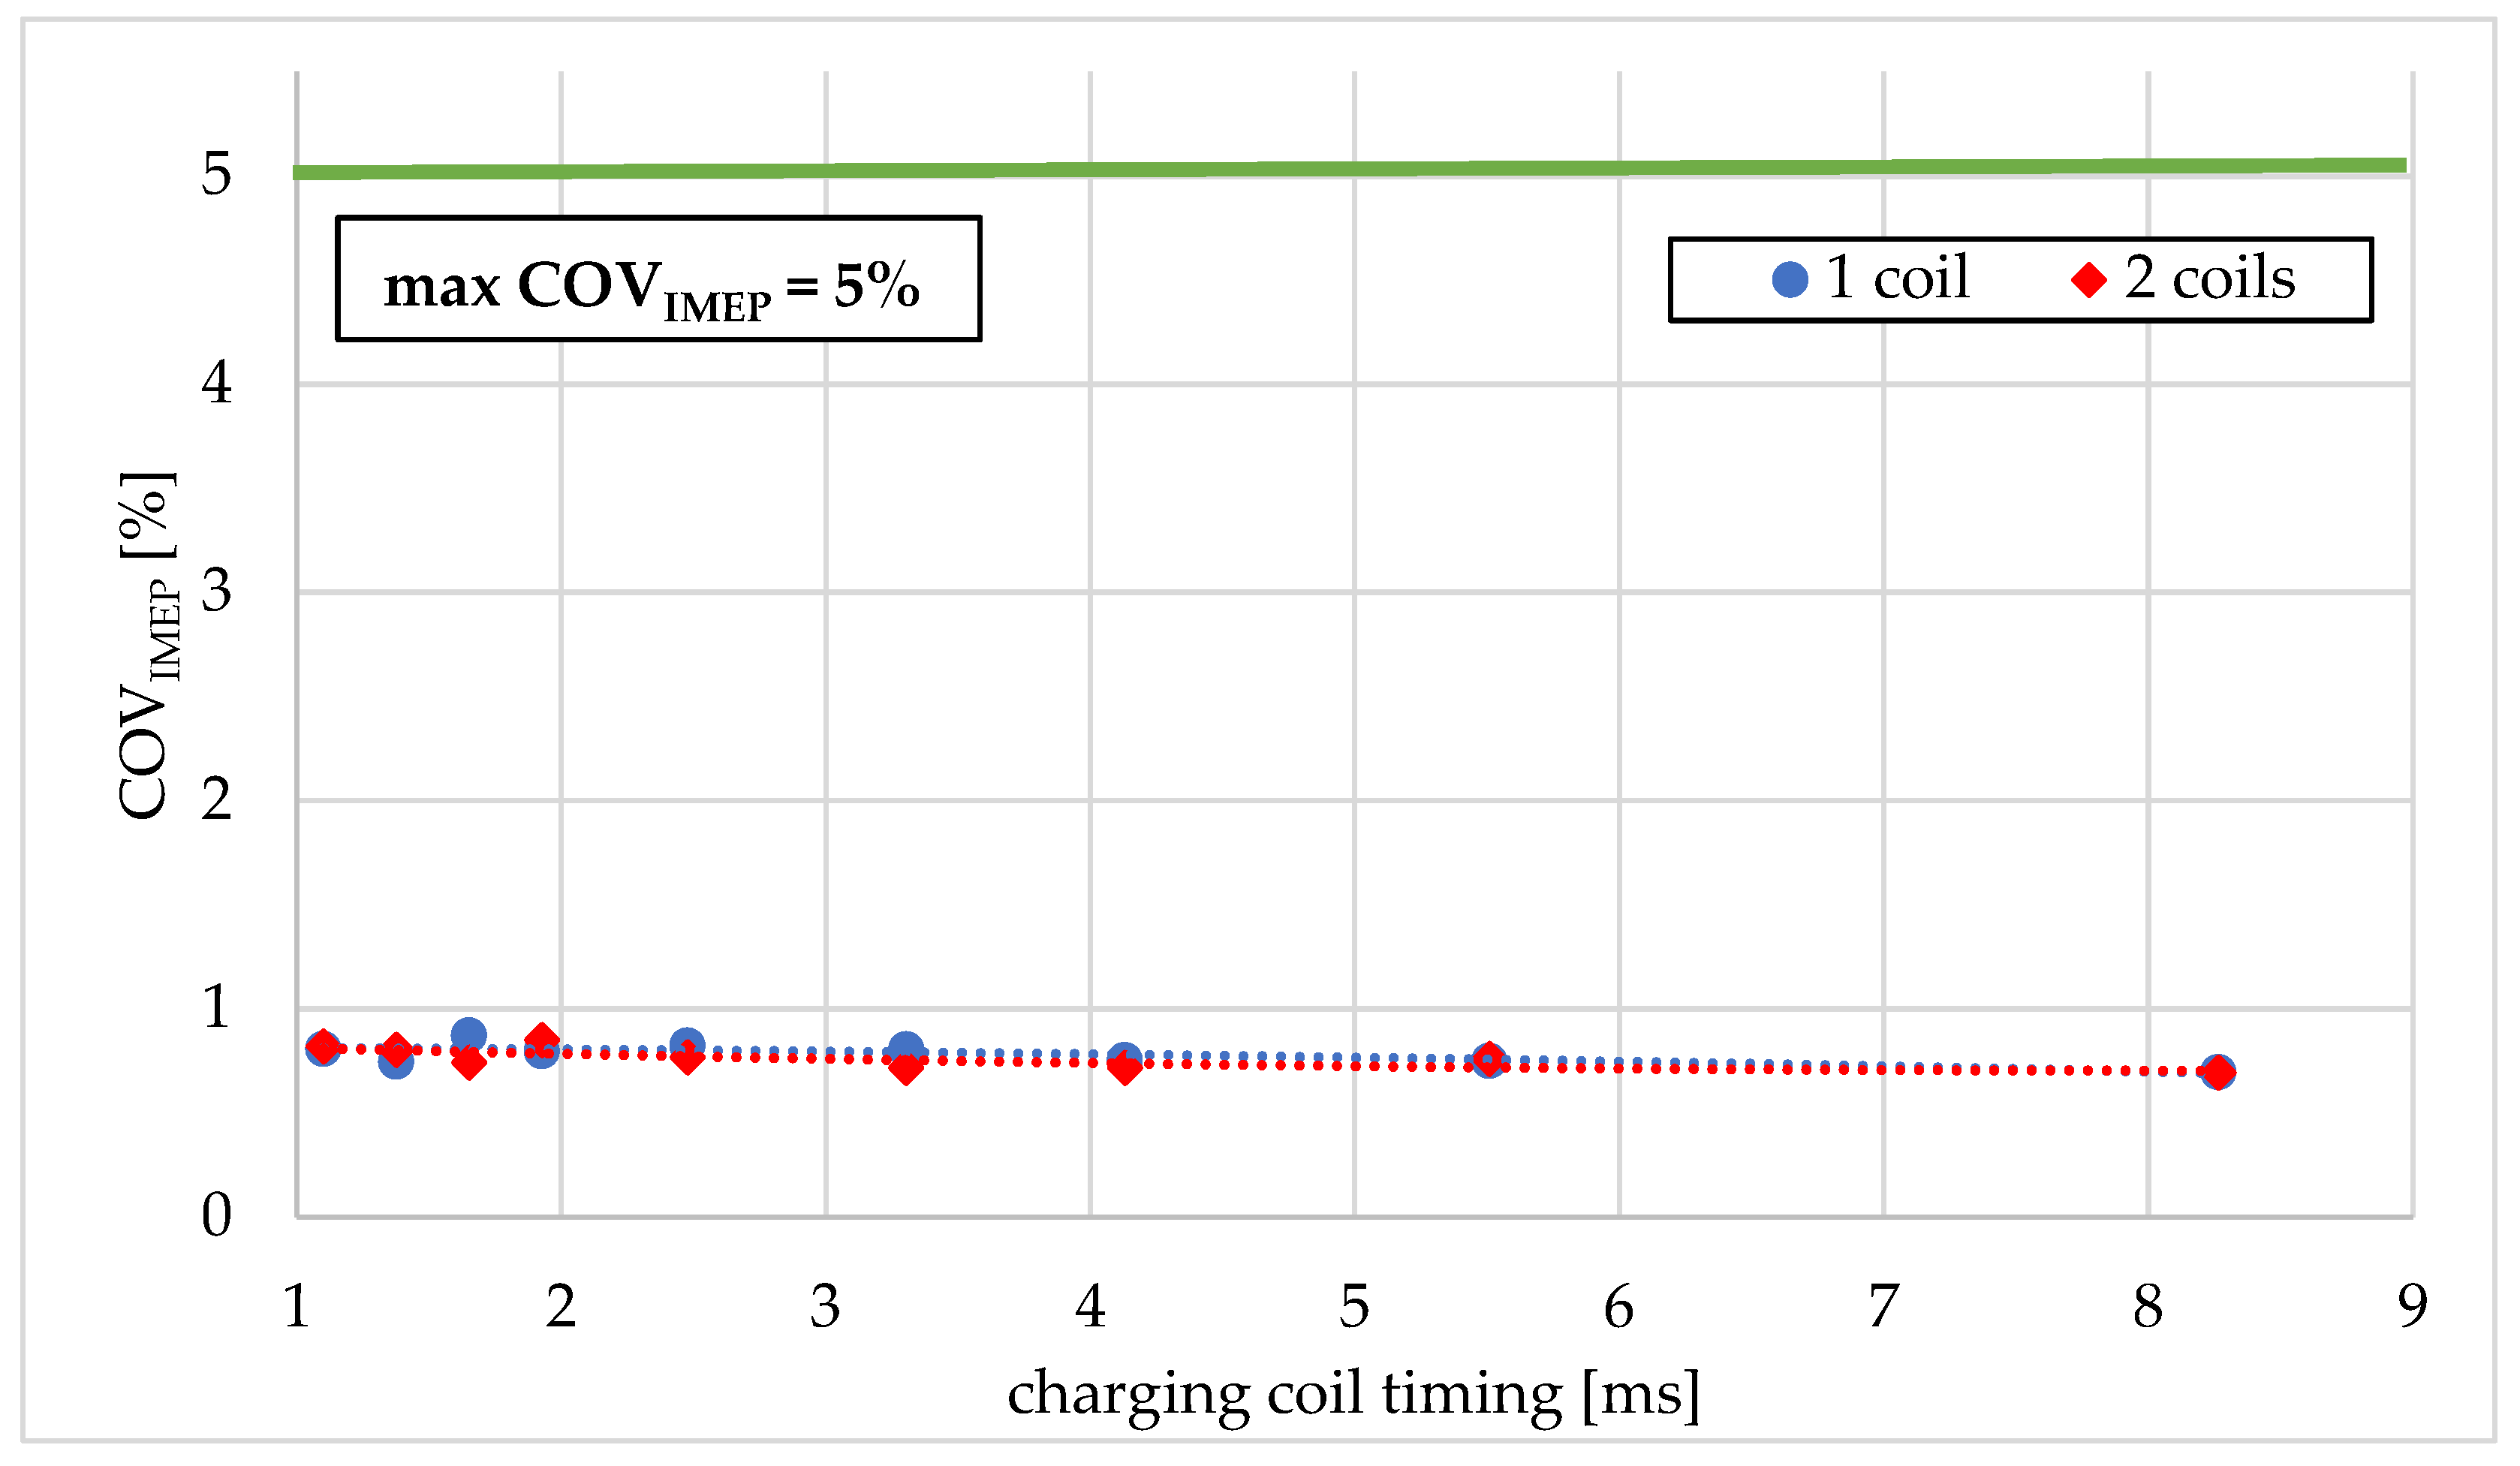
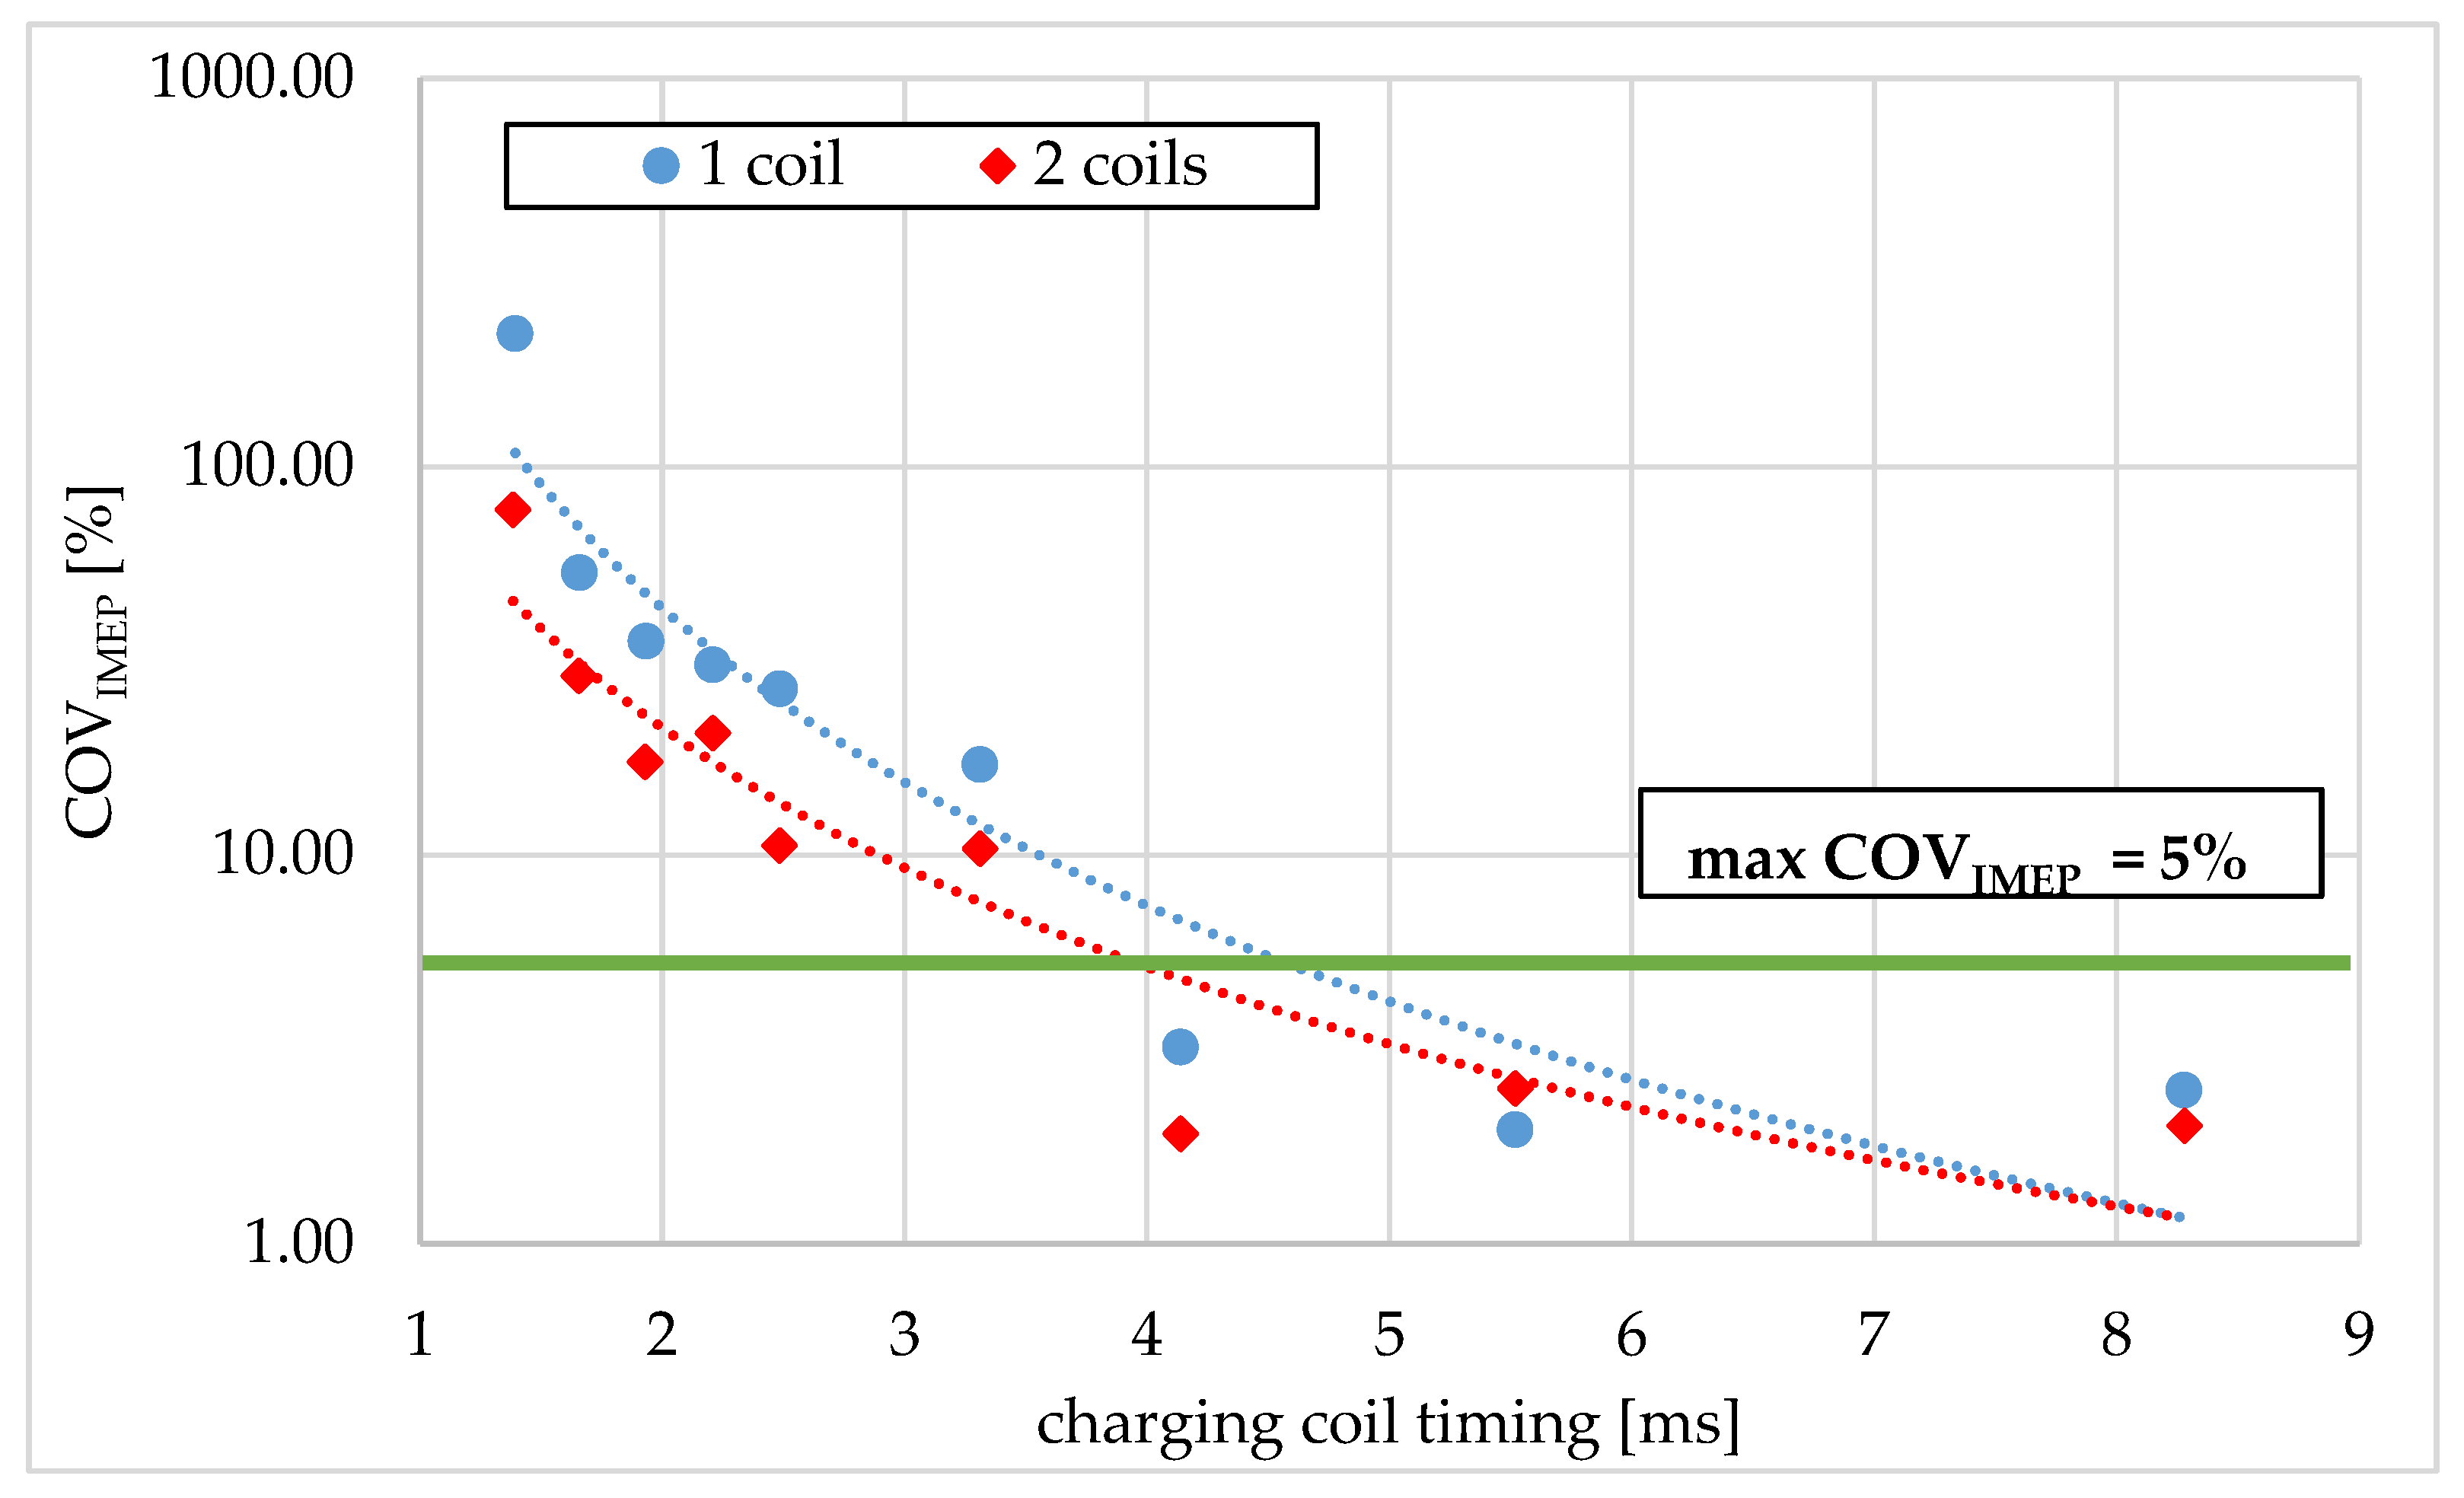
COVIMEP was higher for the hardly flammable ammonia (Figure 13), for which the nonrepeatability of the engine operation increased for short ignition system charging times. To obtain repeatable engine operation (COVIMEP < 5%), the ignition system must be charged at least 15 deg CA (4.14 ms). The use of two ignition modules reduces the nonrepeatability of the engine operation, but despite this, the limit value is exceeded and when using both ignition systems, the coil charging time must also be at least 4.14 ms.
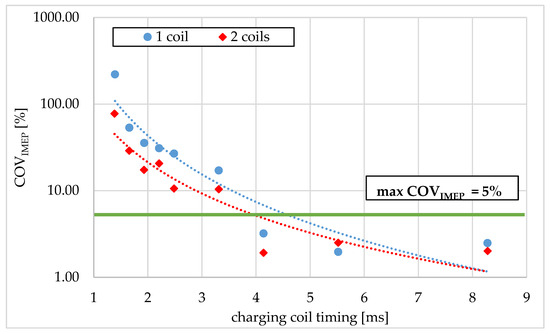
Figure 13.
COVIMEP vs. charge charging coil timing for ammonia.
The analysis carried out confirms the influence of spark energy on the repeatability of engine operation. Spark energy depends on the fuel used and the conditions in the cylinder. This is an important issue, the meticulous analysis of which guarantees reliable and efficient operation of the entire engine [23].
Spark energy varies in a spark-ignition piston combustion engine in a car. The car’s computer is responsible for selecting the appropriate energy. For the engine to operate in a stable, economic, and ecological way, the controller selects the charging coil timing and thus changes the spark energy. The spark energy is corrected, for example, depending on the current battery voltage. When the voltage drops below the nominal value, the ignition coil charging time is extended. However, when the battery voltage is above the nominal value, the dwell time is shortened. The engine speed and its load have a significant impact on charging coil timing. As the load increases, the spark energy must increase. It should be remembered that the engine speed and the ignition system charging time should be selected so that all spark plugs can be powered from one ignition module. Currently, individual high-voltage coils are increasingly used for individual cylinders, and this problem does not have to be taken into account [3,23].
5. Conclusions
The energy stored in the ignition system depends on its charging coil timing. The longer the charging, the more energy stored in the ignition system. The maximum useful charging coil timing of the used ignition module is 5.51 ms. For this time value, the highest total spark energy was 61.1 mJ. Longer charging of the ignition coil does not increase the spark energy. This characteristic of the system results from the maximum current flowing through the ignition coil, which has a constant inductance and resistance. These parameters limit the maximum current flowing through the coil as a function of time. Higher spark energy is characterized by a higher maximum current flowing in the initial phase and higher maximum spark power, but the voltage during spark discharge does not always increase. This voltage is directly related to the length of the electric arc of the spark. The sudden change in the length of the electric arc, caused by the intense flow of fluid around the spark plug, is visible on the graph as voltage spikes. The ignition module has a limited ability to store energy; therefore, for hard-to-ignite fuels, it was decided to use a second ignition module connected in parallel. With this solution, the total spark energy doubled and reached 121 mJ. In cases where such high energy is not required, the ignition module charging timing can be shortened. The minimum ignition module charging timing was set at 1.38 ms. For shorter charging timing, no spark was generated on the spark plug.
The voltage curve during a spark discharge consists of characteristic points. The incorrect location of these points can be an important diagnostic indicator. It can indicate the potential cause of the anomaly, as presented in this article. The conducted experiment and cited articles confirmed that the voltage curve depends on many parameters, i.e., the conditions in the engine, condition of the spark plug, ignition system used, etc. Repeatable and reliable operation of the ignition system is essential for efficient operation of the SI engine. In order for the ignition system to work reliably, its components must be resistant to vibrations, dust, high temperature, etc. In the case of using new alternative fuels, and ammonia is such a fuel, not all aspects have been fully analyzed yet. The conducted experiment allowed us to determine the basic requirements that the ignition system must meet in order to realize effective combustion of ammonia in the internal combustion engine. Modern spark ignition systems are complex electronic systems that control, manage, and diagnose their elements. They are one of the most important elements of the internal combustion engine with spark ignition. The reliable operation of the ignition system determines the durable and reliable operation of the SI engine. The above arguments confirm that it is important to analyze ignition systems in the case of traditional engine fuels, and even more important is the analysis of spark discharge parameters in the case of new alternative fuels, for which there are different ignition conditions. More stringent requirements are placed on modern ignition systems, including long service life and greater spark energy. In the case of using difficult-to-ignite fuels, this requires meticulous testing in real conditions to meet these requirements.
Future research directions can be conducted in the area of analysis of the effect of spark discharge energy on emitted pollutants from the combustion of ammonia in an SI engine. Other methods of increasing the spark energy or multi-ignition should be analyzed. Moreover, in the available literature, there is no information on the minimum spark energy required to ignite ammonia at different temperatures, variable pressures, and variable AFR coefficients. Such knowledge is necessary in the case of using ammonia as an engine fuel because SI engines operate under different ambient and load conditions. The presented knowledge and future research will enable the assessment of the potential of using ammonia as a fuel for piston combustion engines. The planned experimental studies may be used to develop a theoretical model of the ammonia ignition system.
Author Contributions
Conceptualization, M.G. and M.P. and B.B.; methodology, M.G.; software, M.G.; formal analysis, M.G.; investigation, B.B.; resources, M.P.; data curation, M.G.; writing—original draft preparation, M.C.; writing—review and editing, B.B.; visualization, M.C.; supervision, M.P.; project administration, B.B.; funding acquisition, M.P. All authors have read and agreed to the published version of the manuscript.
Funding
This research received no external funding.
Data Availability Statement
The data used in this study are reported in the figures and tables of the manuscript.
Conflicts of Interest
The authors declare no conflicts of interest.
Abbreviations
The following abbreviations are used in this manuscript:
| AFR | air/fuel ratio |
| CA | crank angle |
| CAD | crank angle degree |
| CNG | compressed natural gas |
| COVIMEP | coefficient of variation of indicated mean effective pressure |
| CR | compression ratio |
| deg | degrees |
| dwell | charging coil timing |
| EVC | exhaust valve closed |
| EVO | exhaust valve open |
| E10 | gasoline including 10 per cent bioethanol |
| E5 | gasoline including 5 per cent ethanol |
| H2 | dihydrogen |
| IMEP | indicated mean effective pressure |
| ITA | ignition timing angle |
| IVC | inlet valve closed |
| IVO | inlet valve open |
| LNG | liquefied natural gas |
| LPG | liquefied petroleum gas |
| NH3 | ammonia |
| OHV | overhead valve |
| RAM | random-access memory |
| rpm | revolutions per minute |
| SI engine | spark-ignition engine |
| Ta | ambient temperature |
| TDC | top dead center |
References
- Tutak, W.; Pyrc, M.; Gruca, M.; Jamrozik, A. Ammonia Combustion in a Spark-Ignition Engine Supported with Dimethyl Ether. Energies 2023, 16, 7283. [Google Scholar] [CrossRef]
- Szwaja, S.; Cupial, K.; Grab-Rogalinski, K. Anomalies in combustion of hydrogen in a SI engine modified to work as a supercharged one. J. Kones 2012, 19, 437–442. [Google Scholar] [CrossRef]
- Dyga, G.; Trawiński, G. Diagnostyka Układów Elektrycznych i Elektronicznych Pojazdów Samochodowych; WSiP: Warszawa, Poland, 2014; pp. 186–199. [Google Scholar]
- Sosnowski, M. Modelowanie i Analiza Przebiegu Wyładowania Iskrowego w Silniku z Zapłonem Wymuszonym. Ph.D. Thesis, Czestochowa University of Technology, Czestochowa, Poland, 2008. [Google Scholar] [CrossRef]
- Stevenson, R.C.; Palma, R.; Yang, C.S.; Park, S.K.; Mi, C. Comprehensive Modeling of Automotive Ignition Systems. SAE Trans. 2007, 116, 1077–1100. [Google Scholar]
- Różowicz, S.; Zawadzki, A.; Włodarczyk, M.; Różowicz, A. Modeling of Internal Combustion Engine Ignition Systems with a Circuit Containing Fractional-Order Elements. Energies 2022, 15, 337. [Google Scholar] [CrossRef]
- Haoran, S.; Zhiyu, W.; Suijun, Y.; Shuliang, Y. Measurement of the effect of parasitic capacitance in minimum ignition energy spark generation circuits. J. Electrost. 2022, 119, 103752. [Google Scholar] [CrossRef]
- Skrucany, T.; Stopkova, M.; Stopka, O.; Milojević, S. Design of a daily-user methodology to detect fuel consumption in cars with spark ignition engine. Appl. Eng. Lett. 2020, 5, 80–86. [Google Scholar] [CrossRef]
- Goulart, B.S.; Bringhenti, C.; Oliveira, A.C. Ignition parameters comparative tests: A standard inductive ignition versus a high energy capacitive-discharge ignition. In Proceedings of the COBEM 2011, 21st Brazilian Congress of Mechanical Engineering, Natal, Brazil, 24–28 October 2011. [Google Scholar]
- Huang, S.; Li, T.; Ma, P.; Xie, S.; Zhang, Z.; Chen, R. Quantitative Evaluation of the Breakdown Process of Spark Discharge for Spark-Ignition Engines. J. Phys. D Appl. Phys. 2020, 53, 045501. [Google Scholar] [CrossRef]
- Windarto, C.; Lim, O. Spark discharge energy effect on in-cylinder characteristics performance of rapid compression and expansion machine with spark ignition direct injection strategy. Fuel 2023, 337, 127165. [Google Scholar] [CrossRef]
- BERU Federal Mogul. All About Ignition Coils, Technical Information No. 07, 2013, Bestell-Nr. 5 001 006 056. Available online: https://pages.championpowersports.eu/assets/Beru/ti-07-ignition-coils-gb-2013-lowres-0.pdf (accessed on 27 May 2025).
- Trouble Tracer Spark Plugs—Symptom Diagnosis. Available online: https://www.beruparts.pl/support/trouble-tracer/spark-plugs.html (accessed on 27 May 2025).
- Thompson, B.C. Fire in the hole Understanding Ignition Waveforms. MOTOR, May 2005; pp. 28–44. Available online: https://www.motor.com/wp-content/uploads/FireInTheHoleUnderstandingIgnitionWaveforms-May2005.pdf (accessed on 23 May 2025).
- Korenciak, D.; Kubis, M.; Sebok, M.; Gutten, M.; Kucera, M. Analysis of Automotive Ignition Systems in Laboratory Conditions. Przegląd Elektrotechniczny 2020, 96, 48–51. [Google Scholar]
- Myoungsoo, K.; Changhyun, L.; Seongmin, S.; Shin, J.H.; Kiseon, S.; Jonghyeok, L.; Ho Song, H. Experimental study on the spark ignition characteristics at elevated temperature and pressure under flow conditions. Combust. Flame 2024, 259, 113159. [Google Scholar] [CrossRef]
- Irimescu, A.; Merola, S.S.; Vaglieco, B.M. Spark anemometry applied through secondary current measurements in an optical spark ignition engine. Energy Convers. Manag. 2016, 269, 116088. [Google Scholar] [CrossRef]
- Gruca, M.; Pyrc, M.; Borowik, B. Wpływ parametrów napięciowych i prądowych na pracę układu wtrysku wielokrotnego zbudowanego na bazie sterownika Compact RIO. Przegląd Elektrotechniczny 2022, 98, 305–308. [Google Scholar] [CrossRef]
- Zhiyu, W.; Haoran, S.; Suijun, Y.; Shuliang, Y. Reconsideration of energy measurement of spark discharge using different triggering methods and inductance loads. J. Electrost. 2022, 117, 103724. [Google Scholar] [CrossRef]
- Shy, S.S.; Mai, V.T.; Chen, Y.R.; Hsieh, H.Y. Nanosecond repetitively pulsed discharges and conventional sparks of ammonia-air mixtures in a fan-stirred cruciform burner: Flammability limits and ignition transition. Appl. Energy Combust. Sci. 2023, 15, 100164. [Google Scholar] [CrossRef]
- Chwist, M. Comparative analysis of heat release in a reciprocating engine powered by a regular fuel with pyrolysis oil addition. Combust. Engines 2022, 190, 104–112. [Google Scholar] [CrossRef]
- Jung, D.; Sasaki, K.; Iida, N. Effects of increased spark discharge energy and enhanced in-cylinder turbulence level on lean limits and cycle-to-cycle variations of combustion for SI engine operation. Appl. Energy 2017, 205, 1467–1477. [Google Scholar] [CrossRef]
- Kim, K.; Hall, M.J.; Wilson, P.S.; Matthews, R.D. Arc-Phase Spark Plug Energy Deposition Characteristics Measured Using a Spark Plug Calorimeter Based on Differential Pressure Measurement. Energies 2020, 13, 3550. [Google Scholar] [CrossRef]


Disclaimer/Publisher’s Note: The statements, opinions and data contained in all publications are solely those of the individual author(s) and contributor(s) and not of MDPI and/or the editor(s). MDPI and/or the editor(s) disclaim responsibility for any injury to people or property resulting from any ideas, methods, instructions or products referred to in the content. |
© 2025 by the authors. Licensee MDPI, Basel, Switzerland. This article is an open access article distributed under the terms and conditions of the Creative Commons Attribution (CC BY) license (https://creativecommons.org/licenses/by/4.0/).