Review

Comparative Review of Natural Gas Vehicles During the Energy Transition

School of Engineering, Frederick University, 7 Frederickou Street, 1036 Nicosia, Cyprus
*
Author to whom correspondence should be addressed.
Energies 2025, 18(13), 3512; https://doi.org/10.3390/en18133512
Submission received: 28 May 2025 / Revised: 24 June 2025 / Accepted: 1 July 2025 / Published: 3 July 2025
(This article belongs to the Collection Energy Transition Towards Carbon Neutrality)

Abstract

The global climate crisis necessitates the urgent implementation of sustainable practices and carbon emission reduction strategies across all sectors. Transport, as a major contributor to greenhouse gas emissions, requires transitional technologies to bridge the gap between fossil fuel dependency and renewable energy systems. Natural gas, recognised as the cleanest fossil-derived fuel with approximately half the CO2 emissions of coal and 75% of oil, presents a potential transitional solution through Natural Gas Vehicles (NGVs). This manuscript presents several distinctive contributions that advance the understanding of Natural Gas Vehicles within the contemporary energy transition landscape while synthesising updated emission performance data. Specifically, the feasibility and sustainability of NGVs are investigated within the energy transition framework by systematically incorporating recent technological developments and environmental, economic, and infrastructure considerations in comparison to conventional vehicles (diesel and petrol) and unconventional alternatives (electric and hydrogen-fuelled). The analysis reveals that NGVs can reduce CO2 emissions by approximately 25% compared to petrol vehicles on a well-to-wheel basis, with significant reductions in NOx and particulate matter. However, these environmental benefits depend heavily on the source and type of natural gas used (CNG or LNG), while economic viability hinges largely on governmental policies and infrastructure development. The findings suggest that NGVs can serve as an effective transitional technology in the transport sector’s sustainability pathway, particularly in regions with established natural gas infrastructure, but require supportive policy frameworks to overcome implementation barriers.

1. Introduction

The global climate change and the effects of increasing temperatures due to the greenhouse effect, as well as scarce petroleum supplies, inevitably mean that the world’s economies have to shift to more sustainable energy systems [1]. Several international agreements, including the Paris and Kyoto Agreements, require measures to be put in place. The world temperature increase has to remain below the set amount of 2 °C for this century, and, because of the price set on carbon dioxide (CO2) emissions, economies have to employ more sustainable energy practices, particularly focusing on much-reduced greenhouse gas emissions. The global energy sector is thus undergoing a transformative shift towards sustainability, with increasing emphasis on reducing carbon emissions.
Because of recent experimental research and technological advances in fracking, enhanced gas recovery, and specific experimental techniques [2,3,4,5,6], unconventional gas reservoirs (including shale, mudstone, and tight sandstone formations) have been easier to tap into. Previously, they could not have been exploited via the already commercialised technologies because of their low permeability. These formations contain primarily natural gas; therefore, these advances in technology have made their exploitation less difficult [7]. Among fossil fuels, natural gas is widely seen as the environmentally friendliest option due to the lesser emissions of CO2 produced when burning, in comparison to coal and oil; namely, natural gas emits only half the CO2 emitted by coal and 75% by oil [8,9]. Therefore, in an attempt to bridge the gap between an economy dependent on fossil fuels and the ideal scenario of an economy solely using renewable resources to meet its energy demands, natural gas can be the key to this energy transition [8,10,11,12].
The International Energy Agency (IEA) forecasted that global gas demand would grow by more than 2.5% (just over 100 bcm) in 2024, with the Asia Pacific region accounting for almost 45% of the incremental gas demand in 2024. In addition, world reserves of natural gas were estimated at 206.43 tcm (end of 2023) [13,14,15]. Therefore, due to its rising demand and supply, natural gas is currently exploited in several ways, including direct usage in power stations [10,16]; in conjunction with renewable resources [8,10,17,18]; as a source of hydrogen [19,20,21]; and as a fuel in transportation vehicles, which will be the main investigating point of this study. In general, there has been a rise in Alternative Fuel Vehicles (AFVs), which run on fuels like natural gas, ethanol, methanol, biodiesel, and hydrogen (via the use of fuel cells), as hybrids (which run on conventional fuels like petrol alongside a battery) or electric (plug-in or fully electrical) [22].
In this work, the feasibility and sustainability of natural gas as a vehicle fuel are investigated. Natural Gas Vehicle (NGV) technology is explained in terms of the types of NGVs currently used and their specifications, as well as economic issues that may arise for both the consumer and the government. A comparative assessment in terms of carbon emissions between natural gas as a fuel in the transport sector, conventional fuels (diesel and petrol), and unconventional fuels (electric and hydrogen-fuelled) is carried out, and an overall discussion is presented on the viability of NGVs as a viable and effective transitional technology within the scope of the energy transition, based on the existing barriers and potential emission reductions. Overall, this manuscript presents several distinctive contributions that advance the understanding of NGVs within the contemporary energy transition landscape. While previous studies have examined individual components of NGV performance, this work uniquely synthesises updated emission performance data that incorporates recent technological developments and environmental, economic, and infrastructure considerations into a cohesive analytical framework that provides stakeholders with actionable insights for policy development and technology deployment decisions.
Specifically, Section 2 presents the basics of NGVs, as well as historic data regarding various fuel prices and issues arising from the natural gas grid infrastructure. Section 3 includes a comparative assessment of NGVs with conventional and unconventional fuels in terms of emissions. Section 4 includes a discussion on NGVs regarding both emissions and other financial and non-financial issues that may deter their implementation in a given economy. Lastly, the conclusions are summarised in Section 5.

2. Overview of Natural Gas Vehicles

NGVs were first introduced in the mid-1930s in Italy as an alternative fuel to petrol [23], and currently, more than 23 million NGVs are on the road worldwide [22,24]. Specifically, as illustrated in Figure 1, Asia carries the biggest percentage of NGVs worldwide (66.4%), followed by South America (23.9%) and Europe (7.9%) [25].
Natural gas, as a fuel in vehicles, can be used in different forms; the main ones are summarised in Table 1. CNG is the most popular form of natural gas used as a vehicle fuel, both in light-duty vehicles (LDVs) and medium- and heavy-duty vehicles (MD/HDVs). It is usually cheaper than LNG (due to LNG’s higher costs of production and storage) and more widely used, as it can also be used in bi- and dual-fuel engines [26,27]. However, some HDVs use LNG because of its specific storage conditions, allowing more fuel to be stored on board the vehicle, making it suitable for long-distance travel.
Existing vehicles can have their engines retrofitted into dual- or bi-fuel engines, making the potential shift to NGVs more attainable, especially considering the costs of replacing an existing vehicle with a brand new NGV that runs solely on natural gas. Using existing vehicles and being able to modify their engines to use natural gas as a fuel reduces the technical barriers that these technologies face in order to be considered a viable and sustainable option for the public user. These modifications are not only possible in LDVs but also in MD/HDVs, like buses and trucks, forklifts, agricultural vehicles, etc. However, there is always a general public tendency towards original equipment manufacturer vehicles rather than retrofitted ones. These NGVs have higher purchasing prices in comparison to conventional-fuelled vehicles. For reference, the price of an LDV using natural gas is more expensive, by USD 3000, and that of an MD/HDV is higher, by around half its price [29]. This higher purchasing price can be reduced, especially for LDVs, by employing subsidies and reduced taxation, as suggested in [23,30]. In addition, the lower running costs of these vehicles can also be a serious incentive to the public, making the shift to NGVs more attractive. For example, as presented in Figure 2, CNG is consistently the cheapest fuel compared to gasoline and diesel, and LNG is either lower or really close (USD ± 1) in price; this makes the economics of running an NGV more attractive, especially to HDV fleet owners [29,31,32]. LNG is also seen to follow the same trend as gasoline and diesel prices. It is important to note that original equipment manufacturer CNG vehicles have performance advantages over retrofitted ones (dual-fuel), including enhanced power, total combustion efficiency and lower frictional losses, resulting in less maintenance in the long run [28]. Several mechanisms can be used to overcome this lack of efficiency (e.g., lean burn combustion, supercharging, optimisation of fuel injection parameters, etc.), which come with their own weaknesses. The solution (both in terms of economics and vehicle performance) seems to lie in fuel-blend combinations, with 90% CNG being the maximum replacement [24,28].
Gas distribution systems and grid infrastructure also play an important role in the availability of refuelling stations and the overall commercialisation of NGVs. NGVs can be easily integrated into economies that already have a natural gas grid infrastructure and availability (or the potential for easy installation) of refuelling stations. Currently, there are around 31,000 natural gas (both CNG and LNG) refuelling stations worldwide, and the top seven countries are tabulated in Table 2 [28]. Other countries worth mentioning because of their remarkable growth in refuelling stations are Armenia, Bulgaria, Peru, and Thailand, as well as Germany (900 stations) and Italy (1100 stations) [29,33].
A country with a well-developed natural gas pipeline infrastructure can easily support NGVs, and most developed countries already have such a system, as natural gas is already used for heating and cooking [23]. For developing countries, the adoption of NGVs can also incentivise grid and infrastructure improvements. For example, in Brazil, NGV refuelling stations have aided in justifying the construction of pipelines in areas that otherwise may not have been viable [33]. In India, an expansion of the natural gas pipeline network was announced in 2025, with plans to increase the current operation network of 25,000 km by 63% [34]. China has also seen an expansion in its pipeline length from 16,000 to 50,000 km within the span of 10 years [28], increasing its overall gas transmission capacity by 76% since 2020 [35].
However, even though the adoption of NGVs can be an incentive for infrastructure improvements, the associated high cost of these developments remains a significant barrier [36]. As an example, Canada experienced the collapse of the NGV sector when investment in the refuelling stations was reduced [30]. This issue can be specific to some countries but not others, where NGVs have shown great success, e.g., Argentina and Germany [30]. Overall, the costs of installing such infrastructures can vary between countries because of size, capacity, and the way natural gas is dispensed (fast-fill, time-fill, or combination) [36,37]. Depending on the form of natural gas used (CNG or LNG), refuelling stations vary significantly in technology and, thus, cost to build [24].

3. Comparative Assessment of Environmental Indicators

The environmental performance of Natural Gas Vehicles (NGVs) must be systematically evaluated against conventional and alternative transportation technologies to determine their role in emission reduction strategies. This section employs a well-to-wheel (WTW) lifecycle analysis to quantify greenhouse gas emissions, nitrogen oxides (NOx), and particulate matter (PM) across three vehicle categories: conventional (petrol, diesel), unconventional (electric and hydrogen, as tabulated in Table 3), and NGVs (compressed and liquefied natural gas).

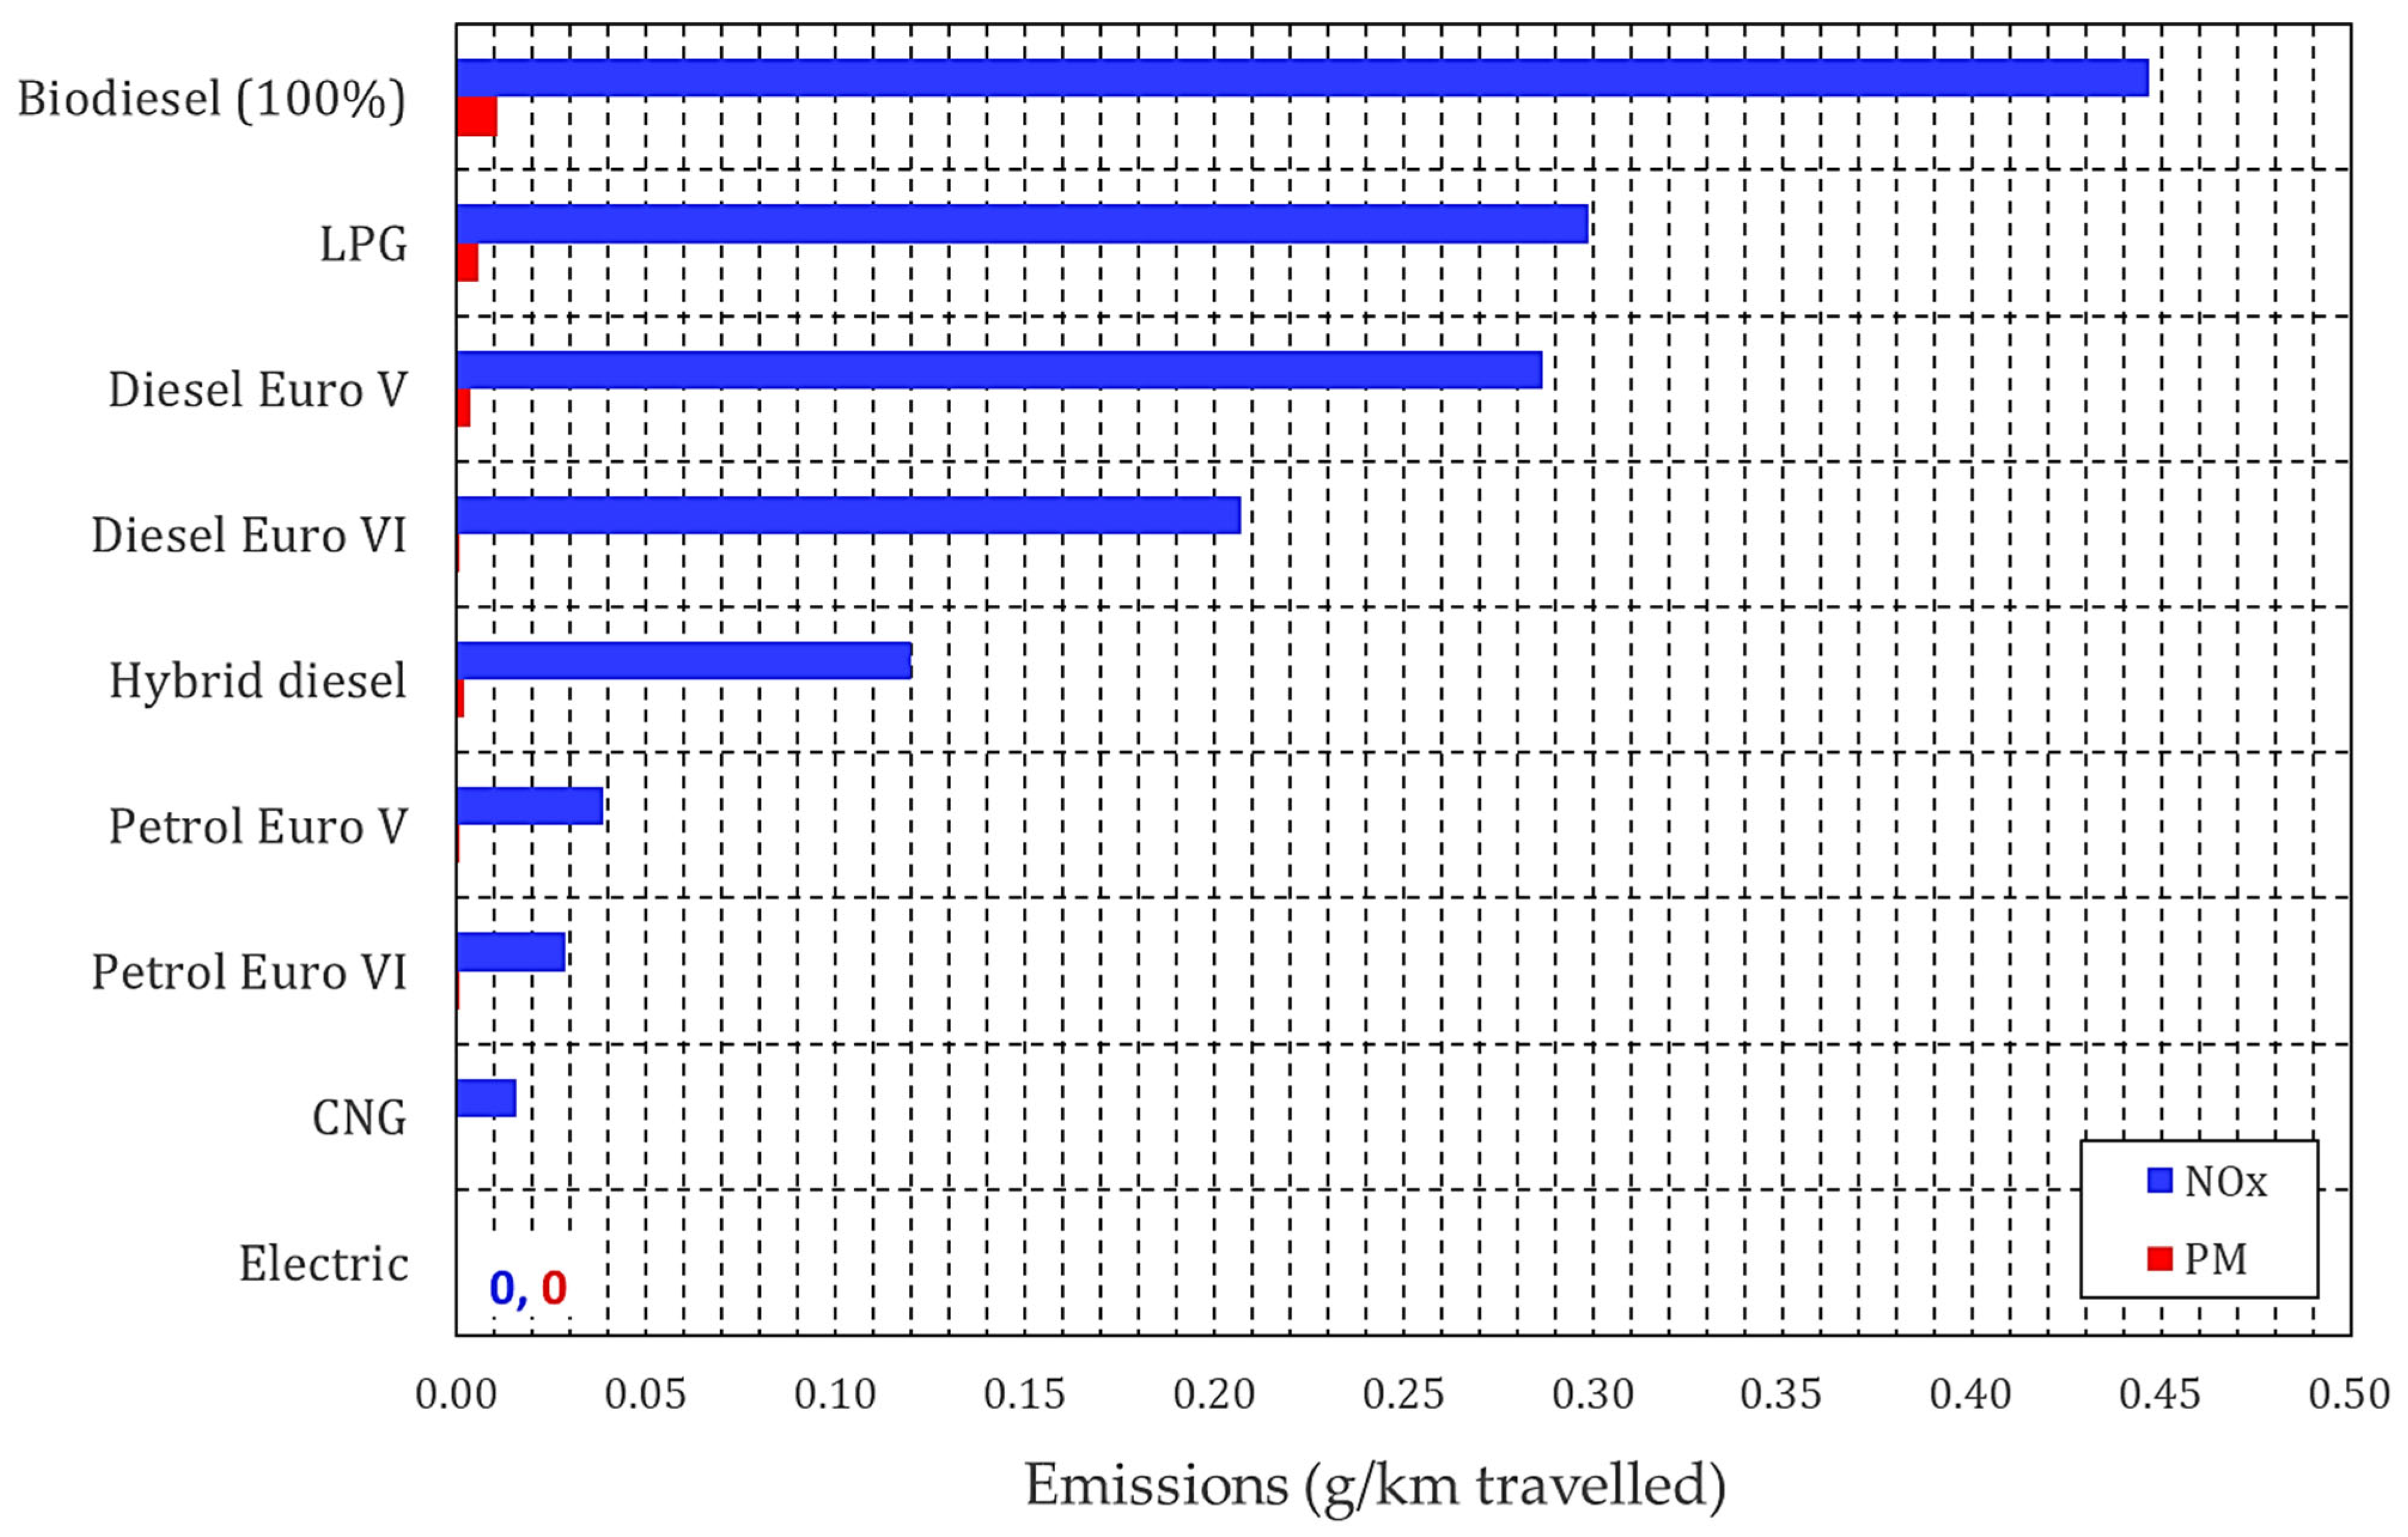
3.1. NOx and Particulate Emissions
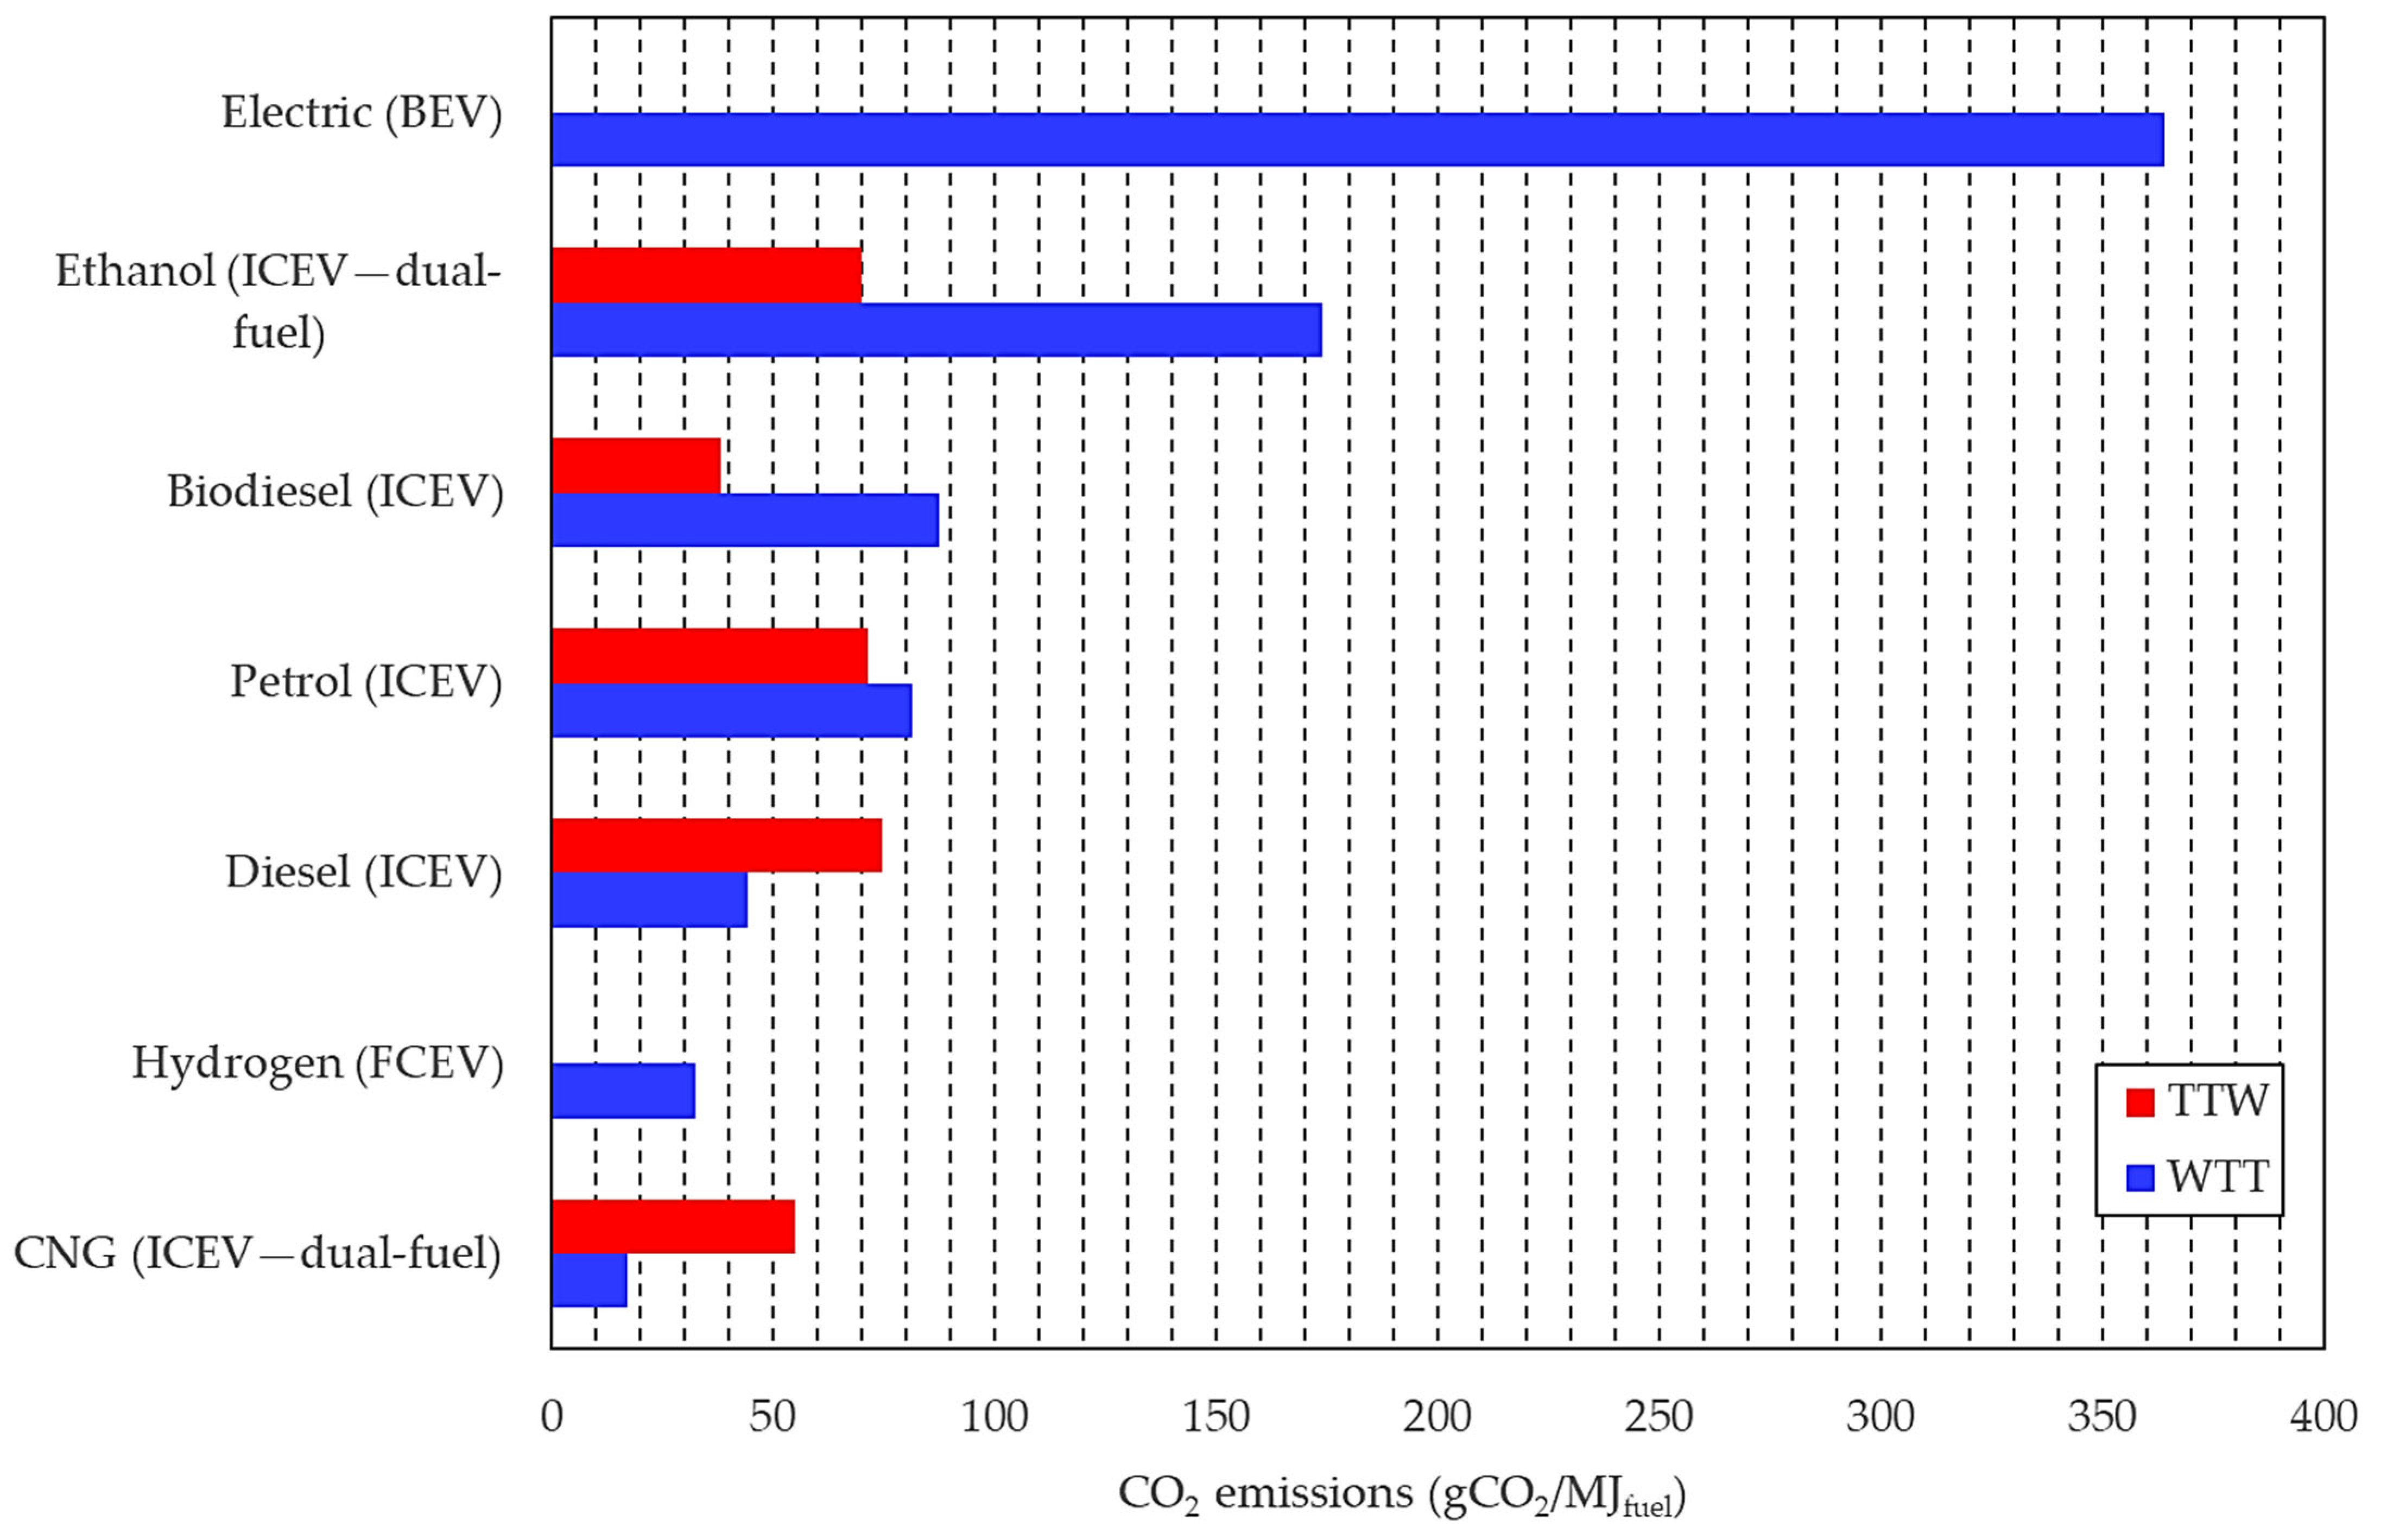
A reduction in NOx and PM emissions is observed when using NGVs, in comparison to diesel and petrol vehicles that run on different specifications, as well as diesel-hybrid vehicles, Liquid Propane Gas (LPG), and 100% biodiesel-run vehicles. This can be seen in Figure 3, where the values refer to standard operational conditions (i.e., traffic distribution of 60% urban, 20% rural, and 20% highways) and a weight from 1400 to 2000 kg for conventional cars. The different diesel and petrol specifications (Euro V and Euro VI) are emission standards introduced by the European Commission to restrict vehicle emissions. For biodiesel, average European conditions are assumed (rapeseed is regarded as the most important raw material for the production of biodiesel).
The same trend in Figure 3 is observed in dual-fuel engines, as discussed in Section 2. Even when a blend of fuels is used (i.e., not 100% natural gas), the peak combustion temperature of the engine is reduced, which, in turn, reduces NOx and PM emissions, improving air quality [36,37,39,40]. This is also seen in MD/HDVs, like trucks and buses, where NGVs are a more cost-effective NOx reduction strategy than their diesel (or electric) counterparts [40,41]. Namely, NOx emissions are seen to be reduced by around 30%, carbon soot by 88%, and CO2 by 33% [42].
However, it has been suggested that NGVs and, in particular, NGVs that run on CNG, produce large numbers of ultrafine particles (as small as 2.5 nm), which are currently not taken into account in PM measurements. NGVs (especially the ones that run on CNG) produce a low mass of PM emissions, but a large number of particles, as the particles themselves are small in mass (less than 2.5 nm in diameter) but large in numbers [43,44,45]. If these particles were included in the measurements, the number of PM emissions would increase by 100–500 times for LDVs and MDVs and up to 100% for HDVs [43,46,47]. NGVs are also seen to emit a large amount of ammonia (20 mg/km for LDVs and 66 mg/km for MDVs) [43,45]. As 1 mg of ammonia is estimated to form 1 mg of particle pollution, ammonia emissions from NGVs can contribute significantly to PM air pollution. Currently, an ammonia emission limit does not exist for LDVs, and the MD/HDV limit is set at 4.5 mg/km [48]. Specific emission limits for diesel and petrol LDVs and HDVs, as per Euro 6, are detailed in Table 4 [49], as well as for EVs and NGVs. Hydrogen FCEVs have no tailpipe emissions; hence, no regulations are included. It is evident that ammonia, nitrous oxide, and ultrafine particulates are the main recurring emissions that are still unregulated, as mentioned above (HDVs excluded for ammonia). It has been speculated that Euro 7 emission standards will mirror the existing limits of Euro 6. However, issues with NOx emissions and particle size/emissions are likely to be addressed, and more focus will be given on reducing non-exhaust emissions, such as particulate matter in brake dust and microplastics in tires [50].
Figure 3. Comparison of NOx and particulate matter emissions [51,52]. Reproduced with permission from [Engerer H. and Horn M.], [Energy Policy]; published by [Elsevier], [2010].
Energies 18 03512 g003

3.2. CO2 Emissions

As mentioned previously, natural gas produces the least CO2 emissions in comparison to the other conventional fossil fuels (diesel and petrol). Several studies have been undertaken to quantify the difference in CO2 emissions between NGVs and conventional-fuelled vehicles; the majority were summarised in [29]. On average, a 25% reduction in CO2 emissions is observed on a WTW basis, i.e., all emissions from production, transportation, and combustion by the vehicle, when replacing petrol LDVs with CNG. In addition, no lead or sulphide is present in NGV exhausts, and carbon monoxide (CO) is reduced by 70–80% [37,39].
Vehicle WTW emissions can be differentiated into two main categories: well-to-tank (WTT), accounting for emissions in fuel production and transportation, affected by the origin of the fuel and the sustainability of the supply chain, and tank-to-wheel (TTW), accounting for emissions from the vehicle itself, affected by fuel economy and the carbon content of the fuel. Some other subcategories found in the literature include pump-to-tank (PTT), which accounts for emissions from the storage and delivery of the fuel, well-to-pump (WTP), which is a subdivision of WTT, and pump-to-wheel (PTW), which is a combination of PTT and TTW [38,53]. Taking the transport distance of the fuel as an example for WTT emissions, CNG has the lowest CO2 emissions in comparison to diesel and petrol only when transported less than 4000 km to its refuelling station, as tabulated in Table 5. As the distance transported increases beyond that, the emissions exceed those of diesel and petrol [29]. A country with an established natural gas grid will therefore not experience these extra WTT emissions from transportation (and added costs, as well as extra traffic), as there will be no need for road tankers to transport the fuel to the refuelling stations [54,55]. TTW emissions have a set target by the EU; namely, for 2020–2024, the target was 95 gCO2/km. From 2025 onwards, there will be stricter EU-wide fleet targets: 93.6 g/km until 2029, 49.5 g/km from 2030 to 2034, and 0 g/km from 2035 [56].
WTT emissions vary depending on the source of fuel, transportation, storage, distribution, etc. Several studies examining WTT emissions were summarised by [57] and are tabulated as an average in Figure 4, distinguishing emissions between CNG- and LNG-powered NGVs and conventional fuels (diesel and petrol). The different pathways for CNG and LNG include various transportation distances between countries and whether the natural gas was imported or not; different sources of the natural gas, depending on the location and how remote it is; and whether liquefaction has taken place, which ultimately adds WTT emissions to LNG-fuelled vehicles. The petrol and diesel pathway values were taken from [58]. As seen in Figure 4, WTT emissions from LNG-fuelled NGVs are higher (more than 200%) than those from CNG-fuelled NGVs, as well as those from conventional-fuelled vehicles (diesel and petrol). This primarily stems from the fact that some studies included in the LNG average account for WTT emissions from pathways that include long-distance transportation of the fuel. For example, some of these studies include LNG that has been imported to Germany from Qatar and transported inland to either a close truck stop for liquefaction or to a remote production site. On the other hand, studies with lower LNG WTT emissions include pathways with liquefaction at the import terminal or smaller-scale liquefaction sites, hence reducing transport emissions. CNG WTT emissions are inherently lower as no liquefaction is necessary; however, regasification will also increase WTT emissions. Grid connections will reduce WTT emissions for both fuels, as on-road transportation of the fuel is no longer needed. It is therefore understood that liquefaction increases WTT emissions for LNG NGVs, and the mode and distance of transport add WTT emissions regardless of the fuel. However, it seems that LNG and CNG are not able to compete with petrol and diesel in WTT emissions, as CNG is the only fuel that has average WTT emissions just below those of the conventional fuels.
WTT emissions can aid in elucidating the importance of any emissions during the energy production stage, which is particularly important for EVs (i.e., the production of the electricity that is used for charging) [41]. Some EVs, depending on the type (as explained in Table 3), have only WTT emissions (no internal combustion engine, hence, no greenhouse gas emissions accounting for TTW). For HEVs and PHEVs, some TTW emissions will be present, depending on the vehicle and fuel used. Focusing on the WTT emissions of BEVs in Romania, in comparison to the source of the electricity produced (biomass, coal, gas, hydro, nuclear, solar wind), the highest emissions occurred when the main source of power was coal, gas, and biomass (46.87% of total power), whereas the lowest occurred when 71.32% of the total came from hydro, nuclear, solar, and wind power plants [48]. FCEVs also exhibit only WTT emissions, depending on the production method of hydrogen. They have a lot of other benefits when compared to conventional-fuelled vehicles, including higher efficiencies in conversion of energy to work (60% vs. 20–30%); reduced noise pollution; waste production is only limited to water and heat; and a significant reduction in greenhouse gas emissions by 50–90% compared to petrol vehicles, depending on how the hydrogen was produced [59,60].
Figure 5 illustrates the effect of the different production methods of hydrogen on CO2 emissions. The highest CO2 emissions were identified for hydrogen that was obtained via the gasification of coal, and the lowest CO2 emissions were identified for hydro-powered electrolysis, followed by nuclear-powered electrolysis [59]. Even though these renewable resources produce no emissions during electrolysis, other emissions are also taken into account when calculating WTT emissions, e.g., plant installation and construction; hence, the value is not zero. The different hydrogen production methods have a great impact on WTT emissions, thus making the comparison between these vehicles very case-specific [61]. As a benchmark, around 65% of the greenhouse gas emissions associated with hydrogen FCEVs come from the vehicle manufacturing stage, whereas 45% of the conventional fuel emissions come from vehicle use [62].
WTW emissions include TTW (and PTW) emissions, as explained above. A WTW analysis was undertaken by [63] (lifecycle analysis, also known as cradle-to-grave) to quantify the amount of CO2 emitted per kilometre for different vehicles, including projections for future emissions when different technological improvements were implemented. Several different types of vehicles were included, i.e., internal combustion energy vehicles (ICEVs) using petrol, diesel, CNG, and ethanol (E85—85% ethanol with 15% petrol); HEVs with petrol and PHEVs with 30% petrol and 70% electricity (PHEV35 has a 50 mile on-road electric range); H2 FCEVs with 300 and 400 mile on-road driving ranges, respectively; and BEVs with 200, 300, and 400 mile on-road driving ranges, respectively. Future technological advancements included renewable sources of electricity (wind/solar), steam methane reforming for the production of hydrogen, carbon capture and storage (CCS), etc. For the full list, the reader is referred to [63]. As seen in Figure 6, BEVs are shown to have the lowest emissions in comparison to HEVs, PHEVs, and CNG dual/bi-fuel vehicles (around 20–100 gCO2/km less, depending on the vehicle type). All different types of electric LDVs exhibit lower life cycle emissions than CNG-powered vehicles (around 40–60 gCO2/km less) [45,52]. However, petrol HEVs are close to BEVs and PHEVs in emissions (especially the longer-driving-range ones), and, taking into consideration that they are a more established technology in today’s world, they are not easy to dominate [64].
The same trend as in Figure 6 is seen in MD/HDVs as well, with BEVs showing the least emissions, followed by diesel hybrids and then CNG-powered vehicles [65]. However, these studies [64,65] considered BEVs that source their electricity from plants that burn natural gas and employ CCS strategies. This, in turn, makes BEV emission reductions even more substantial when compared to conventional fuel production facilities: around a 68% reduction both for LDVs and MD/HDVs [64,65]. As an example, it is interesting to note that when EVs use electricity from natural gas-powered plants, their WTW emissions differ even when different turbine efficiencies are considered (values vary between 20 and 80 gCO2/km) [60].
Hydrogen FCEVs have been considered as powertrain and bus alternatives [66,67,68]. A study carried out in China [66] analysed the WTW lifecycle emissions of various hydrogen FCEV powertrains with different storage and supply systems (pipeline, compressed hydrogen, liquid hydrogen, and liquid organic hydrogen carrier) and compared them with those of a conventional vehicle powertrain. It was found that all supply systems examined, with the exception of liquid hydrogen, showed lower carbon emissions than BEV and conventional vehicle powertrains. Based on another case study in Zhangjiakou, North China, it was estimated that the substitution of all diesel buses by hydrogen fuel cell transit buses could reduce approximately 17,524 tonnes of CO2 by 2035 [67]. Another study, in Australia, assessed the environmental and economic lifecycle impacts of alternative fuels for powertrains and compared the WTT and TTW emissions between a selection of fuels, as shown in Figure 7 [68].
Both FCEVs with hydrogen and BEVs show no TTW emissions, as expected. However, the electric powertrain technology shows the highest overall emissions, with the total emissions attributed to only WTT emissions. FCEVs with hydrogen powertrain technology show the least total emissions, followed by CNG technology powertrains. It is important to note that the electricity mix used by the BEV powertrain was generated from 85% fossil fuels and 15% renewables, with coal taking the biggest share of around 63% [68]. This reinforces the idea that the source of electricity has a great effect on emissions for EVs (both LDVs and MD/HDVs, as well as powertrains). The manufacturing stage of EVs also adds to the WTT emissions; around 10–70% of the total emissions are attributed to manufacturing. EVs tend to also have higher NOx and SO2 WTT emissions, which occur at the power plant that produces the electricity they run on. These can increase by 120% and 370%, respectively, when EVs are used, but they are reduced by 18% and 22%, respectively, when using NGV technology [69]. As an overall remark, any technology that requires the use of fossil fuels (especially coal) to generate either the electricity needed for EVs or hydrogen for FCEVs will ultimately result in higher WTW emissions, even though TTW emissions are always on the lower end in comparison to conventional technologies.
It is important to mention that NGVs exhibit methane leakages (also called fugitive emissions) throughout the entire natural gas supply chain, affecting both WTT and TTW emissions. Namely, around 41% of US methane leaks stem from gas production [70]. Leaks and intentional venting during production and processing occur at natural gas wells [71,72], processing plants [73], and during transmission through pipelines (WTP emissions) [74,75]. This can include malfunctioning equipment, routine wear, rust, corrosion, and intentional releases/venting [70]. In addition, methane can “slip” through the engine and exhaust system uncombusted [76,77,78], as well as from the vehicle’s fuel system and tanks. Quantification of methane slip can be challenging because of the intermittent nature of these leaks. However, as summarised by [77], the range of the methane loss rate can be as wide as 0.4–9.6%. These values are noticeably higher than EPA’s official inventory estimates (around 60% higher), suggesting a national loss rate of 2.3% of the gross gas production. Methane leaks were reported to account for 2Mt of the total methane leaks in 2024 [79]. These leaks can have potential negative effects on the WTW emissions of NGVs; namely, at a mean methane loss rate of 1.8% from production, CNG trucks offer about a 6% reduction in emissions compared to diesel. However, if the leakage rate exceeds 2.5%, CNG trucks become “worse than diesel ones from a climate perspective” [80].

4. Discussion

The viability of NGVs as a transitional technology hinges on multifaceted factors beyond emission reductions, including economic feasibility and infrastructure readiness, as summarised in Table 6. This section synthesises findings from the comparative assessment while addressing four interrelated dimensions: economic implications, infrastructure requirements, emission trade-offs, and transitional pathways. Non-financial barriers, such as public scepticism and technological unfamiliarity, further complicate adoption. Effective communication strategies and pilot programs targeting public transport fleets emerge as critical tools for building trust and demonstrating reliability. By contextualising these challenges within regional energy policies and global climate targets, this discussion provides a roadmap for optimising NGV integration into sustainable transportation systems.

4.1. Economic Implications

The shift to NGVs does not solely depend on the environmental impact; economic impact plays a significant role in the introduction and implementation of any technology. It has been established that NGVs can be bought as a new vehicle using either CNG or, in some more rare cases, LNG [22]; a new vehicle with a dual-fuel configuration (both petrol and CNG on board, choosing which one to burn at a time) [24]; and an existing vehicle that has its engine retrofitted to burn a blend of CNG and diesel (bi-fuel) to assist ignition [22,24,36].
These alternatives leave buyers with higher costs in comparison to other conventional vehicles and thus can be a deterrent. Even though CNG fuel prices may be lower (see Figure 2, Table 6), fluctuations and the uncertainty that a new technology poses to the potential user are enough to deter the public from making such an investment. This is also true for other new technologies, including hydrogen FCEVs. Government subsidies and increased taxation on conventional fuels have been seen as a solution for minimising these costs [23,29,30,31,32]. Newer technologies must be competitive enough in comparison to the traditional technologies available. For example, in Europe, diesel is the most popular fuel used for LDVs throughout the continent because of its economics and established technology [29]. Therefore, a strong policy and continued support by the government are fundamental in order for NGVs (or any AFV) to become a competitive alternative [22,29,51,64]. Any absence or removal of these subsidies can result in market failure [22] due to fiscal unsustainability. For instance, an artificially created monopoly, due to ineffectively coordinated subsidies and government spending, can be a reason for market failure [95]. In addition, in Pakistan, an over-reliance on heavily subsidised natural gas for vehicles led to severe domestic gas shortages, which crippled other sectors and forced the government to ration NGV supply, demonstrating how unsustainable subsidies can lead to systemic issues and market collapse [96].
Historically, successful NGV implementation programmes have entailed governmental market-creation programs that include (1) mandatory conversion to or procurement of government fleets and urban buses that run on alternative fuels or (2) mandatory targets for the achievement of a particular market penetration rate of NGVs within a specific time frame [23]. MD/HDNGVs can therefore be used as an introductory technology, in the public transport sector, in order to initially test their adaptability in the economy and acceptance by the public. This initial introduction will allow the public to become familiar with the technology and thus obtain momentum for further LDNGV investment [29], if the economy has the infrastructure to support it in the first place.
This is seen in the USA, where about 15,000 NGV buses are currently used in public transport [51]. Additionally, Egypt’s Clean Fuels Initiative has incentivised the public, taxi companies, and bus fleet owners to convert their vehicles to CNG vehicles using incentives like five-year tax holidays for CNG companies, low-cost conversion charges, and heavily subsidised CNG fuel [97,98]. The Petroleum and Mineral Resources Ministry of Egypt has also launched a policy that aims to have 1 million vehicles overall running on natural gas within the coming 3 years. Moreover, they place great importance on increasing their fuelling station number to 1000 [97]. This ultimately makes NGVs more accessible and has been proven to be a key parameter in NGV market growth. Several international case studies have shown that a too-low fuelling station-to-vehicle ratio leads to an unprofitable NGV refuelling infrastructure and represents one of the main barriers to NGV market growth. Examples include New Zealand, Switzerland, and Canada, where their NGV markets failed after achieving a considerable successful start [30,97].
India is a country where the introduction of NGVs was pushed as an emission and pollution reduction policy. This introduction is heavily motivated by Court rulings aiming to improve local air quality. Specifically, Delhi has taken several initiatives to encourage NGV growth, including lower interest on loans for the purchase of CNG three-wheelers and taxis; VAT subsidies to replace old diesel LDVs by CNG vehicles; full exemption of CNG for automotive use from sales tax; and taxation of diesel fuel (USD 0.006/L) to fund clean transportation subsidies [29]. The fact that the National Urban Transport Policy has also developed several NGV public bus transport programmes has created more momentum in NGV investments in the long term [29].
These policy and incentive examples elucidate the fact that in order for NGVs to become a competitive technology and cost-effective for the public, the National regulatory framework plays the most important role, especially if higher initial costs are an issue [22]. Lower fuel costs, lower initial costs, and lower payback times when purchasing or modifying an existing vehicle can be the result of subsidies or price caps, and they should be employed by the government in order for NGVs to be successful.

4.2. Infrastructure Implications

Infrastructure and available natural gas grid connections play a significant role in making NGVs accessible to the public. The absence of an established natural gas grid makes the implementation of NGVs seem a very far-fetched idea. The need to implement this technology can be a motivation to construct a natural gas grid, as seen in Brazil and India [23,29]. As another example, Iran has seen an expansion in its grid, driven by the government’s ambition to reduce dependency on oil, avoid regional shortages of gas, and promote industrialisation and employment [29,99]. However, it is important to note that each country must implement their own market research and economic evaluation of such an undertaking to assess its viability and profitability.
Building an NGV refuelling station (either LNG or CNG) carries a lot of costs for the investor. Namely, a fast-fill CNG station may cost anywhere from USD 1.2 to 1.8 million in a developed country [22,87,88]. One way to minimise this cost is to implement modular additions to existing conventional refuelling stations, allowing the grid to expand at a higher rate. This was seen in Pakistan, where 50% of the natural gas refuelling stations were upgraded from the existing diesel/petrol stations [22]. The absence of a grid will ultimately increase WTT emissions, as the fuel will have to travel to the refuelling stations via trucks [38]. However, the size of a country and the distances between refuelling stations can make WTT emissions differ substantially. Smaller distances result in fewer WTT emissions when transporting the fuel. In addition, the availability of domestic natural gas also reduces both costs and emissions, as there will be no need to import natural gas from other countries. This alleviates the running costs of NGVs (cheaper fuel) and WTT emissions, as fuel transportation is minimised [29,57].

4.3. Emission Implications

In terms of WTW emissions, NGVs may not be able to compete with electric or hydrogen-fuelled cars, even though their TTW emissions are lower than conventional-fuelled vehicles. The distance natural gas is transported to the refuelling station and the carbon content of natural gas, as well as the origin of the electricity used by EVs and the WTT emissions of hydrogen FCEVs, all have an effect on WTW emissions and make the comparison very complicated and study-specific. It has been shown that if the electricity used by EVs is produced in plants using mostly fossil fuels, their WTW emissions are higher than those of NGVs [63]. If, however, the electricity is generated from natural gas or even renewable energy, the WTW emissions of EVs are lower than those of NGVs [55].
It has been discussed that NGVs may pose a particulate matter and ammonia emission issue that is not currently regulated—see Section 3.1. NGVs are reported to emit ultrafine particles (<2.5 nm), which are 100–500 times more numerous than diesel particulates. Ammonia emissions from LDNGVs are reported to be around 15 times higher than the MD/HDV limit, and an LDV limit does not currently exist. Without regulatory action, widespread NGV adoption could increase ambient PM2.5 by 8–12% in urban centres. Mitigation is therefore required in order for this issue to be addressed. Such mitigation examples may include retrofitting particulate filters rated for sub-10 nm particles; real-world emission testing protocols, extending beyond current NEDC/WLTP cycles; and updating particulate emission limits to include ultrafine particles and creating ammonia limits for LDVs.
In addition, methane leaks are a challenging topic to quantify, and they can affect the WTW emissions of NGVs substantially. The methane loss rate can reach up to a maximum of 9.6% [77,100], hence negating or even overwriting the emission reductions achieved by NGVs and, overall, reducing or even eliminating the climate benefits of using natural gas as a transportation fuel. Further research and quantification have to be undertaken for more robust and standardised methane measurement and reporting across the natural gas supply chain [101]. The quantification of methane leaks is vital as it directly influences climate policies, emission limits, and the true environmental benefits of natural gas as a transportation fuel.

4.4. Other Transitional Pathways

NGVs can also run on biomethane from biogas. This is particularly important in light of the current energy transition, as WTW emissions can be further reduced when utilising NGV infrastructure for biomethane integration. Firstly, the use of organic waste, which naturally decomposes in landfills, will eliminate the extra release of methane into the atmosphere. Biogas systems capture this methane, producing biogas. This can lead to very low, near-zero, or even negative WTW greenhouse gas emissions for biomethane as a transport fuel, depending on the feedstock and overall system efficiency [102,103,104,105,106]. In addition, the use of biomethane displaces the use of conventional fossil fuels, hence mitigating their upstream emissions of production, extraction, and transportation (WTT emissions). This aligns with the goals of a circular economy, as waste is used as a resource. In addition, this achieves decentralised energy production, as biomethane plants can be scaled and located close to feedstock sources.
Europe is an interesting region to analyse in terms of biomethane production and consequent application in NGVs, as several such initiatives already exist [29]. Sweden is such an example, where transport accounts for about 31% of the national CO2 emissions; hence, targets were set to reduce these emissions by at least 70% from 2010 levels by 2030 [107]. For the first half of 2018, 90% of the gas used in transport was biomethane [108]. Some off-grid plants (Linköping Biogas, Arlanda Airport) are also being used to produce biogas, supplying fuel to bus and public refuelling stations [109]. Several Swedish cities have their own programs regarding biomethane use, including farmers applying a waste-to-energy project to produce biogas for public transport and gas companies cooperating with municipalities to back up deficits from biogas production plants using sewage sludge and organic household and food industry waste as a feedstock [29]. Austria, the Netherlands, and Germany are also countries that either have biogas and biomethane projects connected directly to the natural gas grid or aim to upgrade their existing plants to produce biomethane [29,110].
Natural gas can also be mixed with hydrogen to a certain extent in order to reduce CO2 emissions even further, as the hydrogen-to-carbon ratio is increased, ranging from 20 to 30% [111,112,113,114,115]. NOx emissions are also seen to decrease with increasing hydrogen amounts [116]. However, WTT emissions still depend on how the hydrogen is produced, leading back to the issues discussed in Section 3.2 regarding hydrogen FCEVs. In addition, the extent of the emission reductions may not be large. Namely, it has been seen that a 15–85% blend (hydrogen to natural gas) may result in a reduction of 15% of CO2 emissions [117], or even as low as 6% [118]. The most important consideration seems to be WTT emissions and how these can be reduced based on the production methods of hydrogen.
Lastly, natural gas has also been considered as the source of hydrogen in FCEVs, produced via methane reforming [19,119,120,121]. Issues with WTT emissions also arise here, with the source of methane, as well as transportation of hydrogen, affecting the emissions. Overall, any other transitional pathway to NGV usage or other forms of natural gas utilisation has to be considered thoroughly before application. Emissions are one of the most important parameters that have to be quantified, as well as distinguishing WTT and TTW from WTW emissions. Infrastructure implications have to be taken into consideration [122], as well as trading issues and other technical constraints [123].
The above transitional pathways allow for natural gas to effectively take the role of a bridge fuel, hence aligning with long-term decarbonisation goals. NGVs can complement hydrogen FCEVs and EVs in phased energy transitions, particularly in regions with mature gas infrastructure. As already discussed in Section 2 and Section 4.2, areas with extensive natural gas pipeline networks and distribution systems can quickly connect to new refuelling stations. This existing infrastructure significantly reduces the immediate need for massive, new investments in an entirely new energy infrastructure, for example, a new widespread hydrogen pipeline network or a significantly upgraded electricity grid solely for heavy-duty EV charging. Hence, the expansion of refuelling stations can be a quicker, less capital-intensive, and more cost-effective way to reduce emissions in the short to medium term, compared to waiting for a full build-out of hydrogen or dedicated EV charging infrastructure, especially for heavy-duty transport. In addition, these existing natural gas pipelines (and, effectively, the refuelling stations) can be used to transport blends of natural gas and hydrogen (typically up to 5–20% hydrogen by volume [124,125,126]). This allows for the gradual introduction of hydrogen into the energy system without immediately building entirely new, dedicated hydrogen pipelines, even though such an endeavour can entail other technical and operational issues both in the existing grid and end-use appliances [125,126,127,128]. However, several successful pilot projects in countries like the UK, Italy, Germany, and the US have employed blending up to 20% [129,130,131]. Lastly, the natural gas grid, with its storage facilities, can offer flexibility and storage capacity that complements intermittent renewable electricity generation (wind, solar) for powering EVs.

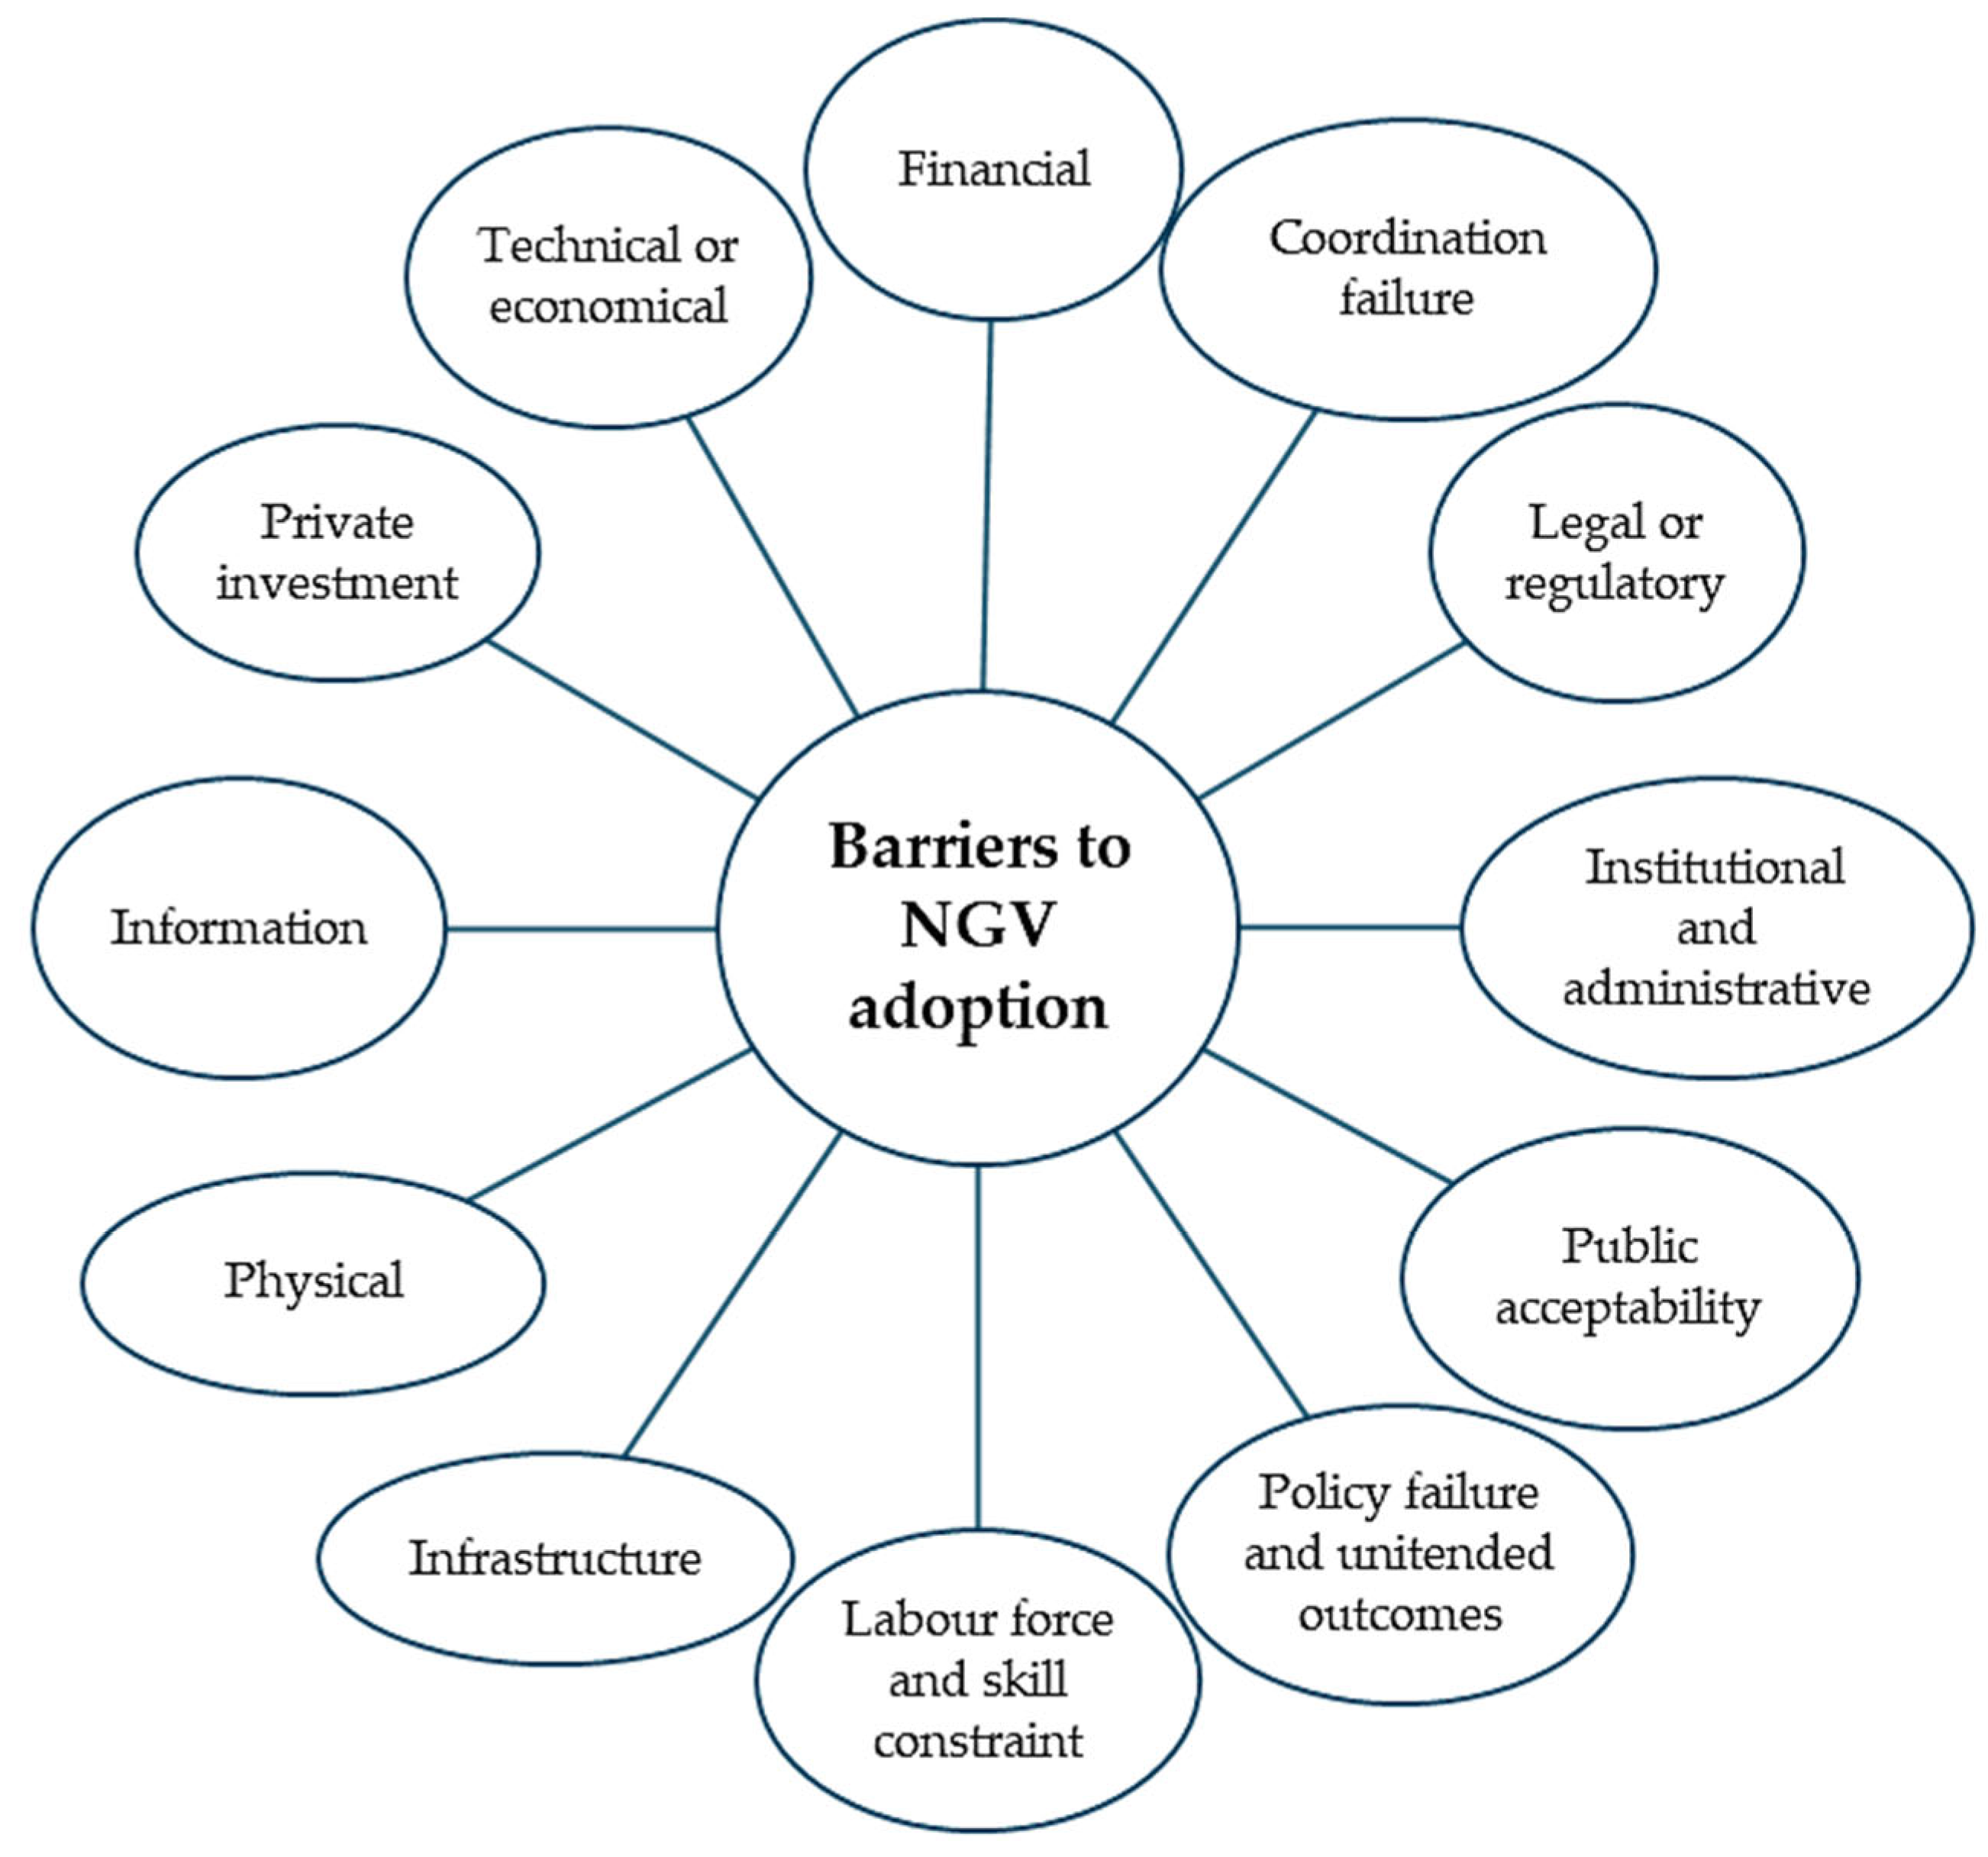
4.5. Public Perception and Barriers to NGV Adoption

Identifying any non-financial barriers to NGV implementation prior to actual implementation is crucial in understanding how a market will operate and/or accept a new technology. A comprehensive summary of these barriers is illustrated in Figure 8 [22,132].
Excluding financial barriers, the lack of information is one of the major barriers. The key information barriers include vehicle total cost of ownership, uncertainty in costs and durability for vehicle buyers, and uncertainty in fuelling needs [22]. Addressing these gaps requires strategies with a top-down approach implemented in the form of a main website, as well as a bottom-down approach featuring a domestic network for support between NGV owners [22]. This needs to be constantly regulated by governmental bodies to address recurring issues and update information. In addition, public acceptability is another crucial factor that has a big impact on NGV implementation. Public acceptability can be influenced by economic gains, safety, improved performance of the vehicle, and easy access to maintenance and refuelling stations. These can be mitigated by constant awareness campaigns and advertisement, as the public has been proven to rely on experience, emotions, media, and other non-technical information [22,133].
Lastly, private investment barriers in infrastructure and refuelling stations can also hinder the NGV market. As explained by [132], information limitations related to product, investment and return possibilities are among the key barriers. This can be resolved by governmental support in down payments for both infrastructure developers and buyers, limiting information risk for end users, and monetising tax compatibility [22,132].

5. Conclusions

Based on the comprehensive analysis presented in this manuscript, Natural Gas Vehicles have demonstrated their potential as a viable transitional technology in the pursuit of sustainable transportation systems. The environmental performance analysis reveals that NGVs can achieve approximately 25% reduced CO2 emissions compared to conventional-fuelled vehicles on a well-to-wheel basis while simultaneously delivering substantial reductions in NOx and particulate matter emissions. However, these environmental benefits are fundamentally contingent upon the source and type of natural gas utilised, with notable performance variations between compressed natural gas (CNG) and liquefied natural gas (LNG) applications.
The comparative assessment against alternative vehicle technologies demonstrates that while electric and hydrogen-fuelled vehicles exhibit superior emission reduction potential under optimal operational conditions, their environmental benefits remain highly dependent on electricity generation sources and hydrogen production methods, respectively. This dependency creates a scenario where the comparative advantage of alternative vehicle technologies becomes highly case-specific and contextual, emphasising the importance of regional energy infrastructure considerations in technology selection.
The feasibility of NGV implementation emerges as a multifaceted challenge influenced by existing natural gas infrastructure, economic considerations, and various non-financial barriers. Countries possessing established natural gas grid systems demonstrate distinct advantages in NGV deployment capabilities, while economic viability continues to hinge on supportive fiscal policies designed to offset higher initial vehicle costs against the backdrop of lower operational expenses. The analysis clearly indicates that governmental intervention represents the critical determining factor in successful NGV adoption across different markets.
Policy frameworks encompassing subsidies, tax incentives, and infrastructure development have proven successful in various international contexts, including Egypt, India, and Sweden, particularly when implementation strategies target public transport fleets as an introductory mechanism. These demonstrate the importance of coordinated governmental approaches that address both economic barriers and infrastructure development simultaneously.
This research identifies several critical areas requiring immediate attention for successful NGV deployment. Addressing public perception barriers through comprehensive information campaigns and ensuring sustained infrastructure investment through dedicated governmental support will be essential components in maximising the potential of NGVs as a transitional technology toward sustainable transportation systems within country-specific operational contexts. The analysis emphasises that effective implementation must consider regional variations in natural gas availability, existing infrastructure capacity, and local economic conditions.
Furthermore, the investigation reveals that NGVs can serve as an effective bridge technology in the broader context of energy transition, particularly when integrated with biomethane pathways and hydrogen blending strategies. The potential for utilising existing natural gas infrastructure to support future hydrogen distribution networks presents significant opportunities for optimising capital investment efficiency while advancing decarbonisation objectives.
While NGVs may not represent the ultimate solution for transportation decarbonisation, they offer immediate and practical emission reduction opportunities in regions with appropriate infrastructure foundations. The success of NGV implementation requires coordinated policy frameworks that address economic barriers, infrastructure development, and public acceptance challenges while maintaining focus on long-term sustainability objectives within the broader energy transition paradigm.

Author Contributions

Conceptualization, E.H. and A.P.; methodology, E.H. and A.P.; investigation, E.H. and A.P.; data curation, E.H. and A.P.; writing—original draft preparation, E.H. and A.P.; writing—review and editing, E.H. and A.P.; visualization, E.H. and A.P.; supervision, A.P. All authors have read and agreed to the published version of the manuscript.

Funding

This research received no external funding.

Conflicts of Interest

The authors declare no conflict of interest.

References

  1. Solomon, B.D.; Krishna, K. The coming sustainable energy transition: History, strategies, and outlook. Energy Policy 2011, 39, 7422–7431. [Google Scholar] [CrossRef]
  2. Kudasik, M.; Kozieł, K.; Anioł, Ł.; Pajdak, A. Assessment of the Potential for CO2-Enhanced Shale Gas Recovery: Studies on CO2/CH4 Exchange in Shales. Energy Fuels 2025, 39, 11187–11200. [Google Scholar] [CrossRef]
  3. Li, Y.; Xu, Y. Recent advances in tight oil reservoir development: Integrated technology of horizontal drilling and hydraulic fracturing. Adv. Resour. Res. 2024, 4, 300–317. [Google Scholar] [CrossRef]
  4. Qadrdan, M.; Johnson, M.R.J.; Mohammed, A.S. A review on hydrogen blending into existing natural gas pipeline infrastructure. Can. J. Chem. Eng. 2021, 99, 359–373. [Google Scholar] [CrossRef]
  5. Bondarenko, A.V.; Islamov, S.R.; Ignatyev, K.V.; Mardashov, D.V. Laboratory investigation of polymer compositions for well killing in fractured reservoirs. Perm J. Pet. Min. Eng. 2020, 20, 37–48. [Google Scholar] [CrossRef]
  6. Belousov, A.; Lushpeev, V.; Sokolov, A.; Sultanbekov, R.; Tyan, Y.; Ovchinnikov, E.; Shvets, A.; Bushuev, V.; Islamov, S. Experimental Research of the Possibility of Applying the Hartmann–Sprenger Effect to Regulate the Pressure of Natural Gas in Non-Stationary Conditions. Processes 2025, 13, 1189. [Google Scholar] [CrossRef]
  7. Thalassinos, E.; Kadłubek, M.; Thong, L.M.; Van Hiep, T.; Ugurlu, E. Managerial Issues Regarding the Role of Natural Gas in the Transition of Energy and the Impact of Natural Gas Consumption on the GDP of Selected Countries. Resources 2022, 11, 42. [Google Scholar] [CrossRef]
  8. Gillessen, B.; Heinrichs, H.; Hake, J.-F.; Allelein, H.-J. Natural gas as a bridge to sustainability: Infrastructure expansion regarding energy security and system transition. Appl. Energy 2019, 251, 113377. [Google Scholar] [CrossRef]
  9. GASVESSEL. Natural Gas vs. Coal—A Positive Impact on the Environment. Available online: https://www.gasvessel.eu/news/natural-gas-vs-coal-impact-on-the-environment/ (accessed on 19 March 2025).
  10. Zhao, S.; Lu, J.; Yan, J.; Wu, H.; Guan, C. Energy transition in China: It is necessary to increase natural gas utilization. Energy Rep. 2023, 10, 2439–2447. [Google Scholar] [CrossRef]
  11. Reji, A.K.; Das, B.; Ray, T.K.; Boral, E. Assessment of compressed natural gas as an alternative transportation fuel in reducing CO2 emission: A case of Agartala city. Environ. Dev. Sustain. 2025. [Google Scholar] [CrossRef]
  12. Mądziel, M. Modelling CO2 Emissions from Vehicles Fuelled with Compressed Natural Gas Based on On-Road and Chassis Dynamometer Tests. Energies 2024, 17, 1850. [Google Scholar] [CrossRef]
  13. International Energy Agency. Global Gas Security Review 2024. 2024. Available online: https://www.iea.org/reports/global-gas-security-review-2024 (accessed on 18 June 2025).
  14. International Energy Agency. Gas Market Report, Q1-2025. 2025. Available online: https://www.iea.org/reports/gas-market-report-q1-2025/executive-summary (accessed on 18 June 2025).
  15. Organization of the Petroleum Exporting Countries. Annual Statistical Bulletin 2024. 2024. Available online: https://publications.opec.org/asb/chapter/show/123/2160 (accessed on 18 June 2025).
  16. Villicaña-García, E.; Ponce-Ortega, J.M. Sustainable strategic planning for a national natural gas energy system accounting for unconventional sources. Energy Convers. Manag. 2019, 181, 382–397. [Google Scholar] [CrossRef]
  17. Mac Kinnon, M.A.; Brouwer, J.; Samuelsen, S. The role of natural gas and its infrastructure in mitigating greenhouse gas emissions, improving regional air quality, and renewable resource integration. Prog. Energy Combust. Sci. 2018, 64, 62–92. [Google Scholar] [CrossRef]
  18. Graczyk, A.; Graczyk, A.; Węgrzyn, A. Change in natural gas utilisation in the context of sustainable energy management in Poland. Econ. Environ. 2023, 84, 51–75. [Google Scholar] [CrossRef]
  19. Ghoneim, S.A.; El-Salamony, R.A.; El-Temtamy, S.A. Review on Innovative Catalytic Reforming of Natural Gas to Syngas. World J. Eng. Technol. 2016, 4, 116–139. [Google Scholar] [CrossRef]
  20. Khan, M.N.; Cloete, S.; Amini, S. Efficient Production of Clean Power and Hydrogen Through Synergistic Integration of Chemical Looping Combustion and Reforming. Energies 2020, 13, 3443. [Google Scholar] [CrossRef]
  21. Rodat, S.; Abanades, S. A Hybrid Windowless Dual Tube Solar Reactor for Continuous Volumetric Natural Gas Dissociation. Front. Energy Res. 2020, 8, 206. [Google Scholar] [CrossRef]
  22. Khan, M.I. Identifying and addressing barriers for the sustainable development of natural gas as automotive fuel. Int. J. Hydrogen Energy 2017, 42, 25453–25473. [Google Scholar] [CrossRef]
  23. Yeh, S. An empirical analysis on the adoption of alternative fuel vehicles: The case of natural gas vehicles. Energy Policy 2007, 35, 5865–5875. [Google Scholar] [CrossRef]
  24. US Department of Energy, Alternative Fuels Data Center. Natural Gas Vehicles. Available online: https://afdc.energy.gov/vehicles/natural-gas (accessed on 18 June 2025).
  25. Khan, M.I. Policy options for the sustainable development of natural gas as transportation fuel. Energy Policy 2017, 110, 126–136. [Google Scholar] [CrossRef]
  26. Aslam, M.; Masjuki, H.; Kalam, M.; Abdesselam, H.; Mahlia, T.; Amalina, M. An experimental investigation of CNG as an alternative fuel for a retrofitted gasoline vehicle. Fuel 2006, 85, 717–724. [Google Scholar] [CrossRef]
  27. Sagar, S.; Agarwal, A.K. Experimental validation of accuracy of dynamic hydrogen-compressed natural gas mixing system using a single cylinder spark ignition engine. Int. J. Hydrogen Energy 2016, 41, 14272–14282. [Google Scholar] [CrossRef]
  28. Chala, G.T.; Aziz, A.R.A.; Hagos, F.Y. Natural Gas Engine Technologies: Challenges and Energy Sustainability Issue. Energies 2018, 11, 2934. [Google Scholar] [CrossRef]
  29. International Energy Agency. The Contribution of Natural Gas Vehicles to Sustainable Transport. 2010. Available online: https://www.iea.org/reports/the-contribution-of-natural-gas-vehicles-to-sustainable-transport (accessed on 19 March 2025).
  30. Janssen, A.; Lienin, S.F.; Gassmann, F.; Wokaun, A. Model aided policy development for the market penetration of natural gas vehicles in Switzerland. Transp. Res. Part A Policy Pract. 2006, 40, 316–333. [Google Scholar] [CrossRef]
  31. Neandross, E. Developments in the U.S. L-NGV Market. In Proceedings of the “LNG is HOT: Opportunities, Challenges & Strategies as a Vehicle Fuel” Conference, Gladstein, Neandross and Associates (GNA), Brussels, Belgium, December 2009. [Google Scholar]
  32. US Department of Energy, Alternative Fuels Data Center. Fuel Prices, Alterative Fuel Price Report. 2024. Available online: https://afdc.energy.gov/fuels/prices.html (accessed on 24 March 2025).
  33. International Gas Union. Natural Gas Vehicles: The Sustainable Road Towards a Clean Planet, WOC 5.3—Study Group Report, 2012–2015 Trienniun Work Reports. 2015. Available online: http://members.igu.org/old/IGU%20Events/wgc/wgc-2015/committee-reports-with-thematic-sessions/woc-5-3-paper.pdf (accessed on 18 June 2025).
  34. Pipeline Technology Journal. India to Expand Natural Gas Pipeline Network by Nearly 11,000 km. 2025. Available online: https://www.pipeline-journal.net/news/india-expand-natural-gas-pipeline-network-nearly-11000-km (accessed on 22 April 2025).
  35. The State Council, The People’s Republic of China. 2024: China Builds over 4,000 Kilometers of New Oil, Gas Pipelines. 2024. Available online: https://english.www.gov.cn/news/202412/03/content_WS674eb8f7c6d0868f4e8ed9f7.html (accessed on 23 April 2025).
  36. Khan, M.I.; Yasmeen, T.; Farooq, M.; Wakeel, M. Research progress in the development of natural gas as fuel for road vehicles: A bibliographic review (1991–2016). Renew. Sustain. Energy Rev. 2016, 66, 702–741. [Google Scholar] [CrossRef]
  37. Liu, L.; Zhang, M.; Liu, Z. A Review of Development of Natural Gas Engines. Int. J. Automot. Manuf. Mater. 2023, 2, 4. [Google Scholar] [CrossRef]
  38. Poullikkas, A. Sustainable options for electric vehicle technologies. Renew. Sustain. Energy Rev. 2015, 41, 1277–1287. [Google Scholar] [CrossRef]
  39. Lejda, K.; Jaworski, A.; Mądziel, M.; Balawender, K.; Ustrzycki, A.; Savostin-Kosiak, D. Assessment of Petrol and Natural Gas Vehicle Carbon Oxides Emissions in the Laboratory and On-Road Tests. Energies 2021, 14, 1631. [Google Scholar] [CrossRef]
  40. Seisler, J.M. Development of the NGV Market and Infrastructure in the US; ABEGAS Brazil Gas Pipeline Association: Rio De Janeiro, Brazil, 2019; Available online: https://www.abegas.org.br/wp-content/uploads/2019/03/04-Development-of-the-NGV-Market-Jeffrey-Seisler-CLEAN-FUELS.pdf (accessed on 18 June 2025).
  41. Hesterberg, T.W.; Lapin, C.A.; Bunn, W.B. A Comparison of Emissions from Vehicles Fueled with Diesel or Compressed Natural Gas. Environ. Sci. Technol. 2008, 42, 6437–6445. [Google Scholar] [CrossRef]
  42. Romanyuk, V.; Likhanov, V.; Lopatin, O. Reducing the environmental threat of motor vehicles by converting engines for operating on natural gas. Theor. Appl. Ecol. 2018, 3, 27–32. [Google Scholar] [CrossRef]
  43. Transport & Environment. Compressed Natural Gas Vehicles Are Not a Clean Solution for Transport. 2020. Available online: https://www.transportenvironment.org/uploads/files/2020_06_TE_CNG_particle_report.pdf (accessed on 18 June 2025).
  44. Samaras, Z.C.; Andersson, J.; Bergmann, A.; Hausberger, S.; Toumasatos, Z.; Keskinen, J.; Haisch, C.; Kontses, A.; Ntziachristos, L.D.; Landl, L.; et al. Measuring Automotive Exhaust Particles Down to 10 nm. SAE Int. J. Adv. Curr. Pract. Mobil. 2020, 3, 539–550. [Google Scholar] [CrossRef]
  45. Suarez-Bertoa, R.; Valverde, V.; Clairotte, M.; Pavlovic, J.; Giechaskiel, B.; Franco, V.; Kregar, Z.; Astorga, C. On-road emissions of passenger cars beyond the boundary conditions of the real-driving emissions test. Environ. Res. 2019, 176, 108572. [Google Scholar] [CrossRef] [PubMed]
  46. Giechaskiel, B.; Lähde, T.; Drossinos, Y. Regulating particle number measurements from the tailpipe of light-duty vehicles: The next step? Environ. Res. 2019, 172, 1–9. [Google Scholar] [CrossRef] [PubMed]
  47. Giechaskiel, B. Solid Particle Number Emission Factors of Euro VI Heavy-Duty Vehicles on the Road and in the Laboratory. Int. J. Environ. Res. Public Health 2018, 15, 304. [Google Scholar] [CrossRef]
  48. Suarez-Bertoa, R. Current non-regulated emissions in EU. In Proceedings of the Integer Emissions Summit & AdBlue® Europe 2019, Munich, Germany, 25–27 June 2019. [Google Scholar]
  49. International Council on Clean Transportation. A Technical Summary of Euro 6/VI Vehicle Emission Standards. 2016. Available online: https://theicct.org/sites/default/files/publications/ICCT_Euro6-VI_briefing_jun2016.pdf (accessed on 16 May 2025).
  50. ICER Brakes. Normativa Euro 7. 2024. Available online: https://www.icerbrakes.com/en/News/Detail/Normativa-Euro-7 (accessed on 16 May 2025).
  51. Engerer, H.; Horn, M. Natural gas vehicles: An option for Europe. Energy Policy 2010, 38, 1017–1029. [Google Scholar] [CrossRef]
  52. PriceWarterhouseCoopers. Impact Assessment on a New Approach for the Cleaner and More Energy Efficient Vehicles Directive Proposal. Final Report to the European Commission. Directorate General Energy and Transport. September 2007. Available online: https://transport.ec.europa.eu/document/download/9241c27e-818e-4edf-b2d9-b0ac14a8286a_en?filename=2007_ia_dir_clean_efficient_vehicles.pdf (accessed on 16 May 2025).
  53. Spiers, J.; Balcombe, P.; Blomerus, P.; Stettler, M.; Brandon, N.; Hawkes, A. Can Natural Gas Reduce Emissions from Transport? Heavy Goods Vehicles and Shipping; Sustainable Gas Institute, Imperial College London: London, UK, 2019; Available online: https://www.arbitrage-maritime.org/CAMP-V3/fr/Gazette/G49complement/gnl.pdf (accessed on 23 April 2025).
  54. The Oxford Institute for Energy Studies; Le Fevre, C.N. A Review of Prospects for Natural Gas as a Fuel in Road Transport. 2019. Available online: https://www.oxfordenergy.org/publications/review-prospects-natural-gas-fuel-road-transport/ (accessed on 24 April 2025).
  55. SNAM. Corporate Responsibility and Social Innovation 2017 Sustainability Report. 2017. Available online: https://reports.snam.it/2017/sustainability-report/servicepages/downloads.html (accessed on 24 April 2025).
  56. European Environment Agency. CO2 Emissions Performance of New Passenger Cars in Europe. 2024. Available online: https://www.eea.europa.eu/en/analysis/indicators/co2-performance-of-new-passenger#:~:text=For%20the%20years%202020%2D2024,is%20illustrated%20in%20Figure%201 (accessed on 13 May 2025).
  57. Hagos, D.A.; Ahlgren, E.O. Well-to-wheel assessment of natural gas vehicles and their fuel supply infrastructures—Perspectives on gas in transport in Denmark. Transp. Res. Part D Transp. Environ. 2018, 65, 14–35. [Google Scholar] [CrossRef]
  58. Joint Research Centre (JRC). Well-to-Wheels Analysis of Future Automotive Fuels and Powertrains in the European Context, Version 4.a. January 2014. Available online: https://publications.jrc.ec.europa.eu/repository/handle/JRC85326 (accessed on 3 June 2025).
  59. Dulău, L.-I. CO2 Emissions of Battery Electric Vehicles and Hydrogen Fuel Cell Vehicles. Clean Technol. 2023, 5, 696–712. [Google Scholar] [CrossRef]
  60. Curran, S.J.; Wagner, R.M.; Graves, R.L.; Keller, M.; Green, J.B. Well-to-wheel analysis of direct and indirect use of natural gas in passenger vehicles. Energy 2014, 75, 194–203. [Google Scholar] [CrossRef]
  61. Halder, P.; Babaie, M.; Salek, F.; Shah, K.; Stevanovic, S.; Bodisco, T.A.; Zare, A. Performance, emissions and economic analyses of hydrogen fuel cell vehicles. Renew. Sustain. Energy Rev. 2024, 199, 114543. [Google Scholar] [CrossRef]
  62. Hienuki, S.; Mitoma, H.; Ogata, M.; Uchida, I.; Kagawa, S. Environmental and energy life cycle analyses of passenger vehicle systems using fossil fuel-derived hydrogen. Int. J. Hydrogen Energy 2021, 46, 36569–36580. [Google Scholar] [CrossRef]
  63. Kelly, J.; Elgowainy, A.; Isaac, R.; Ward, J.; Islam, E.; Rousseau, A.; Sutherland, I.; Wallington, T.; Alexander, M.; Muratori, M.; et al. Cradle-to-Grave Lifecycle Analysis of U.S. Light-Duty Vehicle-Fuel Pathways: A Greenhouse Gas Emissions and Economic Assessment of Current (2020) and Future (2030–2035) Technologies. 2023. Available online: https://greet.anl.gov/publication-c2g_lca_us_ldv (accessed on 10 April 2025).
  64. Tong, F.; Jaramillo, P.; Azevedo, I.M.L. Comparison of Life Cycle Greenhouse Gases from Natural Gas Pathways for Light-Duty Vehicles. Energy Fuels 2015, 29, 6008–6018. [Google Scholar] [CrossRef]
  65. Tong, F.; Jaramillo, P.; Azevedo, I.M.L. Comparison of Life Cycle Greenhouse Gases from Natural Gas Pathways for Medium and Heavy-Duty Vehicles. Environ. Sci. Technol. 2015, 49, 7123–7133. [Google Scholar] [CrossRef] [PubMed]
  66. Li, Y.; Taghizadeh-Hesary, F. The economic feasibility of green hydrogen and fuel cell electric vehicles for road transport in China. Energy Policy 2022, 160, 112703. [Google Scholar] [CrossRef]
  67. Zhang, G.; Zhang, J.; Xie, T. A solution to renewable hydrogen economy for fuel cell buses—A case study for Zhangjiakou in North China. Int. J. Hydrogen Energy 2020, 45, 14603–14613. [Google Scholar] [CrossRef]
  68. Sharma, A.; Strezov, V. Life cycle environmental and economic impact assessment of alternative transport fuels and power-train technologies. Energy 2017, 133, 1132–1141. [Google Scholar] [CrossRef]
  69. Huo, H.; Zhang, Q.; Liu, F.; He, K. Climate and Environmental Effects of Electric Vehicles versus Compressed Natural Gas Vehicles in China: A Life-Cycle Analysis at Provincial Level. Environ. Sci. Technol. 2013, 47, 1711–1718. [Google Scholar] [CrossRef]
  70. EPA. Estimates of Methane Emissions by Segment in the United States. 2025. Available online: https://www.epa.gov/natural-gas-star-program/estimates-methane-emissions-segment-united-states (accessed on 18 June 2025).
  71. Harris, S.J.; Schwietzke, S.; France, J.L.; Salinas, N.V.; Fernandez, T.M.; Randles, C.; Guanter, L.; Irakulis-Loitxate, I.; Calcan, A.; Aben, I.; et al. Methane emissions from the Nord Stream subsea pipeline leaks. Nature 2025, 637, 1124–1130. [Google Scholar] [CrossRef]
  72. de Bruin, G.; de Stigter, H.; Diaz, M.; Delre, A.; Velzeboer, I.; Versteijlen, N.; Niemann, H.; Wilpshaar, M.; Reichart, G. Methane leakage from abandoned wells in the Dutch North Sea. Mar. Pet. Geol. 2024, 171, 107184. [Google Scholar] [CrossRef]
  73. Jia, W.; Jia, P.; Gu, L.; Ren, L.; Zhang, Y.; Chen, H.; Wu, X.; Feng, W.; Cai, J. Quantification of methane emissions from typical natural gas stations using on-site measurement technology. J. Pipeline Sci. Eng. 2025, 5, 100229. [Google Scholar] [CrossRef]
  74. Weller, Z.D.; Hamburg, S.P.; von Fischer, J.C. A National Estimate of Methane Leakage from Pipeline Mains in Natural Gas Local Distribution Systems. Environ. Sci. Technol. 2020, 54, 8958–8967. [Google Scholar] [CrossRef]
  75. Jayarathne, J.R.R.N.; Zimmerle, D.; Kolodziej, R.S.; Riddick, S.; Smits, K.M. Flow and Transport of Methane from Leaking Underground Pipelines: Effects of Soil Surface Conditions and Implications for Natural Gas Leak Classification. Environ. Sci. Technol. Lett. 2024, 11, 539–545. [Google Scholar] [CrossRef]
  76. Schramm, J.; Methane Emission Control (AMF Annex 51). IEA Advanced Motor Fuels Technology Collaboration Programme. 2022. Available online: https://iea-amf.org/app/webroot/files/file/Annex%20Reports/AMF_Annex_51.pdf (accessed on 18 June 2025).
  77. Alvarez, R.A.; Zavala-Araiza, D.; Lyon, D.R.; Allen, D.T.; Barkley, Z.R.; Brandt, A.R.; Davis, K.J.; Herndon, S.C.; Jacob, D.J.; Karion, A.; et al. Assessment of methane emissions from the U.S. oil and gas supply chain. Science 2018, 361, 186–188. [Google Scholar] [CrossRef] [PubMed]
  78. Hmiel, B.; Petrenko, V.V.; Dyonisius, M.N.; Buizert, C.; Smith, A.M.; Place, P.F.; Harth, C.; Beaudette, R.; Hua, Q.; Yang, B.; et al. Preindustrial 14CH4 indicates greater anthropogenic fossil CH4 emissions. Nature 2020, 578, 409–412. [Google Scholar] [CrossRef] [PubMed]
  79. International Energy Agency. Global Methane Tracker 2025. 2025. Available online: https://www.iea.org/reports/global-methane-tracker-2025 (accessed on 18 June 2025).
  80. The International Council on Clean Transportation. How Upstream Methane Leakage Further Weakens the Argument for Natural Gas Trucks. 2025. Available online: https://theicct.org/how-upstream-methane-leakage-further-weakens-the-argument-for-natural-gas-trucks-jan25/ (accessed on 18 June 2025).
  81. Energy Education. Natural Gas Vehicle Fuel Storage. 2024. Available online: https://energyeducation.ca/encyclopedia/Natural_gas_vehicle_fuel_storage#cite_ref-3 (accessed on 2 May 2025).
  82. ET Design & Build. CNG Conversion Costs. Available online: https://etdesignbuild.com/cng-conversion-costs/ (accessed on 2 May 2025).
  83. Government Fleet, Mika Shelley. Exploring the Total Cost of CNG. 2013. Available online: https://www.government-fleet.com/152764/exploring-the-total-cost-of-cng (accessed on 2 July 2025).
  84. Zito, P.; Salerno, S.; Potential Demand and Cost-Benefit Analysis of Electric Cars. European Transport/Trasporti Europei, ISTIEE, Institute for the Study of Transport within the European Economic Integration. 2004, Volume 27, pp. 1–14. Available online: http://hdl.handle.net/10077/5842 (accessed on 2 May 2025).
  85. van den Bulk, J. A Cost- and Benefit Analysis of Combustion Cars, Electric Cars and Hydrogen Cars in The Netherlands; Wageningen UR: Wageningen, The Netherlands, 2009; Available online: https://refman.energytransitionmodel.com/publications/1930 (accessed on 2 May 2025).
  86. Creti, A.; Kotelnikova, A.; Meunier, G.; Ponssard, J.P. A Cost Benefit Analysis of Fuel Cell Electric Vehicles. 2015. Available online: https://hal.science/hal-01116997v1 (accessed on 2 May 2025).
  87. Smith, M.; John Gonzales, J. Costs Associated with Compressed Natural Gas Vehicle Fuelling Infrastructure; US Department of Energy: Washington, DC, USA, 2014. Available online: http://www.afdc.energy.gov/uploads/publication/cng_infrastructure_costs.pdf (accessed on 2 May 2025).
  88. Mitchell, G. Building a Business Case for Compressed Natural Gas in Fleet Applications; National Renewable Energy Laboratory, U.S. Department of Energy: Golden, CO, USA, 2015. Available online: http://www.nrel.gov/docs/fy15osti/63707.pdf (accessed on 2 May 2025).
  89. IEA. Global EV Outlook 2023; IEA: Paris, France, 2023; Available online: https://www.iea.org/reports/global-ev-outlook-2023 (accessed on 19 June 2025).
  90. EV Boosters. The State of Public EV Charging: China, Europe, and U.S. Compared. 2024. Available online: https://evboosters.com/ev-charging-news/the-state-of-public-ev-charging-china-europe-and-u-s-compared/ (accessed on 19 June 2025).
  91. Ludwig-Bölkow-Systemtechnik (LBST); TÜV SÜD. Milestone Reached: Over 1000 Hydrogen Refuelling Stations in Operation Worldwide in 2024. 2025. Available online: https://www.tuvsud.com/-/jssmedia/global/pdf-files/press-and-media/2025/february/022b_lbst_hydrogen-refuelling-stations_statistik_en.pdf (accessed on 19 June 2025).
  92. U.S. Department of Energy. DOE Hydrogen Program Record 21002: Hydrogen Fueling Stations Cost. 2021. Available online: https://www.hydrogen.energy.gov/docs/hydrogenprogramlibraries/pdfs/21002-hydrogen-fueling-station-cost.pdf?Status=Master (accessed on 19 June 2025).
  93. Prokopou, G.I.; Faust, J.M.; Mitsos, A.; Bongartz, D. Cost-optimal design and operation of hydrogen refueling stations with mechanical and electrochemical hydrogen compressors. Comput. Chem. Eng. 2024, 192, 108862. [Google Scholar] [CrossRef]
  94. Wu, L.; Zhu, Z.; Feng, Y.; Tan, W. Economic analysis of hydrogen refueling station considering different operation modes. Int. J. Hydrogen Energy 2023, 52, 1577–1591. [Google Scholar] [CrossRef]
  95. von Rosenstiel, D.P.; Heuermann, D.F.; Hüsig, S. Why has the introduction of natural gas vehicles failed in Germany?—Lessons on the role of market failure in markets for alternative fuel vehicles. Energy Policy 2015, 78, 91–101. [Google Scholar] [CrossRef]
  96. Chaudhury, A. Running Out of Gas? Lessons from the Natural Gas Vehicles (NGV) Market in Pakistan. 2013. Available online: https://papers.ssrn.com/sol3/papers.cfm?abstract_id=2391524 (accessed on 2 July 2025).
  97. Shaarawi, S.I.; Abutaleb, K.; Aboelmagd, A.R.; Temraz, T. Reviewing Natural Gas Vehicle Fleet Growth in Egypt: A Study of Environmentally Friendly Transportation Fuel. Egypt. J. Pet. 2024, 33, 3. [Google Scholar] [CrossRef]
  98. Christou, M.; UN Habitat. For a Better Urban Future. Available online: https://unhabitat.org/sites/default/files/download-manager-files/Module%206%20-%20Annexure%20E%20case%20study%20Cairo.pdf (accessed on 2 May 2025).
  99. IHS Cera. Global Insight, Report; IHS Cera: Cambridge, MA, USA, 2010. [Google Scholar]
  100. Cooper, J.; Balcombe, P.; Hawkes, A. The quantification of methane emissions and assessment of emissions data for the largest natural gas supply chains. J. Clean. Prod. 2021, 320, 128856. [Google Scholar] [CrossRef]
  101. United Nations Environment Programme. Methane Emissions Tracking System Proves Its Worth, but Action to Plug Leaks Must Accelerate. 2024. Available online: https://www.unep.org/news-and-stories/press-release/methane-emissions-tracking-system-proves-its-worth-action-plug-leaks (accessed on 19 June 2025).
  102. Gontaruk, Y.; Kolomiiets, T.; Honcharuk, I.; Tokarchuk, D. Production and Use of Biogas and Biomethane from Waste for Climate Neutrality and Development of Green Economy. J. Ecol. Eng. 2024, 25, 20–32. [Google Scholar] [CrossRef]
  103. Harrison, A.; Watson, M.D.; Dodds, P.E.; Brandon, N.P. Hydrogen blending and utilisation within the European gas grid—A critical review. Int. J. Hydrogen Energy 2021, 46, 27807–27827. [Google Scholar] [CrossRef]
  104. Shinde, A.M.; Dikshit, A.K.; Odlare, M.; Thorin, E.; Schwede, S. Life cycle assessment of bio-methane and biogas-based electricity production from organic waste for utilization as a vehicle fuel. Clean Technol. Environ. Policy 2021, 23, 1715–1725. [Google Scholar] [CrossRef]
  105. European Biogas Association. Biomethane as a Solution for Heavy-Duty Transport Decarbonization (EBA Policy Recommendations on the Revised CO2 Emission Standards for HDVs). 2023. Available online: https://www.europeanbiogas.eu/wp-content/uploads/2023/01/EBA-Policy-Paper-on-CO2-standards-for-HDVs.pdf (accessed on 19 June 2025).
  106. European Biogas Association. SMART CO2 STANDARDS FOR NEGATIVE EMISSIONS MOBILITY. 2021. Available online: https://www.europeanbiogas.eu/wp-content/uploads/2021/06/SMART-CO2-STANDARDS-FOR-NEGATIVE-EMISSIONS-MOBILITY.pdf (accessed on 19 June 2025).
  107. IEA. Energy Policy Review; IEA: Paris, France, 2024. [Google Scholar]
  108. BioEnergy International; Sherrard, A. Biomethane Reaches 90% Share in Swedish Vehicle Gas. 2018. Available online: https://bioenergyinternational.com/biomethane-reaches-90-share-in-swedish-vehicle-gas/ (accessed on 5 May 2025).
  109. IEA. Bioenergy Task 37, 100% Biogas for Urban Transport in Linköping, Sweden. Available online: https://www.iea-biogas.net/_download/linkoping_final.pdf (accessed on 5 May 2025).
  110. BioGas Partner. Available online: https://www.dena.de/en/biogaspartner/ (accessed on 5 May 2025).
  111. Makaryan, I.A.; Sedov, I.V.; Salgansky, E.A.; Arutyunov, A.V.; Arutyunov, V.S. A Comprehensive Review on the Prospects of Using Hydrogen–Methane Blends: Challenges and Opportunities. Energies 2022, 15, 2265. [Google Scholar] [CrossRef]
  112. McTaggart-Cowan, G.P.; Munshi, S.R.; Rogak, S.N.; Hill, P.G.; Bushe, W.K. Hydrogen-Methane Blend Fuelling of a Heavy-Duty, Direct-Injection Engine. In Proceedings of the IMECE2007 ASME International Mechanical Engineering Congress and Exposition, Seattle, WA, USA, 11–15 November 2007. [Google Scholar]
  113. McTaggart-Cowan, G.; Jones, H.; Rogak, S.; Bushe, W.; Hill, P.; Munshi, S. Direct-Injected Hydrogen-Methane Mixtures in a Heavy-Duty Compression Ignition Engine. In Proceedings of the SAE 2006 World Congress & Exhibition, Detroit, MI, USA, 3–6 April 2006. [Google Scholar] [CrossRef]
  114. De Simio, L.; Iannaccone, S.; Guido, C.; Napolitano, P.; Maiello, A. Natural Gas/Hydrogen blends for heavy-duty spark ignition engines: Performance and emissions analysis. Int. J. Hydrogen Energy 2023, 50, 743–757. [Google Scholar] [CrossRef]
  115. Mariani, A.; Morrone, B.; Unich, A. A Review of Hydrogen-Natural Gas Blend Fuels in Internal Combustion Engines, Fossil Fuel and Environment; InTech: Shanghai, China, 2012. [Google Scholar] [CrossRef]
  116. Pan, H.; Geng, S.; Yang, H.; Zhang, G.; Bian, H.; Liu, Y. Influence of H2 blending on NOx production in natural gas combustion: Mechanism comparison and reaction routes. Int. J. Hydrogen Energy 2022, 48, 784–797. [Google Scholar] [CrossRef]
  117. European Commission LIFE Public Database. Methane and Hydrogen Blend for Public City Transport Bus: Technical Demonstrative Application and Strategic Policy Measures. 2013. Available online: https://webgate.ec.europa.eu/life/publicWebsite/project/LIFE07-ENV-IT-000434/methane-and-hydrogen-blend-for-public-city-transport-bus-technical-demonstrative-application-and-strategic-policy-measures# (accessed on 5 May 2025).
  118. Frontier Group, Global Warming Solutions. Blending Hydrogen with Methane Gas is Not a Climate Solution. 2024. Available online: https://frontiergroup.org/articles/blending-hydrogen-with-methane-gas-is-not-a-climate-solution/ (accessed on 5 May 2025).
  119. Zhang, G.; Liu, J.; Xu, Y.; Sun, Y. A review of CH4CO2 reforming to synthesis gas over Ni-based catalysts in recent years (2010–2017). Int. J. Hydrogen Energy 2018, 43, 15030–15054. [Google Scholar] [CrossRef]
  120. Mohanty, U.S.; Ali, M.; Azhar, M.R.; Al-Yaseri, A.; Keshavarz, A.; Iglauer, S. Current advances in syngas (CO + H2) production through bi-reforming of methane using various catalysts: A review. Int. J. Hydrogen Energy 2021, 46, 32809–32845. [Google Scholar] [CrossRef]
  121. Molburg, J.C.; Doctor, R.D. Hydrogen from steam-methane reforming with CO2 capture. In Proceedings of the 20th Annual International Pittsburgh Coal Conference, Pittsburgh, PA, USA, 15–19 September 2003; Volume 20, pp. 1–20. [Google Scholar]
  122. Islam, A.; Alam, T.; Sheibley, N.; Edmonson, K.; Burns, D.; Hernandez, M. Hydrogen blending in natural gas pipelines: A comprehensive review of material compatibility and safety considerations. Int. J. Hydrogen Energy 2024, 93, 1429–1461. [Google Scholar] [CrossRef]
  123. Kanellopoulos, K.; Busch, S.; De Felice, M.; Giaccaria, S.; Costescu, A. Blending Hydrogen from Electrolysis into the European Gas Grid; EUR 30951 EN; Publications Office of the European Union: Luxembourg, 2022. [Google Scholar] [CrossRef]
  124. American Gas Association. Impacts of Hydrogen Blending on Gas Piping Materials. 2023. Available online: https://www.aga.org/wp-content/uploads/2023/08/Impacts-of-Hydrogen-Blending-on-Gas-Piping-Ma_.pdf (accessed on 19 June 2025).
  125. Topolski, K.; Reznicek, E.P.; Erdener, B.C.; San Marchi, C.W.; Ronevich, J.A.; Fring, L.; Simmons, K.; Fernandez, O.J.G.; Hodge, B.; Chung, M. Hydrogen Blending into Natural Gas Pipeline Infrastructure: Review of the State of Technology; National Renewable Energy Laboratory: Golden, CO, USA, 2022. Available online: https://docs.nrel.gov/docs/fy23osti/81704.pdf (accessed on 19 June 2025).
  126. Erdener, B.C.; Sergi, B.; Guerra, O.J.; Chueca, A.L.; Pambour, K.; Brancucci, C.; Hodge, B.-M. A review of technical and regulatory limits for hydrogen blending in natural gas pipelines. Int. J. Hydrogen Energy 2022, 48, 5595–5617. [Google Scholar] [CrossRef]
  127. Huang, H.; Li, J.; Sun, X.; Yu, B.; Zhang, W.; Ma, L. Influence analysis on the storage capacity of hydrogen-blended natural gas pipeline. Comput. Energy Sci. 2024, 1, 3–16. [Google Scholar] [CrossRef]
  128. Reza, A.; Buehler, C.; Carnahan, R.; Ott, B. Exponent: “Can Your Natural Gas Pipelines Handle Hydrogen Blends?” 2022. Available online: https://www.exponent.com/article/can-your-natural-gas-pipelines-handle-hydrogen-blends (accessed on 19 June 2025).
  129. First Gas. Te Horo Hydrogen Blend Project. Available online: https://firstgas.co.nz/te-horo-hydrogen-blend-project (accessed on 19 June 2025).
  130. Energy Capital Ventures. Hydrogen Blending: Advancing Green Molecules™ Through Natural Gas. Available online: https://www.energycapitalventures.com/post/hydrogen-blending-advancing-green-molecules-tm-through-natural-gas (accessed on 19 June 2025).
  131. Rinnovabili.it. Italy Tests Hydrogen-Gas Blend in Its Pipeline Network. 2025. Available online: https://www.rinnovabili.net/tech-innovations-and-startups/energy-tech-innovations-and-startups/hydrogen-gas-blend-italy-launches-5-test-in-gas-network/ (accessed on 19 June 2025).
  132. Dougherty, S.; Nigro, N. Alternative Fuel Vehicle & Fueling Infrastructure Deployment Barriers & the Potential Role of Private Sector Financial Solutions; Center for Climate and Energy Solutions, US Department of Energy: Washington, DC, USA, 2014. Available online: http://www.afdc.energy.gov/uploads/publication/afv_fueling_infrastructure_deployment_barriers.pdf (accessed on 19 June 2025).
  133. Kilbourne, W.; Pickett, G. How materialism affects environmental beliefs, concern, and environmentally responsible behavior. J. Bus. Res. 2008, 61, 885–893. [Google Scholar] [CrossRef]
Figure 1. NGV market share per continent [25]. Reproduced with permission from [Khan M.I], [Energy Policy]; published by [Elsevier], [2017].
Energies 18 03512 g001
Figure 2. Average retail fuel prices in the USA [32].
Energies 18 03512 g002
Figure 4. Average WTT CO2 emissions [57,58].
Energies 18 03512 g004
Figure 5. CO2 emissions for FCEVs considering the source of electricity [59].
Energies 18 03512 g005
Figure 6. WTW emissions of mid-size sedan vehicles [63].
Energies 18 03512 g006
Figure 7. CO2 emissions of different powertrain technologies [68].
Energies 18 03512 g007
Figure 8. Barriers to NGV adoption [22]. Reproduced with permission from [Khan M.I.], [International Journal of Hydrogen Energy]; published by [Elsevier], [2017].
Energies 18 03512 g008
Table 1. Types of Natural Gas Vehicles and specifications [24,28].
Fuel TypeEngine SpecificationsComments
CNG (compressed natural gas)Spark-ignition combustion, similar to petrol enginesCNG is stored in tank and transferred to the engine through a pressure regulator to adjust pressure. Fuel is combined with air, and the air/fuel mixture is ignited by a spark from a spark plug. Some HDVs that use CNG have a diesel-like compression–injection system.
LNG (liquefied natural gas)Spark-ignition combustion, similar to petrol enginesThe natural gas is super-cooled and cryogenically stored in liquid form, usually in a tank on the side of the truck. As it is stored as a liquid, the energy density of LNG is greater than CNG, so more fuel can be stored on board the vehicle, making it suitable for HDVs travelling long distances. The use of LNG is more complicated than CNG, and thus, it is only used in some HDVs to meet longer range requirements.
Bi-fuel (petrol or CNG)Spark-ignition combustion, similar to petrol enginesThe vehicle can use either petrol or CNG in the same internal combustion engine. Both fuels are stored on board, and the driver can switch between the fuels. The vehicle is equipped with separate fuel tanks, fuel injection systems, and fuel lines for both fuels.
Dual-fuel (CNG and diesel blend)Internal combustion engine, similar to diesel enginesA blend of the fuels is used in order to assist ignition (even as low as 90% CNG, 10% diesel). This configuration is traditionally limited to HDVs.
Table 2. Number of NGV fuelling stations per country (top 7 countries) [28].
CountryNumber of Fuelling Stations
China8400
Pakistan3416
Iran2400
Argentina2014
Brazil1805
India1424
Italy1219
Table 3. Types of electric and hydrogen-fuelled vehicles [38]. Reproduced with permission from [Poullikkas A.], [Renewable and Sustainable Energy Reviews]; published by [Elsevier], [2015].
Vehicle TypeInternal Combustion EngineBattery Charging
Hybrid Electric Vehicle (HEV)YesOn-board (internal)
Plug-In Electric Vehicle (PHEV)YesOn-board (internal) and/or external charging
Full Electric Vehicle (or Battery Electric Vehicle, BEV)NoExternal Charging
Fuel Cell Electric Vehicle (FCEV) using H2NoOn-board (internal)
Table 4. Regulated and unregulated emissions for conventional-fuelled vehicles and the AVFs included in this study. The limits stated are as per Euro 6 [49].
Vehicle TypeRegulated EmissionsUnregulated EmissionsComments
LDV—PetrolCarbon Monoxide (CO) = 1.0 g/km
Nitrogen Oxides (NOx) = 0.06 g/km
Total Hydrocarbons (HCs) = 0.10 g/km
Particulate Matter (PM) = 0.005 g/km
Particulate Number (PN) = 6 × 10¹¹/km
Nitrous oxide (N2O), ammonia (NH3), and ultrafine particles (which may be partially regulated via PN, but smaller fractions are still of concern).PM limits for gasoline are newer, primarily for direct injection engines.
LDV—DieselCO = 0.50 g/km
NOx = 0.08 g/km
HC + NOx = 0.17 g/km
PM = 0.005 g/km
PN = 6 × 10¹¹/km
N2O, NH3, Sulphur Dioxide (SO2) and ultrafine particles (which may be partially regulated via PN, but smaller fractions are still of concern).Diesel vehicles have historically faced stricter PM limits.
HDV—DieselCO = 4 g/km
NOx = 0.46 g/km
HC = 0.16 g/km
PM = 0.01 g/km
PN = 8 × 10¹¹/km
SO2 = 10 ppm
NH3 = 0.0045 g/km
N2O, ultrafine particles (which may be partially regulated via PN, but smaller fractions are still of concern), metals (from engine wear/lube oil).HDVs often have distinct and generally stricter limits because of their higher fuel consumption and mileage. They are also differentiated between steady-state and transient testing. Here, maximum values are given.
EVHybrids: When operating via an internal combustion engine (ICE). Same as comparable petrol/diesel ICE vehicles (CO, NOx, PM, PN).When operating via an ICE: same as comparable petrol/diesel ICE vehicles (NH3, N2O), SO2, ultrafine particles.PHEVs have zero emissions when running purely on electricity. BEVs produce no tailpipe emissions.
NGVSame as comparable diesel/petrol vehicles (CO, NOx, PM, PN).Same as comparable petrol/diesel ICE vehicles (NH3, N2O), SO2, ultrafine particles, CH4.While not a direct tailpipe limit, methane slip due to uncombusted natural gas is an issue.
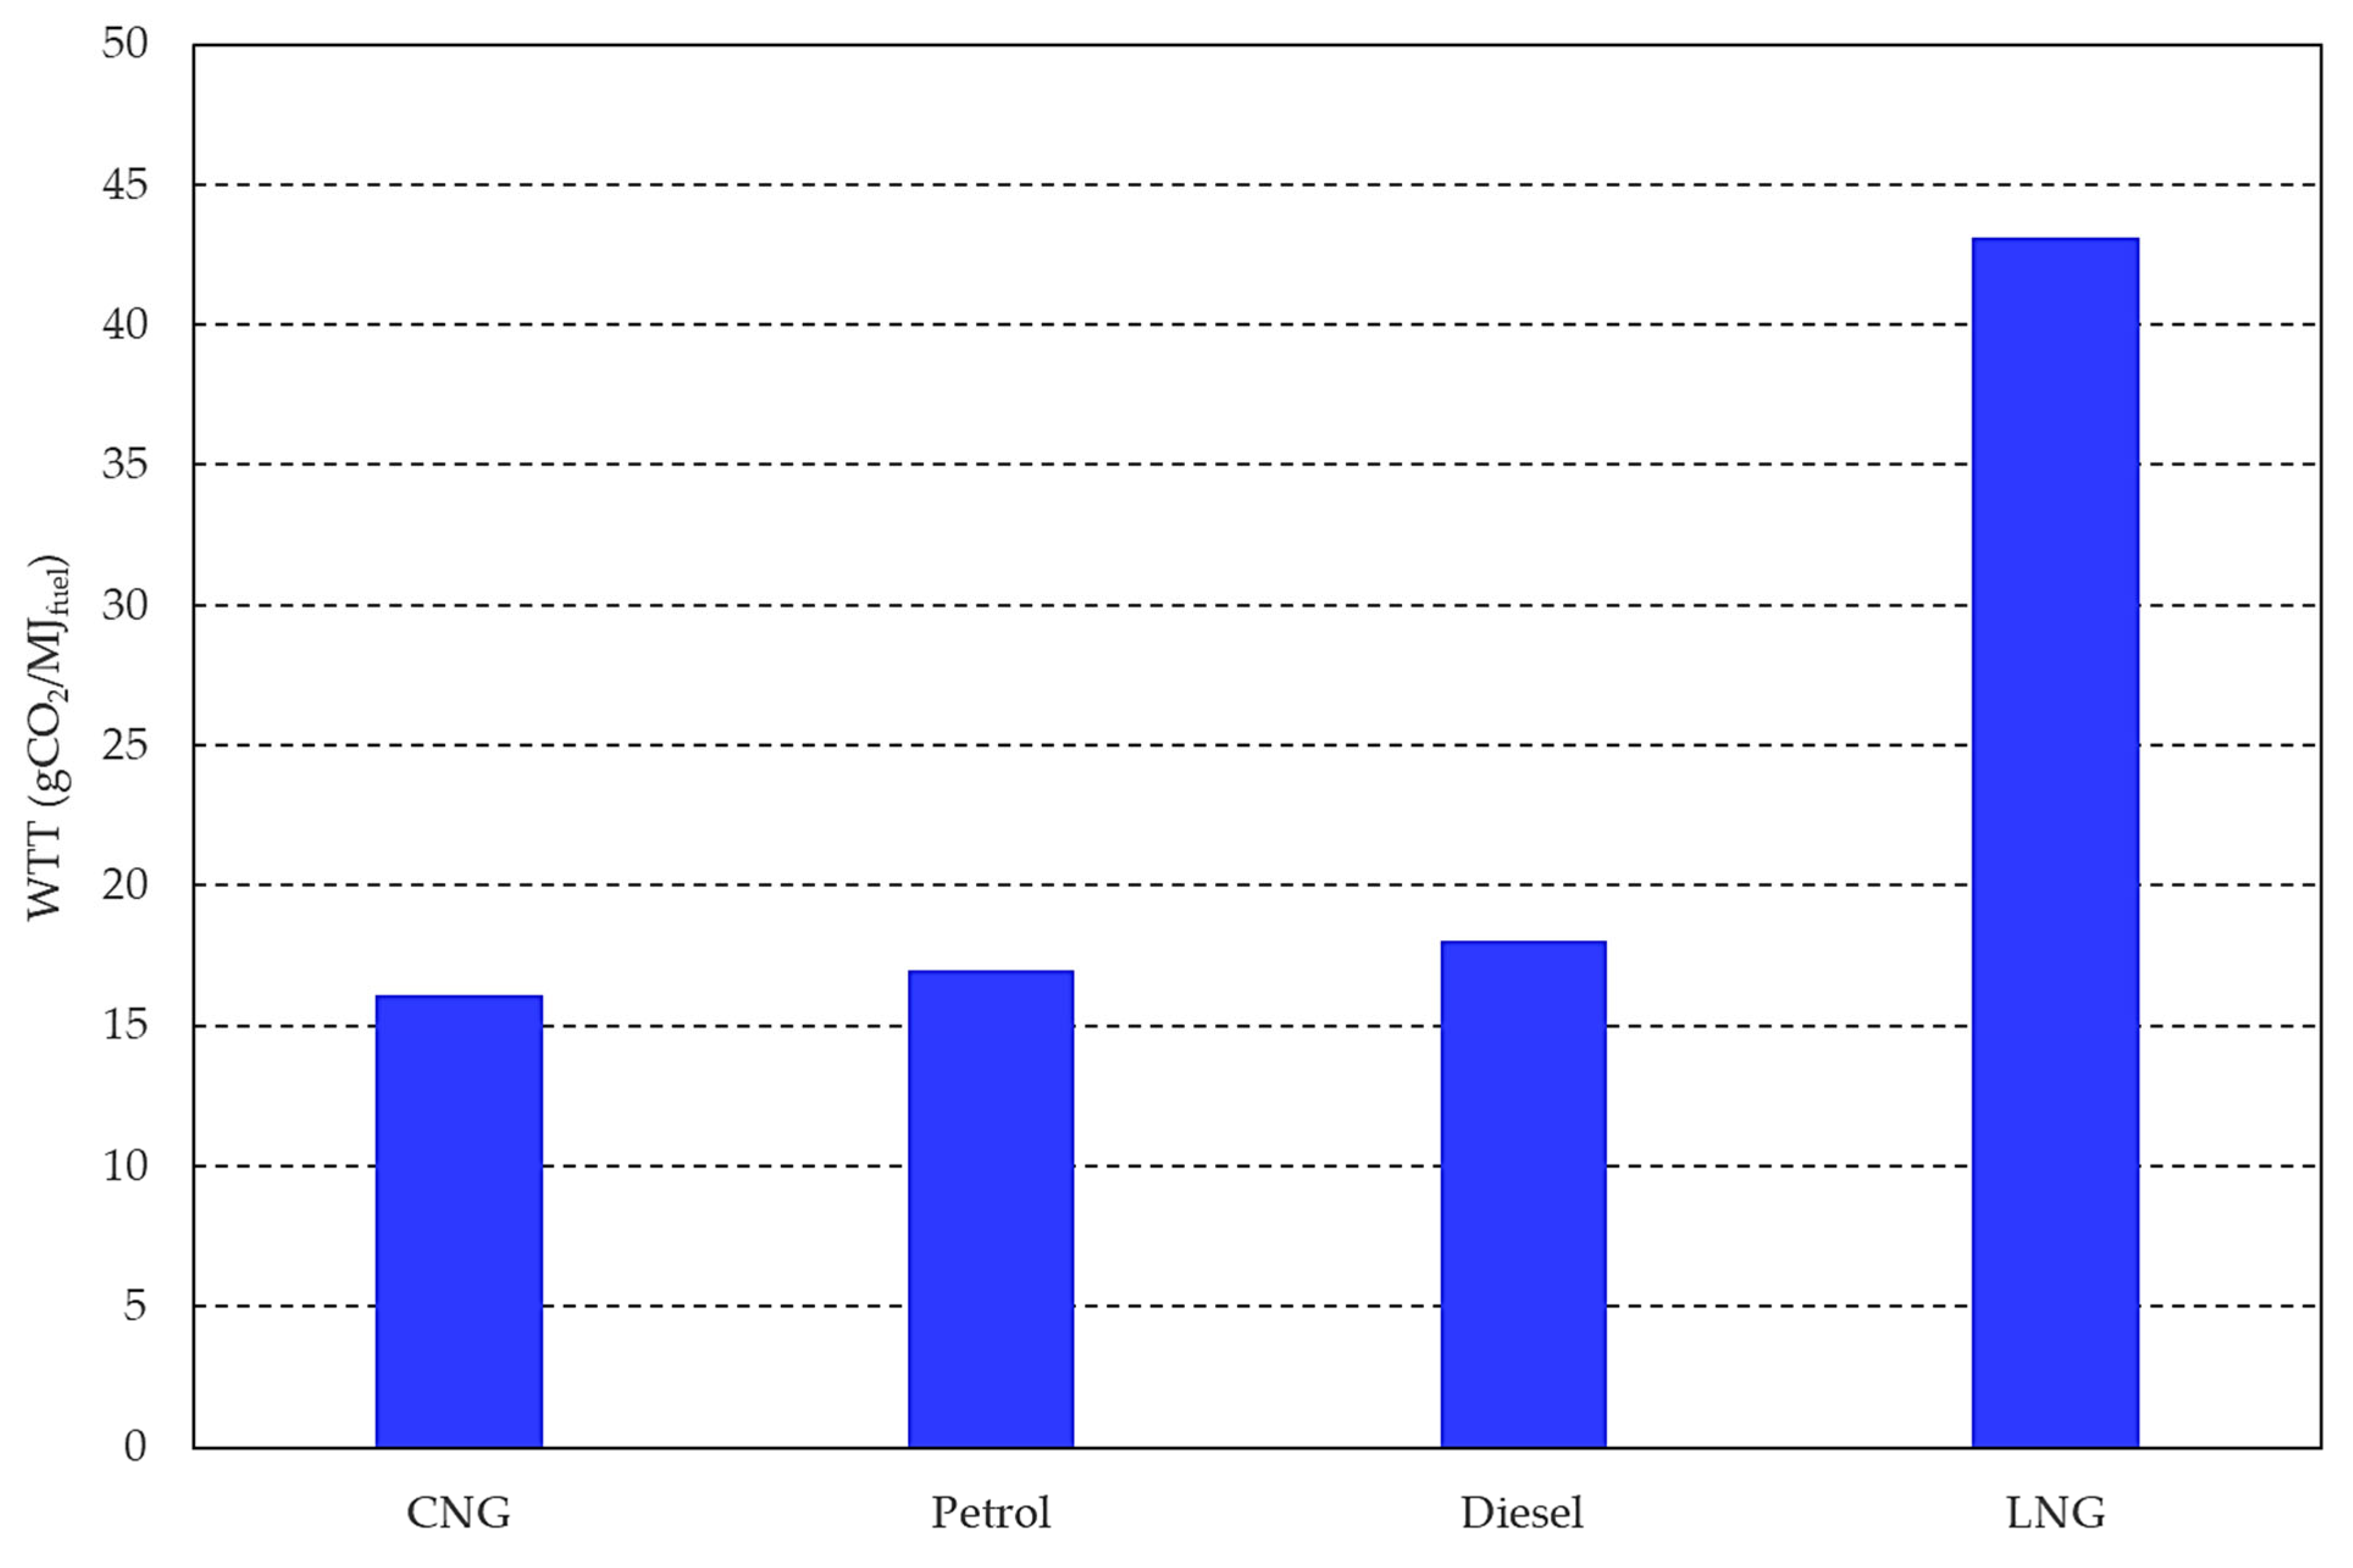
Table 5. Well-to-tank CO2 emissions [29].
FuelWTT CO2 Emissions (gCO2/MJfuel)
Petrol12.5
Diesel14.2
CNG8.4
CNG transported over 4000 km14.0
CNG transported over 7000 km21.7
Table 6. Summary of the vehicles examined, including emissions, costs, infrastructure readiness, and technological maturity.
NGVsEVsH2 FCEV
CostsPurchasing price of LDVs: EUR 2000 higher, MD/HDVs: 50% higher than its conventional vehicle price. Retrofitted engines on existing cars add around USD 6000–USD 13,000 to the price for LDVs [81] and USD 15,000 for HDVs. [22,82,83]. Running costs are seen to be lower because of lower fuel costs, even though they fluctuate [32,83]. Unexpected costs, including maintenance facility upgrades, technician training, fuelling facility maintenance, etc., come to the investor or government (if public-owned) [83].Purchasing price: The price of EVs is around 2–2.5 times higher than the price of conventional-fuelled vehicles [84]. Battery costs are the most significant parameter contributing to the higher prices of EVs, as well as maintenance costs [38]. Running costs can be lower because of the lower prices of electricity (depending on the source) and higher diesel/petrol prices due to taxation [84]. Also, fewer moving parts means less wear and tear (e.g., no oil and filter replacements), thus maintenance can be reduced to once per 40,000 km instead of around 6000 km [85].Highest purchasing costs in comparison to all the other examined vehicles. Purchasing price projected to fall between USD 20,000 and USD 25,000 in 2050 [85,86]. Running costs are higher because of the higher price of hydrogen [86].
CO2 Emission reductionsWTW: On average, 25% reductions [29]. WTT: Similar, but ultimately depends on the pathways followed by natural gas (CNG vs. LNG, transport distances, grid availability, etc.) [69,81]. TTW: Lower, as natural gas emits less CO2 [39,68,86].WTW: Depending on the vehicle, 0.5–0.8 times the conventional emissions [60,63,64,65]. WTT: Depend on the source of electricity; they can be close to conventional fuels when electricity is sourced from fossil fuels [38,59,68]. TTW: Significantly less even for hybrids (0.6–0.7 times the conventional) and zero for BEVs.WTW: Less, as there are no TTW emissions; depend on the source of hydrogen [59].
WTT: Depending on the source of hydrogen, 0.4–0.7 times the conventional [59,63,66,68].
TTW: Zero.
Infrastructure readinessNGV refuelling stations can be costly (USD 1.2 to 1.8 million) [22,87,88], so modular additions to existing refuelling stations can allow for grid expansion. The existing natural grid can be leveraged to supply the refuelling stations. EV infrastructure is rapidly evolving (55% increase from 2021 to 2022), but unevenly (China leads in the number of charging points) [89,90].Lack of robust refuelling network. Around 1160 stations worldwide, with Asia leading the deployment [91]. High capital costs of stations (~USD 1.9 million) [92] that vary with configuration and operation modes [93,94].
MaturityHighly mature engine technology, especially for bi-/dual-fuel engines.Highly mature engine technology.Significantly less mature than NGVs and EVs.
The comparisons are made based on a conventional-fuelled vehicle (diesel or petrol). NGVs include both CNG- and LNG-fuelled vehicles. EVs include HEVs, PHEVs, and BEVs.
Disclaimer/Publisher’s Note: The statements, opinions and data contained in all publications are solely those of the individual author(s) and contributor(s) and not of MDPI and/or the editor(s). MDPI and/or the editor(s) disclaim responsibility for any injury to people or property resulting from any ideas, methods, instructions or products referred to in the content.

