Abstract
Effective management of the hydrogen supply chain (HSC), starting with supplier selection, is crucial for advancing the hydrogen industry and economy. Supplier selection, a complex Multi-Criteria Decision Analysis (MCDA) problem in an inherently uncertain environment, requires careful consideration. This study proposes a novel hybrid MCDA framework that integrates the Bayesian Best–Worst Method (BWM), Fuzzy Analytic Hierarchy Process (AHP), and Entropy Weight Method (EWM) for robust criteria weighting, which is aggregated using a game theory-based model to resolve inconsistencies and capture the complementary strengths of each technique. Next, the globally weighted criteria, emphasizing sustainability performance and techno-risk considerations, are used in the TODIM method grounded in prospect theory to rank hydrogen suppliers. Numerical experiments demonstrate the approach’s ability to enhance decision robustness compared to standalone MCDA methods. The comparative evaluation and sensitivity analysis confirm the stability and reliability of the proposed method, offering valuable insights for strategic supplier selection in the evolving hydrogen landscape in the HSC.
1. Introduction
The hydrogen supply chain (HSC) encompasses the entire process of hydrogen production, storage, transportation, and distribution to end-users. The hydrogen industry covers all aspects of the HSC, starting with various hydrogen production methods. Once produced, hydrogen is stored and transported using different methods, depending on the production technologies employed. The distribution network includes pipelines, trucks, and shipping routes to supply hydrogen to industries such as steel manufacturing, chemical production, and fuel cell applications in transportation [1,2]. The global hydrogen market is expanding rapidly, with its value estimated to reach USD 410 billion by 2030, growing at a compound annual growth rate of 14.7%. Additionally, the global demand for hydrogen is expected to exceed 200 million metric tons (Mt) by 2030, up from 94 Mt in 2021. Consequently, investments in hydrogen production and infrastructure have surged, with over USD 320 billion in announced projects worldwide [3]. With governments worldwide setting ambitious hydrogen strategies, the industry is poised to play a critical role in achieving global decarbonization goals.
Supplier selection in the HSC is a critical process that involves identifying and evaluating suppliers based on key criteria such as cost, quality, reliability, sustainability, and technological capabilities. Suppliers in the HSC play diverse roles across various stages of the value chain, including hydrogen production, storage, transportation, and distribution. These includes manufacturers supplying essential equipment for green hydrogen production, storage system providers for high-pressure tanks and cryogenic storage, and fuel cell manufacturers that provide the technology necessary for hydrogen-powered applications in transportation and industry [4]. Thus, selecting reliable suppliers directly influences the efficiency, cost-effectiveness, and environmental sustainability of the hydrogen economy [5]. Currently, the global HSC is experiencing rapid growth, with investments in hydrogen-related technologies projected to exceed USD 500 billion by 2030, including electrolyzer technology and industrial infrastructure development [6].
Given the complexity and uncertainty in the HSC, evaluating key performance criteria and identifying the right suppliers requires a comprehensive decision-making framework. Multi-Criteria Decision Analysis (MCDA) methods, especially when integrated with fuzzy and Bayesian logic, offer a structured approach to supplier selection by evaluating conflicting criteria. These tools enhance decision-making in Decision Support Systems (DSSs) by addressing uncertainty and quantifying qualitative criteria and trade-offs, making them effective in complex supply chain environments [7]. Supplier selection in the HSC is especially critical due to unique challenges, including infrastructure constraints, sustainability issues, regulatory compliance, technological requirements, and safety concerns [8,9]. For instance, sustainability challenges arise in assessing suppliers’ ability to provide economical, low-carbon hydrogen production. Regulatory compliance requires meeting evolving safety codes and carbon reporting standards, while technological requirements demand expertise in cutting-edge production technologies and system integration. Safety and risk aspects must be carefully evaluated to ensure adherence to strict protocols and mitigate flammability risks [10].
In this study, sustainability and techno-risk criteria are proposed and assessed in alignment with the characteristics of supplier selection in the HSC. Specifically, the importance of these criteria is determined using an integrative MCDA framework. The Bayesian Best–Worst Method (Bayesian BWM), Fuzzy Analytic Hierarchy Process (Fuzzy AHP), and Entropy Weight Method (EWM) are first applied to assess the criteria. The weighting results are then harmonized through a game theory-based approach to establish global criteria weights for further analysis. The proposed integrated framework enables a more robust and balanced evaluation of criteria weights in decision-making. Additionally, potential biases and inconsistencies among the methods are minimized, resulting in a more stable approach that ensures a comprehensive and well-calibrated assessment framework for hydrogen supplier selection. Using these synchronized weights, numerical case studies are conducted to rank hydrogen suppliers using the Interactive Multi-Criteria Decision Making (TODIM) method. Furthermore, a comparative evaluation and sensitivity analysis of these methodologies provide valuable insights into their efficiency and robustness in supplier selection within the HSC. The key contributions of this study are highlighted as follows:
- This study introduces a unique integrated framework combining MCDA tools based on the Bayesian BWM, Fuzzy AHP, and EWM to assess supplier selection in the HSC.
- Both the fuzzy logic and Bayesian approach are further integrated to account for uncertainty and variability in expert judgments, improving the reliability of decision-making in the complex environments of the supplier selection process.
- The objective-based and subjective-based weighting methods are considered to create a comprehensive approach, providing a more accurate, flexible, and balanced approach to enhance the robustness of the decision-making process.
- The game theory-based approach is used to synchronize criteria weights derived from different methods, minimizing conflicts and biases, and ensuring a more balanced and stable outcome.
- The TODIM method incorporates the prospect theory to account for decision-makers’ risk preferences, which offers a more psychologically realistic supplier ranking. In addition, a comparative evaluation and sensitivity analysis are conducted to provide valuable insights into the effectiveness of the proposed framework.
The structure of this research study is as follows: Section 2 reviews the relevant literature. Section 3 outlines the methodological framework, incorporating the integrative MCDA tool. Section 4 details the data collection and analysis processes, along with key managerial insights derived from the study. Finally, Section 5 summarizes this study’s findings and suggests potential directions for future research.
2. Literature Review
2.1. Managing the Hydrogen Supply Chain
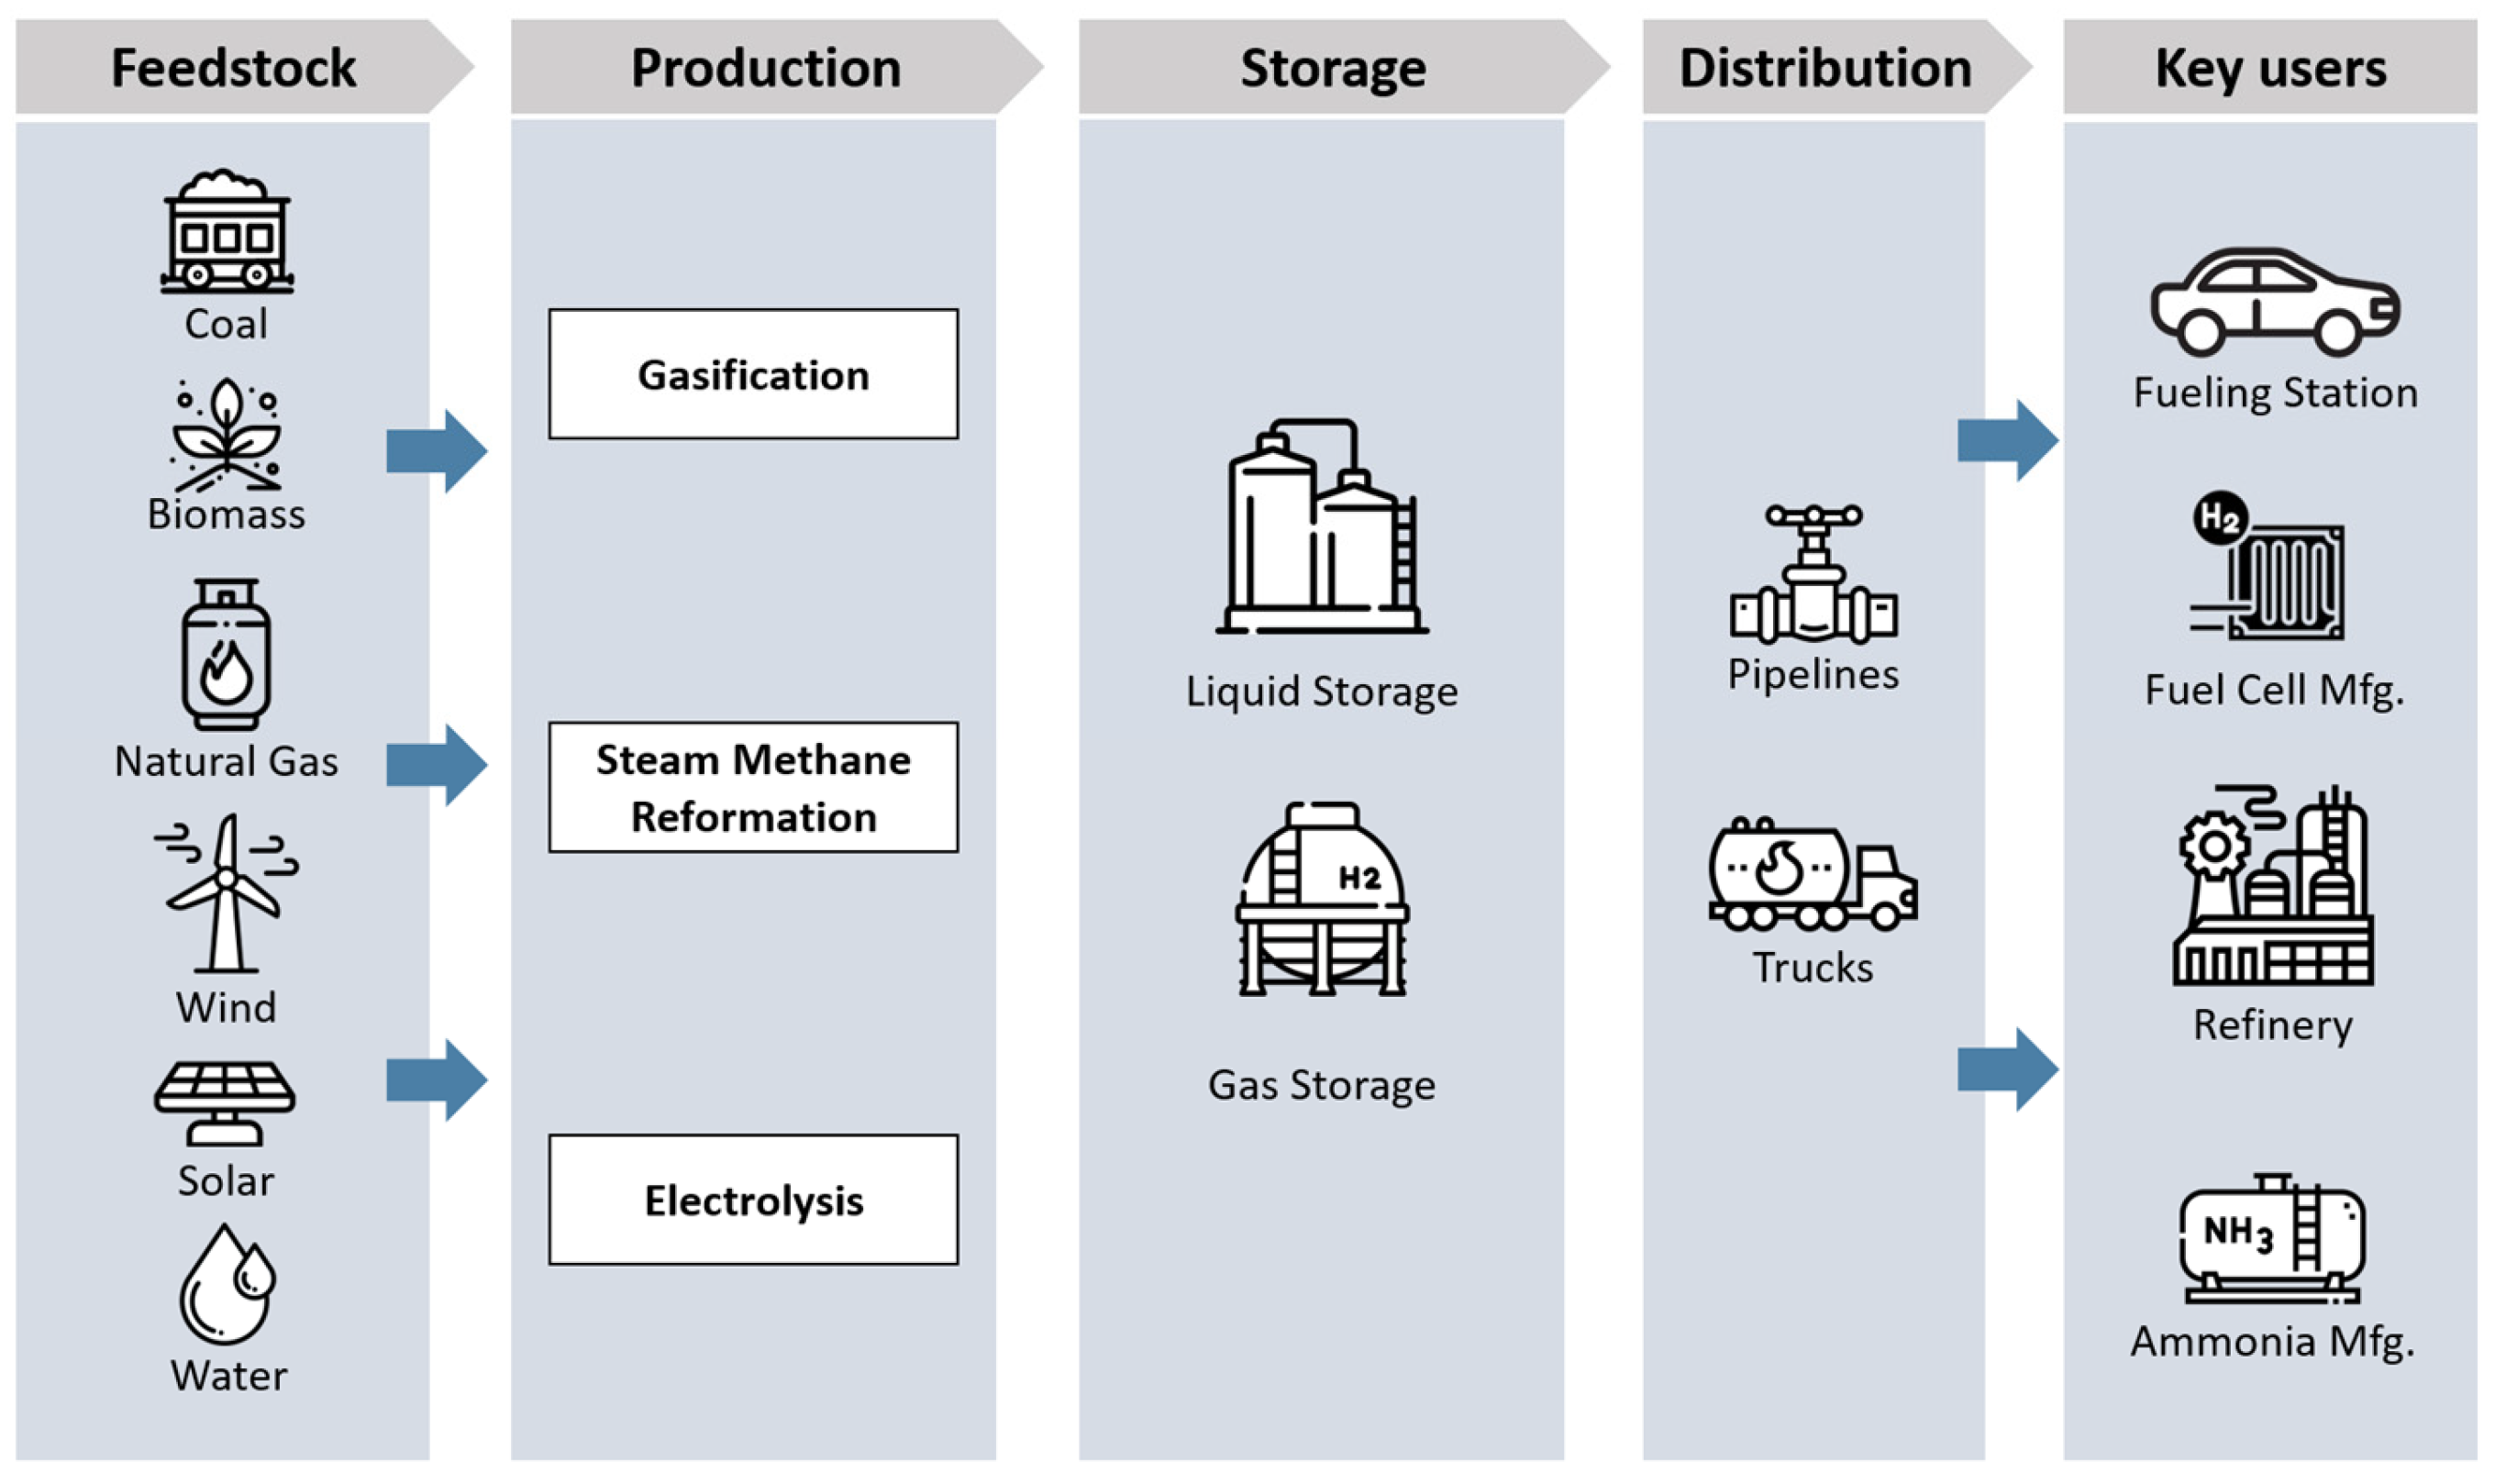
The hydrogen network infrastructure typically begins with energy sources in the upstream process and ends at the demand areas in the downstream process, as illustrated in Figure 1. Evaluating each segment of the HSC—upstream, midstream, and downstream—is essential for ensuring efficiency and cost-effectiveness, as each phase presents distinct challenges. Integrating these components is also crucial, as it enables the creation of a cohesive, optimized system.

Figure 1.
General hydrogen supply chain.
Hydrogen production in the upstream stage of the HSC is typically categorized by “colors” based on the production methods and environmental impacts (Figure 2). Grey hydrogen, the most common type, is produced from natural gas via Steam Methane Reforming (SMR) without carbon capture, making it the least environmentally friendly. Blue hydrogen uses the same process but incorporates Carbon Capture and Storage (CCS) to reduce emissions. Green hydrogen, the most sustainable option, is produced by electrolyzing water using renewable energy sources like wind or solar, emitting no greenhouse gases. Operational challenges in the upstream process often relate to hydrogen source assessment and supplier selection. These include evaluating the geographic availability of production methods and the technological maturity of suppliers [11]. Several studies have examined renewable energy sources across diverse regions to assess the green hydrogen potential [12,13,14], highlighting the impacts of regional characteristics on hydrogen sourcing. Additionally, various components of a supplier assessment across the HSC are explored in other studies, as discussed in the next subsection.
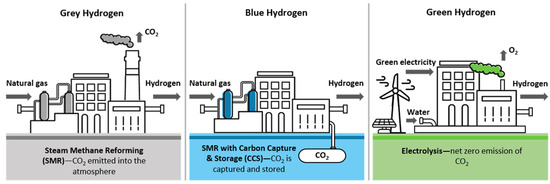
Figure 2.
Different types of hydrogen production.
The midstream stage of the HSC involves hydrogen storage, where it can be either compressed as gas—referred to as compressed hydrogen (CH2)—or liquefied as liquefied hydrogen (LH2), and then distributed via tube trailers, cryogenic tankers, pipelines, or ships, depending on its physical state. Logistical challenges for both forms have been widely discussed, as they differ significantly in terms of storage, transport, and energy efficiency [15,16,17]. Compressed hydrogen is typically stored at pressures of 350–700 bar, offering a lower energy density and making it more suitable for short- to medium-distance transport via tube trailers or pipelines. In contrast, liquefied hydrogen is stored at around 1 bar in cryogenic tanks and has a higher energy density, making it better suited for long-distance transport using cryogenic tankers or ships. Additionally, infrastructure costs for compressed hydrogen are relatively low compared to liquefied hydrogen, which requires a greater investment due to the complexity of cryogenic systems. Therefore, storage and distribution decisions in the HSC are critical, as they depend on the form of hydrogen and the associated techno-economic considerations.
The growing complexity of integrated renewable energy systems, including hydrogen, requires more effective decision-making approaches. Economic, decision science, and advanced data analysis techniques have become key enablers for coordinated planning and efficient operation in multi-actor energy settings [18,19]. Several studies have contributed to evaluating midstream and downstream operations in the HSC, particularly in location analysis and the assessment of centralized versus distributed supply chain models [20,21,22]. A centralized HSC network focuses on large-scale hydrogen production, distributing hydrogen to various locations via pipelines or bulk transportation. While this model benefits from economies of scale, it often involves long transport distances and extensive infrastructure. In contrast, a distributed network relies on localized hydrogen production near the point of use. This approach reduces transportation costs and offers greater flexibility and resilience but may result in higher production costs, potentially impacting overall efficiency. The downstream stage of the HSC focuses on end-use applications, such as a hydrogen supply for ammonia production, commercial energy use, and Hydrogen Refueling Stations (HRSs) for Fuel Cell Electric Vehicles (FCEVs). Several studies on the downstream stage address challenges related to the hydrogen demand, balancing supply and capacity and exploring potential markets for hydrogen energy [23,24].
Recent studies have emphasized the growing applicability of hybrid MCDA methodologies across the entire energy sector value chain, from upstream exploration and production to downstream consumption. In the upstream segment, MCDA’s effectiveness in supporting sustainable energy resource development and technology selection is examined. For instance, Janmontree et al. [12] apply integrated MCDA frameworks to evaluate optimal sites for green hydrogen production in the upstream supply chain. In particular, Data Envelopment Analysis (DEA), super-efficiency DEA, EWM, and TOPSIS are used to assess regions in Germany based on solar, geographic, and climate data. Moreover, Ransikarbum et al. [11] use a two-phase MCDA framework combining DEA and TOPSIS to evaluate green hydrogen site suitability based on economic and sustainability indicators using a case study in Thailand. In the downstream sectors, MCDA continues to prove indispensable in evaluating system configurations and end-use technologies. For instance, Guan et al. [25] highlight the effective use of an MCDA framework to tackle the complex problem of selecting suitable battery technologies for renewable energy storage. By combining objective weighting techniques with an uncertainty component, the Uncertainty-Preserved COmplex PRoportional ASsessment called UP-COPRAS is proposed. In addition, Park et al. [26] propose an integrated MCDA approach combined with an optimization model to improve hydrogen refueling station site selection. By combining MCDA with the maximal covering location problem, the authors offer a scalable MCDA-based framework for optimizing the hydrogen infrastructure in sustainable cities.
The above literature review underscores the growing need for integrated MCDA methodologies that can address the complex, multifaceted challenges in the renewable energy sector. Such approaches are essential for incorporating diverse criteria and stakeholder perspectives to support more informed decision-making in energy infrastructure planning. Hydrogen’s critical role in renewable energy systems, with its diverse technical, economic, and environmental factors, makes the use of MCDA essential to balance these competing criteria and ensure optimal, sustainable infrastructure decisions.
2.2. Supplier Selection Problem in the HSC
Supplier selection is a critical aspect of supply chain management, directly impacting operational efficiency and an industry’s competitive advantage. The primary goal is to ensure that raw materials, components, or services are sourced from reliable and capable suppliers who meet the industry requirements. Traditionally, supplier selection has focused on economic factors, often resulting in short-term relationships with limited attention to environmental and social impacts. However, recent studies emphasize the need for sustainable supplier selection, calling for advanced decision-support models that account for operational complexity and sustainability concerns [27,28,29]. This approach integrates ecological and social criteria alongside economic considerations, fostering long-term partnerships aimed at reducing environmental footprints and promoting ethical practices. This shift reflects a growing commitment to corporate social responsibility, encouraging the selection of suppliers aligned with sustainability goals and thereby reducing supply chain risks and contributing to a more sustainable economy.
Supplier selection in the HSC presents a critical decision-making challenge due to the complex nature of hydrogen production, storage, and distribution. Unlike conventional supply chains, supplier selection in the hydrogen sector must account for diverse production technologies, infrastructure readiness, regulatory compliance, and environmental impacts [30]. The volatility of the hydrogen demand, high transportation costs, and safety concerns further complicate the process, making it a multidimensional and highly uncertain task [31]. In this context, Multi-Criteria Decision Analysis (MCDA) methods are essential for evaluating supplier alternatives across a range of often conflicting criteria, such as economic viability, environmental sustainability, technological capability, and risk management. Moreover, the uncertainty inherent in the HSC requires the use of uncertainty-handling techniques, including fuzzy logic and stochastic modeling, within MCDA frameworks [32]. These integrated approaches support decision-makers in managing trade-offs and reducing risks, contributing to a more resilient and sustainable hydrogen supply chain.
A recent review of studies related to general supplier selection, its extension to sustainability, and applications in the hydrogen context is summarized in Table 1. Despite the growing interest in hydrogen as a sustainable energy source, research on supplier selection within the hydrogen supply chain (HSC) remains limited and warrants further exploration. Moreover, addressing uncertainty in supplier selection models is essential to improve decision-making robustness in the hydrogen sector. For example, Alipour et al. [33] propose an integrated approach combining entropy, SWARA, and COPRAS methods within a Pythagorean fuzzy environment to support supplier selection for fuel cell and hydrogen technologies. Their framework includes both objective and subjective weighting methods, followed by comparison and sensitivity analyses to validate its effectiveness. Hjeij et al. [30] develop a comprehensive index to assess the hydrogen export competitiveness of countries using 21 indicators across four categories: resource potential, economic strength, political stability, and industrial expertise. They apply AHP, supported by expert interviews and surveys, to refine indicators and determine weights. More recently, Singh et al. [32] address the supplier selection gap for critical hydrogen fuel cell components in developing countries by proposing a TODIM-based decision-making framework. The authors address uncertainty by applying a generalized linear Diophantine linguistic fuzzy set in their study.

Table 1.
Literature review of supplier selection in the sustainability and hydrogen contexts.
3. Research Methodology
3.1. Methodological Flow
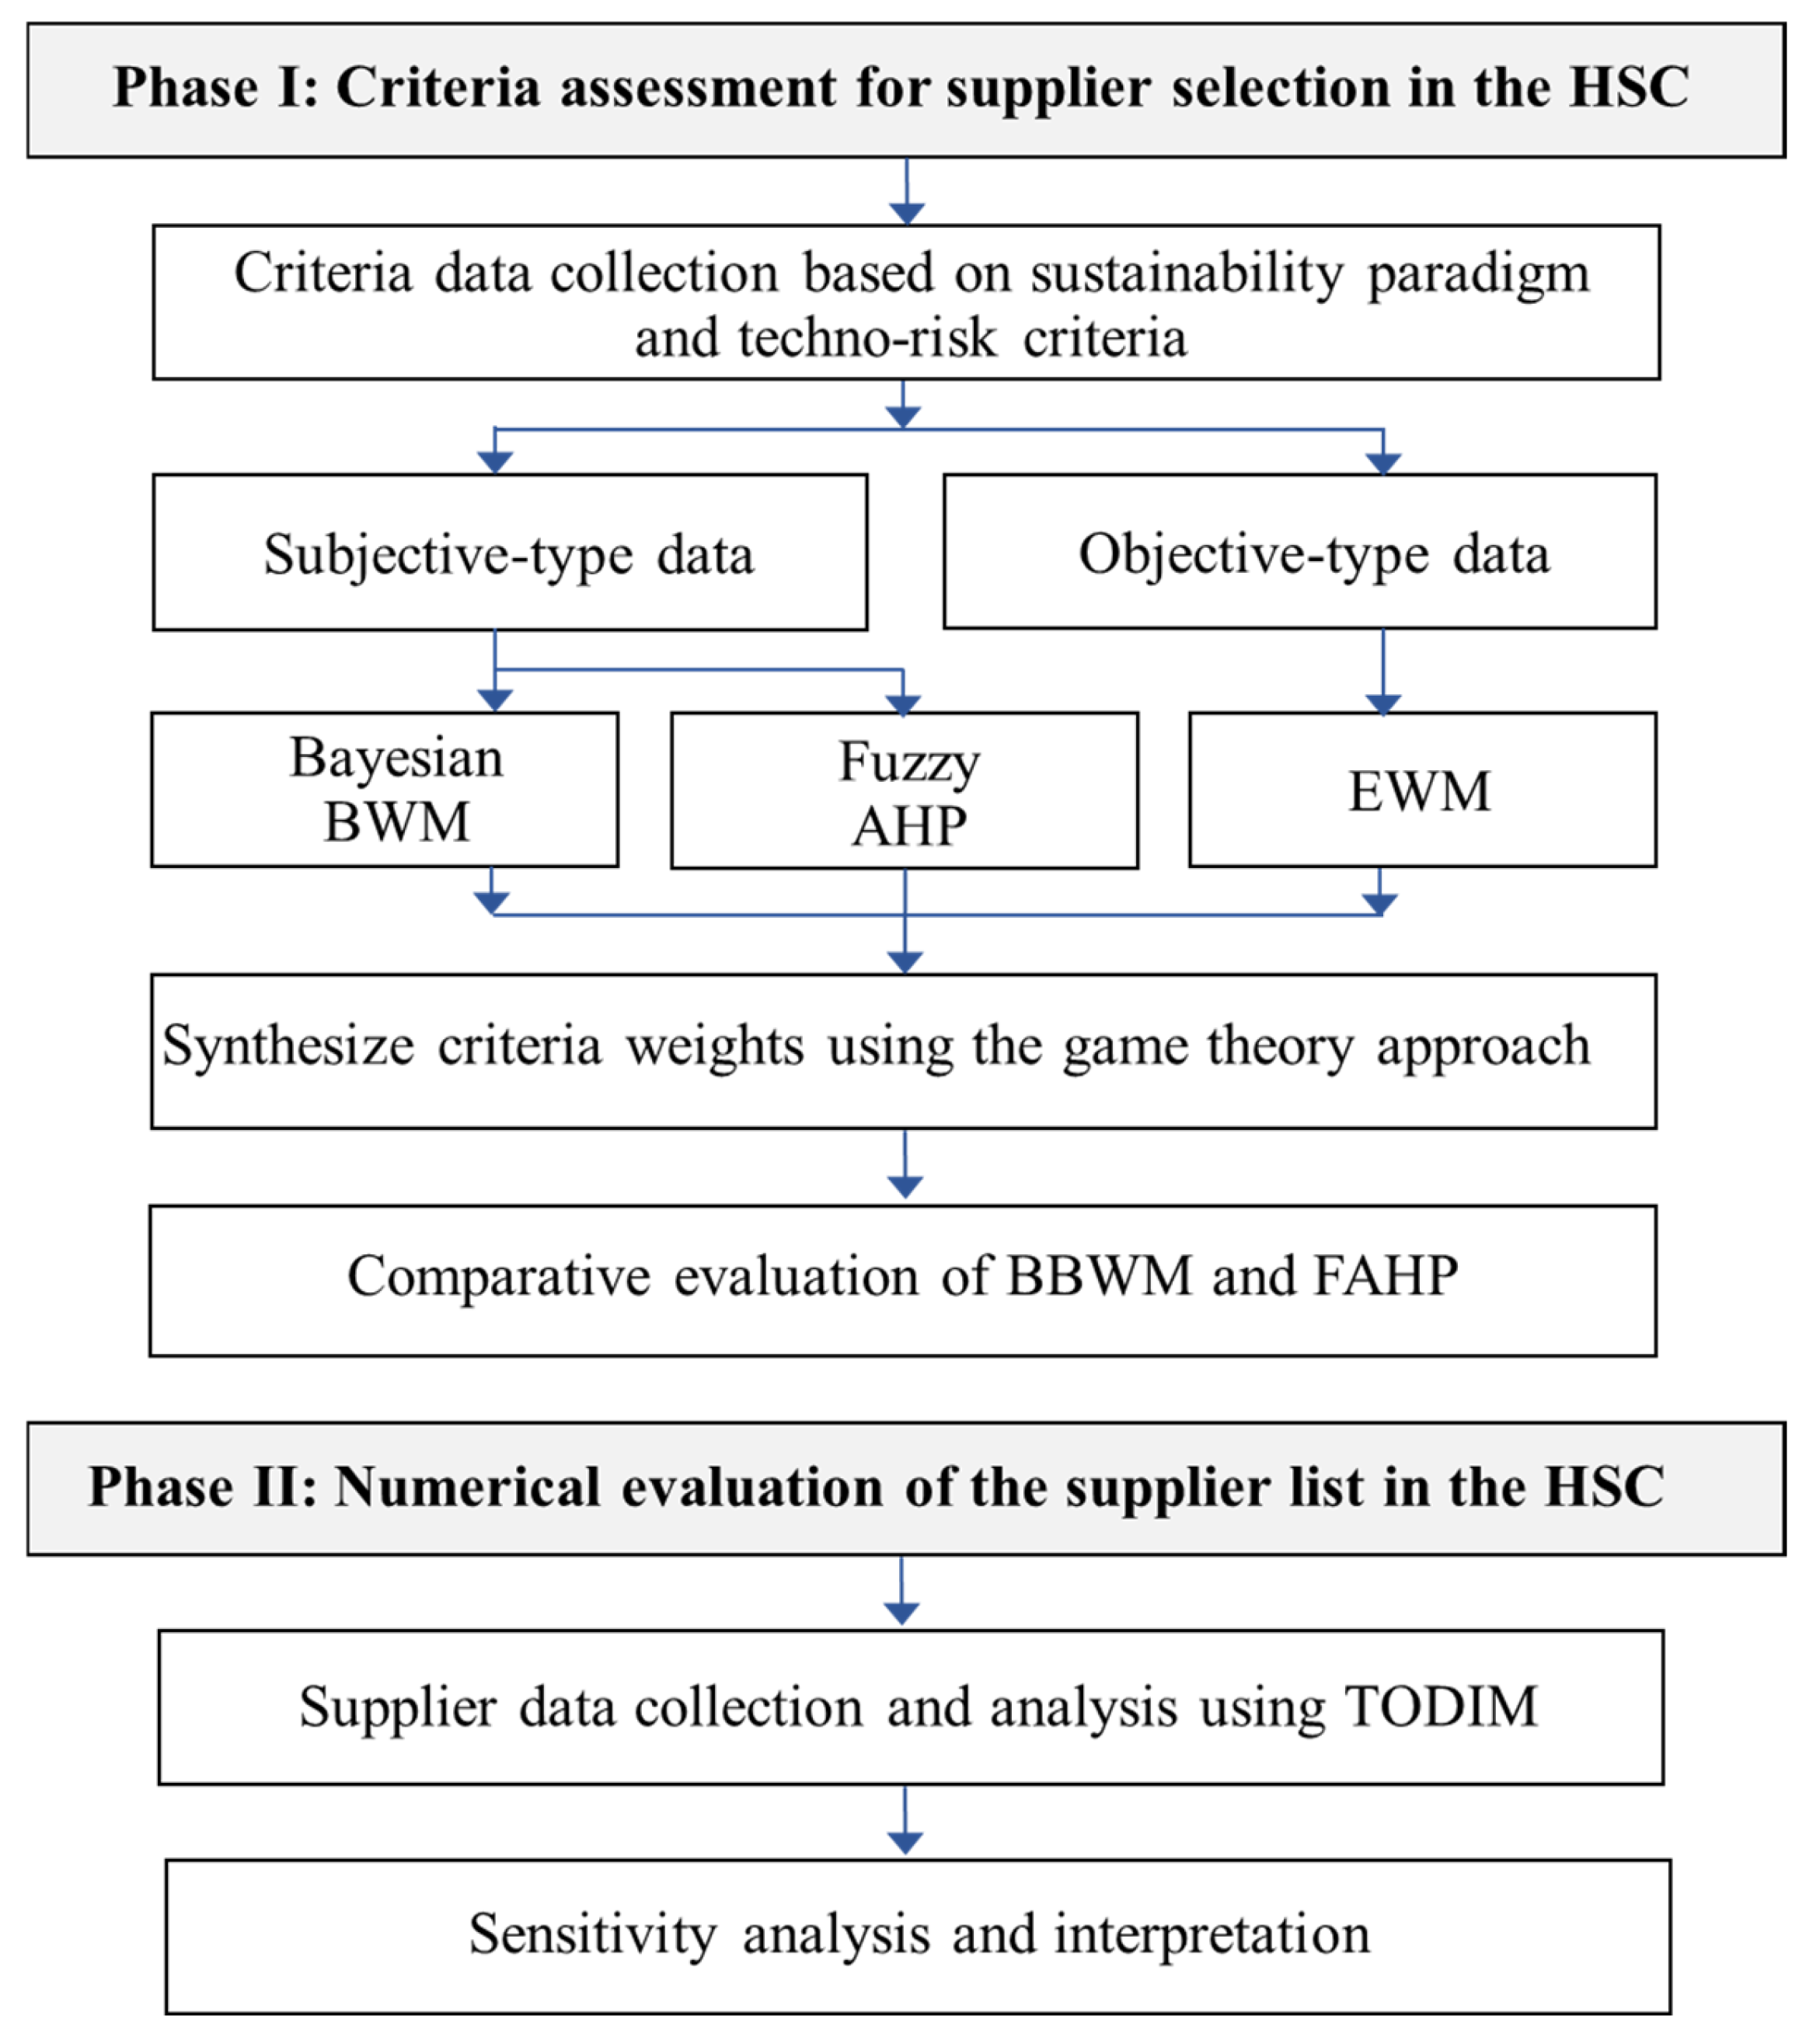
The methodological flow for the supplier selection problem in the HSC context is illustrated in Figure 3. It is structured into two main phases. The first phase focuses on the assessment of criteria for supplier selection in the HSC, aiming to identify and evaluate the most critical factors. The process begins with defining evaluation criteria based on expert input and a comprehensive literature review. These criteria are then refined and categorized under the sustainability paradigm and techno-risk dimensions, encompassing economic, environmental, social, operational capacity and efficiency, and risk management aspects. An integrated MCDA framework is subsequently applied to determine the weight of each criterion, incorporating both objective and subjective evaluations from three domain experts. In application-oriented research, particularly in complex decision-making contexts like supplier selection, expert input plays a critical role in capturing domain-specific knowledge and contextual judgment that are not easily quantified. The number of experts used in this study aligns with practices commonly reported in the literature, where expert panels typically range from as few as 3 to more than 15 participants, depending on the specificity of the problem and the level of expertise required [44,45]. In the context of supplier selection within the HSC, focused decision problems involving a managerial team of highly experienced experts are considered both practical and valid for obtaining reliable input.
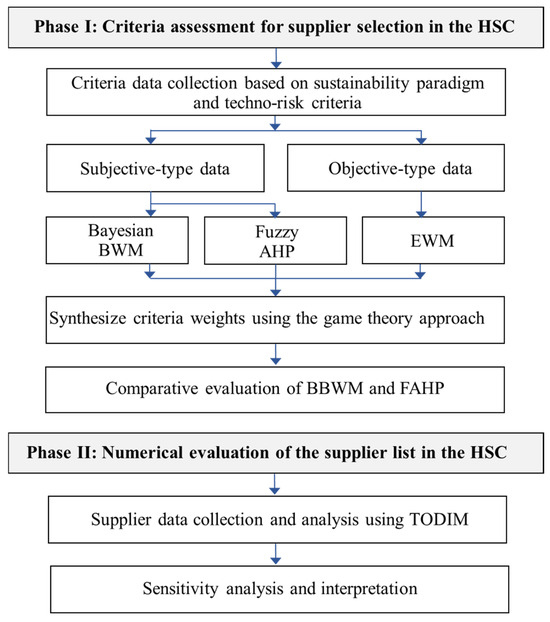
Figure 3.
Methodological flow for the supplier selection problem in the HSC.
The criteria weighting process incorporates both objective evaluations using the EWM and subjective judgment through the BWM and AHP to establish a balanced evaluation framework. Uncertainty is also addressed by conducting a comparative study between the Bayesian BWM and Fuzzy AHP. This structured assessment ensures the validity of all significant factors before advancing to the supplier evaluation phase. The second phase involves the numerical evaluation of potential suppliers in the HSC based on quantitative assessments aligned with the defined criteria. This phase begins with the collection of data for seven suppliers, evaluated according to each criterion. The TODIM method is then applied to rank the suppliers based on their overall performance relative to the weighted criteria. Additionally, a sensitivity analysis is performed to test the robustness of the ranking system and to confirm the consistency of results under varying conditions. Each methodological tool is presented in detail in the subsequent sections.
3.2. Bayesian BWM
This subsection discusses the Bayesian BWM. The BWM is a MCDA approach used to determine the relative importance of multiple criteria by comparing the most important (i.e., the best) and least important (i.e., the worst) criteria against others [46]. The method begins by identifying the best and worst criteria from the selected set and then proceeds with pairwise comparisons to quantify their relative importance. An optimization procedure is employed to derive the final weights of the criteria, ensuring consistency in judgments while minimizing the number of pairwise comparisons [47]. The Bayesian BWM improves upon the traditional BWM by incorporating Bayesian inference, which allows for the integration of prior knowledge and uncertainty in the decision-making process. Specifically, the Bayesian model assesses the weights probabilistically, considering prior distributions and updating beliefs based on observed data [48]. This approach provides a more robust framework for handling uncertain and inconsistent judgments, especially when expert opinions vary or when data are limited. The Bayesian BWM is particularly suitable for supplier selection in the HSC, where decision-making involves multiple criteria with inherent uncertainty.
A brief procedure for the Bayesian BWM is outlined as follows. A more detailed mathematical explanation of the model can be found in the works of [49,50], which provide comprehensive theoretical foundations and formal derivations. The process begins by identifying the best (i.e., the most important) and worst (i.e., the least important) criteria. Next, pairwise comparisons are made for the ‘Best-to-Others’ and ‘Worst-to-Others’ vectors. The ‘Best-to-Others’ vector compares the best criterion with all other criteria in terms of relative importance, while the ‘Worst-to-Others’ vector compares all other criteria with the worst criterion. Following this, the pairwise comparisons are used to determine the relative importance of criteria based on expert judgment using a scale from 1 (equal importance) to 9 (extremely more important) that quantifies the intensity of preference between two criteria. Since the Bayesian BWM is based on a probabilistic framework, the probabilistic weight distribution, likelihood function, and posterior distribution are computed. Initially, a Dirichlet distribution is used as a prior to model the uncertainty of the true criteria weights, as shown in Equation (1). The likelihood function is then defined based on the pairwise comparisons, using the Bayesian inference model for the ‘Best-to-Others’ and ‘Worst-to-Others’ comparisons, presented in Equations (2) and (3), respectively. Finally, the posterior distribution is estimated using Bayes’ theorem, as shown in Equation (4).
Next, the final weight distribution is obtained by maximizing the posterior distribution, and the expected value of each weight is computed to assess the ranking of criteria, as shown in Equations (5) and (6). Finally, the credal ranking is calculated to quantify the confidence level that one criterion is more significant than another, based on the posterior distribution obtained earlier, as shown in Equation (7).
where is the parameter for Dirichlet distribution representing a prior belief.
where refers to the set of pairwise ‘Best-to-Others’ and ‘Worst-to-Others’ comparisons
The consistency ratio (CR) is also typically used to assess the reliability of decision-makers’ pairwise comparisons. In the BWM, it can be calculated by dividing the optimal consistency index obtained from solving a model that minimizes deviations between actual and implied comparisons by a predefined consistency threshold depending on the number of criteria. Additionally, consistency in the Bayesian BWM can be addressed through probabilistic reasoning and confidence in posterior estimates.
3.3. Fuzzy AHP
The AHP is a widely used MCDA method that helps decision-makers evaluate criteria and alternatives by structuring a complex decision problem into a multi-level hierarchy. The process begins with the goal at the top level, followed by decision criteria, sub-criteria, and, finally, alternatives at the bottom. Pairwise comparisons are then made between criteria and/or alternatives to assess their relative importance using a scale from 1 (equal importance) to 9 (extremely more important), with other values representing varying degrees of relative importance. These comparisons are used to calculate normalized weights, called priority vectors, which assist in decision-making. Fuzzy AHP extends the traditional AHP by incorporating fuzzy logic to address uncertainty and imprecision in decision-making. In this method, fuzzy numbers, such as triangular distributions, represent the subjective nature of judgment. AHP and its variations have been applied in numerous fields, including the renewable energy sector [51,52,53]. In this study, a comparative analysis between the Bayesian BWM and Fuzzy AHP is conducted for further insights.
A brief procedure for the Fuzzy AHP is outlined as follows. A more detailed mathematical explanation of the model can be found in [54,55], which provide comprehensive theoretical foundations and formal derivations. The fuzzy comparison matrix is constructed, where each decision-maker evaluates the fuzzy relative importance of criteria using linguistic judgments, as shown in Equation (8). In this study, a triangular distribution is used to represent linguistic judgments for the worst (i.e., minimum value L), moderate (i.e., median value M), and best (i.e., maximum value U) values, as presented in Equation (9). The geometric mean method is then applied to derive linguistic judgments and calculate fuzzy weights, as shown in Equations (10) and (11). To perform fuzzy addition and multiplication, additive and multiplicative operators are employed, which are subsequently used in the calculation of fuzzy weights. Finally, a crisp numerical value is derived from the fuzzy weights, as outlined in Equation (12).
In the AHP, the CR also evaluates the logical consistency of a decision-maker’s pairwise comparisons among criteria or alternatives. It is calculated by dividing the consistency index, which measures the deviation from perfect consistency, by the random index, a benchmark average consistency index derived from randomly generated matrices of the same size. In the Fuzzy AHP, the consistency is often adapted from AHP using defuzzified values to compute a CR, with values of 0.10 or less generally considered acceptable, indicating reasonably consistent judgments.
3.4. EWM
Unlike other subjective methods, such as BWM and AHP, which rely on expert judgment to assign weights, the EWM is a popular MCDA technique that determines objective weights based on numerical data. The EWM method is rooted in information theory, where entropy measures the uncertainty within a system. Entropy is used to quantify the variability of each criterion based on the data, with criteria exhibiting higher variability receiving higher weights [56,57,58]. This method is particularly useful for assessing the importance of each criterion based on its variability, contributing to the overall decision-making process. As such, EWM ensures a transparent and reproducible process, making it a valuable tool for complex decision-making problems with multiple criteria and alternatives.
A brief procedure for the EWM is outlined as follows. A more detailed mathematical explanation of the model can be found in [59]. The methodology begins by scaling a normalized decision matrix, called the projection value, which represents decision-making information for each alternative with respect to each criterion, as shown in Equation (13). Next, the entropy value for each criterion is calculated, where m is the number of alternatives, as presented in Equation (14). Then, the degree of divergence for each criterion is computed, as shown in Equation (15). In particular, the higher the degree, the more concentrated the information, indicating the criterion’s importance. Finally, the relative weight of each criterion is determined, as shown in Equation (16). While the CR is a key component in the AHP and BWM-based methods to ensure the reliability of subjective judgments in pairwise comparisons, the CR is not applicable for the EWM. In particular, given that the EWM determines criterion weights based on the inherent variability of data without relying on expert judgments, there are no subjective inputs involved.
3.5. TODIM
The main methodology for supplier ranking is discussed next using the TODIM method. A key feature of TODIM is its ability to handle both qualitative and quantitative criteria while incorporating decision-maker’s preferences. The method adopts a dominance-based approach, comparing the performance of each alternative pairwise across all criteria. A distinctive aspect of TODIM is its use of prospect theory to capture the decision-maker’s risk attitudes, adjusting the weight of criteria based on the perceived risk or preference. The final ranking of alternatives is obtained by aggregating individual performances across all criteria, considering both the relative importance of the criteria and the decision-maker’s risk preferences (gains and losses) [60,61].
The advantages of TODIM over other methods include its ability to incorporate the decision-maker’s risk preferences, which are often overlooked by other approaches. This method is particularly suited for the HSC, given its high complexity, evolving technologies, and uncertainties. TODIM provides a robust framework for integrating risk preferences into decision-making. Initially, normalized data are obtained based on benefit- and cost-type criteria using a linear normalization technique, as shown in Equations (17) and (18), which scales all criteria values to a uniform range between 0 and 1. This technique preserves the relative distances between alternatives, which is crucial for TODIM’s underlying prospect theory framework that differentiates between gains and losses relative to a reference point. Compared to other normalization methods, this approach offers greater interpretability and maintains proportional differences without distorting the data’s dominance relationships in TODIM [62]. Next, the dominance degree for each pair of alternatives is calculated using the value function from prospect theory, determining the degree to which one alternative dominates another, as shown in Equations (19) and (20) for both gain and loss scenarios. The overall dominance degree is then computed by aggregating the dominance degrees across all criteria for each alternative, as shown in Equation (21). Finally, the overall prospect value for each alternative is determined by normalizing the dominance degrees, as shown in Equation (22). The alternatives are then ranked according to their calculated prospect values.
3.6. Game Theory Approach
In decision-making problems involving multiple criteria, game theory can be effectively used to combine weights derived from the different methods proposed in this study [63,64]. Each method offers unique perspectives: the Bayesian BWM reflects expert preferences with risk attitudes using Bayesian theory, Fuzzy AHP incorporates uncertainty in judgments through fuzzy logic, and EWM objectively quantifies the information provided by each criterion based on data dispersion. The proposed game theory model adopts a cooperative game framework, wherein the weighting methods from Bayesian BWM, Fuzzy AHP, and EWM are treated as players working collaboratively to reach a consensus solution. The strategy space in this context comprises the feasible set of weight combinations for the decision criteria, constrained by the requirement that the combined weights remain non-negative and sum to one. In addition, the equilibrium condition is defined as the solution that minimizes the maximum deviation between the aggregated weight vector and those derived from each individual method, as presented in Equations (23)–(26). This approach ensures a fair and balanced compromise by treating each method’s perspective, consistent with the principles of cooperative game theory, where the goal is to achieve an optimal collective outcome rather than individual dominance. Specifically, the objective function minimizes the maximum discrepancy between the combined weights and the individual methods, while the constraints ensure that the sum of weight coefficients equals one and remains non-negative.
4. Case Study and Results
4.1. Supplier Selection Criteria in HSC
This section discusses the multiple criteria relevant to supplier selection in the hydrogen supply chain (HSC) based on a literature review of hydrogen studies, sustainability approaches, and challenges related to technology and safety. The criteria definitions are provided in Table 2, which outlines both main criteria and sub-criteria. Specifically, the case study includes five main criteria: the economic criterion (C1), the environmental criterion (C2), the social criterion (C3), the operational capacity and technology criterion (C4), and the risk management criterion (C5). In total, there are sixteen sub-criteria, with four sub-criteria under C1 and three sub-criteria for C2, C3, C4, and C5, respectively.
Table 2.
Criteria description for the HSC’s supplier selection in the case study.
After identifying the criteria, experts are consulted to evaluate each sub-criterion in the case study, demonstrating the group decision-making approach within the proposed MCDA framework for the supplier selection problem in the HSC. Since the HSC is an emerging field with limited research compared to more established energy and logistics sectors, comprehensive insights are scarce. For this study, three experts with experience in supply chain management, renewable energy, and hydrogen applications are purposively selected to assess the identified criteria. An aggregated technique is then used to report the group decision-making results. Additionally, seven supplier companies (A1–A7) in Germany are chosen for this case study, with data collected for each supplier under each criterion, as shown in Table 3.
Table 3.
Data collection for a decision matrix of supplier companies and defined criteria.
4.2. Results for the Criteria Weight Evaluation
The presented criteria are evaluated by key decision-makers, and results are obtained by applying each method individually. Specifically, the criteria weights are evaluated using subjective methods like Bayesian BWM and Fuzzy AHP. A comparative analysis between these two methods is conducted to derive potential insights. Additionally, the objective method, EWM, based on data dispersion, is used to calculate criteria weights. The synthesized results are then obtained by combining the weights from all methods using the game theory approach. MATLAB 2015 is employed to code algorithms for each method and to synthesize the overall criteria weights. A consistency check is also performed for both Bayesian BWM and Fuzzy AHP to ensure the reliability of the data.
The group decision-making technique based on the geometric mean is used to aggregate the overall criteria from different experts in this case study. Initially, the five main criteria are evaluated for both their weights and posterior distributions, as shown in Table 4. The posterior distribution reflects the confidence level, indicating the probability that one criterion is more significant than another. Additionally, the results for the sub-criteria evaluation under each main criterion are presented in Table 5. The Bayesian BWM results suggest that the environmental criterion (C2, with a weight of 0.2589) is the most important, while the social criterion (C3, with a weight of 0.1751) is the least important. The probability matrix shows that the probability of C2 being more significant than C3 is 0.8149. The sub-criteria analysis reveals that the most important factors are financial stability (C1.2, 0.3103), carbon footprint (C2.1, 0.5369), occupational health (C3.3, 0.4586), technological innovation (C4.3, 0.3420), and regulatory compliance (C5.3, 0.3594). The remaining results in Table 4 and Table 5 can be interpreted similarly. Additionally, the consistency of all experts’ judgments based on the Bayesian BWM is verified to ensure reliable pairwise comparisons, with all CR values falling within acceptable thresholds [47]. Specifically, the group CRs are 0.2047 for the main criteria (threshold: 0.2960 for a 5 × 5 matrix), 0.1931 for C1 (threshold: 0.2830 for a 4 × 4 matrix), 0.1611 for C3, 0.1634 for C4, and 0.1055 for C5 sub-criteria (threshold: 0.1870 for a 3 × 3 matrix).
Table 4.
Main criteria and probability matrix evaluation using the Bayesian BWM.
Table 5.
Sub-criteria and probability matrix evaluation using the Bayesian BWM.
Next, the Fuzzy AHP is applied to derive the criteria and sub-criteria weights, as shown in Table 6. The consistency check of all experts related to the main criteria and sub-criteria matrices also suggests that the CRs are within the acceptable threshold of 0.10. The results from the Fuzzy AHP indicate that the economic criterion (C1, with a weight of 0.3202) is the most important, while the social criterion (C3, with a weight of 0.1215) is the least important. The sub-criteria analysis reveals that the most important factors are cost (C1.1, 0.3476), carbon footprint (C2.1, 0.4305), occupational health (C3.3, 0.4595), distribution network (C4.2, 0.3520), and geopolitical risk (C5.2, 0.3748). The comparison between the Bayesian BWM and Fuzzy AHP ranking results shows overall consistency, although there are some differences in specific ranking sequences. This observation suggests that different subjective methods (i.e., Bayesian BWM vs. Fuzzy AHP) can yield variations in the results, even when applied by the same group of decision-makers. Therefore, a comparative analysis between these two methods should be conducted to explore the theoretical implications further.
Table 6.
Main and sub-criteria evaluations using the Fuzzy AHP.
Next, the main criteria and sub-criteria weights from both the Bayesian BWM and Fuzzy AHP are aggregated to calculate the global criteria weights for all 16 sub-criteria, as shown in Table 7. Additionally, the EWM is employed as an objective method to quantify the criteria weights based on the data dispersion provided in the decision-matrix table. Specifically, the entropy for each criterion is calculated to assess the level of data dispersion. A criterion with lower entropy indicates higher data variability, making it more important. The overall results for all 16 sub-criteria are presented in the table. The results from the EWM suggest that the most important criteria under each main category are market share (C1.4), carbon footprint (C2.1), occupational health (C3.3), distribution network (C4.2), and geopolitical risk (C5.2). These findings align overall with the results obtained from the subjective methods, although there are variations in the criteria weights.
Table 7.
Synthesized weight of each method and the combined weight using game theory.
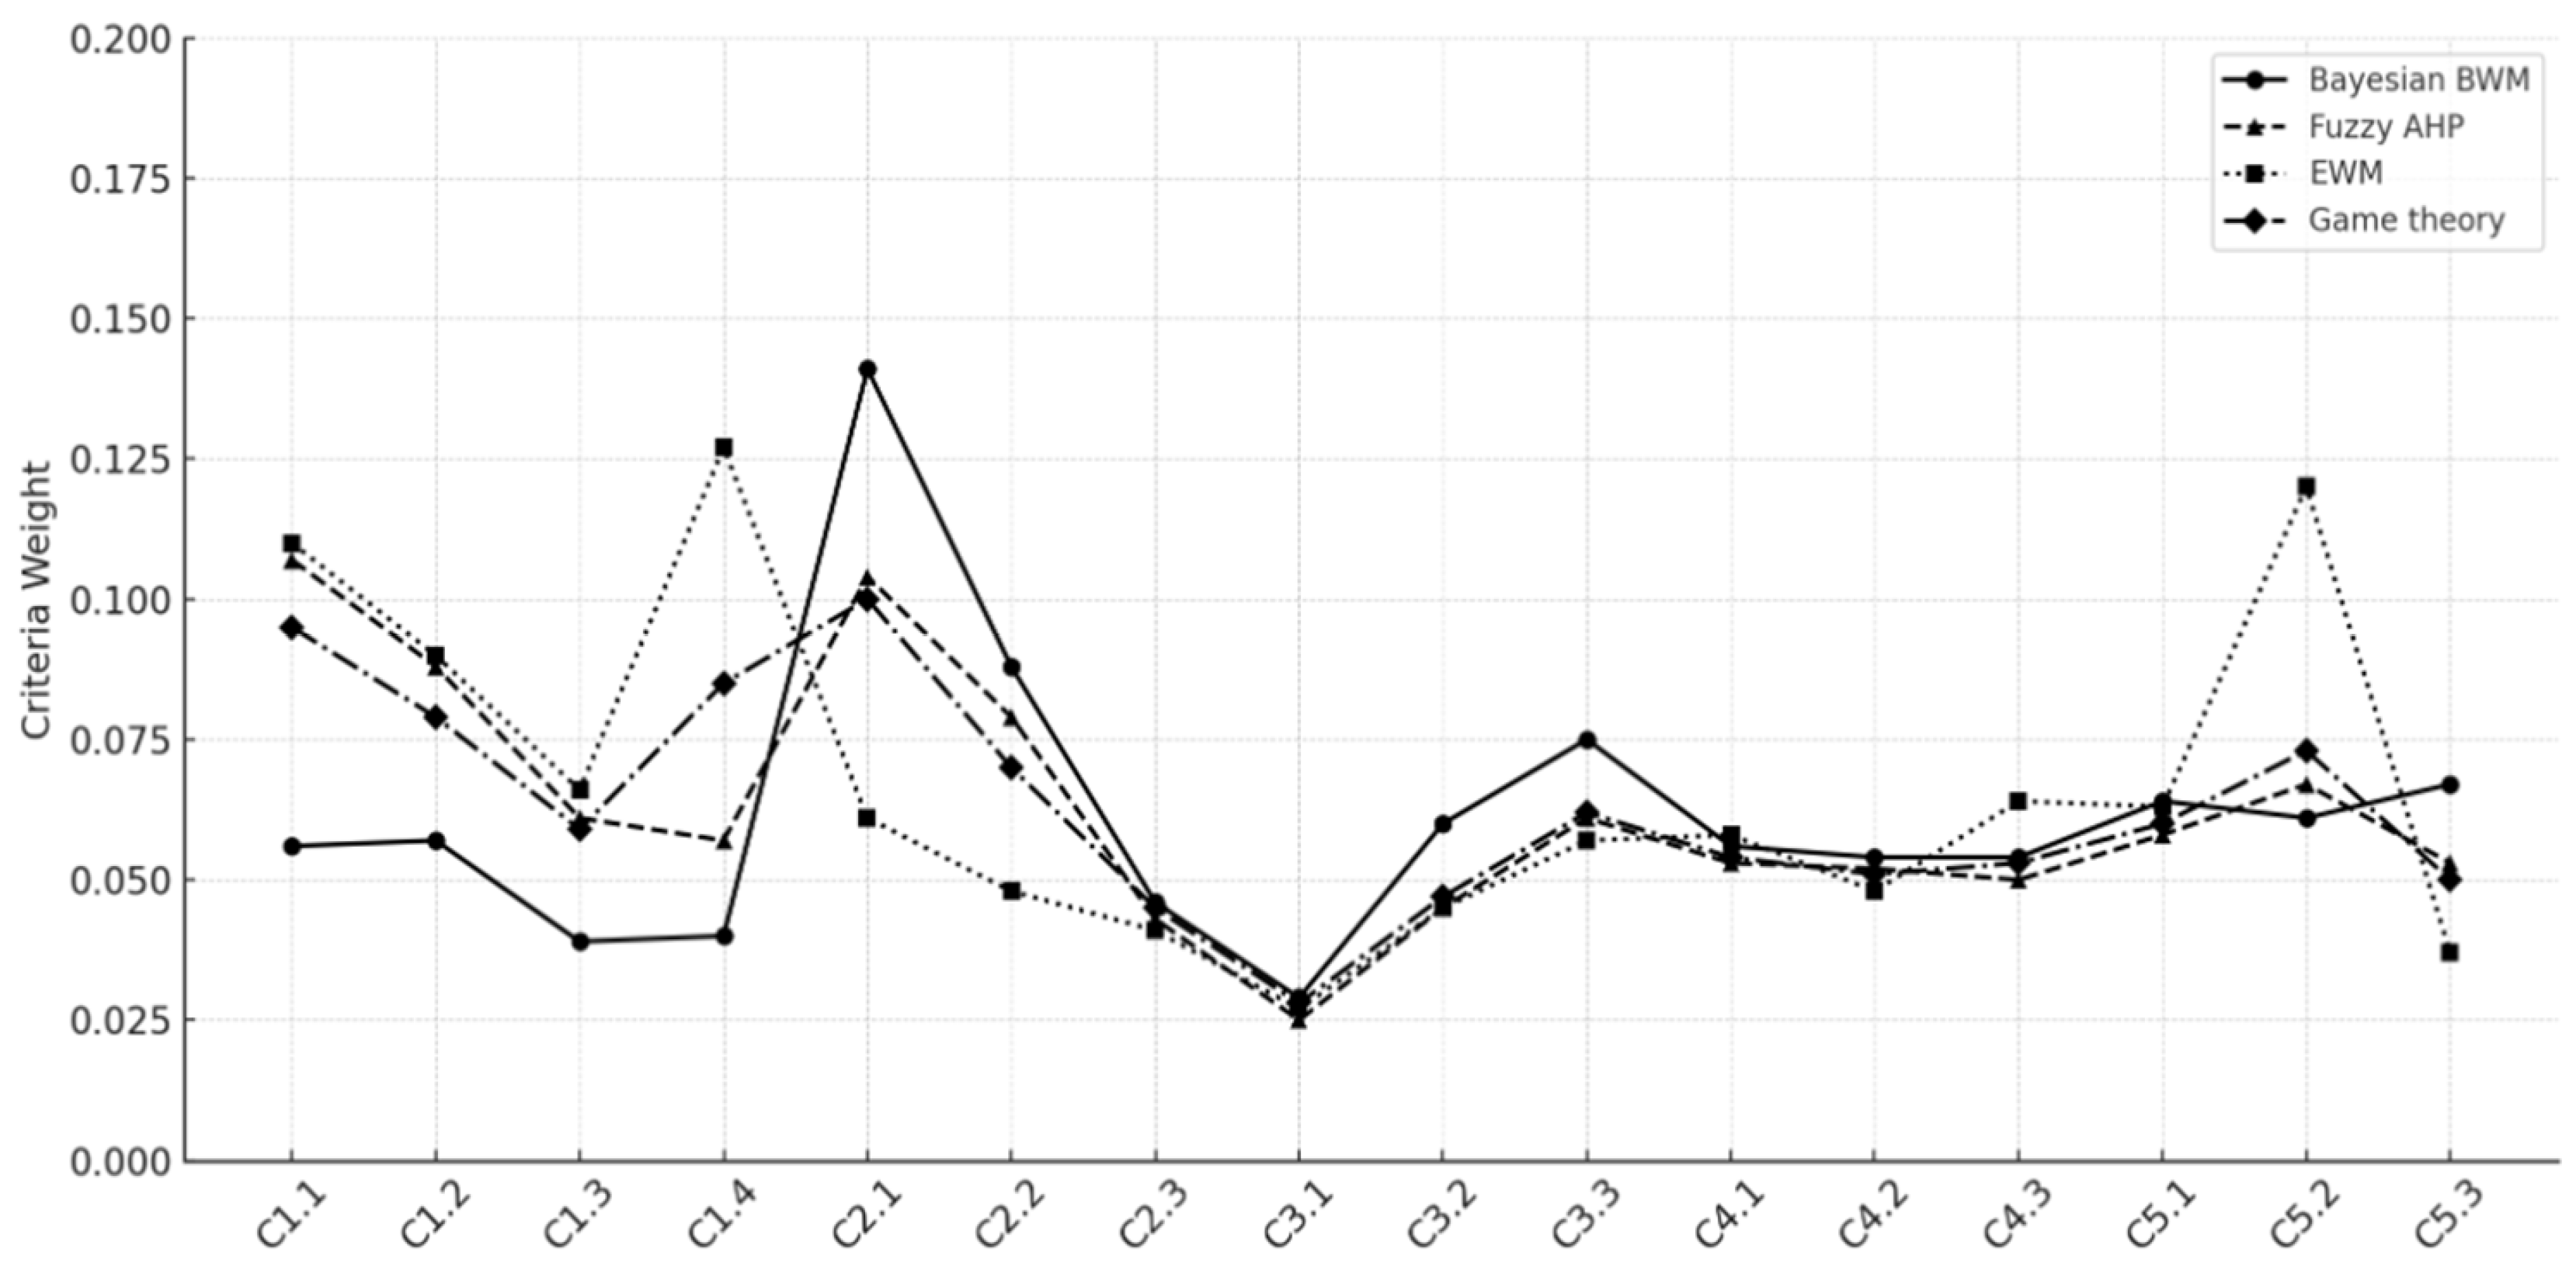
Finally, the game theory approach is used to synthesize the criteria from both the subjective and objective weighting methods to obtain the final combined criteria weight for ranking suppliers in the HSC case study. This approach minimizes the maximum discrepancy between the combined weights and the individual weight sets to ensure equilibrium and weight stability in the context of this study. In other words, a stable combined weight is achieved, where no criterion or decision-maker can improve their outcome by changing their weight, given the weights of others, leading to a balanced result. The overall results from the game theory approach indicate that the most important criteria across all main categories are cost (C1.1), carbon footprint (C2.1), occupational health (C3.3), distribution network (C4.2), and geopolitical risk (C5.2). Figure 4 illustrates the comparisons among the methods used to quantify the criteria weights. Additionally, the criteria ranking results are illustrated in a radar chart in Figure 5. Clearly, trade-offs exist across the different ranking methods, with noticeable variations in how each method prioritizes sub-criteria. Among them, the game theory-based method provides a more balanced prioritization, avoiding extreme highs or lows in the ranking by considering the strategic interactions among criteria. As a result, the game theory-based framework provides a robust approach for decision-making contexts that require compromise and stability across multiple evaluation dimensions. It is noted that the combined weights obtained from the game theory approach will be used to evaluate the supplier selection problem in the HSC in the next phase.
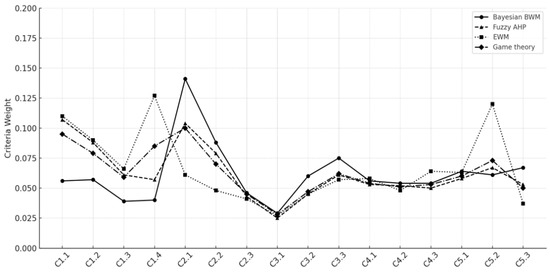
Figure 4.
Criteria weight comparison among different methods.
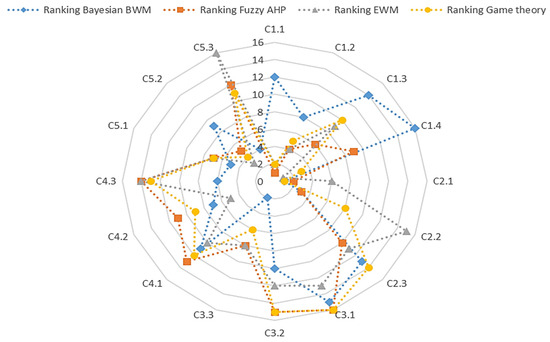
Figure 5.
Radar chart for ranking criteria among different methods.
Next, to quantitatively assess the stability of the aggregated weights obtained from the game theory approach, we apply the Weighting Stability Coefficient (WSC) introduced by [73], which can be used to measure synchronization consistency among pairs of weighting vectors. In particular, the WSC can be computed as shown in Equation (27) to assess a set of weights derived from different subjective weighting methods, where a higher WSC indicates greater stability and reliability of the weighting results. Table 8 presents the WSC analysis among the Bayesian BWM, Fuzzy AHP, EWM, and the game theory-integrated weight vectors. The WSC values between the individual methods range from 0.7646 (Bayesian BWM vs. EWM) to 0.8585 (Fuzzy AHP vs. EWM), with an average of 0.8228, indicating moderate to strong consistency among techniques. Notably, the WSC values between each individual method and the game theory weights are higher, ranging from 0.8621 to 0.9238 with an average of 0.8953. This suggests that the game theory-based aggregation harmonizes divergent priorities by aligning closely with all methods. The improved agreement reinforces the effectiveness of the game theory approach in resolving conflicts between subjective and objective weighting schemes in this study.
Table 8.
The WSC analysis of different methods.
4.3. Results for the Supplier Ranking Using TODIM
This subsection discusses the results obtained from the supplier ranking using the TODIM method. The TODIM method, grounded in prospect theory, accounts for how decision-makers perceive gains and losses differently for each alternative. Specifically, TODIM reflects the tendency for losses to weigh heavier than equivalent gains, making it particularly useful in scenarios where risk perception significantly influences decision-making. Given that the HSC is a relatively emerging sector with dynamic conditions, the TODIM method is applied in this study. Initially, the normalized data are presented in Table 9. Next, using the combined criteria weight obtained from the game theory approach discussed earlier, the dominance degree for each alternative pair is computed based on all evaluated criteria. The resulting dominance degree matrix for all alternative pairs is shown in Table 10. This matrix represents the extent to which alternative i dominates or is dominated by alternative k, considering both gains and losses across all criteria. Positive values indicate dominance, while negative values reflect inferiority. For example, the A3 supplier demonstrates strong dominance over most alternatives, particularly A5 (dominance degree of 0.8527) and A4 (dominance degree of 0.8086). Conversely, the A5 and A4 suppliers show predominantly negative dominance scores, signifying their poor performance relative to other suppliers. The dominance degree for other alternative pairs can be interpreted similarly.
Table 9.
Normalized matrix for supplier alternatives using TODIM.
Table 10.
The dominance degree matrix for each pair of supplier alternatives.
Next, the overall dominance degree and final prospect values are computed to rank the supplier alternatives, as shown in Table 11. The overall dominance degree reflects each supplier alternative’s net performance, while the prospect value represents a normalized score between zero and one, indicating the relative attractiveness of each alternative. Supplier A3 achieved the highest overall dominance degree (3.2975) and prospect value (1.0000), making it the top-ranked alternative. Suppliers A7 and A2 followed closely, with strong positive dominance scores and high prospect values, securing the second and third positions, respectively. In contrast, supplier A5 received the lowest dominance degree (−2.6712) and a prospect value of zero, placing it at the bottom of the ranking. These results provide clear insights into the relative strengths of each supplier, assisting decision-makers in selecting the most suitable supplier alternative based on multiple criteria.
Table 11.
The overall dominance degree and the prospect value for supplier ranking.
5. Sensitivity Analysis and Managerial Insights
5.1. Sensitivity Analysis of the Loss Aversion Parameter
The sensitivity analysis of the the loss aversion parameter in the TODIM method is presented next. The loss aversion parameter originates from prospect theory, which is the theoretical foundation of TODIM. This parameter typically controls the degree to which losses are weighted more heavily than gains to reflect loss aversion. As shown in Table 12, the sensitivity analysis explores how varying the loss aversion parameter influences the ranking of alternatives (A1–A7). This parameter adjusts the weight placed on losses relative to gains, reflecting the decision-maker’s attitude toward risk: higher values imply stronger aversion to losses, causing the method to penalize alternatives with poor performance more heavily. In this analysis, the loss aversion parameter increases from 1.0 (neutral or symmetric gains/losses) to 5.0 (strong loss aversion) and the rankings are assessed, where the reference criterion is the one with the highest weight [60].
Table 12.
Sensitivity analysis of the loss aversion parameter.
That is, the most favorable alternative, A3, consistently maintains the first rank across all levels, indicating that it performs well in both gain and loss domains and is robust to changes in risk attitude. Alternatives A2, A4, and A1 exhibit a similar trend: each improves by one rank as the loss aversion parameter increases from 1.0 to 2.0 and then maintains a stable rank through higher levels of loss sensitivity. Specifically, A2 moves from rank three to two, A4 from rank six to five, and A1 from rank four to three. This finding suggests that these alternatives benefit slightly when a greater weight is placed on losses, indicating that they are relatively less penalized in the loss domain and are reliable choices for decision-makers with higher sensitivity to losses. Additionally, alternative A7 displays a distinctive and meaningful trend in the sensitivity analysis: it starts with a strong position at rank two when the loss aversion parameter is 1.0, but then consistently drops to rank four as the loss aversion parameter increases to 2.0 and remains at that lower rank through 5.0. This downward shift indicates that A7 performs relatively well when gains and losses are treated equally (neutral loss aversion), but becomes less favorable as the decision-maker places more emphasis on losses. Alternatives A5 and A6 also show a notable reversal in ranking as loss aversion increases. In particular, A6 becomes less attractive under risk-averse conditions, while A5 remains consistently poor but relatively stable.
5.2. Sensitivity Analysis of Criteria Weights
The sensitivity analysis of criteria weights is then conducted across five scenarios, each emphasizing a single primary criterion, as presented in Table 13. In Scenario 1, the focus is entirely on the economic criteria (C1), with equal weights assigned to the sub-criteria of cost, financial stability, hydrogen quality range, and market share. Scenario 2 emphasizes the environmental criteria (C2), distributing equal weights among the carbon footprint, renewable energy use, and resource efficiency. Scenario 3 targets the social criteria (C3), giving equal emphasis to community engagement, labor practices, and occupational health. Similarly, Scenario 4 shifts the focus to operational capacity and technology criteria (C4), equally weighting the production capacity, distribution network, and technological innovation. Finally, Scenario 5 highlights the risk management criteria (C5), equally weighting supply chain resilience, geopolitical risk, and regulatory compliance. This structured variation in weight distribution allows for an analysis of how supplier rankings shift when decision-makers prioritize different strategies in various decision-making contexts.
Table 13.
The criteria weight scenarios for the sensitivity analysis.
The sensitivity analysis results demonstrate how supplier rankings shift based on different strategic priorities, as shown in Table 14. When economic, production capacity, and technology-related criteria (Scenarios 1 and 4) are prioritized, Supplier A3 ranks first, indicating its strong financial performance, technological edge, and operational scalability. In contrast, under an environmental focus (Scenario 2), Supplier A6 takes the lead, reflecting its superior environmental profile. In Scenario 3, where social criteria are emphasized, Supplier A2 ranks highest, showcasing its strengths in labor practices and community engagement. Finally, under a risk management focus (Scenario 5), Supplier A7 is ranked first, highlighting its resilience and regulatory compliance. Overall, Supplier A3 consistently performs well across most scenarios, indicating balanced capabilities. Additionally, Suppliers A7 and A2 demonstrate strong, scenario-dependent competitiveness, emphasizing their adaptability in specific strategic contexts.
Table 14.
The ranking results based on varied scenarios in the sensitivity analysis.
Additionally, the weighted similarity (WS) coefficient proposed by [74] is applied to quantify how similar two rankings are, with a special emphasis on the top-ranked items. In this study, the similarity between the rankings from different scenarios compared to the base scenario ranking is evaluated. A higher WS value means that two rankings are very similar, especially at the top, while a lower WS value signals significant differences. Specifically, Scenario 1 shows the highest similarity to the base scenario with a WS of 0.928, indicating only minor differences, particularly among top-ranked alternatives. In contrast, Scenario 2, with a WS of 0.569, reveals the greatest divergence, reflecting significant shifts in rankings. Scenario 3 (WS = 0.678) also shows substantial differences, while Scenario 4 (WS = 0.901) is relatively close to the base, suggesting only moderate changes. Scenario 5 (WS = 0.788) lies in between, showing some reordering but retaining reasonable similarity.
A comparative study is conducted to evaluate the ranking stability using different weighting methods, incorporating the Monte Carlo simulation technique. In this approach, criteria weights are randomly disturbed within a specified range, with a 10% increase or decrease applied in each iteration. To assess the stability of the rankings, a correlation measure is used, specifically Kendall’s Tau, as presented in Equation (28). This nonparametric measure evaluates the degree of agreement between two rankings [73]. The method emphasizes the number of concordant and discordant pairs, with values ranging from −1 (complete disagreement) to +1 (perfect agreement). In the context of MCDA, Kendall’s Tau can be applied to compare the baseline rankings with those generated under perturbed weights, providing insights into the robustness of the decision-making process. A high Kendall’s Tau value indicates that the rankings remain consistent despite variations in criteria weights, thus demonstrating the stability and reliability of the ranking method.
where C (D) is the number of concordant (discordant) pairs and n is the number of alternatives.
The Monte Carlo simulation results, conducted over 1000 iterations with ±10% perturbations in criteria weights, yield the following Kendall’s Tau values for the four weighting methods: Bayesian BWM (0.0476), Fuzzy AHP (0.0476), EWM (0.0368), and game theory (0.0474). These findings suggest that the pure subjective methods, namely, Bayesian BWM and Fuzzy AHP, exhibit a slightly higher ranking stability. Although both methods show marginally better stability metrics, they rely on subjective expert judgments, which can introduce potential biases and inconsistencies. On the other hand, the purely subjective method, EWM, demonstrates a slightly lower ranking stability. This lower stability is due to the fact that EWM relies solely on the dataset, making it more sensitive to perturbations in the data. However, the integrated weights derived through the game theory approach strike a near-optimal balance between subjective and objective weighting methods. By combining the strengths of both subjective and objective approaches, game theory provides a more robust and balanced solution, maintaining stability while minimizing potential biases and inconsistencies.
5.3. Managerial Insights and Practical Limitations
The study provides HSC managers with a structured, data-driven approach to a supplier evaluation in complex and uncertain environments. Using a hybrid MCDA framework that integrates Bayesian BWM, Fuzzy AHP, and EWM, harmonized through a game theory approach, decision-makers can achieve balanced, consensus-driven criteria weighting that emphasizes both sustainability and techno-risk factors in supplier selection. However, the integrated MCDA approach has several limitations. It requires consistency across the different weighting methods, and the selection of criteria and normalization of weights often depend on decision-makers’ judgments and the availability of reliable data. Additionally, the static nature of the criteria and weights may not fully capture dynamic changes in the operating environment. To address these challenges, advanced statistical analyses and machine learning techniques could be integrated to enhance the framework’s adaptability and responsiveness. Furthermore, recent MCDA techniques such as SPOTIS [75] and RANCAM [76] have emerged to overcome the drawbacks inherent in traditional methods, improving the robustness and reliability of decision-making processes in complex supply chain contexts. Given the continuous development of new MCDA methods, it is increasingly important to have reliable evaluation tools for validating and benchmarking these methods, ultimately enhancing the credibility and consistency of decision-making outcomes [74,77].
The game theory framework to assess criteria weight in this study acts as a strategic aggregation tool, treating each individual method as a rational contributor to a cooperative solution. This approach resolves inconsistencies, reduces bias, and leverages complementary insights, resulting in more robust and balanced criteria weighting for supplier selection in the complex HSC context. This study also demonstrates that supplier ranking using the TODIM method provides a clear hierarchy of preferred suppliers. The results empower key stakeholders and policymakers to make informed strategic sourcing decisions by identifying suppliers who meet technical and economic criteria while aligning with long-term operational resilience and sustainability goals in the HSC. The sensitivity and comparative analyses using weighting stability and weighted similarity coefficients for both criteria weights and obtained rankings provide clear evidence supporting the integrated game theory framework with the TODIM method. These findings not only validate the robustness of the proposed approach but also underscore its theoretical implications, demonstrating how combining diverse MCDA techniques through a cooperative game theory model enhances decision reliability and adaptability, particularly in dynamic policy environments in HSC. Ultimately, the proposed framework in this study can serve as a decision support tool for companies within HSC, particularly in emerging markets, helping them align their supplier selection processes with strategic objectives and fostering sustainable industrial growth.
6. Conclusions
The hydrogen supply chain (HSC) begins with hydrogen production through various methods, followed by storage, transportation, and distribution to end-users. This study focuses on the hydrogen supplier selection process within the HSC, recognizing its crucial role in advancing the hydrogen industry and economy. Supplier selection at the upstream stage of the HSC is particularly significant, as it directly affects the performance and reliability of the midstream and downstream processes. Given the complexity of supplier selection in the HSC, which involves multiple criteria and an uncertain environment, an integrated MCDA framework is proposed. The key criteria for evaluating hydrogen suppliers in this study include economics, environment, society, operational capacity and technology, and risk management.
This study presents a practical approach to strategic hydrogen supplier selection by developing an integrated MCDA framework that combines Bayesian BWM, Fuzzy AHP, and EWM, with the game theory approach used to synthesize criteria weights. The application of TODIM enhances the decision-making process by incorporating risk-based behavioral insights, resulting in a more comprehensive supplier evaluation. Sensitivity and comparative analyses are conducted to demonstrate how hydrogen supplier rankings shift when decision-makers prioritize different strategies in varying decision-making contexts. Future research directions include exploring dynamic models with real-time data integration using advanced statistical analyses and/or machine learning techniques. Extending the framework to dynamic decision environments and integrating uncertainty representation through interval or fuzzy numbers at all modeling stages could further enhance the robustness and applicability of the model. Additionally, other MCDA methods could be applied to improve the model’s adaptability and effectiveness in evolving hydrogen industry contexts. Further investigation into diverse criteria and decision-maker roles within the HSC process is also recommended. Another promising direction for future research involves collaborating with industry stakeholders to access real-world procurement data and perform a comparative validation, thereby strengthening the practical relevance and applicability of the proposed model for the supplier selection problem in the HSC. Currently, uncertainty is addressed only in the weighting phase; introducing fuzziness or probabilistic distributions in supplier performance data would enhance realism and decision accuracy. Moreover, the discussion could be expanded to include more depth in terms of practical implications for procurement managers and policymakers, particularly in translating model outputs into actionable sourcing strategies. Moreover, applying the proposed approach to other strategic areas within the hydrogen economy would provide valuable insights and broaden its practical impact. Finally, the analysis and design of the HSC network connecting upstream, midstream, and downstream operations should be further assessed.
Author Contributions
Conceptualization, J.J. and K.R.; methodology, A.S.; formal analysis, A.S.; investigation, S.T.; resources, H.Z.; writing—original draft preparation, J.J.; writing—review and editing, K.R. All authors have read and agreed to the published version of the manuscript.
Funding
This research received no external funding.
Data Availability Statement
Dataset available on request from the authors.
Conflicts of Interest
The authors declare no conflict of interest.
References
- Kim, C.; Cho, S.H.; Cho, S.M.; Na, Y.; Kim, S.; Kim, D.K. Review of hydrogen infrastructure: The current status and roll-out strategy. Int. J. Hydrogen Energy 2023, 48, 1701–1716. [Google Scholar] [CrossRef]
- Monteiro, E.; Brito, P.S.D. Hydrogen supply chain: Current status and prospects. Energy Storage 2023, 5, e466. [Google Scholar] [CrossRef]
- International Energy Agency (IEA). Global Hydrogen Review 2024. 2024. Available online: https://www.iea.org/reports/global-hydrogen-review-2024 (accessed on 15 August 2024).
- Sultan, M.; Akram, M. An extended multi-criteria decision-making technique for hydrogen and fuel cell supplier selection by using spherical fuzzy rough numbers. J. Appl. Math. Comput. 2024, 71, 1843–1886. [Google Scholar] [CrossRef]
- Quitzow, R.; Nunez, A.; Marian, A. Positioning Germany in an international hydrogen economy: A policy review. Energy Strat. Rev. 2024, 53, 101361. [Google Scholar] [CrossRef]
- Hydrogen Council. Hydrogen Insights 2023. An Update on the State of the Global Hydrogen Economy. 2023. Available online: https://hydrogencouncil.com/en/hydrogen-insights-2023/ (accessed on 15 August 2024).
- Ransikarbum, K.; Chanthakhot, W.; Glimm, T.; Janmontree, J. Evaluation of sourcing decision for hydrogen supply chain using an integrated multi-criteria decision analysis (MCDA) tool. Resources 2023, 12, 48. [Google Scholar] [CrossRef]
- Hasankhani, M.; van Engelen, J.; Celik, S.; Diehl, J.C. Unveiling complexity of hydrogen integration: A multi-faceted exploration of challenges in the Dutch context. J. Clean. Prod. 2024, 434, 139927. [Google Scholar] [CrossRef]
- Li, F.; Liu, D.; Sun, K.; Yang, S.; Peng, F.; Zhang, K.; Guo, G.; Si, Y. Towards a future hydrogen supply chain: A review of technologies and challenges. Sustainability 2024, 16, 1890. [Google Scholar] [CrossRef]
- Azadnia, A.H.; McDaid, C.; Andwari, A.M.; Hosseini, S.E. Green hydrogen supply chain risk analysis: A european hard-to-abate sectors perspective. Renew. Sustain. Energy Rev. 2023, 182, 113371. [Google Scholar] [CrossRef]
- Ransikarbum, K.; Aydın, N.; Janmontree, J.; Zadek, H. Analysis of solar and wind farm area using technique for order of preference by similarity to ideal solution. E3S Web Conf. 2025, 610, 01001. [Google Scholar] [CrossRef]
- Janmontree, J.; Zadek, H.; Ransikarbum, K. Analyzing solar location for green hydrogen using multi-criteria decision analysis. Renew. Sustain. Energy Rev. 2025, 209, 115102. [Google Scholar] [CrossRef]
- Ransikarbum, K.; Zadek, H.; Janmontree, J. Evaluating Renewable Energy Sites in the Green Hydrogen Supply Chain with Integrated Multi-Criteria Decision Analysis. Energies 2024, 17, 4073. [Google Scholar] [CrossRef]
- Zhao, W.; Ma, J.; Wang, Z.; Li, Y.; Zhang, W. Potential hydrogen market: Value-added services increase economic efficiency for hydrogen energy suppliers. Sustainability 2022, 14, 4804. [Google Scholar] [CrossRef]
- Li, H.; Cao, X.; Liu, Y.; Shao, Y.; Nan, Z.; Teng, L.; Peng, W.; Bian, J. Safety of hydrogen storage and transportation: An overview on mechanisms, techniques, and challenges. Energy Rep. 2022, 8, 6258–6269. [Google Scholar] [CrossRef]
- Ma, N.; Zhao, W.; Wang, W.; Li, X.; Zhou, H. Large scale of green hydrogen storage: Opportunities and challenges. Int. J. Hydrogen Energy 2024, 50, 379–396. [Google Scholar] [CrossRef]
- Xie, Z.; Jin, Q.; Su, G.; Lu, W. A Review of hydrogen storage and transportation: Progresses and challenges. Energies 2024, 17, 4070. [Google Scholar] [CrossRef]
- Ding, B.; Li, Z.; Li, Z.; Xue, Y.; Chang, X.; Su, J.; Sun, H. Cooperative Operation for Multiagent Energy Systems Integrated with Wind, Hydrogen, and Buildings: An Asymmetric Nash Bargaining Approach. IEEE Trans. Ind. Inform. 2025. early access. [Google Scholar] [CrossRef]
- Xuan, A.; Sun, Y.; Liu, Z.; Zheng, P.; Peng, W. An ADMM-based tripartite distributed planning approach in integrated electricity and natural gas system. Appl. Energy 2025, 388, 125660. [Google Scholar] [CrossRef]
- Handique, A.J.; Peer, R.; Haas, J.; Osorio-Aravena, J.C.; Reyes-Chamorro, L. Distributed hydrogen systems: A literature review. Int. J. Hydrogen Energy 2024, 85, 427–439. [Google Scholar] [CrossRef]
- Niemsakul, J.; Hiranmahapol, S.; Janmontree, J.; Zadek, H.; Ransikarbum, K. Analysis of barriers for hydrogen-fueled logistics under integrated sustainability: A DEMATEL-TOWS framework. J. Clean. Prod. 2025, 513, 145720. [Google Scholar] [CrossRef]
- Reuß, M.; Dimos, P.; Léon, A.; Grube, T.; Robinius, M.; Stolten, D. Hydrogen road transport analysis in the energy system: A case study for Germany through 2050. Energies 2021, 14, 3166. [Google Scholar] [CrossRef]
- Bolz, S.; Thiele, J.; Wendler, T. Regional capabilities and hydrogen adoption barriers. Energy Policy 2024, 185, 113934. [Google Scholar] [CrossRef]
- Trencher, G.; Edianto, A. Drivers and barriers to the adoption of fuel cell passenger vehicles and buses in Germany. Energies 2021, 14, 833. [Google Scholar] [CrossRef]
- Guan, Y.; Liu, Z.; Du, Y.; Xu, D. Evaluating batteries for renewable energy storage: A hybrid MCDM framework based on combined objective weights and uncertainty-preserved COPRAS. J. Renew. Sustain. Energy 2023, 15, 044102. [Google Scholar] [CrossRef]
- Park, S.-G.; Park, J.-H.; Kim, J.-Y.; Lee, S.; Hwang, M.-H. Innovative framework for selecting sustainable hydrogen refueling station sites: Integrating resilience and interdependence. Int. J. Hydrogen Energy 2025, 140, 678–693. [Google Scholar] [CrossRef]
- Alavi, B.; Tavana, M.; Mina, H. A dynamic decision support system for sustainable supplier selection in circular economy. Sustain. Prod. Consum. 2021, 27, 905–920. [Google Scholar] [CrossRef]
- Shekarian, E.; Ijadi, B.; Zare, A.; Majava, J. Sustainable supply chain management: A comprehensive systematic review of industrial practices. Sustainability 2022, 14, 7892. [Google Scholar] [CrossRef]
- Xie, Z.; Tian, G.; Tao, Y. A multi-criteria decision-making framework for sustainable supplier selection in the circular economy and industry 4.0 era. Sustainability 2022, 14, 16809. [Google Scholar] [CrossRef]
- Hjeij, D.; Bicer, Y.; bin Saleh Al-Sada, M.; Koç, M. Hydrogen export competitiveness index for a sustainable hydrogen economy. Energy Rep. 2023, 9, 5843–5856. [Google Scholar] [CrossRef]
- Bique, A.O.; Maia, L.K.K.; Grossmann, I.E.; Zondervan, E. Design of hydrogen supply chains under demand uncertainty—A case study of passenger transport in Germany. Phys. Sci. Rev. 2023, 8, 741–762. [Google Scholar] [CrossRef]
- Singh, R.R.; Zindani, D.; Maity, S.R. A novel fuzzy-prospect theory approach for hydrogen fuel cell component supplier selection for automotive industry. Expert Syst. Appl. 2024, 246, 123142. [Google Scholar] [CrossRef]
- Alipour, M.; Hafezi, R.; Rani, P.; Hafezi, M.; Mardani, A. A new Pythagorean fuzzy-based decision-making method through entropy measure for fuel cell and hydrogen components supplier selection. Energy 2021, 234, 121208. [Google Scholar] [CrossRef]
- Hashemi, S.H.; Karimi, A.; Tavana, M. An integrated green supplier selection approach with analytic network process and improved Grey relational analysis. Int. J. Prod. Econ. 2015, 159, 178–191. [Google Scholar] [CrossRef]
- Sarkis, J.; Dhavale, D.G. Supplier selection for sustainable operations: A triple-bottom-line approach using a Bayesian framework. Int. J. Prod. Econ. 2015, 166, 177–191. [Google Scholar] [CrossRef]
- Badri Ahmadi, H.; Hashemi Petrudi, S.H.; Wang, X. Integrating sustainability into supplier selection with analytical hierarchy process and improved grey relational analysis: A case of telecom industry. Int. J. Adv. Manuf. Technol. 2017, 90, 2413–2427. [Google Scholar] [CrossRef]
- Faisal, M.N.; Al-Esmael, B.; Sharif, K.J. Supplier selection for a sustainable supply chain: Triple bottom line (3BL) and analytic network process approach. Benchmarking Int. J. 2017, 24, 1956–1976. [Google Scholar] [CrossRef]
- Luthra, S.; Govindan, K.; Kannan, D.; Mangla, S.K.; Garg, C.P. An integrated framework for sustainable supplier selection and evaluation in supply chains. J. Clean. Prod. 2017, 140, 1686–1698. [Google Scholar] [CrossRef]
- Lu, H.; Jiang, S.; Song, W.; Ming, X. A rough multi-criteria decision-making approach for sustainable supplier selection under vague environment. Sustainability 2018, 10, 2622. [Google Scholar] [CrossRef]
- Hendiani, S.; Mahmoudi, A.; Liao, H. A multi-stage multi-criteria hierarchical decision-making approach for sustainable supplier selection. Appl. Soft Comput. 2020, 94, 106456. [Google Scholar] [CrossRef]
- Roy, S.A.; Ali, S.M.; Kabir, G.; Enayet, R.; Suhi, S.A.; Haque, T.; Hasan, R. A framework for sustainable supplier selection with transportation criteria. Int. J. Sustain. Eng. 2020, 13, 77–92. [Google Scholar] [CrossRef]
- Fallahpour, A.; Wong, K.Y.; Rajoo, S.; Fathollahi-Fard, A.M.; Antucheviciene, J.; Nayeri, S. An integrated approach for a sustainable supplier selection based on Industry 4.0 concept. Environ. Sci. Pollut. Res. 2021, 1–19. [Google Scholar] [CrossRef]
- Nguyen, T.-L.; Nguyen, P.-H.; Pham, H.-A.; Nguyen, T.-G.; Nguyen, D.-T.; Tran, T.-H.; Le, H.-C.; Phung, H.-T. A novel integrating data envelopment analysis and spherical fuzzy MCDM approach for sustainable supplier selection in steel industry. Mathematics 2022, 10, 1897. [Google Scholar] [CrossRef]
- Dua, R.; Guzman, A.F. A perspective on emerging energy policy and economic research agenda for enabling aviation climate action. Energy Res. Soc. Sci. 2024, 117, 103725. [Google Scholar] [CrossRef]
- Govindan, K.; Kannan, D.; Jørgensen, T.B.; Nielsen, T.S. Supply Chain 4.0 performance measurement: A systematic literature review, framework development, and empirical evidence. Transp. Res. Part E Logist. Transp. Rev. 2022, 164, 102725. [Google Scholar] [CrossRef]
- Anussornnitisarn, P.; Nivasanon, C.; Kim, N.; Ransikarbum, K. Sustainable technology selection in additive manufacturing: An integrated fuzzy decision analysis framework. Int. J. Adv. Manuf. Technol. 2025, 138, 1177–1196. [Google Scholar] [CrossRef]
- Rezaei, J. Best-worst multi-criteria decision-making method. Omega 2015, 53, 49–57. [Google Scholar] [CrossRef]
- Mohammadi, M.; Rezaei, J. Bayesian best-worst method: A probabilistic group decision making model. Omega 2020, 96, 102075. [Google Scholar] [CrossRef]
- Rezaei, J. Best-worst multi-criteria decision-making method: Some properties and a linear model. Omega 2016, 64, 126–130. [Google Scholar] [CrossRef]
- Liang, F.; Brunelli, M.; Rezaei, J. Consistency issues in the best worst method: Measurements and thresholds. Omega 2020, 96, 102175. [Google Scholar] [CrossRef]
- Liu, Y.; Eckert, C.M.; Earl, C. A review of fuzzy AHP methods for decision-making with subjective judgements. Expert Syst. Appl. 2020, 161, 113738. [Google Scholar] [CrossRef]
- Majumder, P.; Balas, V.E.; Paul, A.; Baidya, D. Application of improved fuzzy best worst analytic hierarchy process on renewable energy. PeerJ Comput. Sci. 2021, 7, e453. [Google Scholar] [CrossRef]
- Wattanasaeng, N.; Ransikarbum, K. Sustainable planning and design for eco-industrial parks using integrated multi-objective optimization and fuzzy analytic hierarchy process. J. Ind. Prod. Eng. 2024, 41, 256–275. [Google Scholar] [CrossRef]
- Saaty, T.L. Decision making with the analytic hierarchy process. Int. J. Serv. Sci. 2008, 1, 83–98. [Google Scholar] [CrossRef]
- van Laarhoven, P.; Pedrycz, W. A fuzzy extension of Saaty’s priority theory. Fuzzy Sets Syst. 1983, 11, 229–241. [Google Scholar] [CrossRef]
- Chanthakhot, W.; Ransikarbum, K. Integrated IEW-TOPSIS and fire dynamics simulation for agent-based evacuation modeling in industrial safety. Safety 2021, 7, 47. [Google Scholar] [CrossRef]
- Song, Q.; Wang, Z.; Wu, T. Risk analysis and assessment of water resource carrying capacity based on weighted gray model with improved entropy weighting method in the central plains region of China. Ecol. Indic. 2024, 160, 111907. [Google Scholar] [CrossRef]
- Zhu, S.; Shi, X.; Yang, C.; Bai, W.; Wei, X.; Yang, K.; Li, P.; Li, H.; Li, Y.; Wang, G. Site selection evaluation for salt cavern hydrogen storage in China. Renew. Energy 2024, 224, 120143. [Google Scholar] [CrossRef]
- Shannon, C.E. A mathematical theory of communication. Bell Syst. Tech. J. 1948, 27, 379–423. [Google Scholar] [CrossRef]
- Llamazares, B. An analysis of the generalized TODIM method. Eur. J. Oper. Res. 2018, 269, 1041–1049. [Google Scholar] [CrossRef]
- Tian, X.; Li, W.; Liu, L.; Kou, G. Development of TODIM with different types of fuzzy sets: A state-of the-art survey. Appl. Soft Comput. 2021, 111, 107661. [Google Scholar] [CrossRef]
- Puppo, B.; Leles, M.; Mozelli, L.; Sbruzzi, E. A Multicriteria decision trading system based on prospect theory: A risk return analysis of the TODIM method. Processes 2022, 10, 609. [Google Scholar] [CrossRef]
- Ibrahim, M.A.R.; Jaini, N.I.; Khalif, K.M.N.K. A comprehensive review of hybrid game theory techniques and multi-criteria decision-making methods. J. Phys. Conf. Ser. 2021, 1988, 012056. [Google Scholar] [CrossRef]
- Lu, X.; Ren, S.; Cui, Y.; Yin, X.; Chen, X.; Zhang, Y.; Moghtaderi, B. A novel site selection approach for Co-location of petrol-hydrogen fueling stations using a game theory-based multi-criteria decision-making model. Int. J. Hydrogen Energy 2025, 106, 1443–1461. [Google Scholar] [CrossRef]
- Altman, E.I. Financial ratios, discriminant analysis and the prediction of corporate bankruptcy. J. Financ. 1968, 23, 589–609. [Google Scholar] [CrossRef]
- Risman, A.; Mulyana, B.; Silvatika, B.A.; Sulaeman, A.S. The effect of digital finance on financial stability. Manag. Sci. Lett. 2021, 11, 1979–1984. [Google Scholar] [CrossRef]
- S&P Global. 2025. Available online: https://www.spglobal.com/en (accessed on 15 August 2024).
- Grand View Research. Hydrogen Generation Market Size, Share & Trends Analysis Report. 2025. Available online: https://www.grandviewresearch.com/industry-analysis/hydrogen-generation-market (accessed on 15 August 2024).
- Busch, P.; Kendall, A.; Lipman, T. A systematic review of life cycle greenhouse gas intensity values for hydrogen production pathways. Renew. Sustain. Energy Rev. 2023, 184, 113588. [Google Scholar] [CrossRef]
- OSHA. 2025. Available online: https://www.osha.gov/recordkeeping (accessed on 15 August 2024).
- Han, Y.; Chong, W.K.; Li, D. A systematic literature review of the capabilities and performance metrics of supply chain resilience. Int. J. Prod. Res. 2020, 58, 4541–4566. [Google Scholar] [CrossRef]
- World Bank. Political Stability and Absence of Violence/Terrorism: Percentile Rank. 2023. Available online: https://data.worldbank.org/indicator/ (accessed on 15 August 2024).
- Shekhovtsov, A. How strongly do rank similarity coefficients differ used in decision making problems? Procedia Comput. Sci. 2021, 192, 4570–4577. [Google Scholar] [CrossRef]
- Sałabun, W.; Urbaniak, K. A new coefficient of rankings similarity in decision-making problems. In Computational Science—ICCS 2020, Proceedings of the 20th International Conference, Amsterdam, The Netherlands, 3–5 June 2020; Springer: Cham, Switzerland, 2020; pp. 632–645. [Google Scholar] [CrossRef]
- Dezert, J.; Tchamova, A.; Han, D.; Tacnet, J.-M. The SPOTIS rank reversal free method for multi-criteria decision-making support. In Proceedings of the 2020 IEEE 23rd International Conference on Information Fusion (FUSION), Rustenburg, South Africa, 6–9 July 2020; pp. 1–8. [Google Scholar]
- Więckowski, J.; Kizielewicz, B.; Shekhovtsov, A.; Sałabun, W. RANCOM: A novel approach to identifying criteria relevance based on inaccuracy expert judgments. Eng. Appl. Artif. Intell. 2023, 122, 106114. [Google Scholar] [CrossRef]
- Shekhovtsov, A. Evaluating the performance of subjective weighting methods for multi-criteria decision-making using a novel weights similarity coefficient. Procedia Comput. Sci. 2023, 225, 4785–4794. [Google Scholar] [CrossRef]


Disclaimer/Publisher’s Note: The statements, opinions and data contained in all publications are solely those of the individual author(s) and contributor(s) and not of MDPI and/or the editor(s). MDPI and/or the editor(s) disclaim responsibility for any injury to people or property resulting from any ideas, methods, instructions or products referred to in the content. |
© 2025 by the authors. Licensee MDPI, Basel, Switzerland. This article is an open access article distributed under the terms and conditions of the Creative Commons Attribution (CC BY) license (https://creativecommons.org/licenses/by/4.0/).