1. Introduction
Climate change and increasing greenhouse gas (GHG) emissions have become global issues that require immediate action [
1,
2]. The transportation sector is one of the main contributors to carbon dioxide (CO
2) emissions, especially through the use of fossil fuels such as gasoline and diesel [
3]. Efforts to reduce emissions in this sector are crucial in achieving environmental sustainability targets [
4]. One policy that can be implemented is a carbon tax, which aims to provide economic incentives for transportation actors to switch to more environmentally friendly technologies [
5]. However, the implementation of carbon taxes in the transportation sector still faces various challenges, both in terms of calculation, implementation, and effectiveness in reducing emissions [
6,
7].
Jakarta currently faces a number of environmental challenges, including air pollution, traffic congestion, and the impact of climate change [
8,
9]. Implementing a carbon tax in big cities can bring several benefits, including encouraging emission reduction [
10]. Jakarta is a city with a large population and intensive industrial activities, where by implementing a carbon tax, the government can provide economic incentives for companies and individuals to reduce carbon emissions, especially from the transportation and industrial sectors. Greenhouse gas emissions are often related to air pollution, so by reducing carbon emissions, you can reduce dangerous air pollutants such as fine particulates (PM2.5) and nitrogen dioxide (NO
2), which can harm human health. In addition, by implementing a carbon tax, the government can allocate revenue from this tax to finance investments in more efficient and environmentally friendly public transportation, as well as infrastructure for green mobility, such as bicycle lanes and supporting infrastructure.
By implementing a carbon tax, the government can encourage sustainable economic development by allocating revenue from the carbon tax to support sectors that promote green growth, such as renewable energy, environmentally friendly transportation, and green technology innovation [
11,
12]. By implementing a carbon tax, Jakarta can be an example for other cities in Indonesia and around the world regarding its commitment to reducing carbon emissions and addressing climate change. However, it is important to remember that implementing a carbon tax must also be carried out carefully while considering its impact on the economy and society as a whole, so a balanced approach and comprehensive strategy are needed to maximize the benefits of this policy. The implementation of a carbon tax has the potential to be a significant step in reducing carbon emissions [
13] and slowing the impacts of climate change [
14], such as flooding and sea level rise. This policy can support sustainable development through the allocation of tax revenues for the green sector [
15,
16], but it needs to be implemented with a balanced strategy so that the benefits are optimal without burdening society and the economy [
17].
Several previous studies that developed models for formulating carbon taxes were carried out using mathematical models with simulation factor experiments, sensitivity analysis, and decision tree algorithms. The model in [
18] uses a dynamic system approach combined with the STIRPAT model, designed to analyze the impact of carbon excise [
19]. Another model combines theoretical approaches, fiscal mechanism design, and empirical analysis to support the effectiveness of dynamic carbon tax policies in improving vehicle efficiency and reducing CO
2 emissions [
20]. The agent-based model approach provides a better context for understanding how the implementation of a carbon tax may impact the development of the cultivated protein industry and its impact on the conventional livestock sector [
21]. Carbon tax is a fiscal policy implemented by the government to set a price on carbon emissions from economic activities with the aim of providing economic incentives for companies and individuals to reduce greenhouse gas emissions, which are the main cause of climate change. By providing economic incentives to reduce emissions, the implementation of a carbon tax can encourage the development and adoption of cleaner and environmentally friendly technologies, thereby creating new markets for innovation and green technology [
22]. Revenue from the carbon tax can be used to support environmental programs such as investments in renewable energy, environmental conservation programs, and incentives for sustainable mobility. Apart from that, revenue from the carbon tax can also be used to help groups that may be affected by the negative economic impact of this policy. Carbon taxes serve as an economic incentive to encourage carbon emission reductions [
23] while internalizing environmental costs into the prices of goods and services [
24]. In addition to encouraging green technology innovation [
25], carbon tax revenues can be used to support environmental programs [
26] and help groups economically impacted by the policy [
27]. Carbon taxes provide incentives for companies to invest in green technologies [
28,
29], and support the transition to renewable energy [
30,
31], making them more competitive with fossil fuels [
32,
33]. They also reinforce international commitments to combating climate change [
34,
35] but require careful planning to mitigate negative economic impacts [
36,
37], and ensure their effectiveness in reducing carbon emissions [
38,
39].
The key role of the carbon tax formula is to assess the amount of carbon emissions produced by various human activities shown in
Table 1, especially in the transportation sector. The carbon tax formula plays an important role in measuring and determining the amount of tax imposed on carbon emissions [
22]. Carbon taxes help reduce carbon emissions, which, in turn, can help address the impacts of climate change [
40]. This tax is a tool to reduce the carbon footprint of a country or region, and the carbon tax formula provides a measurable and predictable framework and allows companies to plan long-term investments and integrate carbon costs into business strategies. Therefore, by using an economic approach, carbon taxes provide a solution that can be measured and implemented efficiently, utilizing market principles to achieve emission reductions. The effectiveness of a carbon tax depends heavily on careful policy design, including the right tax rate, how tax revenues are allocated, and supporting measures to ensure that the tax burden does not negatively impact certain sectors.
Directives issued by the government aimed at implementing a carbon tax in Indonesia refer to two main regulations: Law No. 7 of 2021 concerning the harmonization of tax regulations and Presidential Regulation No. 98 of 2021 concerning the application of carbon economic value for achieving targets of the national contribution and greenhouse gas emission control in Indonesia, with the amount of carbon tax set at IDR 30 per kg CO2e in the latter. However, although the regulation has been issued, the carbon tax was not implemented until now in various sectors, including the transportation sector. The basis of reference in determining the amount of carbon tax in government regulations is allegedly not very clear in its calculation reference. For this reason, it is necessary to reformulate the basis of reference for calculating the amount of the carbon tax that refers to social, economic, and environmental conditions in Indonesia more accurately and responsibly. Another gap is the lack of empirical data showing how the implementation of the carbon tax in the transportation sector can affect the behavior of users and transportation operators. How can an optimal carbon tax calculation formula, which is able to support environmental protection efforts and significantly reduce greenhouse gas emissions in Indonesia, be formulated in the transportation sector?
This study aims to produce a formula for calculating a carbon tax in the transportation sector. The carbon tax formula in this study is designed as a fiscal instrument that functions not only to internalize environmental externalities but also as a policy strategy that is responsive to national needs for reducing greenhouse gas emissions. To that end, the research design uses a quantitative descriptive and analytical approach to developing an optimal carbon tax calculation formula in the transportation sector. The study begins with the identification and measurement of key variables that influence the tariff structure, including the social cost of carbon, national emission reduction targets, economic impacts on transportation actors, funding needs for environmental programs, and dimensions of social justice in the distribution of the tax burden. Quantitative data were collected from secondary sources such as official government reports and national emission and transportation statistics, as well as academic literature and comparative studies related to the implementation of carbon taxes globally. The analysis process is carried out by building a mathematical model that integrates all of these variables into a tax formula structure based on the relative contribution of each factor. This model is used to test various policy scenarios, including how variations in tax rates affect emission volumes, transportation operating costs, and their impacts on different community groups. Quantitative simulations are conducted to evaluate the effectiveness of the formula in reducing emissions and identifying potential risks to economic stability and social inequality. Validation of the results is carried out through comparison with international benchmarks and local case studies so that the obtained carbon tax formula is not only theoretically strong but also applicable and contextual to Indonesian conditions. Thus, this research design produces data-based policies that are able to bridge environmental, fiscal, and social interests in a balanced manner.
This study highlights the importance of implementing a carbon tax in the transportation sector as a strategic step in reducing greenhouse gas emissions [
48] and supporting sustainable development [
49] in Jakarta and other major cities in Indonesia. Although regulations related to carbon taxes have been issued, their implementation is still not optimal, mainly due to the lack of clarity in calculating carbon tax rates [
50] in accordance with Indonesia’s social, economic, and environmental conditions. In the context of the transportation sector, the implementation of a carbon tax can provide several key benefits, including reducing air pollution [
51], accelerating the transition to renewable energy [
52], increasing investment in green technology [
53], and financing the development of more environmentally friendly transportation infrastructure [
54]. Carbon taxes function as economic instruments that provide incentives for companies and individuals to switch to low-carbon solutions such as electric vehicles and clean energy-based public transportation [
55].
The success of implementing a carbon tax policy depends heavily on key parameters such as carbon penalties and subsidies [
56]. The implementation of a carbon tax has been proven to be able to increase profits more significantly and efficiently in reducing carbon emissions compared to investing in green technology [
13]. Achieving the effectiveness of carbon tax policies requires more accurate tariff calculations by considering key factors such as the social cost of carbon [
57], emission reduction targets [
58], economic impacts [
59], revenue for environmental programs [
60], and social justice and equity [
61]. This study shows that by allocating carbon tax revenues to support the development of renewable energy [
62], green transportation subsidies [
63], and social justice programs [
64], this policy can be implemented in a more equitable and sustainable manner. This study makes a significant academic contribution by offering a new approach to understanding the spatial distribution of greenhouse gas emissions and the need for fiscal policy reform in the transportation sector, particularly through the development of a more adaptive carbon tax formula in Indonesia. By integrating air quality data as a proxy for emission distribution and linking it to the design of fiscal incentives that consider economic burdens, social inequalities, and behavioral change targets towards low-carbon transportation, this study enriches the literature on climate change mitigation policies in developing countries. In addition, this evidence-based approach opens up a new space for cross-disciplinary research that combines environmental, economic, and public policy analyses more comprehensively. The hypothesis of this study is that the carbon tax calculation formula that integrates the social cost of carbon, emission reduction targets, economic impacts, funding needs for environmental programs, and social justice aspects can be optimally applied in the transportation sector and contribute significantly to reducing greenhouse gas emissions in Indonesia.
3. Results
Carbon tax knowledge plays an important role in various aspects of public policy, the economy, the environment, and society. Some important roles in understanding carbon tax include controlling greenhouse gas emissions, encouraging green technology innovation, establishing fair and efficient policies, increasing public awareness and education, collecting revenue for environmental projects, supporting international agreements, government transparency and accountability, reducing dependence on fossil fuels, addressing economic uncertainty, and promoting social justice. Carbon taxes are designed to reduce greenhouse gas emissions by making emissions more expensive for companies and individuals. Therefore, by understanding how carbon taxes work, policymakers can design an effective system to achieve emission reduction targets.
Efforts made in calculating carbon taxes to understand global carbon emissions, the development of greenhouse gas emission data, and CO2 emissions in Indonesia play a very important role because these three factors help assess the scale and impact of climate change and design effective policies in accordance with emission reduction targets. Efforts to understand global carbon emissions provide an important context in designing carbon tax policies because climate change is a global challenge today. Understanding global carbon emissions, the development of greenhouse gas emission data, and CO2 emissions in Indonesia is very important in designing and calculating effective carbon tax rates. These data not only help the government determine which sectors to target but also allow for economic impact assessments, monitoring progress in reducing emissions, and ensuring that carbon tax policies are designed in a fair and sustainable manner. This information also serves as a baseline for measuring Indonesia’s success in contributing to global efforts to address climate change.
Therefore, efforts to identify global carbon emissions by countries play an important role in providing in-depth insight into the contribution and responsibility of countries to climate change, as presented in
Figure 2. The information obtained can help formulate fair, effective, and efficient policies in global efforts to reduce carbon emissions. Countries that produce large amounts of carbon emissions, especially industrial countries, have a greater responsibility to reduce emissions. By identifying the countries that contribute the most emissions, global reduction targets can be focused on sectors and countries that require the most significant changes. This allows for the establishment of mitigation policies that are in accordance with each country’s contribution to global carbon emissions. In addition, the importance of these data also reflects a greater moral responsibility for high-emitting countries to lead efforts to mitigate climate change while ensuring fairness for countries that are more vulnerable to its impacts.
This explanation has an important significance for the development of future climate change mitigation policies because it provides a solid foundation for building a fair and data-based responsibility-sharing system. By clearly knowing the emission contribution of each country, especially the largest emitting countries, decision-making can be directed towards the creation of regulations and economic instruments, such as carbon taxes or emissions trading, that are more proportional and targeted. In addition, this information encourages the creation of a more transparent and equitable international cooperation mechanism, where developed countries not only reduce their emissions but also support the low-carbon transition in developing countries. Therefore, global emissions data serve not only as a monitoring tool but also as a strategic basis for more sustainable and inclusive climate policy innovations in the future.
The steps to find out and understand Indonesia’s CO
2 emission trend from 1889 to 2020, presented in
Figure 3, are very important because they provide a historical overview and in-depth context of Indonesia’s role in global contributions to climate change and the challenges faced by the country in the transition to more environmentally friendly development. In addition, efforts to track Indonesia’s CO
2 emission trend provide information on how carbon emissions have evolved along with economic development and industrialization. This understanding is essential for designing effective climate policies, measuring the impact of existing policies, meeting international commitments, and planning future mitigation and adaptation measures. By utilizing this historical data, Indonesia can build a stronger and more sustainable strategy in facing the challenges of climate change while maintaining inclusive and green economic growth. This study is very important for future development because it provides a strong empirical basis for formulating national climate policies that are data-based and contextual. By understanding the historical trend of Indonesia’s CO
2 emissions over time, policymakers can identify critical periods of increasing emissions and their correlation with phases of economic growth, changes in energy policies, and industrialization. This knowledge not only helps evaluate the effectiveness of policies that have been implemented but also allows for more accurate planning of future emission mitigation strategies. In addition, these historical data strengthen Indonesia’s position in international negotiations by demonstrating its commitment and the need for support in the transition to a low-carbon economy. Thus, understanding the dynamics of long-term emissions becomes an important foundation for creating adaptive, progressive climate policies that are in line with Sustainable Development Goals.
Information on Indonesia’s greenhouse gas (GHG) emissions from 2010 to 2020, shown in
Figure 4, has great importance in the context of climate change mitigation, policy formulation, and evaluation of the success of emission reduction efforts. GHG emission data for a decade provide an overview of the development of Indonesia’s emissions over time. By monitoring trends from 2010 to 2020, we can see emission patterns from various sectors, such as energy, transportation, forestry, agriculture, and waste. It is important to identify whether efforts that have been made, such as greening, renewable energy, and energy efficiency, have succeeded in reducing emissions or failed [
72]. Steps to find out greenhouse gas emissions are an important tool in understanding emission developments, assessing the effectiveness of climate change mitigation policies, and determining the next steps to achieve national and international emission reduction targets. These data help ensure that Indonesia moves towards a low-carbon economy in an effective and equitable manner while maintaining economic growth and public welfare. This explanation plays an important role in future development because it provides a scientific and strategic basis for designing more targeted and sustainable climate change mitigation policies. By understanding the trend of Indonesia’s greenhouse gas (GHG) emissions during the 2010–2020 period, the government and stakeholders can evaluate the effectiveness of various programs that have been implemented, such as the adoption of renewable energy, energy efficiency, and forest rehabilitation. These data are also important for identifying sectors with high emission contributions and for setting intervention priorities. Furthermore, this information strengthens Indonesia’s position in international cooperation and supports efforts to achieve the Nationally Determined Contributions (NDC) targets. In the future, the use of these data will enable the formulation of evidence-based policies that not only significantly reduce emissions but also encourage inclusive and equitable economic development in the context of the transition to a green economy. Efforts to support data completeness, Indonesian oil consumption data is needed to consider carbon tax rates referring to CEIC Data shown in
Figure 5.
The carbon tax is based on the amount of greenhouse gas (GHG) emissions produced by the combustion of fossil fuels such as oil. Oil consumption is directly related to the amount of carbon emissions released into the atmosphere. Oil consumption data can be used to measure the total carbon emissions resulting from oil use in key sectors such as transportation, industry, and power generation. In addition, oil consumption data are used to determine the amount of carbon tax rates based on the amount of emissions resulting from oil use. This rate can be higher if the measured oil consumption produces large emissions. Oil consumption data provide an important foundation in determining fair and effective carbon tax rates. These data help calculate emissions, adjust taxes per sector, assess economic impacts, support emission reduction targets, and identify the necessary energy transitions. By using oil consumption data appropriately, carbon tax policies can be designed to minimize economic impacts while encouraging significant and sustainable emission reductions [
74]. Indonesia’s fuel consumption trend data, based on data from the Ministry of Energy and Mineral Resources, are very important in considering carbon tax rates shown in
Figure 6.
Carbon taxes are intended to reduce carbon emissions from the combustion of fossil fuels. These trend data play a role in determining effective and fair carbon tax rates. These data not only help calculate carbon emissions from fuel combustion but also provide important information about the economic impact, consumption behavior, and potential emission reductions in various sectors. This information allows the government to measure carbon emissions, target key sectors, and reduce the economic burden of environmental policies. By understanding fuel consumption patterns, the government can formulate targeted carbon tax policies, encourage energy transitions, and ensure economic and environmental sustainability in Indonesia. Ultimately, fuel consumption trends can help encourage the transition to clean energy and achieve carbon emission reduction targets [
76].
The price per unit of energy issued by the Ministry of Energy and Mineral Resources for fuels such as gasoline RON 90 and 92, Avtur, kerosene, gasoil CN 48 and CN 51, and LPG is very important in various aspects of energy, economic, and environmental policies, as presented in
Table 2. The price per unit of energy provides a strong basis for determining carbon tax rates. Each type of fuel has a different carbon emission potential, and fuel prices affect consumer behavior and cost structures in various sectors. Gasoline RON 90 and 92, which are widely used in private transportation, contribute significantly to carbon emissions. Knowing the price per liter helps design a proportional tax rate to reduce consumption of these fuels. Avtur and kerosene are often used in the aviation and household sectors and require tariff settings that are in accordance with the volume of use and their environmental impact. Gasoil CN 48 and CN 51 used in diesel vehicles and the industrial sector have higher emission intensity, so the carbon tax imposed can be higher to encourage the use of more environmentally friendly energy. LPG (liquefied petroleum gas) used in households and industry is a fossil fuel that is often a cleaner alternative to kerosene. Carbon tax rates need to consider the price per unit of LPG because if it is too high, it can affect low-income households. Efforts to find out the price per unit of energy, including gasoline, Avtur, kerosene, gasoil, and LPG, play an important role in designing effective, fair, and sustainable carbon tax rates. These price data allow the government to calculate economic impacts, manage energy subsidies, ensure social justice, and support the energy transition towards wider use of renewable energy. A deep understanding of energy prices helps in making balanced energy policies, reducing carbon emissions, and protecting the interests of society and the environment [
77].
Energy consumption data in the transportation sector issued by the Ministry of Energy and Mineral Resources play a very important role in considering the carbon tax rate shown in
Table 3. The transportation sector is one of the largest contributors to greenhouse gas emissions due to the intensive use of fossil fuels such as gasoline, gasoil (diesel), and Avtur (aviation fuel). The transportation sector has a high level of carbon emissions due to the significant use of fossil fuels. The volume of fuel use, such as gasoline RON 90 and RON 92, gasoil CN 48 and CN 51, and Avtur, which has a direct impact on the amount of carbon emissions produced. The transportation sector includes private vehicles, public transportation, and air transportation, each contributing different amounts of emissions. By understanding the energy consumption of the transportation sector, carbon tax policies can be adjusted to target the fuels that are most widely used and have the greatest impact on carbon emissions. Energy consumption data in the transportation sector are very important in designing and implementing effective carbon tax rates. These data help the government measure the contribution of carbon emissions from the transportation sector, determine the right tax rate, and understand the economic impact of the tax. In addition, these data also allow the formulation of policies that encourage energy efficiency [
78], support the transition to clean energy, and maintain social justice [
79]. Using appropriate data, the carbon tax can be an efficient policy instrument in reducing carbon emissions [
80] and achieving climate targets in Indonesia.
Knowledge of carbon taxes can encourage investments in environmentally friendly technologies and energy efficiency, where carbon taxes provide incentives for companies to develop and adopt technologies that reduce emissions. Understanding carbon taxes helps in designing fair and efficient policies that minimize the economic burden on society while still achieving environmental goals. Understanding carbon taxes includes identifying groups that may be disproportionately affected and designing appropriate compensation mechanisms. Knowledge related to carbon taxes can increase public awareness of climate change and the importance of reducing emissions in order to encourage more environmentally friendly behavior at the individual and community levels. Carbon taxes can be a significant source of revenue for governments, which can be used to fund environmental projects such as nature conservation, climate change adaptation, and renewable energy development. Knowledge of carbon taxes is important for supporting international commitments to climate change, such as the Paris Agreement, which helps countries demonstrate leadership in climate action and meet emission targets. By understanding how carbon taxes are calculated and applied, the public can demand transparency and accountability from the government in ensuring that carbon tax revenues are used effectively and in accordance with the intended purpose. Carbon taxes help reduce dependence on fossil fuels by making cleaner and renewable energy sources more economically competitive. A good understanding of carbon taxes allows companies to better plan for the future and reduce economic uncertainty caused by changes in climate policy. Carbon taxes can be designed to support social justice [
81] by allocating revenues to help groups most affected by climate change or to reduce the economic burden on low-income households. Therefore, knowing and understanding carbon taxes is an important step in creating effective, fair, and sustainable policies to address the challenges of climate change and achieve sustainable development [
82].
The comparative level of carbon prices based on the State and Trends of Carbon Pricing 2022 report plays an important role in designing effective and globally competitive carbon tax policies, as shown in
Figure 7 [
46]. This report provides insight into carbon price trends in various countries and jurisdictions that have implemented carbon pricing mechanisms such as carbon taxes and emission trading systems (ETS). This report presents a global picture of carbon prices applied by various countries, where Indonesia’s position is compared to other countries that have implemented carbon taxes or ETS. If the carbon price in Indonesia is much lower than in other countries, this can reduce the incentive for companies to reduce emissions and can put Indonesia behind in global climate change commitments. Data to understand carbon prices in other countries can help Indonesia adjust carbon tax rates to remain competitive, especially in export-oriented industrial sectors that face cross-border carbon tariffs in trading with partner countries. It is necessary to understand the comparative carbon prices in various countries so that the Indonesian government can set balanced rates. Carbon tax rates that are too low do not provide sufficient incentives to reduce emissions, while rates that are too high can burden industry and society. These data help in determine the optimal price range that is sufficient to reduce emissions but does not harm the economy. Countries with mature carbon pricing mechanisms, such as the European Union, Canada, and Japan, can provide guidance on effective tariffs and complementary policies needed to drive the energy transition without sacrificing economic growth. Understanding the comparative level of carbon prices is important in designing competitive, fair, and effective carbon tax policies to help Indonesia assess its global position, determine optimal tariffs, measure potential revenues, and maintain economic competitiveness in the face of international pressure to reduce carbon emissions. By following global trends in carbon pricing, Indonesia can play a bigger role in global efforts to address climate change while protecting the domestic economy and society.
Understanding the carbon tax formula is very important and useful for determining the right tariff, including understanding the formula for calculating carbon taxes, to help governments and policymakers determine the right tax rate. Tariffs that are too low are ineffective in reducing emissions, while tariffs that are too high can burden the economy and society. In addition, transparency and accountability are needed, which can be applied using clear and transparent formulas to increase accountability. Companies and individuals can understand how taxes are calculated to increase public trust in the policy. Economic impact needs to be measured by applying the formula where policymakers can model the economic impact of a carbon tax that allows for evaluating potential effects on economic growth, jobs, and the cost of living, and adjusting policies if necessary. It is important to plan and predict by determining the carbon tax formula that allows governments and companies to plan ahead, which is achieved by predicting the revenue that will be generated from the carbon tax and allocating the funds to environmental projects or social programs.
Furthermore, efforts to find out the carbon tax formula are directed towards evaluating the effectiveness of the policy, where knowing the carbon tax formula allows for a better evaluation of the effectiveness of the policy so that the government can monitor changes in emissions and assess whether the tax has achieved the desired emission reduction goals. The next step requires policy adjustments that can be implemented if the carbon tax formula is based on accurate data and a solid model so that policies can be adjusted quickly to respond to changes in emissions or economic conditions that allow for more dynamic and responsive policies. In addition, knowing the carbon tax formula is related to efforts to provide incentives appropriately by applying the right formula to help provide better incentives for companies and individuals to reduce emissions in the form of tax credits for investment in green technology or tax deductions for environmentally friendly business practices. By understanding the carbon tax formula, various parties can work together more effectively to achieve better environmental and climate goals while ensuring that the economic and social impacts of the policy are well managed. For this reason, efforts are needed to determine carbon tax rates that involve consideration of various economic, environmental, and social factors. There are several bases that can be used to determine carbon tax rates, including the social cost of carbon, emission reduction targets, economic impacts, revenues needed for environmental programs, social justice and balance, carbon market prices, and expert studies or recommendations. In determining carbon tax rates, it is necessary to involve consideration of various factors, including economic, environmental, and social factors. Some bases used to determine carbon tax rates include the social cost of carbon, emission reduction targets, economic impacts, revenues needed for environmental programs, and social justice and balance. Efforts to determine carbon tax rates by involving economic, environmental, and social considerations are important to ensure fair and balanced policies for all stakeholders, including industry, the general public, and vulnerable groups. In addition, it is necessary to meet national and global climate targets such as the Paris Agreement commitments, manage economic impacts to maintain industrial competitiveness and reduce negative impacts on low-income communities, support environmental programs that facilitate the energy transition and encourage green technology innovation, and create structural changes needed in a more environmentally friendly and sustainable economy in the future. Comprehensive planning by considering all these factors can encourage the implementation of carbon taxes that are effective, fair, and provide long-term benefits for the environment, economy, and society.
3.1. Calculating the Social Cost of Carbon
The social cost of carbon (SCC) is a monetary estimate of the economic loss caused by one ton of CO2 emissions into the atmosphere, including climate change impacts such as agricultural damage, human health, and environmental damage. SCC corresponds to the economic loss due to the emission of one ton of CO2 into the atmosphere, causing broad and measurable negative impacts on various aspects of human life and the environment, which ultimately results in real economic costs. CO2 emissions contribute to climate change causing global temperature increases, sea level rise, infrastructure damage due to natural disasters, reduced agricultural productivity, spread of diseases, and loss of biodiversity. All of these impacts require mitigation, recovery, or compensation costs that directly or indirectly burden the economy, whether at the individual, national, or global level. Therefore, SCC is used as an instrument to internalize the negative externalities of carbon emissions into economic calculations so that development and investment policies take into account the long-term losses to human well-being and environmental sustainability. Carbon tax rates are often based on estimates of the social cost of carbon. Calculating the social cost of carbon is a complex process involving multiple disciplines, including economics, climate science, and public policy. Common steps in calculating the SCC include climate modeling, economic impact modeling, future discounting, and uncertainty analysis.
Climate modeling aims to project climate change due to additional CO
2 emissions, where methods are developed using climate models that link CO
2 emissions to changes in global temperature, precipitation, sea level, and other climate phenomena that can be applied using integrated assessment models (IAMs) such as DICE (dynamic integrated climate-economy), FUND (climate framework for uncertainty, negotiation, and distribution), and PAGE (policy analysis of the greenhouse effect). Meanwhile, economic impact modeling aims to estimate the economic impact of projected climate change where the method is carried out by assessing how climate change affects economic sectors such as agriculture, health, energy, and infrastructure, which includes analysis of agricultural production losses, health costs due to climate-related diseases, infrastructure damage due to extreme weather, and changes in energy consumption. Economic impact modeling is a tool that functions to detect damage that links climate change with economic impacts. Future discounting is one of the efforts in calculating the social cost of carbon aimed at calculating the present value of future economic impacts. The future discount method uses a discount rate to convert future economic losses into present values, where the discount rate is a key factor in SCC because it is able to determine how much to value future losses compared to current costs. While uncertainty analysis aims to consider uncertainty in climate projections and economic impacts, the method uses sensitivity analysis and probability distribution to explore various scenarios and assumptions applied through Monte Carlo simulation and other statistical techniques to handle uncertainty. An example of the SCC calculation in a climate model is projecting that one additional ton of CO
2 will increase the average global temperature by 0.00001 °C. The economic impacts are calculated by assessing that the increase in temperature will cause a global economic loss of USD 10. In calculating the discounted future, a discount rate of 3% is used to calculate the present value of this future loss [
83]. Calculating the SCC is a complex process and requires various assumptions and models. The final result is highly dependent on the assumptions used in the climate model, the economic impacts, and the discount rate. Therefore, the SCC is often presented in a range of values to reflect the uncertainty and variability in the calculation.
The basic formula for calculating the SCC involves calculating the present value of the future economic losses resulting from CO
2 emissions.
SCC: Social cost of carbon (in dollars or currency units per ton of CO2).
Dt: Annual economic impact of emitting one additional ton of CO2 in year t.
T: Time period of impact, often considered up to 100 years or more.
r: Discount rate used to calculate future value in today’s terms.
t: Specific year after emission, with t = 0 being the year of emission.
Economic impacts (Dt) include losses due to various climate change impacts, such as reduced agricultural yields, flood losses, increased extreme weather events (hurricanes, heat waves), increased health costs related to poorer air quality, and sea level rise affecting coastal areas. Impacts are calculated globally because carbon emissions have long-term and widespread effects, regardless of the location of emissions. Discount rate (r) is one of the most controversial factors in calculating SCC; low values (1–3%) emphasize the importance of future impacts, while higher discount rates (above 5%) reduce the value of future economic impacts. The lower the discount rate, the higher the SCC value because future impacts are considered more significant. Impact time horizon (T) includes the impact of CO2 emissions that can last for hundreds of years, but most models limit the calculation of SCC to around 100 years or more, and being able to capture the long-term impacts of climate change is essential in calculating SCC accurately. Calculating the social cost of carbon is an important tool in environmental and climate change policy that provides the basis for setting carbon prices or carbon taxes by considering the long-term impacts of greenhouse gas emissions on the global economy and society.
3.2. Emission Reduction Targets
Determining emission reduction targets needs to be a consideration for the government in setting carbon tax rates set in international agreements, such as the Paris Agreement, or national policies where tax rates are set to encourage significant emission reductions. Efforts to create emission reduction targets are an important step in efforts to reduce the impact of climate change with steps to create effective emission reduction targets through several steps, including identifying emission sources, measuring emissions, determining emission reduction targets, setting time frames, developing strategies and action plans, calculating financial and social impacts, involving stakeholders, monitoring and reporting progress, adjusting and recalibrating targets. Identification of Emission sources can be identified by making a complete inventory of all greenhouse gas (GHG) emission sources in relevant organizations or regions. The identification of emission sources needs to use data from national emission inventories as well as energy, transportation, industry, and agriculture sectors in the form of emission reporting and assessment tools such as the Greenhouse Gas Protocol (GHG Protocol). In addition, efforts to measure emissions can include determining the base year in measuring emissions by collecting GHG emission data from the selected base year, which includes historical data and future emission projections that can be implemented using emission data management software. Furthermore, in determining emission reduction targets, it is necessary to set emission reduction targets based on a base year that refers to absolute reduction targets (reducing 100,000 tons of CO2e) or intensity reduction (reducing emissions per unit of product or per unit of GDP). Emission reduction targets need to set a time frame to achieve emission reduction targets, which can be achieved by dividing the time frame into short-term, medium-term, and long-term targets.
Developing strategies and action plans to encourage emission reduction targets requires efforts through identifying and implementing steps to achieve these targets. Strategies that can be developed include increasing energy efficiency, using renewable energy, clean transportation, and sustainable agricultural practices by optimizing green technology, government policies and incentives, and sustainability initiatives. To calculate the financial and social impacts, a cost-benefit analysis of the proposed steps can be applied, including utilizing economic feasibility studies, social impact analysis, and cost-benefit assessments. Efforts to encourage emission reduction targets more effectively need to involve stakeholders, including the government, community, and private sector, and need to be carried out through meetings, workshops, and public consultations. The next step is to monitor and report progress towards emission reduction targets periodically related to emissions and the progress of strategy implementation by utilizing emission data management systems, public reporting, and third-party audits. Emission reduction targets are important for adjusting and recalibrating targets by evaluating the effectiveness of the strategy and adjusting targets, if necessary, through periodic reviews and data analysis to assess progress and obstacles. Setting emission reduction targets requires a comprehensive approach, from baseline emission measurements to stakeholder engagement and ongoing monitoring. An effective strategy must be based on accurate data, comprehensive impact analysis, and multi-stakeholder engagement to achieve sustainable results.
Factors that can measure the ability of carbon tax rates to achieve emission reduction targets where tax rates must be high enough to encourage behavioral change and investment in low-carbon technologies.
Emission reduction targets are the amount of emission reductions that you want to achieve, for example 30% reduction in CO2 emissions. Emission elasticity is calculated based on the responsiveness of emissions to changes in carbon tax rates, for example, how much emissions will decrease if the carbon tax rate increases by 1%.
The formula for calculating emission reduction targets is based on the percentage or absolute amount of greenhouse gas emission reductions that are to be achieved in a given period. These targets are often used in the context of climate change policies to limit global temperature increases. The basic formula for emission reductions:
Baseline emissions are the amount of GHG emissions in the base year or reference year before there is an emission reduction policy, and can be emission data in a particular year that are used as a reference point. Actual emissions are the amount of GHG emissions measured after a policy or action is implemented, which is usually intended to evaluate the target achievement. Target emissions are the amounts of emissions to be achieved at the end of the target period according to the emission reduction plan. Emission reduction targets can be carried out using an emission projection approach. Emission reduction targets are calculated based on future emission projections if there are no reduction actions, which are usually called business as usual (BAU). The formula is:
BAU emissions are assumed to be emission projections if no emission reduction policies or actions are taken. Target emissions are the planned emissions after the implementation of emission reduction actions. Several important factors that need to be considered in setting emission reduction targets include the baseline year by determining the selection of the base year, which is very important because it determines the initial level of emissions that will be the reference for reduction. The BAU scenario is carried out by calculating future emission projections if there are no reduction actions, as the key to setting realistic targets. The time period needs to be adjusted to short-term and long-term targets that can be used to map out a gradual reduction plan. Reduction actions need to involve the use of renewable energy, energy efficiency, technology replacement, or changes in consumption and production patterns. Compliance with the global climate agreement means setting emission reduction targets that are in line with international commitments aimed at limiting global temperature increases to below 2 °C or even 1.5 °C. Calculating emission reduction targets needs to involve selecting a base year, calculating absolute or relative reductions, and using emission projections if no action is taken, as an important tool in climate change mitigation strategies, and ensuring that targets are in accordance with global or national policies.
3.3. Economic Impact of Carbon Tax Tariff
Efforts to determine the economic impact in order to set carbon tax rates are a process that needs to involve an in-depth analysis of how the tax will affect various sectors of the economy and society as a whole. The steps that need to be taken to determine the economic impact of determining carbon tax rates need to consider cost and benefit analysis, sector-specific impact analysis, macroeconomic models, and mitigation policy considerations. Cost and benefit analysis requires the identification of direct costs and benefits with the aim of determining the costs that will be borne by industry, companies, and consumers. In addition, it is also necessary to assess the benefits obtained from reducing emissions, such as improving air quality and health. This can be implemented through the development of an input–output economic model that calculates the impact of additional costs on various economic sectors, and needs to use empirical data and case studies to measure the benefits of reducing emissions.
In developing a sector-specific impact analysis, it is important to consider the impact on industry and business, as well as the impact on consumers. This is used to assess how the carbon tax rate will affect the operating costs and competitiveness of the industry, and to determine how the carbon tax affects the prices of goods and services and the cost of living of consumers. Macroeconomic models can be applied using macroeconomic simulations to assess the overall impact of carbon taxes on national economies, including GDP growth, employment, and inflation, through the development of macroeconomic models such as computable general equilibrium (CGE) or dynamic stochastic general equilibrium (DSGE). In addition, macroeconomic models are developed through income distribution analysis to assess the impact of carbon taxes on income distribution and economic inequality by simulating the impact of carbon taxes on various income groups. Mitigation policies are important for considering subsidies and incentives that aim to reduce the negative impacts on vulnerable and low-income sectors. Mitigation policies are also needed for investments in green technology to encourage innovation and adoption of low-carbon technologies in order to increase investments in green technology research and development. With this approach, countries can comprehensively assess the economic impacts of carbon tax implementation and design effective mitigation policies to minimize its negative impacts and maximize its benefits.
The economic impact formula for calculating the carbon tax rate aims to estimate the fiscal and macroeconomic consequences of the carbon tax implementation, including the increase in the price of goods and services (inflation), the decrease in the output of certain sectors such as energy and transportation, the impact on employment, and the effect on people’s purchasing power. In the context of the optimal carbon tax rate formula, the economic impact is one of the adjustment variables so that the rate does not burden the economic sector too much or reduce social welfare in general.
This formula considers ΔP as the change in the general price level (additional inflation due to the carbon tax), ΔGDP is the change in gross domestic product due to the carbon tax, and ΔE is the change in employment or economic efficiency due to technological transfer or energy substitution. This economic impact formula plays an important role in ensuring that the determination of the carbon tax rate does not have an excessive negative impact on the national economic stability. ΔP represents the potential increase in the price of goods and services due to increased energy costs, ΔGDP reflects the potential decrease in national economic output due to the continued impact of the carbon tax on productive sectors, and ΔE describes the change in efficiency or employment, including the potential reduction in the workforce in carbon-intensive sectors. By incorporating these three elements into the carbon tax rate determination formula, governments can calibrate rates more fairly and realistically so that they remain effective in reducing emissions without sacrificing economic growth or public welfare. This approach helps create a climate fiscal policy that balances environmental goals and national economic interests. The need for this formula in determining carbon tax rates is based on the need to holistically understand the impact of policies on the economy. Carbon taxes not only function as a tool for controlling emissions but also affect the structure of production costs, people’s purchasing power, and the dynamics of economic growth. Without a formula that can measure changes in prices, gross domestic product, and impacts on employment or efficiency, decision-making becomes speculative and risks causing social inequality and economic disruption. Therefore, logically, this formula is important so that the policies implemented can consider the real impacts in the field and produce a balanced approach between environmental interests and national economic stability.
The economic impact formula is used as an analytical tool in formulating a fair and sustainable carbon tax policy. This formula allows the government to project the overall economic impact, referring to the increase in the price of goods and services, changes in the national economic growth, and the impact on employment or sector efficiency. With this approach, carbon tax rates can be designed dynamically and responsively to economic conditions so that the resulting policy not only reduces carbon emissions but also maintains people’s purchasing power, as well as the stability of the industrial sector and job creation. In the future, this formula will become a strategic foundation for ensuring that the transition to a green economy does not undermine the country’s economic stability.
3.4. Revenue for Environmental Programs
Environmental program revenue plays a critical role for governments because it provides a realistic and measurable basis for financing environmental initiatives by linking potential tax revenues to actual emission coverage and collection efficiency. Through the environmental program revenue formula, governments can estimate how much revenue can be mobilized from carbon taxes. This ensures that fiscal planning for climate programs is based on practical parameters, such as the taxable emission coverage and the administrative capacity to collect revenue effectively. Using this approach, policymakers can align environmental financing needs with national carbon reduction strategies, increase transparency in climate budgeting, and build public trust by demonstrating that carbon tax revenues directly support environmental goals. Environmental program revenue for the government is to ensure the availability of stable, fair, and measurable funds to finance programs that support the transition to low-carbon development.
The environmental program revenue formula represents a realistic approach to calculating the potential revenue that a government can raise from a carbon tax to finance environmental programs. This formula combines three important components, including coverage ratio, collection efficiency, and estimated potential revenue. Coverage ratio is the proportion of total national emissions that will be subject to a carbon tax, for example, a ratio of 60% if only the energy and industrial sectors are taxed. Collection efficiency is the realistic efficiency of tax collection with a range of 80–90%, due to leakage, incentives, or tax avoidance. The estimated potential revenue is the estimated maximum revenue that can be collected if all emissions are subject to the ideal tariff, which can be calculated by multiplying the total amount of emissions by the benchmark social carbon cost. By multiplying these three components, the government can more accurately estimate how much revenue can actually be used to fund climate change mitigation, renewable energy, or environmental adaptation programs.
Revenue for environmental programs is essential for governments because it provides a realistic and measurable basis for funding environmental initiatives by linking potential tax revenues to actual emissions coverage and collection efficiency. Through the environmental program revenue formula, governments can estimate how much revenue can be mobilized from a carbon tax. This ensures that fiscal planning for climate programs is based on practical parameters, such as the taxable emissions coverage and the administrative capacity to collect revenue effectively. Using this approach, policymakers can align environmental funding needs with national carbon reduction strategies, increase transparency in climate budgeting, and build public trust by demonstrating that carbon tax revenues directly support environmental goals.
The study found that the environmental program formula has a strong correlation in supporting the determination of carbon tax rates because this formula provides an estimative framework for assessing the real revenue needs from carbon taxes without having to know the rates directly. By knowing how broadly the sector will be taxed (coverage ratio), how effectively the collection can be carried out (collection efficiency), and how much potential revenue is based on national emissions (estimated potential revenue), the government can calculate the amount of revenue needed to fund environmental programs. The results of this calculation serve as a reference for determining proportional carbon tax rates so that funding targets are achieved without causing excessive fiscal or social burdens, allowing this formula to function as a bridge between environmental funding needs and effective policy tariff design.
3.5. Social Justice and Balance in Carbon Tax Rates
Evaluating social justice and balance in the application of carbon tax rates is generally related to how carbon taxes affect different groups in society differently, especially the impact on income distribution, welfare, and access to energy. The main principle is to avoid the regressive impact of carbon taxes, where low-income households are disproportionately affected compared to high-income households. There are several approaches to measuring social justice and the balance of carbon tax rates, using formulas that include income redistribution, the percentage of energy expenditure, and the impact on vulnerable groups in society.
The social justice and balance factor ensures that the carbon tax rate does not burden vulnerable or low-income groups in society. Carbon tax rates can be measured through income redistribution and compensation provided to disproportionately affected households.
The compensation given can be calculated based on the amount of financial assistance or energy subsidies given to low-income groups. Meanwhile, the impact of carbon taxes on vulnerable groups is the burden of additional costs that must be borne by vulnerable groups due to rising energy prices.
One way to ensure social equity is to measure the redistribution of income from a carbon tax. This formula estimates the amount of income that can be returned to low-income groups to compensate for the regressive impact of a carbon tax.
Redistribution is the amount of funds per low-income household or individual obtained from carbon tax revenue. Carbon tax revenue is the total income generated from the carbon tax, while the number of low-income households is the total number of households in the low-income category, which are the target of compensation. Carbon taxes can be designed in such a way that they reduce the negative impact on low-income households and support social balance through income redistribution or direct compensation.
3.6. Carbon Tax Rate Formula
Determining the optimal carbon tax rate requires a formula that takes into account various factors, including the social cost of carbon, emission reduction targets, economic impacts, revenue for environmental programs, and social equity and balance. This comprehensive formula is able to combine the essential elements of each factor to produce a rate that meets various policy objectives. The basic formula for determining the carbon tax rate can be calculated as follows.
This formula provides a comprehensive approach to determining the carbon tax rate that takes into account five important factors, including the social cost of carbon, emission reduction targets, economic impacts, revenue for environmental programs, and social equity. Each factor must be measured carefully to achieve a fair and effective balance in reducing carbon emissions and mitigating the impacts of climate change.
The implementation of a comprehensive carbon tax formula in Indonesia is highly urgent, considering the country’s position as one of the largest carbon emitters in the world. With abundant natural resources and intense industrial activities and fossil fuel combustion, Indonesia is at the forefront of contributing to global climate change. This formula provides a clear framework for setting optimal carbon tax rates by considering various dimensions, such as the social cost of carbon, economic impact, and social equity. With this approach, the government can design policies that are not only effective in reducing greenhouse gas emissions but also able to maintain economic stability and support sustainable environmental programs. One of the main benefits of this formula is its ability to create a balance between economic growth and environmental protection. The social cost of carbon reflects the negative externalities of carbon emissions on human health, ecosystem damage, and economic productivity. By including this factor in determining carbon tax rates, the government can ensure that industry players pay an appropriate price for the environmental impacts they cause. In addition, revenue from carbon taxes can be allocated to fund climate mitigation programs, such as tree planting, renewable energy development, or adaptation to natural disasters. This will help Indonesia meet its commitments in the Paris Agreement to reduce carbon emissions while strengthening national resilience to the impacts of climate change.
However, it is important to ensure that the implementation of this formula is fair and inclusive. The social justice and balance factors in the formula aim to minimize the economic burden on vulnerable communities and the informal sector, which are often most affected by such fiscal policies. For example, the carbon tax rate should be designed in such a way that it does not increase the costs of living for low-income communities while still encouraging large businesses to switch to more environmentally friendly technologies. With a holistic approach like this, Indonesia can make the carbon tax an effective tool to achieve sustainable development goals while maintaining social and economic harmony in the transition to a green economy. This carbon tax formula is very important for Indonesia because it provides a systematic, fair, and effective guide to managing climate change issues without sacrificing economic stability and social justice. With proper implementation in
Table 4, this formula can be a strategic first step towards a more sustainable and climate-resilient future.
SCC is a monetary estimate of the economic, social, and environmental losses from releasing one ton of carbon dioxide emissions into the atmosphere. This value includes long-term impacts on health, agricultural output, infrastructure, and global climate change. The U.S. Environmental Protection Agency (EPA) report or The Stern Review study estimates the global SCC in the range of USD 50–USD 150 per ton of CO
2, depending on the discount rate and risk assumptions. If the average SCC assumption is USD 20–USD 80 per ton of CO
2, with an exchange rate of IDR 15,000/USD, the SCC value for Indonesia is:
Considering Indonesia’s status as a developing country with moderate emissions, the SCC can be assumed to be in the low range, at IDR 300,000/ton CO2.
Indonesia is facing direct impacts of climate change such as rising sea levels, flooding, and declining agricultural yields. Studies on the impacts of climate change in Indonesia show that the annual cost of climate change could reach 2–4% of GDP. With a GDP of around IDR 20,000 trillion, the annual loss reaches IDR 400–800 trillion, which is a prediction made in a study by the National Development Planning Agency [
84]. If annual transportation emissions reach 1,500 million tons of CO
2, then the cost per ton of CO
2 is equivalent to the estimated annual loss calculated at 600 trillion and compared to annual emissions in tons of CO
2, and the SCC value (local) based on the results of the annual loss calculation is obtained at IDR 400,000/ton CO
2. In this study, the determination of SCC taking into account the amount of annual loss at IDR 300,000/ton CO
2 is a conservative estimate. The SCC rate must be adjusted to the purchasing power of the community, where IDR 300,000/ton CO
2 is a relatively moderate value and avoids severe economic impacts on the community. A lower SCC, IDR 300,000/ton CO
2, is designed to encourage an initial investment in low-carbon technologies without triggering high resistance from industry players. The assumption of the SCC value based on the calculation of annual losses of IDR 300,000 per ton CO
2 refers to international standards adjusted for Indonesia, local impacts of climate change on the economy and society, social and economic considerations to ensure the sustainability of carbon policies, and regulations that are in harmony with sustainable development targets (SDGs) and national emission reductions (NDCs).
If the total revenue required for environmental programs is IDR 20 trillion per year, and the estimated emission reduction target that can be taxed is IDR 129,870 per ton of CO
2, then the calculation of this rate is based on the total carbon emissions that are taxed, as presented in
Table 5. The carbon tax rate of IDR 129,870 per ton of CO
2 is designed to collect revenue of IDR 20 trillion per year, assuming all emissions from the taxed sector are approximately 154.01 million tons of CO
2. This rate can be integrated with other components in the carbon tax formula to ensure the financial sustainability of environmental programs, such as renewable energy investments, green technology subsidies, or environmental conservation. The revenue generated from this rate is allocated for renewable energy development, environmentally friendly technology subsidies, environmental conservation, and social and community investments. Renewable energy development can be carried out in the form of green energy infrastructure development, such as solar panels or wind. Environmentally friendly technology subsidies can be provided through incentives for electric vehicles or low-carbon public transportation. Environmental conservation is implemented by protecting forests and ecosystems that can absorb carbon. Social and community investments are encouraged through the provision of assistance to households or economic sectors affected by carbon policies. The tariff of IDR 129,870 per ton of CO
2 ensures that the funding needs for environmental programs of IDR 20 trillion per year can be met. This value is calculated based on total taxable emissions that reflect a commitment to sustainability while considering the financial needs of the state and the social community.
Social equity subsidies in carbon tax rates are the allocation of funds to help vulnerable groups (low-income communities, workers in affected sectors, or rural communities) so that the carbon tax policy does not impose too great an economic burden. The figure of IDR 32,468 per ton of CO2 is calculated based on the total allocated subsidy and the total carbon emissions taxed. The total annual social equity subsidy budget is assumed based on policy needs, for example, IDR 5 trillion per year. The total carbon emissions taxed (tons of CO2) of 154.01 million tons of CO2 refer to the total energy consumption that produces carbon emissions in the transportation sector. Revenue from carbon taxes allocated for social equity subsidies is used for direct assistance, job training programs, increasing access to public transportation, and reducing basic living costs. Direct assistance is used as a form of energy subsidy for low-income households to reduce the impact of rising fuel prices. Job training programs play a role for workers in affected sectors, such as the fossil fuel industry, so that they can switch to jobs in the green sector. Increasing access to public transportation is intended to provide low-carbon public transportation subsidies for the community. Reducing basic living costs is used as assistance to offset the impact of carbon policies on the prices of goods and services. Social equity subsidies ensure that carbon tax policies not only fund environmental programs but also maintain the welfare of affected communities and create inclusive policies. The allocation of IDR 32,468 per ton of CO2 is a moderate figure and can help vulnerable groups without burdening the entire carbon tax revenue system. The subsidy of IDR 32,468 per ton of CO2 is determined based on the annual social subsidy requirement of IDR 5 trillion and the total carbon emissions subject to tax. This calculation ensures that carbon tax policies are not only effective in reducing emissions but also socially just.
4. Discussion
The hypothesis that the carbon tax calculation formula that integrates the social cost of carbon, emission reduction targets, economic impacts, funding needs for environmental programs, and social justice aspects can be optimally applied in the transportation sector and contribute significantly to reducing greenhouse gas emissions in Indonesia is confirmed and verified through theoretical studies and mutually reinforcing empirical arguments. The social cost of carbon provides a strong scientific and economic basis for determining tax rates that reflect the real impact of emissions on the environment and society, while emission reduction targets ensure that the policy is in line with national and global commitments. The economic impacts that arise, both in the form of increased costs and encouragement of innovation and green job creation [
85], emphasize the importance of policy design that is able to maintain economic stability during the transition to a low-carbon economy [
86]. Revenue from carbon taxes can be used strategically to fund environmental programs [
87], especially the development of green transportation infrastructure, such as electric vehicles and bicycle lanes, which accelerate the decarbonization of the transportation sector. The social justice aspect further strengthens the validity of the hypothesis by demanding a fair compensation mechanism for vulnerable groups so that policies do not deepen social disparities. The interconnection between these factors proves that a holistic and integrated carbon tax formula approach is not only realistic to implement in Indonesia’s transportation sector but also effective in reducing emissions, maintaining socio-economic balance, and supporting sustainable development goals.
Determining carbon taxes must also consider the emission reduction targets that a particular country or region wants to achieve. Carbon taxes should be designed to be high enough to encourage behavioral changes, such as reducing fossil fuel consumption, increasing energy efficiency, and investing in renewable energy. Effective emission reductions will contribute to achieving national and international climate change goals, such as the Paris Agreement. A critical role in emission reduction is to ensure that carbon tax rates encourage businesses and individuals to reduce emissions, achieve national and global emission targets in a measurable and accountable manner, and promote innovation in low-carbon and clean energy technologies. Carbon taxes can have broad economic impacts, both directly and indirectly. On the one hand, carbon taxes can increase production costs, especially in energy-intensive sectors. On the other hand, they can also encourage innovation, create green jobs, and provide long-term economic stability through the energy transition. The economic impacts must be carefully considered so that carbon taxes do not harm economic growth or cause significant economic instability. The important role of economic impact is expected to be able to manage the transition from a carbon-based economy to a low-carbon economy by considering the risks to industry and labor, ensuring that carbon taxes maintain the competitiveness of the national economy and do not cause massive unemployment in carbon-intensive sectors, and creating new investment opportunities in the renewable energy and clean technology sectors.
Revenue from carbon taxes can be used to fund environmental programs such as climate change mitigation, adaptation to climate change impacts, green infrastructure development, and support for communities most affected by climate change. This allows the government to not only reduce carbon emissions but also strengthen its commitment to environmental conservation and sustainability. The important role of revenue for environmental programs is directed at providing a stable and sustainable source of funding for environmental initiatives. In addition, it is needed to increase the effectiveness of carbon taxes by ensuring that the proceeds are used to reduce the environmental and social impacts caused by climate change and to support innovation in green technology and clean energy, which can accelerate the transition to a low-carbon economy. The aspect of social equity is one of the most critical in determining the carbon tax rate because the burden of the carbon tax can be heavier for low-income groups who tend to spend a larger proportion of their income on energy. Carbon tax policies should be designed to be fair, including providing compensation to vulnerable groups, either through energy subsidies, direct cash transfers, or tax refunds. The importance of social equity is needed to ensure that the impact of the carbon tax does not exacerbate social inequality by ensuring that low-income households are not more severely impacted than wealthier households. In addition, social equity is expected to provide incentives or compensation to support vulnerable households in facing additional energy costs of the carbon tax and to promote intergenerational balance by reducing the impact of climate change that will be passed on to future generations. All of these factors should be seen as inter-related in determining the carbon tax rate. The social cost of carbon will influence how high the tax rate should be. Emission reductions and revenue for environmental programs are mutually reinforcing, where higher taxes generate more revenue to fund green initiatives. Economic impacts and social equity must be considered simultaneously to ensure that the policy does not create economic instability or increase social inequality. Determining the optimal carbon tax rate is a multi-dimensional effort that combines environmental, economic, and social considerations. A rate set based on the social cost of carbon, emission reduction targets, economic impacts, revenues for environmental programs, and social equity and balance will create a policy that is not only effective in reducing emissions but also fair, inclusive, and supports sustainable economic growth. This combination of factors makes it possible to achieve climate change goals without sacrificing social and economic well-being.
The implementation of a carbon tax formula in the transportation sector in Indonesia can be a strategic step to significantly reduce carbon emissions, considering that this sector contributes a large proportion to total national emissions. By considering factors such as SCC, emission reduction targets, economic impacts, and social justice, the government can design carbon tax rates that encourage behavioral change without causing injustice. Adjusting carbon tax rates on fossil fuels used in transportation can encourage consumers and industry players to switch to clean energy-based vehicles, such as electric vehicles or environmentally friendly public transportation [
53,
88]. In addition, revenue from carbon taxes can be allocated to fund green transportation infrastructure development programs, such as the construction of bicycle lanes, the procurement of electric buses, or the provision of charging stations for electric vehicles. This will not only help achieve emission reduction targets according to the Paris Agreement commitments [
89] but also help strengthen efforts to mitigate the impacts of climate change in the transportation sector [
90].
However, the implementation of this formula must be carried out carefully to ensure that the economic and social impacts are maintained fairly. The increase in transportation costs due to carbon taxes can place an additional burden on low-income people, especially those who rely on private or public transportation, with higher ticket prices. Therefore, this policy must be designed with compensation mechanisms, such as energy subsidies for vulnerable groups, direct cash transfers, or tax incentives for public transport operators who use environmentally friendly technologies. The aspect of social justice must also be a priority to ensure that the transition to low-carbon transport does not create greater social disparities [
91,
92]. With a holistic approach that considers all these factors, the carbon tax formula can be an effective tool to reduce emissions in the transport sector while maintaining economic stability and social welfare. The implementation of the carbon tax formula in the transport sector in Indonesia requires a balance between environmental objectives, economic impacts, and social justice. By designing a comprehensive policy, the government can encourage the transition to a greener transport system without sacrificing public welfare, thereby supporting the achievement of sustainable development goals and climate change mitigation.
The implementation of the carbon tax formula in Indonesia in the transportation sector must consider the balance between emission reduction targets and socio-economic impacts. As shown in
Figure 8, this policy must be designed so as not to impose an excessive economic burden, especially for low-income communities. Therefore, there needs to be a subsidy or incentive mechanism to encourage the use of clean energy-based vehicles [
93,
94]. In addition, emission reduction strategies must be implemented effectively by directing carbon taxes to sectors with high emission levels, such as fossil fuel transportation, and providing incentives for sectors that switch to green technology. Revenue from carbon taxes must be allocated to fund green infrastructure and ensure a just transition for all levels of society. In this context, a policy design must take into account social justice so that the impact does not burden vulnerable groups too much. The government also needs to encourage behavioral changes, such as incentives for electric vehicles and increasing clean energy-based public transportation. With this approach, the carbon tax in Indonesia not only functions as a fiscal instrument but also as a transformation tool towards a more sustainable and inclusive transportation system.


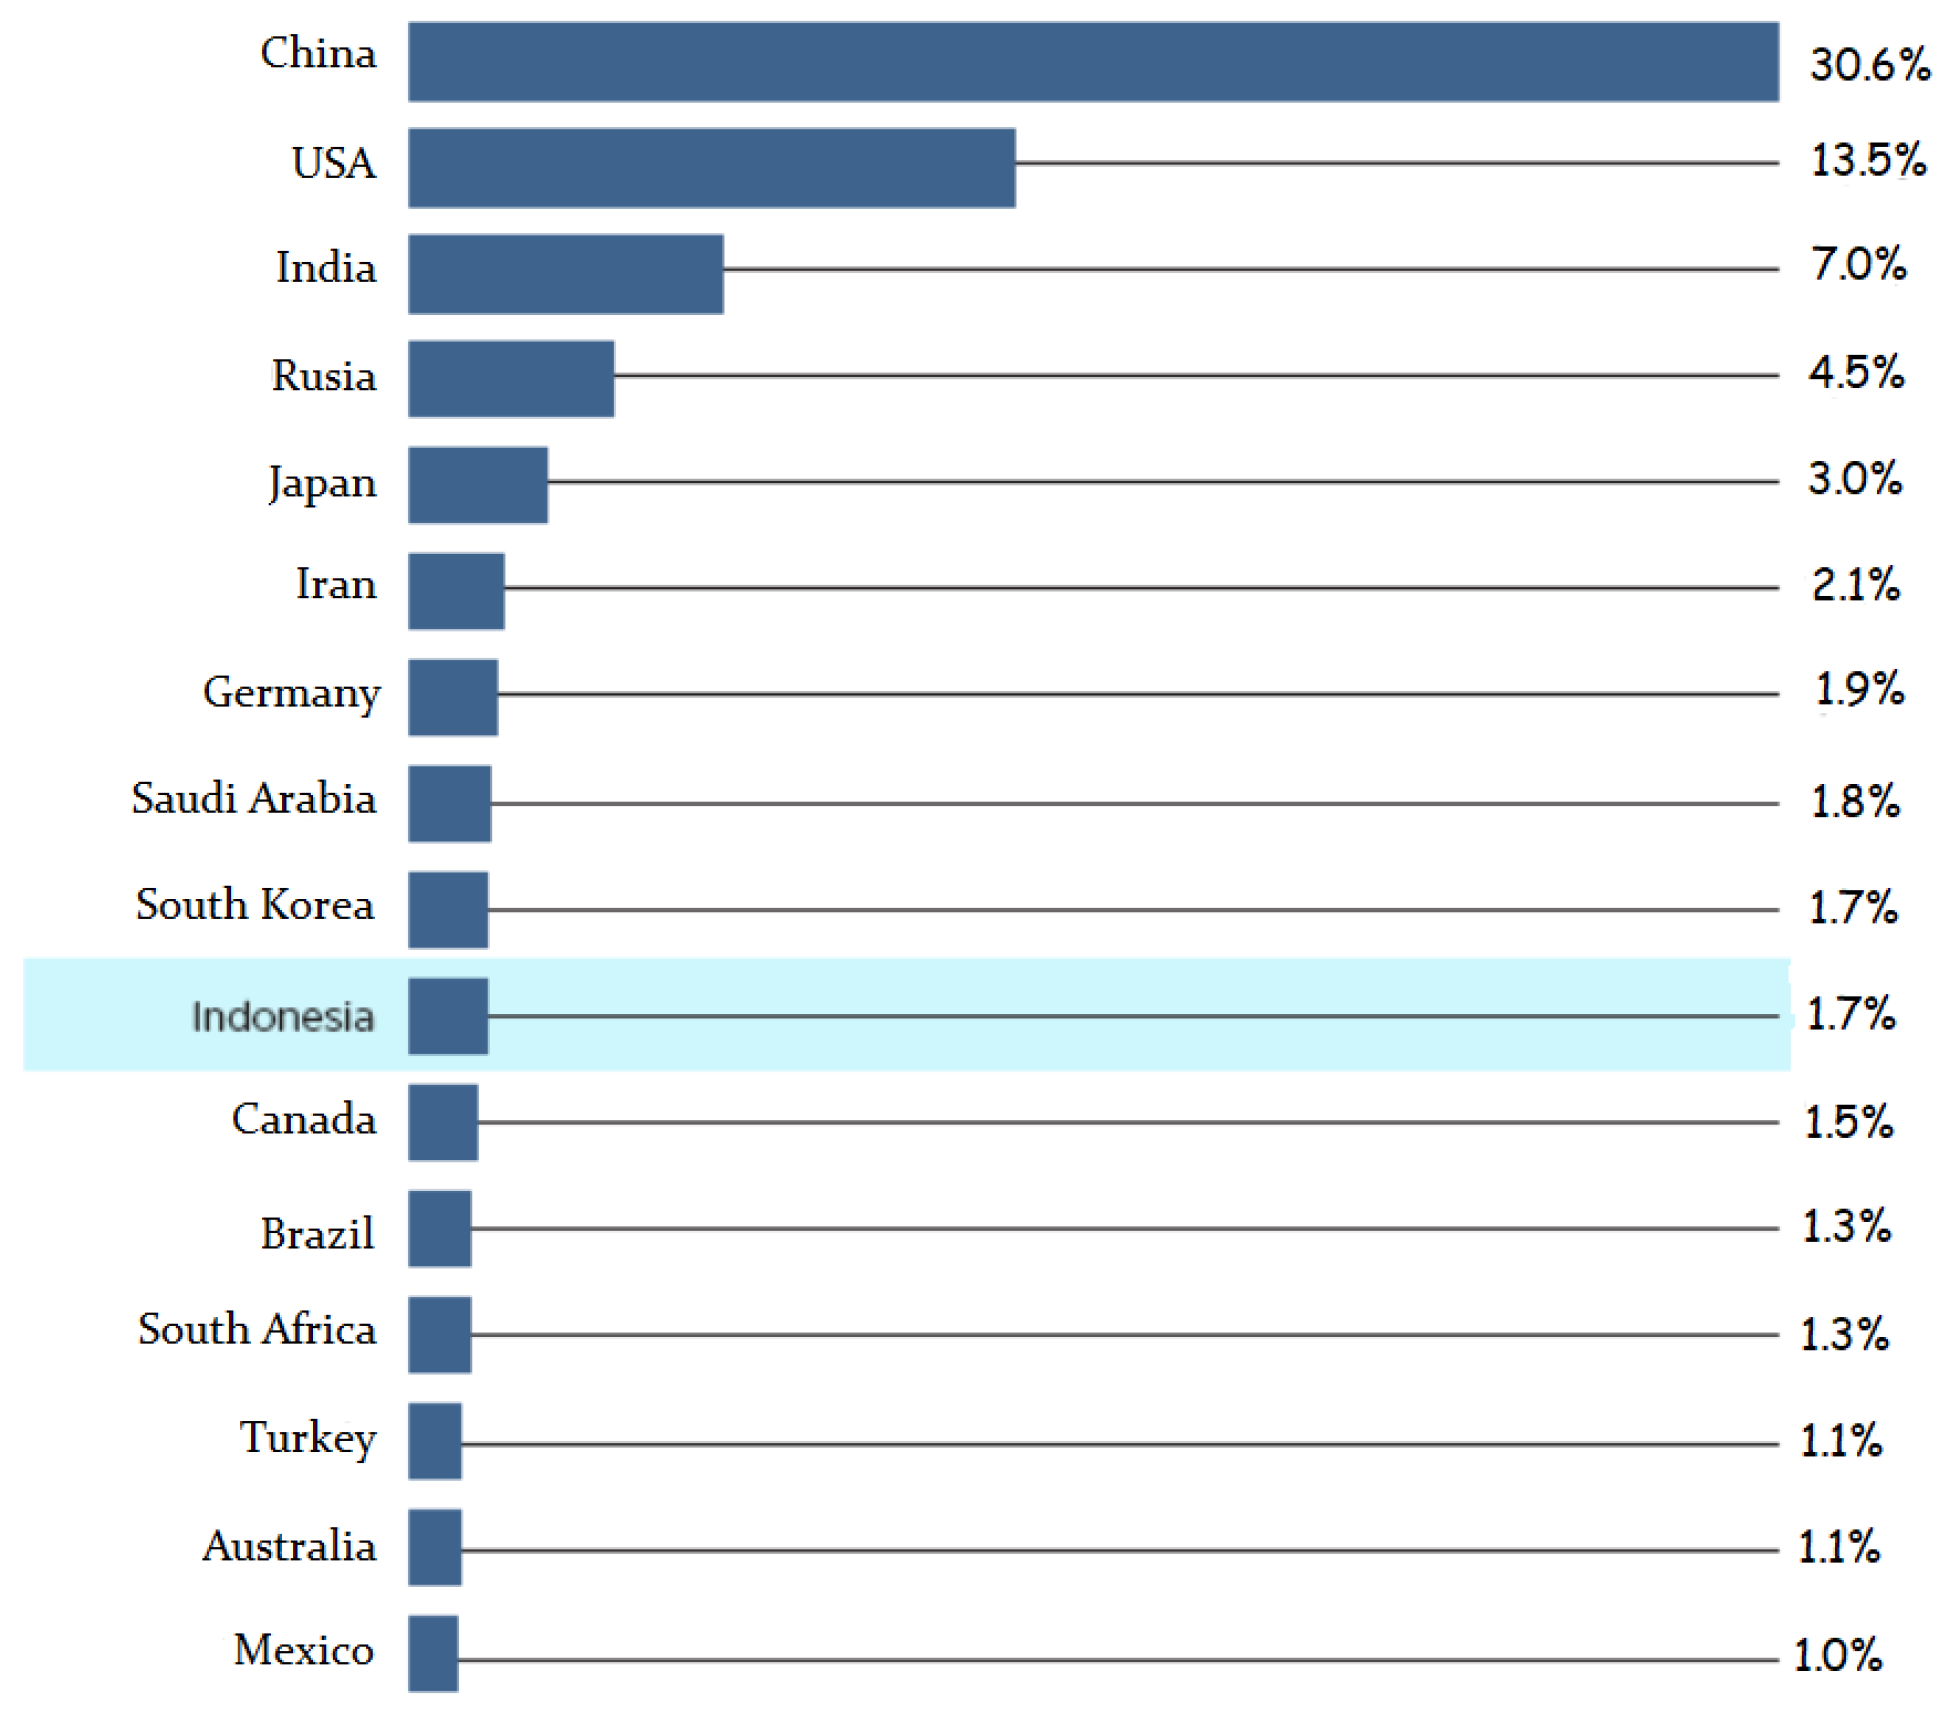
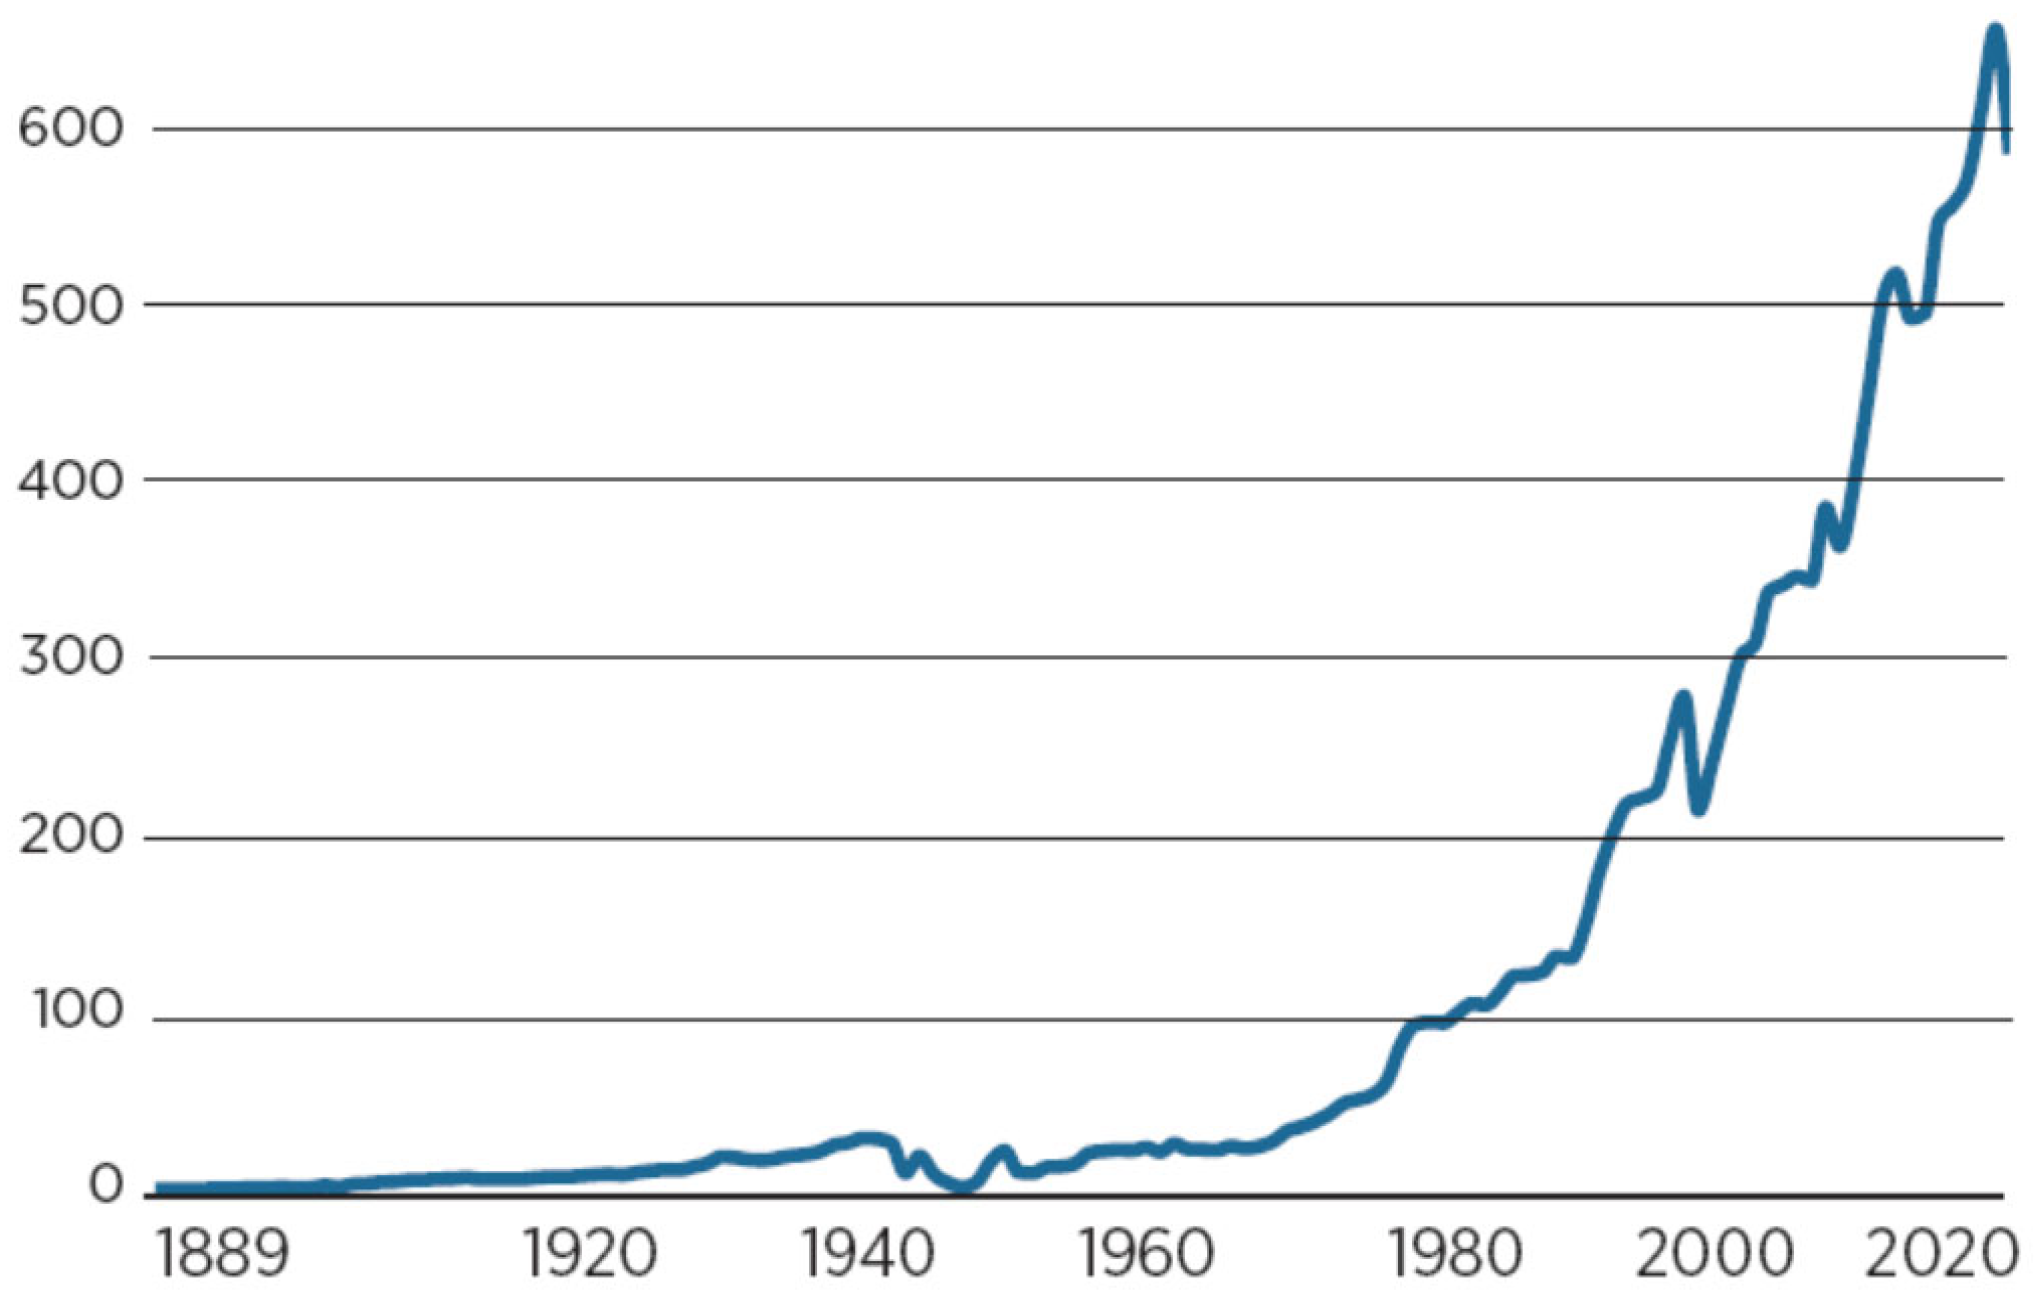
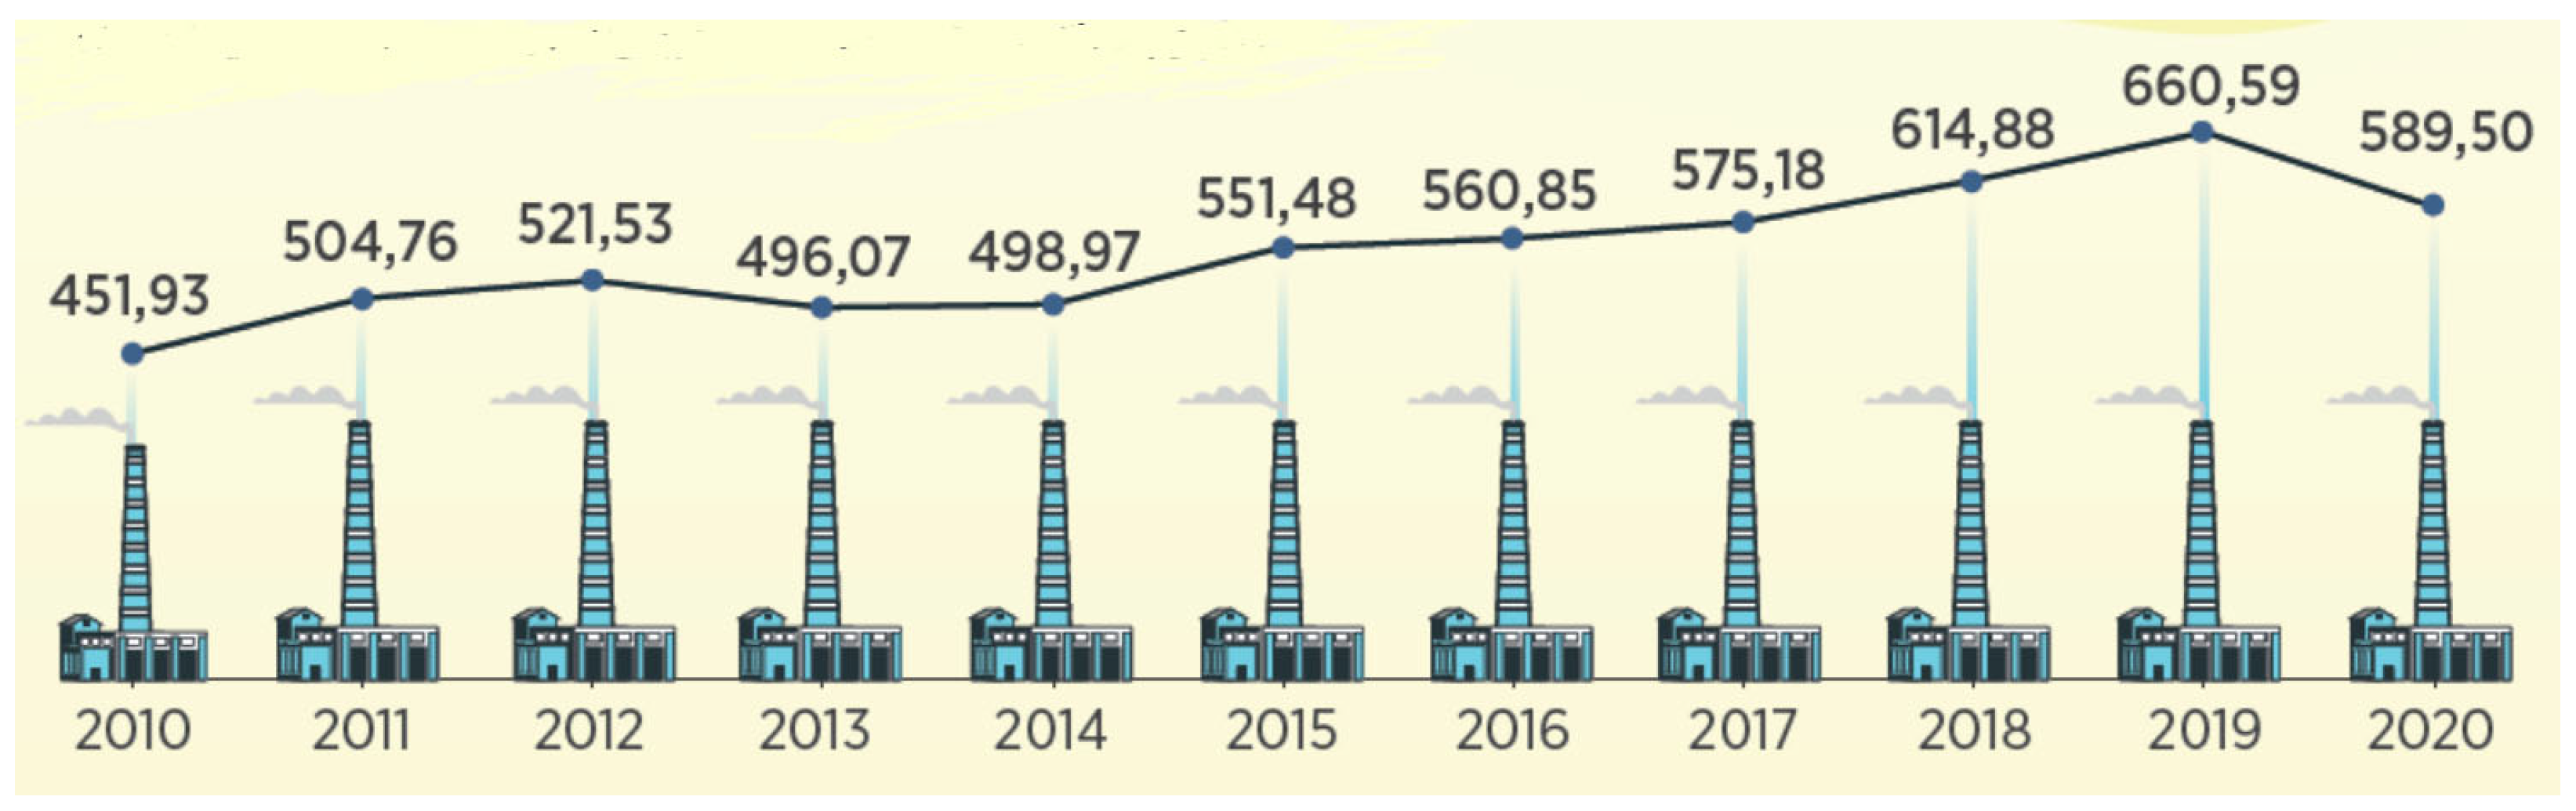
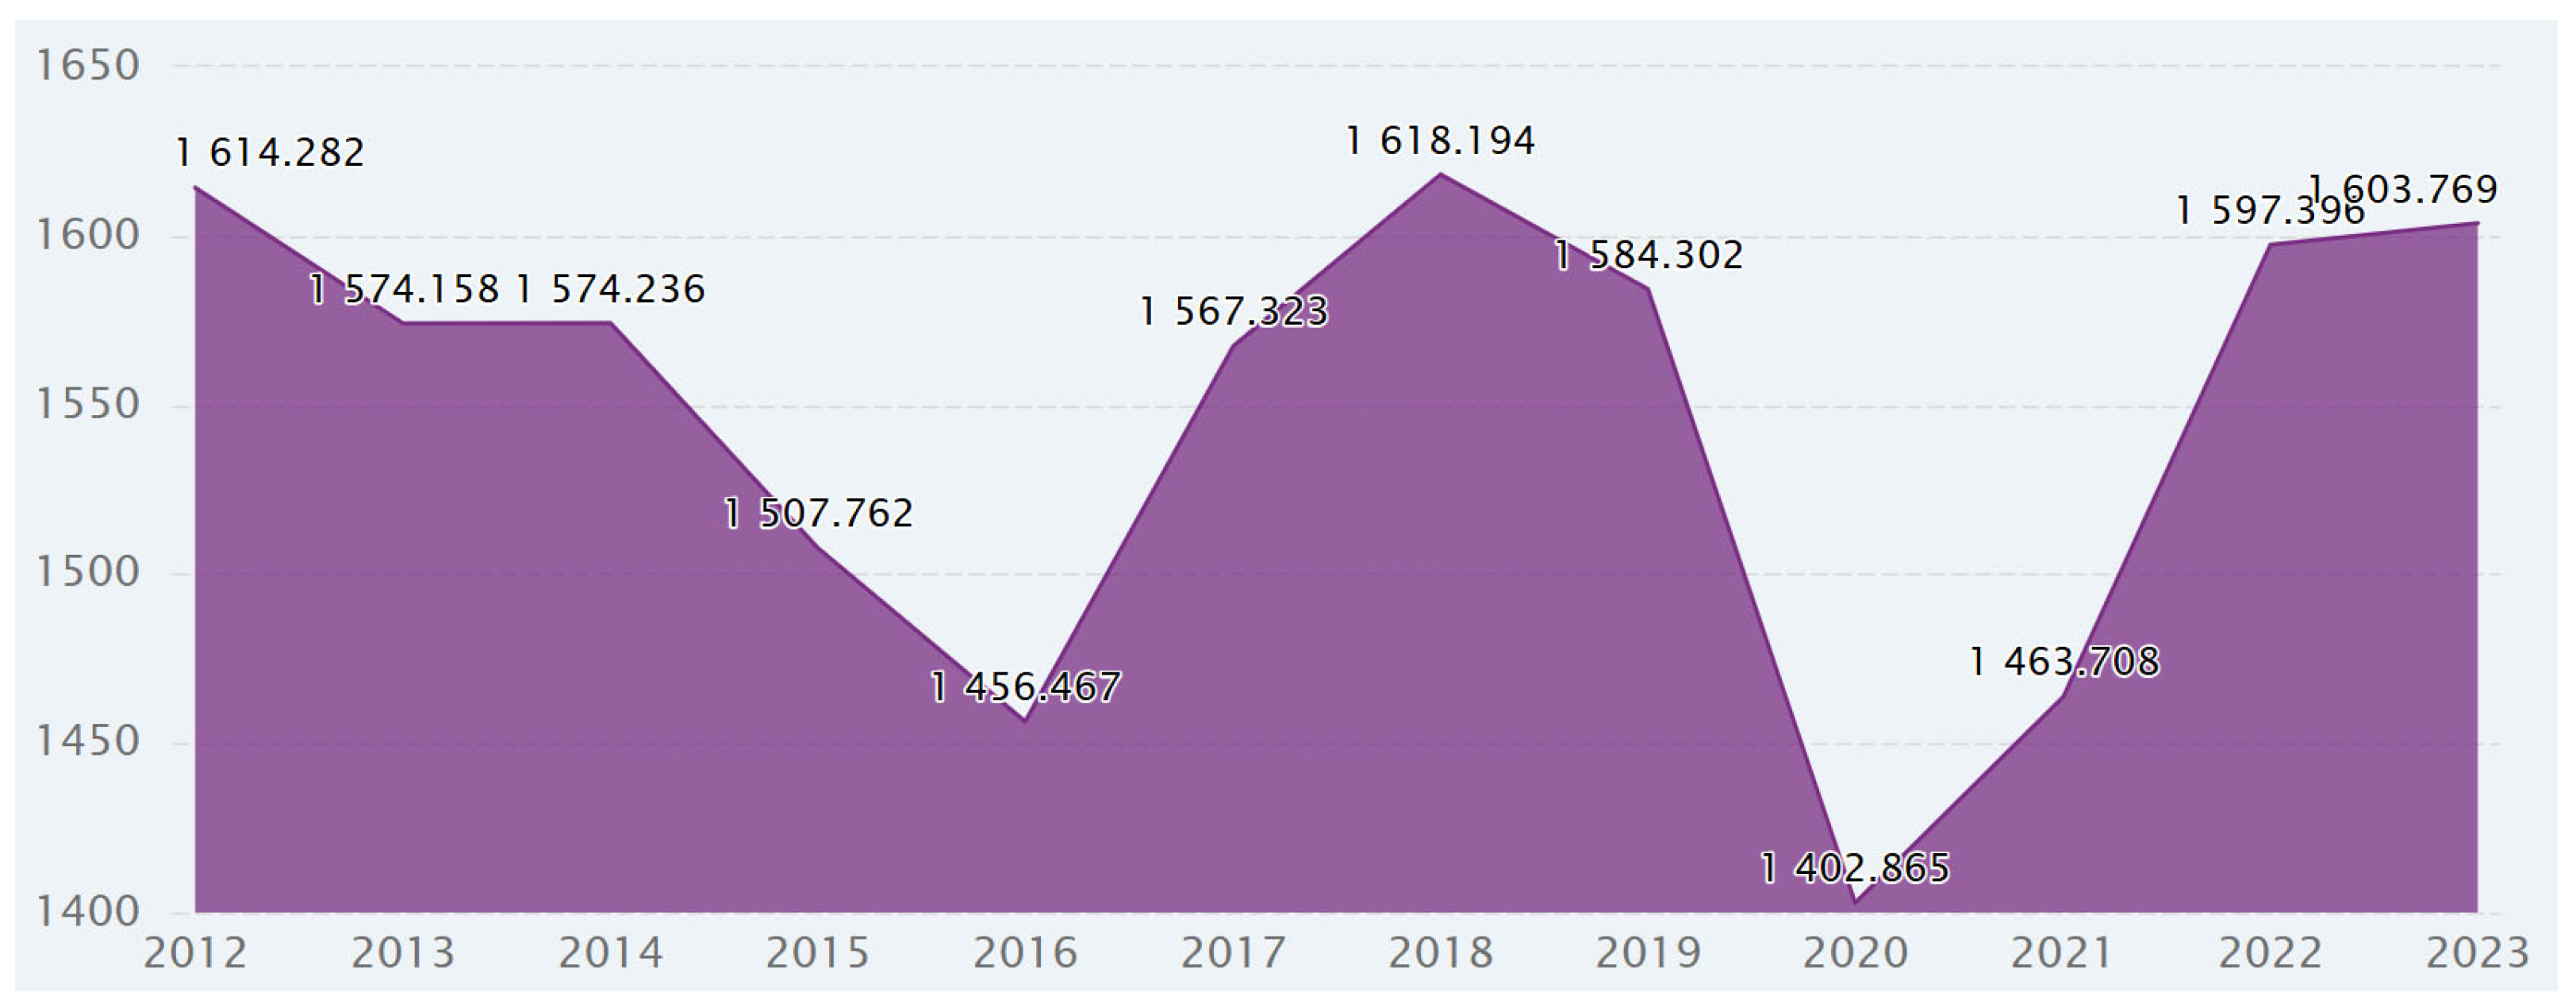
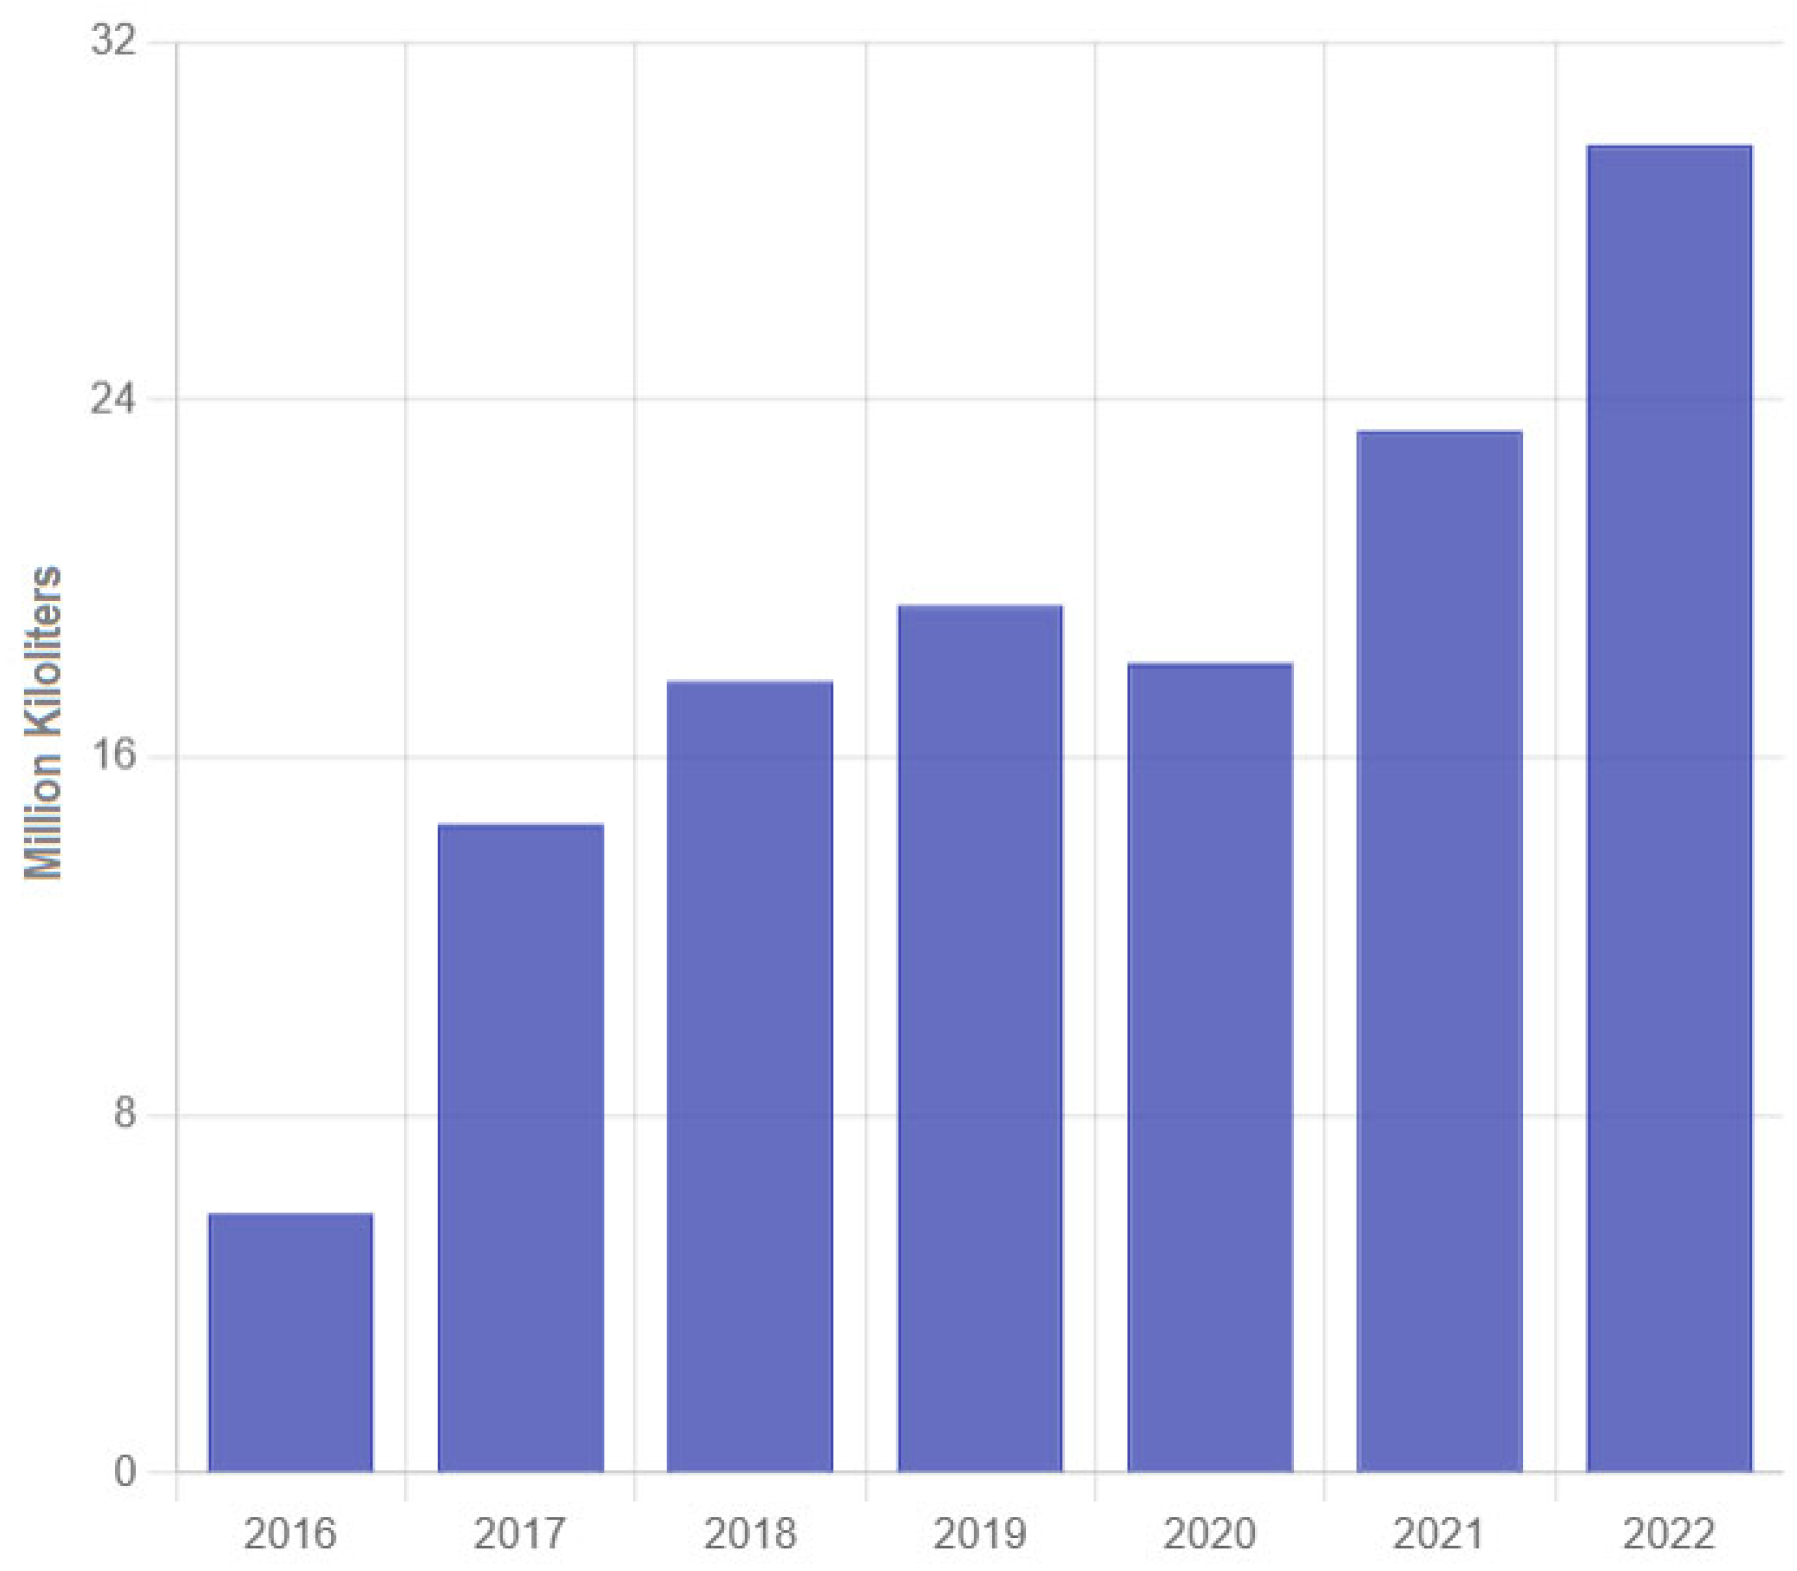
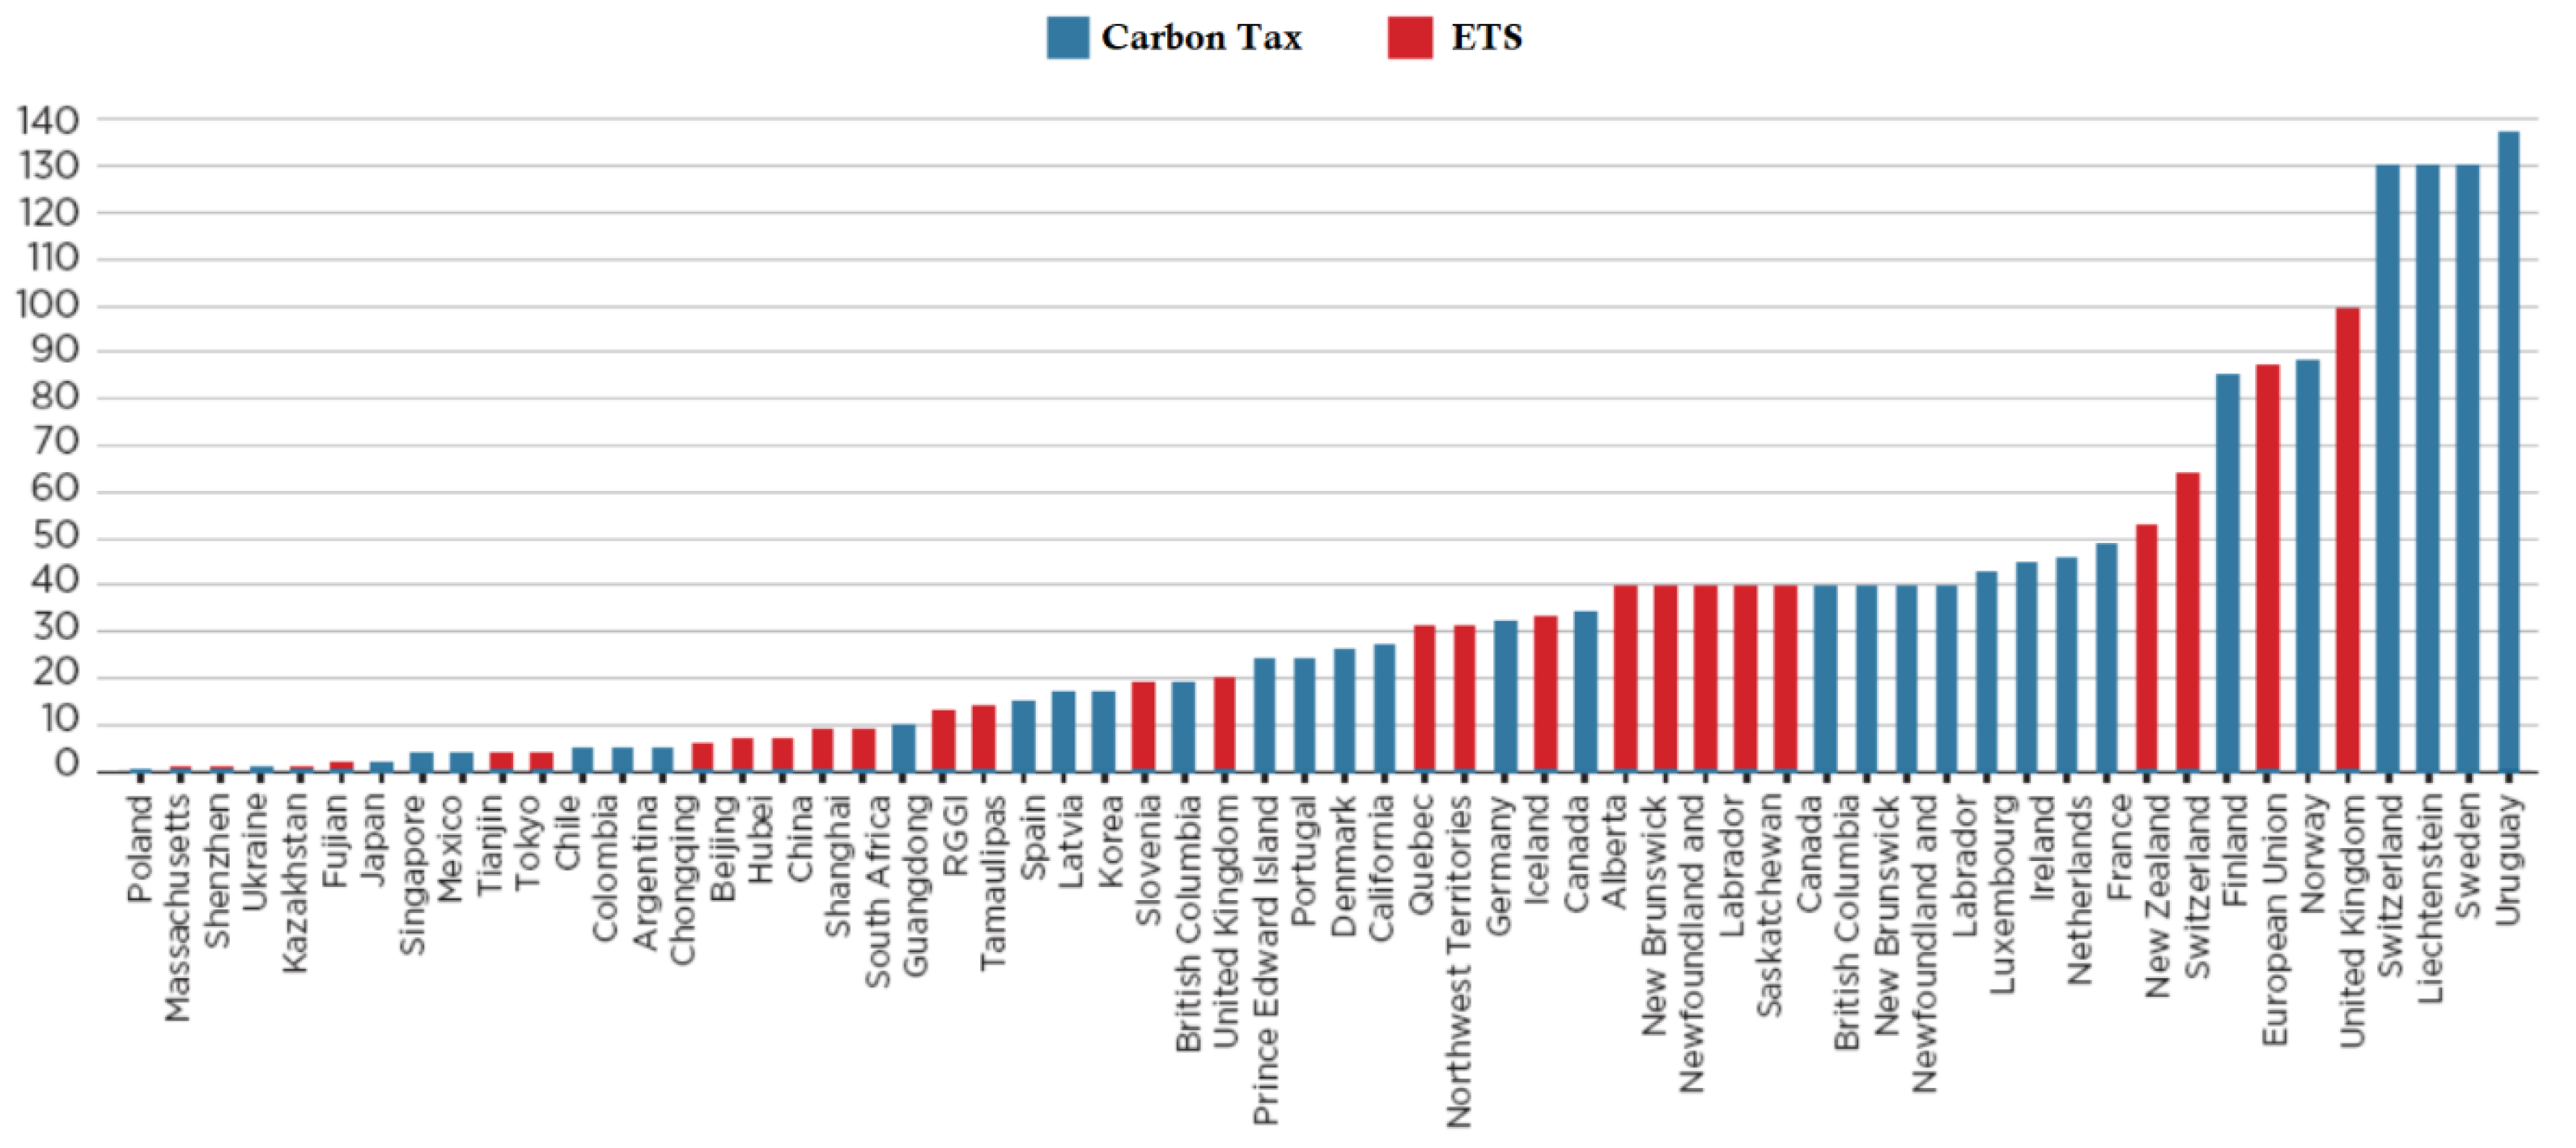
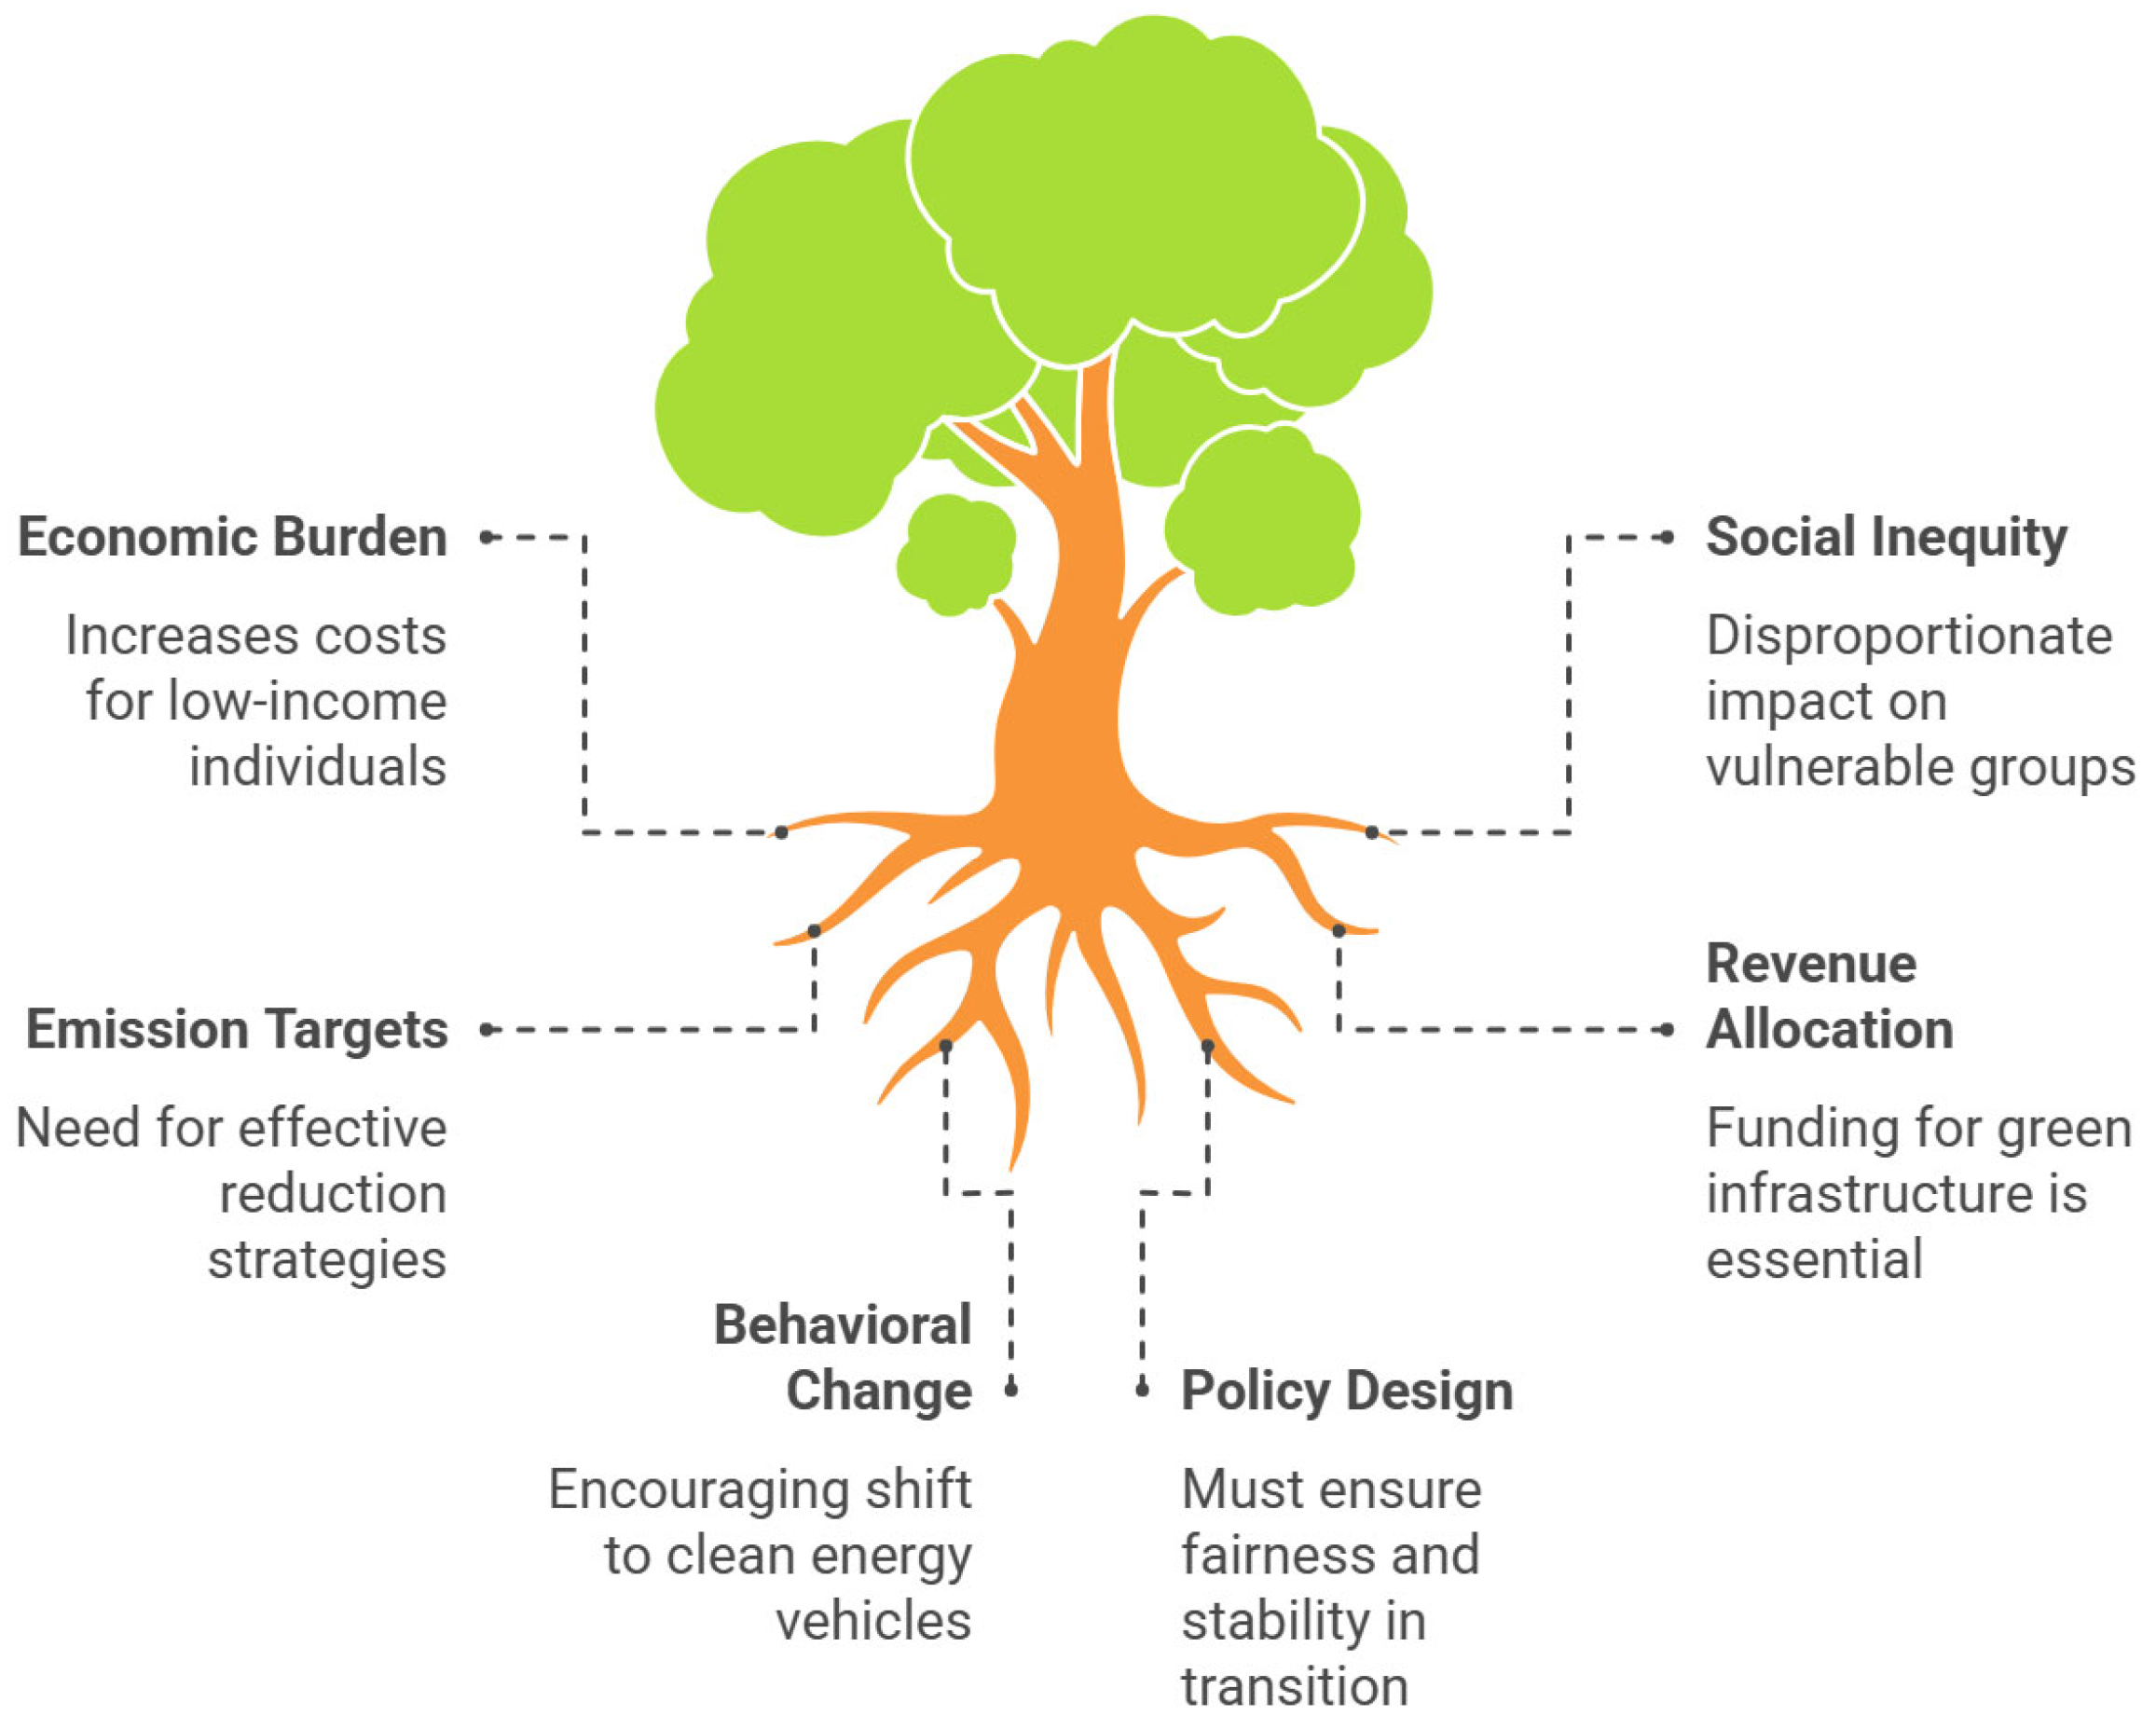
