Article

An Intelligent Technique for Coordination and Control of PV Energy and Voltage-Regulating Devices in Distribution Networks Under Uncertainties

by
Tolulope David Makanju
*,
Ali N. Hasan
,
Oluwole John Famoriji
and
Thokozani Shongwe
Department of Electrical and Electronics Engineering, Faculty of Engineering and Built Environment, University of Johannesburg, Auckland Park, Johannesburg 2006, South Africa
*
Author to whom correspondence should be addressed.
Energies 2025, 18(13), 3481; https://doi.org/10.3390/en18133481
Submission received: 13 June 2025 / Revised: 28 June 2025 / Accepted: 30 June 2025 / Published: 1 July 2025

Abstract

The proactive involvement of photovoltaic (PV) smart inverters (PVSIs) in grid management facilitates voltage regulation and enhances the integration of distributed energy resources (DERs) within distribution networks. However, to fully exploit the capabilities of PVSIs, it is essential to achieve optimal control of their operations and effective coordination with voltage-regulating devices in the distribution network. This study developed a dual strategy approach to forecast the optimal setpoints of onload tap changers (OLTCs), PVSIs, and distribution static synchronous compensators (DSTATCOMs) to improve the voltage profiles in power distribution systems. The study began by running a centralized AC optimal power flow (CACOPF) and using the hourly PV output power and the load demand to determine the optimal active and reactive power of the PVSIs, the setpoint of the DSTATCOM, and the optimal tap setting of the OLTC. Furthermore, Machine Learning (ML) models were trained as controllers to determine the reactive-power setpoints for the PVSIs and DSTATCOMs as well as the optimal OLTC tap position required for voltage stability in the network. To assess the effectiveness of the method, comprehensive evaluations were carried out on a modified IEEE 33 bus with a high penetration of PV energy. The results showed that deep neural networks (DNNs) outperformed other ML models used to mimic the coordination method based on CACOPF. Furthermore, when the DNN-based controller was tested and compared with the optimizer approach under different loading and PV conditions, the DNN-based controller was found to outperform the optimizer in terms of computational time. This approach allows predictive control in power systems, helping system operators determine the action to be initiated under uncertain PV energy and loading conditions. The approach also addresses the computational inefficiency arising from contingencies in the power system that may occur when optimal power flow (OPF) is run multiple times.

1. Introduction

Electrical energy is one of the key factors in the economic development of any nation. The recent adoption of the Paris Agreement, which enforces reductions in carbon emissions by nations under the United Nations (UN), has caused many nations that depend on fossil fuels to seek alternative sources of energy [1]. One approach used by many nations to achieve the objective of the Paris Agreement is the use of distributed energy resources (DERs) such as PV energy to reduce dependency on fossil fuel-based generators [2]. PV energy sources are connected to existing distribution networks through PV smart inverters (PVSIs). However, the introduction of PVSIs into existing distribution networks causes bidirectional current flows in power system networks. This has led to a number of complexities in power system parameter control [3,4]. Many of the devices used in the regulation of power system parameters depend on a unidirectional flow of current in the network. The integration of PVSIs into a network can cause a reverse flow of current to the substation so that the power generated at the point of connection of the inverter is greater than the load demand. This issue of reverse current flow affects the operation of voltage-regulation devices in the substation, such as the on-load tap changer (OLTC), which is installed at the transformer in the substation.
The growing prevalence of DER integration introduces new technical and operational hurdles for existing power system distribution networks [5]. Distribution networks must now contend with novel issues such as voltage fluctuations, potential grid overloading, and unprecedented power flow dynamics that challenge traditional electrical system design and management [6,7]. Active distribution network management (ANM), which refers to the techniques used to control and manage distribution networks in a more flexible and dynamic manner in the presence of DERs, is one of the main methods used to manage technical issues and maintain operations within permissible limits, and it involves the use of reactive power and voltage-compensating devices [8,9,10]. ANM involves controlling power flow across the distribution network to optimize efficiency, minimize losses, and maintain operation of the reactive and voltage-regulating devices in the network to ensure that there are no violations of power system operating parameters. Several voltage-regulating devices are used in ANM, such as static voltage regulators, switched-capacitor banks (SCBs), distribution static synchronous compensators (DSTATCOMs), and other flexible AC transmission (FACT) devices [11]. An OLTC regulates the voltage by adjusting the transformer’s tap position, whereas SCBs and DSTATCOMs regulate the voltage by reactive power compensation. However, SCBs have slow response times and a limited number of switches, whereas DSTATCOMs have fast response times owing to thyristor-controlled switching. A DSTACOM can provide inductive reactive power to alleviate the problem of voltage rise in addition to compensating for capacitive reactive power. Therefore, DSTATCOMs are preferable to SCBs for fast voltage regulation.
Recently, many PVSIs have begun to be used to supply reactive power to regulate their bus voltage along the distribution network. According to the recently updated IEEE standard (IEEE 1547-2018), smart inverters can be used to provide or absorb reactive power for fast voltage regulation [12]. A smart inverter is an advanced type of inverter used primarily in renewable energy systems, such as solar power installations, to convert the direct current (DC) electricity generated by renewable sources into alternating current (AC) electricity which can be used by electrical appliances or fed into the grid. Unlike traditional inverters, smart inverters come equipped with advanced features that improve the functionality, reliability, and integration of renewable energy systems within the grid. The smart inverter functionality includes fault ride-through, voltage and frequency ride-through, and grid voltage support. Among these functions, grid voltage support is obtained by the reactive function mode of smart inverters, which depends on the voltage at the point of connection to the grid network. The reactive function of smart inverters controls the local voltage by either absorbing reactive power or providing it to the grid. However, smart inverters can also introduce challenges and issues, such as voltage fluctuations and instability, which may occur when multiple DERs like PV and wind energy operate simultaneously. When additional power is thereby injected into the grid, overvoltage may result if smart inverters are not well coordinated with other voltage-regulating devices in the network, further leading to overvoltage or undervoltage outside acceptable limits within some buses in the network. Additionally, variability in DER output, as occurs when solar generation is influenced by weather, can complicate load and generation, making it harder to plan and manage the network effectively. Excessive generation by DERs can cause reverse power flow from distribution networks to transmission networks, creating challenges in grid operation and potentially damaging equipment. To address the challenges caused by the use of smart inverters in distribution networks, there is a need to develop advanced control techniques to coordinate and control the volt/VAR optimization of smart inverters and other voltage-regulating devices as well as the generation output power of the inverters.
Various approaches for managing smart inverter operations and coordinating them with conventional voltage control devices have been explored in the literature. Reference [13] presented a hybrid scheme combining centralized and local real and reactive power control for PV smart inverters. In this method, the inverter’s local control is based on piecewise linear functions, while its parameters are periodically optimized through a centralized process. However, this centralized optimal power flow (OPF) strategy demands extensive computing and communication resources. In [14], a distributed adaptive robust Volt/VAR control method was developed to reduce power losses in distribution systems, but it relies on multiple control centers to carry out Volt/VAR optimization. Similarly, [15] proposed a model-free extremum-seeking adaptive local Volt/VAR control to minimize network losses, but its computational complexity is relatively high. Reference [16] introduced a probabilistic approach to coordinate PV smart inverters with on-load tap changers (OLTC) and electric vehicles (EVs) to maximize hosting capacity. This method’s dependence on precise probability distributions limits its practicality in dynamic and uncertain environments, potentially reducing network reliability under extreme or unexpected scenarios. In [17], a data-driven distributionally robust stochastic OPF method was suggested to control PV smart inverters and energy storage setpoints to address overvoltage issues. However, its performance is constrained by the quality and availability of historical data, which might not reflect rare events or rapidly changing conditions, resulting in suboptimal control under significant uncertainty. Reference [18] proposed a data-driven local control strategy for determining setpoints for smart inverters, controllable loads, and battery storage systems, but the use of iterative OPF leads to high computational demands. Likewise, [19] described a data-based nonlinear control policy for the real-time reactive power dispatch of smart inverters, which requires repeated OPF runs, making it computationally intensive. A multi-mode data-driven method to coordinate conventional voltage regulation devices and PV inverters was proposed by [20], but it did not account for variations in PV output and load conditions.
In [21], a multi-objective model for reactive power and voltage optimization was introduced, using the gray wolf optimization algorithm to enhance node voltage quality and improve overall system stability. Although this method boosts voltage quality and operational stability, it does not provide real-time adaptability to sudden changes or the unpredictable nature of renewable generation. Reference [22] developed a reactive power optimization algorithm specifically for distribution networks with PV generation, addressing power quality issues through a multi-objective optimization model solved with the Non-dominated Sorting Genetic Algorithm III (NSGA-III). Test results showed that the NSGA-III approach could reduce active power output by up to 25%, whereas other methods reduced PV active power by less than 10%. Traditional reactive power optimization methods still struggle with finding globally optimal solutions efficiently and often suffer from slow computational performance. The authors in [23] applied the simulated annealing technique to optimize models involving photovoltaic systems, wind turbines, and electric vehicles in active distribution networks. Experiments based on a modified IEEE 14-bus distribution system indicated significant reductions in voltage deviations and overall system losses after optimization. However, the approach does not explicitly account for the variability of intermittent energy sources, which limits its effectiveness under uncertain conditions. To address the need to avoid repeatedly solving OPF to identify optimal setpoints for smart inverters and other voltage control devices, while also minimizing communication infrastructure requirements and capturing dynamic system behavior with integrated PV smart inverters (PVSIs), this paper proposes a machine learning (ML)-based coordinated control strategy for PVSIs in combination with DSTATCOM and OLTC. Initially, a centralized AC optimal power flow (CACOPF) is used to determine the coordinated setpoints for PVSIs, DSTATCOM, and OLTC based on PV generation and load demand data. Then, machine learning models are trained as controllers to select optimal operating points for the PVSIs, DSTATCOM, and OLTC under varying load and distributed generation conditions.
The major contribution of this research is as follows:
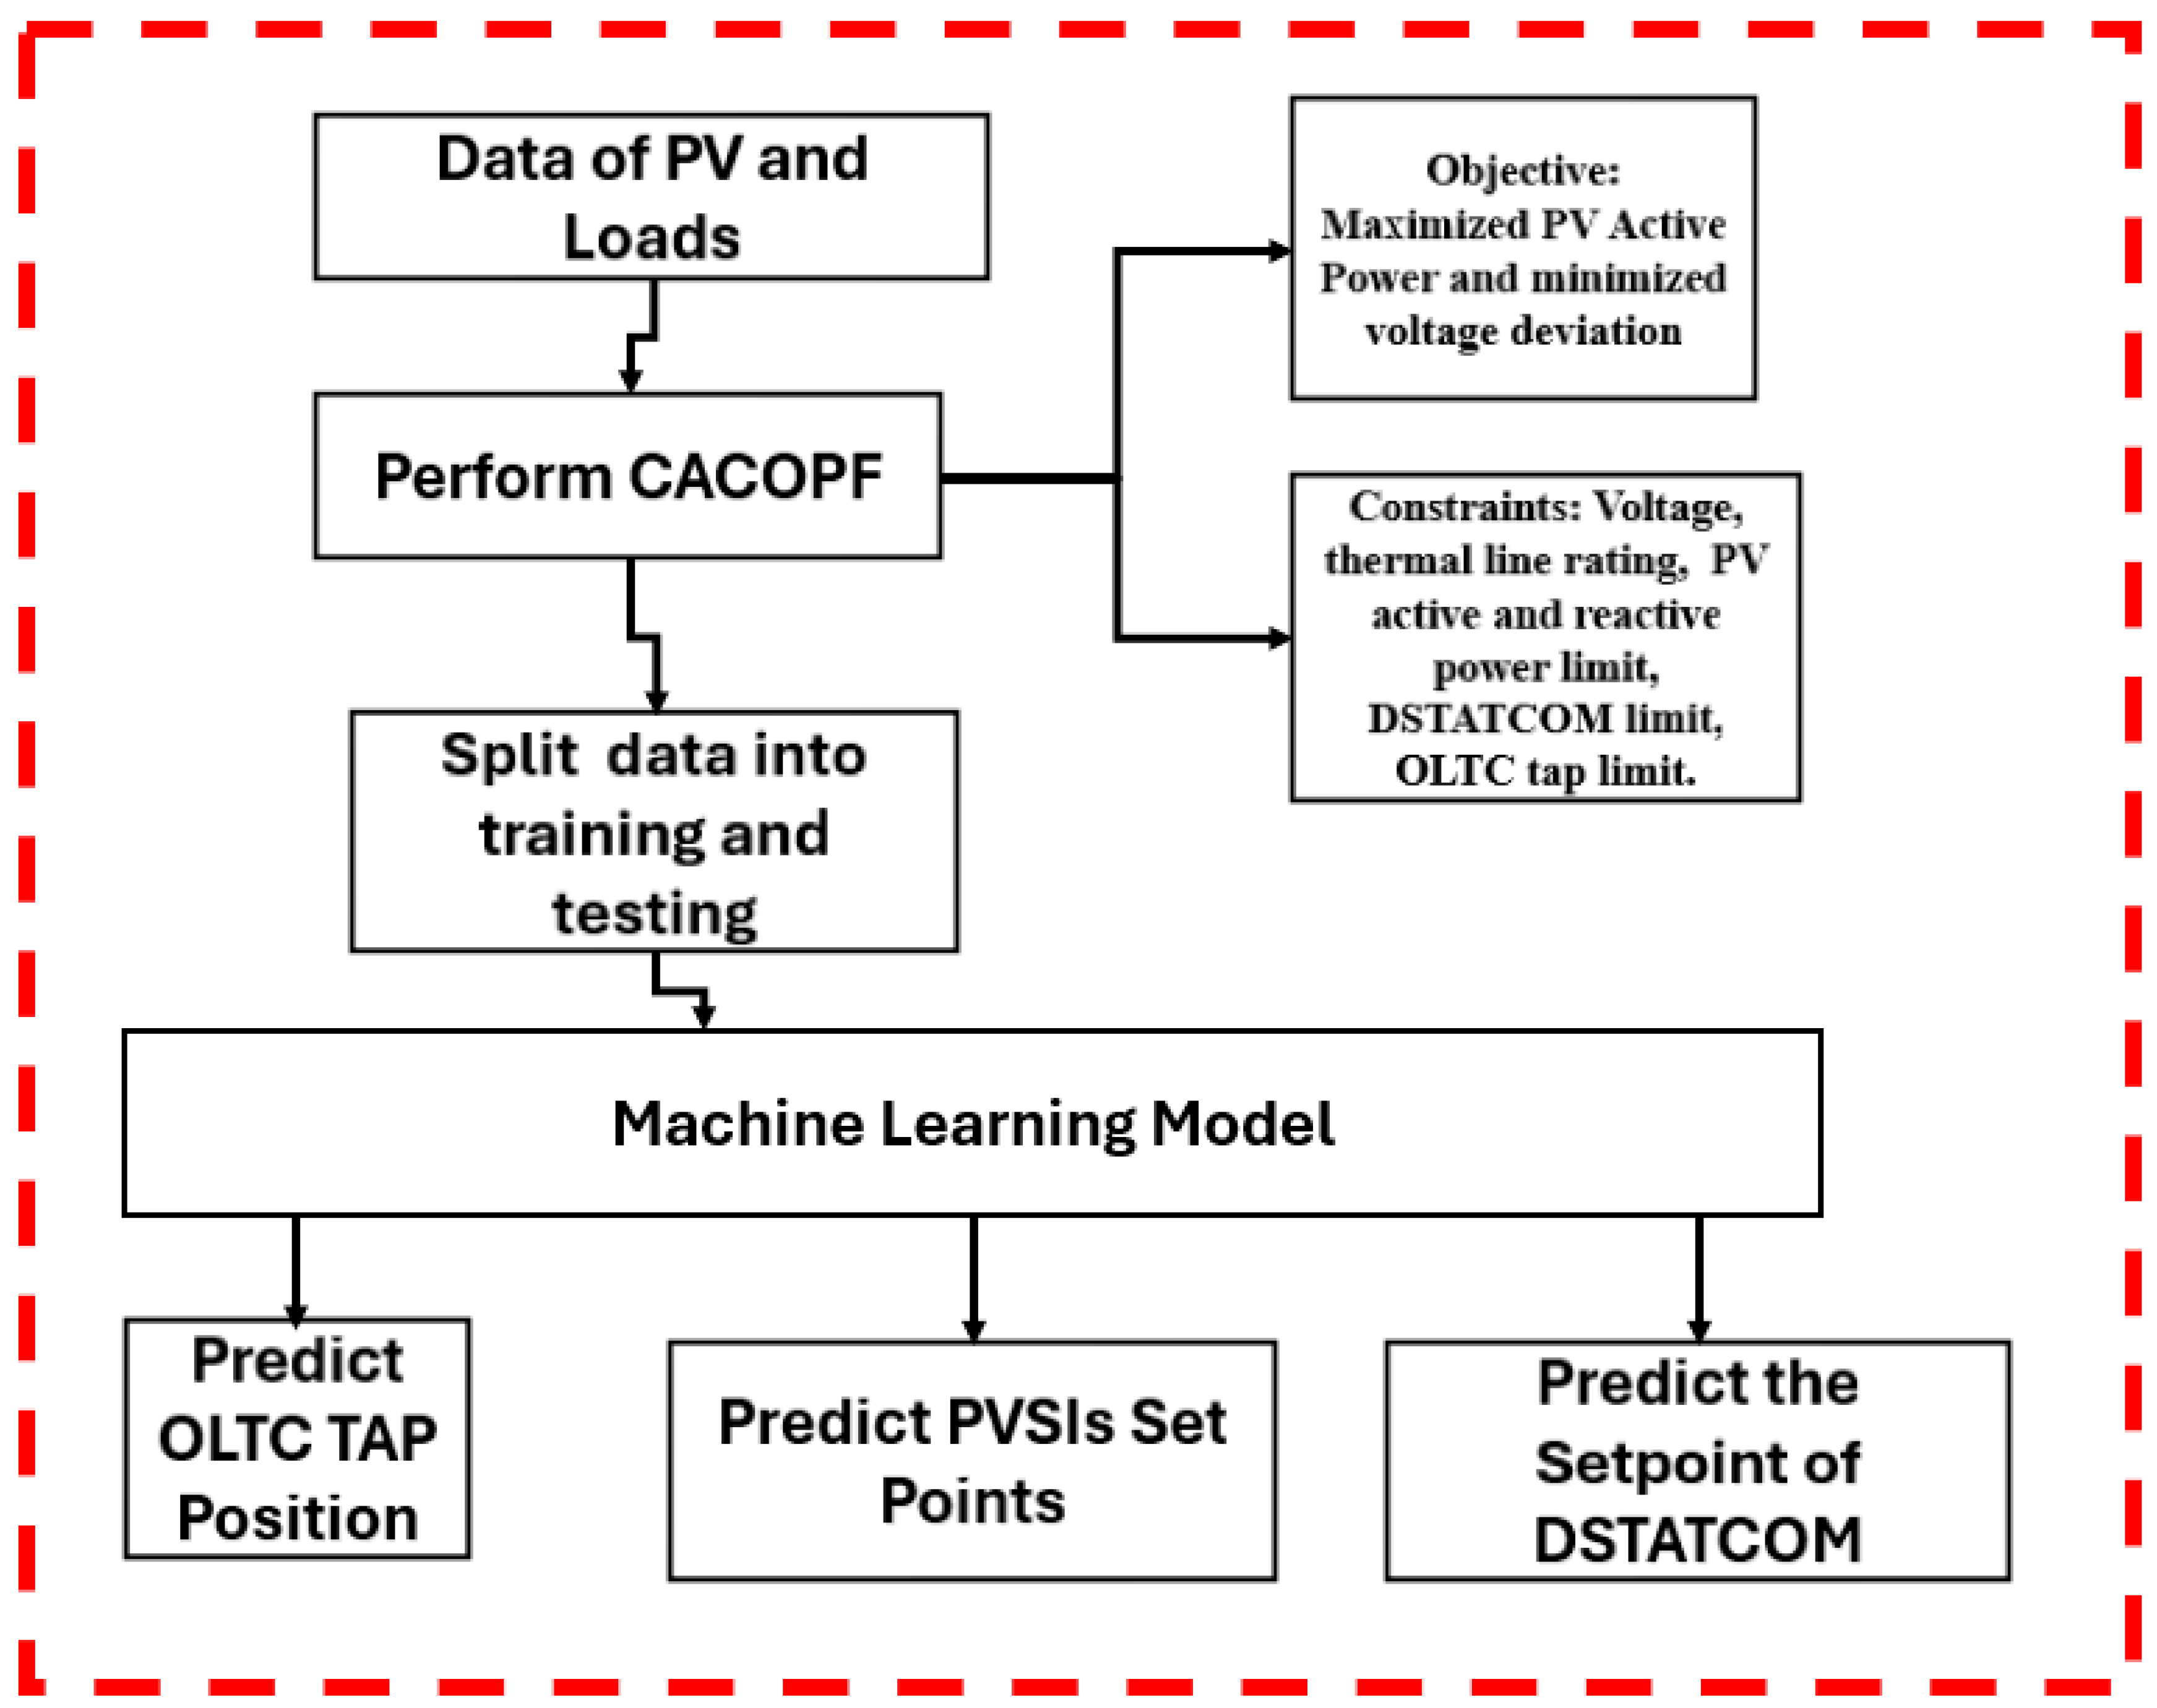
  • The research addresses the computational inefficiency of running optimal power flow (OPF) multiple times by proposing an ML-based approach to predict optimal setpoints of voltage-regulating devices under different loading conditions. The approach reduces the need for repeatedly solving OPF problems, enhancing real-time operational efficiency.
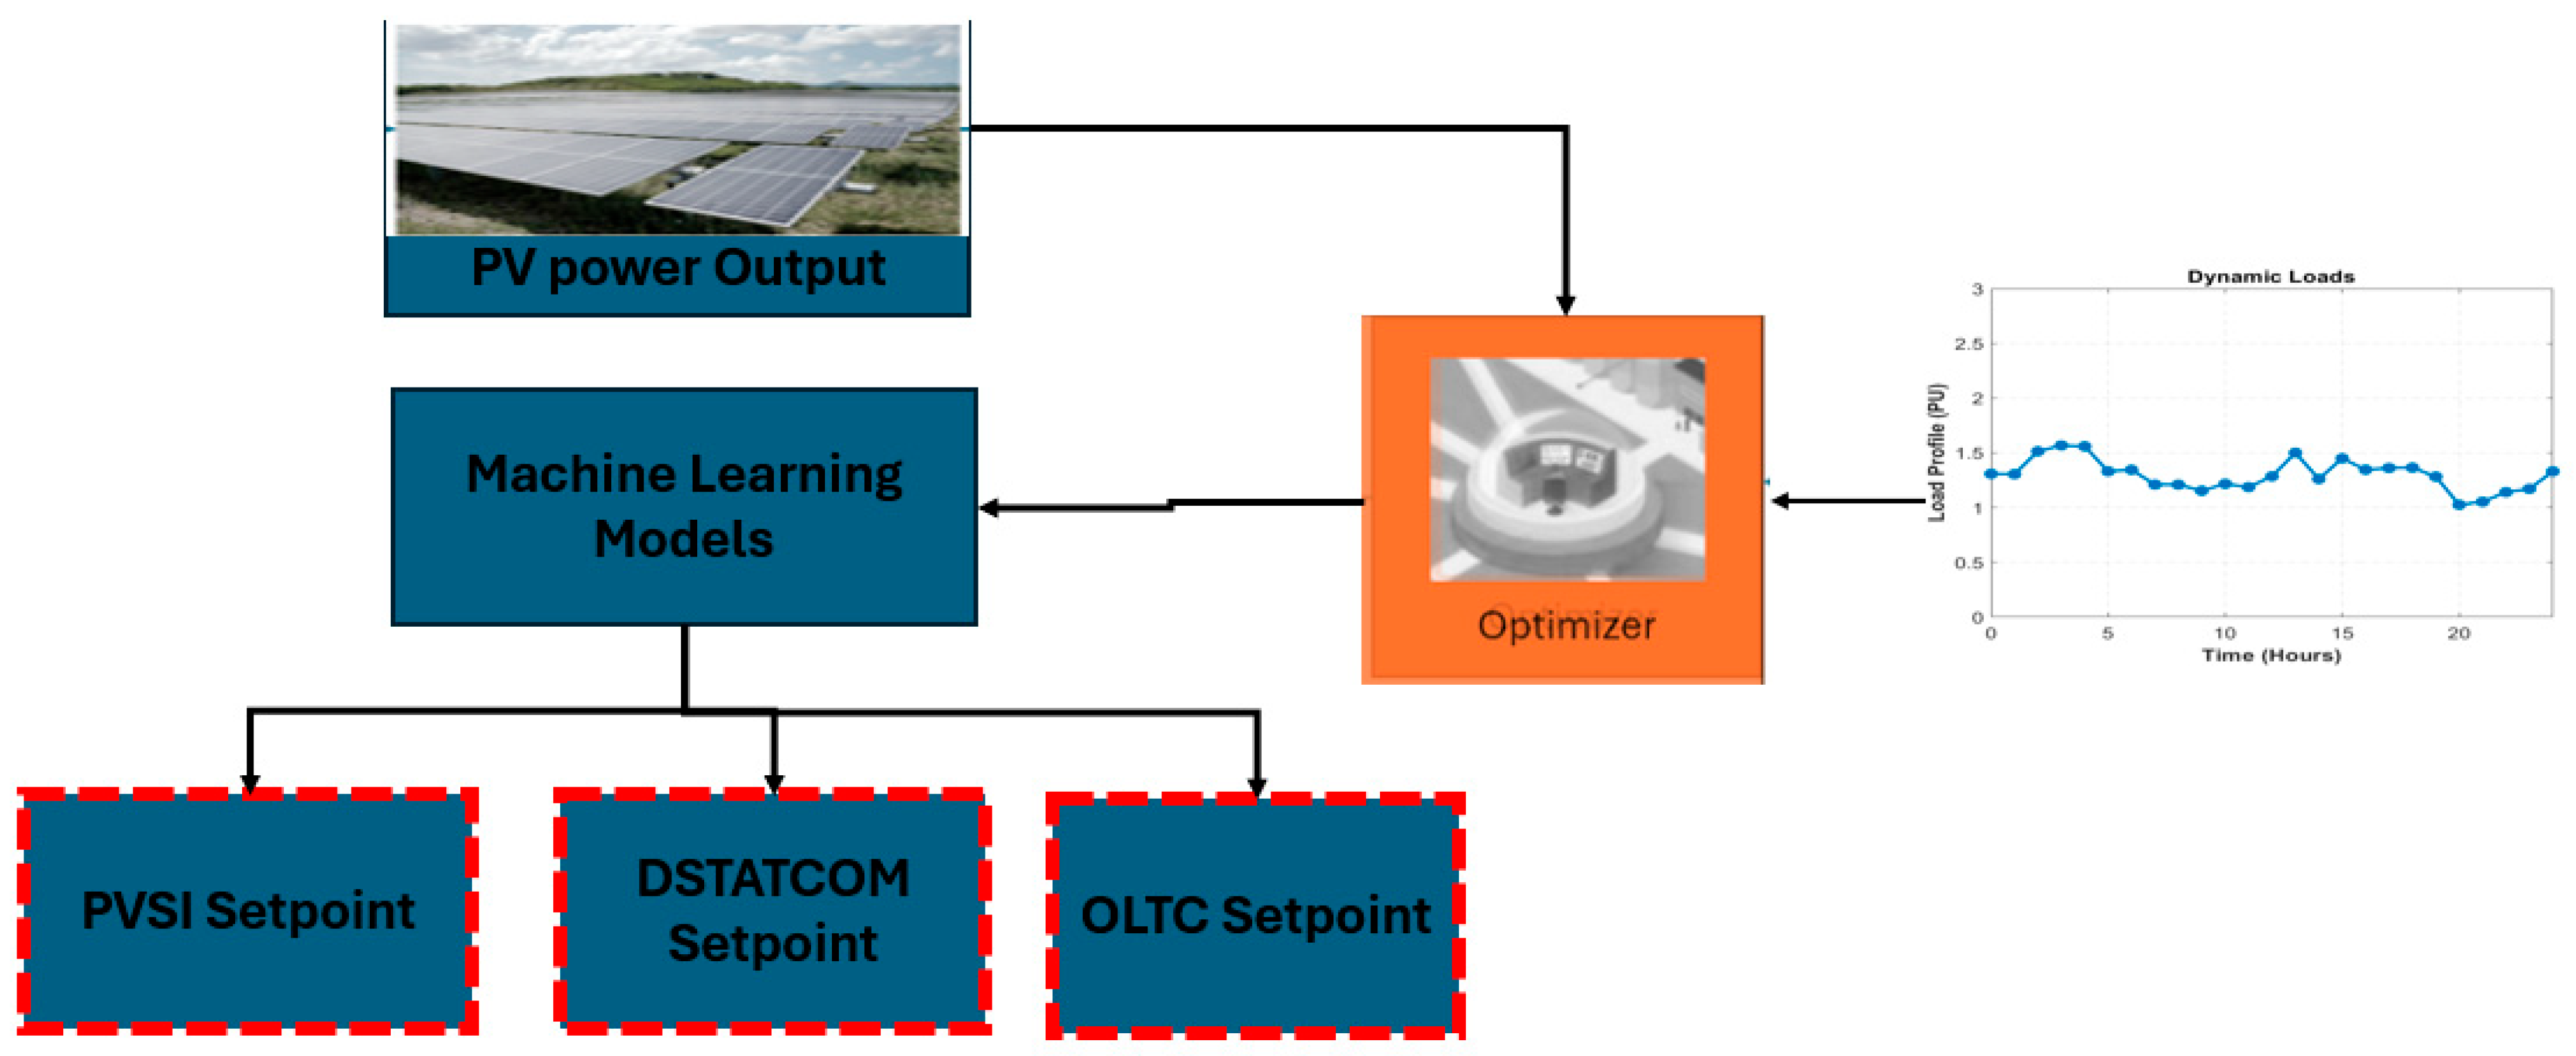
  • The proposed coordinated control scheme involving PV smart inverters, DSTATCOM, and OLTC enables effective voltage regulation and power flow management by leveraging the combined capabilities of multiple devices in the power system.
  • The centralized AC optimal power flow (CACCOPF) adopted in this research ensures that the control strategy accounts for nonlinear power system dynamics, improving the accuracy and robustness of the coordination.
  • The use of ML models as local controllers to determine the best operational points of PV smart inverters, DSTATCOM, and OLTC allows a scalable and communication-efficient control mechanism, enabling faster decision making.

2. Proposed Framework

The proposed framework for coordinating and controlling the output of PV energy along with voltage regulation devices is illustrated in Figure 1. The time-varying output power from the PV system and dynamic loading were fed into an optimizer, which continuously operates based on a multi-objective function aimed at maximizing PV output while minimizing voltage deviations across the network. The optimizer calculates the setpoints for the voltage regulation devices and the PV smart inverter (PVSI) at hourly intervals, considering both load demand and PV generation. To eliminate the need for repeatedly running the optimizer, the hourly setpoint results for the voltage devices and PVSIs’ reactive power are used to train machine learning models. As a result, the setpoints for both the voltage regulation devices and the PV inverter can be predicted for any combination of load demand and PV generation output.

3. Mathematical Modeling

This section outlines the centralized AC optimal power flow (CACOPF) approach for power system networks, which is based on the nonlinear power flow equations. It also presents the mathematical formulations for controlling the reactive power output of PVSIs as well as the control equations for the OLTC and DSTATCOM. Compared to linearized or DC power flow models, the nonlinear power flow model provides a more accurate representation of actual system behavior. While linearized and DC power flow methods often rely on simplifying assumptions such as ignoring reactive power and bus voltage angles, the nonlinear model captures these aspects, delivering a more realistic and precise depiction of power system conditions [24,25,26].

3.1. Nonlinear Centralized AC OPF (CACOPF)

The nonlinear OPF is formulated by the following power flow model as in (1) to (4). The equivalent active power and reactive power at any bus in the network are described in Equations (1) and (2). The equivalent active and reactive power that flows in bus i, connected to a PSVI and the load connected, is given as in (3) and (4) [27].
P G i P D i = P i ( V ,   δ )
Q G i Q G i = Q i ( V ,   δ )
P P V S I i P D i = k = 1 n V i V k | Y i k | cos ( δ i δ k θ i k )
Q P V S I i Q D i = k = 1 n V i V k | Y i k | sin ( δ i δ k θ i k )  
where PG−i and QG−i are the active and reactive power generated at bus I, respectively. PPVSI is the active power of the PVSI, PD−i is the active load at the point of connection, QPVSI is the reactive power of the PVSI, and QD−i is the reactive power demand at the point where PVSI is connected. Vi and Vk are the buses between bus i and k, respectively, Yik is the admittance between i and k, δ i is the bus angle of i, δ k is the bus angle of k, and θ i k is the angle difference between i and k. The PPVSI and QPVSI will be zero when there is no PVSI connected at bus i. In the slack bus, the active and reactive power are free to balance the mismatch in the network.

3.2. OLTC Model

The tap position of the OLTC is determined by the secondary and primary voltage of the transformer and the change ratio per step. The OLTC tap position is modeled as expressed in (5).
T p = V s V p 1 . 1
where vp and vs are the primary and secondary connection points of the transformer, and is the change ratio per step.

3.3. Smart Inverter Model

In this study, the smart inverter is designed to regulate voltage by adjusting its reactive power output in response to voltage levels. When the terminal voltage drops below the network’s minimum threshold, the inverter supplies reactive power to the grid; when the terminal voltage exceeds the maximum limit, it absorbs reactive power from the grid. The inverter’s voltage setpoints (v1, v2, v3, and v4) are optimally determined using three key parameters: the reference voltage (vr), the voltage range (D), and the deadband (d). The inverter’s goal is to keep the terminal voltage close to vr. The amount of reactive power injected or absorbed to achieve this is based on D and the inverter’s maximum reactive power capacity. The voltage setpoints are calculated using Equations (6) through (10).
v 1 = v r D
v 2 = v r d
v 3 = v r + d
v 4 = v r + D
The voltage gap D used is 5% of the nominal voltage, the deadband is 2% of the nominal voltage, and Vr is the nominal voltage of 1. The reactive power output of the smart inverter as a function of voltage is modeled using a piecewise function, which is expressed as in (10).
Q P V S I = Q m a x                                                               v v 1 Q m a x ( v 2 v 1 ) × v V 1                     v 1 v v 2 0                                                                                         v 2 v v 3 Q m a x v 3 v 4 × v v 3                   v 3 v v 4 Q m a x                                                               v v 4
where V denotes the bus voltage, QPVSI is the smart inverter available reactive power at the connected bus n, and Qmax is the maximum reactive power that can be absorbed or supplied by the PVSI.

3.4. Distribution Static Synchronous Compensator (DSTATCOM) Model

A DSTATCOM (distribution static synchronous compensator) is a device used to regulate voltage by generating or absorbing reactive power at high speed. The reactive power of a DSTATCOM is controlled using power electronics, which is typically through voltage–source converters (VSC) that allow rapid and continuous adjustments of the reactive power. There are two main operation modes for DSTATCOM: voltage regulation mode and reactive power control mode. In voltage regulation mode, the DSTATCOM can be modeled by two parameters: the slope (XDSTATCOM) and the voltage reference (Vr). In reactive power control mode, the DSTATCOM can be modeled as a constant susceptance. However, when the DSTATCOM reaches its limits, it operates as either a fixed capacitive or a fixed inductive device under low or high voltage conditions, respectively. In these situations, the DSTATCOM is not actively controlled, which limits its ability to regulate voltage effectively. In this study, the voltage control mode of the DSTATCOM was employed. It is modeled by a voltage source in series with reactance (XDSTATCOM). An auxiliary generator is used to model the DSTATCOM in the networks. The XDSTATCOM and Vr are the decision variables, and the DSTATCOM reactive power (QDSTATCOM) is obtained from the optimal OPF as depicted in (11) to (13).
X m i n S L   X S L X S L m a x
V m i n V r   V m a x
Q m i n D S T A T C O M   Q D S T A T C O M Q D S T A T C O M m a x
where X m i n S L and X S L m a x denote the minimum and maximum values of the DSTATCOM slope settings, respectively. Vmin and Vmax represent the minimum and maximum permissible voltage limits, respectively. Q m i n D S T A T C O M and Q D S T A T C O M m a x are the lower and upper limits of the DSTATCOM reactive power, respectively.

4. Objective Function and Constraints

The robust, coordinated control setpoints of the reactive power of the PVSIs and the tap position of the OLTC are computed and determined using the centralized AC optimal power flow (CACOPF) approach. The objective functions and constraints under different loading and power outputs are discussed as follows:

4.1. Objective Function

The objective function of the proposed approach is the maximization of the active power of the PVSI and the minimization of voltage deviation of all buses in the networks as described in (14).
max w 1 m N P V S I P P V S I + min w 2 n = i N 1 V i N  
where PPVSI is the active power of the PVSI and NPVSI is the number of PVSIs connected in the network, Vi is the voltage at bus i, and N is the total number of buses in the network. Since the objective function is a multiple function, it is scalarized via a weighted sum. After normalizing each objective and inspecting the Pareto front, we set the weights in the ratio 7.9:0.2, which corresponds (when normalized to sum to 1) to approximately w1 = 0.975 for the PVSI power and w2 = 0.025 for the voltage deviation objective.

4.2. Constraints

Several power flow constraints were set for the optimization process as discussed in the following sections:

4.2.1. Voltage Constraint

The voltage magnitude at bus n should satisfy the permissible voltage limit as in (15).
V m i n V n V m a x
where Vmin is the minimum voltage, Vn is the voltage at any bus n, and Vmax is the maximum voltage.

4.2.2. Thermal Capacity Constraint

The thermal capacity limit of the distribution line should be less than the maximum apparent power value as in (16).
P 2 n + q 2 n S 2 n _ m a x
where Pn and qn are the active and reactive power that flows along the distribution line, and Sn-max is the maximum apparent power of the line.

4.2.3. Tap Position of OLTC Constraints

The OLTC tap position should be within the permitted range, and the difference between consecutive tap changes should be limited, as presented in (17). The number of tap positions varies from −8 to 8.
T m i n P T P , t T P m a x
where T m i n P and T P m a x are the minimum and maximum tap positions. T P , t is the tap position at time t.

4.2.4. Smart Inverter (SI) Constraints

The PV smart inverter constraints are presented in Equations (18) to (19).
P P V S I m i n P P V S I   P P V S I m a x
Q P V S I m i n Q P V S I   Q P V S I m a x
where P P V S I m i n and P P V S I m a x are the maximum and minimum active power limits of smart inverters, respectively. Q P V S I m i n and Q P V S I m a x are the minimum and maximum reactive power limits of PV smart inverters, respectively. P P V S I and Q P V S I are the active and reactive power of the smart inverter, respectively.

4.2.5. Power Flow Constraints

The power flow constraints at the point without PVSI and with PVSI are given in (20) and (21) for active power and (22) and (23) for reactive power, respectively.
P n = P D
P n = P P V S I P D
Q n = Q D
Q n = Q P V S I Q D
In addition, the reactive power flow constraint at the point of connection of the DSTATCOM is given in Equation (26).
Q n = Q D S T A T C O M Q D
where PD and QD represent the active and reactive load demand at the bus n, respectively, Q S T A T C O M is the reactive power supplied by DSTATCOM at bus n, and P P V S I and Q P V S I represent the active power and reactive power of the PVSIs, respectively. To minimize the computational load of repeatedly solving the OPF, machine learning models are trained on the results of the CACOPF, enabling real-time implementation.

5. Machine Learning Approaches in Predicting the Optimal Setpoints of PVSIs and Voltage Regulating Devices
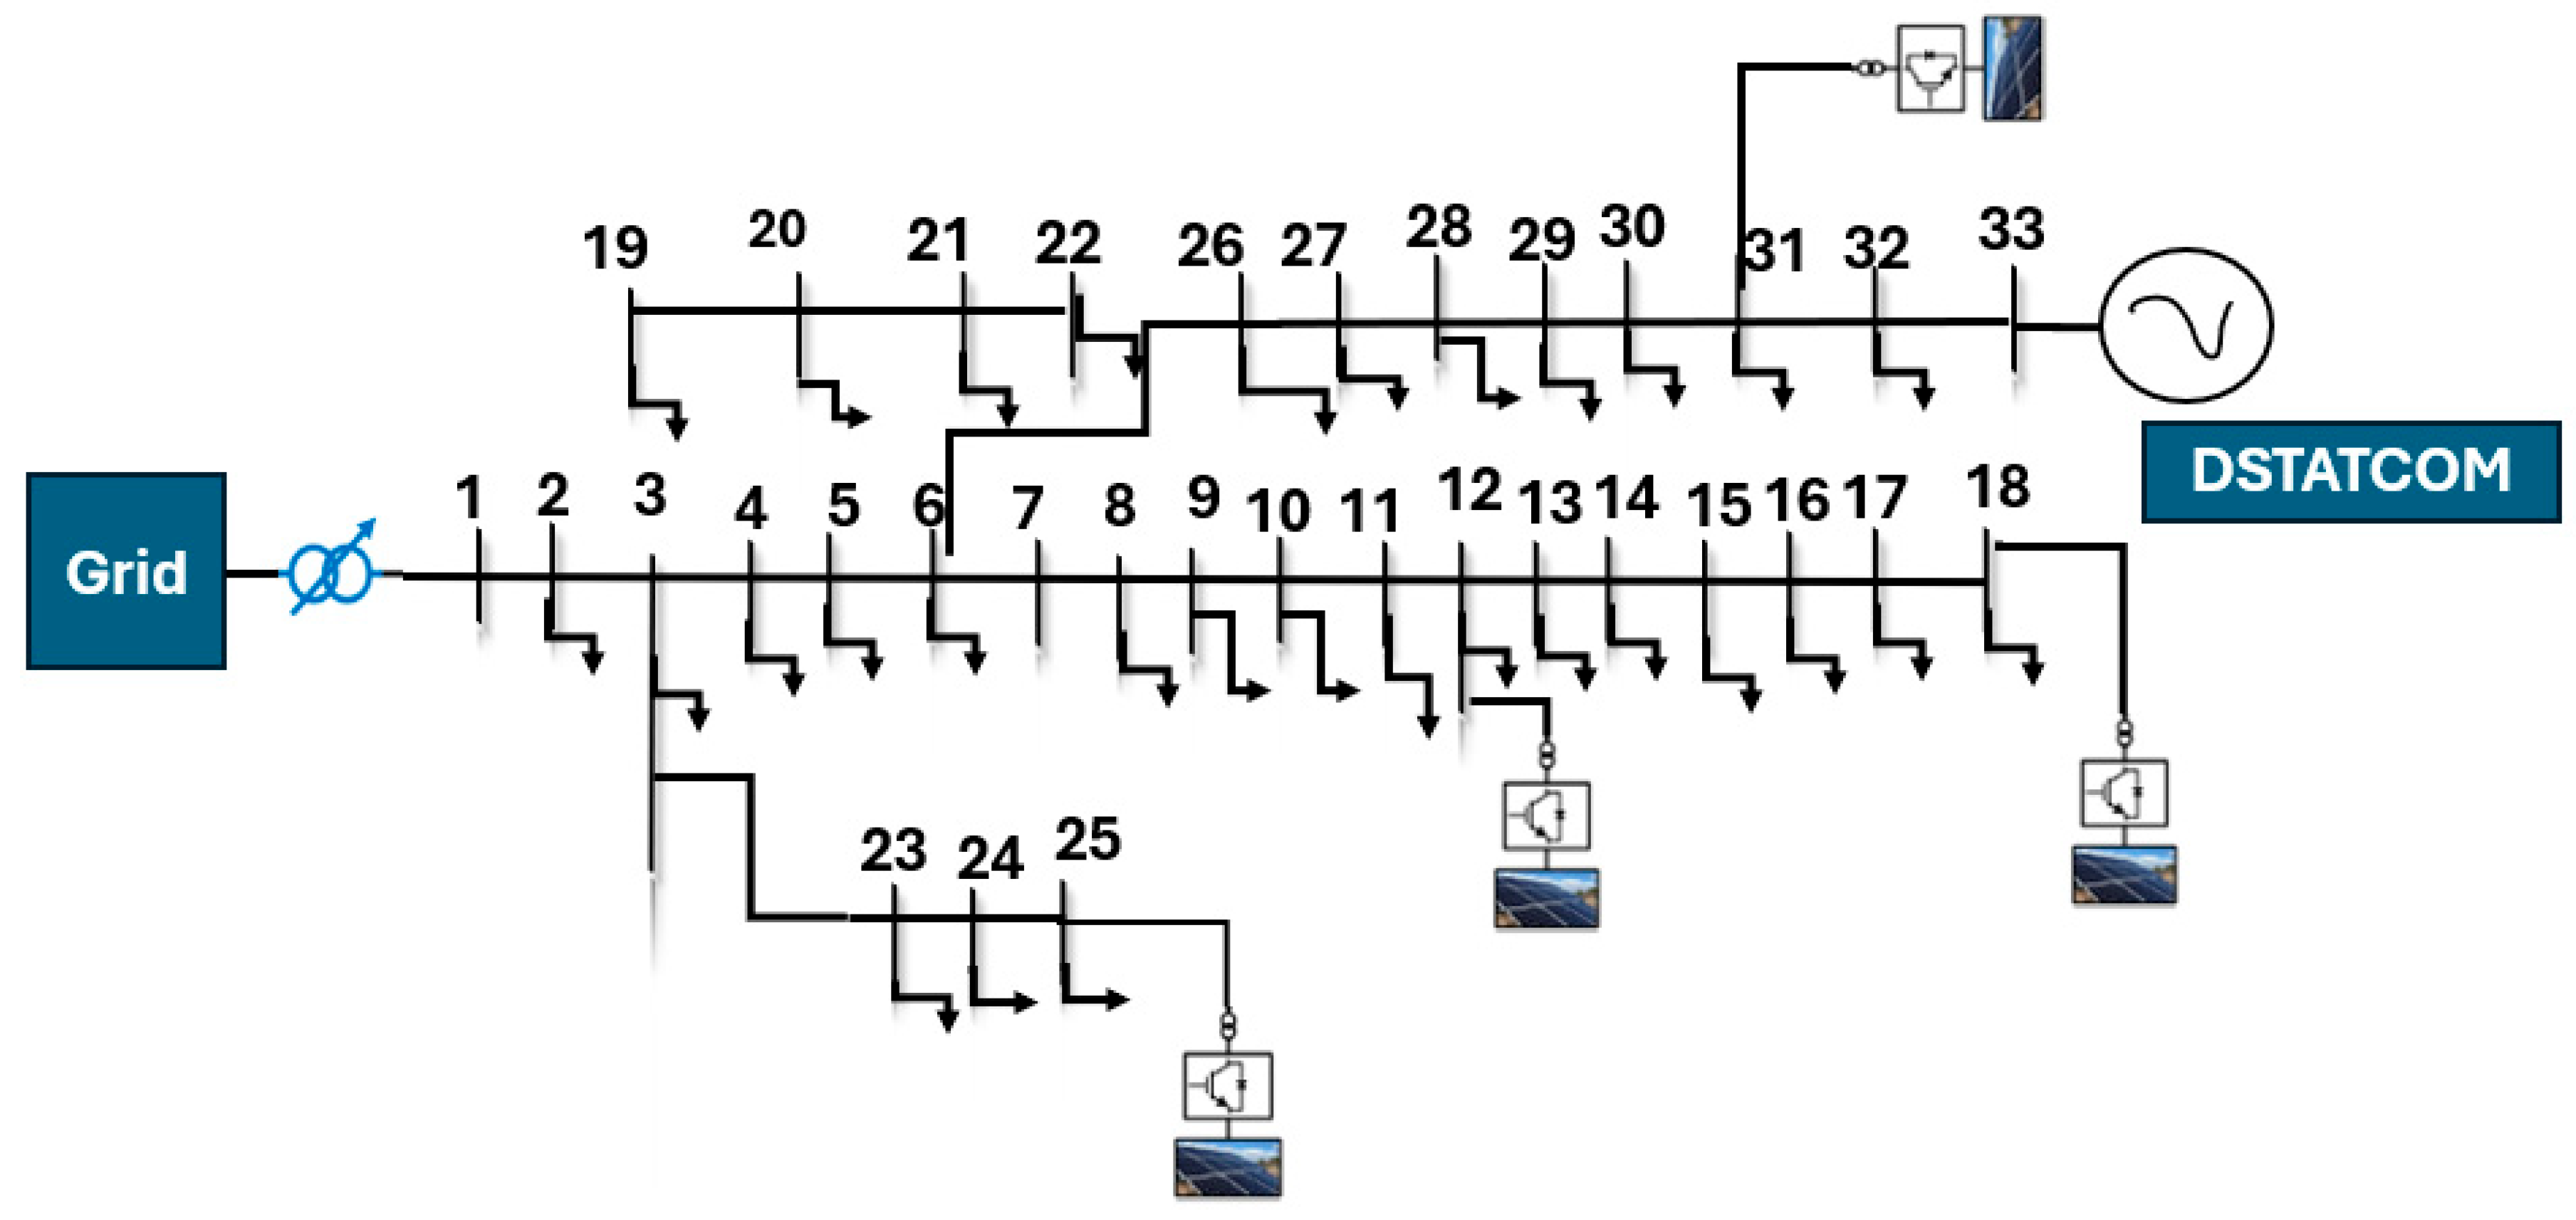
The prediction is carried out after the implementation of the CACOPF. The step-by-step approach is presented in Figure 2.
CACOPF is carried out offline using the defined objective function and constraints to find the optimal operating points for the PVSIs, the reactive power output of the DSTATCOM, and the ideal tap settings for the OLTC under different PV generation and load conditions. The resulting CACOPF dataset is then normalized and divided into training and testing sets with 80% allocated for training and 20% for testing. In machine learning, the accuracy of parameter prediction depends mainly on three factors: the quality of the data, how the input is structured, and the chosen algorithm or model [28]. According to the “no free lunch theorem,” no single model excels universally across all problems [29,30]. Therefore, multiple machine learning algorithms must be evaluated to ensure reliable predictions. In this study, three algorithms; extreme learning machine (ELM), decision tree (DT), and deep neural network (DNN); are used to forecast the OLTC tap positions and the reactive power setpoints for the PVSIs and DSTATCOM. The prediction performance is assessed using the root mean square error (RMSE) and mean absolute error (MAE) metrics, as defined in Equations (25) and (26).
R M S E = n = 1 n ( X n ˙ X n ) ˙ 2 n
M A E = 1 n ( X n ˙ X n ) ˙ n
where X n ˙ is the predicted value, X n is the actual value, and n is the number of samples predicted.
Since predicting the OLTC tap position is a classification problem, its evaluation relies on metrics derived from the confusion matrix with accuracy and precision calculated as shown in (27) and (28). However, as noted in [30,31], accuracy and precision alone can be misleading when classes are imbalanced. To address this, the Matthews Correlation Coefficient (MCC), given in (29) [31], is also used to assess the performance of the machine learning models for predicting the OLTC tap positions, ensuring that class imbalance does not distort the results.
A c c u r a c y = T P + T N T P + T N + F P + F N
P r e c i s i o n = T P T P + F P
M C C = T P . T N ( F P . F N ) ( T p + F P ) ( T p + F N ) ( T N + F P ) ( T N + F N )
where TP and TN are the true positive and true negative, respectively. FP and FN are the false positive and false negative, respectively. To test the proposed approach, a simulation analysis was carried out on a modified IEEE bus 33 with high penetration of PV energy under different loading conditions.

6. Simulation Setup

The proposed method was validated using a modified IEEE 33-bus network, as illustrated in Figure 3. In this setup, four PV smart inverters are installed at their optimal locations along with a DSTATCOM, as shown in the figure. Both the PV output and load demand change over time. Each PV inverter has a capacity of 4.5 MVA and is placed at its optimal position within the network. The PVSI can inject or absorb up to 1.5 MVAR of reactive power to help maintain voltage levels, ensuring a minimum power factor of 0.94. Additionally, the maximum reactive power capacity is 300 kVAR. To demonstrate the effectiveness of the optimization within the defined objectives and constraints, a daily simulation was carried out, accounting for variations in PV generation and load demand, to determine the best operating points for the voltage regulation devices and PVSIs under different scenarios. Following the daily simulation, the CACOPF was applied to the entire dataset, which included 1080 samples reflecting various PV outputs and load conditions.
Two scenarios were considered for the networks: Scenario 1, when the smart inverter is not optimally controlled, and Scenario 2, when the reactive power of the smart Inverter is optimally controlled by a controller in the OPF. The CACOPF is conducted in MATLAB using FMINCON solver.

7. Results and Analysis

The test system, case studies, and performance evaluation of the machine learning-based coordination control methods are thoroughly discussed in the following subsections.

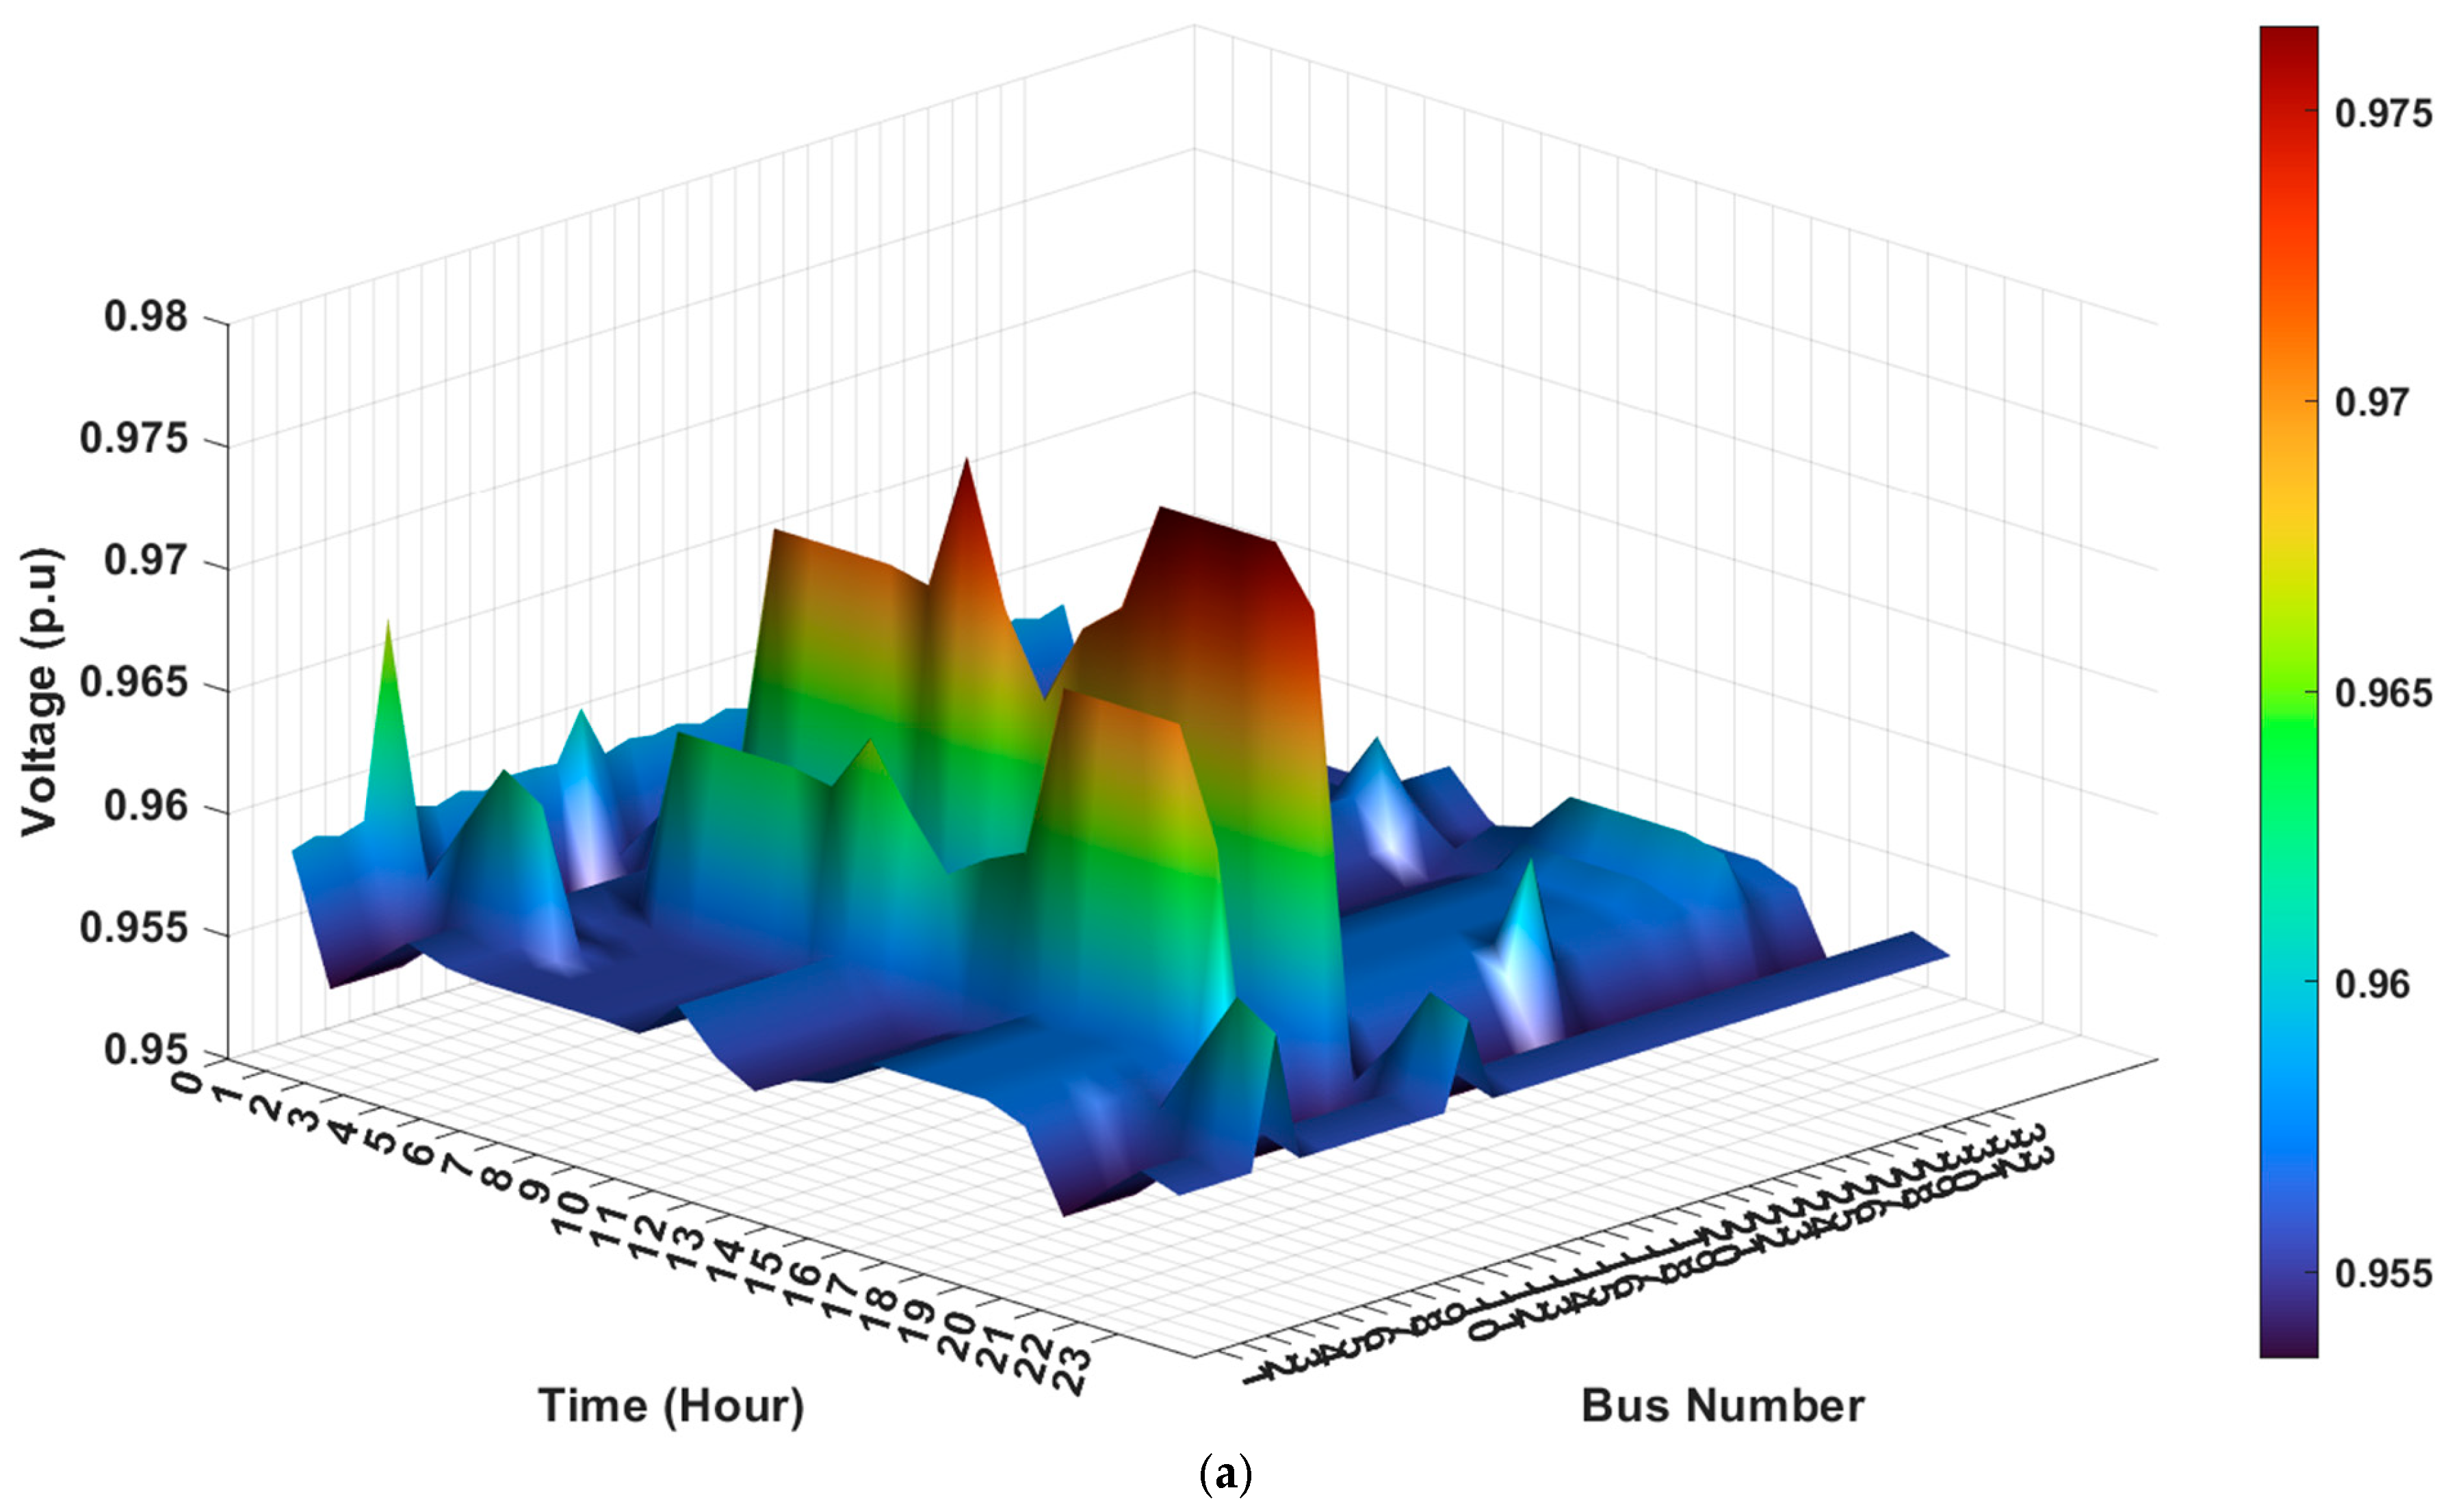
7.1. Daily Voltage Profile and Optimal Setpoint of OLTC, PVSI, and DSTATCOM Network

Figure 4 displays the daily voltage profiles of all nodes in the network when the OLTC, DSTATCOM, and PVSIs are coordinated using the CACOPF for both scenarios. The figure shows that the voltages remain within the acceptable range of 0.95 to 1.05 PU across all conditions of load and PV output. This indicates that the CACOPF successfully met its objective, maintaining voltage limits for all buses even with the uncertainties in PV generation and varying load conditions.
Figure 5 illustrates the dynamic behavior of the reactive power from the PVSIs under varying loading conditions and fluctuating power generated. As seen in the figure, the reactive power output from the PVSIs adjusts continuously to maintain the voltage within the accepted limit in the network. This indicates that the PVSIs play a crucial role in voltage regulation by either supplying or absorbing reactive power, depending on the system’s voltage needs. The reactive power fluctuates within the operational limits of the PVSIs, which are determined by the inverter’s capabilities and the system’s voltage stability requirements. The optimizer ensures that the PVI does not exceed its maximum power generation capacity or absorb more reactive power than it can handle. By adjusting the reactive power output, the PVSIs help stabilize the voltage at the point of common coupling (PCC), ensuring that voltage remains within acceptable bounds despite changes in load and PV generation. This dynamic adjustment highlights the PVSIs’ flexibility in voltage control, enabling more efficient system operation and enhancing grid stability under varying conditions. In Figure 6, the DSTATCOM is shown to frequently supply reactive power to maintain the bus voltage. However, with optimal control of reactive power from the PV inverter in Scenario 2, the STATCOM compensates more actively for voltage fluctuations, ensuring voltage stability by injecting reactive power as needed. This is due to the controller logic embedded in the OPF regulating the reactive power of the PVSIs, which will not allow any excessive import or export of reactive power from the PVSI in order to reduce active power losses in the network. Therefore, the CACOPF allows the DSTATCOM to supply less reactive power in Scenario 2 than in Scenario 1, with low PV generation periods, and it supplies more reactive power in Scenario 2, as shown in Figure 6b, than in Scenario 1, when the PV generation is high. This is due to the objective function of the CACOPF, which is the maximization of the PV power active and the minimization of the voltage profile. The CACOPF prefers to use the best setpoints of the DSTATCOM to keep the PVSI at the maximum power capacity at any point in the network and ensure that the voltage of all buses in the network is within the acceptable limits.
The tap changes of the OLTC for the two scenarios under the variation in the PV power output and loading condition are presented in Figure 7. In Scenario 1, when the Volt–VAR of the inverter is not optimally controlled, the operation of the tap position of the OLTC for voltage regulation increases in frequency as the stall changes with a frequency of 4 under the 24 timesteps. This implies that without optimal control, the volt-var increases the dependents of voltage regulation of the OLTC. The results in Figure 6b indicate that by optimally coordinating the OLTC with the smart inverter and DSTATCOM, the frequency of switching the OLTC tap position is reduced with a stall change of 2 under the 24 h timestep. This implies that the system can maintain voltage stability more efficiently in Scenario 2 where the OLTC role is optimized. The reduction in switching frequency suggests improved overall voltage regulation and reduces mechanical wear on the OLTC, which can enhance the longevity and reliability of the OLTC. Additionally, it indicates that the PVSI and DSTATCOM are effectively assisting in maintaining the desired voltage levels, leading to a more efficient operation of the power grid. The coordination approach reduces the dependency on OLTC adjustments and enhances the system’s response to dynamic variations of the PV and loading conditions.
To validate the effectiveness of optimally controlling the Volt–VAR of the PVSI, the sensitivity analysis is presented in Table 1. The findings demonstrate that in Scenario 2, where the inverter’s Volt–VAR is optimally managed, the voltage profile improves and the total active power output from the PV inverter increases. In Scenario 1, the average voltage deviation across the network is 0.0425 PU, and the total active power generated by the PV smart inverter is 130.239 MW. In contrast, Scenario 2, where reactive power is optimally controlled, yields an active power output of 131.4998 MW and a reduced voltage deviation of 0.034 PU under varying PV generation and load conditions. These results indicate that integrating a controller into the optimization process is an effective strategy for coordinating PV output and voltage regulation. The optimal control of reactive power not only improves PVSI performance but also enhances the utilization of the PV system’s generation capacity. The increased power output in Scenario 2 confirms more efficient inverter operation, showing that coordinated reactive power control significantly contributes to overall system efficiency and improved network performance.
To minimize the computational demands of repeatedly executing the OPF and enable real-time implementation, the CACOPF results from Scenario 2 were used to train various machine learning models. These models were then tested to predict the setpoints of the voltage regulation devices and the reactive power output of the inverter.

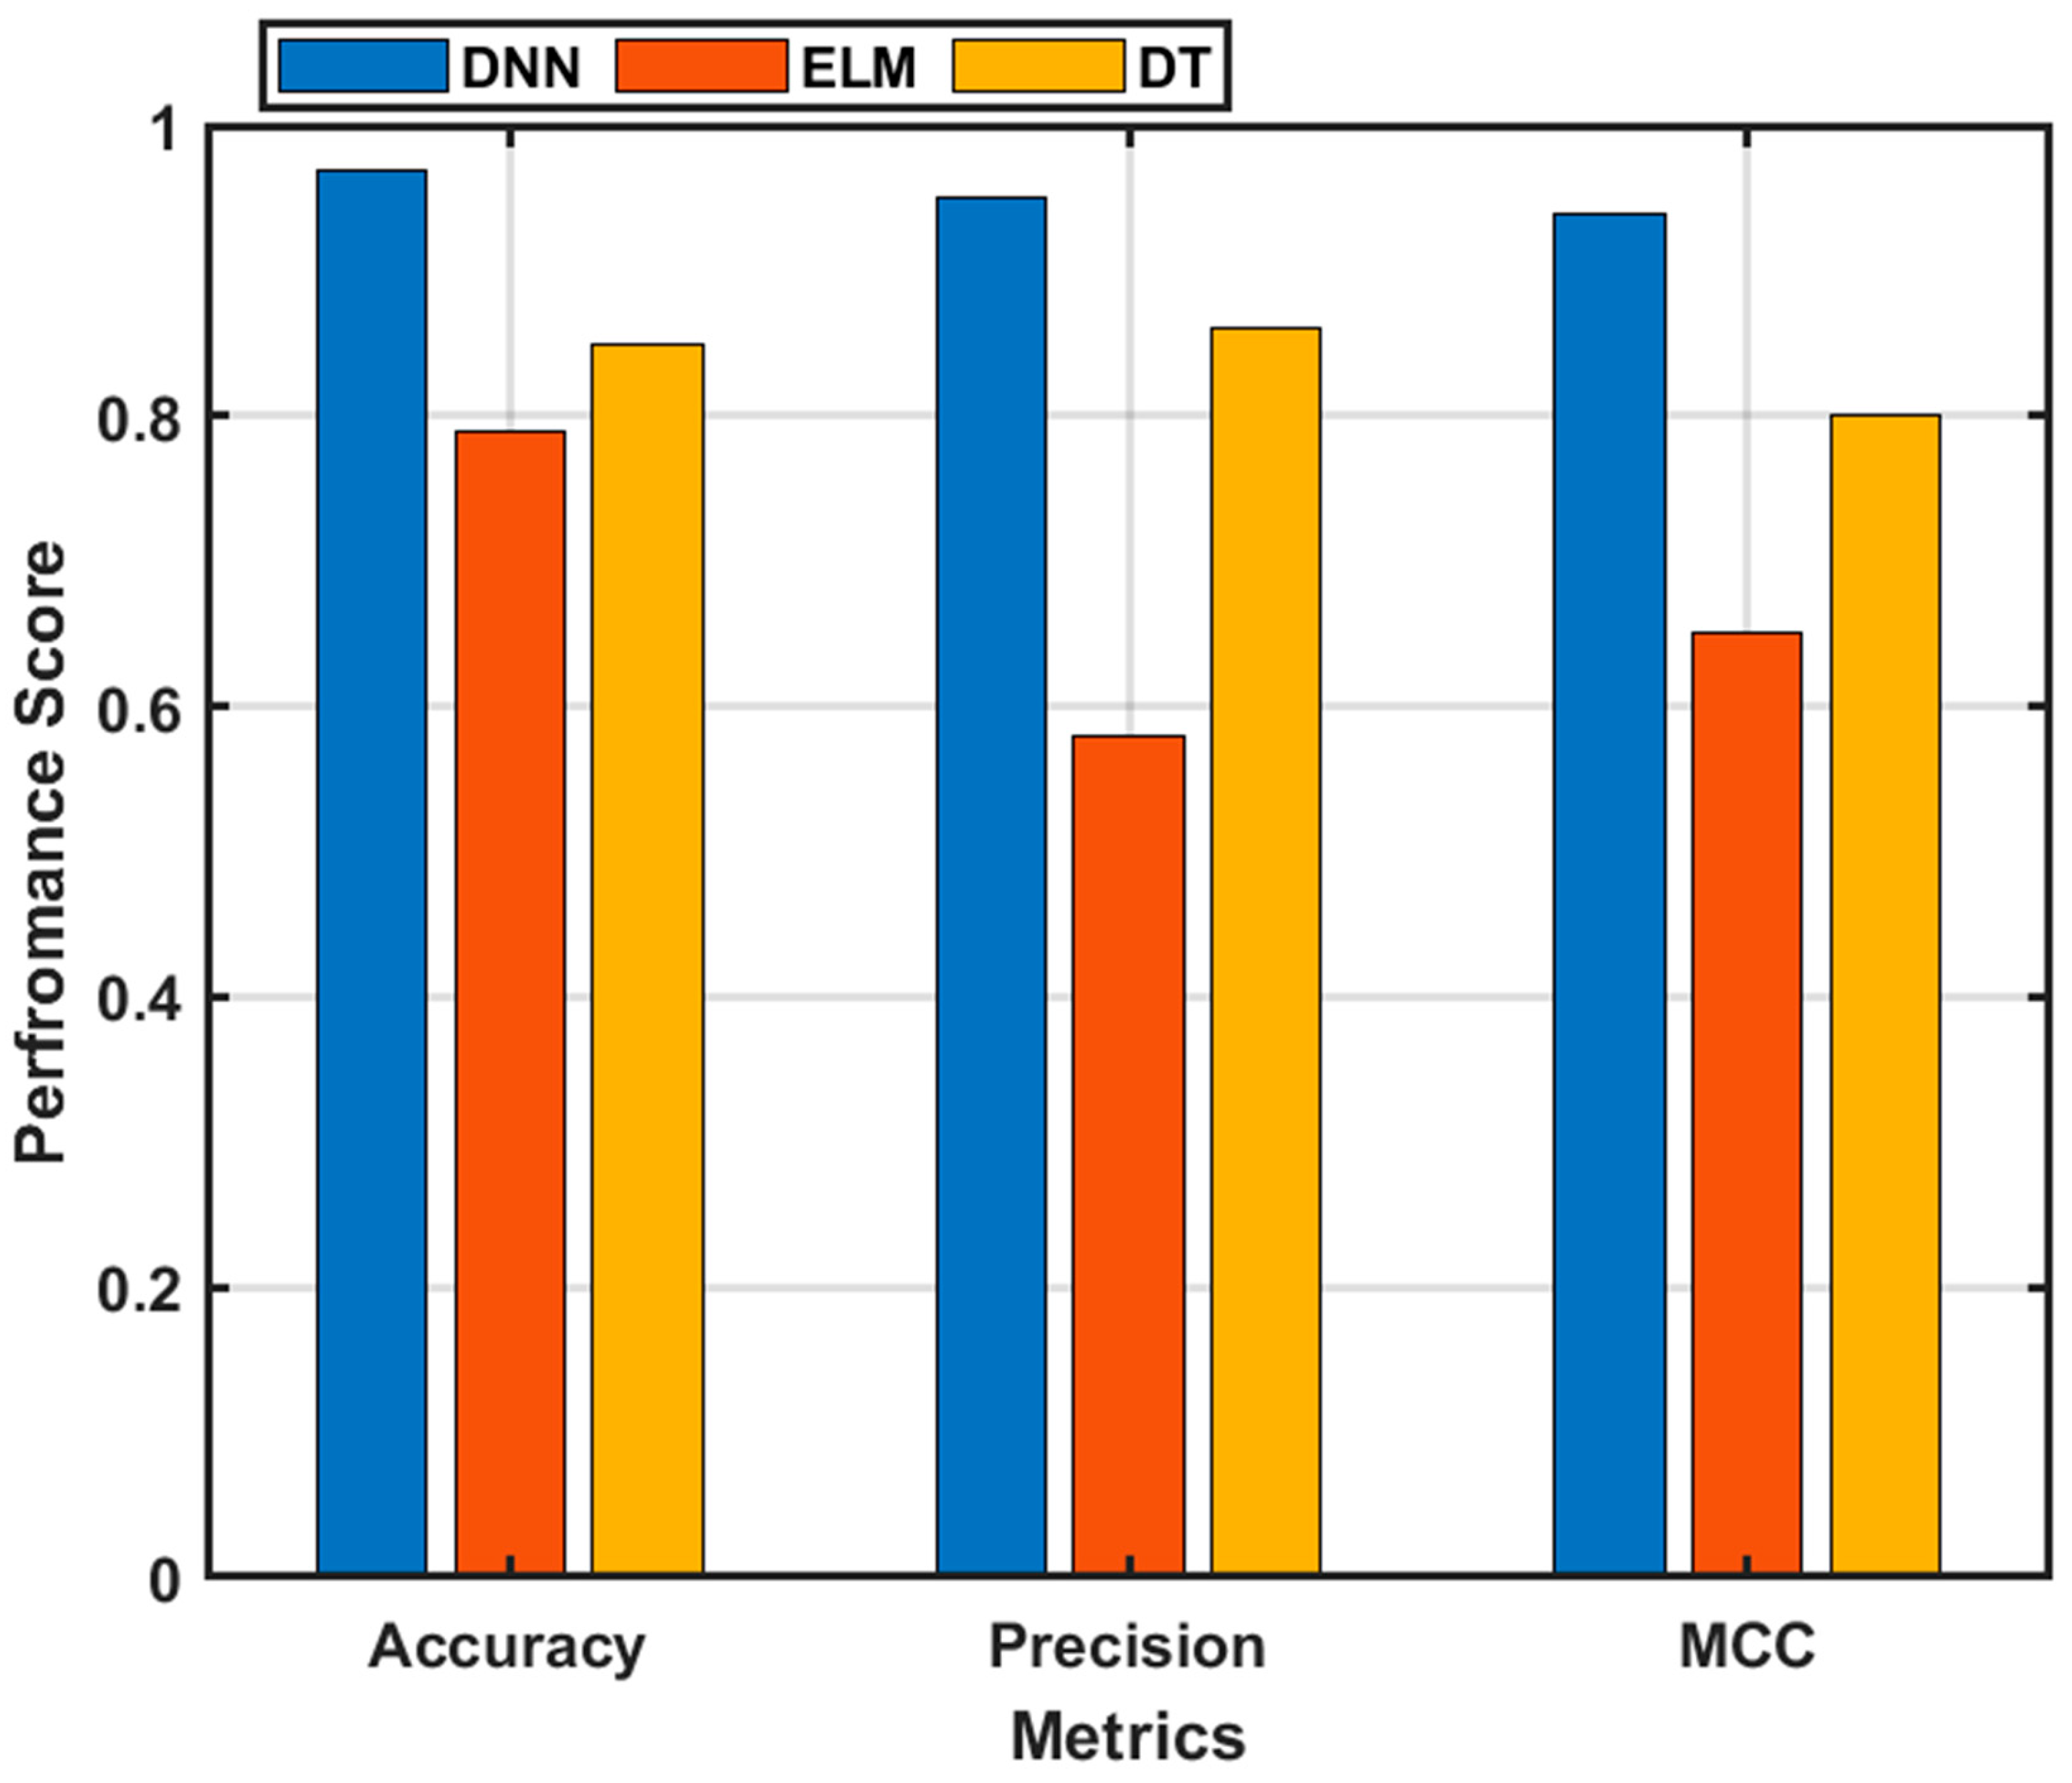
7.2. Machine Learning Prediction Results

After the comprehensive coordinated dataset was generated using the CACOPF, a machine learning-based local coordination controller was trained to predict the OLTC tap positions, PVSI reactive power setpoints, and DSTATCOM reactive power under varying load levels and PV generation outputs. The deep neural network (DNN) model was developed using the TensorFlow library.

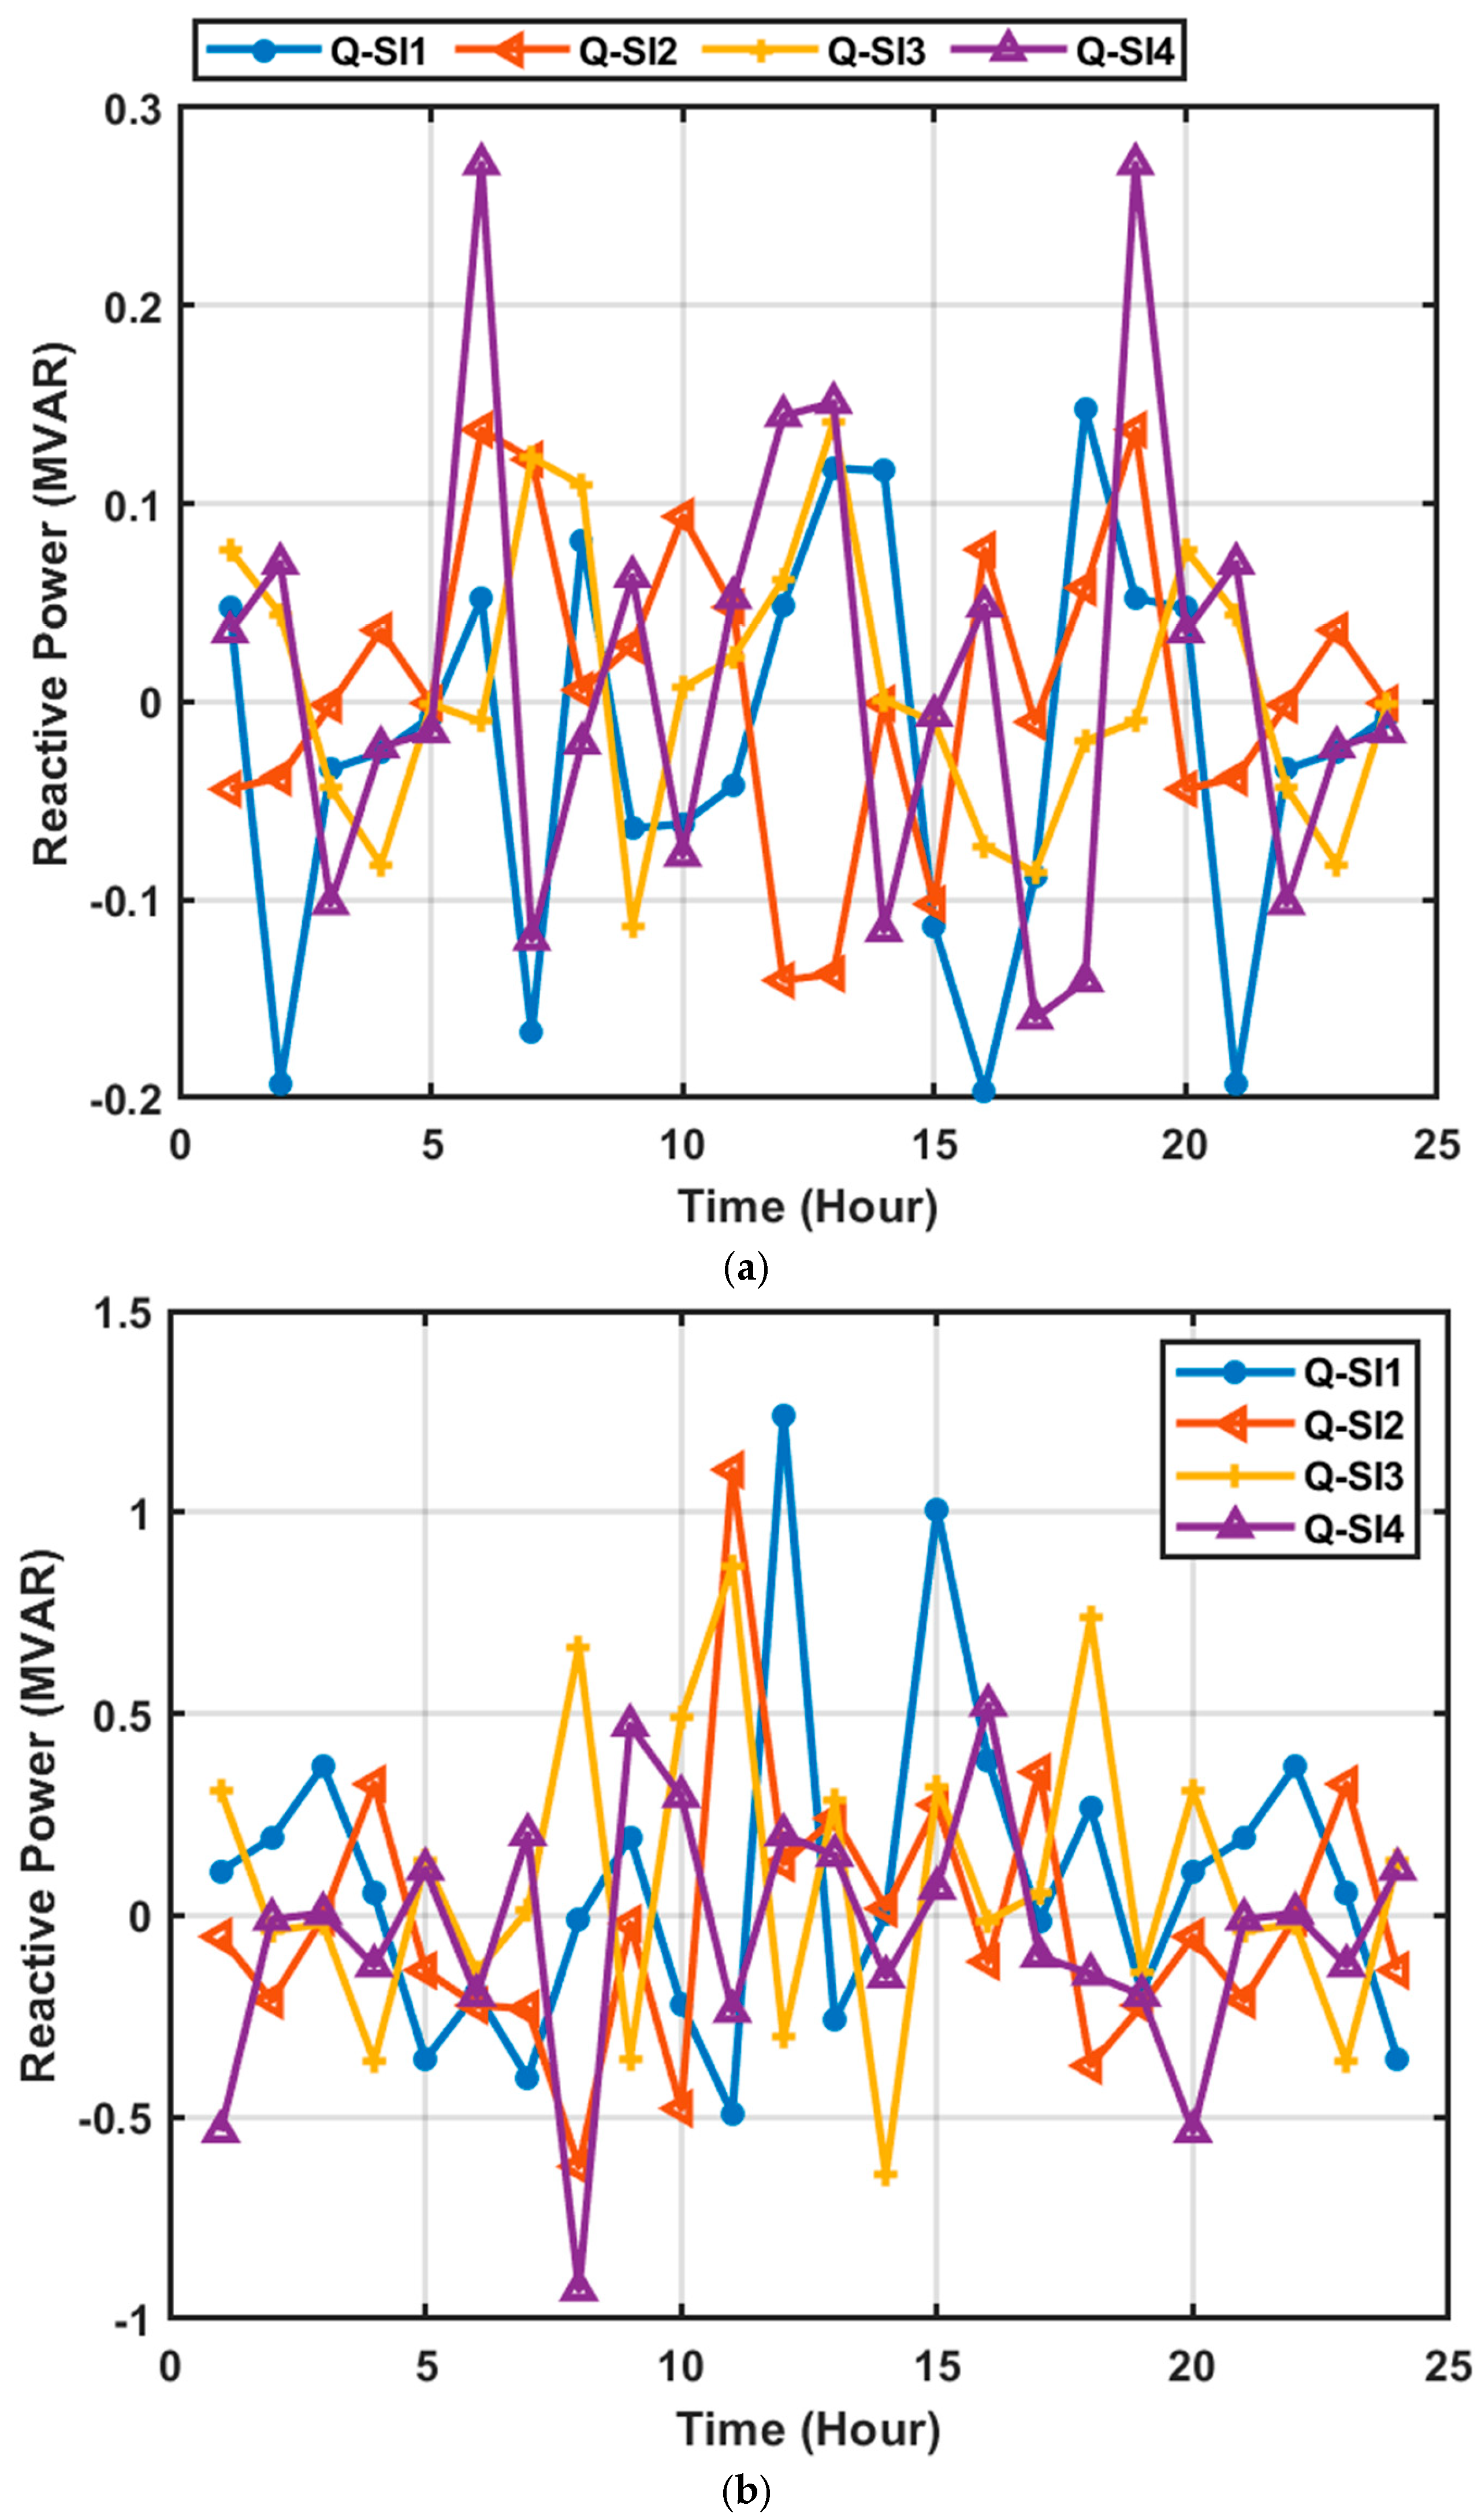
7.2.1. Smart Inverter Reactive Power Prediction

The reactive power of smart inverters for each PV was predicted using the active power, the reactive load demand, and the active power of the PVSI. The results of the evaluation metrics of the different machine learning models used are presented in Table 2.
The results demonstrate that the deep neural network (DNN) outperforms the extreme learning machine (ELM) and decision tree (DT) models in predictive accuracy, as indicated by its lower root mean square error (RMSE) and mean absolute error (MAE) values. This highlights DNN’s stronger capability to learn complex data relationships, making it more effective at predicting optimal reactive power setpoints for voltage regulation. The lower error values confirm that DNN can accurately model the correlation between input variables, such as load and PV output, and the required reactive power output. This makes it well suited for real-time voltage control applications, where fast and precise decisions are critical. Its ability to manage nonlinearities and complex interactions allows it to respond effectively to the dynamic behavior of power systems, enhancing reactive power control and system optimization. In comparison, while ELM and DT are competent models, their limited ability to capture deeper patterns in the data results in lower performance relative to DNN. Thus, DNN emerges as a more dependable solution for managing PVSI reactive power under varying load conditions.

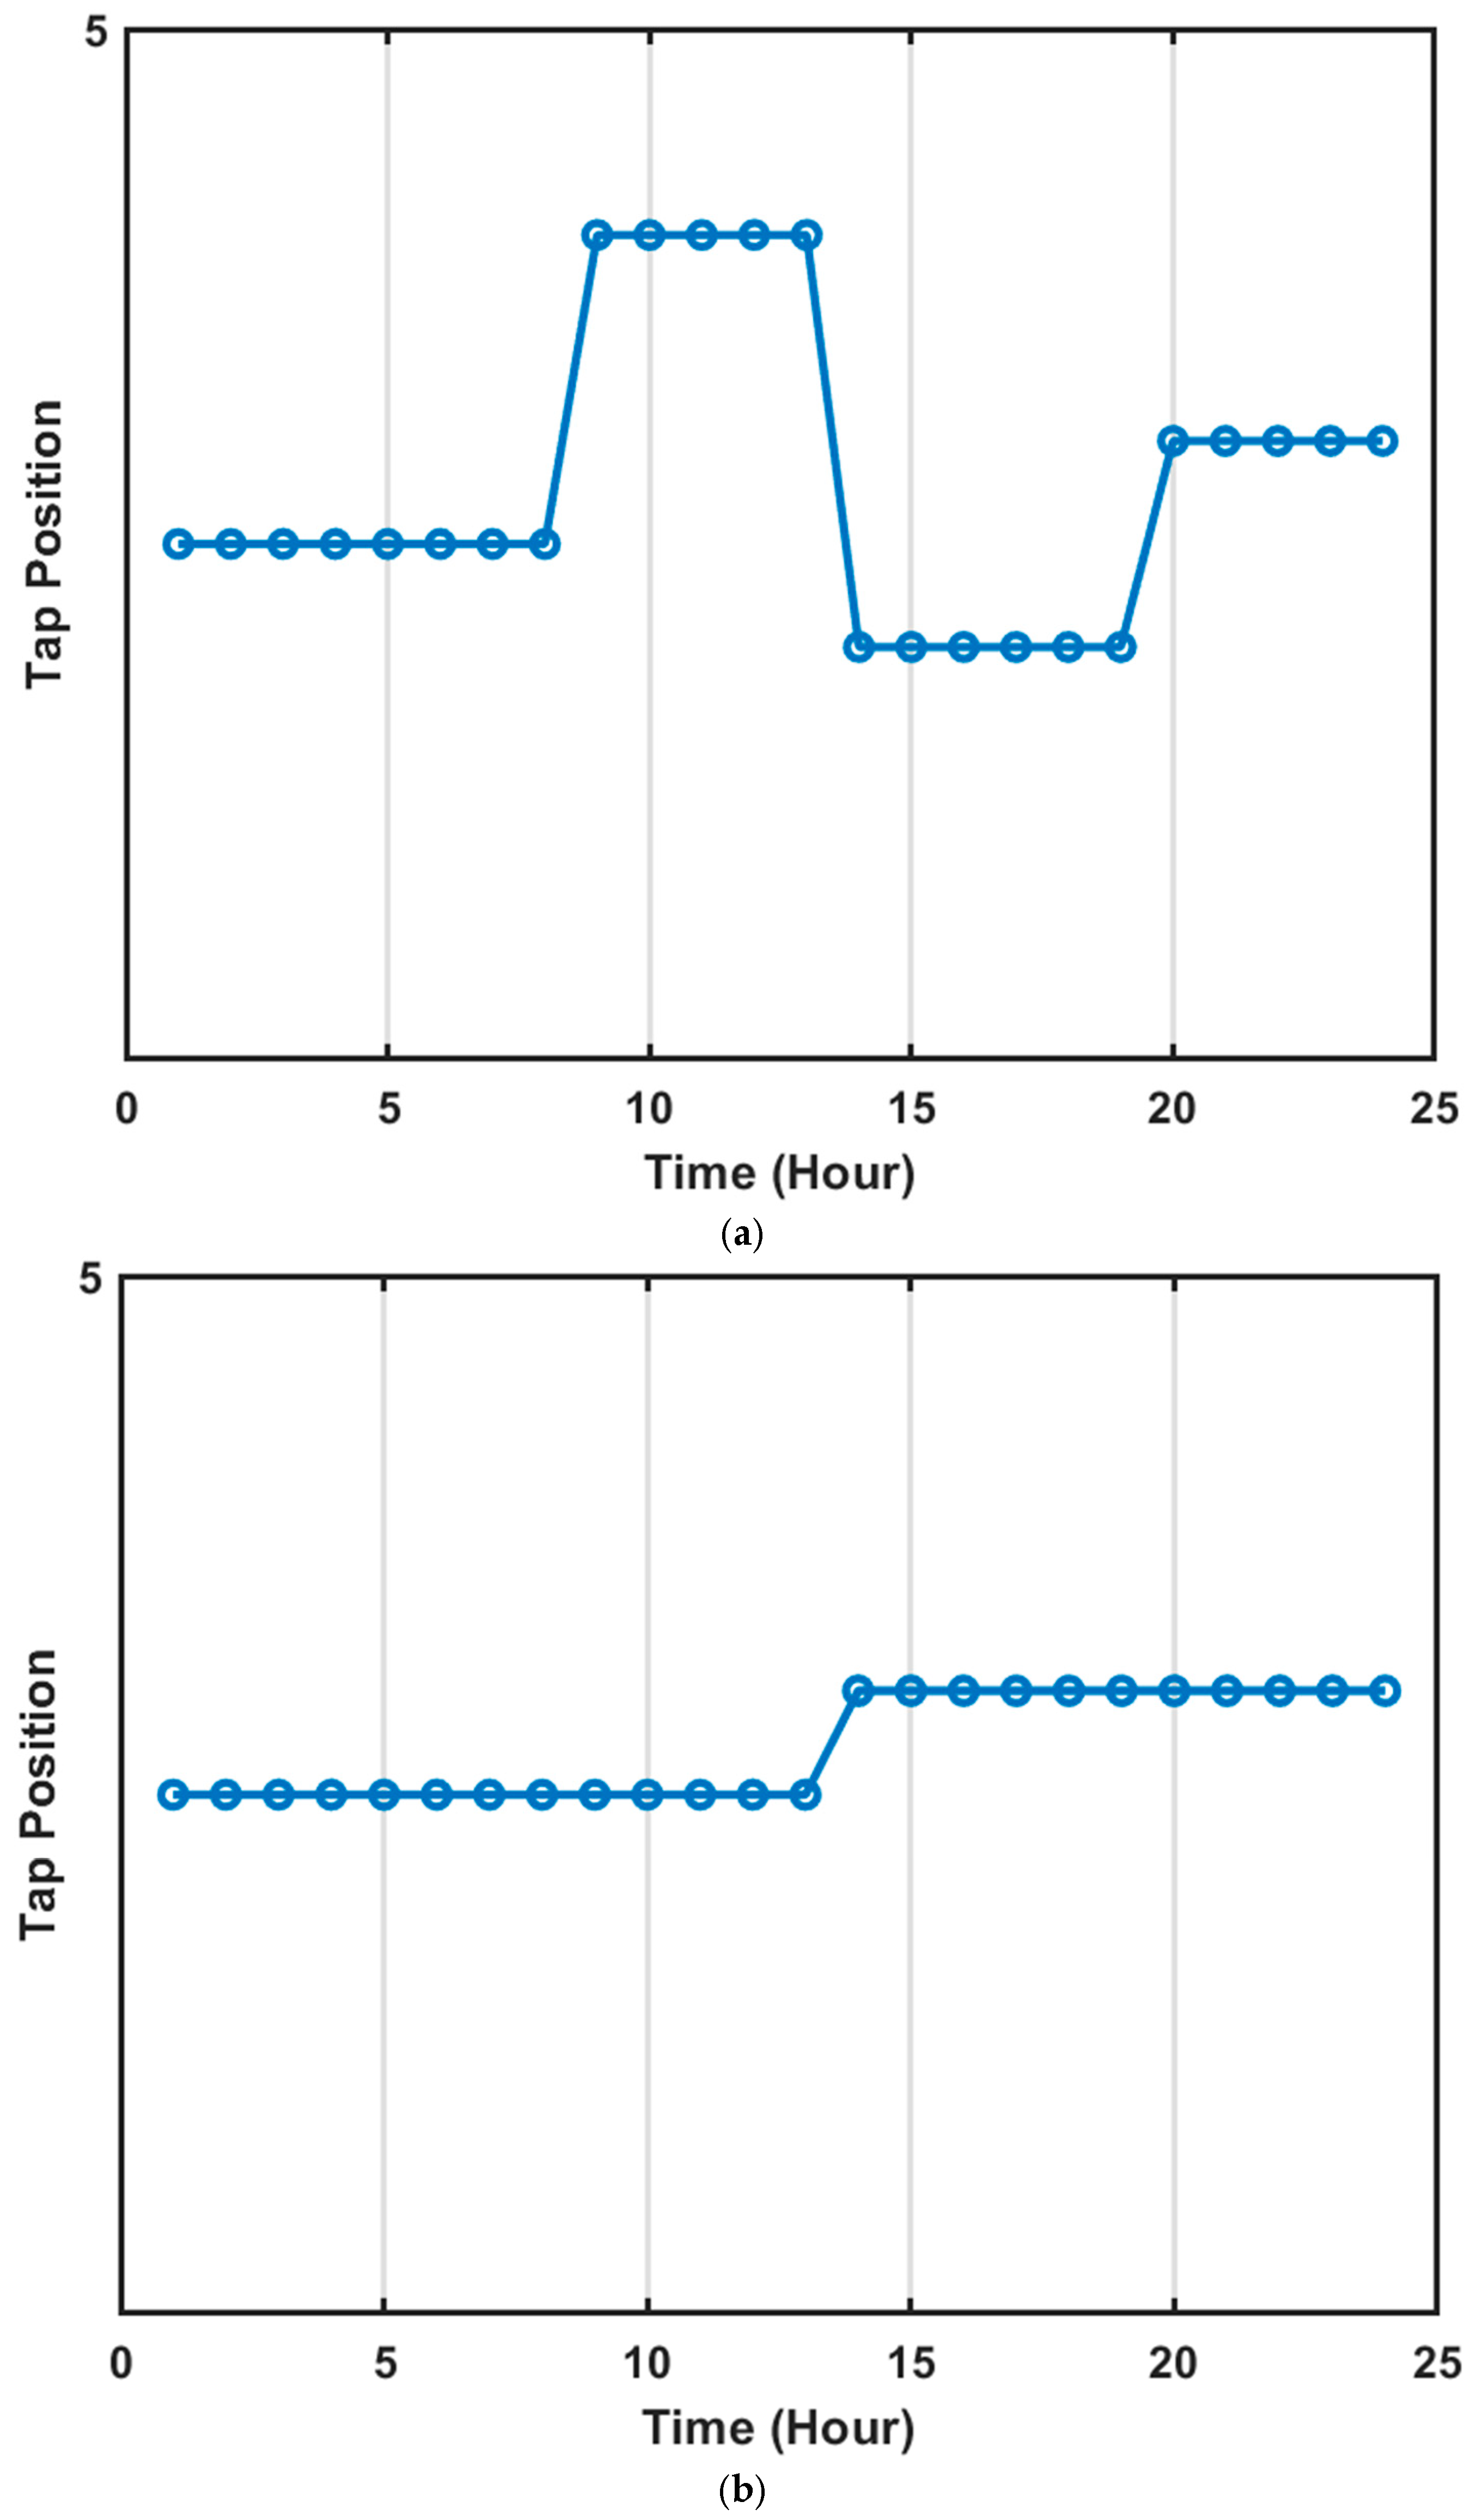
7.2.2. OLTC Taps Position Classification Performance

To assess the machine learning models’ ability to predict the OLTC tap position, active power, demand, and PVSI output power were used as input variables for the prediction models. Figure 8 presents the evaluation results for the different machine learning models tested. The findings show that the deep neural network (DNN) outperforms both the extreme learning machine (ELM) and the decision tree (DT) models in accurately predicting the OLTC tap position for reliable voltage control. The assessment uses the Matthews Correlation Coefficient (MCC), where the DNN achieves the highest scores among the models. The MCC is a robust metric for evaluating classification performance, particularly when dealing with imbalanced data, as it considers true and false positives and negatives, providing a more balanced measure of accuracy. Because accurate tap position prediction is critical for stable voltage regulation, higher MCC values mean the DNN handles class imbalance better and delivers more dependable predictions. The DNN’s superior performance suggests it effectively captures the complex, nonlinear patterns between input variables and the OLTC tap setting. By better managing data imbalance, the DNN supports more precise tap changer control, which is essential for voltage stability and optimizing system performance in real-time applications.

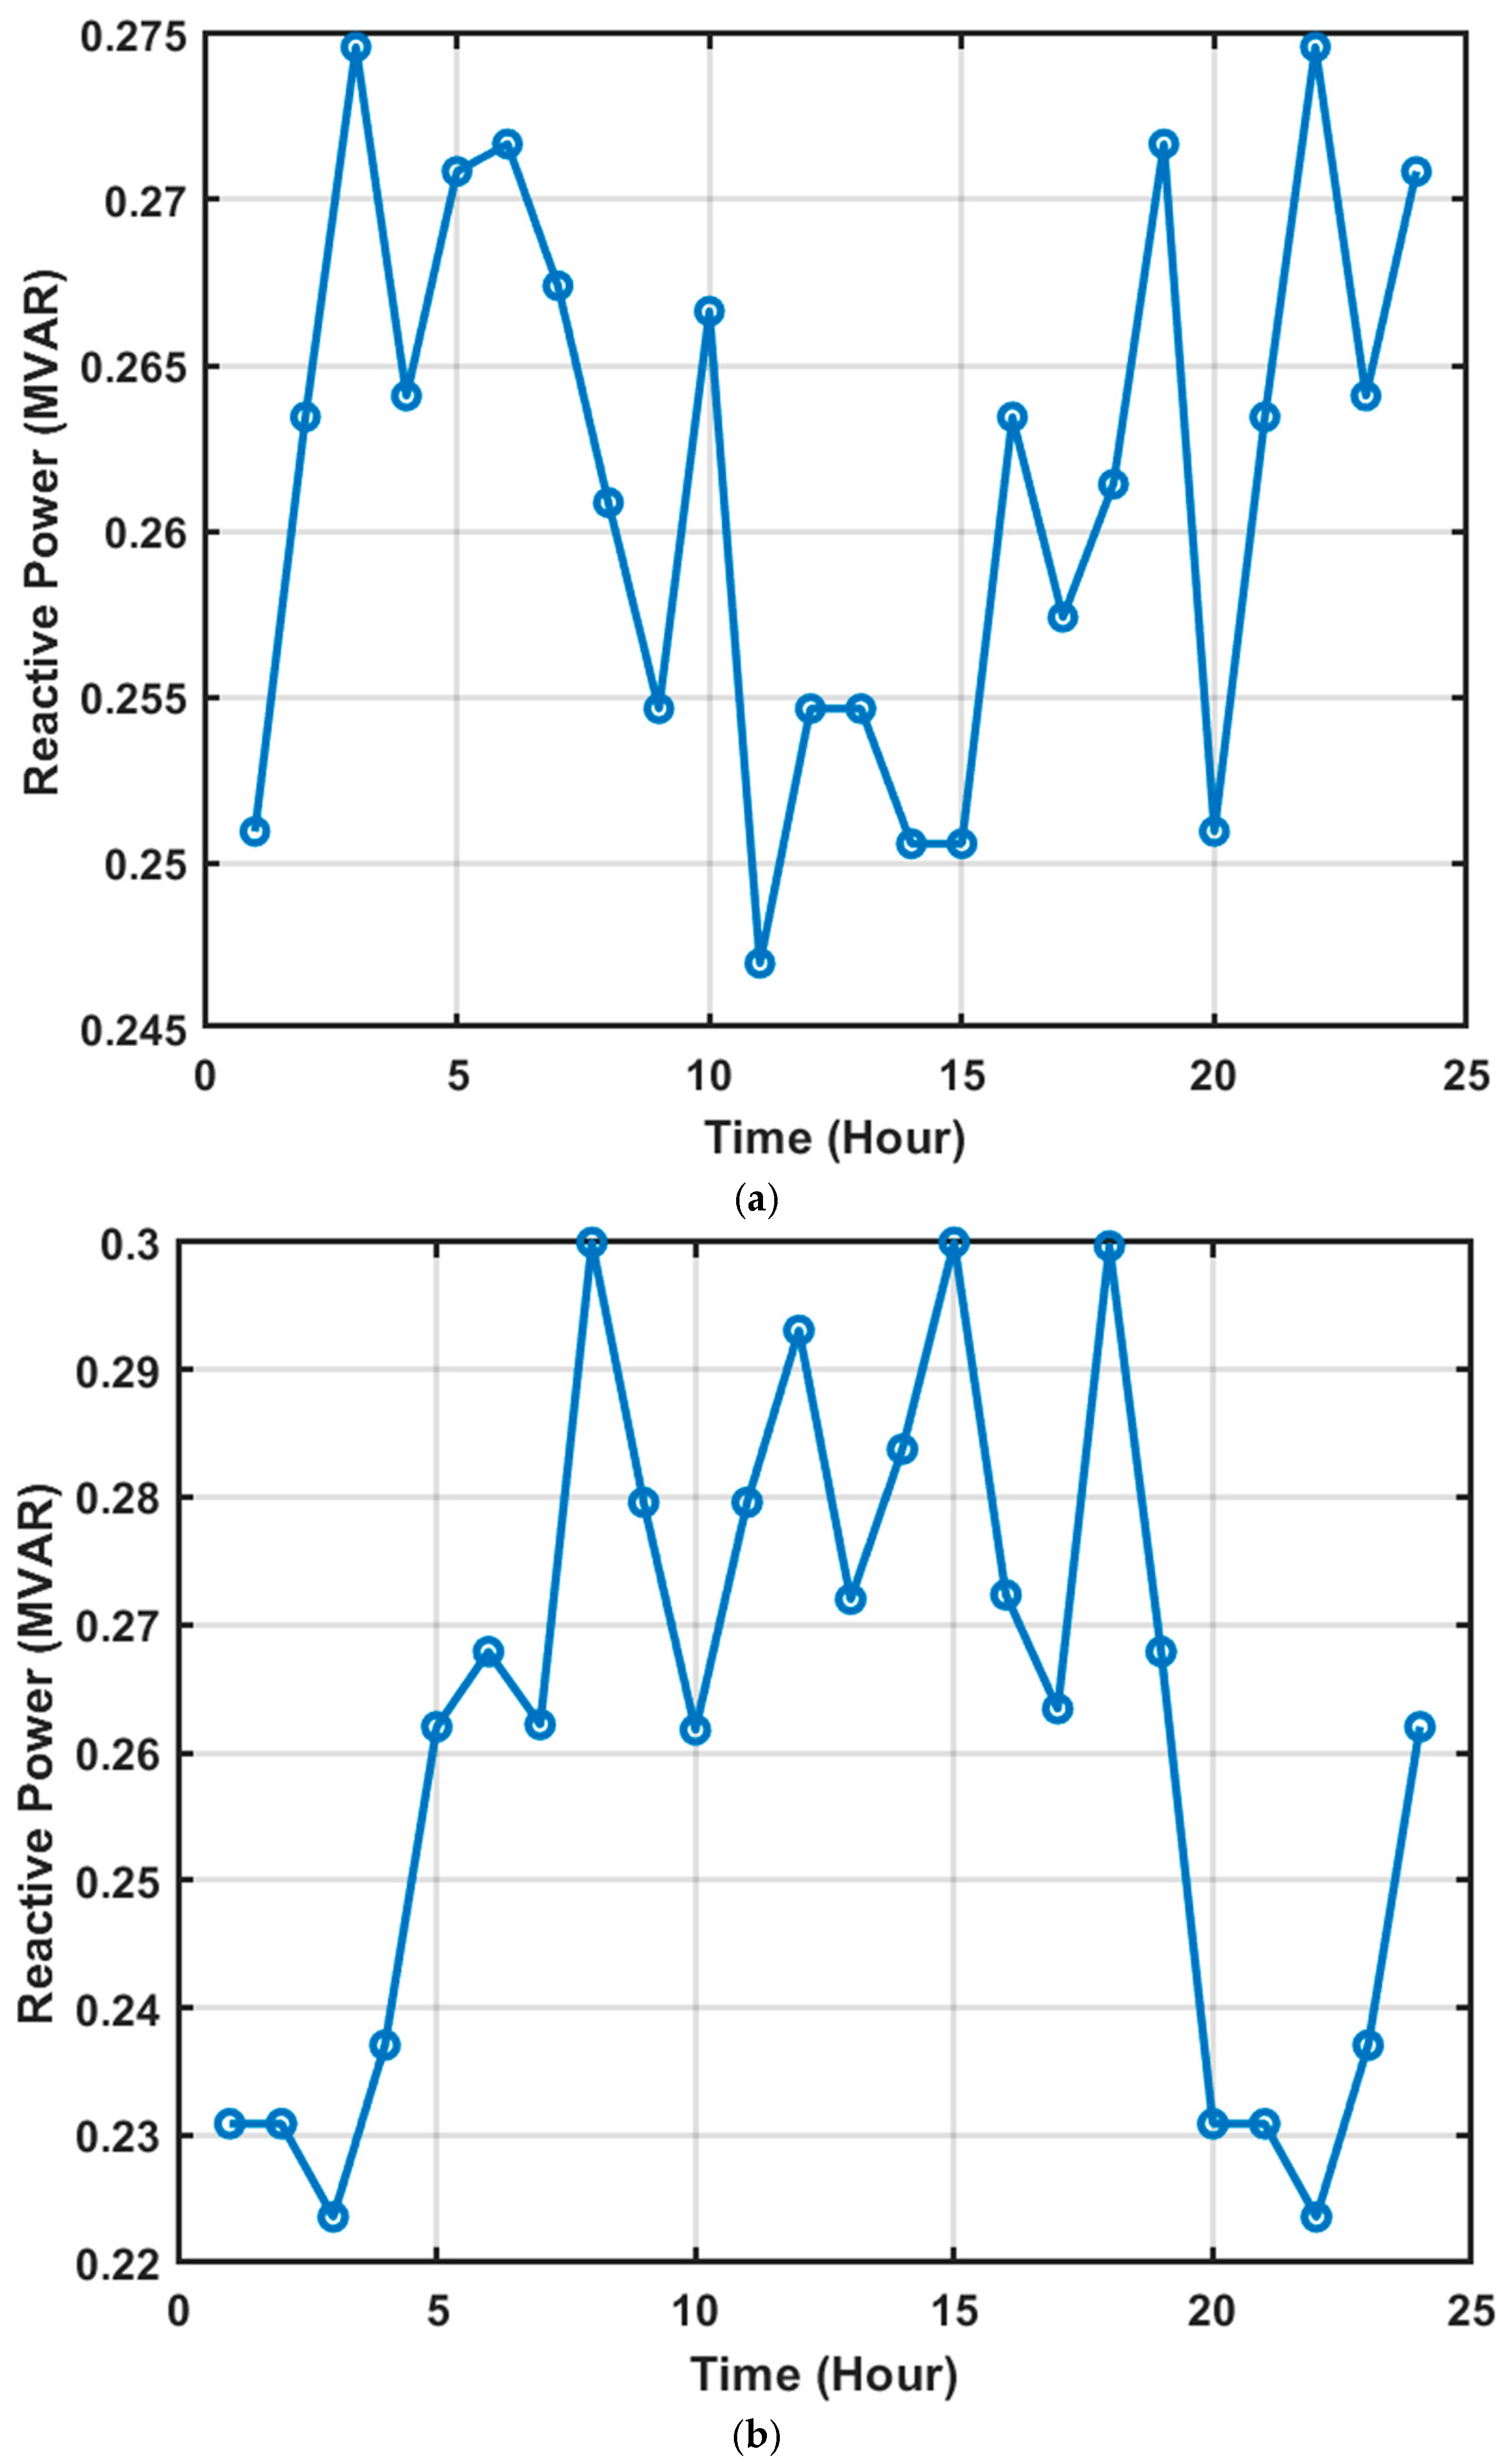
7.2.3. DSTATCOM Reactive Power Prediction Performance

The results in Table 3 illustrate how the machine learning models perform in predicting the DSTATCOM’s reactive power output under varying PV generation and load conditions. Among the models, the deep neural network (DNN) achieves the best performance, as shown by its lower root mean square error (RMSE) and mean absolute error (MAE) compared to the extreme learning machine (ELM) and decision tree models. The RMSE and MAE are essential indicators of prediction accuracy, and lower values reflect more reliable forecasts of the DSTATCOM’s reactive power. The DNN’s superior results suggest it can effectively capture and adapt to the complex, dynamic nature of the power system, accounting for changing loads, generation levels, and network configurations. This capability is vital for the reliable operation of reactive power devices like DSTATCOMs, which need to respond quickly to maintain voltage stability and support overall grid performance. The DNN’s strong prediction accuracy demonstrates its practical value for real-world voltage regulation and power quality improvement in modern power systems.

7.3. Testing of the DNN-Based Controller

To demonstrate the advantages of the DNN-based controller, it was tested under new, unseen PV generation and load scenarios to predict the setpoints for the PVSI, the DSTATCOM’s reactive power, and the OLTC tap position. The resulting voltage profiles and computation times were then compared to those produced by the optimizer under the same conditions. Table 4 presents the network’s average voltage profile and simulation time for a 24-timestep variation in PV output and load demand. The results indicate that the DNN controller is better suited for real-time use, achieving a quick response time of just 2.32 s for the 24 timesteps. This shows that the DNN controller can reliably coordinate the PVSI, DSTATCOM, and OLTC setpoints in real time even with uncertainties in PV generation and load fluctuations.

8. Conclusions

In this paper, we developed an ML-based intelligent controller for the coordination control of PV energy smart inverters integrated with DSTATCOMs and OLTC, considering the uncertainties in PV output and load demand. The proposed approach begins by performing a centralized AC optimal power flow (CACOPF) analysis to determine the coordination setpoints for the smart inverters, DSTATCOMs, and OLTCs under various loading and power output conditions. In addition, ML-based control methods are trained as local controllers to determine the optimal reactive power of the smart inverters, DSTATCOMs, and tap position of the OLTCs. The simulation was tested under two different scenarios: Scenario 1, when the Volt–VAR of the smart inverter was not optimally controlled, and Scenario 2, when it was optimally controlled by a controller embedded in the CACOPF. The results from the study underscore the importance of optimally coordinating various grid devices, such as the OLTC, smart inverters, and DSTATCOM, for maintaining voltage stability in a power distribution system. The comparison between Scenario 1 and Scenario 2 demonstrates that optimally controlling and coordinating Volt–VAR with other voltage-regulating devices improves its operational efficiency. Moreover, the frequency of OLTC tap switching is reduced in Scenario 2 when coordinated with the reactive power control from the smart inverter and DSTATCOM. This reduction in switching frequency suggests a more stable voltage profile, with less mechanical stress on the OLTC, which can improve its operational lifespan and reduce maintenance needs. The findings of this research also established that the optimal coordination of PVSI with other voltage-regulating devices allows the effective usage of PV smart inverters in distribution networks. Furthermore, the use of a DNN-based controller reduces computational inefficiency in performing optimal power flow multiple times to determine the optimal setpoints of the PVSIs, OLTC, and DSTATCOM. In addition, the DNN-based controller approach allows system operators to take predictive actions rather than reactive ones, which delay responses under the uncertainty of loading and PV power generation, can cause voltage violations in the network, and lead to equipment damage. The DNN-based controller results in predicting the optimal setpoints for the reactive power of the PV smart inverter, tap position of the OLTC, and reactive power of the DSTATCOM, showing that the DNN-based controller excels in predicting the setpoints for the coordination of reactive power for smart inverters, DSTATCOMs, and OLTCs, outperforming ELM and DT models. The DNN-based local coordination control approach mirrors the CACOPF but does not require repeated execution of OPF. The adoption of this method in the optimal coordination of PV smart inverters with OLTCs and DSTATCOMs will enhance voltage stability, reduce operational costs, and improve the longevity of grid equipment, making the system more resilient to load and generation variations.

Author Contributions

Conceptualization, T.D.M. and A.N.H.; Methodology, T.D.M., A.N.H., O.J.F. and T.S.; Software, T.D.M.; Validation, T.D.M., A.N.H., O.J.F. and T.S. Formal Analysis, T.D.M., A.N.H., O.J.F. and T.S.; Investigation, T.D.M., A.N.H., O.J.F. and T.S.; Writing T.D.M.; Writing—Review and Editing, T.D.M., A.N.H., O.J.F. and T.S. Visualization, T.D.M.; Supervision, A.N.H., O.J.F. and T.S. All authors have read and agreed to the published version of the manuscript.

Funding

This research received no external funding.

Data Availability Statement

The data used for this research are available upon request from the corresponding author.

Conflicts of Interest

There are no conflicts of interest among the authors regarding the submission of this manuscript.

References

  1. Hossain, T.; Hossen, Z.; Badal, F.R.; Islam, R.; Hasan, M.; Ali, F.; Tasneem, Z. Next generation power inverter for grid resilience: Technology review. Helicon 2024, 10, 2–40. [Google Scholar] [CrossRef] [PubMed]
  2. Nadeem, T.B.; Siddiqui, M.; Khalid, M.; Asif, M. Distributed energy systems: A review of classification, technologies, applications, and policies. Energy Strategy Rev. 2023, 48, 101096. [Google Scholar] [CrossRef]
  3. Djalab, A.; Djalab, Z.; El Amomum, A.; Tina, G.M.; Motahhir, S.; Laouid, A.A. A comprehensive review of floating photovoltaic systems: Tech advances, marine environmental influences on offshore PV systems, and economic feasibility analysis. Sol. Energy 2024, 277, 112711. [Google Scholar] [CrossRef]
  4. Saxena, V.; Manna, S.; Rajput, S.K.; Kumar, P.; Sharma, B.; Alsharif, M.H.; Kim, M.K. Navigating the complexities of distributed generation: Integration, challenges, and solutions. Energy Rep. 2024, 12, 3302–3322. [Google Scholar] [CrossRef]
  5. Twaisan, K.; Barışçı, N. Integrated distributed energy resources (DER) and microgrids: Modeling and optimization of DERs. Electronics 2022, 11, 2816. [Google Scholar] [CrossRef]
  6. Ahmad, T.; Madonski, R.; Zhang, D.; Huang, C.; Mujeeb, A. Data-driven probabilistic machine learning in sustainable smart energy/smart energy systems: Key developments, challenges, and future research opportunities in the context of smart grid paradigm. Renew. Sustain. Energy Rev. 2022, 160, 112128. [Google Scholar] [CrossRef]
  7. Iweh, C.D.; Gyamfi, S.; Tanyi, E.; Effah-Donyina, E. Distributed generation and renewable energy integration into the grid: Prerequisites, push factors, practical options, issues and merits. Energies 2021, 14, 5375. [Google Scholar] [CrossRef]
  8. Jose, J.; Kowli, A. Optimal augmentation of distribution networks for improved reliability. IEEE Syst. J. 2022, 16, 1965–1973. [Google Scholar] [CrossRef]
  9. Liu, Y.; Li, J.; Wu, L. Coordinated optimal network reconfiguration and voltage regulator/DER control for unbalanced distribution systems. IEEE Trans. Smart Grid 2019, 10, 2912–2922. [Google Scholar] [CrossRef]
  10. Wang, S.; Chen, S.; Ge, L.; Wu, L. Distributed generation hosting capacity evaluation for distribution systems considering the robust optimal operation of OLTC and SVC. IEEE Trans. Sustain. Energy 2016, 7, 1111–1123. [Google Scholar] [CrossRef]
  11. Escalera, A.; Prodanovi, M.; Castronuovo, E.D.; RoldanPerez, J. Contribution of active management technologies to the reliability of power distribution networks. Appl. Energy 2020, 267, 114919. [Google Scholar] [CrossRef]
  12. IEEE Standard 1547-2018 (Revision of IEEE Standard 1547-2003); IEEE Standard for Interconnection and Interoperability of Distributed Energy Resources with Associated Electric Power Systems Interfaces. IEEE: Piscataway, NJ, USA, 2018.
  13. Wick, S.; Gonzalez, C.; Driesen, J. Combined central and local active and reactive power control of PV inverters. IEEE Trans. Sustain. Energy 2014, 5, 776–784. [Google Scholar]
  14. Li, P.; Zhang, C.; Wu, Z.; Xu, Y.; Hu, M.; Dong, Z. Distributed adaptive robust Voltage/VAR control with network partition in active distribution networks. IEEE Trans. Smart Grid 2020, 11, 2245–2256. [Google Scholar] [CrossRef]
  15. Ren, H.; Jha, R.R.; Dubey, A.; Schulz, N.N. Extremum-seeking adaptive-droop for model-free and localized Volt-VAR optimization. IEEE Trans. Power Syst. 2022, 37, 179–190. [Google Scholar] [CrossRef]
  16. Ali, A.; Mahmoud, K.; Lehtonen, M. Maximizing hosting capacity of uncertain photovoltaics by coordinated management of OLTC, Var sources and stochastic EVs. Int. J. Elect. Power Energy Syst. 2021, 127, 106627. [Google Scholar] [CrossRef]
  17. Guo, Y.; Baker, K.; Dall’Anese, E.; Hu, Z.; Summers, T.H. Data-based distributionally robust stochastic optimal power flow—Part II: Case studies. IEEE Trans. Power Syst. 2019, 34, 1493–1503. [Google Scholar] [CrossRef]
  18. Karagiannopoulos, S.; Aristidou, P.; Hug, G. Data-driven local control design for active distribution grids using off-line optimal power flow and machine learning techniques. IEEE Trans. Smart Grid 2019, 10, 6461–6471. [Google Scholar] [CrossRef]
  19. Jalali, M.; Kekatos, V.; Gatsis, N.; Deka, D. Designing reactive power control rules for smart inverters using support vector machines. IEEE Trans. Smart Grid 2020, 11, 1759–1770. [Google Scholar] [CrossRef]
  20. Sun, X.; Qiu, J.; Tao, Y.; Ma, Y.; Zhao, J. A multi-mode data-driven Volt/Var control strategy with conservation voltage reduction in active distribution networks. IEEE Trans. Sustain. Energy 2022, 13, 1073–1085. [Google Scholar] [CrossRef]
  21. Yu, L.; Zhang, L.; Meng, G.; Zhang, F.; Liu, W. Research on multi-objective reactive power optimization of power grid with high proportion of new energy. IEEE Access 2022, 10, 116443–116452. [Google Scholar]
  22. Ai, M.; Du, Z.; Pan, Z.; Li, G. The optimization of reactive power for distribution network with PV generation based on NSGA-III. CPSS Trans. Power Electron. Appl. 2021, 6, 193–200. [Google Scholar] [CrossRef]
  23. Li, C.; Lu, Q.; He, H.; Zhao, J.; Jiang, Y.; Xu, B.; Yan, Y.; Bian, J.; Du, W. Reactive power optimization of active distribution networks based on simulated annealing algorithm. In Proceedings of the 2023 IEEE 7th Information Technology and Mechatronics Engineering Conference (ITOEC), Chongqing, China, 15–17 September 2023; pp. 1022–1026. [Google Scholar]
  24. Ilyushin, P.; Volnyi, V.; Suslov, K.; Filippov, S. State-of-the-art literature review of power flow control methods for low-voltage AC and AC-DC microgrids. Energies 2023, 16, 3153. [Google Scholar] [CrossRef]
  25. Rehman, N.; Mufti, M.U.D.; Gupta, N. Power flow analysis in a distribution system penetrated with renewable energy sources: A review. Int. J. Ambient Energy 2024, 45, 2305701. [Google Scholar] [CrossRef]
  26. Nair, A.S.; Abhyankar, S.; Peles, S.; Ranganathan, P. Computational and numerical analysis of AC optimal power flow formulations on large-scale power grids. Electr. Power Syst. Res. 2022, 202, 107594. [Google Scholar] [CrossRef]
  27. Tshivhase, N.; Hasan, A.N.; Shongwe, T. Proposed Fuzzy Logic System for Voltage Regulation and Power Factor Improvement in Power Systems with High Infiltration of Distributed Generation. Energies 2020, 13, 4241. [Google Scholar] [CrossRef]
  28. Makanju, T.D.; Shongwe, T.; Famoriji, O.J. Machine Learning Approaches for Power System Parameters Prediction: A Systematic Review. IEEE Access 2024, 12, 66646–66679. [Google Scholar] [CrossRef]
  29. Powers, D.M.W. Evaluation: From precision, recall and F-measure to ROC, informedness, markedness and correlation. arXiv 2020, arXiv:2010.16061. [Google Scholar]
  30. Luque, A.; Carrasco, A.; Martín, A.; de las Hera, A. The impact of class imbalance in classification performance metrics based on the binary confusion matrix. Pattern Recognit. 2019, 91, 216–231. [Google Scholar] [CrossRef]
  31. Makanju, T.D.; Famoriji, O.J.; Hasan, A.N.; Shongwe, T. Machine learning approaches for identifying and predicting voltage conditions in power system networks using network topology behavior input formulation. Sci. Afr. 2024, 26, e02493. [Google Scholar] [CrossRef]
Figure 1. Proposed framework of the coordination and control approach.
Energies 18 03481 g001
Figure 2. Step-by-step approach of the machine learning models.
Energies 18 03481 g002
Figure 3. Topology of the modified IEEE bus 33 network.
Energies 18 03481 g003
Figure 4. Voltage profile of all buses: (a) Scenario 1, (b) Scenario 2.
Energies 18 03481 g004aEnergies 18 03481 g004b
Figure 5. Reactive power imported and exported by the PVSIs: (a) Scenario 1, (b) Scenario 2.
Energies 18 03481 g005
Figure 6. Reactive power DSTATCOM: (a) Scenario 1, (b) Scenario 2.
Energies 18 03481 g006
Figure 7. Tap position: (a) Scenario 1, (b) Scenario 2.
Energies 18 03481 g007
Figure 8. Comparison of the tap position classification performance of the machine learning.
Energies 18 03481 g008
Table 1. Sensitivity analysis.
ScenariosMaximum Active Power (MW)Average Voltage Deviation (PU)
1130.2390.0425
2131.49980.0340
Table 2. Performance of ML models in predicting the PV reactive power of the IEEE networks.
PVSIELMDNNDT
RMSEMAERMSEMAERMSEMAE
Q10.1060.08700.05430.04550.09330.0914
Q20.09850.08300.06830.04570.08980.0832
Q30.07890.09700.06750.05510.06680.0543
Q40.10240.23050.04350.05720.09320.0891
Table 3. Performance of the model in forecasting the optimal reactive power of STATCOM in IEEE bus 33 network.
ELMDNNDT
RMSEMAERMSEMAERMSEMAE
0.7860.9070.02670.02290.0340.0498
Table 4. Comparison between the DNN controller and simulation time.
TechniquesAverage Voltage Deviation (PU)Simulation Time (Seconds)
Optimizer0.0392108.45
DNN Controller0.04132.32
Disclaimer/Publisher’s Note: The statements, opinions and data contained in all publications are solely those of the individual author(s) and contributor(s) and not of MDPI and/or the editor(s). MDPI and/or the editor(s) disclaim responsibility for any injury to people or property resulting from any ideas, methods, instructions or products referred to in the content.

