Abstract
Photovoltaic thermal (PVT) hybrid systems offer a promising approach to maximizing solar energy utilization by combining electricity generation with thermal energy recovery. This study presents an experimental evaluation of a commercially available PVT panel, focusing on its thermal performance under varying inlet temperatures and flow rates. The work addresses a gap in the literature regarding the real-world behavior of integrated systems, particularly in residential settings where space constraints and energy efficiency are crucial. Experimental tests were conducted at three mass flow rates and five inlet water temperatures, demonstrating that lower inlet temperatures and higher flow rates consistently improve thermal efficiency. The best-performing condition was achieved at 0.012 kg/s and 10 °C. These findings deepen our understanding of the panel’s thermal behavior and confirm its suitability for practical applications. The experimental platform developed in this study also enables standardized PVT testing under controlled conditions, supporting consistent evaluation across different settings and contributing to global optimization efforts for hybrid solar technologies.
Keywords:
Photovoltaic thermal (PVT); solar energy; thermal efficiency; electrical performance; heat removal factor; mass flow rate; inlet temperature; hybrid solar systems; energy conversion; thermal losses; solar irradiance; cooling effect; experimental characterization; renewable energy; carbon emissions 1. Introduction
Photovoltaic thermal (PVT) panels produce heat and electricity simultaneously. In photovoltaic (PV) modules, a fraction of the solar radiation is converted into electricity, and the remainder is rejected as heat. PVT panels recover this heat and use it in a functional application [1]; therefore, they are considered cogeneration systems [2]. Figure 1 illustrates the various pathways for harnessing solar energy, distinguishing between systems that generate thermal or electrical output. The diagram emphasizes the PVT system, which integrates thermal and photovoltaic technologies to simultaneously produce heat and electricity, maximizing energy utilization from a single solar input source.
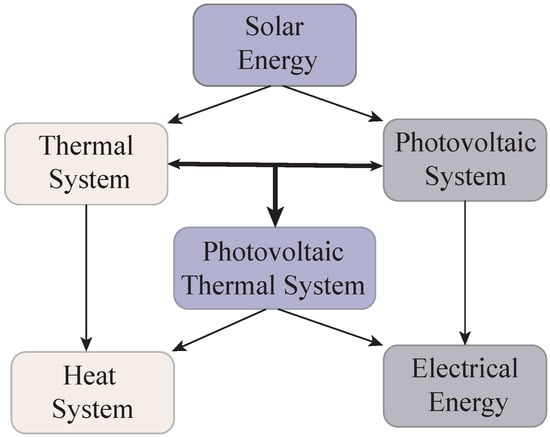
Figure 1.
Hybrid PVT system integrating thermal and electrical solar energy pathways.
Solar energy technologies have evolved to address the growing demand for sustainable thermal and electrical energy in both residential and commercial applications [3,4]. Among the most established solutions are solar collectors, which function as specialized heat exchangers that convert solar radiation into thermal energy [5]. These systems are commonly integrated into buildings for domestic hot water, space heating, and solar-assisted cooling. In most installations, the thermal energy collected is transferred to storage systems via circulation pumps, which are typically governed by control systems that ensure fluid movement occurs only when optimal temperatures are reached.
A widely adopted type of solar collector is the flat plate solar thermal collector (FPSTC). This configuration is particularly effective for low- to medium-temperature applications, such as heating domestic water or melting snow on surfaces where accumulation poses structural or safety concerns. An FPSTC typically consists of a black-coated absorber plate enclosed within an insulated box and covered with one or more transparent layers—usually glass or plastic—to reduce heat loss while maximizing solar absorption. These systems are designed to reach temperatures of up to 80 °C and can maintain high absorptivity even when coated with standard black paint, reflecting as little as 10% of the incident radiation [6,7].
Figure 2 presents the cross-sectional diagram configuration of an FPSTC. At the core is the absorber plate, typically coated with a selective surface that maximizes solar absorptivity in the visible spectrum while minimizing infrared emissivity, thereby reducing radiative heat losses. Above the absorber is a transparent cover that limits convective and conductive heat losses while allowing solar radiation to reach the surface below. Beneath the absorber, riser tubes connected to a header channel allow fluid to circulate and carry away the absorbed heat [8]. Modern collectors incorporate materials with high thermal conductivity to further enhance thermal efficiency, such as pressed aluminum sheets or thick copper bases to which small-bore copper tubes are soldered, facilitating uniform heat distribution [9]. The entire assembly is encased in an insulated housing, often made of aluminum or galvanized steel, to reduce heat dissipation from the sides and bottom. As shown in the figure, this integrated structure enables a robust and efficient thermal capture process for residential and industrial applications.
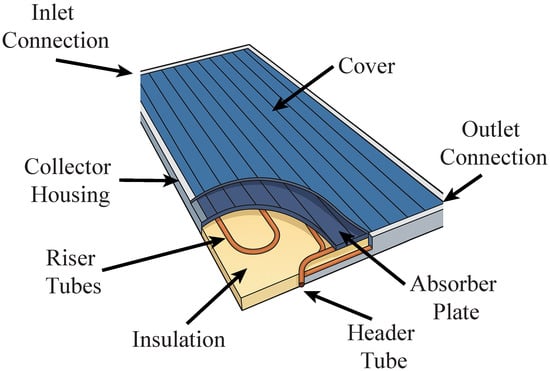
Figure 2.
Cross-sectional view of a flat-plate solar collector, showing key components [10].
This study investigates the thermal performance of a commercial PVT panel, with a focus on its potential to enhance energy efficiency through integrated solar harvesting. While many studies focus on simulations or idealized conditions, there is a lack of standardized experimental methods for evaluating commercial systems. This research addresses that gap by implementing a controlled and instrumented test bench that can be replicated globally. The platform enables consistent testing across varying flow rates and inlet temperatures, allowing for cross-comparisons and providing validated performance indicators, such as the heat removal factor and overall heat loss coefficient. These parameters are essential for optimizing real-world system sizing, particularly in space-constrained residential contexts, and for establishing a reference standard for future experimental validation of commercial PVT systems.
During the last 30 years, significant research on PVT systems has been performed since Kern and Russell introduced the concept of PVT in 1987 [11]. Table 1 summarizes the most relevant characteristics that make PVT systems an attractive solution for energy cogeneration. As highlighted by Hasan and Sumathy [12], these systems are distinguished not only by their ability to produce heat and electricity simultaneously, but also by their high combined efficiency, making them especially valuable in urban environments where rooftop space is a constraint.

Table 1.
Key advantages of PVT systems in energy generation [12].
The paper is structured to provide a comprehensive understanding of the experimental methodology and performance evaluation of the PVT system. Section 2 presents a review of the state of the art, focusing on the thermal and electrical modeling of PVT systems. Section 3 details the experimental setup and instrumentation, including the design of the solar simulator, thermal circuit, and measurement procedures. Section 4 discusses the analysis of thermal, electrical, and overall system efficiency under varying inlet temperatures, irradiance levels, and mass flow rates. Finally, Section 5 concludes with a synthesis of the key findings and highlights their implications for the design and optimization of high-performance hybrid solar energy systems.
2. State of the Art
Table 2 comprehensively summarizes recent research focused on mechanical and electrical energy analysis in PVT systems. The paper [13] presents a systematic review of performance evaluation criteria for PV, solar thermal (ST), and PVT systems. The paper [14] explores the use of machine learning models for predicting the electrical efficiency of PVT systems with high accuracy. The study [15] performs a numerical energy and exergy analysis of PVT systems enhanced with nanofluids, revealing substantial improvements in both thermal and electrical output. The paper [16] applies finite element method (FEM) simulations to evaluate the thermal and electrical performance of a PVT system using carbon nanotube (CNT) nanofluids. Meanwhile, the paper [17] uses multi-criterion decision-making (MCDM) techniques. Each study is categorized based on whether it involves a mechanical analysis (e.g., heat transfer, flow dynamics) and/or focuses on electrical energy performance, offering a broad overview of current trends and innovations in the design and optimization of high-efficiency PVT technologies.
Table 2.
Summary of PVT system research methodologies focused on mechanical and electrical energy analysis. The symbol “X” denotes that the corresponding study includes the respective type of analysis.
Table 3 presents a comprehensive overview of the most cited research contributions to advancing PVT systems. The table highlights key studies focusing on methodologies, such as Fudholi, A. [21], which analyzes the performance parameters of water-based PVT systems under various conditions. In contrast, Al-Waeli, A.H.A. [20] investigates the combined effects of nanofluids and phase change materials on PVT efficiency. The bar graph in Figure 3 visualizes the citation counts of the top 10 cited articles, emphasizing the academic impact and recognition these studies have garnered within the energy research community.
Table 3.
Top 10 papers with methodologies.
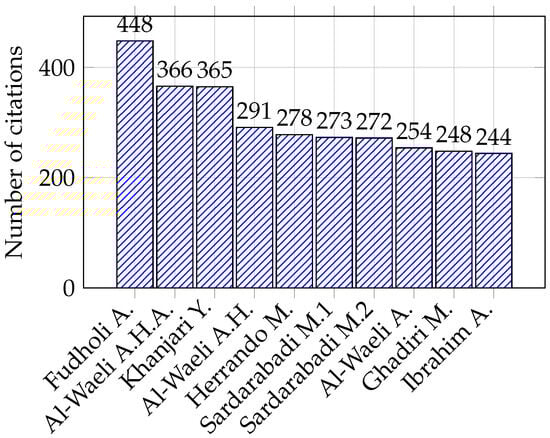
Figure 3.
Number of citations of the top 10 most cited articles.
3. Methodology
3.1. Integrated Thermal and Electrical Performance Modeling of PVT Panels
The balance between the absorbed solar radiation and the thermal losses to the environment fundamentally governs the thermal performance of a solar collector. Under steady-state conditions, this energy exchange is represented by the energy balance Equation (1), quantifying the useful energy gained by the working fluid. The equation incorporates parameters such as the solar irradiance, the collector’s optical properties, and the system’s heat transfer characteristics. Specifically, the useful energy depends on the product of the transmittance–absorptance factor and the incident irradiance, minus the thermal losses determined by the temperature difference between the absorber plate and the ambient environment. The primary variables used in this formulation are summarized in Table 4.
Table 4.
Definition of variables used in the PVT modeling.
The performance of PVT thermal efficiency is defined as the ratio between the useful thermal energy extracted and the total solar energy incident on the collector surface, which is expressed analytically in Equations (2) and (3). The first form incorporates the collector’s optical properties and heat losses. At the same time, the second is more practical for experimental setups, as it relates directly to the temperature difference of the working fluid across the collector. Both expressions are essential for analyzing system performance under varying conditions.
Building upon the previous formulations, the Hottel–Whillier–Bliss (HWB) equation, presented in Equation (4), provides a more refined expression for the useful thermal energy gain by explicitly incorporating the fluid inlet temperature. This model is particularly relevant for practical evaluations where the inlet temperature is more accessible than the average plate temperature. It introduces the heat removal factor , which quantifies heat transfer effectiveness from the absorber to the fluid. A perfect heat removal scenario would result in , while real systems typically exhibit lower values due to thermal resistances. Equation (5) defines as the ratio of actual to maximum possible useful energy gain, further linking system performance to the fluid temperature difference.
To further characterize the thermal behavior of the collector, the American Society of Heating, Refrigerating and Air Conditioning Engineers (ASHRAE) method provides a practical approach to experimentally determine the heat removal factor and the overall heat loss coefficient . This method involves measuring the collector’s steady-state thermal efficiency at various fluid inlet temperatures under consistent solar irradiance. The resulting data are plotted to form the collector efficiency curve, modeled by Equation (6), which expresses as a linear function of the normalized temperature difference. As illustrated in Figure 4, this relationship corresponds to a straight line equation in the form of Equation (7), where the y-axis is Equation (8), and the intercept Equation (9) reflects the optical gain and the slope is in Equation (10) indicates thermal losses. This graphical method validates the theoretical model and facilitates the estimation of performance parameters from empirical data.
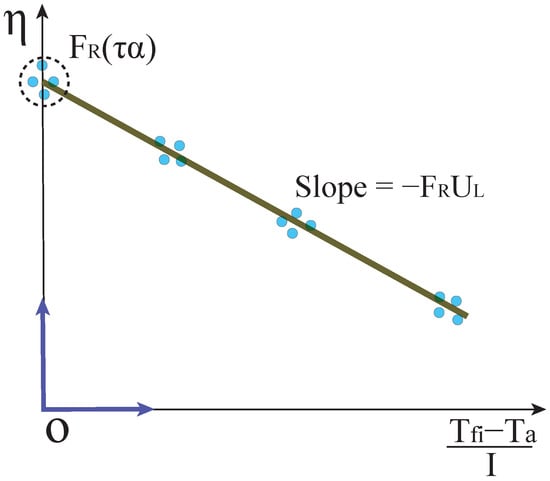
Figure 4.
Efficiency curve using the ASHRAE method [10].
Having established the independent behavior of PVT panels and flat-plate thermal collectors, it is now essential to analyze their integrated configuration in the form of PVT systems. The overall efficiency of a PVT panel combines both thermal and electrical contributions, as represented in Equation (11). This dual-output capability makes PVT technology particularly attractive in applications where maximizing total solar energy conversion is crucial. The thermal efficiency of a PVT system, shown in Equation (12), follows the same general form as in flat-plate collectors, although it is influenced by the presence of the PV module, which affects heat absorption and transfer. The useful thermal energy , given in Equation (13), depends on the fluid’s mass flow rate, specific heat, and the temperature rise across the collector. To better represent real PVT behavior, Duffie et al. [31] adapted the classical HWB formulation, resulting in a modified version shown in Equation (14), which incorporates the optical characteristics specific to PVT configurations. On the electrical side, the efficiency is calculated by relating the generated power to the solar energy received over the collector area, as expressed in Equation (15).
3.2. Physical Implementation Piping and Instrumentation Diagram (P&ID)-Based Experimental Setup
Figure 5 presents the P&ID for the experimental setup to experimentally assess the thermal and electrical behavior of PVT systems under controlled indoor conditions, the TD204 laboratory at Brunel University incorporates a dedicated testing platform known as the Solar Testing Ring Module. Developed by former engineering students, this module is designed to replicate solar irradiation and evaluate integrated solar technologies with a focus on hybrid panel performance.
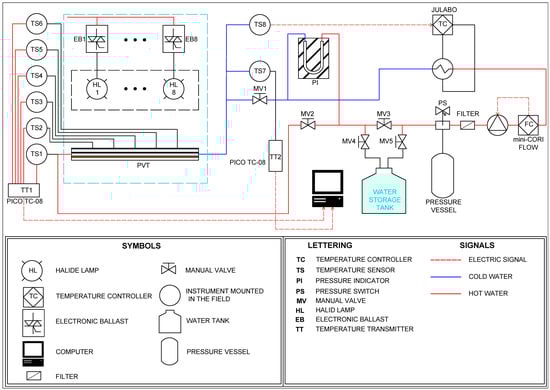
Figure 5.
Piping and Instrumentation Diagram (P&ID) of the experimental PVT test bench.
As defined by the ISA Standard S5.1, this diagram provides a detailed view of the interconnections between piping, instrumentation, and key equipment components. Definitions of all acronyms used in the figure are compiled in Table 5. The water flow originates at the storage tank outlet and passes through the manual valve MV2. It then reaches a manifold composed of three additional valves (MV3, MV4, and MV5), which allow for system purging or fluid replacement. The flow continues through a filter and into the pumping system, which includes a mechanical pump and a mini-CORI FLOW controller. A pressure release vessel is connected in parallel and activated through a pressure switch (PS) to ensure operational safety.
Table 5.
Acronyms and instrumentation symbols used in the P&ID schematic (Figure 5).
After flow regulation, the fluid passes through a heat exchanger where its temperature is adjusted before entering the PVT panel via the gate valve MV1. Thermal measurements are taken by several Type-T thermocouples (TS1 to TS7), strategically placed at the inlet, outlet, and various surface points of the PVT module. A Pt100 RTD sensor (TS8) provides inlet water temperature data to the Julabo Presto A40 controller, which manages the thermal conditioning of the fluid. The solar simulator consists of eight halide lamps (HL1 to HL8), each rated at 1000 W and controlled individually by electronic ballasts (EB1 to EB8), directly connected to the power supply. Additionally, two temperature transmitters (TT1 and TT2) of model PICO TC-08 record temperature data from the PVT surface and outlet. This fully integrated system, controlled by three programmable controllers, ensures the precise monitoring and reproducibility of the experimental conditions, as schematized in Figure 5.
3.3. Experimental Scope and Environmental Conditions
To ensure a comprehensive evaluation of the PVT system’s performance, future experimentation will be designed to isolate and quantify the effects of key operating variables on both thermal and electrical outputs. This is essential for establishing reproducible conditions and enabling meaningful comparisons under different scenarios. Emphasis will be placed on controlling environmental parameters such as ambient temperature and relative humidity throughout all tests. All experiments will be conducted in a controlled laboratory setting, maintaining an ambient temperature of 22.5 ± 1.5 °C and relative humidity within the range of 40–50%. These conditions will be continuously monitored using calibrated sensors to ensure thermal stability and data reliability.
The experimental plan will encompass tests on inlet water temperature, mass flow rate, and irradiance effects on system performance, conducted under systematically varied but controlled conditions. A detailed overview of the experimental configurations, including fixed and variable parameters, is provided in Table 6.
Table 6.
Summary of experimental tests performed to evaluate the thermal and electrical performance of the PVT system.
4. Results and Analysis
4.1. Solar Testing Ring Module for PVT Evaluation
The Solar Testing Ring Module in the TD204 laboratory at Brunel University incorporates a dedicated testing platform that follows the design in Figure 5. The system includes a solar simulator comprising halide lamps, a water circulation loop with thermal control, and data acquisition tools for precise monitoring of input and output parameters. It enables researchers to conduct repeatable experiments across a range of environmental and operational conditions. Figure 6 shows the experimental setup, highlighting the integration of optical, electrical, and thermal instrumentation required for performance testing.
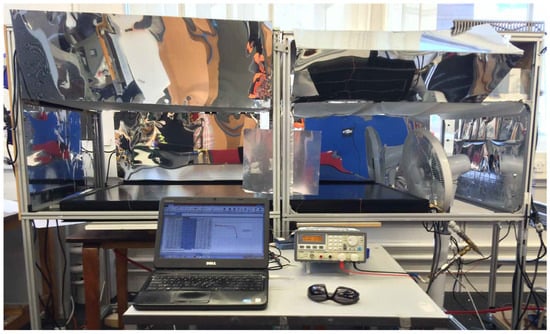
Figure 6.
Solar testing ring module at Brunel University for the experimental evaluation of PVT panels.
To enhance the uniformity of irradiance during testing, the solar simulator is equipped with a light diffuser positioned above the PVT panel. Its primary function is to evenly distribute the light emitted by the halide lamps across the entire absorber surface, thereby minimizing spatial irradiance variation. In addition, internal reflectors are mounted along the simulator walls to redirect scattered radiation back toward the panel, increasing the overall effective illumination and improving energy input conditions. Due to the elevated thermal stress that intense artificial lighting can impose on photovoltaic surfaces, an auxiliary ventilation system is installed. This consists of a fan positioned directly in front of the PVT panel, which serves to dissipate excess heat and maintain panel temperature within realistic operational limits. Figure 7 illustrates the placement and function of the following three key enhancements: the light diffuser, reflective panels, and cooling fan.
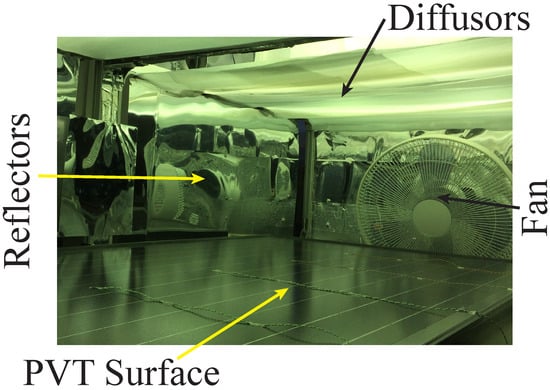
Figure 7.
Solar simulator enhancements: light diffuser, internal reflectors, and cooling fan to stabilize panel temperature.
The solar simulator in Figure 8 is a central element of the experimental system, designed to replicate solar radiation with a high degree of control and repeatability. It consists of eight metal halide lamps, each rated at 1000 W, which together provide sufficient irradiance to simulate real solar conditions. These lamps are regulated by electronic ballasts that allow for the following four distinct power levels: 600 W, 750 W, 1000 W, and a “Super Lumen” mode for maximum intensity. This adjustable configuration supports testing under varying irradiance scenarios, enhancing the system’s experimental flexibility provides a visual overview of the halide lamp and ballast configuration.
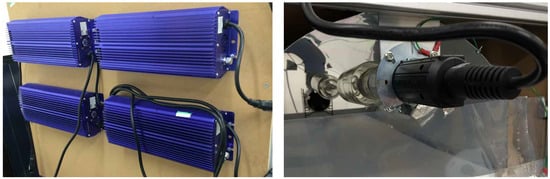
Figure 8.
Solar simulator configuration: (left) electronic ballasts and (right) 1000 W metal halide lamps for irradiance control.
4.2. Specifications of the PVT
The PVT panel used in the experimental setup is the Volther Power Volt MWPVT-1414, a commercially available hybrid model produced by Solimpeks Solar Energy Corp., a Turkish manufacturer. This PVT module combines mono-crystalline photovoltaic cells with a copper thermal absorber. Table 7 presents the technical specifications of the panel, which include its electrical performance, mechanical construction, thermal capabilities, and manufacturing details.
Table 7.
Technical specifications of the Volther Power Volt MWPVT-1414 hybrid PVT panel.
4.3. Effect of Inlet Water Temperature on Electrical Output and Thermal Efficiency
To assess the influence of thermal conditions on the electrical behavior of the PVT panel, a controlled experiment was conducted at the following five different inlet water temperatures: 10 °C, 15 °C, 25 °C, 40 °C, and 55 °C. The water flow rate was maintained at 0.012 kg/s to ensure consistent thermal mass and hydraulic conditions across all trials. Figure 9 presents the resulting I–V curves obtained under these conditions. It can be observed that, despite the significant variation in fluid temperatures, the open-circuit voltage () remains relatively stable across all cases. This suggests that the PV cell surface temperature is being effectively regulated by the fluid flow, even when the inlet temperature varies substantially. Such thermal behavior is critical in hybrid systems, as it supports stable electrical output while enabling thermal energy recovery.
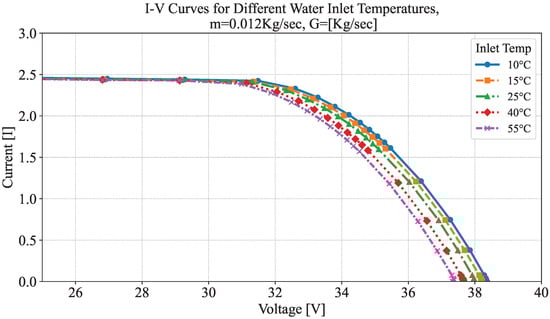
Figure 9.
I–V curves of the PVT panel at varying inlet water temperatures (from 10 °C to 55 °C) with a constant flow rate .
In addition, the analysis of the impact of the inlet water temperature over the thermal efficiency of the PVT panel was carried out at different water temperatures and also at two irradiance levels (1090.9 W/m2 and 548.86 W/m2). The values obtained are shown in Table 8. As can be seen in Figure 10, the thermal effectiveness of the system is reduced when the temperature of the working fluid increases. At an irradiance of 548.86 W/m2, the highest thermal efficiency (44.19%) was obtained at Tin = 10 °C, and it has a decreasing ramp reaching the lowest thermal efficiency (15.35%) at Tin = 55 °C. At 1090.9 W/m2, the system generally has a lower efficiency than 548.86 W/m2, but it maintains the trend, reaching the peak (30.5%) at Tin = 10 °C and the lowest value (14.04%) at Tin = 55 °C.
Table 8.
Thermal efficiency at different inlet temperatures and irradiance levels.
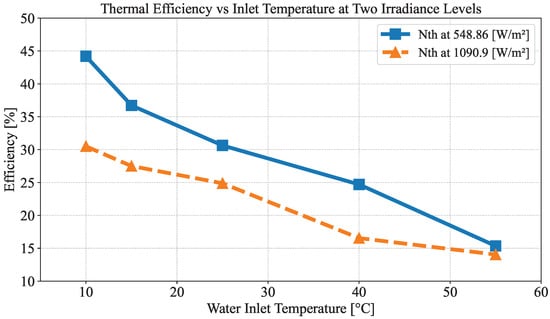
Figure 10.
Thermal efficiency of the PVT system as a function of water inlet temperature for two different irradiance levels. Higher irradiance tends to reduce the efficiency decline with increasing inlet temperature.
The thermal efficiency of the PVT panel is notably affected by the following two primary operating conditions: (a) an increase in solar irradiance and (b) a rise in the inlet water temperature. Both conditions contribute to the higher surface temperature of the absorber, which, in turn, intensifies thermal losses. These losses occur primarily through convection and, more significantly, through radiation, as the radiative heat transfer increases with the fourth power of the surface temperature according to the Stefan–Boltzmann law. Additionally, the effective emissivity of the surface tends to increase with temperature, further exacerbating radiative losses.
4.4. Analysis of the Effect of Different Mass Flow Rates over the Thermal Efficiency of a PVT
To evaluate the impact of fluid dynamics on system performance, a comprehensive analysis was carried out to assess how different mass flow rates affect the thermal efficiency of the PVT panel. A total of 27 experimental tests were performed, involving three mass flow rates—0.004 kg/s, 0.008 kg/s, and 0.012 kg/s—across varying irradiance levels (363.38 W/m2, 548.86 W/m2, and 870.51 W/m2) and inlet water temperatures (15 °C, 25 °C, and 55 °C). The resulting thermal efficiencies, shown in Table 9, reveal a consistent trend as follows: higher mass flow rates lead to greater thermal efficiencies across all tested scenarios. This behavior is attributed to the improved heat transfer at higher flow rates, which reduces the temperature difference between the absorber and the working fluid, thus minimizing thermal losses. The table also highlights the combined effects of inlet temperature and irradiance on efficiency, emphasizing the thermal sensitivity of the PVT system under variable operating conditions.
Table 9.
Impact of mass flow rate on thermal efficiency (PVT).
As illustrated in Figure 11, the highest thermal efficiency was consistently achieved at the maximum flow rate of 0.012 kg/s. Notably, the most favorable performance (45.52%) occurred at the lowest inlet temperature (15 °C) and the lowest irradiance (363.38 W/m2). Although similar trends were observed at higher inlet temperatures, the absolute efficiency values decreased. For instance, the peak efficiency at 55 °C was only 9.69%, compared to 36.81% at 25 °C and 45.52% at 15 °C under the same irradiance. These findings confirm the inverse relationship between inlet fluid temperature and thermal efficiency, emphasizing the benefit of cooler inlet conditions when maximizing thermal recovery in hybrid PVT systems. Each data point in the figure represents the average of eight experimental measurements, with the associated error bars reflecting a deviation range between 5% and 10%.
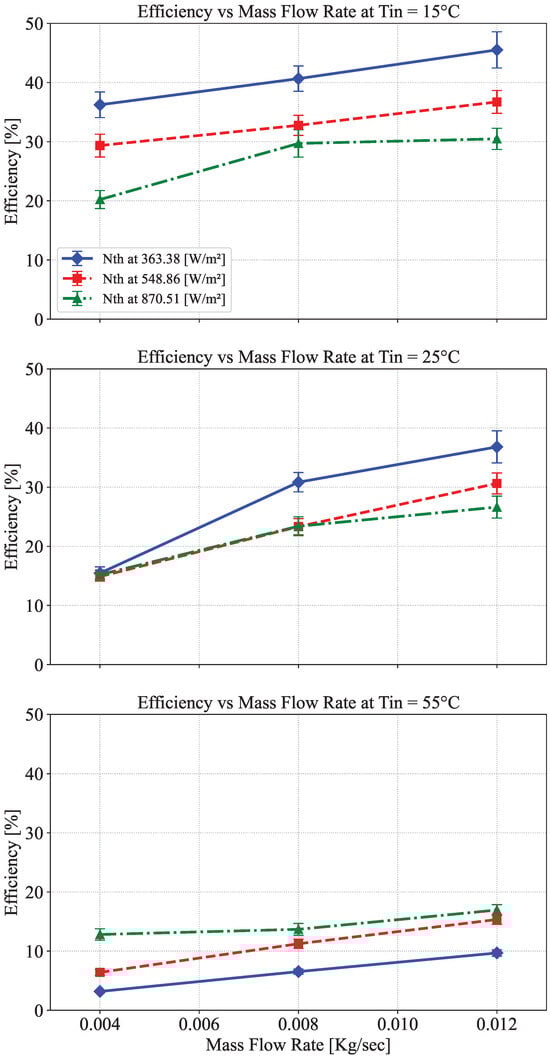
Figure 11.
Thermal efficiency as a function of mass flow rate at three irradiance levels and inlet water temperatures of 15 °C (top), 25 °C (middle), and 55 °C (bottom). The results demonstrate the combined influence of irradiance and flow rate on system performance.
4.5. Determination of Heat Removal Factor and Heat Loss Coefficient
To quantify the thermal behavior of the PVT system, the heat removal factor and the overall heat loss coefficient were calculated using the ASHRAE method. This approach is based on plotting thermal efficiency against the normalized temperature difference, expressed as . The corresponding data for this evaluation are presented in Table 10, derived from five distinct inlet temperatures: 10 °C, 15 °C, 25 °C, 40 °C, and 55 °C, all tested under a constant irradiance of 548.86 W/m2.
Table 10.
Data for the thermal efficiency curve.
The resulting thermal efficiency curve, shown in Figure 12, exhibits a strong linear relationship between efficiency and the normalized temperature difference , confirming the expected inverse correlation between thermal efficiency and increasing inlet temperature. The linear regression yields Equation , where the intercept represents the product and the slope corresponds to . This relationship allows for the extraction of both the heat removal factor and the overall heat loss coefficient. For validation, a simplified linear fit was also modeled using the standard linear form , where and , as illustrated in Figure 12. Assuming the known optical properties of the absorber surface with (Equation (16)), the heat removal factor was computed as (Equation (18)). Subsequently, using the slope from the linear fit, the overall heat loss coefficient was determined as (Equation (19)). These parameters provide a quantitative basis for evaluating the thermal performance of the PVT system and serve as critical inputs for dynamic thermal modeling under varying operating conditions.
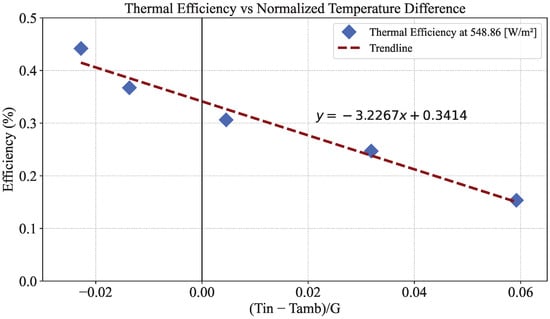
Figure 12.
Thermal efficiency of the PVT system as a function of the normalized temperature difference, defined as , at an irradiance of 548.86 W/m2. The linear trendline illustrates the inverse relationship between efficiency and temperature difference.
4.6. Comparing Efficiency Between PV and PVT Modules
To investigate the influence of active cooling on the electrical performance of photovoltaic panels, a comparative analysis was conducted between a standard PV module and a PVT module operating with water circulation. The results, summarized in Table 11 and visualized in Figure 13, show how electrical efficiency varies across different irradiance levels for both configurations. As expected, electrical efficiency decreases with increasing irradiance for both PV and PVT panels, primarily due to elevated cell temperatures under higher solar flux. Notably, at the lowest irradiance (363.38 W/m2), the standalone PV module exhibited slightly higher efficiency than the PVT panel. However, at all higher irradiance levels, the PVT system consistently outperformed the PV panel in terms of electrical efficiency. This improvement is attributed to the active cooling effect provided by water circulation, which reduces thermal stress on the solar cells and mitigates temperature-related performance losses. These findings highlight the value of thermal regulation in enhancing the electrical output of integrated PVT systems under real operating conditions.
Table 11.
Electric efficiency under different irradiances [W/m2] for PV vs. PVT.
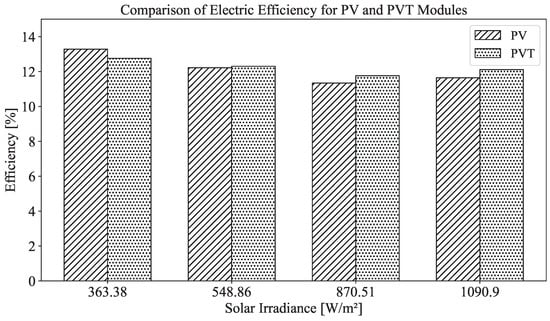
Figure 13.
Comparison of the electric efficiency of PV and PVT modules under varying irradiance conditions. The results highlight the impact of solar irradiance on electrical performance for both technologies.
4.7. Overall Efficiency of the PVT System at Varying Inlet Temperatures
The overall efficiency of the PVT panel was evaluated under different inlet water temperatures and irradiance levels, with the results shown in Table 12 and illustrated in Figure 14. The analysis reveals that overall efficiency is highest at lower inlet temperatures, where the working fluid absorbs more solar energy, reducing thermal and electrical losses. As inlet temperature increases, overall efficiency declines, reflecting increased surface temperature and associated radiative losses. This trend is consistent across irradiance levels, with peak performance occurring at 548.86 W/m2 and inlet temperatures around 10 °C. Conversely, under the highest irradiance (1090.9 W/m2), elevated surface temperatures cause greater energy dissipation, lowering overall system efficiency.
Table 12.
Overall efficiency of the PVT panel at different inlet temperature and irradiance.
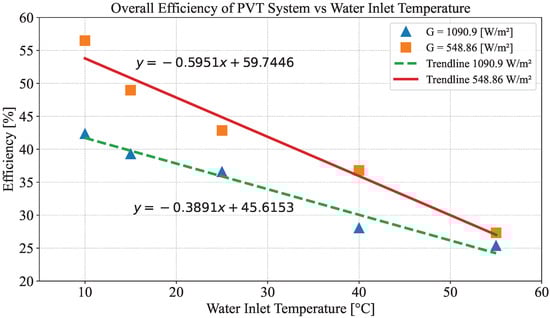
Figure 14.
Overall efficiency of the PVT system as a function of water inlet temperature for two irradiance levels (548.86 and 1090.9 W/m2). The plotted trendlines illustrate the inverse relationship between inlet temperature and system efficiency.
To provide a broader context to the performance of the proposed system, a comparative analysis was carried out using experimental data from Allan et al. [10], who evaluated a serpentine-type PVT collector under an irradiance of 993 W/m2. Our results, measured under 1090.9 W/m2, were plotted against theirs to examine common thermal behavior trends. Although the irradiance conditions are not identical, Table 13 and Figure 15 reveal a consistent and well-aligned trend across both studies as follows: thermal efficiency decreases as the inlet water temperature increases. This behavior is typical of PVT systems due to the reduced temperature gradient between the absorber and the fluid at higher inlet temperatures, which in turn diminishes the rate of heat transfer. The regression lines included in the graph further support this inverse correlation, showing a more substantial drop in efficiency in the reference system. Despite differences in panel architecture and test conditions, the present system exhibits a more gradual decline, suggesting stable thermal performance even under higher thermal loads.
Table 13.
Comparative thermal efficiency of the proposed PVT system and a serpentine collector reported in Ref. [10].
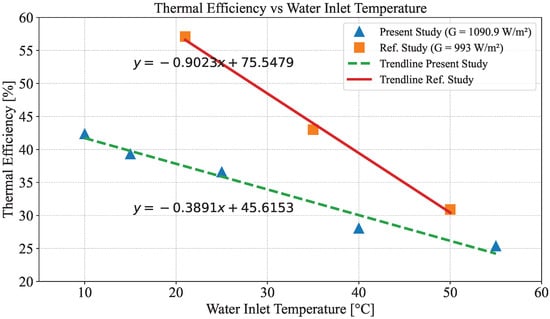
Figure 15.
Comparison of thermal efficiency versus inlet water temperature between the present study (G = 1090.9 W/m2) and the serpentine PVT collector reported by Allan et al. [10] (G = 993 W/m2).
The progressive decline in thermal efficiency observed with rising inlet water temperature and solar irradiance is primarily attributed to intensified radiative heat losses from the absorber surface. As the surface temperature increases, radiative losses grow significantly, following the Stefan–Boltzmann law, which establishes that radiative heat flux scales with the fourth power of absolute temperature, while convective losses also contribute—particularly under conditions of natural or forced airflow—their relative impact diminishes at elevated temperatures where radiation dominates the overall heat dissipation. Additionally, the effective emissivity of absorber materials tends to increase with temperature, further amplifying radiative heat loss. This combination of thermophysical effects explains the sharper efficiency drop observed under high-irradiance, high-inlet-temperature conditions, reinforcing the importance of maintaining lower operating temperatures to optimize thermal recovery in hybrid PVT systems.
5. Conclusions and Future Works
The literature review revealed a noticeable lack of experimental studies on commercially available PVT panels operating under varied real-world hydrodynamic and thermal conditions. While many previous investigations have focused on simulations or theoretical models, few have addressed the reproducibility and standardized assessment of such systems in controlled environments relevant to residential use.
To address this gap, a replicable experimental platform was developed to evaluate the thermal and electrical performance of a commercial PVT module. The system includes a solar simulator, a fully instrumented thermal loop, and a programmable control framework, offering consistent testing across a range of operating conditions. This benchmark enables other researchers to reproduce tests under equivalent boundary conditions, thereby supporting standardization efforts in the assessment of hybrid solar technology.
Experimental results confirm that the PVT system maintains stable electrical performance across inlet temperatures ranging from 10 °C to 55 °C. The open-circuit voltage showed only minor fluctuations throughout the entire range, indicating that the fluid flow at 0.012 kg/s effectively limits thermal stress on the photovoltaic cells. This thermal regulation plays a crucial role in maintaining electrical output, particularly under varying thermal loads, and enhances the panel’s dual-function capability to simultaneously generate heat and electricity without compromising stability. The panel’s electrical performance under high irradiance was also improved when compared to a standalone PV module, highlighting the benefits of active cooling in hybrid solar applications.
The study also confirmed that thermal efficiency improves significantly with increased mass flow rate and declines with higher inlet temperatures and solar irradiance. The most favorable thermal performance was observed at a flow rate of 0.012 kg/s and an inlet temperature of 10 °C, where convective heat transfer was maximized and radiative losses minimized. This inverse relationship between inlet temperature and efficiency is primarily attributed to radiative heat losses, which intensify as the absorber surface temperature rises. The apparent linear trend observed in the efficiency curve as a function of normalized temperature difference supports the applicability of the ASHRAE method for this system. The experimental data enabled the accurate determination of the heat removal factor () and the overall heat loss coefficient (), which are essential parameters for dynamic thermal modeling and system optimization.
Overall, this research makes significant contributions both methodologically and empirically to the field of hybrid solar systems. It provides a validated experimental procedure, delivers actionable performance data for a commercial panel, and establishes a foundation for future optimization and simulation studies. These insights support more accurate sizing, better integration into residential settings, and improved comparability between systems tested under matched conditions.
Author Contributions
Conceptualization, methodology, software, resources, validation, and formal analysis, J.A. and W.P.; investigation and writing–original draft preparation, J.A., W.P. and Z.D.; writing—review and editing—and supervision, J.A., W.P. and Z.D. All authors have read and agreed to the published version of the manuscript.
Funding
This research was funded by Brunel University London and Universidad UTE. The financial support included contributions from Universidad UTE (USD 2000) and the Ecuadorian Government (USD 5000) under a scholarship awarded through an open call.
Data Availability Statement
Data are contained within the article.
Acknowledgments
This paper presents results from a project in the master’s program of Renewable Energy at Brunel University, UK, and Universidad UTE, Ecuador.
Conflicts of Interest
The authors declare no conflict of interest.
References
- Grant, C.D.; Schwartzberg, A.M.; Smestad, G.P.; Kowalik, J.; Tolbert, L.M.; Zhang, J.Z. Characterization of nanocrystalline and thin film TiO2 solar cells with poly(3-undecyl-2,2%-bithiophene) as a sensitizer and hole conductor. J. Electroanal. Chem. 2002, 522, 40–48. Available online: https://www.elsevier.com/locate/jelechem (accessed on 1 June 2025). [CrossRef]
- Thakare, M.S.; Priya, G.S.K.; Ghosh, P.C.; Bandyopadhyay, S. Optimization of photovoltaic-thermal (PVT) based cogeneration system through water replenishment profile. Sol. Energy 2016, 133, 512–523. [Google Scholar] [CrossRef]
- Pavón, W.; Inga, E.; Simani, S.; Armstrong, M. Novel Single Stage DC/AC Power Inverter for a Standalone Photovoltaic System Controlled by a Double Loop Scheme. In Proceedings of the 2022 IEEE 10th International Conference on Smart Energy Grid Engineering (SEGE), Oshawa, ON, Canada, 10–12 August 2022; pp. 111–118. [Google Scholar] [CrossRef]
- Vallejos, P.; David, W. Optimal Control on Electrical Substation for Enhanced Stability Transient Considering Frequency and Voltage. Università degli Studi di Ferrara 2021. Available online: https://tesidottorato.depositolegale.it/handle/20.500.14242/118817 (accessed on 1 June 2025).
- Pavón, W.; Inga, E.; Simani, S.; Armstrong, M. Optimal Hierarchical Control for Smart Grid Inverters Using Stability Margin Evaluating Transient Voltage for Photovoltaic System. Energies 2023, 16, 2450. [Google Scholar] [CrossRef]
- Lema, M.; Pavón, W.; Ortiz, L.; Asiedu-Asante, A.B.; Simani, S. Controller Coordination Strategy for DC Microgrid Using Distributed Predictive Control Improving Voltage Stability. Energies 2022, 15, 5442. [Google Scholar] [CrossRef]
- Pavón, W.; Inga, E.; Simani, S.; Chamorro, W. Optimal Secondary and Tertiary Hierarchical Control for Photovoltaic System Generation Using a Heuristic Approach. In Proceedings of the 2023 6th International Conference on Electrical Engineering and Green Energy (CEEGE), Grimstad, Norway, 6–9 June 2023; pp. 198–203. [Google Scholar] [CrossRef]
- Lin, Q.; Li, Q.; Xu, P.; Zheng, R.; Bao, J.; Li, L.; Tan, D. Transport Mechanism and Optimization Design of LBM–LES Coupling-Based Two-Phase Flow in Static Mixers. Processes 2025, 13, 1666. Available online: https://www.mdpi.com/2227-9717/13/6/1666 (accessed on 5 June 2025). [CrossRef]
- Gu, Y.; Li, L.; Zheng, G.; Gu, C.Y.; Li, L.; Zheng, Y. Study on the Dynamic Characteristics of the Gear Lubrication Flow Field with Baffles and Optimization Design Strategies. Lubricants 2025, 13, 143. [Google Scholar] [CrossRef]
- Allan, J.; Dehouche, Z.; Stankovic, S.; Mauricette, L. Performance testing of thermal and photovoltaic thermal solar collectors. Energy Sci. Eng. 2015, 3, 310–326. [Google Scholar] [CrossRef]
- Zhang, X.; Zhao, X.; Smith, S.; Xu, J.; Yu, X. Review of R&D progress and practical application of the solar photovoltaic/thermal (PV/T) technologies. Renew. Sustain. Energy Rev. 2012, 16, 599–617. [Google Scholar] [CrossRef]
- Hasan, M.A.; Sumathy, K. Photovoltaic thermal module concepts and their performance analysis: A review. Renew. Sustain. Energy Rev. 2010, 14, 1845–1859. [Google Scholar] [CrossRef]
- Fares, H.; Le Pierrès, N.; Chèze, D.; Wurtz, E. Assessing the energy performance of solar photovoltaic, thermal and hybrid PVT panels in a building context: A systematic study of the criteria’ definitions and studies parameters. Sol. Energy 2025, 286, 113126. [Google Scholar] [CrossRef]
- Gharaee, H.; Erfanimatin, M.; Bahman, A.M. Machine learning development to predict the electrical efficiency of photovoltaic-thermal (PVT) collector systems. Energy Convers. Manag. 2024, 315, 118808. [Google Scholar] [CrossRef]
- Alktranee, M.; Al-Yasiri, Q.; Mohammed, K.S.; Al-Lami, H.; Bencs, P. Energy and exergy assessment of a photovoltaic-thermal (PVT) system cooled by single and hybrid nanofluids. Energy Convers. Manag. X 2024, 24, 100769. [Google Scholar] [CrossRef]
- Azad, A.K.; Parvin, S.; Hossain, T. Performance evaluation of nanofluid-based photovoltaic thermal (PVT) system with regression analysis. Heliyon 2024, 10, 7. [Google Scholar] [CrossRef] [PubMed]
- Hosouli, S.; Gaikwad, N.; Qamar, S.H.; Gomes, J. Optimizing photovoltaic thermal (PVT) collector selection: A multi-criteria decision-making (MCDM) approach for renewable energy systems. Heliyon 2024, 10, 6. [Google Scholar] [CrossRef] [PubMed]
- El Alami, Y.; Lamkaddem, A.; Bendaoud, R.; Talbi, S.; Louzazni, M.; Baghaz, E. Numerical study of a water-based photovoltaic-thermal (PVT) hybrid solar collector with a new heat exchanger. E-Prime Electr. Eng. Electron. Energy 2024, 9, 100693. [Google Scholar] [CrossRef]
- Pourier, C.; Beltrán, F.; Sommerfeldt, N. Solar photovoltaic/thermal (PVT) technology collectors and free cooling in ground source heat pump systems. Sol. Energy Adv. 2024, 4, 100050. [Google Scholar] [CrossRef]
- Al-Waeli, A.H.A.; Sopian, K.; Chaichan, M.T.; Kazem, H.A.; Ibrahim, A.; Mat, S.; Ruslan, M.H. Evaluation of the nanofluid and nano-PCM based photovoltaic thermal (PVT) system: An experimental study. Energy Convers. Manag. 2017, 151, 693–708. [Google Scholar] [CrossRef]
- Fudholi, A.; Sopian, K.; Yazdi, M.H.; Ruslan, M.H.; Ibrahim, A.; Kazem, H.A. Performance analysis of photovoltaic thermal (PVT) water collectors. Energy Convers. Manag. 2014, 78, 641–651. [Google Scholar] [CrossRef]
- Alsaqoor, S.; Alqatamin, A.; Alahmer, A.; Nan, Z.; Al-Husban, Y.; Jouhara, H. The impact of phase change material on photovoltaic thermal (PVT) systems: A numerical study. Int. J. Thermofluids 2023, 18, 100365. [Google Scholar] [CrossRef]
- Khanjari, Y.; Pourfayaz, F.; Kasaeian, A.B. Numerical investigation on using of nanofluid in a water-cooled photovoltaic thermal system. Energy Convers. Manag. 2016, 122, 263–278. [Google Scholar] [CrossRef]
- Al-Waeli, A.H.A.; Sopian, K.; Chaichan, M.T.; Kazem, H.A.; Hasan, H.A.; Al-Shamani, A.N. An experimental investigation of SiC nanofluid as a base-fluid for a photovoltaic thermal PV/T system. Energy Convers. Manag. 2017, 142, 547–558. [Google Scholar] [CrossRef]
- Herrando, M.; Markides, C.N.; Hellgardt, K. A UK-based assessment of hybrid PV and solar-thermal systems for domestic heating and power: System performance. Appl. Energy 2014, 122, 288–309. [Google Scholar] [CrossRef]
- Sardarabadi, M.; Passandideh-Fard, M.; Heris, S.Z. Experimental and numerical study of metal-oxides/water nanofluids as coolant in photovoltaic thermal systems (PVT). Energy Convers. Manag. 2016, 122, 263–273. [Google Scholar] [CrossRef]
- Sardarabadi, M.; Passandideh-Fard, M.; Heris, S.Z. Experimental study of using both ZnO/water nanofluid and phase change material (PCM) in photovoltaic thermal systems. Energy 2017, 138, 876–889. [Google Scholar] [CrossRef]
- Al-Waeli, A.H.A.; Chaichan, M.T.; Sopian, K.; Kazem, H.A. Modeling and experimental validation of a photovoltaic thermal (PVT) system using nanofluid coolant and nano-PCM. Sol. Energy 2019, 177, 106–123. [Google Scholar] [CrossRef]
- Ghadiri, M.; Hosseini, R.; Chaji, H.; Sardarabadi, M. Experimental investigation of a photovoltaic thermal (PVT) system performance using nano ferrofluids. Energy Convers. Manag. 2015, 103, 468–476. [Google Scholar] [CrossRef]
- Ibrahim, A.; Othman, M.Y.; Ruslan, M.H.; Alghoul, M.A.; Yahya, M.; Sopian, K. Efficiencies and improvement potential of building integrated photovoltaic thermal (BIPVT) system. Energy Convers. Manag. 2014, 77, 527–534. [Google Scholar] [CrossRef]
- Klein, S.A.; Duffie, J.A.; Beckman, W.A. Transient Considerations of Flat-Plate Solar Collectors. J. Eng. Gas Turbines Power 1974, 96, 109–113. [Google Scholar] [CrossRef]
Disclaimer/Publisher’s Note: The statements, opinions and data contained in all publications are solely those of the individual author(s) and contributor(s) and not of MDPI and/or the editor(s). MDPI and/or the editor(s) disclaim responsibility for any injury to people or property resulting from any ideas, methods, instructions or products referred to in the content. |
© 2025 by the authors. Licensee MDPI, Basel, Switzerland. This article is an open access article distributed under the terms and conditions of the Creative Commons Attribution (CC BY) license (https://creativecommons.org/licenses/by/4.0/).