Article

Pulse Compression Probing for Active Islanding Detection †

by
Nicholas Piaquadio
*,
N. Eva Wu
and
Morteza Sarailoo
Department of Electrical and Computer Engineering, State University of New York at Binghamton, Binghamton, NY 13902, USA
*
Author to whom correspondence should be addressed.
This paper is an extended version of our paper published in IEEE PESGM 2024, Seattle, Washington, USA, 21–25 July 2024.
Energies 2025, 18(13), 3354; https://doi.org/10.3390/en18133354
Submission received: 28 April 2025 / Revised: 2 June 2025 / Accepted: 16 June 2025 / Published: 26 June 2025
(This article belongs to the Section A1: Smart Grids and Microgrids)

Abstract

The rapid growth of inverter-based resources (IBRs) has created a need for new islanding detection methodologies to determine whether an IBR has been disconnected from the transmission grid in some manner (islanded) or remains connected to the transmission grid (grid-connected). Active islanding detection methods inject a signal into the power system to achieve detection. Existing schemes frequently limit consideration to a single node system with one IBR. Schemes tested on multiple IBRs often see interference, with the signals from one IBR disturbing the others, or require intricate communication. Further, several methods destabilize an islanded grid to detect it, preventing a prospective microgrid from remaining in operation while islanded. This work develops an active islanding detection scheme using Pulse Compression Probing (PCP) that is microgrid-compatible and can be used with multiple IBRs without requirement for communication. This active islanding detection scheme can be implemented on existing inverter switching sequences and has a detection time of 167–223 ms, well within the detection time specified by existing standards. The method is verified via electromagnetic transient (EMT) simulation on a modified version of a 34-bus test system.

1. Introduction

The goal of islanding detection is to determine whether an inverter-based resource (IBR) within a distribution network is electrically connected to the transmission grid (grid-connected), or has become isolated from the transmission grid (islanded) [1]. If the IBR is islanded, action must be taken. Traditionally, this entails disconnecting the IBR from the network to ensure electrical worker safety and grid integrity. In the case of a microgrid, controls are adjusted to keep the islanded microgrid online in a stable mode of operation.
Distribution networks and microgrids are growing increasingly complex. In some jurisdictions, generation from numerous IBRs is expected to exceed load [2]. To meet this rapid IBR growth, new and more advanced islanding detection methodologies are needed. In particular, new schemes are needed that are highly reliable, operate with numerous IBRs in the network simultaneously, and can meet the functional needs of a microgrid. These schemes must also be selective between islanded conditions and various non-islanding events, which are changes in the network that leave an IBR grid-connected [3]. This work develops an active nu-gap [4]-based islanding detection scheme to meet the above needs.

1.1. Related Work

Broadly speaking, islanding detection methods are divided into three categories. Passive methods [5,6,7,8] detect islands using measurement data alone, while active methods [9,10,11,12] detect islands by injecting signal(s) into the network, and processing the network’s response(s). In addition, communication-based methods are available, such as a power line carrier and direct transfer trip. These communication-based schemes are not discussed in this paper as they require substantial infrastructure investment and cooperation among many entities on a detailed design level [13].
Passive methods tend to rely on voltage and frequency measurements. Some of the earliest passive methods used voltage and frequency protection relays directly [14]. More recent developments have introduced machine learning [5,6], data mining [7], and wavelet transforms [8] to process and classify large amounts of data in rapid time scales.
Passive methods entail a non-detection zone, which refers to a set of islanded conditions that would be classified as grid-connected. Most non-detection zones include the case of a balanced island, where the power generated on the island is equal to the power consumed by the load on the island [14]. New passive methods look to reduce the size of the non-detection zone through the application of chaos theory [15] and signal processing techniques [16].
Active islanding detection methods can eliminate this non-detection zone entirely at the cost of causing an unwanted disturbance to the distribution network. Hence, the primary benefit of active methods is the absence of a non-detection zone, and the primary drawbacks are the disturbance to the system caused by, and cost of generating, the active signal. Many active signals have been considered. As shown in Table 1, these range from a slight positive feedback in frequency control known as the Sandia Frequency Shift [17], to perturbations in voltage magnitude [11,18], reactive power [19], and real power [10].
This work achieves islanding detection through Pulse Compression Probing (PCP), a form of power system probing. Power system probing involves injecting a known probing signal into the power grid to capture sought information in its response. Power system probing has found various active islanding detection applications [10,11,19,20].
Several recent active islanding detection methods are compared in Table 1, under selected important performance criteria. A bold entry in a column of Table 1 indicates the method(s) that performs best on that criterion.
In Table 1, we define “Disturbance While Grid-Connected” as the impact of active signal injection while the probing IBR is grid-connected. The acceptable level of disturbance depends on the operational needs of a given distribution network; therefore, no entry is bold. “Detection Time” is the time taken to identify an island, as given in the cited work. “Performance with Multiple Inverters” records how the method performs in systems with multiple IBRs, if tested. “Test System Size” refers to the number of electrical nodes in the distribution test feeder (or network) used for the study. “Microgrid Compatibility” reflects whether the method can identify an islanded microgrid without destabilizing it.
Of the methods in Table 1, Ref. [18] had the fastest detection time, but the negative sequence injection method did not work for multiple IBRs, and the method did not work in unbalanced networks where the load is not equal on all three phases.
Refs. [10,11,20,21] considered islanding detection involving multiple IBRs in test systems larger than a single electrical node. In [10], the coordination of multiple inverters via the global positioning system (GPS) was required to ensure that the probing signals did not interfere with more than one IBR. A high-frequency voltage waveform was used in [11] as the probing signal. This produced a faster detection time, but a special injection device was required for probing, and degraded performance was observed with multiple IBRs.
Table 1. Comparison of several active islanding detection methods.
Active Islanding Detection MethodDisturbance While Grid-ConnectedDetection TimePerformance with Multiple InvertersTest System SizeMicrogrid-Compatible
Hybrid Sandia Frequency Shift [22]Small Frequency PerturbationOrder of ms, VariesTested, but missed detection shown [11]Single NodeNo—Destabilizes
Impedance Angle Measurement [21]Small Frequency PerturbationUp to 1 sGood Performance, Synchronization Needed4 NodesYes
Negative Sequence Injection [18]Constant 4% Negative Sequence Injection60 msSingle Inverter OnlySingle NodeBalanced Networks Only
d-q Reactive Power [19]5% Reactive Power Variation1.8 sNot TestedSingle NodeYes
d-q Real Power [10]1% Real Power Variation500 msGood Performance, GPS Coordination Needed5 NodesYes
Harmonic Profile Injection [20]< 5 % THD While Probing100–133 msGood Performance9 NodesNo—Destabilizes
High-Frequency Impedance Estimation [11]< 1.6 % THD While Probing200 msTested, Degraded Performance3 NodesYes
PCP (This Work)< 3 % THD While Probing167–223 msGood Performance34 NodesYes
Ref. [20] used harmonic injection to set the system on an unstable trajectory when islanded. This worked well for multiple IBRs, but destabilizes the island by design, making it microgrid-incompatible. Ref. [21] used a 225 Hz pulse to measure a grid impedance angle, spaced by 1 Hz to allow multiple units to synchronize. This allowed multiple IBRs to use the method simultaneously, and remained microgrid-compatible, but the synchronization led to a potential for long detection delays. Like other communication-based methods, this also requires IBRs to cooperate. Given the large number of competing manufacturers for inverters, cooperation may be unrealistic to expect in real applications.
To meet the needs of the future power system, islanding detection methods must have no non-detection zone, work for numerous IBR simultaneously, and be microgrid-compatible. This work develops a scheme to meet these requirements.

1.2. Contributions

This work utilizes Pulse Compression Probing (PCP) [23] to develop an active nu-gap-based islanding detection scheme. The nu-gap metric [4], as defined in Section 2.1 Equation (1), is used to compare the probed system and the nominal system from the terminals of the IBR. We find that islanded conditions cause a large shift in the nu-gap, while non-islanding events do not cause the nu-gap to change substantially.
The main benefits of the active nu-gap-based method proposed in this work are as follows:
  • Our islanding detection scheme, like other active methods, handles the case of a balanced island.
  • It allows simultaneous probing signal injection from multiple IBRs.
  • It does not destabilize an island to detect it, making it microgrid-compatible.
  • A logical implementation is developed for single H-bridge inverters, allowing direct injection from each IBR and eliminating any need for new physical devices.
  • Detection is achieved without the need for any inter-IBR cooperation or communication infrastructure.
  • As special devices and communication are not required, the implementation cost is low, and only a software update would be required to implement PCP on most inverters.
The above are demonstrated via simulation on test systems in Section 3 and Section 4 of this work. The case of multiple inverters is investigated using a detailed system, comprised of the Institute of Electrical and Electronics Engineers (IEEE) 34-bus test system [24] and three added IBRs. Electromagnetic transient (EMT) simulations are carried out in Matlab 2024b with Simscape Specialized Power Systems toolbox [25].
This paper builds on two conference papers [26,27]. Ref. [26] introduced the concept of using PCP in distribution networks. Ref. [27] demonstrated some preliminary islanding detection results. New developments in this work include a detailed discussion of the design of the active nu-gap-based detector, design parameters, treatment of measurement noise and harmonic distortion, as well as new test data in a balanced island scenario with multiple IBRs on a weak system.

1.3. Paper Organization

The remainder of this paper is organized as follows. Section 2 provides background on PCP and the nu-gap metric. Section 3 describes a proof of concept for probing via PCP on the IEEE 13-Node Distribution Test System [24], and Section 4 demonstrates the active nu-gap-based islanding detection scheme on the IEEE 34-bus distribution test system [24]. Section 5 concludes the paper.

2. Materials and Methods

This section provides an overview of the working principles of Pulse Compression Probing (PCP) [28] and the nu-gap metric [4].

2.1. Nu-Gap-Based Detection

As will be shown in Section 2.2, the PCP output will be a measurement of the current to voltage pulse response as seen by the IBR that is injecting the probing signal. This provides sufficient information to construct a system realization via techniques such as the Eigensystem Realization Algorithm (ERA) [29]. In this context, system realization means finding a closed-form model that nearly matches the current to voltage pulse response of the distribution network.
Having a closed-form model of the system as seen by the IBR is useful in that it provides a simplified representation of the distribution network. This information may be used to re-design IBR controls, or, as in the case of this paper, attempt to make a determination about the state of the distribution network. For islanding detection, we will take the closed-form model of the probed system, and compare it to a stored model of the “nominal” system. We obtain the “nominal” system model by probing the network with all lines in service.
The nu-gap metric will be used to measure the distance between the two systems [30]. When two systems are close in the nu-gap metric, controllers that perform well for one tend to perform well on the other. We will show in Section 4 that islanded systems tend to have a large nu-gap when compared with grid-connected systems.
The nu-gap metric ranges from 0 to 1 and compares the closed-loop behavior of two systems with the same winding number [30]. The winding number of a system can be found on its Nyquist contour as the number of counter-clockwise encirclements of the origin. Alternatively, it is equal to the number of right half plane zeros minus the number of right half plane poles.
For two single-input single-output systems with the same winding number, P 1 ( j ω ), and P 2 ( j ω ), the nu-gap, and δ ν can be computed point by point in the frequency domain, according to (1) [4].
ψ ( P 1 ( j ω ) , P 2 ( j ω ) ) = | P 1 ( j ω ) P 2 ( j ω ) | 1 + | P 1 ( j ω ) | 2 1 + | P 2 ( j ω ) | 2 δ ν = max ω ψ ( P 1 ( j ω ) , P 2 ( j ω ) )
This result is useful in that it provides a computable analytic expression for the metric. Given two systems, it can also be used to provide a point-by-point calculation of the nu-gap at each frequency, which allows deeper insight into why two systems appear far apart in the metric.

2.2. Overview of PCP

The goal of PCP is to extract, in real time, an input–output model of the distribution network in the form of a pulse response, h ( t ) , as seen by an IBR at its terminals. The pulse response is linearized around the distribution network’s operating point, as seen from the probing IBR.
To begin, a discrete-time pseudo-random binary sequence (PRBS) [31] is generated and made into a continuous-time pseudo-random binary pulse train (PRBPT), shown in Figure 1.
A rectangular pulse η ( t ) is taken to have magnitude a and width t 0 . The PRBPT is the convolution of η ( t ) with an impulsive PRBS:
p ( t ) = a η ( t ) σ ( t )
where σ ( t ) represents an impulsive PRBS of order n (as shown in the top plot of Figure 1), and ∗ denotes the convolution operator. Each bit in the sequence holds for t 0 time units, which defines the bit duration of the PRBPT. The period of the PRBPT, T p , is given by
T p = ( 2 n 1 ) t 0
Here, T p must be taken to be no shorter than the effective memory length, M, of h ( t ) . M can be visualized as the duration of the pulse response before it settles near zero.
In addition to M, the system bandwidth, ω B , seen from the terminals of the IBR, must be approximately known.
Figure 2 shows a block diagram of the PCP process, with sample signals from the IEEE 13-Node Distribution Test System [24]. The probing signal p ( t ) is added to the system nominal voltage u ( t ) . For a linear system, the system output y ( t ) can be decomposed into two components: y ( t ) = y s ( t ) + y p ( t ) , where the output due to the system is y s ( t ) = h ( t ) u ( t ) and the output due to probing is y p ( t ) = h ( t ) p ( t ) . The PCP output z ( t ) is extracted by cross-correlating a reference signal, s ( t ) , with the system output passed through some filtering, denoted as y f ( t ) :
z ( t ) = y f ( t ) s ( t ) = z s ( t ) + z p ( t )
In (4), ⊗ represents continuous-time cross-correlation. The PCP output z ( t ) has two components: z s ( t ) , caused by u ( t ) , and z p ( t ) , caused by p ( t ) .
The reference signal s ( t ) is chosen to be a cyclic repetition of the probing signal p ( t ) with magnitude 1 / ( a T p ) , yielding
p ( t ) s ( t ) k δ ( t k T p )
Here, δ ( t ) is the Dirac delta function, and the cross-correlation of the probing signal and reference signal yields a time-shifted impulse. This impulse repeats every T p time units. This property is shown in [28] to hold so long as the bit duration, t 0 , is sufficiently small. Under this condition, the component of the PCP output excited by the PRBPT is expressed as
z p ( t ) = h ( t ) p ( t ) s ( t ) k h ( t k T p )
where z p is a repetition of the system impulse response, generated by the “phantom impulse” that results from the cross-correlation of the probing signal p ( t ) , as expressed in (4). The cross-correlation operation dictates that the first complete PCP output impulse response appears between T p and 2 T p .
A PCP signal is designed by selecting parameters a, n, and t 0 , such that the PCP output is dominated by the impulse response, z ( t ) z p ( t ) , and the system output is dominated by the nominal output, y ( t ) y s ( t ) .
The reader is referred to [28] for a proof that z ( t ) z p ( t ) holds for sufficiently large n and/or sufficiently small t 0 . It is evident that y ( t ) y s ( t ) holds when a is taken small enough to cause a minimal disturbance in the system.
As the detector in this work will be implemented in discrete-time, the measurement will be of the discrete-time pulse response, and the term “pulse response” will be used from here on.

2.3. PCP Signal Design

The parameters of a PCP signal must be carefully chosen to fit the system of interest. The bit duration, t 0 , must be short enough to accommodate the system bandwidth ω B [32]. A small t 0 leads to a short probing period T p , as shown in (3), and a short probing delay.
To avoid time-domain aliasing, T p must be at least as long as the effective memory length, M, of h ( t ) . The h ( t ) signal shown in Figure 2 has a memory length of roughly 0.02 s. Combined with the bandwidth requirement, this places design constraints on t 0 and the order, n.
t 0 2 π 5 ω B
n l o g 2 ( M / t 0 + 1 )
The remaining parameter is the probing magnitude a, which must be sufficiently small to keep the disturbance caused by probing within acceptable bounds, yet large enough that z p in (6) dominates the PCP output. The signal-to-noise ratios (SNRs) in both the system and PCP outputs are defined according to (9)
S N R y = r m s y s ( t ) r m s y p ( t ) S N R z = r m s z p ( t ) r m s z s ( t )
Rather than increasing a to improve S N R z , an alternative approach is increasing the order, n. Section 3.2 contains simulated results to demonstrate PCP design under measurement noise.
As each order doubles the period of the PRBPT, this increases the total probing latency. The latency can be lowered by reducing the bit duration, t 0 , if the limitations imposed by power electronics allow.
The power electronics switching devices used in grid-scale inverters are typically medium-voltage (600 V) Insulated-Gate Bipolar Transistors (IGBTs). Modern IGBTs for energy application have a normal switching frequency limit of 20 kHz, with a few commercial models capable of switching at 40 kHz. This places a lower bound of 25 μs on t 0 . Future devices promise faster switching frequencies [33], which would lower this bound further and allow additional flexibility in PCP signal design.
Table 2 summarizes the design trade-offs for a PCP signal.

3. Change Detection with PCP

This section will follow [26], with the goal of showing how changes in the distribution network are reflected in the PCP output. The IEEE 13-Node Distribution Test System [24], shown in Figure 3, is selected as a small example system for this purpose. [34]. Section 4 will employ a much larger test system with multiple IBRs to show islanding detection.
The probing signal is injected in series with Phase A of the voltage regulator between busses 650 and 632. The blue bounding box delineates the portion of the network being probed, and a simple model of a solar plant [35] is interconnected at bus 680, with modification to the models’ transformer and filters.

3.1. Small Signal Representation of PCP Outputs

The effective memory length of the channel between V r e g a and I 650 632 a is found in its pulse response (see Figure 2). This is obtained via simulation, yielding roughly 20 ms.
The nominal voltage for the distribution network under test is 4160 V r m s phase–phase or 3387 Volts Peak phase to ground. The amplitude of the probing signal is selected to be 10 Volts to keep the disturbance level low.
Table 3 summarizes the design of the resulting probing signal, taking the above into account, as well as the principles discussed in Section 2.1.
The filtering block in Figure 2 contains a notch filter tuned to 60 Hz. This is applied to y ( t ) prior to the cross-correlation in (5) to remove the 60 Hz component, yielding y f ( t ) .
With the notch filter applied, the PCP output z ( t ) is the current to voltage pulse response seen from node 650 looking towards 652. Using the bit duration, t 0 , as the sampling time, the values of the PCP output are exactly the Markov parameters of the system being probed, based on which the Hankel matrix [36] is readily constructed:
H ( k ) = z p ( 1 ) z p ( 2 ) . . . z p ( m ) z p ( 2 ) z p ( 3 ) . . . z p ( m + 1 ) z p ( m ) z p ( m + 1 ) . . . z p ( 2 m 1 )
Here, the number of samples m is selected such that 2 m t 0 is at least as long as the effective memory length of the system. The Hankel Matrix, expressed as in (10), captures a pulse response. The Eigensystem Realization Algorithm [29] is used to translate the pulse response into a system realization. A third-order system realization is taken to capture the dynamics of the distribution network. In general, choice of order depends on the system under test, and the level of accuracy required.
Plot A in Figure 4 shows the pulse response of the network with the addition of a 250 kW solar plant. The pulse response identified by PCP is overlaid with the true pulse response of the system. The pulse responses match well. However, the direct pulse has a small 60 Hz oscillation caused by the current injected by the solar plant, which is filtered out during probing.
The extracted pulse responses reflect changes in IBR generation, changes in load, and changes in topology. The traces in plot B of Figure 4 show the changed PCP output for each of these scenarios. It is evident from these plots that system changes are reflected in the PCP output. This concept allows for detector design, as will be shown in Section 4.

3.2. Measurement Noise and Harmonic Distortion

The addition of PCP in this example results in a signal-to-noise ratio (9) (in the current from node 650 to 632) of S N R y = 42.7 dB, well below the typical noise level in a power system, and a total harmonic distortion in phase current under 0.1%, computed according to (11)
T H D = I 2 2 + I 3 2 + I 4 2 + I 1
Here, I n represents the nth harmonic of a 60 Hz signal. The level of distortion created by PCP in this example falls within the limits outlined in IEEE standard 1547 [37].
To evaluate the performance of PCP under sensor noise, S N R z is computed using (9) under varying noise levels and several probing signal designs. Zero-mean Gaussian noise is added at the measurement of the Phase A output current ( y p ) for the system in Figure 3. This noise would be present at the input of the filtering block in Figure 2.
Two noise levels are considered. First, noise with a standard deviation equal to 0.1 percent of the peak phase current, and second, a standard deviation equal to 0.5 percent of the peak phase current. These roughly correspond to the accuracy class of a 0.1 and 0.5 current transformer, respectively, [38].
Table 4 shows the computed values of S N R z for both noise levels as the probing amplitude, a, and PRBS order, n, are varied. The trade-offs described in Table 2 are clear from the results: doubling the probing amplitude improves S N R z by roughly 6 dB, at the cost of doubling the disturbance created by the probing signal. Increasing the order by one raises the signal-to-noise ratio by about 3 dB. Assuming a fixed bit duration at the switching frequency of the available IGBTs, this doubles the probing delay.

4. Islanding Detection Results with PCP

In this section, we utilize a larger test system to demonstrate islanding detection using PCP.
The IEEE 34-bus test system [24] is modified via the addition of three three-phase solar plants. From Table 1, this test system is large compared to that used in many other active islanding detection works. It further allows the exploration of the multiple-inverter case. In this context, we define islanding detection as follows. For each IBR plant, determine whether that plant is
  • grid-connected, defined as having an electrical connection to the transmission network, represented by bus 800;
  • islanded, defined as being isolated from bus 800.
The term “plant” is used to refer to a whole IBR facility, including the inverters, step-up transformers, and the tie line to the distribution network.
A balanced sub-network, with generation equal to load, will be set up as a microgrid, with the ability to maintain operation after disconnection from the grid. This will demonstrate the microgrid compatibility of our active nu-gap-based detection, and demonstrate detection for the case of a balanced island.

4.1. Problem Setup

Each solar plant is represented by an aggregated switching inverter model, filter, and step-up transformer with equivalent grid-following current, DC voltage, and active power regulating control loops. Each solar plant is a modification of the standard model in [35], with real power and voltage control loops added.
A small induction motor load is incorporated to introduce more realistic dynamic load behavior. Figure 5 shows the topology of the modified test system, including the placement of 12 load-breaking switches, which can introduce various islanding events and non-islanding events.
From here on, we define the nominal case as the system without any open switch, and a changed case as the system with one of the twelve switch positions open.
Electromagnetic transient (EMT) simulation is performed in Simulink via the Simscape Specialized Power Systems toolbox [25] with a total simulation time of 0.5 s, and a step size of one μs. An unintentional switching action without fault is assumed to occur at 0.05 s.

4.2. PCP Signal and Injection Circuit Design

The probing input signal, or p ( t ) in Figure 2, is injected by transitioning between positive and negative DC voltage at or below the switching frequency of an inverter. The inverters are taken to be three-phase, single-step H bridges with neutral, as shown in Figure 6. Figure 6 also shows the logical implementation of the probing signal as a firing sequence for the IGBTs. On a rising edge, the first sequence signal (blue) closes switch 2, and opens switch 4, and the red signal closes switch 1 and opens switch 3 after a delay [27]. Implementation of PCP signals on a physical circuit board has been shown in [28].
Each solar plant is assigned a unique bit duration. This works to eliminate correlation in Equation (4) between the probing signals injected by the three IBRs. The parameters for each solar plant are provided in Table 5.
The order of n = 12 has been chosen to satisfy (8) and set the detection time on par with other active probing-based methods per Table 1. A lower order could be used to reduce detection time further, but the signal-to-noise ratio at the PCP output would decrease by about 3 dB per Table 4. The resulting probing periods are T p = 164 ms, 197 ms, and 223 ms, respectively, for solar plants 1, 2, and 3.
Due to the single-step H-bridge, the full DC inverter voltage is used as the probing signal magnitude. This injection methodology eliminates any need for a dedicated device to perform probing. That said, a single-stage inverter cannot both probe the system and inject real power. For a plant containing multiple inverters, at least one inverter must therefore interrupt real power injection while probing.
For multi-level or voltage source converter (VCS) inverter topologies, the signal designer has the flexibility to use only a single or a few stages for probing, while leaving the rest on pulse width modulation (PWM) control. This allows for a smaller a, and for continued active power injection whilst probing.

4.3. Nu-Gap-Based Detection Results on the 34-Bus System

Probing via PCP is performed for each possible changed system in Figure 5, and a third-order system realization is obtained. The nu-gap metric is computed via (1), comparing the changed system (resulting from an opened switch) to the nominal system. The results of this initial simulation are tabulated in Table 6, in which each column provides the results for one solar plant, and bold text indicates that the plant is islanded due to the opening of that particular switch.
In Table 6, the islanded conditions produce a nu-gap near 1, while grid-connected conditions have a nu-gap near zero. The largest nu-gap for a grid-connected topology is 0.491, from Plant 3, after the opening of switch 8. The smallest nu-gap for an islanded topology is 0.974, from Plant 3, after the opening of switch 11. We define the detector margin for the system as the difference, or 0.483.
The detector margin guarantees a level of robust islanding detection in the face of load change and/or modeling error. If the system is known, the detection threshold can be placed anywhere between, say, 0.50 and 0.95, without causing false alarm or missed detection errors.
The most distant grid-connected topology was loss of the 4.8 kV sub-network, including the added induction motor load at bus 890, from the perspective of Plant 3. Plant 3 is connected at a traditionally weak bus in the network, far from the infinite bus at bus 800. By “weak bus” in this context, we mean that bus 840 has a low short circuit ratio [39] relative to the rest of the network.
A threshold-based detector is implemented by probing the system and computing the nu-gap against the PCP-generated model for the nominal system. If the nu-gap is larger than a chosen threshold of 0.9, the plant is declared islanded.
Figure 7 provides a flowchart for the islanding detection method. z ( t ) is the output of Pulse Compression Probing, at the top-right of Figure 2.
A total of 300 independent Monte-Carlo simulations are carried out to verify the operation of the active nu-gap-based islanding detection scheme under varying loading conditions. In each replication, a random scaling factor between 0.5 and 1.5 is assigned to each load, and a random switch is opened after 0.16 s. Table 7 shows the results of this simulation.
All three plants correctly identified their islanded or grid-connected state in all replications. This is due to the large separation in Table 6. To cause a false alarm error, or missed detection error, an unexpected system disturbance would need to substantially change the network, as seen by each plant. There is no design trade-off for the detector in this example because the distributions of nu-gaps for islanded and grid-connected states do not overlap for any reasonable level of load variation. Larger and more complex systems may see smaller margins, and have a detector design trade-off as load variation is considered.

4.4. Case Study for an Island with Balanced Generation and Load

To show the microgrid comparability of active nu-gap-based detection, and its ability to handle the balanced island case, a balanced island is constructed with generation equal to load, as shown in Figure 8.
For a network the size of the IEEE 34-bus test system, switching transients can be large. VAR demands are high for scenarios that cause the loss of transformers, or the large shunt capacitor banks at busses 844 and 848. To create a case where a switch can open smoothly, a small subset of the network is taken. A small synchronous machine is added, as shown in Figure 8. The addition of this machine ensures that a voltage reference is present for the grid-following inverter controls to track.
Two IBR plants, Plant 3 and Plant 4, are placed in proximity at busses 840 and 860. Figure 9 shows the dynamic behavior of the island with these two IBR facilities in place, after switch 11 is opened. The measured voltage and frequency are compared with the most conservative protection settings available in IEEE 1547 [37]. From Figure 9, the voltage, frequency, and power responses of the island remain well within acceptable limits. In other words, protection-based passive islanding detection methods could not detect this island: it would be within the non-detection zone.
To test the effectiveness of active nu-gap-based detection on this balanced island case, the probing signal parameters from Table 5 are retained, with Plant 4 being assigned a bit duration of 64 μs for this simulation. Probing is taken to be initiated by the transient disturbance in voltage and measured active power, and commences at 0.2 s.
Figure 10 visualizes the nu-gap computation for both topology changes. Equation (1) is evaluated at each frequency, comparing the system model obtained via PCP for the nominal system and the changed system. This computation extends to high frequencies, highlighting the importance of a small bit duration to more accurately compare high-frequency behavior. The high-frequency information has the highest gap, meaning the islanded system is most apparent to high-frequency signals. This phenomenon was also observed in [11], where high-frequency content was the most valuable information for islanding detection.
Table 8 shows the nu-gap metric between the nominal system and each of the studied changed systems.
From Table 8, the balanced island caused by opening switch 11 is clearly detectable, as indicated by a large nu-gap from the nominal case. The grid-connected event of opening switch 12 has a small nu-gap. This confirms that balanced island scenarios do not create a non-detection zone.
The slightly reduced nu-gap in Plant 3 compared to Table 6 is best explained by the effect of the small synchronous machine, which improves grid strength on the island by raising short circuit ratios.
Continuing the simulation with the network in Figure 8, Table 9 shows the nu-gap metric for opening switch 11 and 12 as the R/X ratio of the lines varies.
The islanded case caused by opening switch 11 remains distinct for all tested R/X ratios. For the highly resistive cases, the nu-gap for the grid connected case caused by opening switch 12 grows larger. This growth is attributed to the influence of the resistance on the frequency response of the network. As shown in Figure 10, the nu-gap for an islanded scenario tends to achieve its highest value at high frequency. Having less inductance in the grid lowers the frequency dependence of the overall system impedance, leading to a peak nu-gap at slightly lower frequencies.

4.5. PCP Disturbance on the Balanced Case

Figure 11 shows the frequency content at bus 860 for the nominal system at Plants 3 and 4. With PCP in place, an overall increase in the off-nominal frequency content is evident. The distortion from PCP is spread across the spectrum rather than at particular harmonics, due to the broadband frequency contents of the PRBS [31]. The maximum total harmonic distortion observed during probing injection is under 3%, which meets IEEE Standard 1547 [37].
This moderate level of noise in comparison to the large magnitude of the probing signal (the full inverter voltage was used as the magnitude, a) is attributed to the wide frequency spectrum of the PRBS signal, with higher frequencies diminishing in magnitude through reactive filters and transformers.

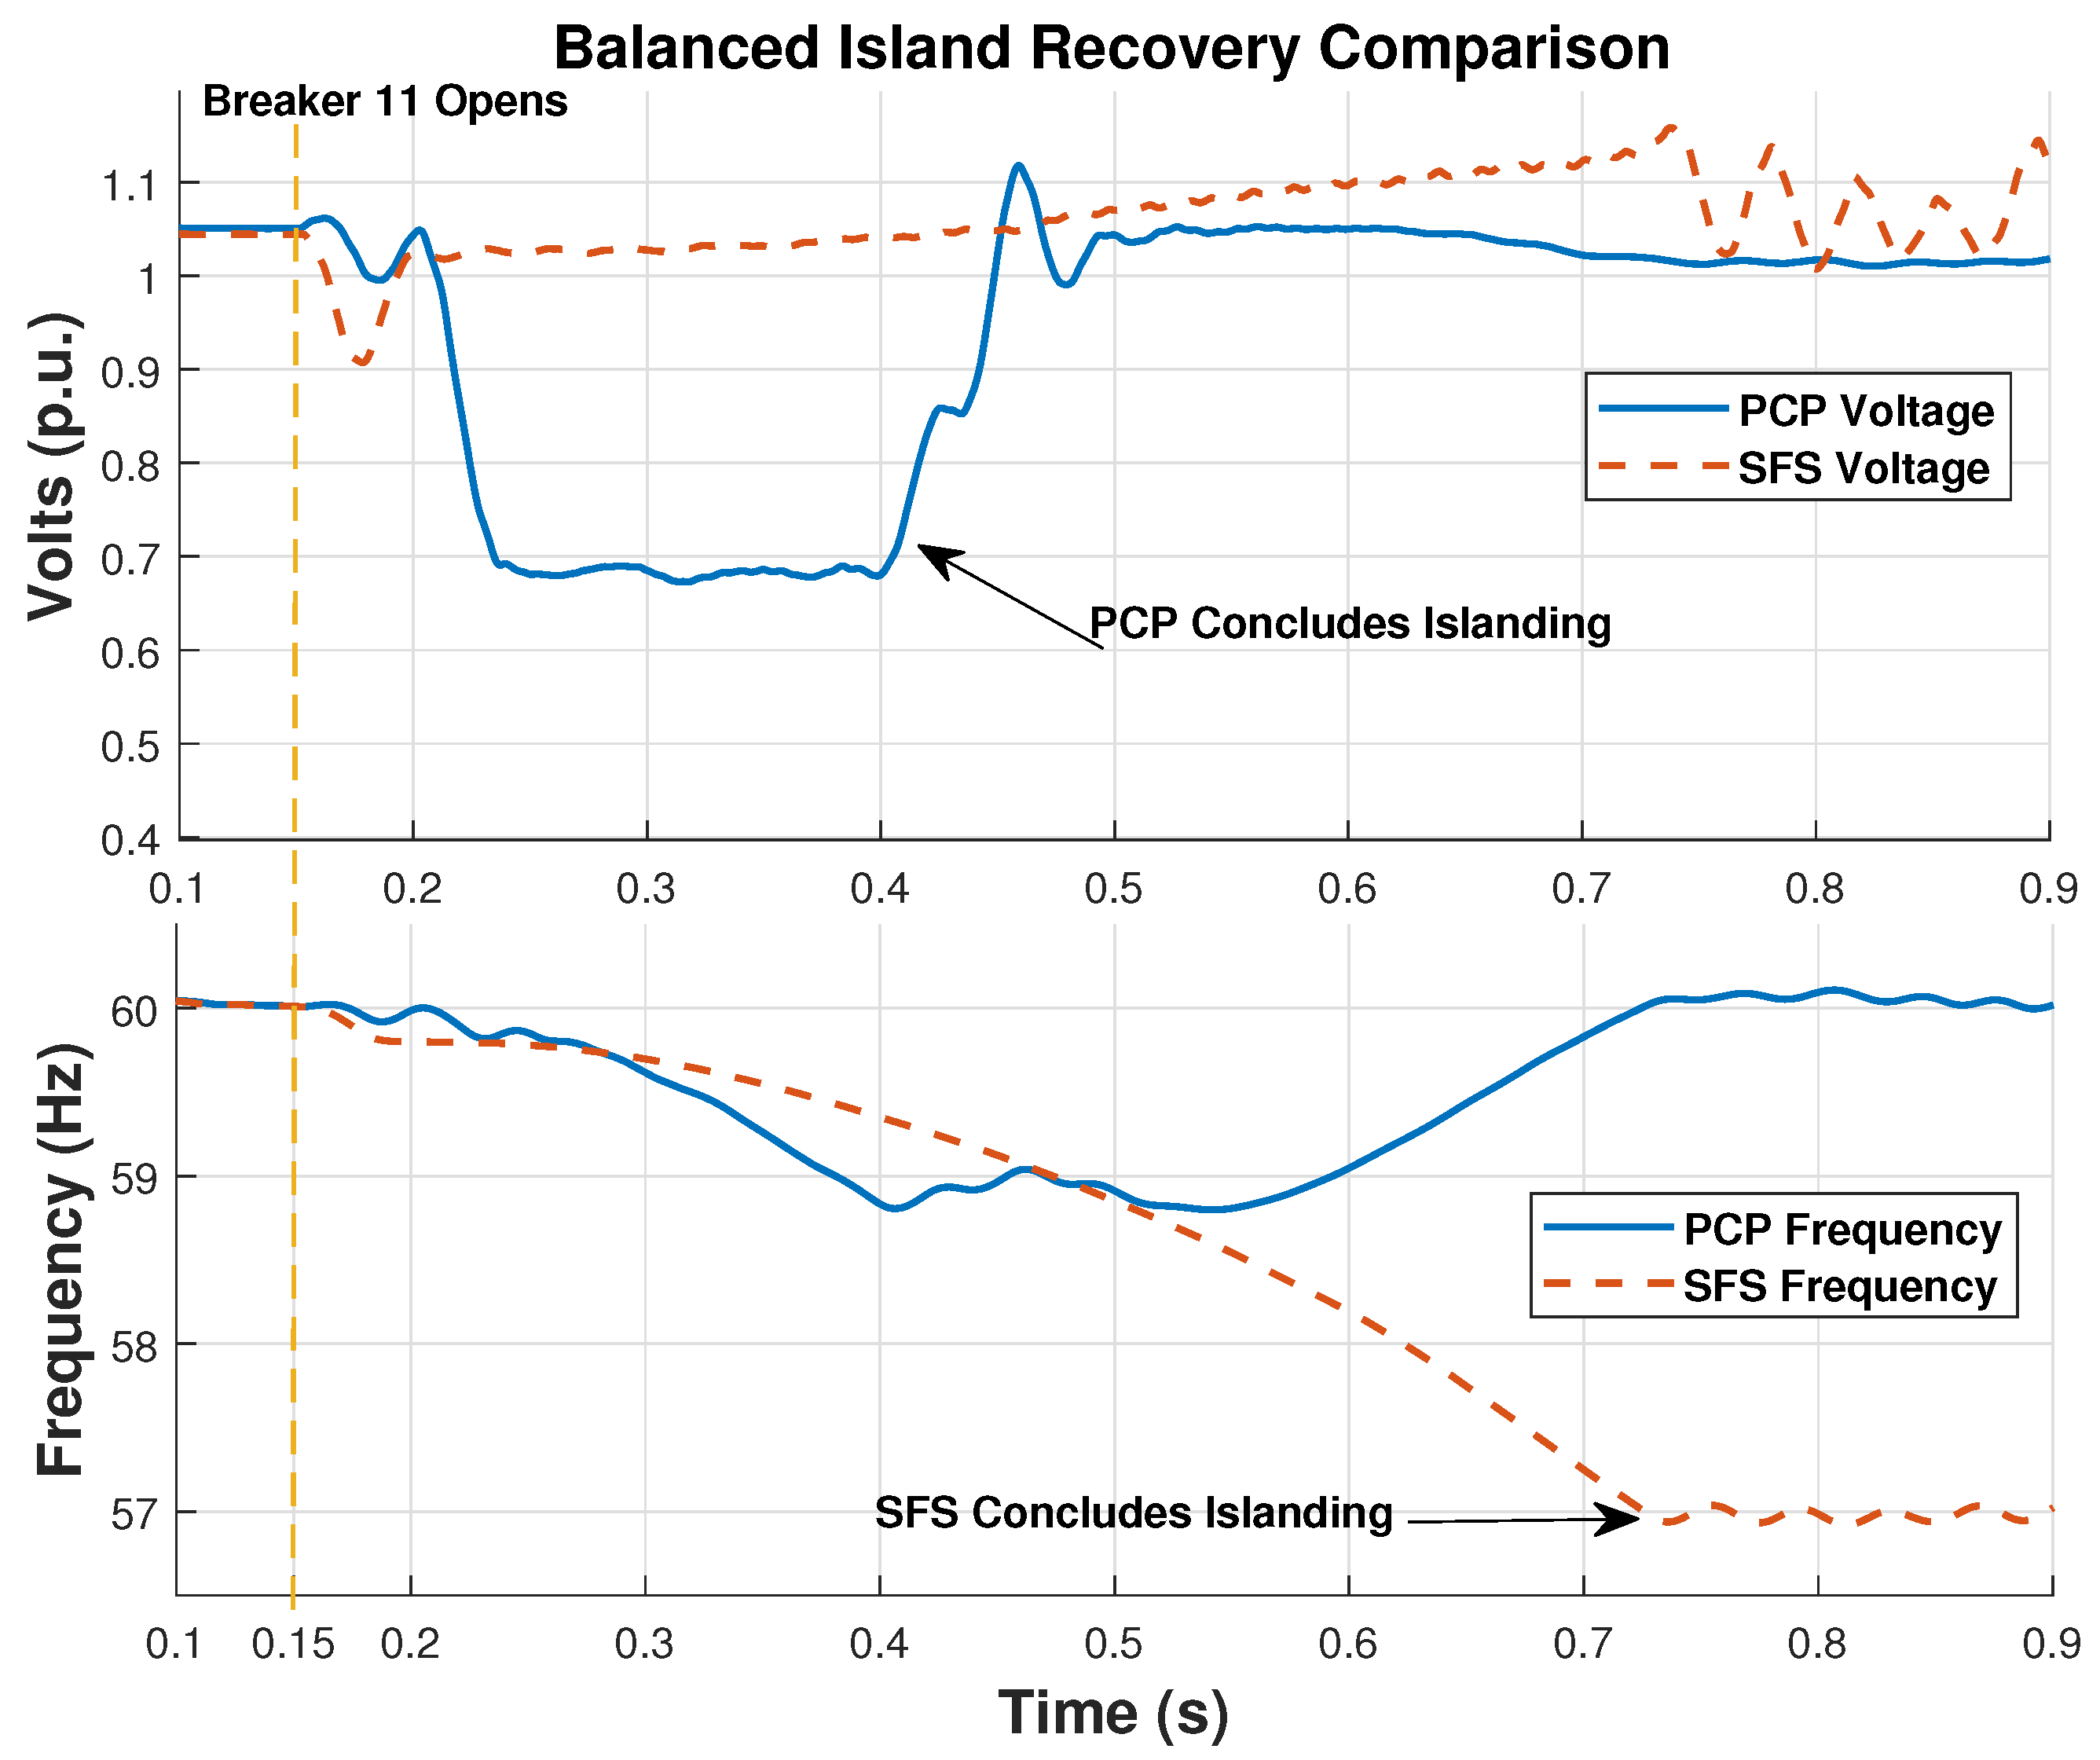
4.6. Performance vs. Sandia Frequency Shift

To highlight the advantages of PCP and active nu-gap-based detection, a comparative case is drawn using the balanced island scenario in Figure 8. Sandia Frequency Shift (SFS) [17], from Ref. [22], is implemented for side-by-side comparison with PCP.
SFS is chosen for this comparison over the other methods in Table 1 for the following reasons:
  • It works for most multiple inverter cases without needing a communication network. Methods like negative sequence injection [18] and d-q reactive power [19] are meant for a single inverter only. Impedance Angle Measurement [21] and d-q real power [10] require a communications infrastructure to handle multiple inverters.
  • It requires no special hardware to implement, so we can test it on the same system as PCP, using the inverters themselves as signal injection points. Harmonic Profile Injection [20] requires a multi-level voltage source converter, so it cannot be applied to the single-stage inverters in this study. High-Frequency Impedance Estimation [11] requires a special injection device to be constructed and added to the network.
For the implementation of SFS, an aggressive gain of 0.10 and a chopping fraction of 0.001 are selected.
Following the opening of switch 11, the balanced island can be considered a microgrid, consisting of inverter-based solar, a small synchronous machine, and load. We look to recover the grid and operate in islanded mode following the event, meeting "Microgrid Compatibility" in Table 1. This is achieved by changing control parameters as soon as an island is detected. For PCP, controls are switched as soon as the method identifies a nu-gap of 0.9 or larger. For SFS, controls are switched as soon as the frequency crosses 61.8 Hz or 57 Hz. Figure 12 shows the frequency and voltage at Bus 860 for both scenarios.
PCP begins at 0.2 s, and a transient under voltage occurs due to the two IBRs injecting the probing signal rather than active power. Following island identification at 0.397 s (Plant 4) and 0.423 s (Plant 3), the grid voltage and frequency are quickly recovered.
SFS struggles in this scenario, as frequency droop control from the synchronous machine counteracts the positive feedback introduced by SFS. As a result, it takes just over 570 ms to reach the frequency threshold. Afterward, the frequency plateaus near 57 Hz and a voltage oscillation persists.
Figure 12 highlights an important part of islanding detection on a microgrid. Because microgrids should have a stable islanded operation, any implemented islanding detection scheme must leave the system in a recoverable state. Methods such as SFS [17], Reactive Power Control [21], and Harmonic Injection [20] detect an island by driving the island unstable, or at the very least, setting the island on an unstable trajectory. Such a trajectory may not be recoverable. PCP offers the fast response and zero non-detection zone of active methods without compromising island stability.
Other methods offering microgrid compatibility either require GPS coordination [10], show worse performance as inverters are added [11], or leave scenarios with multiple IBRs out of consideration altogether [19]. PCP requires no communication or special hardware, and is explicitly designed and tested to handle multiple IBRs in the same network.

5. Conclusions

This work applies PCP to establish an equivalent model of a distribution network as seen by an IBR. It then develops an active nu-gap-based islanding detection scheme.
PCP is implementable on present converter technology. The developed scheme is verified via EMT simulation on a modified IEEE 34-bus distribution test system [24], demonstrating islanding detection in 167–223 ms. This is achieved for three inverters without additional devices or cooperation. The scheme, furthermore, meets the needs of microgrids, with a disturbance level well within grid code [37].
One important consideration is that under the present injection methodology, real power injection from an IBR is zero while probing. Future work will involve probing with multistage converters, which will allow a single inverter to probe with only a portion of its full DC voltage. Deriving a direct relationship between grid strength and the nu-gap metric is also an ongoing effort which may have broad applications for the connection of IBRs in distribution networks.

Author Contributions

N.P. Conceptualization, methodology, software, writing—original draft. N.E.W. Conceptualization, methodology, supervision, writing—review and editing. M.S.: Conceptualization, methodology, writing—review and editing. All authors have read and agreed to the published version of the manuscript.

Funding

This research received no external funding.

Data Availability Statement

The original data presented in the study are openly available in the MATLAB Central File Exchange at https://www.mathworks.com/matlabcentral/fileexchange/178099-pulse-compression-probing-islanding-detection-data.

Conflicts of Interest

The authors declare no conflicts of interest.

Abbreviations

The following abbreviations are used in this manuscript:
EMTelectromagnetic transient
ERAEigensystem Realization Algorithm
GPSglobal positioning system
IBRinverter-based resource
IEEEInstitute of Electrical and Electronics Engineers
IGBTInsulated-Gate Bipolar Transistor
PCPPulse Compression Probing
PRBPTpseudo-random binary pulse train
PRBSpseudo-random binary sequence
PWMpulse width modulation
SFSSandia Frequency Shift
SNRsignal-to-noise ratio
THDtotal harmonic distortion
Operators:
convolution
cross-correlation
Functions:
δ ( · ) Dirac delta function
H ( k ) Hankel matrix of a discrete-time series
ψ ( · , · ) point-wise nu-gap function, as seen in (1)
r m s ( · ) root mean square
Time Series:
h ( t ) impulse response/pulse response
η ( t ) rectangular pulse
p ( t ) pseudo-random binary pulse train (probing signal)
s ( t ) cyclic repetition of a probing signal
σ ( t ) pseudo-random binary sequence
u ( t ) system nominal input
y ( t ) system output
y f ( t ) filtered system output
y p ( t ) system output due to probing signal
y s ( t ) system output due to nominal inputs
z ( t ) probing output
z p ( t ) probing output due to probing signal
z s ( t ) probing output due to nominal inputs
Parameters:
aprobing signal magnitude
mnumber of samples for system realization
nprobing signal order
t 0 bit duration
T p probing signal period
V d c + positive DC source voltage
V d c negative DC source voltage
Variables:
δ ν nu-gap
I i n v a Phase A inverter current
I j current in jth harmonic of 60 Hz
kindex variable
Mmemory length
S N R y system signal-to-noise ratio
S N R z probing signal-to-noise ratio
ttime
ω frequency
ω B system bandwidth
V i n v a Phase A inverter terminal voltage

References

  1. Bekhradian, R.; Sanaye-Pasand, M. A Comprehensive Survey on Islanding Detection Methods of Synchronous Generator-Based Microgrids: Issues, Solutions and Future Works. IEEE Access 2022, 10, 76202–76219. [Google Scholar] [CrossRef]
  2. Independent System Operator New England. 2023 Regional System Plan; Technical Report; Independent System Operator New England: Holyoke, MA, USA, 2023. [Google Scholar]
  3. Resende, E.C.; Simoes, M.G.; Freitas, L.C.G. Anti-Islanding Techniques for Integration of Inverter-Based Distributed Energy Resources to the Electric Power System. IEEE Access 2024, 12, 17195–17230. [Google Scholar] [CrossRef]
  4. Vinnicombe, G. Frequency domain uncertainty and the graph topology. IEEE Trans. Automat. Contr. 1993, 38, 1371–1383. [Google Scholar] [CrossRef]
  5. Baghaee, H.R.; Mlakić, D.; Nikolovski, S.; Dragicević, T. Support Vector Machine-Based Islanding and Grid Fault Detection in Active Distribution Networks. IEEE J. Emerg. Sel. Top. Power Electron. 2020, 8, 2385–2403. [Google Scholar] [CrossRef]
  6. Matic-Cuka, B.; Kezunovic, M. Islanding Detection for Inverter-Based Distributed Generation Using Support Vector Machine Method. IEEE Trans. Smart Grid 2014, 5, 2676–2686. [Google Scholar] [CrossRef]
  7. Gomes, E.A.; Vieira, J.C.; Coury, D.V.; Delbem, A.C. Islanding detection of synchronous distributed generators using data mining complex correlations. IET Gener. Transm. Distrib. 2018, 12, 3935–3942. [Google Scholar] [CrossRef]
  8. Igbineweka, E.; Chowdhury, S. Application of Dual-Tree Complex Wavelet Transform in Islanding Detection for a Hybrid AC/DC Microgrid with Multiple Distributed Generators. Energies 2024, 17, 5133. [Google Scholar] [CrossRef]
  9. Salman, M. Application of Multiple Model Filters to Fault Diagnosis and Islanding Detection in Electric Grids. Ph.D. Thesis, State University of New York at Binghamton, Binghamton, NY, USA, 2020. [Google Scholar]
  10. Sivadas, D.; Vasudevan, K. An Active Islanding Detection Strategy with Zero Nondetection Zone for Operation in Single and Multiple Inverter Mode Using GPS Synchronized Pattern. IEEE Trans. Ind. Electron 2020, 67, 5554–5564. [Google Scholar] [CrossRef]
  11. Jia, K.; Wei, H.; Bi, T.; Thomas, D.W.P.; Sumner, M. An Islanding Detection Method for Multi-DG Systems Based on High-Frequency Impedance Estimation. IEEE Trans. Sustain. Energy 2017, 8, 74–83. [Google Scholar] [CrossRef]
  12. Bei, T.Z. Accurate active islanding detection method for grid-tied inverters in distributed generation. IET Renew. Power Gener. 2017, 11, 1633–1639. [Google Scholar] [CrossRef]
  13. Timbus, A.; Oudalov, A.; Ho, C.N. Islanding detection in smart grids. In Proceedings of the 2010 IEEE Energy Conversion Congress and Exposition, Atlanta, GA, USA, 12–16 September 2010; pp. 3631–3637. [Google Scholar] [CrossRef]
  14. Bower, W.; Ropp, M. Evaluation of Islanding Detection Methods for Utility-Interactive Inverters in Photovoltaic Systems; Technical Report; Sandia National Laboratories: Livermore, CA, USA, 2002.
  15. Amini, H.; Mehrizi-Sani, A.; Noroozian, R. Passive Islanding Detection of Inverter-Based Resources in a Noisy Environment. Energies 2024, 17, 4405. [Google Scholar] [CrossRef]
  16. Li, M.; Chen, A.; Liu, P.; Ren, W.; Zheng, C. Multivariable Algorithm Using Signal-Processing Techniques to Identify Islanding Events in Utility Grid with Renewable Energy Penetration. Energies 2024, 17, 877. [Google Scholar] [CrossRef]
  17. Ropp, M.; Begovic, M.; Rohatgi, A. Analysis and performance assessment of the active frequency drift method of islanding prevention. IEEE Trans. Energ. Convers. 1999, 14, 810–816. [Google Scholar] [CrossRef]
  18. Karimi, H.; Yazdani, A.; Iravani, R. Negative-Sequence Current Injection for Fast Islanding Detection of a Distributed Resource Unit. IEEE Trans. Power Electron. 2008, 23, 298–307. [Google Scholar] [CrossRef]
  19. Zhu, Y.; Xu, D.; He, N.; Ma, J.; Zhang, J.; Zhang, Y.; Shen, G.; Hu, C. A Novel RPV (Reactive-Power-Variation) Anti-islanding Method Based on Adapted Reactive Power Perturbation. IEEE Trans. Power Electron. 2013, 28, 4998–5012. [Google Scholar] [CrossRef]
  20. Dhar, S.; Dash, P.K. Harmonic Profile Injection-Based Hybrid Active Islanding Detection Technique for PV-VSC-Based Microgrid System. IEEE Trans. Sustain. Energy 2016, 7, 1473–1481. [Google Scholar] [CrossRef]
  21. Yang, F.; Lei, Y.; Chen, H.; Yang, Z.; Xu, H.; Chen, H.; Chen, Y. An Anti-Islanding Protection Method Based on Voltage-Synchronous Impedance Angle Measurements. Energies 2023, 16, 7139. [Google Scholar] [CrossRef]
  22. Khodaparastan, M.; Vahedi, H.; Khazaeli, F.; Oraee, H. A Novel Hybrid Islanding Detection Method for Inverter-Based DGs Using SFS and ROCOF. IEEE Trans. Power Deliv. 2017, 32, 2162–2170. [Google Scholar] [CrossRef]
  23. Wu, N.E.; Huang, J. On-line impulse response extraction of a power transfer path using pulse compression probing. In Proceedings of the 2014 American Control Conference, Portland, OR, USA, 4–6 June 2014; pp. 1346–1351. [Google Scholar] [CrossRef]
  24. Kersting, W. Radial distribution test feeders. In Proceedings of the 2001 IEEE Power Engineering Society Winter Meeting, Columbus, OH, USA, 28 January–1 February 2001; Volume 2, pp. 908–912. [Google Scholar] [CrossRef]
  25. The MathWorks Inc. Specialized Power Systems Toolbox, R2024b; The MathWorks Inc.: Natick, MA, USA, 2024.
  26. Piaquadio, N.; Wu, N.E.; Sarailoo, M.; Huang, J. Pulse Compression Probing for Tracking Distribution Feeder Models. In Proceedings of the 2023 IEEE Power & Energy Society General Meeting, PESGM, Orlando, FL, USA, 16–20 July 2023; pp. 1–5. [Google Scholar] [CrossRef]
  27. Piaquadio, N.; Wu, N.E.; Sarailoo, M. Active Islanding Detection Using Pulse Compression Probing. In Proceedings of the 2024 IEEE Power & Energy Society General Meeting, PESGM, Seattle, DC, USA, 21–25 July 2024; pp. 1–5. [Google Scholar]
  28. Wu, N.E.; Ruschmann, M.C.; Huang, J.; Huang, K. Probing the NASA Generic Transport Aircraft in Real-Time for Health Monitoring. IEEE Trans. Control Syst. Technol. 2011, 19, 1288–1295. [Google Scholar] [CrossRef]
  29. Juang, J.; Pappa, R. An Eigensystem Realization Algorithm (ERA) for Modal Parameter Identification and Model Reduction. J. Guid. Control Dyn. 1985, 8, 620–627. [Google Scholar] [CrossRef]
  30. Zhou, K.; Doyle, J.C. Essentials of Robust Control, 1st ed.; Prentice Hall: Hoboken, NJ, USA, 1999. [Google Scholar]
  31. Ljung, L. System Identification: Theory for the User; Prentice-Hall, Inc.: Upper Saddle River, NJ, USA, 1999. [Google Scholar]
  32. Wu, N.E.; Wang, X. A pulse-compression method for process monitoring. In Proceedings of the 2001 American Control Conference, Arlington, VA, USA, 25–27 June 2001; Volume 3, pp. 2127–2130. [Google Scholar] [CrossRef]
  33. Zhang, L.; Yuan, X.; Wu, X.; Shi, C.; Zhang, J.; Zhang, Y. Performance Evaluation of High-Power SiC MOSFET Modules in Comparison to Si IGBT Modules. IEEE Trans. Power Electron. 2019, 34, 1181–1196. [Google Scholar] [CrossRef]
  34. Tartakovsky, A.; Nikiforov, I.; Basseville, M. Sequential Analysis: Hypothesis Testing and Changepoint Detection, 1st ed.; Chapman & Hall/CRC: Boca Raton, FL, USA, 2014. [Google Scholar]
  35. Giroux, P.; Sybille, G.; Osorio, C.; Chandrachood, S. Grid-Connected PV Array. MATLAB Central File Exchange. 2012. [Google Scholar]
  36. Chen, C.T. Linear System Theory and Design, 3rd ed.; Oxford University Press: New York, NY, USA, 1999. [Google Scholar]
  37. IEEE Std 1547-2018; IEEE Standard for Interconnection and Interoperability of Distributed Energy Resources with Associated Electric Power Systems Interfaces. IEEE: Piscataway, NJ, USA, 2003.
  38. General Electric Grid Solutions. Protection Automation Application Guide; General Electric: Sesto San Giovanni, MI, Italy, 2016. [Google Scholar]
  39. Saadat, H. Power System Analysis; WCB/McGraw-Hill: New York, NY, USA, 1999. [Google Scholar]
Figure 1. Top: One period of σ ( t ) , a discrete-time impulsive pseudo-random binary sequence (PRBS) [31] of order n = 6. Bottom: p ( t ) , the corresponding continuous-time pseudo-random binary pulse train (PRBPT) [28].
Energies 18 03354 g001
Figure 2. Block diagram illustrating the process of PCP [27] and signals drawn from probing the IEEE 13-Node Distribution Test System [24] with an added IBR. The bandwidth, ω B , and memory length, M, of the distribution network, as seen from the probing IBR, are highlighted. Both are important in selecting probing signal parameters.
Energies 18 03354 g002
Figure 3. The 13-Node Distribution Test System [24] with the addition of 250 kW of Solar IBR at bus 680. The probing signals for PCP [26] are labeled at the voltage regulator.
Energies 18 03354 g003
Figure 4. (A) Time-domain comparison of the Phase A pulse response obtained via direct simulation and via PCP [26]. (B) PCP-generated pulse response under several system changes.
Energies 18 03354 g004
Figure 5. Modified IEEE 34-bus test system [24] used for islanding detection [27]. Added load-breaking switches are indicated by numbered yellow boxes, and phase information is represented by the color of each line/bus.
Energies 18 03354 g005
Figure 6. Single-phase view of the logical implementation of the probing signal in the firing sequence of an IGBT-based H-bridge inverter with neutral [27].
Energies 18 03354 g006
Figure 7. Flowchart for the islanding detection process, after PCP has been completed including ERA [29].
Energies 18 03354 g007
Figure 8. Single-phase view of a balanced island consisting of 5 busses. Switch 11 is moved to the opposite end of bus 860 such that the bus belongs to the island.
Energies 18 03354 g008
Figure 9. One-cycle averaged rms voltage (top), frequency (middle), and plant power (bottom) for opening switch 11 in the balanced islanded scenario, with generation equal to load. Measurements taken are compared to the standards set forth in IEEE standard 1547 [37].
Energies 18 03354 g009
Figure 10. Computation of the nu-gap from the perspective of Plant 4 in Figure 8. Using the system realizations from the PCP output, Equation (1) is evaluated point-by-point.
Energies 18 03354 g010
Figure 11. Harmonic content with and without probing for the balanced island case, measured at bus 860. The 60 Hz component is omitted to allow a clear view of all available harmonic data.
Energies 18 03354 g011
Figure 12. System recovery at Bus 860, for an island created by opening switch 11 at time t = 0.15 s. The 1-cycle averaged frequency and RMS voltage are shown for PCP and SFS [17].
Energies 18 03354 g012
Table 2. Design trade-offs for PCP [32].
CriteriaMagnitudeOrderBit Duration
High S N R y Small--
High S N R z LargeLarge-
Low Probing Latency-SmallSmall
High Probing Resolution--Small
Low Switching Frequency--Large
Table 3. Parameters of selected probing signal.
Probing ParameterSymbolValue
Bit Duration t 0 100 μs
PRBPT Ordern12
PRBPT Magnitudea10 Volts
Probing Period T p 0.4095 s
Table 4. Probing output S N R z in d B with measurement noise for the IEEE 13-Node Distribution Test System.
0.1% a = 10 a = 20 a = 40 a = 80 a = 160 0.5% a = 10 a = 20 a = 40 a = 80 a = 160
n = 1223.5329.9336.1042.0748.39n = 1210.5715.9122.4228.3034.16
n = 1325.8433.4338.9745.1650.88n = 1313.1819.2024.6430.5137.06
n = 1430.2036.1642.2948.1254.32n = 1416.5121.7427.8035.3640.48
Table 5. Parameters of selected probing signal [27].
Probing ParameterSymbolValue
Bit Duration (Plant 1) t 0 40 μs
Bit Duration (Plant 2) t 0 48 μs
Bit Duration (Plant 3) t 0 56 μs
PRBPT Ordern12
Inverter DC Voltagea600 Volts
Table 6. Nu-gap to intact system. Islanded topologies in bold [27].
Open SwitchPlant 1Plant 2Plant 3
10.9810.9890.977
20.0680.0390.117
30.0820.9880.977
40.0700.0510.242
50.0690.0410.153
60.0670.0420.106
70.0730.0280.976
80.0710.0440.491
90.0680.0410.114
100.0690.0270.116
110.0720.0410.974
120.0680.0390.149
Table 7. Summary of islanding detection results.
Open SwitchNumber of ReplicationsReplications where Plant 1 Detects an IslandReplications where Plant 2 Detects an IslandReplications where Plant 3 Detects an Island
None18000
122222222
225000
32602626
425000
521000
616000
7310031
820000
916000
10370037
1124000
1219000
Table 8. Nu-gap to intact system for the balanced case.
Open SwitchPlant 3Plant 4
110.9660.994
120.0080.046
Table 9. Impact of varying R/X ratio.
R/X RatioPlant 3Plant 4
Open Switch:11121112
11.110.9510.1440.9970.268
5.560.9830.0880.9960.051
2.780.9640.0830.9950.072
1.830.9640.0120.9950.031
1.360.9660.0080.9940.046
0.680.9760.1220.9940.029
Disclaimer/Publisher’s Note: The statements, opinions and data contained in all publications are solely those of the individual author(s) and contributor(s) and not of MDPI and/or the editor(s). MDPI and/or the editor(s) disclaim responsibility for any injury to people or property resulting from any ideas, methods, instructions or products referred to in the content.

