Article

Conjugate Heat Transfer Modelling in a Centrifugal Compressor for Automotive Applications

by
Carlo Cravero
1,
Pierre-Alain Hoffer
2,
Davide Marsano
1,*,
Daniele Mattiello
2 and
Luigi Mosciaro
2
1
Dipartimento di Ingegneria Meccanica, Energetica, Gestionale e dei Trasporti (DIME), Università degli Studi di Genova, Via Montallegro 1, 16145 Genoa, Italy
2
Ferrari SpA, Via Abetone Inferiore 4, 41053 Maranello, MO, Italy
*
Author to whom correspondence should be addressed.
Energies 2025, 18(13), 3348; https://doi.org/10.3390/en18133348
Submission received: 26 May 2025 / Revised: 11 June 2025 / Accepted: 23 June 2025 / Published: 26 June 2025

Abstract

In the automotive industry, the increasing stringent standards to reduce fuel consumption and pollutant emissions has driven significant advancements in turbocharging systems. The centrifugal compressor, as the most widely used power-absorbing machinery, plays a crucial role but remains one of the most complex components to study and design. While most numerical studies rely on adiabatic models, this work analyses several Computational Fluid Dynamics (CFD) models with conjugate heat transfer (CHT) of varying complexity, incorporating real solid components. This approach allowed a sensitivity analysis of the performance obtained from the different models compared to the adiabatic case, highlighting the effects of internal heat exchange losses. Moreover, an analysis of the temperature distribution of the wheel was conducted, along with a thermal assessment of the various heat flux contributions across the different components, to gain a deeper understanding of the performance differences. The impact of including the seal plate has been evaluated and different boundary conditions on the seal plate have been tested to assess the uncertainty in the results. Finally, the influence of heat exchange between the shroud and the external environment is also examined to further refine the model’s accuracy. One of the objectives of this work is to obtain a correct temperature profile of the rotor for a subsequent thermo-mechanical analysis.

1. Introduction

Turbocharging is one of the most strategic technologies to integrate into an internal combustion engine. It allows to reach higher specific output powers, in way to reduce the pollutant emissions and the related consumption, satisfying the recent standards [1]. The centrifugal compressor is the power-absorbing component of this system, thanks to its inherent ability to achieve a high pressure ratio despite its compact size. The design objectives of this compressor focus on achieving high performance and a wide operating range, which is constrained by choking at high mass flow rates and surge at low mass flow rates. For this reason, over the years an extensive research activity has been carried out, aimed at understanding the fluid dynamic phenomena under different operating conditions in order to be able to optimize this component [2,3,4,5] and to extend its operating range [6,7,8].
During the compression there is a strong internal heat exchange, due to uneven temperature distribution, which can have a significant impact on the performance [9]. So, the heat transfer effect on the compressor originated great interest. Rautenberg et al. [10] evaluated the heat transfer, which has been also evaluated more recently [11,12]. The external heat transfer influence has been evaluated experimentally [13,14,15]. The influence on the turbocharger efficiency was confirmed by Jung et al. [16] who compared a large experimental dataset. Aghaali [17] developed a 1D model for a turbocharged engine, which revealed substantial heat transfer between the turbine and the bearing housing. Later, Bohn enhanced this approach by incorporating a more detailed 3D model that accounts for conjugate heat transfer (CHT), which was then integrated into a one-dimensional framework [18]. Numerous researchers tried to quantify the non-adiabatic phenomena in the compressor, including the internal heat leakage [19,20,21]. Moosania and Zheng [22] assessed the impact of heat leakage through the solid impeller and casing on compressor performance using a three-dimensional numerical model. Similarly, Gu [23] analyzed the influence of internal heat transfer across various components, demonstrating a reduction in compressor efficiency of approximately 1%. Cui [24] quantified the amount of heat circulating with respect to the input energy. Diefenthal et al. [25] applied thermocouples on the turbine wheel and shaft to use the temperature measured as boundary conditions for numerical investigations. Roclawski et al. [26] presented a conjugate heat transfer analysis for predicting the temperature load on compressor wheels for turbochargers. Some 1D heat transfer models of the turbocharger system have been presented. Romagnoli and Martinez-Botas [27] introduced an algorithm for calculating the heat transfer through the turbocharger, along with a new correlation for the compressor’s non-adiabatic efficiency. Cormerai et al. [28] proposed a heat transfer model to estimate the temperature difference between the exhaust and intake manifolds. Abdel-Hamid et al. [29] measured turbocharger performance at low rotational speeds and developed a method to predict turbine and compressor performance under non-adiabatic conditions. Chapman et al. [30] used finite element analysis to study heat fluxes within the main components of a turbocharger, revealing that the external heat transfer in the turbine is two orders of magnitude higher than in the compressor.
The exponential growth of hardware resources has allowed to integrate the CFD simulations into design and analysis of turbomachinery. The same researchers carried out unsteady simulations of conditions near surge in centrifugal compressors with vaned diffusers [31]. In their earlier works, they introduced several techniques for predicting the critical mass flow rate at surge points, utilizing an efficient and simple 3D CFD method during the design and development phases of a compressor stage [32,33]. Furthermore, they examined ways to enhance the surge margin in centrifugal compressors through the use of casing treatment methods [34]. An in-depth fluid dynamics analysis of a two-stage radial compressor with refrigerant gas under near-surge conditions has been performed [35]. Machine learning models have been developed to detect instability [36,37]. CFD analysis can be performed also for aeroacoustics applications in radial blowers [38]. However, CFD simulations in turbomachinery do not consider the heat transfer due to the high velocities of the flows. In this paper, different CHT models have been developed to consider the conjugate heat transfer between the fluid domain and the solid components of an automotive centrifugal compressor. A first model includes the solid components of the rotor, while the second, more complete, model also includes the seal plate. The main objective is to determine the differences in the performance obtained between the CHT models and an adiabatic one, under different operating conditions already at the design speed. Subsequently, a thermal analysis has been carried out to better understand the identified performance variations through temperature distributions and the investigation of the contributions of thermal flux. Finally, some different boundary conditions have been simulated to evaluate the possible uncertainty in the results, in particular regarding the seal plate and secondly regarding the shroud. The aim is to find the most accurate temperature distribution on the rotor for a subsequent structural analysis with the appropriate thermo-mechanical load. In fact, accurate rotor temperature profiles are crucial for thermo-mechanical analyses, as they enable more reliable predictions of thermal stresses, fatigue life and structural deformations in rotating components.

2. Reference Case

The case study focuses on a compact centrifugal compressor designed for an automotive turbocharging system. As the compressor design is proprietary and protected by a non-disclosure agreement, the geometric parameters are shared in a non-dimensional format, based on the inlet diffuser radius, R4. Additionally, some numerical values are either presented in their corrected form (divided by the corresponding design specifications) or left out entirely to maintain confidentiality. This particular compressor, which is fitted with a vaneless diffuser, consists of six main blades and six splitter blades, all designed with a backswept configuration. The detailed geometric and performance data, therefore, are selectively provided to ensure that sensitive information is not disclosed. For the purpose of this work, the back cavity, i.e., the fluid domain between the back face of the rotor and the seal plate, has been included. Conversely, the volute was not included in this study, as the study aims to focus on the compressor stage, with particular attention to the rotor’s thermo-mechanical loading. Then, the solid domains of the rotor, shaft, spacer, nut and seal plate (when modeled) are include for conjugate heat transfer purposes. Figure 1 shows (on the right) a sketch of the compressor with the main geometric parameters superimposed and (on the left) a middle plane with all the fluid and solid domains clearly highlighted, while in Table 1 the primary non-dimensional geometric ratios of the configuration are provided.

3. Numerical Model

3.1. Governing Equations

The mathematical formulation is based on the Reynolds-averaged Navier–Stokes equations. The conservation of mass and momentum is expressed in the Eulerian conservative divergence form:
ρ t + · ρ u = 0
ρ u t + · ρ u × u = p + · τ + S M
In this formulation, τ represents the tensor of normal and tangential stresses caused by viscosity, while SM denotes the momentum source term. The k-ω SST turbulence closure is used to model the Reynolds stress tensor and thus describe the momentum source. This model is designed to combine the precision of the k-ω model in wall-adjacent regions with the robustness of the k-ε model in the free-stream flow. It differs from the standard k-ω formulation by including several additional terms. A blending function switches between the k-ω and k-ε models based on the local value of y+, which indicates whether the flow is near the wall or in the free stream [39,40]. This approach also introduces a revised formulation for the eddy viscosity, along with modified constants. The model is governed by a set of additional transport equations, as follows:
t ρ k + x i ρ k u i = x j Γ k k x j + G k Y k + S k
t ρ ω + x j ρ ω u j = x j Γ ω ω x j + G ω Y ω + D ω + S ω
In this formulation, Gk corresponds to the generation of turbulence kinetic energy caused by mean velocity gradients, while Gω represents the generation term for the specific dissipation rate. Yk and Yω are the terms accounting for the dissipation of turbulence kinetic energy and specific dissipation rate, respectively; finally, Sk and Sω denote the source terms for these quantities.
The diffusivity is obtained by the following equations:
Γ k = μ + μ t σ k
Γ ω = μ + μ t σ ω
The eddy viscosity is finally computed with:
μ t = ρ k ω 1 m a x 1 a * , S F 2 a 1 ω
The model constants are: σk,1 = 1.176, σω,1 = 2.0, σk,2 = 1.0, σω,2 = 1.168, α1 = 0.31, βi,1 = 0.075 and βi,2 = 0.0828.
Furthermore, the resolutions of the energy equation in the fluid domains, with the following equation:
ρ h t t p t + · ρ u h t = · λ     T + · u · τ + u · S M + S E
where the total enthalpy is equal to:
h t = h + 1 2 u 2
To take account also the heat transfer in the solid regions, well known as conjugate heat transfer, the following conservation of energy equation is solved:
ρ h t + · ρ u s h = · λ     T + S E

3.2. CFD Models

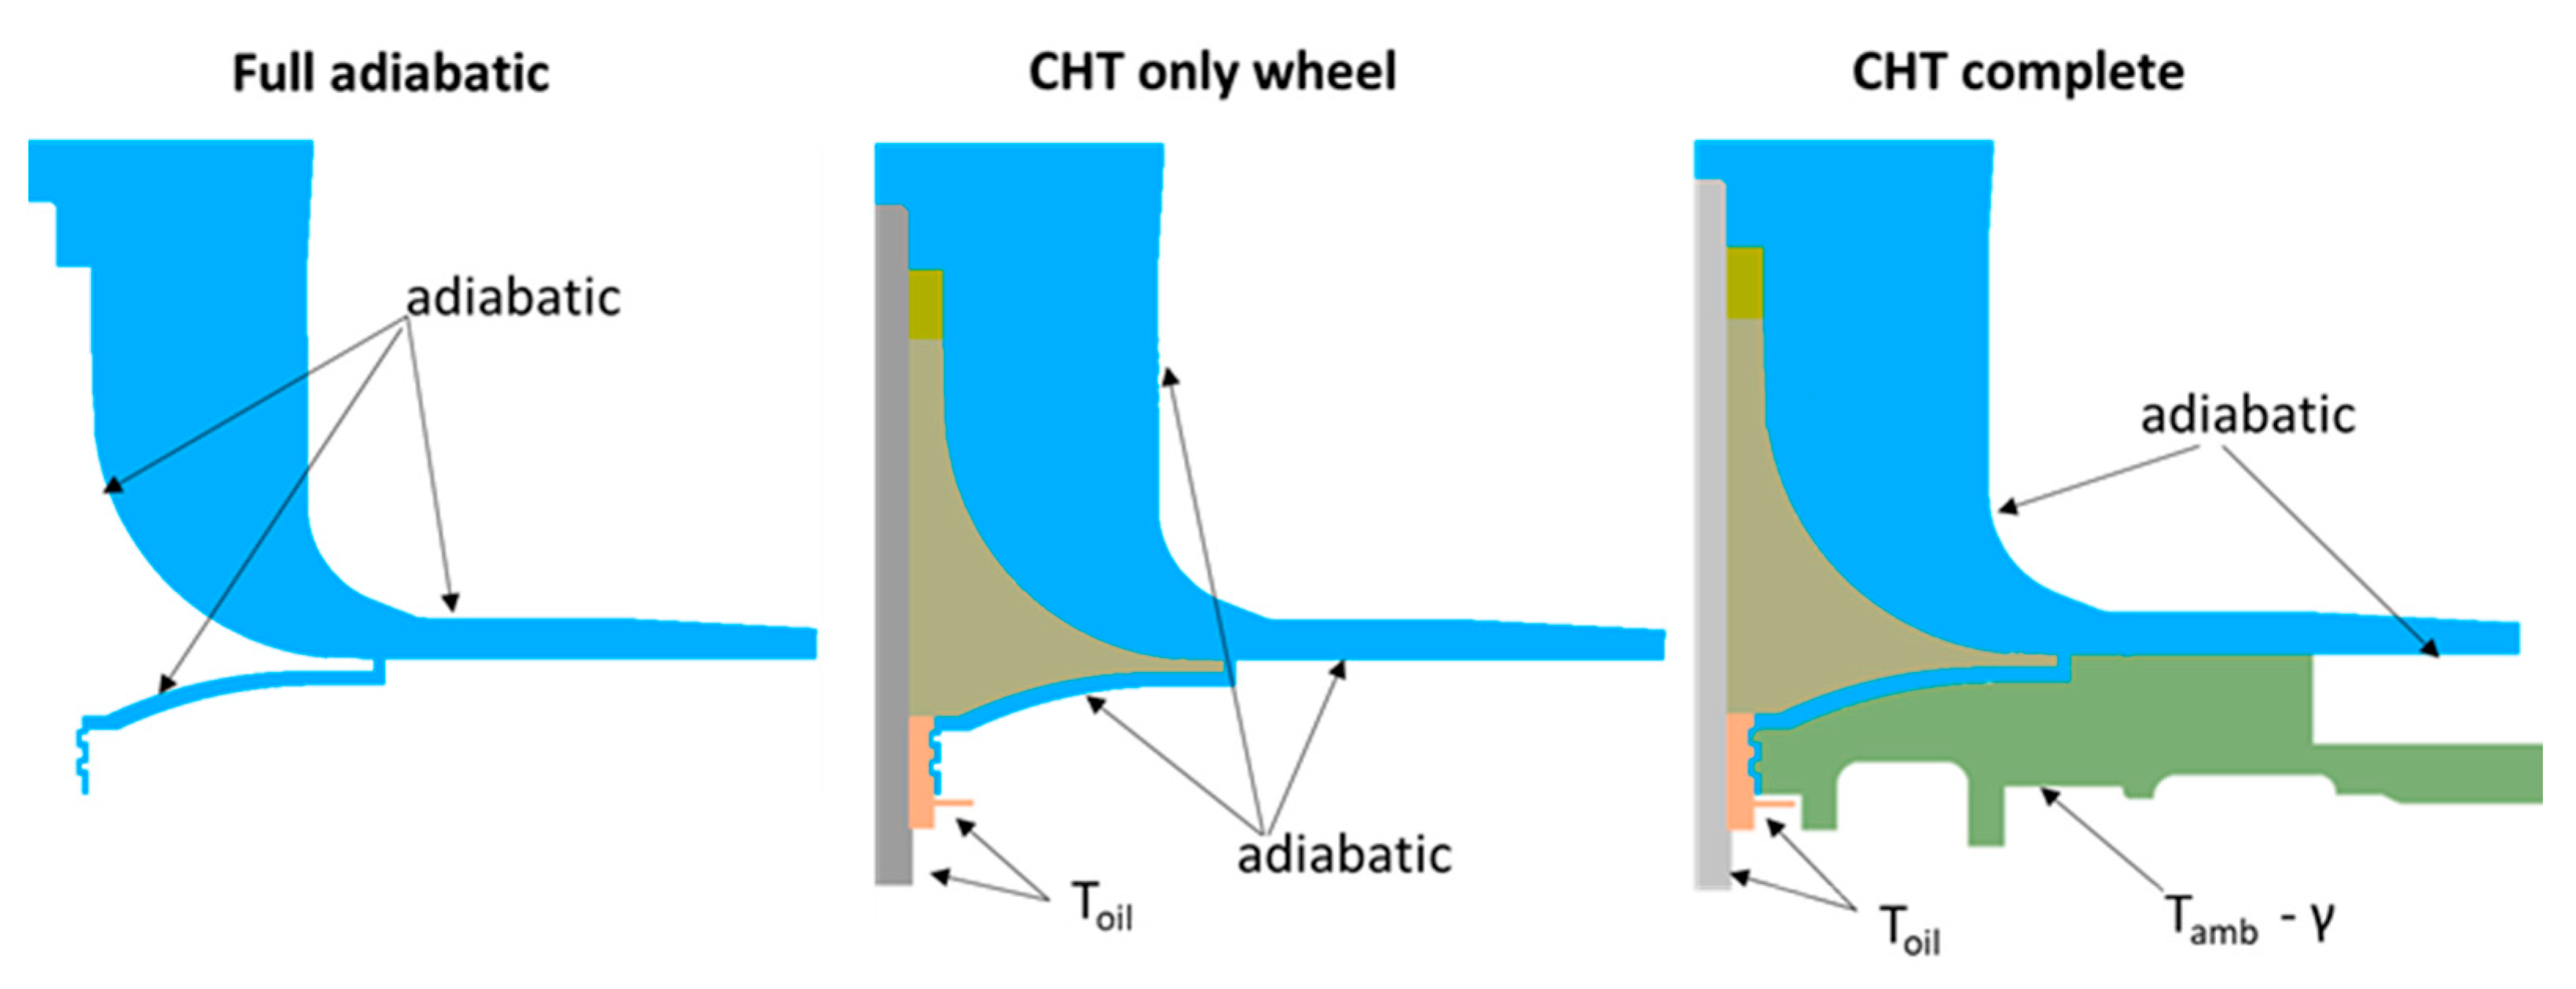
The CFD simulations have been performed with three main steady numerical models: the full adiabatic model, the CHT only wheel and the CHT complete. The commercial software Ansys CFX v. 17.1 was used to solve the Reynolds-averaged Navier–Stokes equations. In Figure 2 a scheme of the thermal boundary conditions adopted for the different three models is reported, where the corresponding domains considered are represented.

3.2.1. Full Adiabatic Model

This model consists of the intake duct, impeller (with main blades and splitter), diffuser (with a convergent duct for stability reasons) and back cavity; all domains have an angular extension of 360°, while the volute has not been modelled (outside the scope of this work). This model is the complete fluid-only representation of the stage. It has the scope to be able to calculate the performance and the fluid structure, by neglecting the effect of the coupled heat exchange.
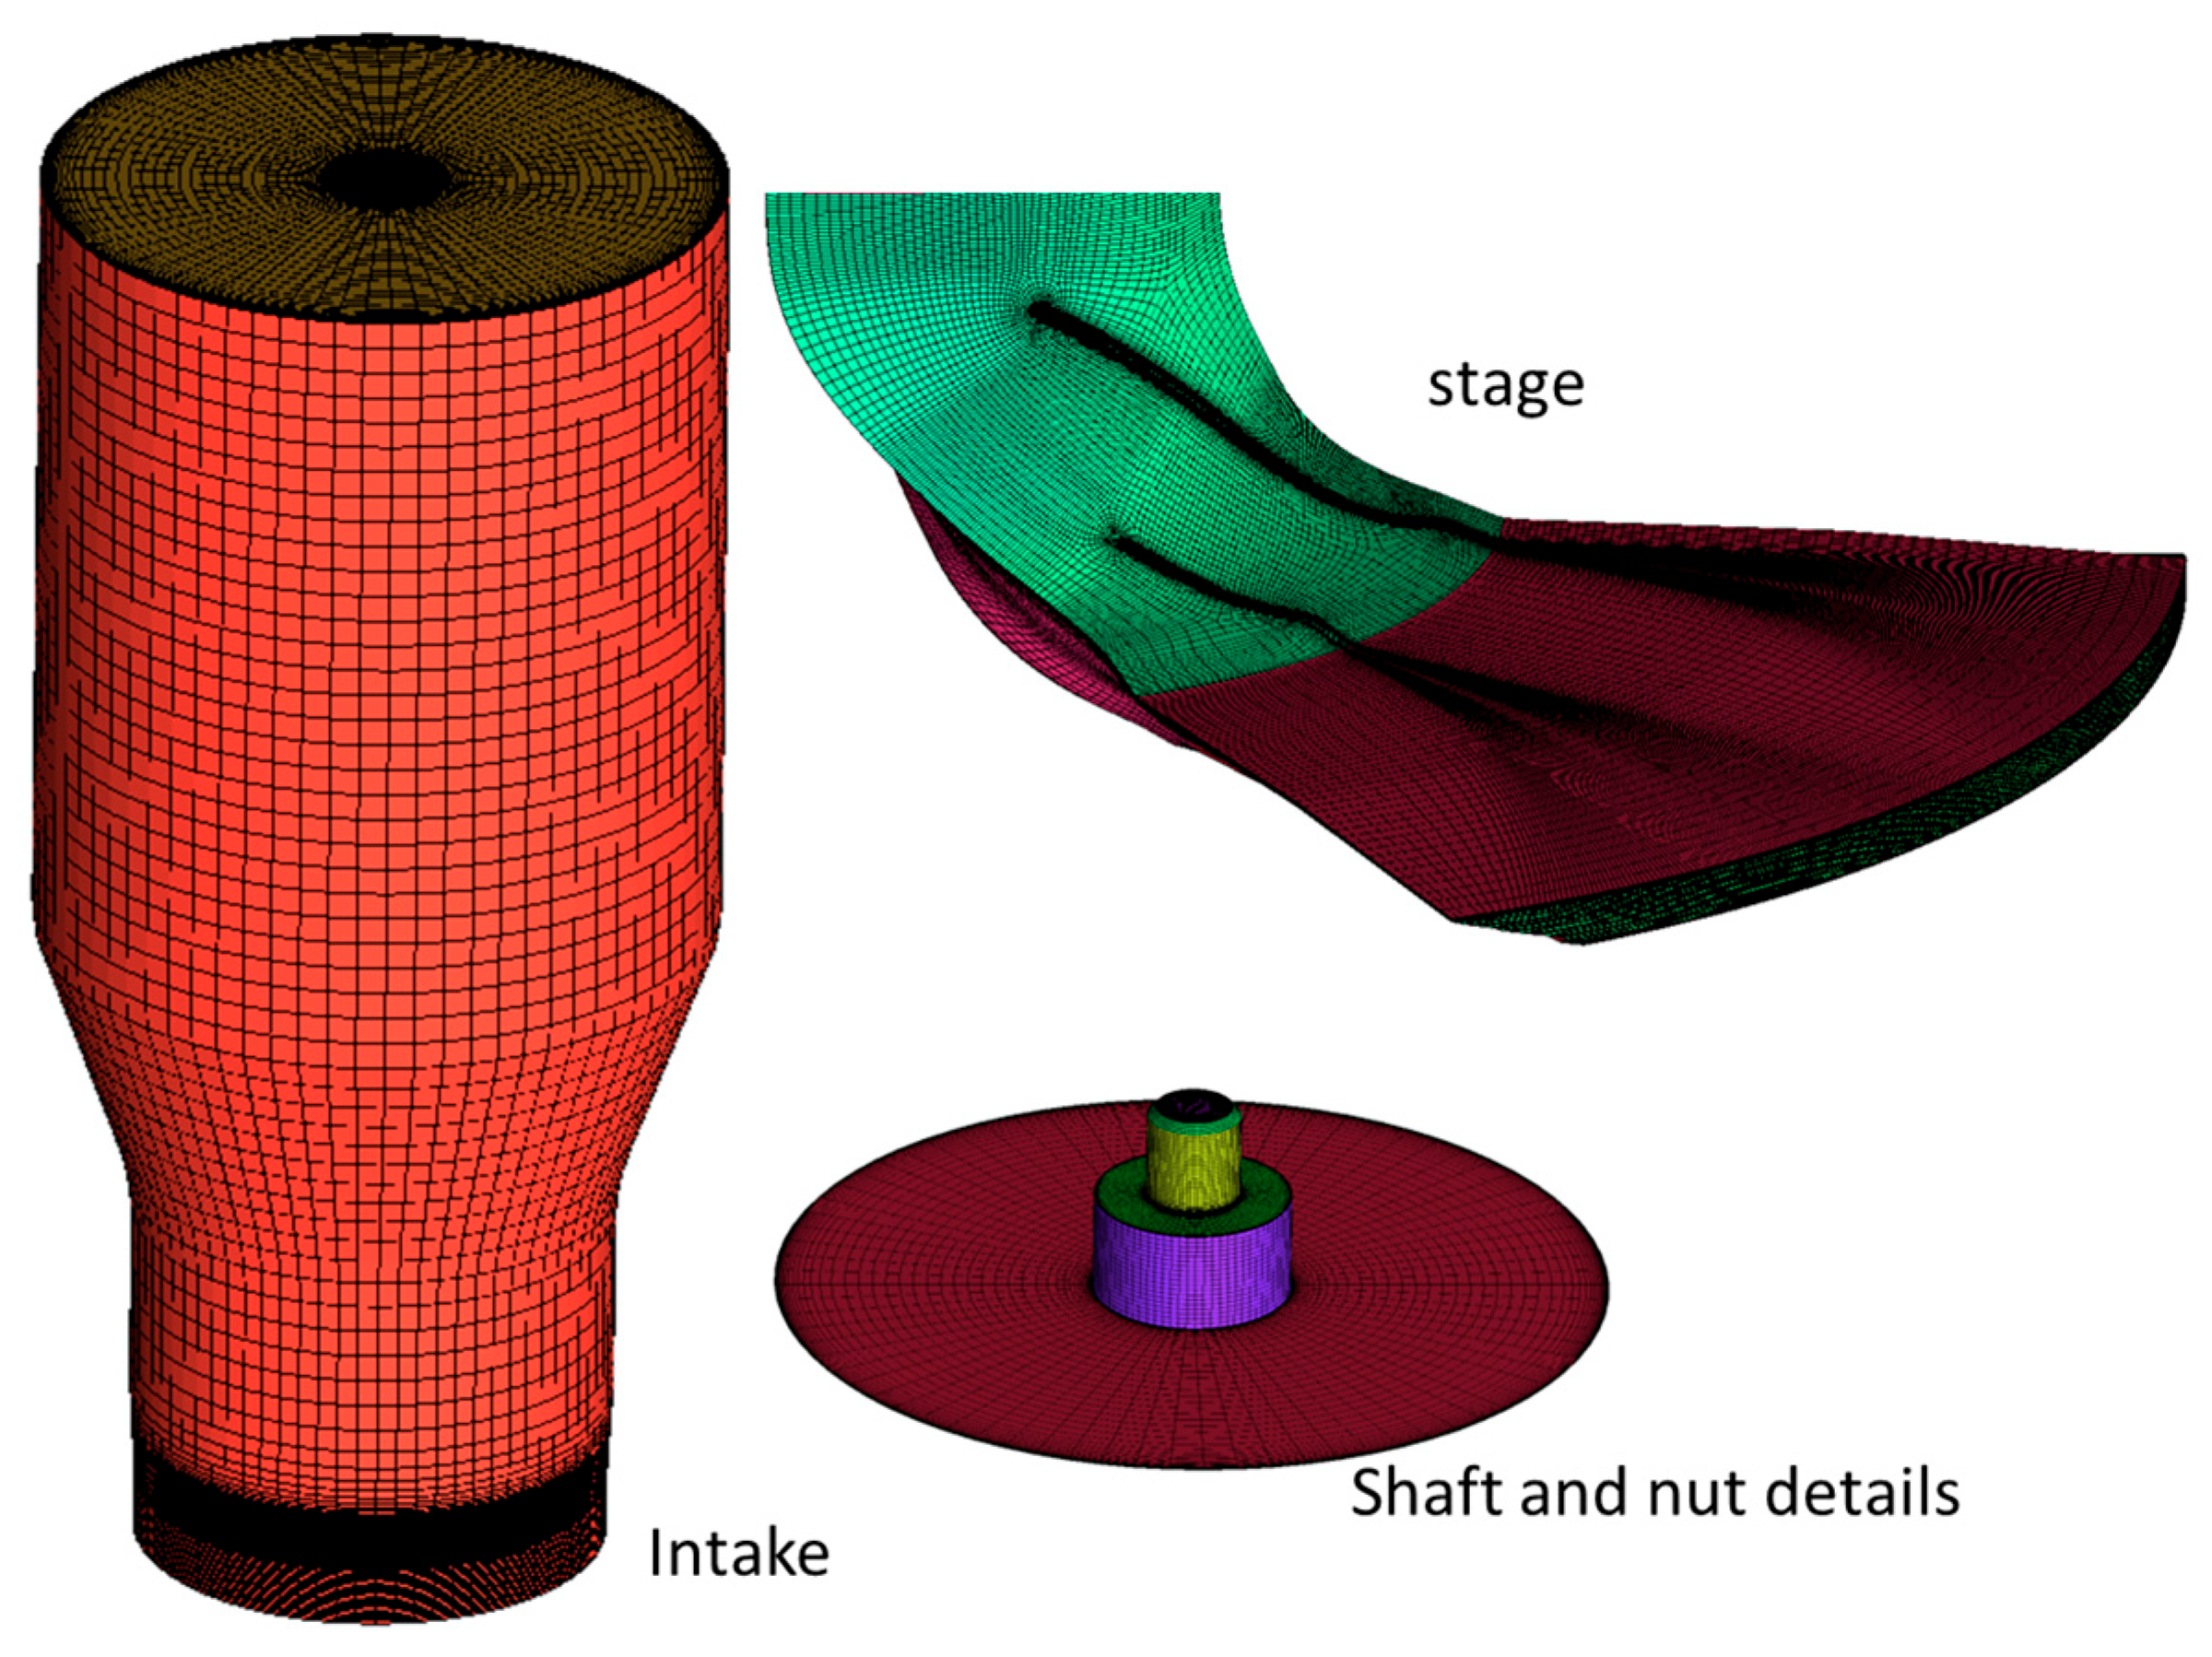
The stage (impeller and diffuser) has been discretized with Ansys Turbogrid through a structured grid in a single channel with hexahedral elements using the ATM optimized topology; this channel has been then replicated for 360°. Also, the entire intake domain, with the real geometry on the hub, identified by the shaft and nut surfaces, has been discretized using a structured grid but with a O-grid topology created in ICEM CFD from the Ansys CFD platform; instead, the back cavity has been discretized with an unstructured mesh with this last software. Particular emphasis was placed on grid refinement near the walls of each component to ensure that the y+ value remained below unity, which is crucial for accurately capturing the boundary layer. To properly model the blade geometry, including the tip clearance gap, at least 50 computational cells were allocated along the spanwise direction of the blade. Additionally, the unstructured grid was refined with the creation of ten prismatic layers to effectively resolve the boundary layer dynamics. The grid cells in regions of high curvature were sized between 2.0 mm and 0.1 mm to maintain resolution, with tetrahedral elements used throughout the domain. This level of refinement ensures that the computational model can capture the detailed flow characteristics near the walls, where gradients in velocity and turbulence are most pronounced. As regards this, Figure 3 shows the mesh of a stage portion and the complete intake domain, while Figure 4 shows the upper and lower mesh surfaces of the back cavity with the seals.
The global mesh of the model consists of about 15 Mcells, where the grids of a stage channel are distributed as follows: 1.3 million cells for the impeller and 800 thousand cells for the diffusers, while the grids of the intake and back cavity consist, respectively, of 1.1 Mcells and 1.2 Mcells. A mesh sensitivity analysis was conducted to identify the optimal grid resolution that does not show significant performance variations when a finer mesh is applied. This analysis was based on the mesh parameters from earlier studies on the compressor stage [31,32,33]. In this case, the sensitivity analysis focused specifically on the additional fluid component, i.e., the back cavity, where three distinct grids with varying global mesh sizes were tested. Table 2 presents the global corrected pressure ratio (PRcor) within the compressor and the MRF passing through the cavity under near-surge conditions (OP1) for each of the different grid configurations. Among these, the second configuration with 1.2 million cells was determined to be the most suitable, serving as the reference grid for subsequent simulations. This analysis ensures that the chosen grid provides sufficient accuracy without unnecessary computational cost, ultimately leading to a more efficient simulation setup.
The turbulence model implemented in this study is the k-ω SST, which has gained widespread adoption for modeling the flow within centrifugal compressors due to its proven ability to reliably predict both the flow field and compressor performance under a broad range of operating conditions [41]. In the simulations, the total energy equation was activated and air was modeled as an ideal gas for simplicity and accuracy. The boundary conditions applied were as follows: at the inlet, the total pressure, total temperature and a medium turbulence intensity of 5% were specified. For the diffuser outlet, the mass flow rate condition was set, except in near-choking conditions, where the static pressure boundary condition was instead employed, while at the outlet of the seal cover from the back cavity a pressure outlet ambient condition has been imposed. At the impeller a uniform rotational speed has been set, so the adduction–impeller and impeller–diffuser interfaces were modeled with the frozen rotor options, as well as the interface between the impeller and back cavity. All the walls have been set as no-slip, with the exception of the upstream hub and the upper surface of the back cavity which were set as rotating walls, while a counter-rotation velocity has been used for the impeller shroud. All the walls are adiabatic; no heat exchange with the external environment is taken into account in this model. Finally, all equations were solved using second-order numerical schemes and steady-state simulations were conducted with this model. The convergence was assessed by monitoring global performance indicators, namely pressure ratio and efficiency, ensuring that stable values were reached. Each simulation required approximately 2000 iterations to achieve convergence.
A validation of this fluid dynamic model has been caried out in previous works by comparing the numerical results with detailed experimental data [31,34].

3.2.2. CHT Only Wheel

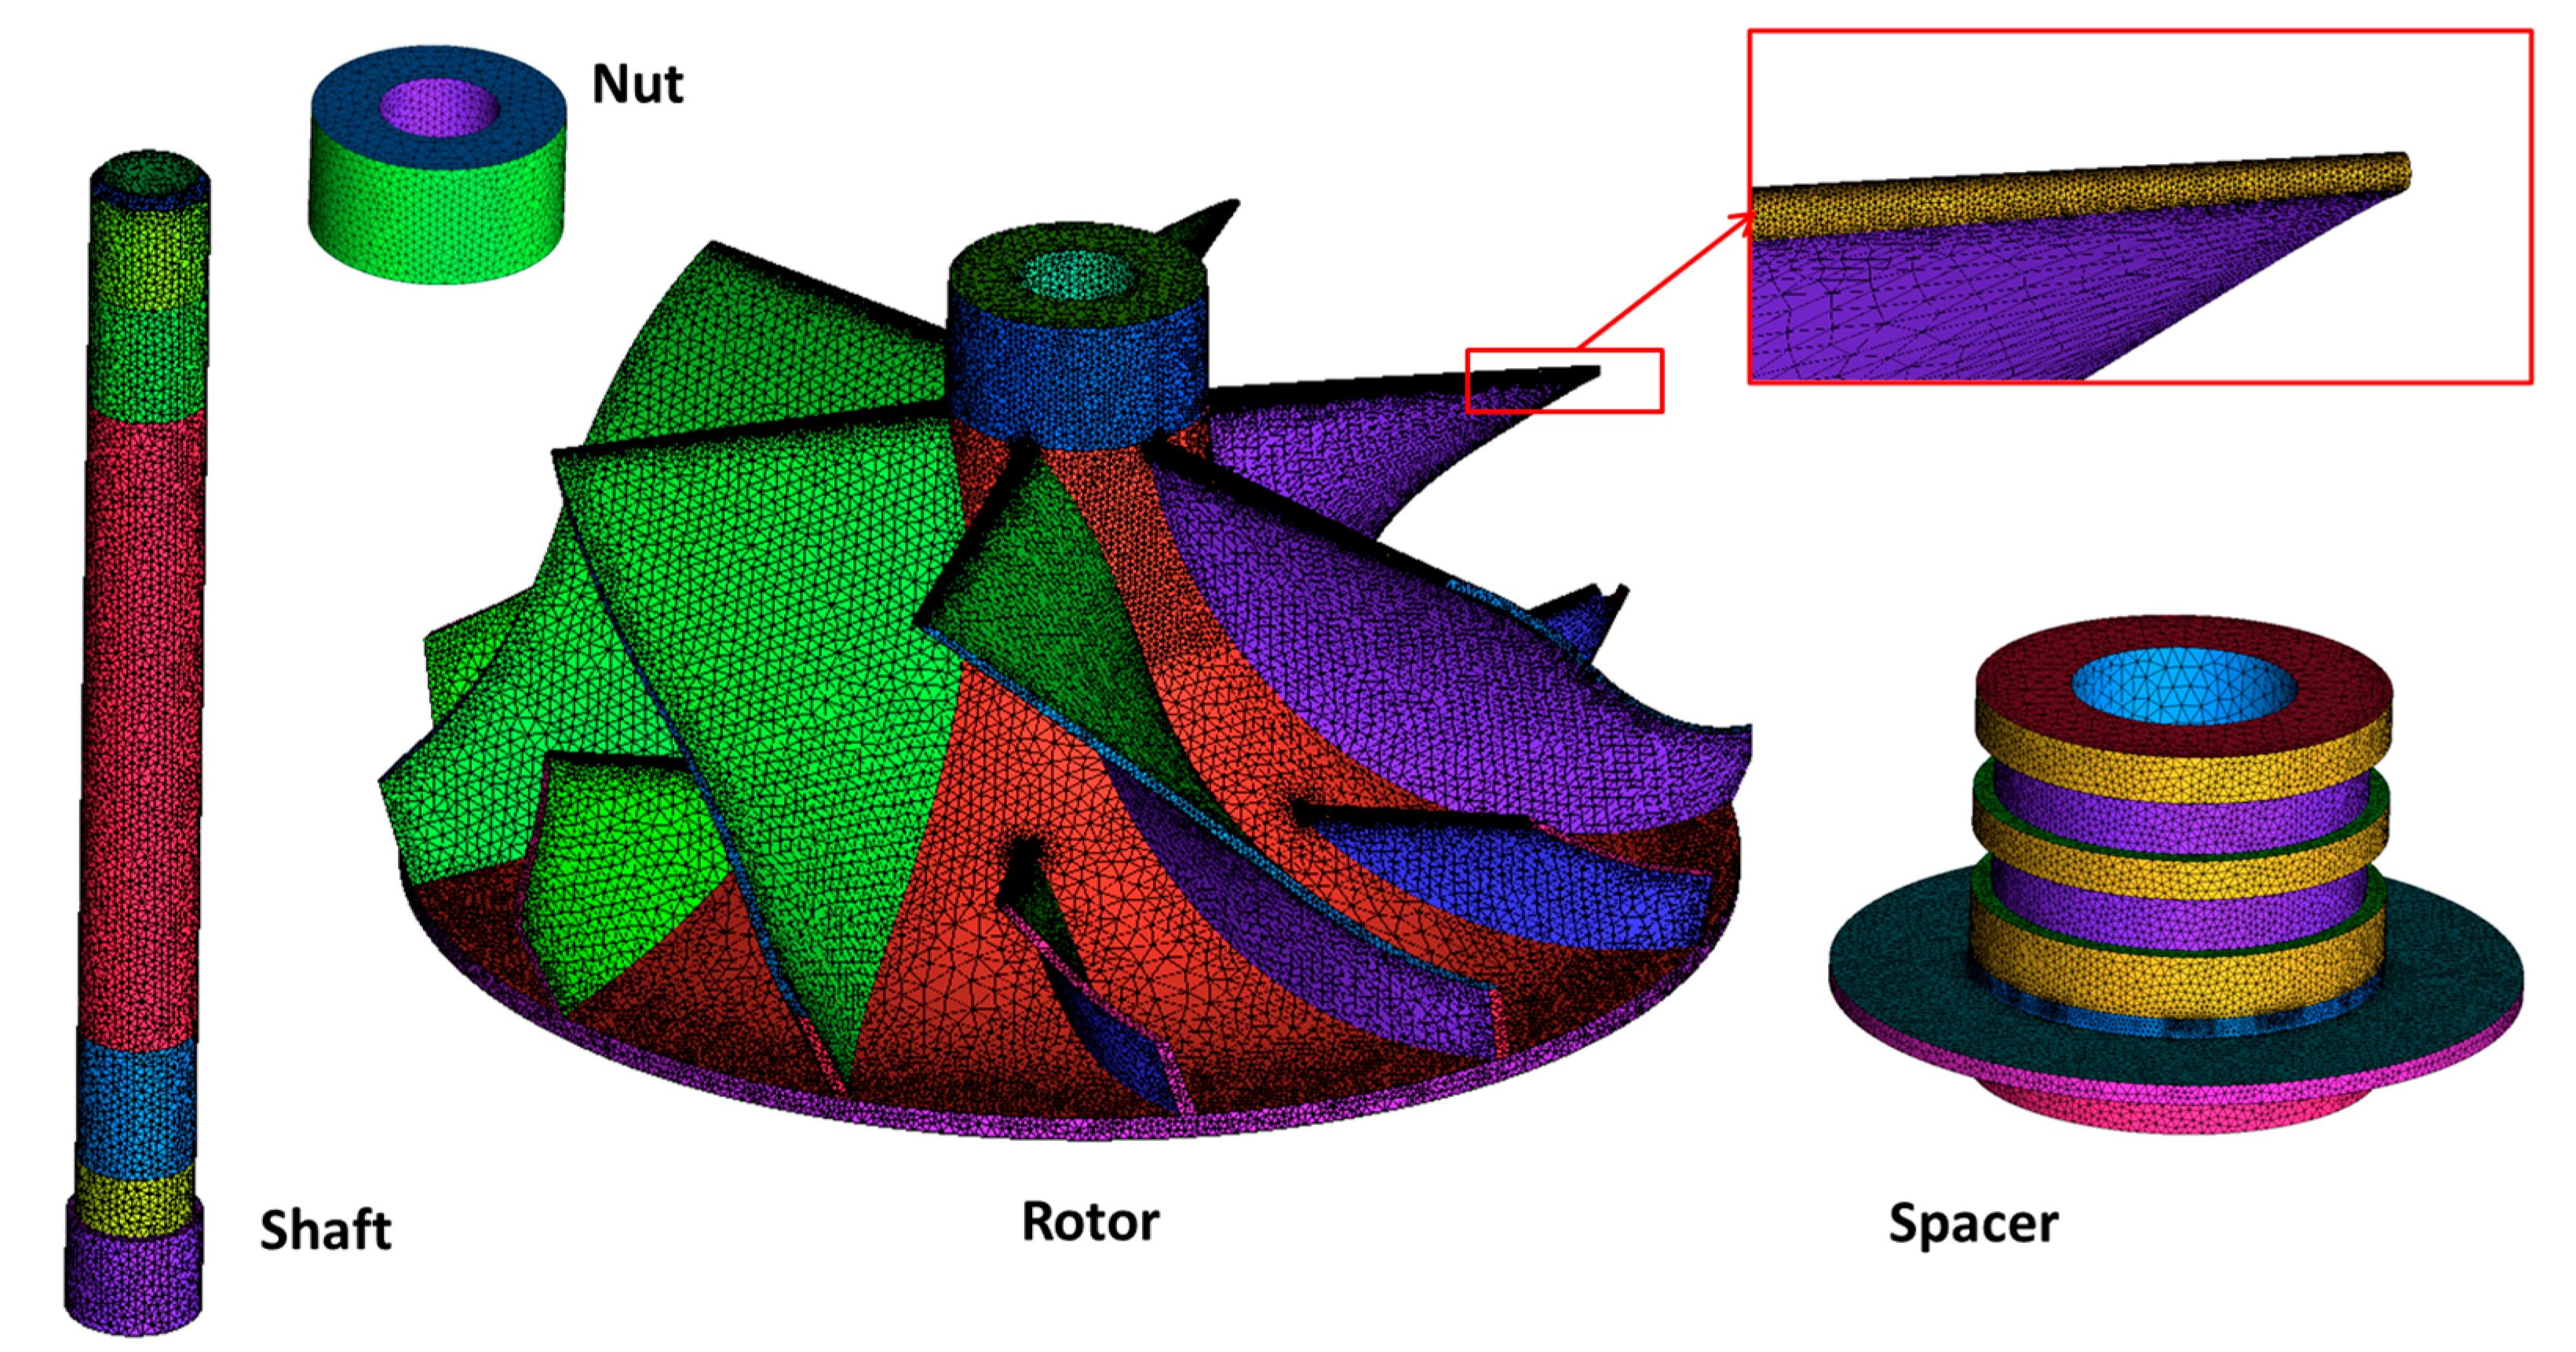
In this model there are the same fluid domains with the same settings described for the full adiabatic model, with the addition of the following solid domains to be able to simulate the coupled heat exchange: rotor (without fillets), shaft, nut and spacer; these components were discretized with unstructured grids of 1.4 Mcells, 90 thousand cells, 30 thousand cells and 300 thousand cells, respectively. On the surfaces, the same ranges of minimum and maximum cell sizes have been used so as to have congruent meshes in the interfaces. Figure 5 shows the meshes of the four solid components here included.
The rotor has been assigned the solid properties of the aluminum, while appropriate steel has been considered for the other three components. For all solid domains a uniform rotational speed has been set. The fluid–solid and solid–solid interfaces have been modelled with zero thermal resistance. Furthermore, a condition of uniform temperature has been assigned in the lower portions of the shaft and spacer in contact with lubricating oil; instead, the walls of the shroud and of the entire diffuser have been left adiabatic.

3.2.3. CHT Complete

This model, compared to the previous CHT, includes also the seal plate among the solid domains, in order to allow complete and even more realistic simulations with conjugated heat exchange. The seal plate has also been discretized with an unstructured grid, with the same characteristics as the previous solid components; it has a global mesh size of 1.3 Mcells, bringing the total model to over 18 Mcells. Figure 6 shows the mesh of the upper and lower surfaces of the seal plate.
The seal plate was modelled stationary and with the aluminum properties. This component is interfaced to the back cavity and hub stage, where an appropriate patch has been created in the lower portion of the impeller; in this case, a zero thermal resistance was also imposed between the solid component and the fluid domains. Among the remaining walls of the seal plate, an adiabatic condition was set for the upper faces, while the lower surface was divided into two: up to the intermediate radius (before the triangular details evident in the previous figure) a uniform temperature was set (where the lubricant oil is in contact), while the remaining external part exchanges with the outside with the heat transfer coefficient γ = 20 W/m2K at ambient temperature; the previously evaluated heat transfer coefficient is consistent, as the hot surface is not excessively large. This conditioning on the seal plate will be defined as the baseline in the following.

4. Results

In this section, the main effects on compressor performance have been evaluated by taking into account the conjugated heat exchange between the fluid domains and the solid components, with models of different degrees of complexity. Therefore, the main aim is to quantify the error in using a simpler adiabatic numerical model compared to more complex cases with CHT. An analysis of the effect of the back cavity has been also performed. Subsequently, an in-depth thermal analysis with temperature and heat flux distributions has been carried out to aid in the understanding of the identified performance variations. Finally, some different boundary conditions have been simulated to evaluate the possible uncertainty in the results, in particular regarding the seal plate and secondly regarding the shroud. All the evaluations have been carried out in the mass flow rate range of the design iisospeed, to show that not negligible deviations already occur for this regime.

4.1. Comparison Among Full Adiabatic, CHT Only Wheel and CHT Complete Models

To evaluate the performance differences, the pressure ratio (Equation (11)) and the isentropic adiabatic total-to-total efficiency (Equation (12)) are considered as key parameters. These are calculated between the adduction duct inlet (model inlet—section 0) and the diffuser outlet (section 5). They are reported in a corrected form, by dividing these quantities for the ones corresponding to the design point, due to a non-disclosure agreement. In the literature there is also a diabatic isentropic efficiency, which implements the correction of subtracting the thermal flow that reaches the compressor from the turbine; if this were not considered, it would lead to an underestimation of the correct efficiency (called apparent in this case) because there would be an additional temperature difference [42,43]. In this work, however, thermal flows coming from the turbine have not been considered, but only a constant temperature condition is fixed for the lower shaft and spacer; therefore, the definition of efficiency shown is correct and allows to take into consideration and quantify the internal losses due to the heat exchange of the compressor with the CHT models.
P R = p t 5 p t 0
η t t , a d i a b = p t 5 p t 0 ( k 1 ) / k 1 ( T t 5 T t 0 ) 1

4.1.1. Global Performance

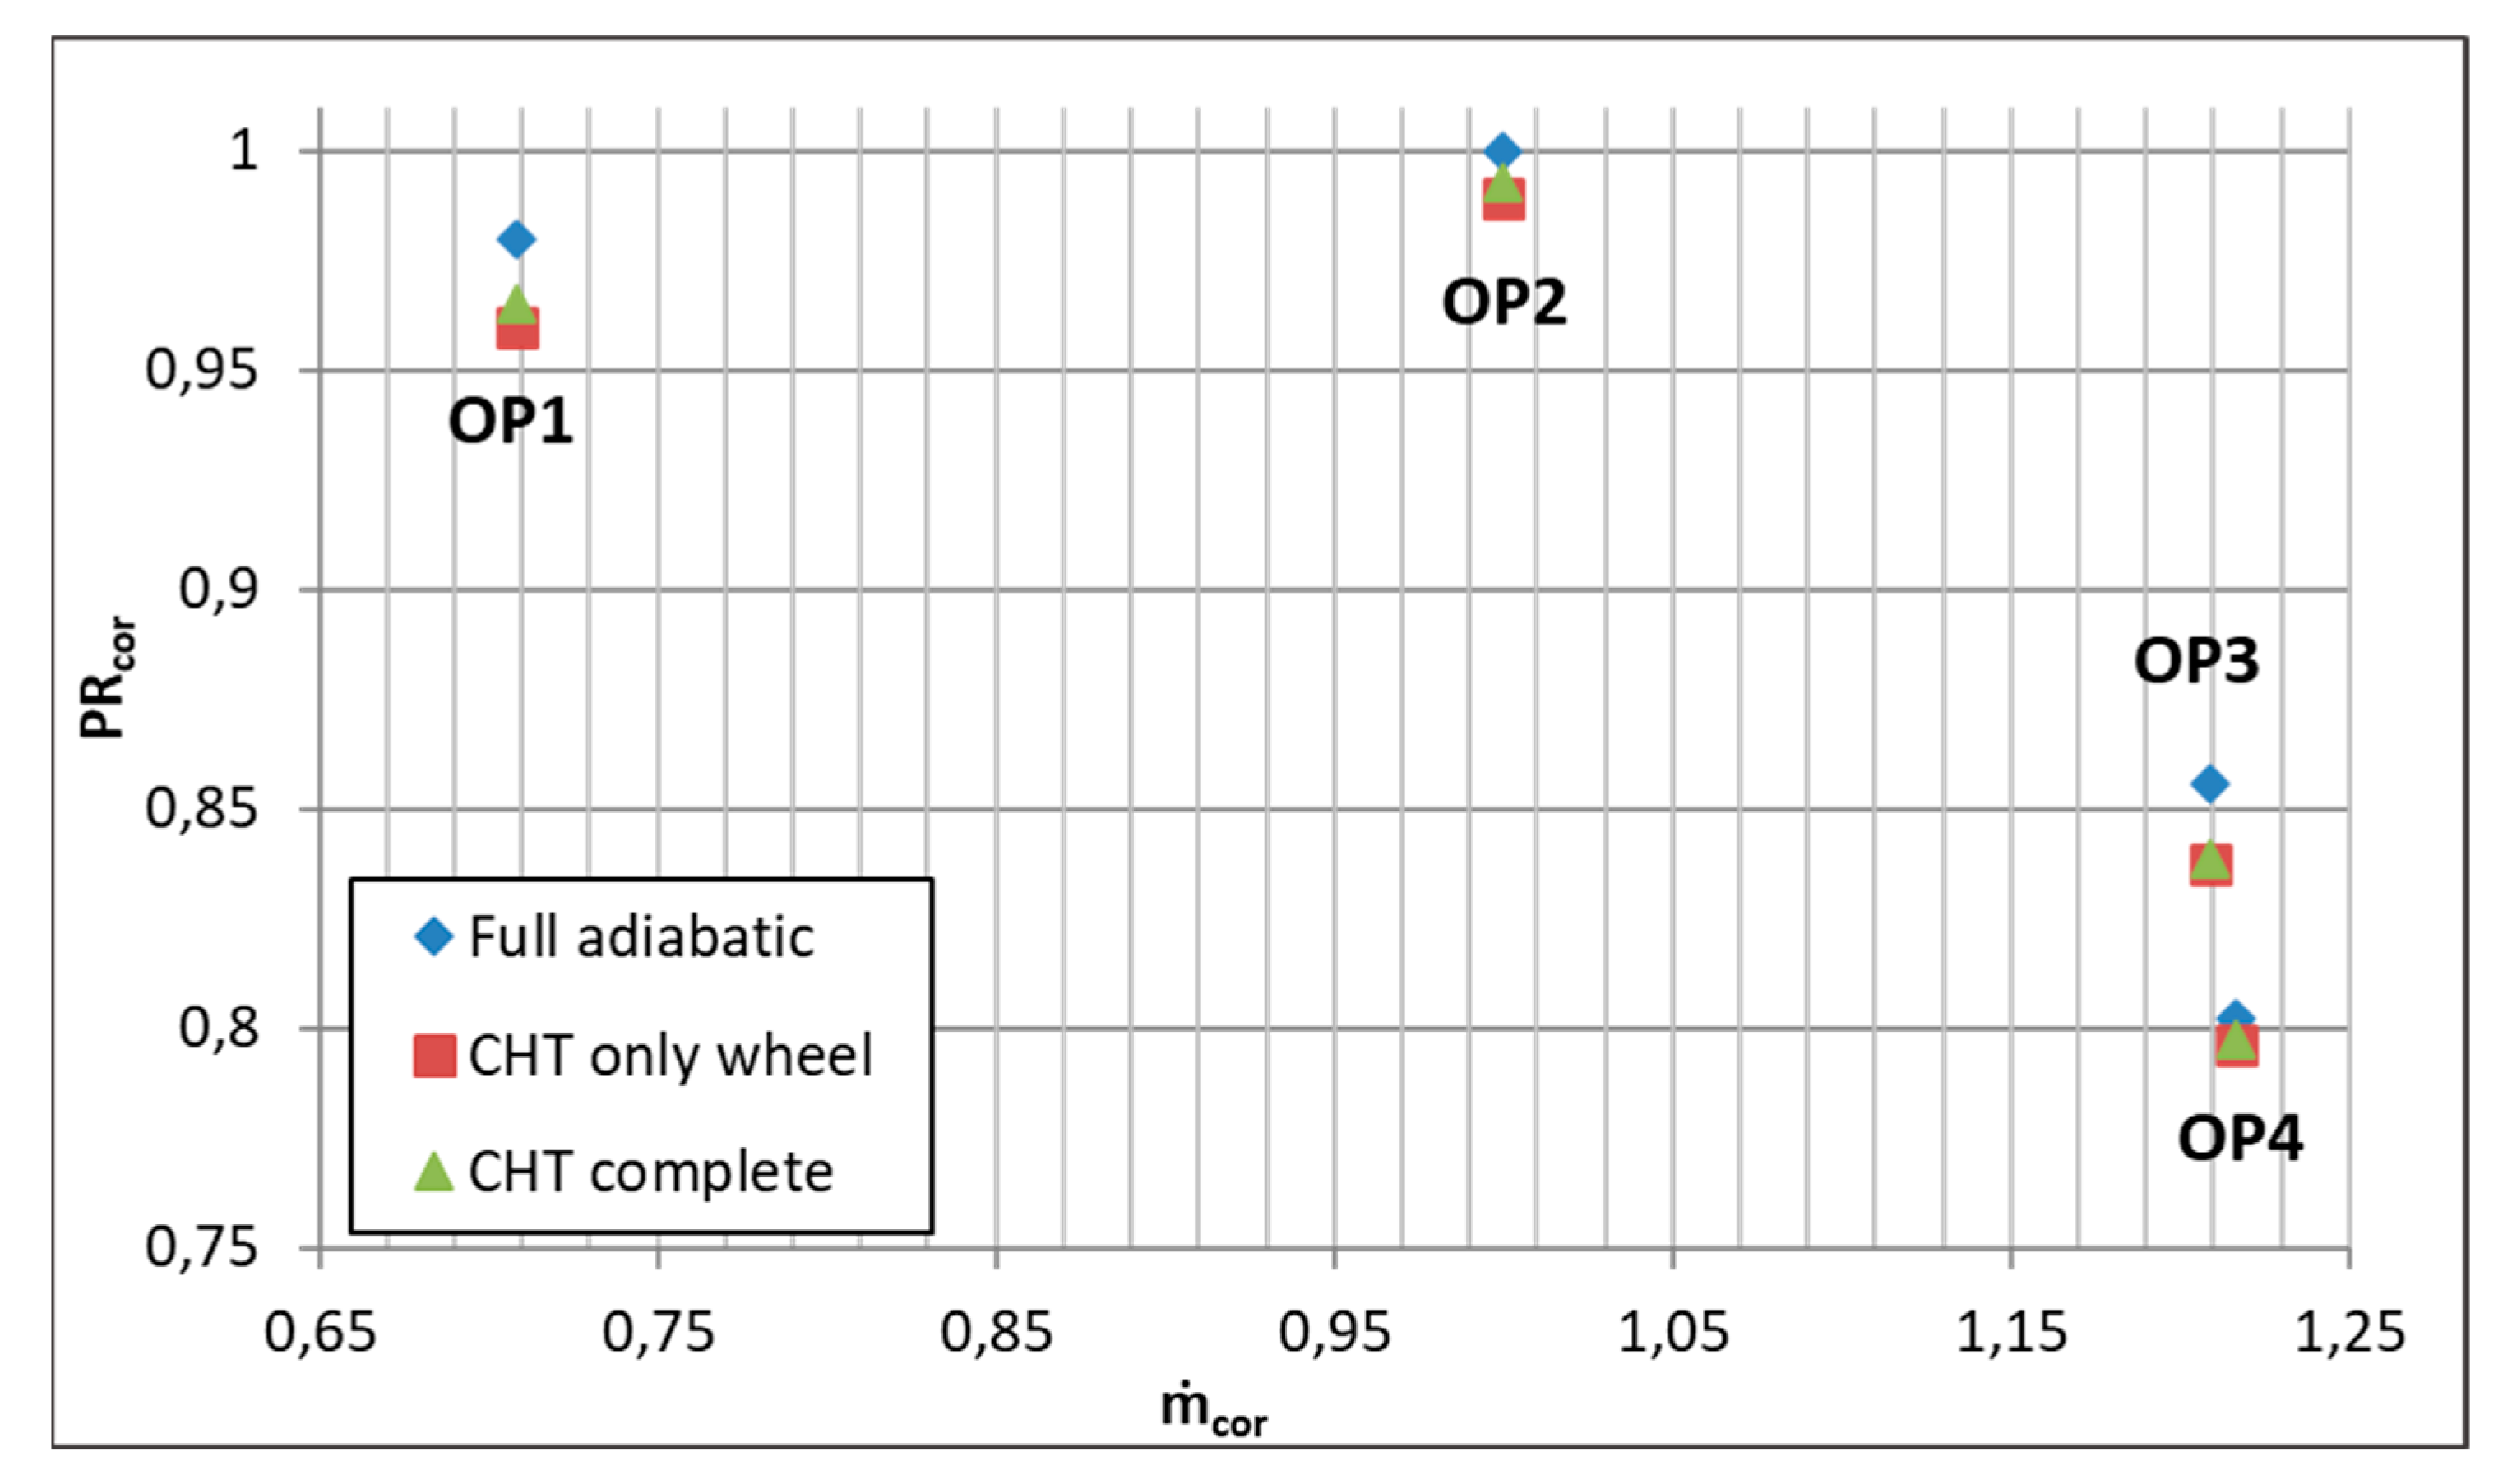
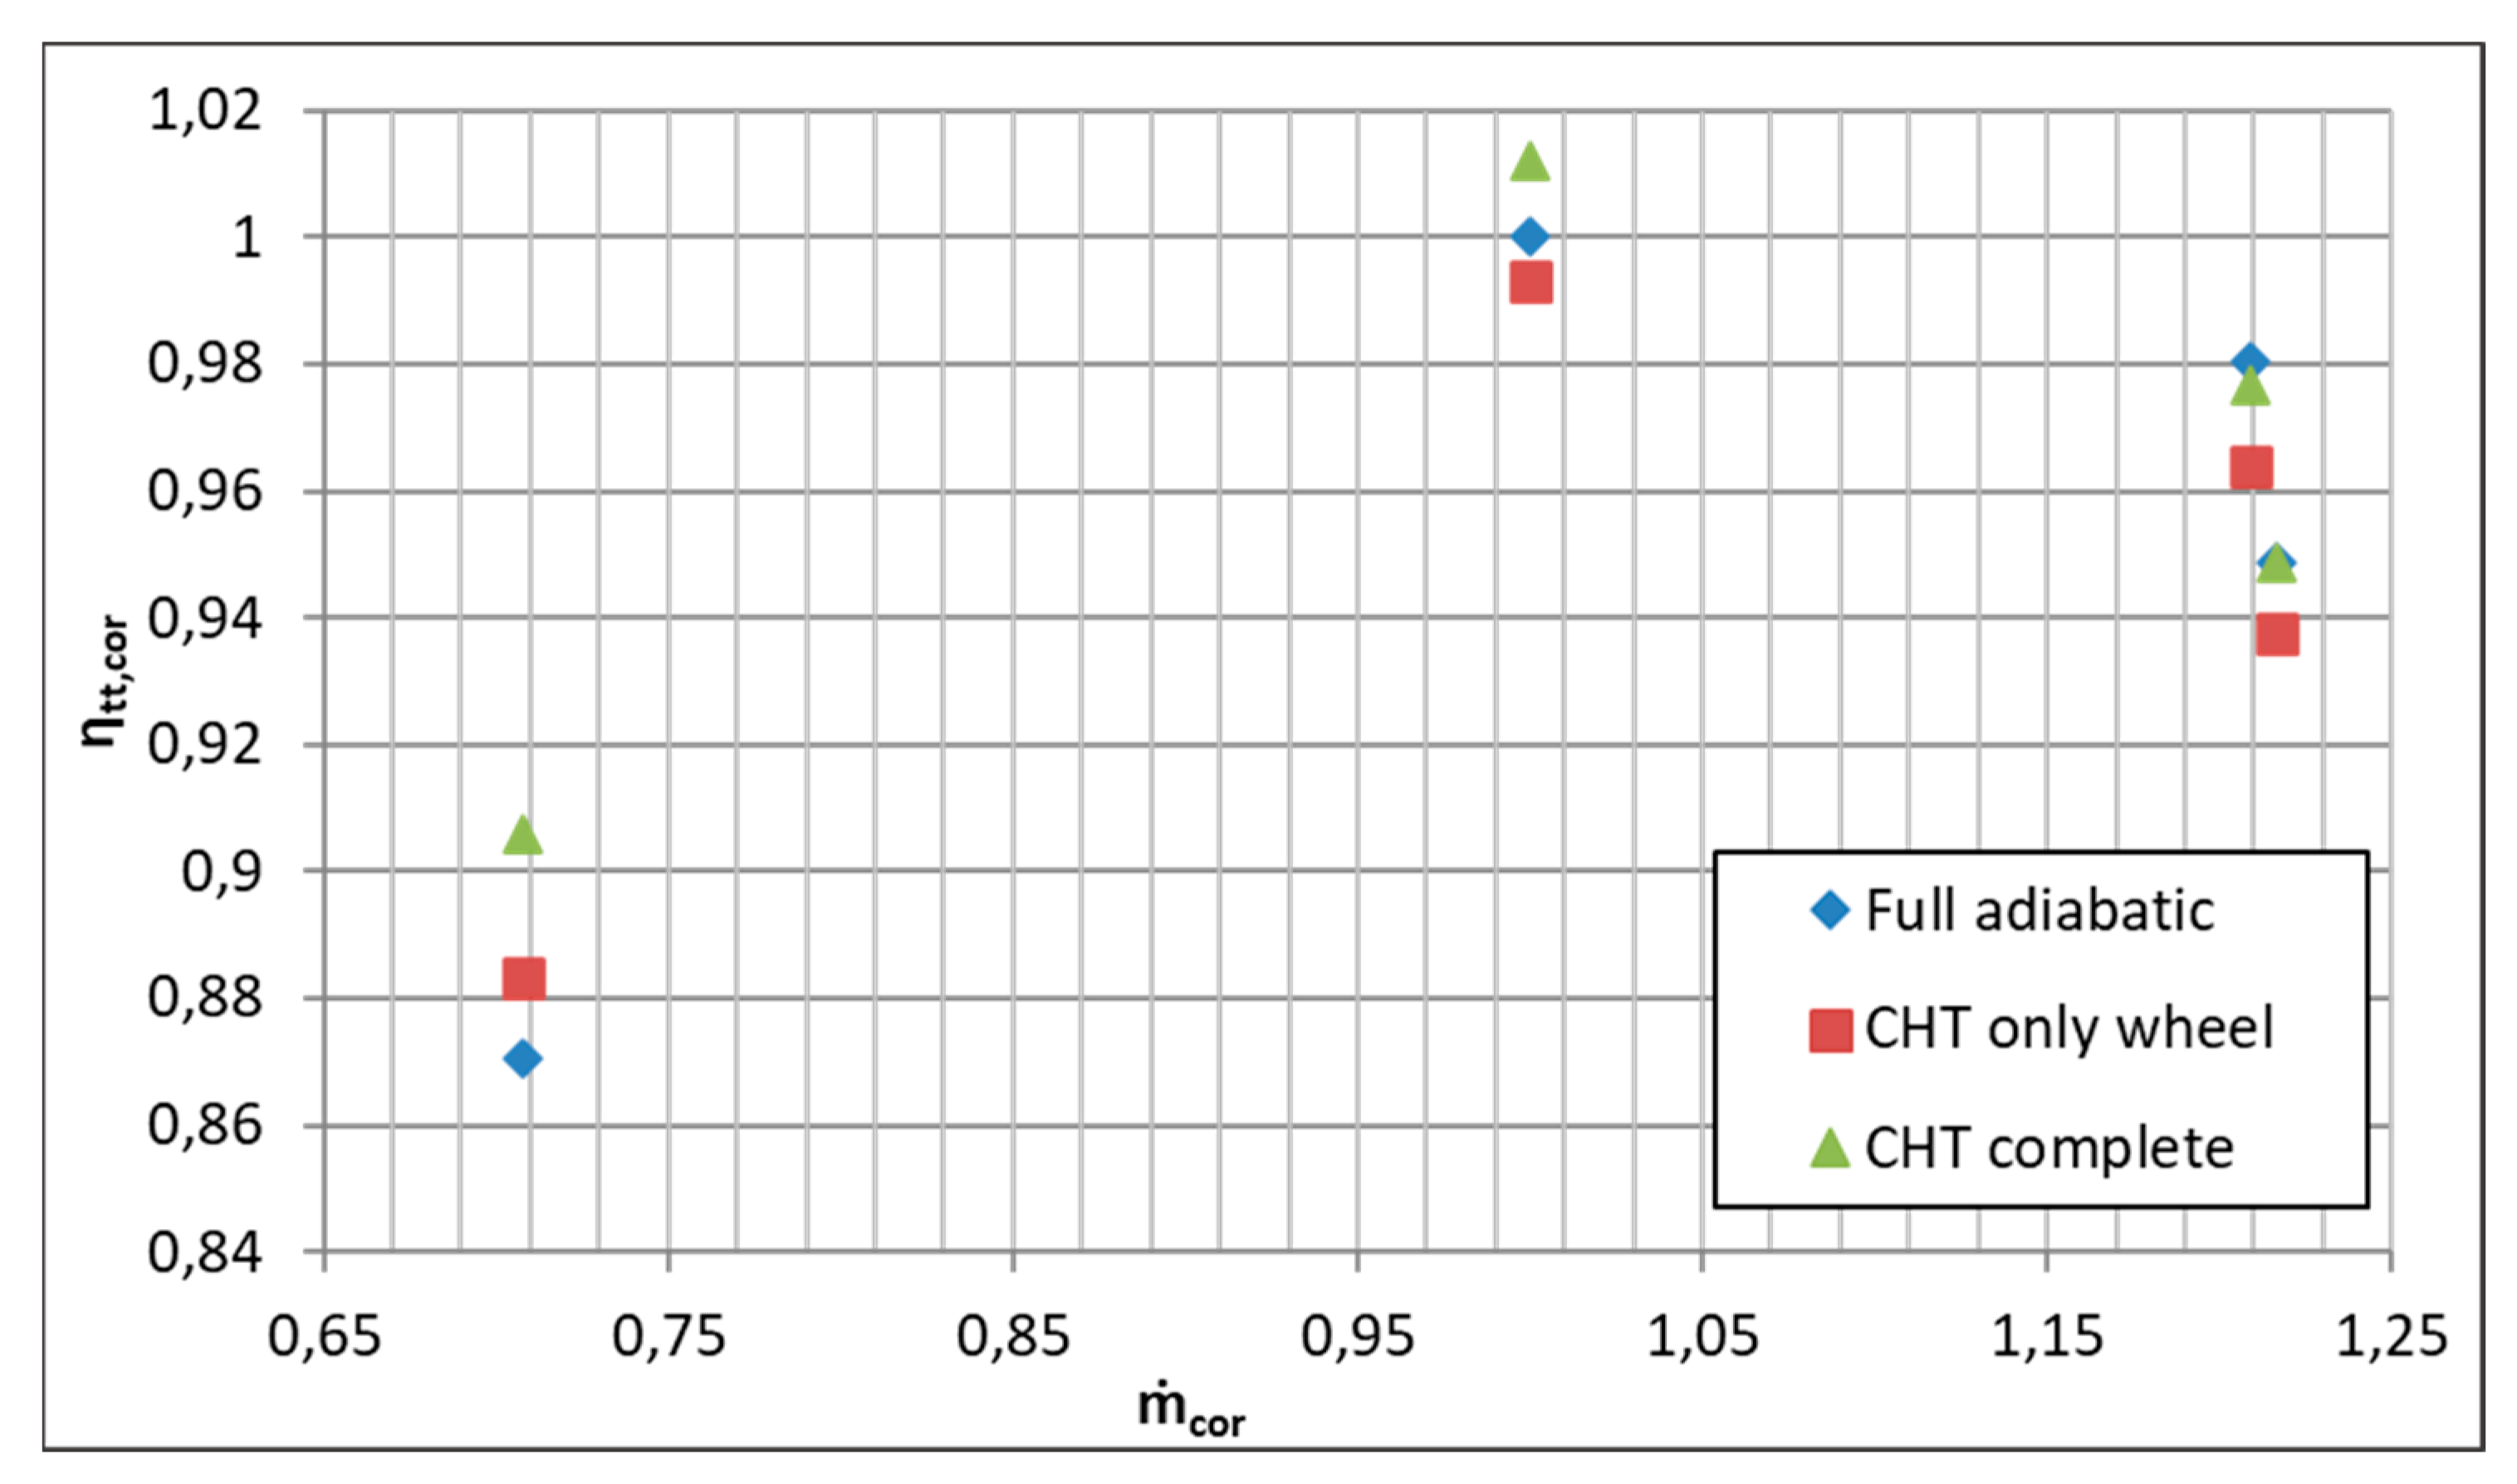
This section compares the performance of the centrifugal compressor at the reference isospeed in the cases of an adiabatic model without solid domains, of the CHT only wheel model and of the more complete one also including the seal plate. Figure 7 and Figure 8 show the corrected pressure ratio and corrected efficiency curves, respectively, calculated as previously shown, while Table 3 shows the percentage variations with respect to the adiabatic case.
First of all, it can be noted that the pressure ratio in CHT cases is lower than in the adiabatic case. In fact there are internal losses due to the heat transfer that goes upstream from the outlet; this heat brings the fluid at the compressor inlet to a slightly higher temperature, with a lower density and more complex to compress. In more detail, a reduction of 2% was quantified for the simpler CHT model for the near-surge condition OP1, which is reduced to 1.5% in the complete model; towards choking, a similar reduction was observed in the CHT models, a reduction which decreases for the condition of best efficiency OP2 and also in this case in both CHT cases. The smaller variations detected by the complete CHT model are due to the seal plate which disperses part of the heat flow with the outside, reducing the amount of recirculating heat flow upstream.
As regards the efficiency, an opposite behavior was observed based on the operating range. At higher mass flow rates, both CHT models have a lower efficiency than the adiabatic case due to the greater difficulty in compressing a hotter fluid, while towards the surge, these models detect a greater heat loss to the outside which reduces the total temperature at the compressor outlet, which is correlated to the work expended by the compressor in the denominator of Equation (12). This heat loss to the outside is greater if the seal plate is also modelled.

4.1.2. Back Cavity

The presence of the back cavity as a fluid domain to be included in the simulations is of considerable importance, even in the presence of adiabatic models [44,45]. To evaluate the effect of its presence, Table 4 shows the percentage variations in the performance of the full adiabatic case without the back cavity compared to the case with it.
There are overestimations of an average of 2% in the case without the back cavity for the PR, while minor deviations have been observed on the efficiency; these deviations are more evident towards the surge. In fact, the presence of the cavity is responsible for leaks, which lower the pressure at the impeller outlet, due to the leakage flow out of the seals. This leakage is higher at lower mass flow rates, because greater pressure increases are realized in the stage, which generate a greater MRF; under the OP1 condition the leakage mass flow rate reaches 0.45% with respect to the main flow in the stage and is therefore no longer negligible. Efficiency losses are mainly due to mixing effects that can occur between the main and the leakage flows.

4.1.3. Thermal Analysis

To better understand the reasons of the previous performance variations, the temperature distributions and heat transfer contributions between the various compressor components have been analyzed in more detail. First of all, Figure 9 shows the corrected temperature distributions on the impeller hub for the OP2 condition of the three modelled cases.
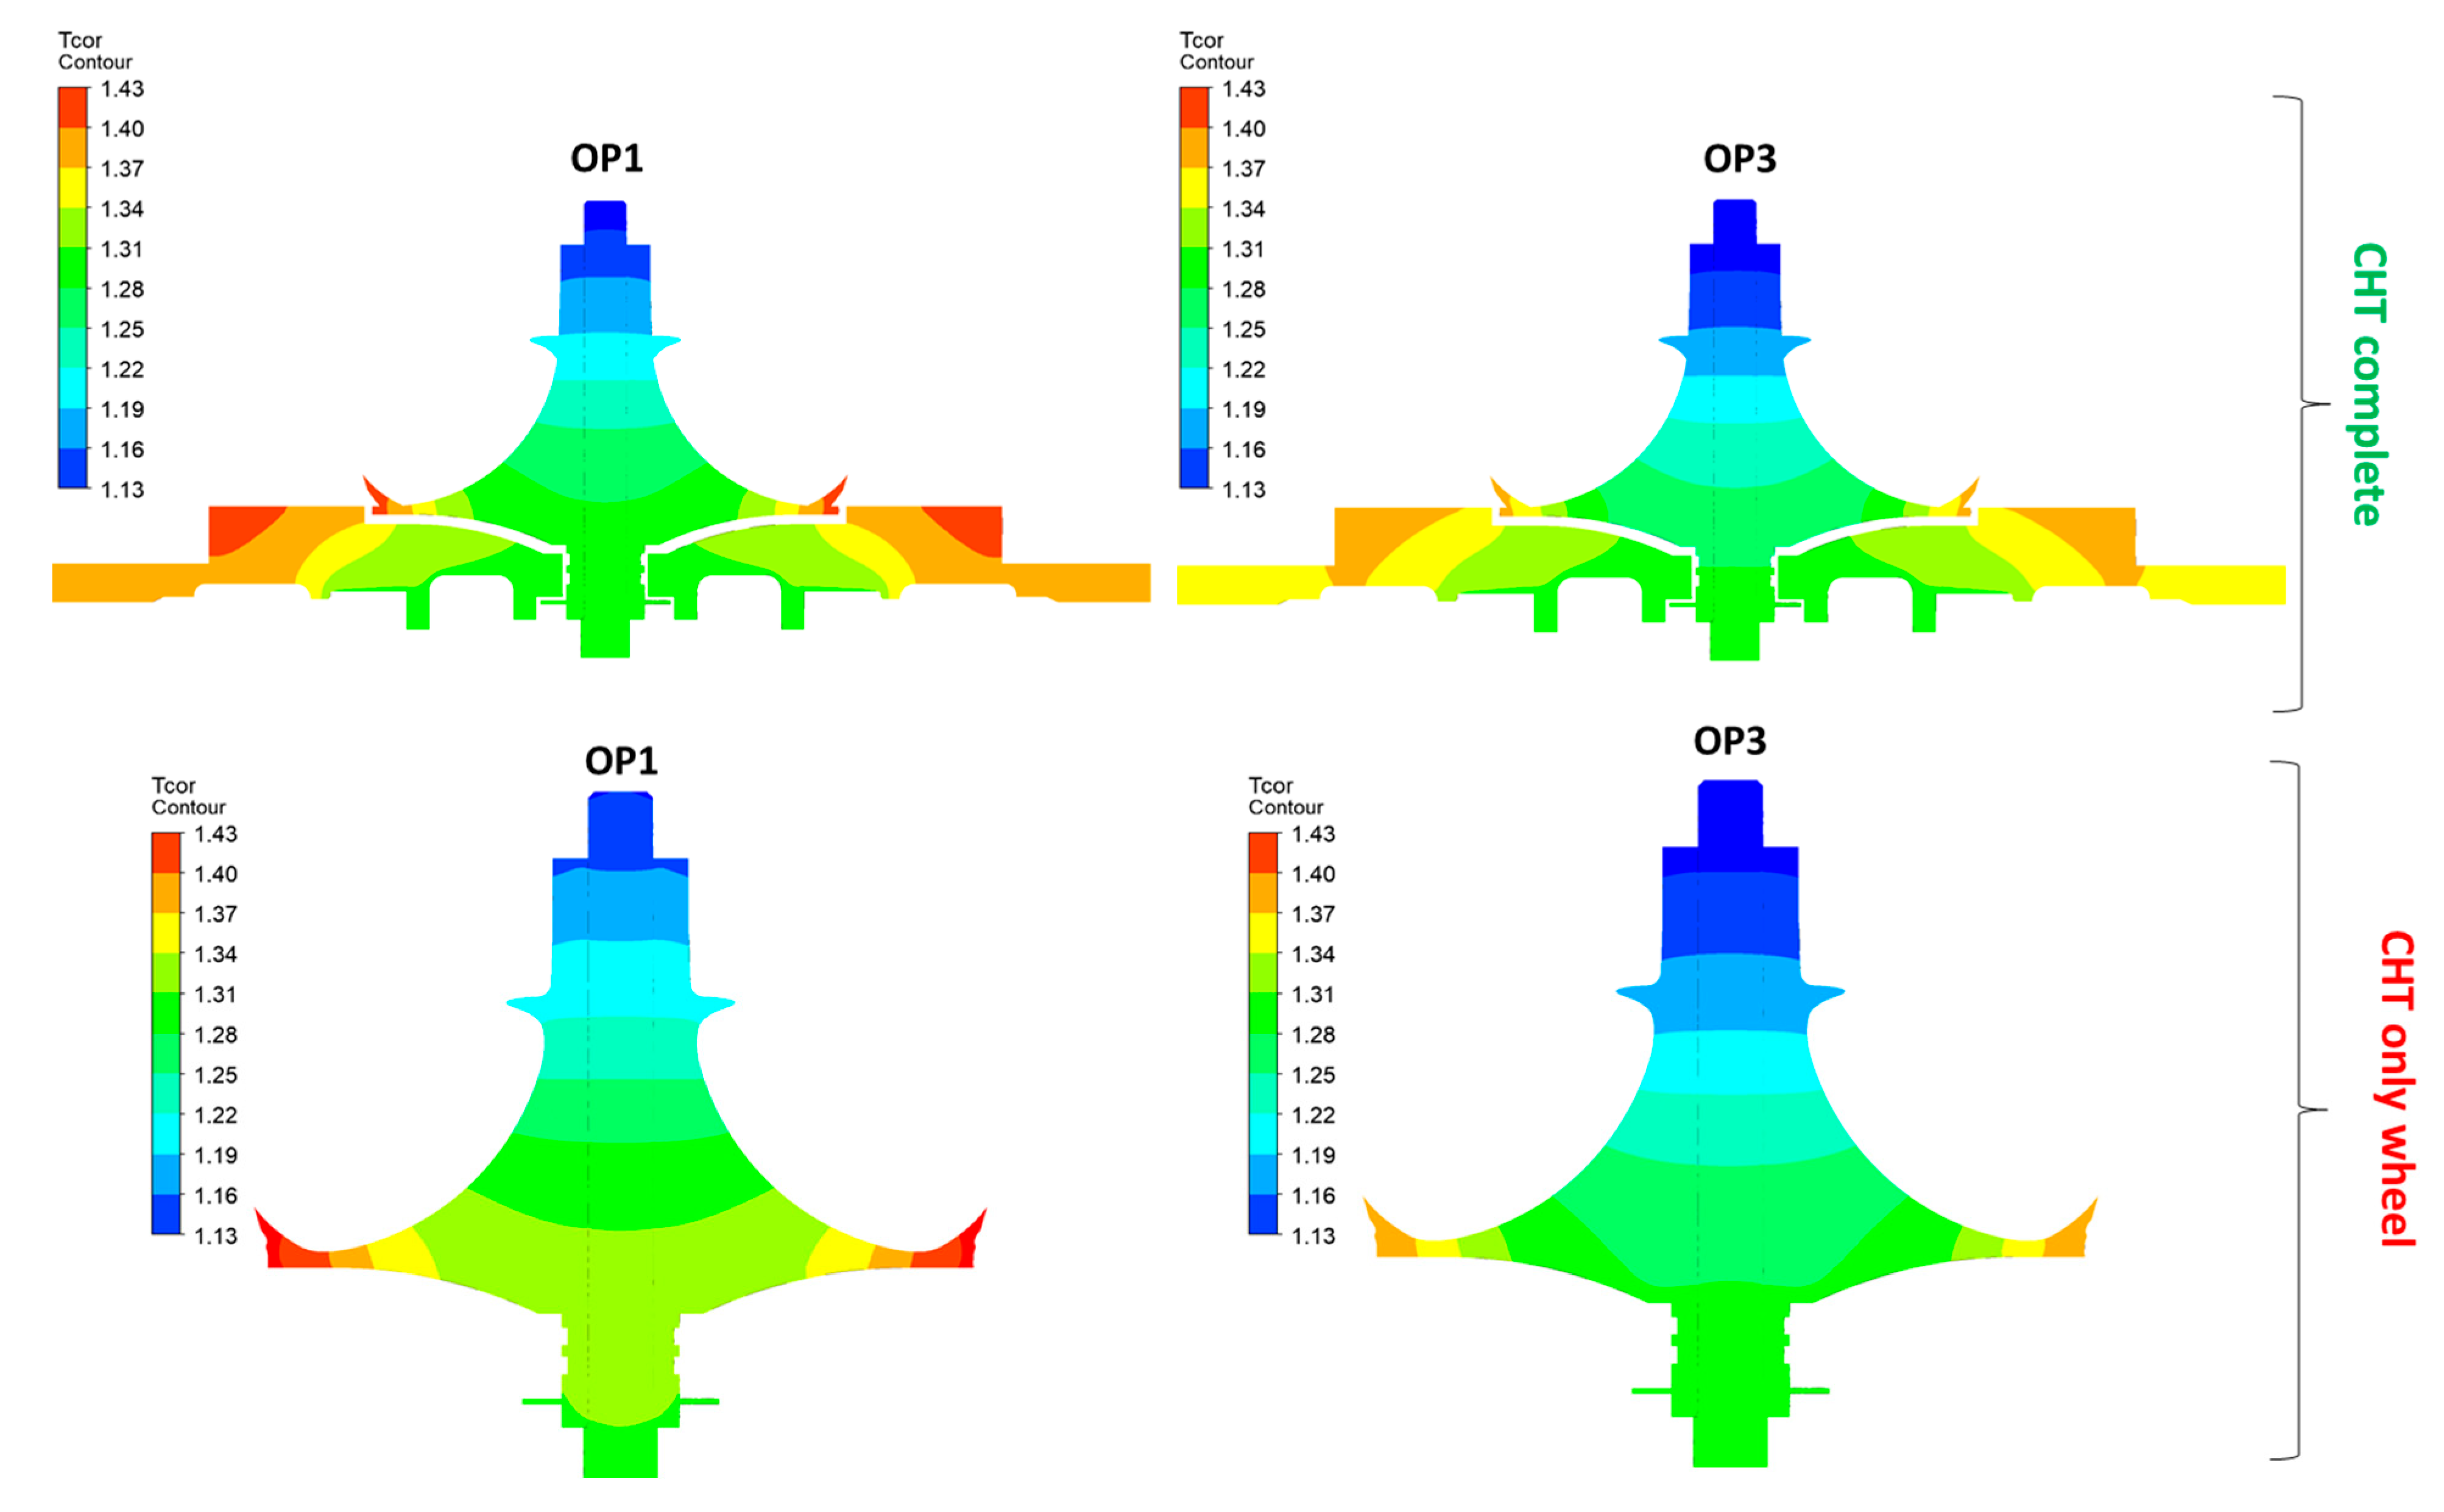
The distribution shows that compared to the adiabatic case, the two CHT models have more limited temperature gradients; in particular, due to the heat transfer from downstream to upstream, the inducer area has higher temperatures than in the adiabatic case. Instead, comparing the two CHT cases, the main difference occurs near the trailing edge, where in the case with also the seal plate slightly lower temperature values have been detected; in fact, in this last case, there is a heat transfer towards the outside through the thermal conduction in the seal plate. Quite similar considerations can also be made for the other operating conditions, for which the contours have not been reported for brevity reasons. Then, Figure 10 shows the internal corrected temperature distributions in a middle plane for the conditions OP1 and OP3, for the two CHT models.
This representation shows better the temperature differences in the trailing edge region under the same operating conditions, due to thermal conduction in the seal plate. In fact, in the CHT only wheel model, the fluid that leaks into the cavity under the wheel is modeled with an adiabatic condition with respect to the outside, while in the complete case this flow exchanges heat with the seal plate. This aspect has been highlighted in Figure 11, where higher temperature values in the CHT only wheel model have been highlighted. On the other hand, by comparing the two operating conditions OP1 and OP3 in Figure 10, higher temperature values are highlighted for the lower mass flow rate condition, because there is a greater pressure increase in the fluid despite a smaller flow quantity; therefore, under this condition the heat transfer from downstream to upstream is greater leading to a greater difference in performance towards the surge between the CHT models and the adiabatic one. Finally, in all cases it is observed how following the axial direction of the rotor the isotherms assume a radial pattern from constant to parabolic, generating higher thermo-mechanical stresses towards the trailing edge.
To further analyze the temperature difference trend along the impeller hub, Figure 12 shows the temperature distributions referred to the inlet total temperature for each operating condition, with the three different models.
These distributions show an almost linear trend on the temperature field on the impeller hub along the meridional coordinate in the CHT cases; moreover, higher temperature values at the inlet have been obtained than in the adiabatic case. Between the two CHT models, the more complete one has lower values than the only wheel case due to the heat exchange with this additional component; furthermore, it is quite evident how this difference is more marked at the trailing edge. Figure 13 shows the distributions of the ratio between the temperature obtained in the CHT models on the impeller hub and the one measured in the adiabatic case, for different operating conditions.
These distributions quantify the dispersion of the values found in the respective CHT model with respect to the values found in the adiabatic model. It can be seen how the values detected in the CHT models are higher for almost the entire meridional coordinate, presenting the maximum deviation of about 20% just before the middle; instead, at the trailing edge they are underestimated with respect to the adiabatic case. Between the two CHT cases, the curves of the complete case have values that are approximately 5% lower from the peak to the outlet. In both distributions it is highlighted how the curves have the same trend for all operating conditions, but they are shifted towards lower values when the operating flow rate increases. Such distributions can be useful for the eventual development of simplified models that do not include solid domains, to which a more correct conditioning is assigned instead of the more common adiabatic condition.
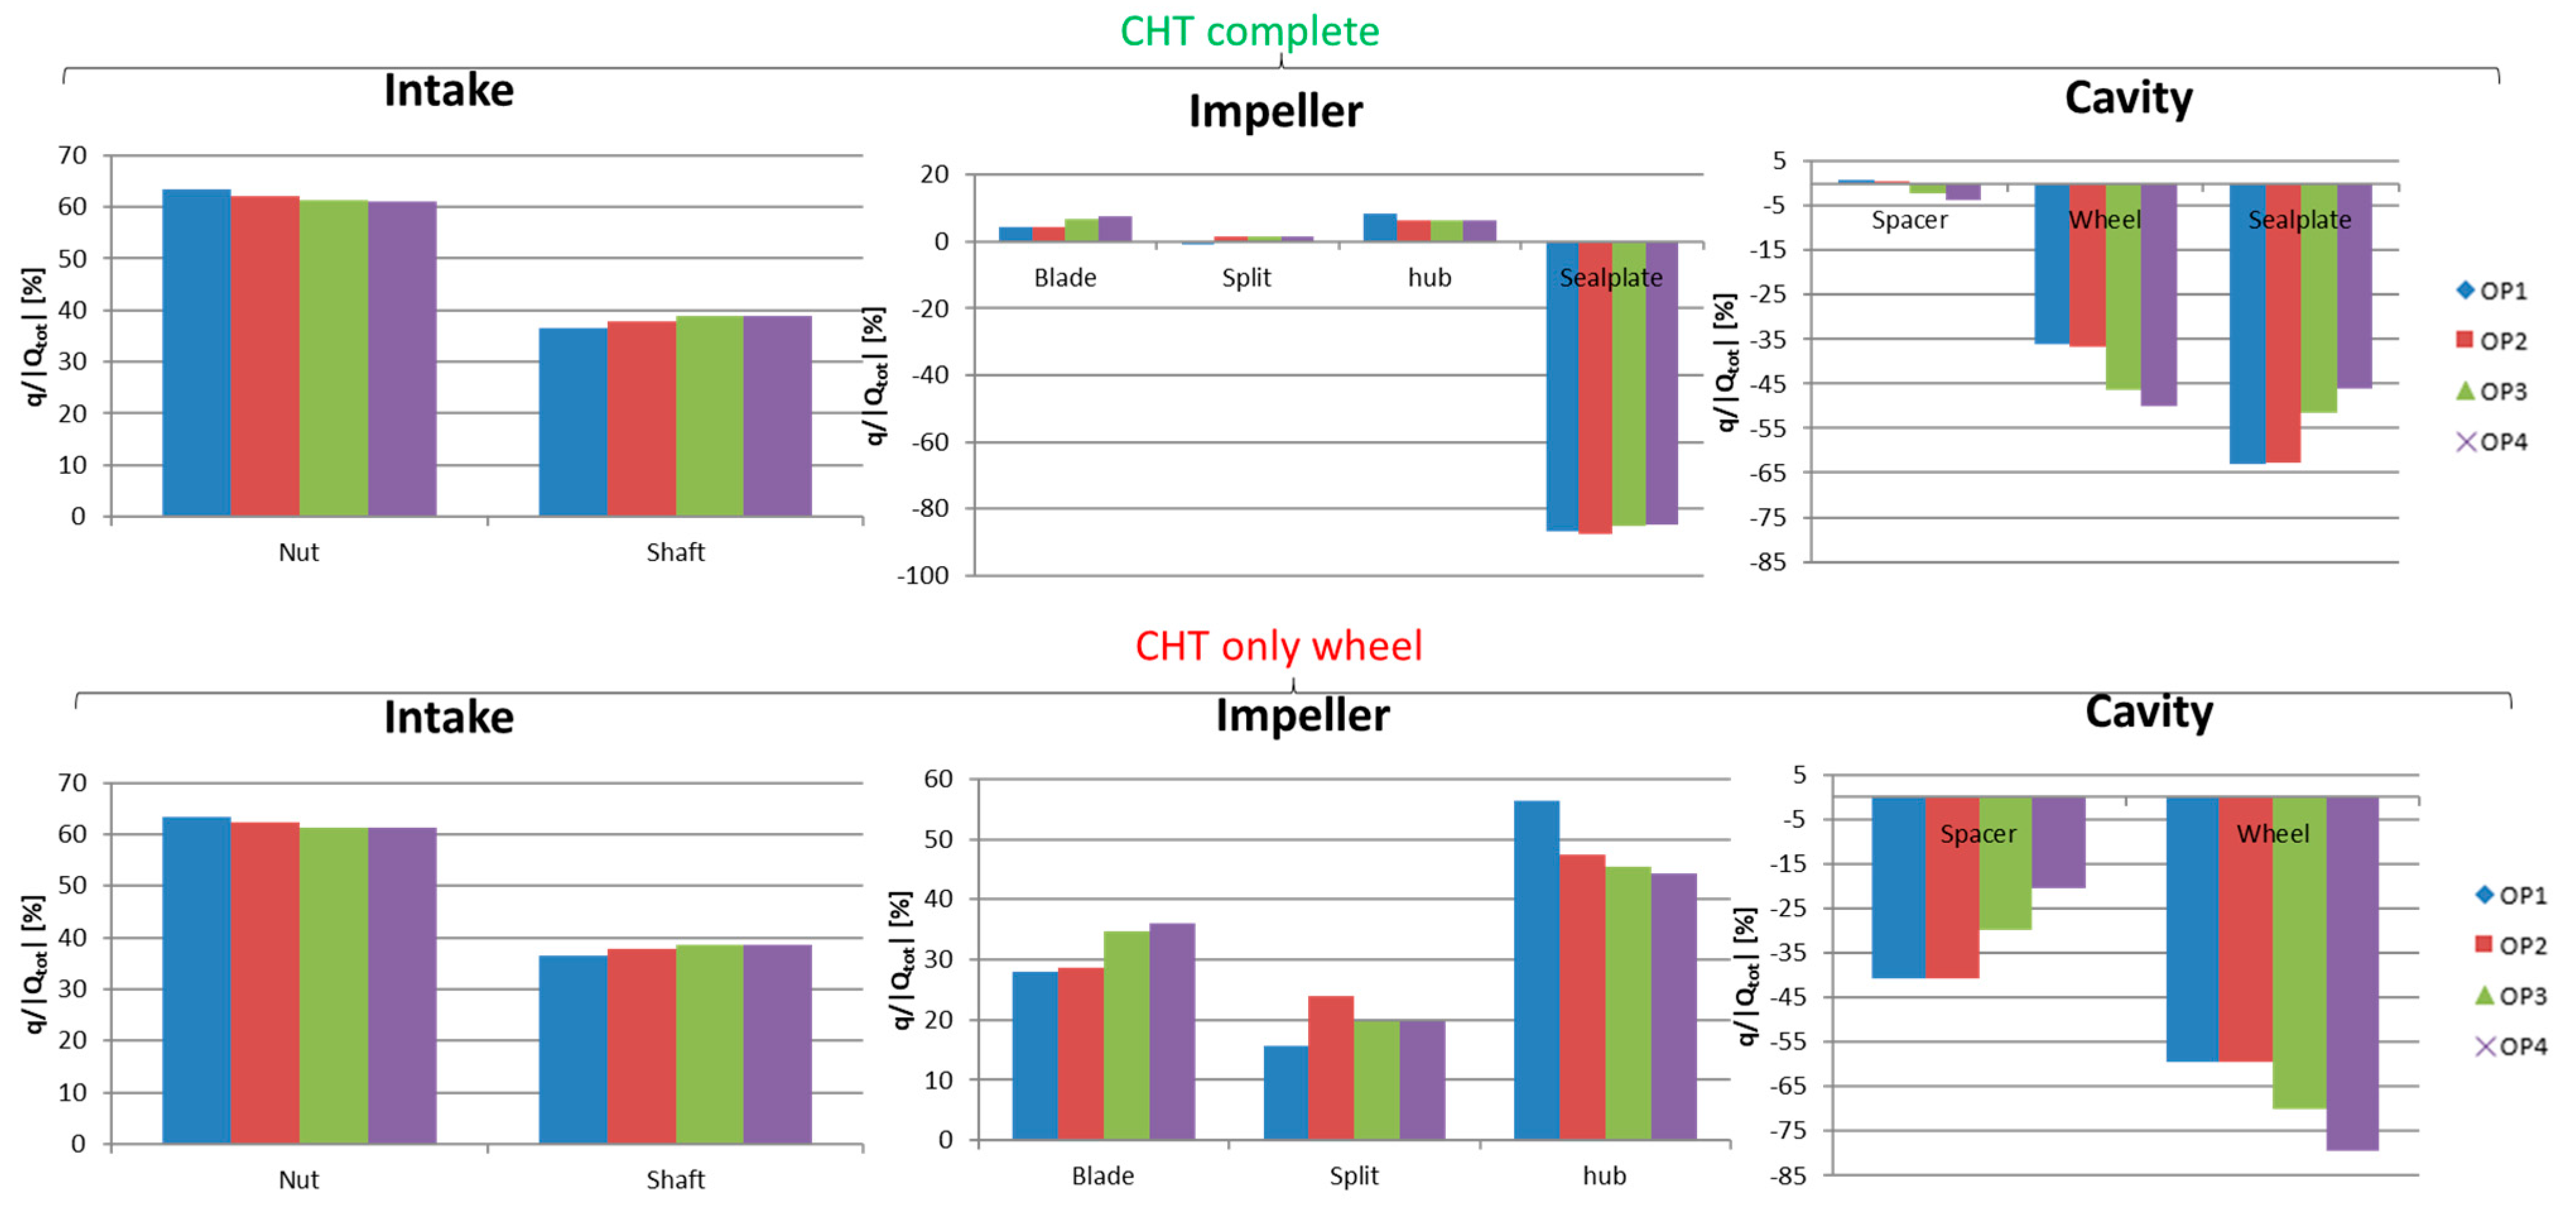
To analyze the thermal flows in the fluid domains with the various components, Figure 14 shows the histograms of q/|Qtot| [%] on the various patches, in the two CHT models, for the different operating conditions. It represents the ratio between the thermal flux q [W/m2] exchanged on a given patch to the sum the thermal fluxes of all patches (of the appropriate component) in absolute values, i.e. |Qtot| [W/m2]. The positive values mean that the thermal flow enters the fluid, while on the contrary the negative sign means that the thermal flow leaves the fluid domain.
By analyzing the intake domain, no particular differences are found between the two CHT cases, where a thermal flow (coming from downstream) enters the fluid distributed between the nut and the shaft for 60 and 40%, respectively. On the other hand, in the impeller significant differences were found between the two different models: in the CHT only wheel case, from the hub there are only thermal flows entering, where the hub is the component with the greatest entering thermal flow, followed by the main blade and the splitter with halved values; instead in the case with the seal plate, it is this last component that exchanges more and in particular that receives the hotter flow that dissipates towards the external environment. Actually, to obtain an absolute value of the thermal power, it is necessary to multiply the thermal flux by the exchange area, even if in the case between the impeller and the seal plate this area is rather modest. However, it follows that in the complete CHT case the thermal flows entering from the hub and from the blades are lower, and therefore the temperature values are lower than in the CHT only wheel case, as previously observed. Finally, in the cavity for both models there are thermal flows coming out of the fluid domain; in fact here there is a higher temperature flow coming from the impeller outlet. In particular, in the CHT only wheel case, the heat flow enters the rotor mainly from the wheel and less from the spacer; on the other hand, in the complete CHT case, the seal plate also comes into play which absorbs thermal power, removing it from the possibility of returning to the main flow from the wheel. The latter aspect is more evident for lower mass flow rates. For further information, Table 5 shows the energy exchanged by the seal plate with the various fluid domains under the OP1 condition.
It can be seen how the seal plate dissipates with the outside mainly due to the part in contact with the lubricating oil, while it receives heat above all from the diffuser (where the fluid with the highest energy is present) and continuing in decreasing importance level from the cavity and the impeller (which has the smallest portion of the exchange area).

4.2. Effect of the Seal Plate Conditioning

Given the importance of the seal plate for a more correct evaluation of the performance and heat exchanges between the compressor components, various boundary conditions have been considered. Initially, a different subdivision of the boundary conditions on the lower wall of the seal plate with different extension of the relative patches was simulated; while subsequently the influence of the oil temperature in the region of the seal plate close to the shaft was measured.

4.2.1. Different Patches

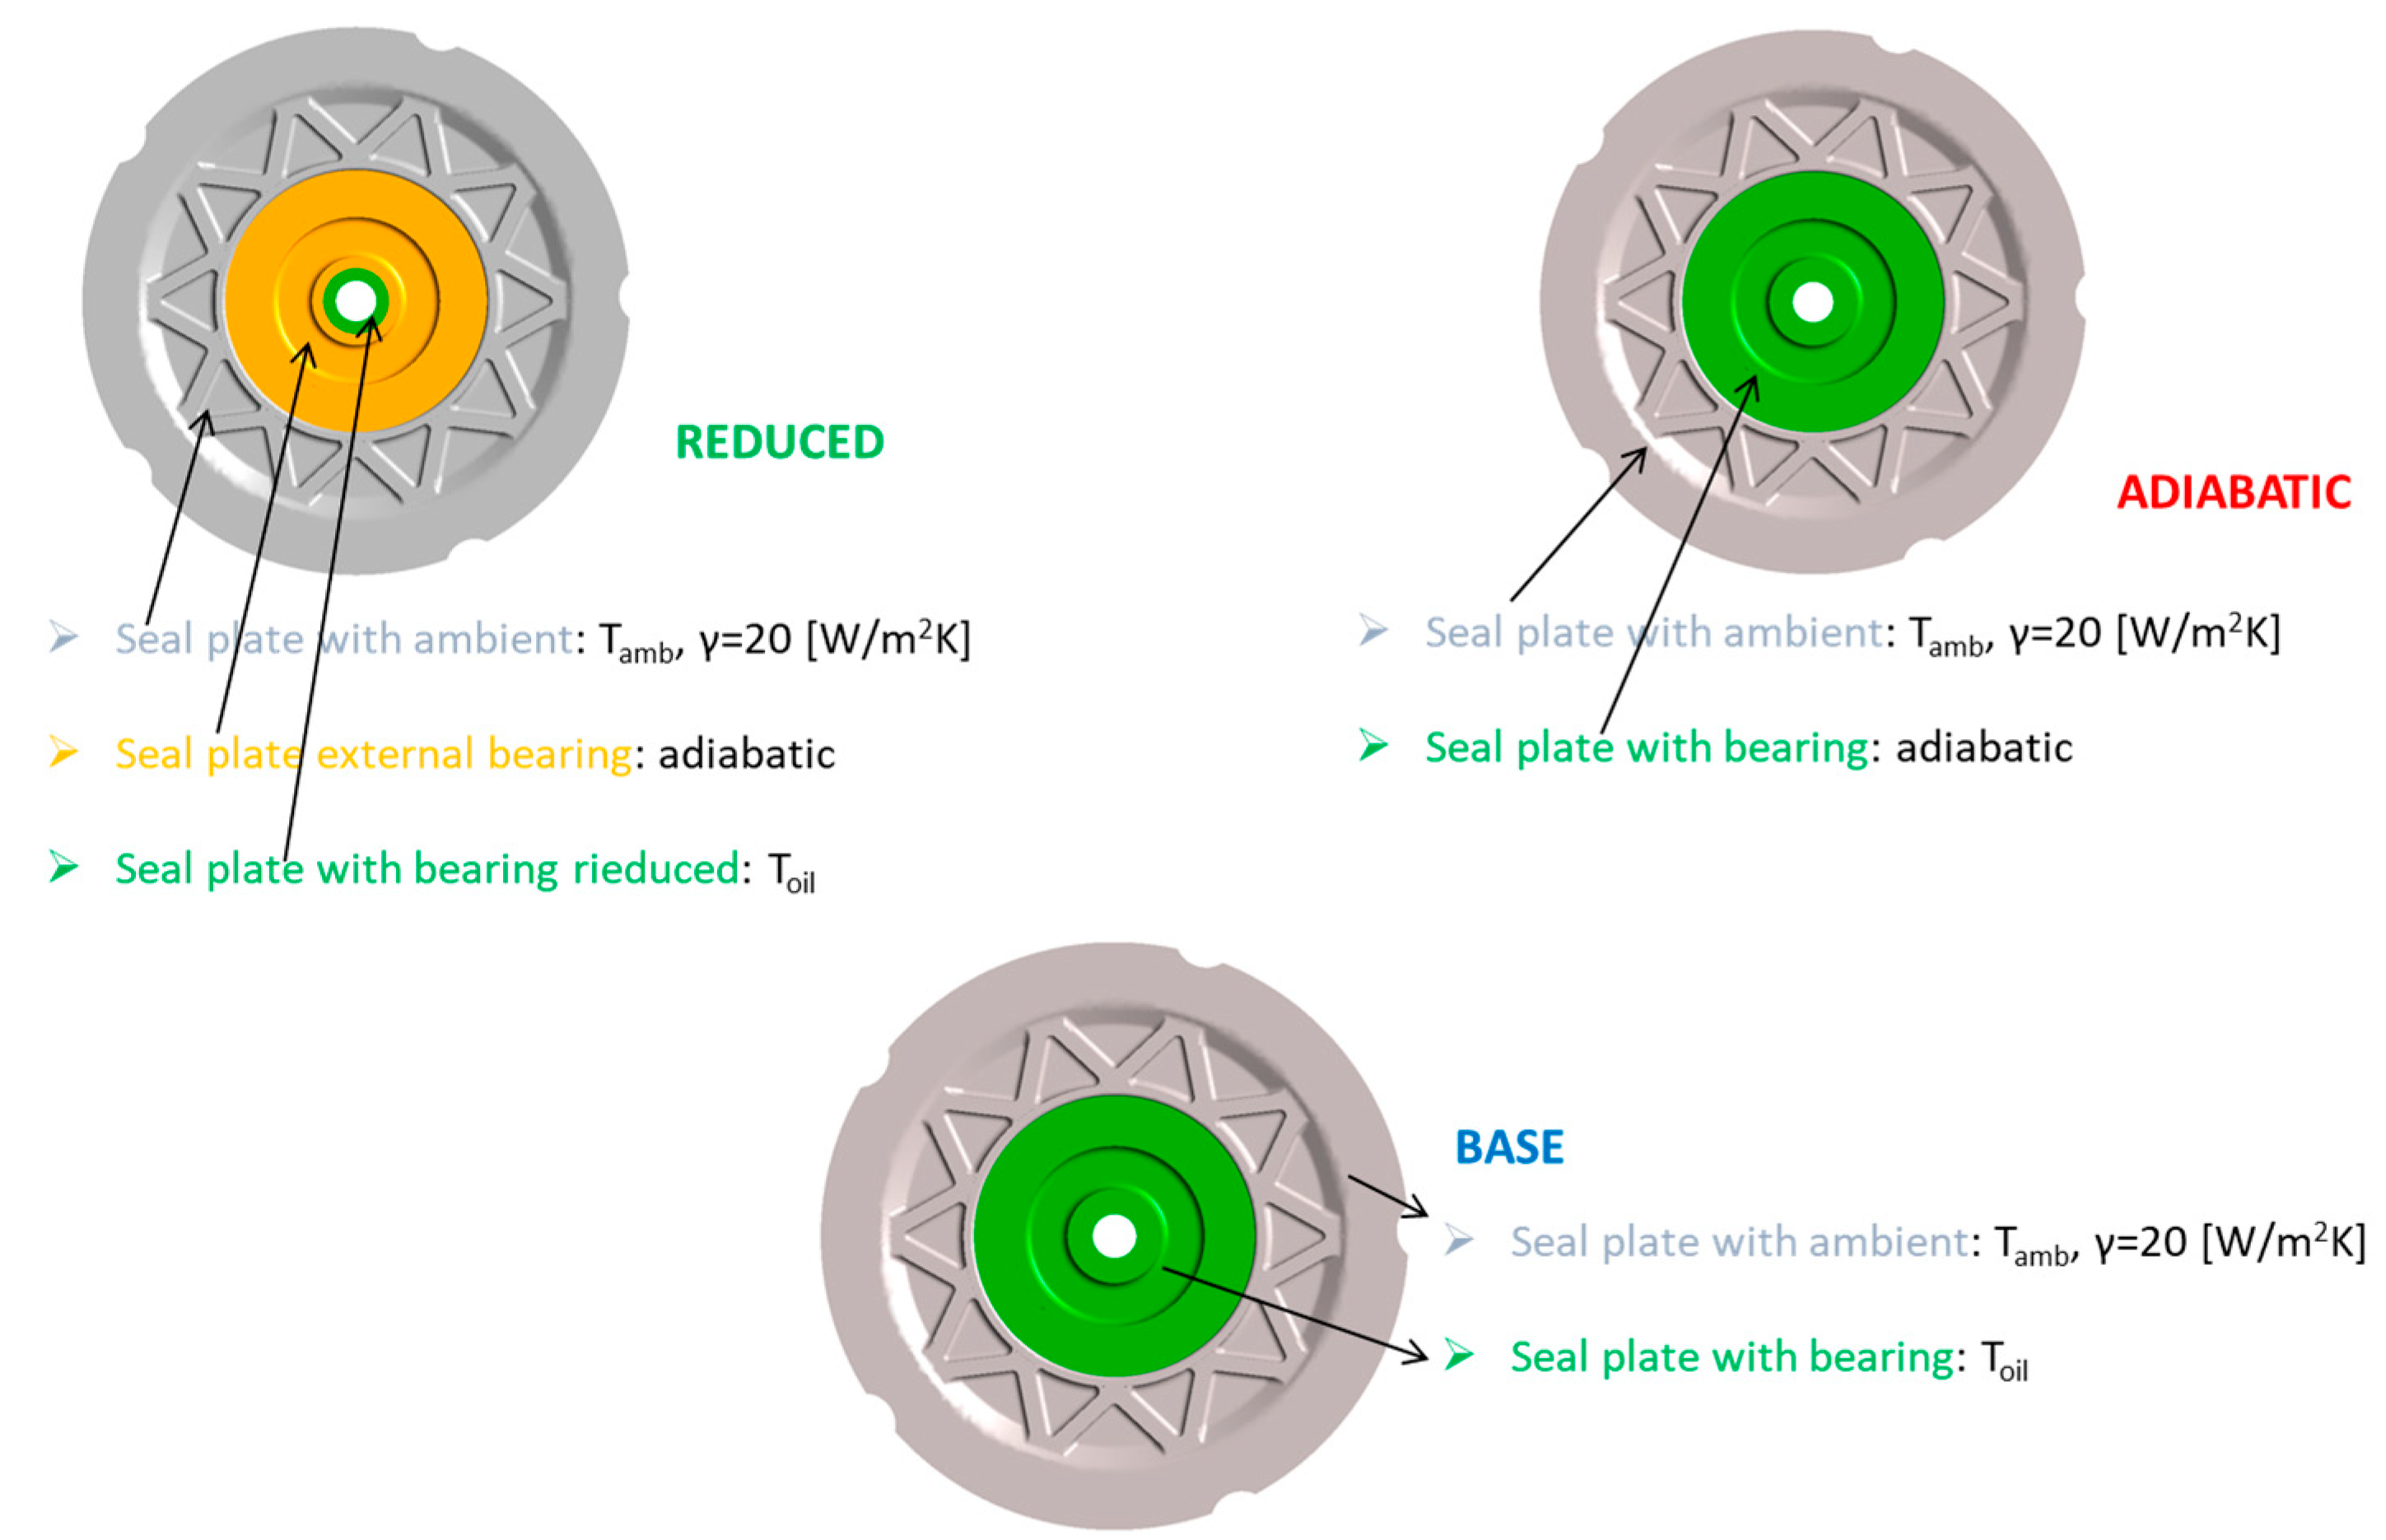
As regards the different patches on the lower surface of the seal plate, two cases have been considered in addition to the baseline one, where up to an intermediate radius a constant temperature is fixed, while from the intermediate to the maximum radius the heat exchange with the environment is considered by setting the convective coefficient γ = 20 W/m2K and an ambient temperature. Then, an adiabatic case is defined, in which an adiabatic condition was established on the internal surface up to the intermediate radius, while in the subsequent portion the same condition of convective exchange with the environment; finally in the third case, called reduced, the condition of constant oil temperature was reduced to a very limited region (highlighted in green), then in an intermediate region (in orange) the adiabatic condition is set, then from the intermediate radius again the heat exchange with the environment is defined. Figure 15 shows a scheme of the three different cases.
Figure 16 reports the distribution of the ratio T/Tt1 along the hub for the three cases, under the OP2 condition.
From this trend, which is also quite similar for the other mass flow rates, it can be observed how the adiabatic and reduced cases overestimate the temperature with maximum deviations obtained towards the trailing edge, respectively, of 7% and 5%. It is therefore clear how reducing the extension or eliminating the fixed oil T-zone reduces the heat dissipation from the seal plate and consequently the rotor stays hotter. To evaluate the performance influence of the different boundary conditions, Table 6 reports the performance variations of the adiabatic and reduced cases with respect to the baseline under different operating conditions, for the reference isospeed.
From the comparison, it is evident (in order of increasing effect) how the reduced case and the adiabatic case show lower performances regarding both the PR and especially the efficiency, because by removing less heat to the outside, the amount of heat recirculating from downstream to upstream is greater; hence the fluid to be compressed remains at a slightly higher temperature, at a lower density, and is more difficult to compress for the same amount of work. These variations are more marked at lower mass flow rates.

4.2.2. Different Oil Temperatures

In this case, the uniform temperature fixed on the patch containing lubricating oil has been varied with respect to the original condition of the seal plate. Table 7 reports the performance variations by varying the oil temperature with respect to the original case, for the reference isospeed.
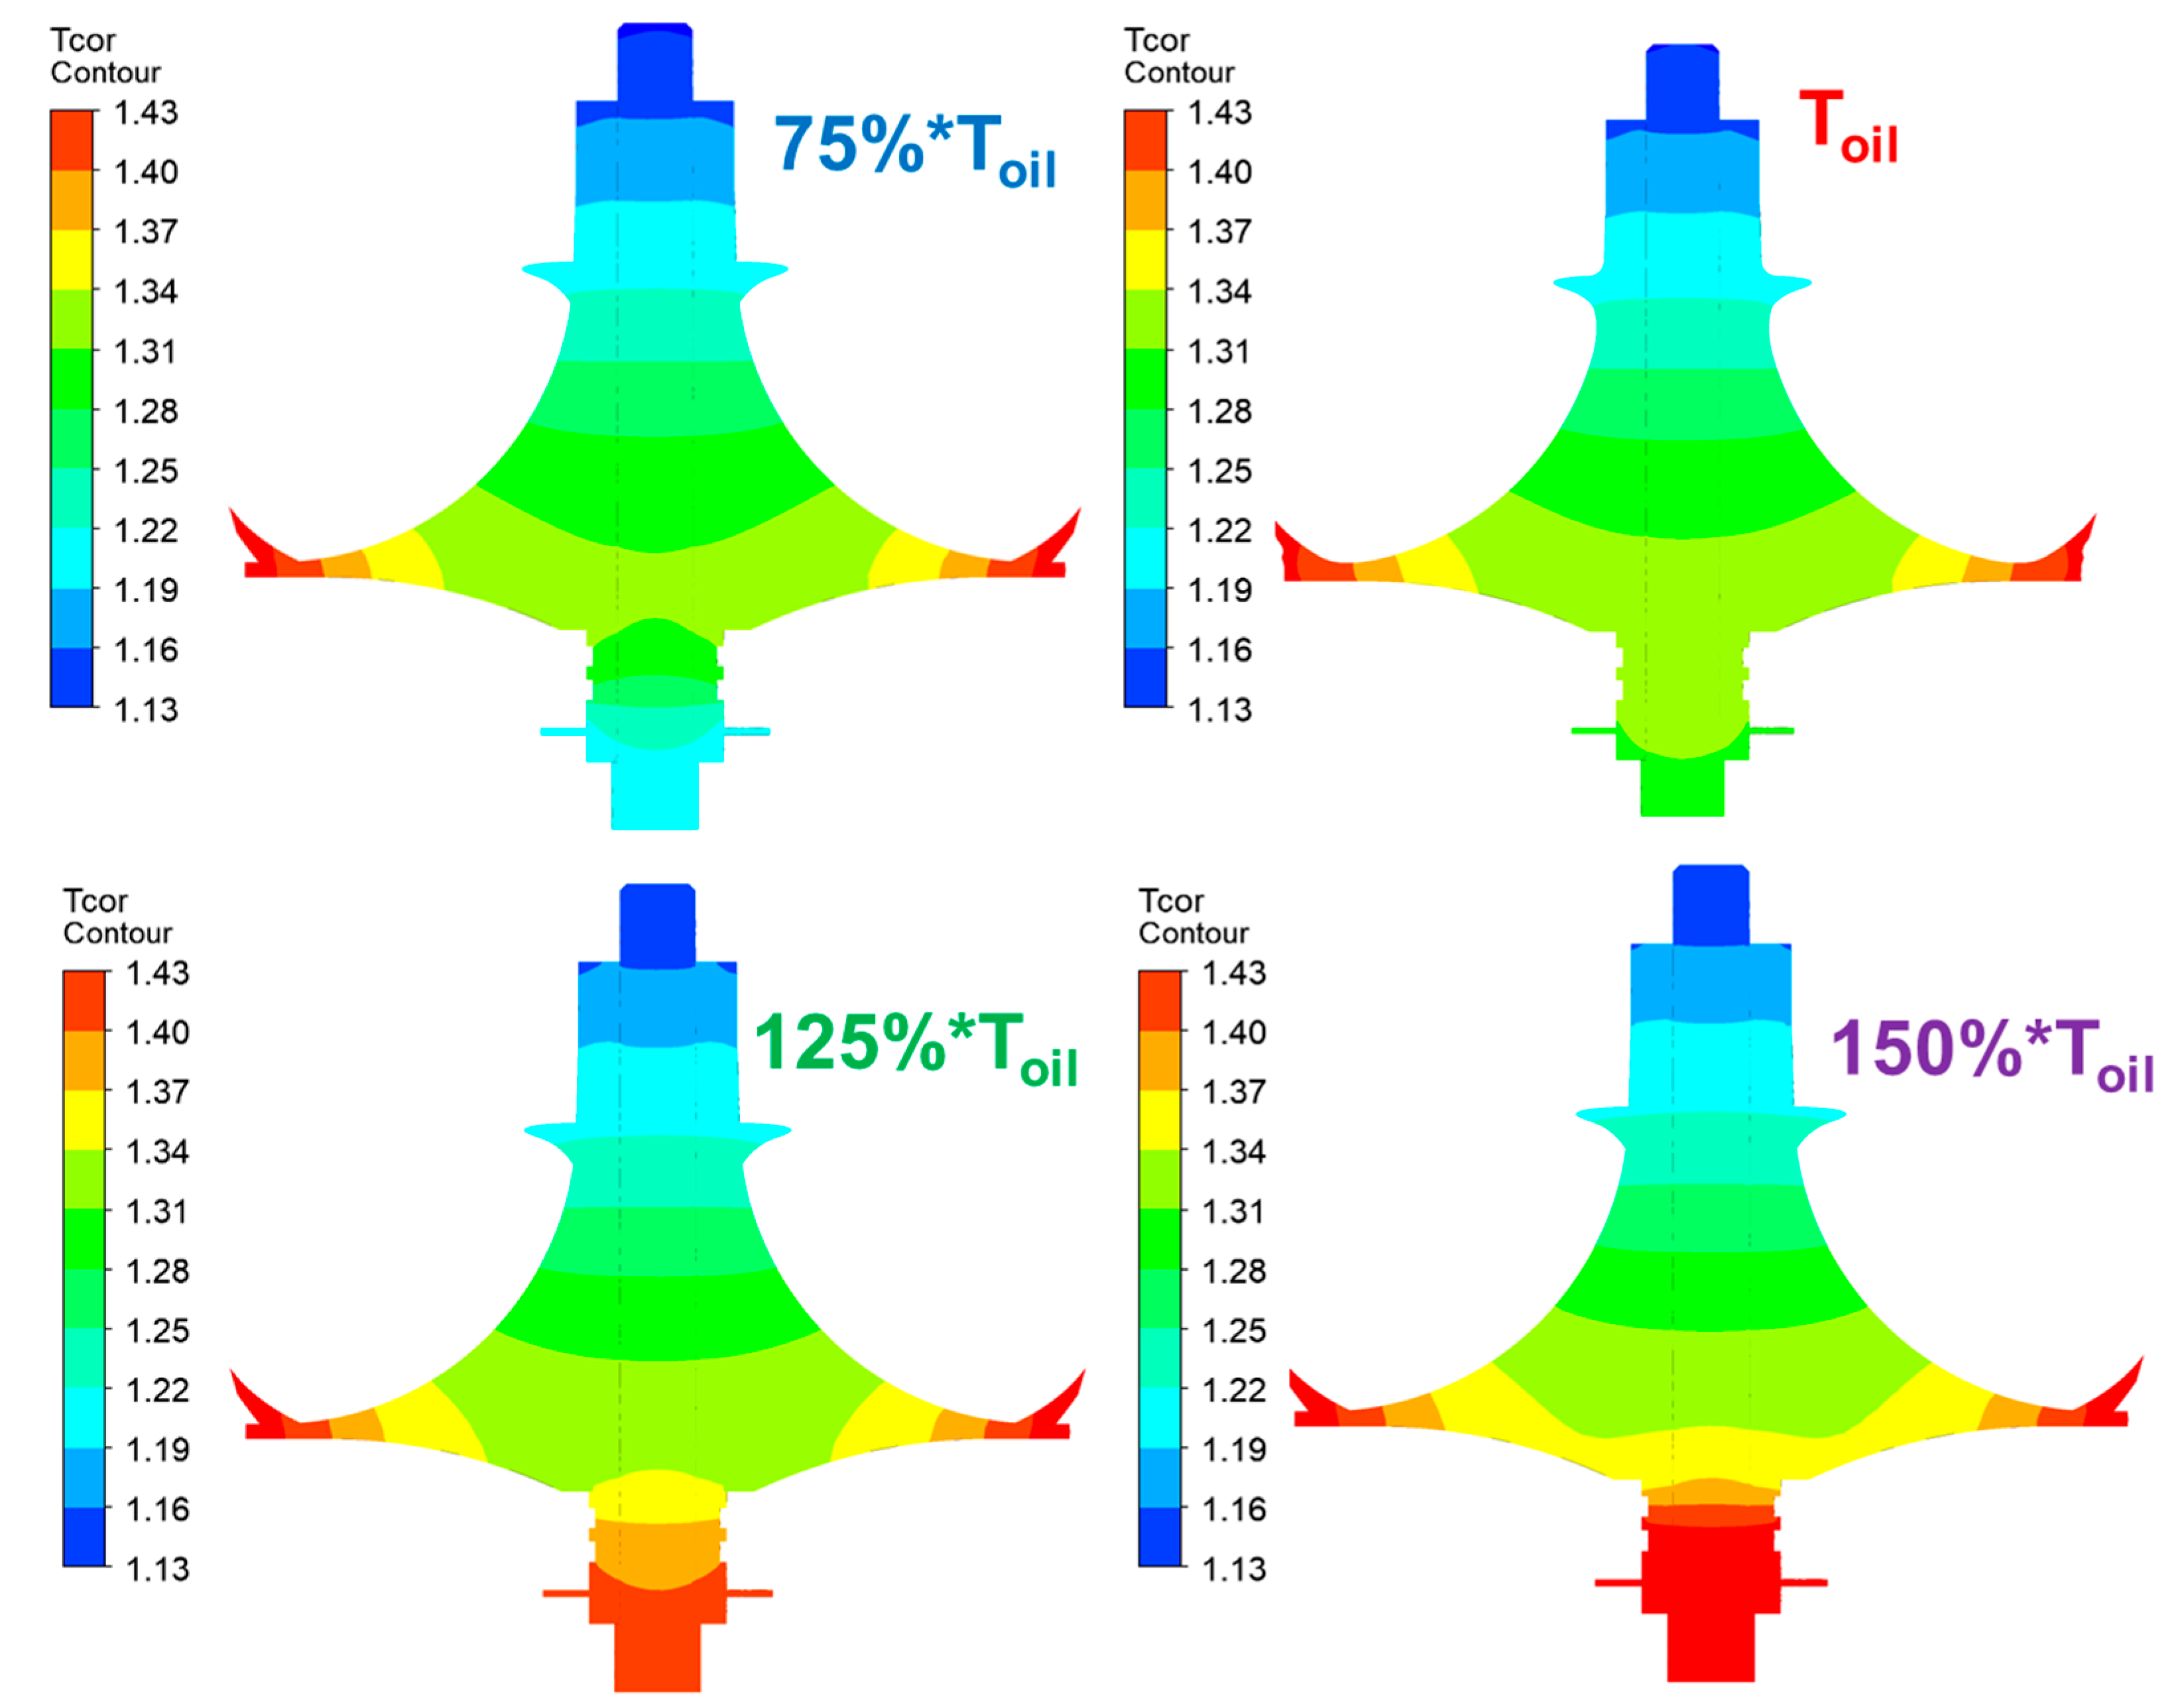
In this case, extremely limited variations in the PR and efficiency have been found, highlighting how the uncertainty of this parameter leads to completely negligible errors. However, by analyzing the trend in more detail, it can be observed that as the lubrication temperature increases, there is a slight decrease in the PR. In this regard, Figure 17 shows the corrected temperature distributions on the middle plane of the rotor with the different temperatures of the fixed oil, under the OP2 condition.
From these distributions it can be observed that in the case of higher oil temperatures the temperature in the rotor remains slightly higher with the same isotherms translated towards the inlet. Therefore, it is clear that the fluid to be compressed is hotter, less dense and therefore more expensive to compress. This is also favored by the lower heat exchange of the hot fluid with the back rotor face which leaks into the cavity, due to the lower thermal gradient which is created with a higher oil temperature condition.

4.3. Effect of the Heat Exchange of the Shroud

Finally, in this sub-section the effect of the thermal exchange of the shroud with the outside has been also evaluated. So, instead of setting the adiabatic condition, a correct transmittance at an external ambient temperature was imposed, without including the respective solid domain. To model the shroud, the thermal transmittance relationship of a cylindrical shell (Equation (13)) for the section from the inlet to the impeller outlet and the transmittance of a flat plate (Equation (14)) for the section of the diffuser are used. These transmittances consider both the thermal conduction in the solid (assumed with a uniform thickness equal to 5 mm) with a thermal conductivity K = 151 W/mk and the thermal convection with the outside through the convective thermal coefficient γ = 20 W/m2K.
U = 1 R e x t   l n R e x t   R i n t K + 1 γ
U = 1 1 K + 1 γ
Table 8 reports the performance variation in the shroud case with transmittance with respect to the adiabatic shroud, for different operating conditions.
This effect on performance is completely negligible; in fact the energy dissipation to the outside and the lowering of the inlet temperature (and consequent density increase) tend to compensate for each other. In particular, a positive effect on the PR begins to be noticed at minimum flow rates, where it is therefore less expensive to compress a slightly colder fluid.

5. Conclusions

In this work different CFD models including the real solid components of a centrifugal compressor for turbocharging have been presented to simulate conjugate heat transfer. The first model includes the rotor as a solid component, while the second more complete one also includes the seal plate, in order to quantify the deviation that is detected in the performance compared to an adiabatic model, under different operating conditions. Differences of between 1 to 2% have been found in the pressure ratio and differences of up to 4% in isentropic efficiency, which would cause coupling problems with the turbine if not considered. Through thermal analysis it has been observed how the thermal flow coming from downstream to upstream heats the flow before the leading edge, lowering the density of the fluid and making it more difficult to compress. When the seal plate is included, it reduces the amount of this heat recirculation, partially removing it towards the outside; consequently, the temperature obtained at the impeller outlet is partially lowered, but the negative effect of the fluid overheating at the impeller inlet is also reduced. Furthermore, the importance of the presence of the back cavity to be modelled has been verified, not only in CHT models, but directly for the adiabatic model. Then, different boundary conditions on the seal plate have been considered, with a different extension of the patches on its lower surface and a different lubricating oil temperature, in order to evaluate the uncertainty of the performance and of rotor temperature. It was found that reducing the contact area between the seal plate and the lubricating oil limits heat transfer to the outside, while changes in oil temperature have a minor impact. However, increasing the oil temperature reduces heat dissipation to the external environment. The impact of heat exchange between the shroud and the external environment was assessed by introducing an appropriate thermal transmittance. This revealed a trade-off between external energy dissipation and a reduction in compressor inlet temperature, leading to an improved compression process.
The main objective was to conduct a sensitivity analysis on the performance and temperature distribution for a centrifugal compressor rotor using a CFD model with CHT at different complexity levels compared to the adiabatic conditions. The final goal was to determine the accuracy required in the rotor temperature profiles needed to set boundary conditions and thermal loads in the thermo-structural simulations of the rotor.
In a future work, the development of an analytical model will be presented, de-signed to calibrate thermal loads without resorting to computationally expensive CFD simulations with CHT models. This analytical model will allow for a faster determination of the internal temperature distribution on the rotor while maintaining a good level of precision, thus providing a valuable alternative for the thermal analysis of compressors during the design and optimization phases.

Author Contributions

All the authors have equally contributed to the concept of the research activity, the setup of the model, the discussion of the results and the writing of the paper. All authors have read and agreed to the published version of the manuscript.

Funding

This research received no external funding.

Data Availability Statement

The original contributions presented in the study are included in the article; further inquiries can be directed to the corresponding author.

Acknowledgments

The research team from the University of Genova is grateful to the technical group of Ferrari SpA for their support in the discussion of the complex topics involved in this paper and for the peculiar opportunity to work on this very specific and difficult application.

Conflicts of Interest

Author Pierre-Alain Hoffer, Daniele Mattiello and Luigi Mosciaro were employed by the company Ferrari SpA. The remaining authors declare that the research was conducted in the absence of any commercial or financial relationships that could be construed as a potential conflict of interest.

Nomenclature

bSpan height
EThermal power
hEnthalpy
kTurbulent kinetic energy
KThermal conductivity
Mass flow rate
MRFMass flow ratio
pStatic pressure
PRPressure ratio
qThermal flux
QTotal thermal flux
RRadius
tTime
TTemperature
uVelocity
UThermal transmittance
Y+Non dimensional boundary layer distance from wall
ZbBlades number
γThermal convective coefficient
εRate of dissipation of turbulent kinetic energy
ηEfficiency
μViscosity
ρDensity
τTensor of tangential and normal stress
ωSpecific rate of dissipation
Subscripts
0Model inlet (adduction duct inlet)
4Diffuser inlet
5Diffuser outlet
ambAmbient
corCorrected
extExternal
intInternal
LELeading edge
ttotal
TETrailing edge

References

  1. European Commission Website. A European Green Deal—Striving to Be the First Climate-Neutral Continent. Available online: https://ec.europa.eu/info/strategy/priorities-2019-2024/european-green-deal_en (accessed on 10 March 2025).
  2. Casey, M.A. Computational geometry for the blades and internal flow channels of centrifugal compressors. In Proceedings of the ASME 1982 International Gas Turbine Conference and Exhibit, London, UK, 18–22 April 1982; p. V001T01A062. [Google Scholar]
  3. Bonaiuti, D.; Arnone, A.; Ermini, M.; Baldassarre, L. Analysis and optimization of transonic centrifugal compressor impellers using the design of experiments technique. J. Turbomach. 2006, 128, 786–797. [Google Scholar] [CrossRef]
  4. Kim, J.H.; Choi, J.H.; Husain, A.; Kim, K.Y. Multi-objective optimization of a centrifugal compressor impeller through evolutionary algorithms. Proc. Inst. Mech. Eng. Part A J. Power Energy 2010, 224, 711–721. [Google Scholar] [CrossRef]
  5. Mojaddam, M.; Pullen, K.R. Optimization of a centrifugal compressor using the design of experiment technique. Appl. Sci. 2019, 9, 291. [Google Scholar] [CrossRef]
  6. Fisher, F.B. Application of Map Width Enhancement Devices to Turbocharger Compressor Stages. J. Engines 1988, 97, 1303–1310. [Google Scholar]
  7. Zheng, X.; Zhang, Y.; Yang, M.; Bamba, T.; Tamaki, H. Stability Improvement of High-Pressure-Ratio Turbocharger Centrifugal Compressor by Asymmetrical Flow Control—Part II: Nonaxisymmetrical Self-Recirculation Casing Treatment. J. Turbomach. 2002, 135, 021007. [Google Scholar] [CrossRef]
  8. Li, Z.; Han, G.; Lu, X.; Huang, E.; Zhao, S. Improving the operating range using a centrifugal compressor with a tandem impeller. Aerosp. Sci. Technol. 2020, 96, 105548. [Google Scholar] [CrossRef]
  9. Denton, J.D. Loss mechanisms in turbomachines. J. Turbomach. 1993, 115, 621–657. [Google Scholar] [CrossRef]
  10. Rautenberg, M.; Mobarak, A.; Malobabic, M. Influence of heat transfer between turbine and compressor on the performance of small turbochargers. In Tokyo International Gas Turbine Congress; Gas Turbine Society of Japan: Tokyo, Japan, 1983; Volume 2, pp. 567–574. [Google Scholar]
  11. Shaaban, S.; Seume, J. Impact of turbocharger nonadiabatic operation on engine volumetric efficiency and turbo lag. Int. J. Rotating 2012, 2012, 625453. [Google Scholar]
  12. Kim, H.R.; Kim, K.Y.; Jeong, J.; Song, S.J. An analysis of heat transfer effect on surge characteristics in turbo heat pumps. In Proceedings of the International Compressor Engineering Conference, Purdue, IN, USA, 12–15 July 2010; p. 1521. [Google Scholar]
  13. Chesse, P.; Chalet, D.; Tauzia, X. Impact of the heat transfer on the performance calculations of automotive turbocharger compressor. Oil Gas Sci. Technol. 2011, 66, 791–800. [Google Scholar] [CrossRef]
  14. Shaaban, S. Experimental Investigation and Extended Simulation of Turbocharger Non-Adiabatic Performance. Ph.D. Thesis, Universite de Hannover, Hanover, Germany, 2004. [Google Scholar]
  15. Serrano, J.R.; Olmeda, P.; Vidal, F. An experimental procedure to determine heat transfer properties of turbochargers. Meas. Sci. Technol. 2010, 21, 035109. [Google Scholar] [CrossRef]
  16. Jung, M.; Ford, R.G.; Glover, K.; Collings, N.; Christen, U.; Watts, M.J. Parameterization and transient validation of a variable geometry turbocharger for mean-value modeling at low and medium speed-load points. In Proceedings of the SAE Powertrain and Fluid Systems Conference, San Diego, CA, USA, 21–24 October 2002; p. 2002-01-2729. [Google Scholar]
  17. Aghaali, H. On-Engine Turbocharger Performance Considering Heat Transfer. Licentiate Thesis, Royal Institute of Technology, Stockholm, Sweden, 2012. [Google Scholar]
  18. Bohn, D.; Heuer, T.; Kusterer, K. Conjugate flow and heat transfer investigation of a turbo charger. J. Eng. Gas Turbines Power 2005, 127, 663–669. [Google Scholar] [CrossRef]
  19. Geller, M.; Kluck, N.; Magiera, R. Numerical computation of heat transfer coefficient for a radial compressor stage using CFD and comparison with analytical model computations. In Proceedings of the 24th CADFEM Users’ Meeting, Schwabenlandhalle Stuttgart/Fellbach, Germany, 25–27 October 2006. [Google Scholar]
  20. Cormerais, M.; Chesse, P.; Hetet, J. Turbocharger heat transfermodeling under steady and transient conditions. Int. J. Thermodyn. 2009, 12, 193–202. [Google Scholar]
  21. Baines, N.; Wygant, K.D.; Dris, A. The analysis of heat transfer in automotive turbochargers. J. Eng. Gas Turbines Power 2010, 132, 042301. [Google Scholar] [CrossRef]
  22. Moosania, S.M.; Zheng, X. Effect of internal heat leakage on the performance of a high pressure ratio centrifugal compressor. Appl. Therm. Eng. 2017, 111, 317–324. [Google Scholar] [CrossRef]
  23. Gu, L.; Zemp, A.; Abhari, R.S. Numerical study of the heat transfer effect on a centrifugal compressor performance. Proc. Inst. Mech. Eng. Part C J. Mech. Eng. Sci. 2015, 229, 2207–2220. [Google Scholar] [CrossRef]
  24. Cui, M.; Hohlweg, W. Numerical and experimental investigation of heat transfer in a low flow single stage centrifugal compressor. In Proceedings of the ASME Turbo Expo 2016: Turbomachinery Technical Conference and Exposition, Seoul, Republic of Korea, 13–17 June 2016; Volume 49729, p. V02DT42A030. [Google Scholar]
  25. Diefenthal, M.; Tadesse, H.; Rakut, C.; Wirsum, M.; Heuer, T. Experimental and numerical investigation of temperature fields in a radial turbine wheel. In Proceedings of the ASME Turbo Expo 2014: Turbine Technical Conference and Exposition, Düsseldorf, Germany, 16–20 June 2014; Volume 45585, p. V01BT24A015. [Google Scholar]
  26. Roclawski, H.; Oberste-Brandenburg, C.; Böhle, M. Conjugate Heat Transfer Analysis of a Centrifugal Compressor for Turbocharger Applications. In Proceedings of the 16th International Symposium on Transport Phenomena and Dynamics of Rotating Machinery, Honolulu, HI, USA, 10–15 April 2016. [Google Scholar]
  27. Romagnoli, A.; Martinez-Botas, R. Heat transfer analysis in a turbocharger turbine: An experimental and computational evaluation. Appl. Therm. Eng. 2012, 38, 58–77. [Google Scholar] [CrossRef]
  28. Cormerais, M.; Hetet, J.F.; Chesse, P.; Maiboom, A. Heat transfer analysis in a turbocharger compressor: Modeling and experiments. In Proceedings of the SAE 2006 World Congress & Exhibition, Detroit, MI, USA, 3–6 April 2006; p. SAE 2006-01-0023. [Google Scholar]
  29. Abdelhamid, S.; Berndt, R.; Grigoriadis, P.; Hagelstein, D.; Nickel, J.; Pucher, H.; Seume, J.R. Advanced presentation and extrapolation of turbocharger maps as a boundary condition of the engine process simulation. In Proceedings of the Stuttgart International Symposium on Motor Vehicles and Engines, Stuttgart, Germany, 2–3 July 2003. [Google Scholar]
  30. Chapman, K.S.; Nguru, R.; Shultz, J. Simplified Methodology to Correct Turbocharger Field Measurements for Heat Transfer and Other Effects; Final Report for Gas Research Institute; Gas Technology Institute: Des Plaines, IL, USA, 2002; p. GRI-02/0156. [Google Scholar]
  31. Bardelli, M.; Cravero, C.; Marini, M.; Marsano, D.; Milingi, O. Numerical Investigation of Impeller-Vaned Diffuser Interaction in a Centrifugal Compressor. Appl. Sci. 2019, 9, 1619. [Google Scholar] [CrossRef]
  32. Cravero, C.; Marsano, D. Criteria for the Stability Limit Prediction of High-Speed Centrifugal Compressors with Vaneless Diffuser. Part I: Flow Structure Analysis. In Proceedings of the ASME Turbo Expo 2020: Turbomachinery Technical Conference and Exposition, Online, 21–25 September 2020; ASME: New York, NY, USA, 2020; p. GT2020-14579. [Google Scholar]
  33. Cravero, C.; Marsano, D. Criteria for the Stability Limit Prediction of High-Speed Centrifugal Compressors with Vaneless Diffuser. Part II: The development of Prediction Criteria. In Proceedings of the ASME Turbo Expo 2020: Turbomachinery Technical Conference and Exposition, Online, 21–25 September 2020; ASME: New York, NY, USA, 2020; p. GT2020-14589. [Google Scholar]
  34. Cravero, C.; Marsano, D. A comparison of strategies to extend the operating range of radial compressors for turbocharging. E3S Web Conf. 2023, 414, 02011. [Google Scholar] [CrossRef]
  35. Cravero, C.; Marsano, D.; Sishtla, V.; Halbe, C.; Cousins, W.T. Numerical investigations of near surge operating conditions in a two-stage radial compressor with refrigerant gas. J. Eng. Gas Turbines Power 2024, 146, 021010. [Google Scholar] [CrossRef]
  36. Cravero, C.; Marsano, D. Numerical prediction of tonal noise in centrifugal blowers. In Proceedings of the ASME Turbo Expo 2018: Turbomachinery Technical Conference and Exposition, Oslo, Norway, 11–15 June 2018; Volume 50985, p. V001T09A001. [Google Scholar]
  37. Carrattieri, L.; Cravero, C.; Marsano, D.; Valenti, E. The use of Approximate Entropy analysis for flow pattern identification in radial compressors to detect instable operating conditions. J. Phys. Conf. Ser. 2024, 2893, 012127. [Google Scholar] [CrossRef]
  38. Carrattieri, L.; Cravero, C.; Marsano, D.; Valenti, E.; Sishtla, V.; Halbe, C. The Development of Machine Learning Models for Radial Compressor Monitoring With Instability Detection. J. Turbomach. 2025, 147, 051004. [Google Scholar] [CrossRef]
  39. ANSYS Inc. Ansys CFX Theory Guide v.17; ANSYS Inc.: Canonsburg, PA, USA, 2009. [Google Scholar]
  40. Menter, F.; Kuntz, M.; Langstry, R. Ten years of industrial experience with the SST turbulence model. Turbul. Heat Mass Transf. 2003, 4, 625–632. [Google Scholar]
  41. Smirnov, P.; Menter, F. Sensitization of the SST turbulence model to rotation and curvature by applying the Spalart-Shur correction term. J. Turbomach. 2009, 131, 041010. [Google Scholar] [CrossRef]
  42. Casey, M.V.; Fesich, T.M. The efficiency of turbocharger compressors with diabatic flows. J. Eng. Gas Turbines Power 2010, 132, 7. [Google Scholar] [CrossRef]
  43. Sirakov, B.; Casey, M. Evaluation of heat transfer effects on turbocharger performance. J. Turbomach. 2013, 135, 2. [Google Scholar] [CrossRef]
  44. Zheng, X.; Jin, L.; Du, T.; Gan, B.; Liu, F.; Qian, H. Effect of temperature on the strength of a centrifugal compressor impeller for a turbocharger. Proc. Inst. Mech. Eng. Part C J. Mech. Eng. Sci. 2013, 227, 896–904. [Google Scholar] [CrossRef]
  45. Gibson, L.; Spence, S.; Kim, S.I.; Schwitzke, M.; Starke, A. A numerical investigation of a turbocharger compressor back-disk cavity at widely varying operating conditions. In Proceedings of the International Turbocharging Seminar, London, UK, 16–17 May 2018; Volume 2018, p. 11. [Google Scholar]
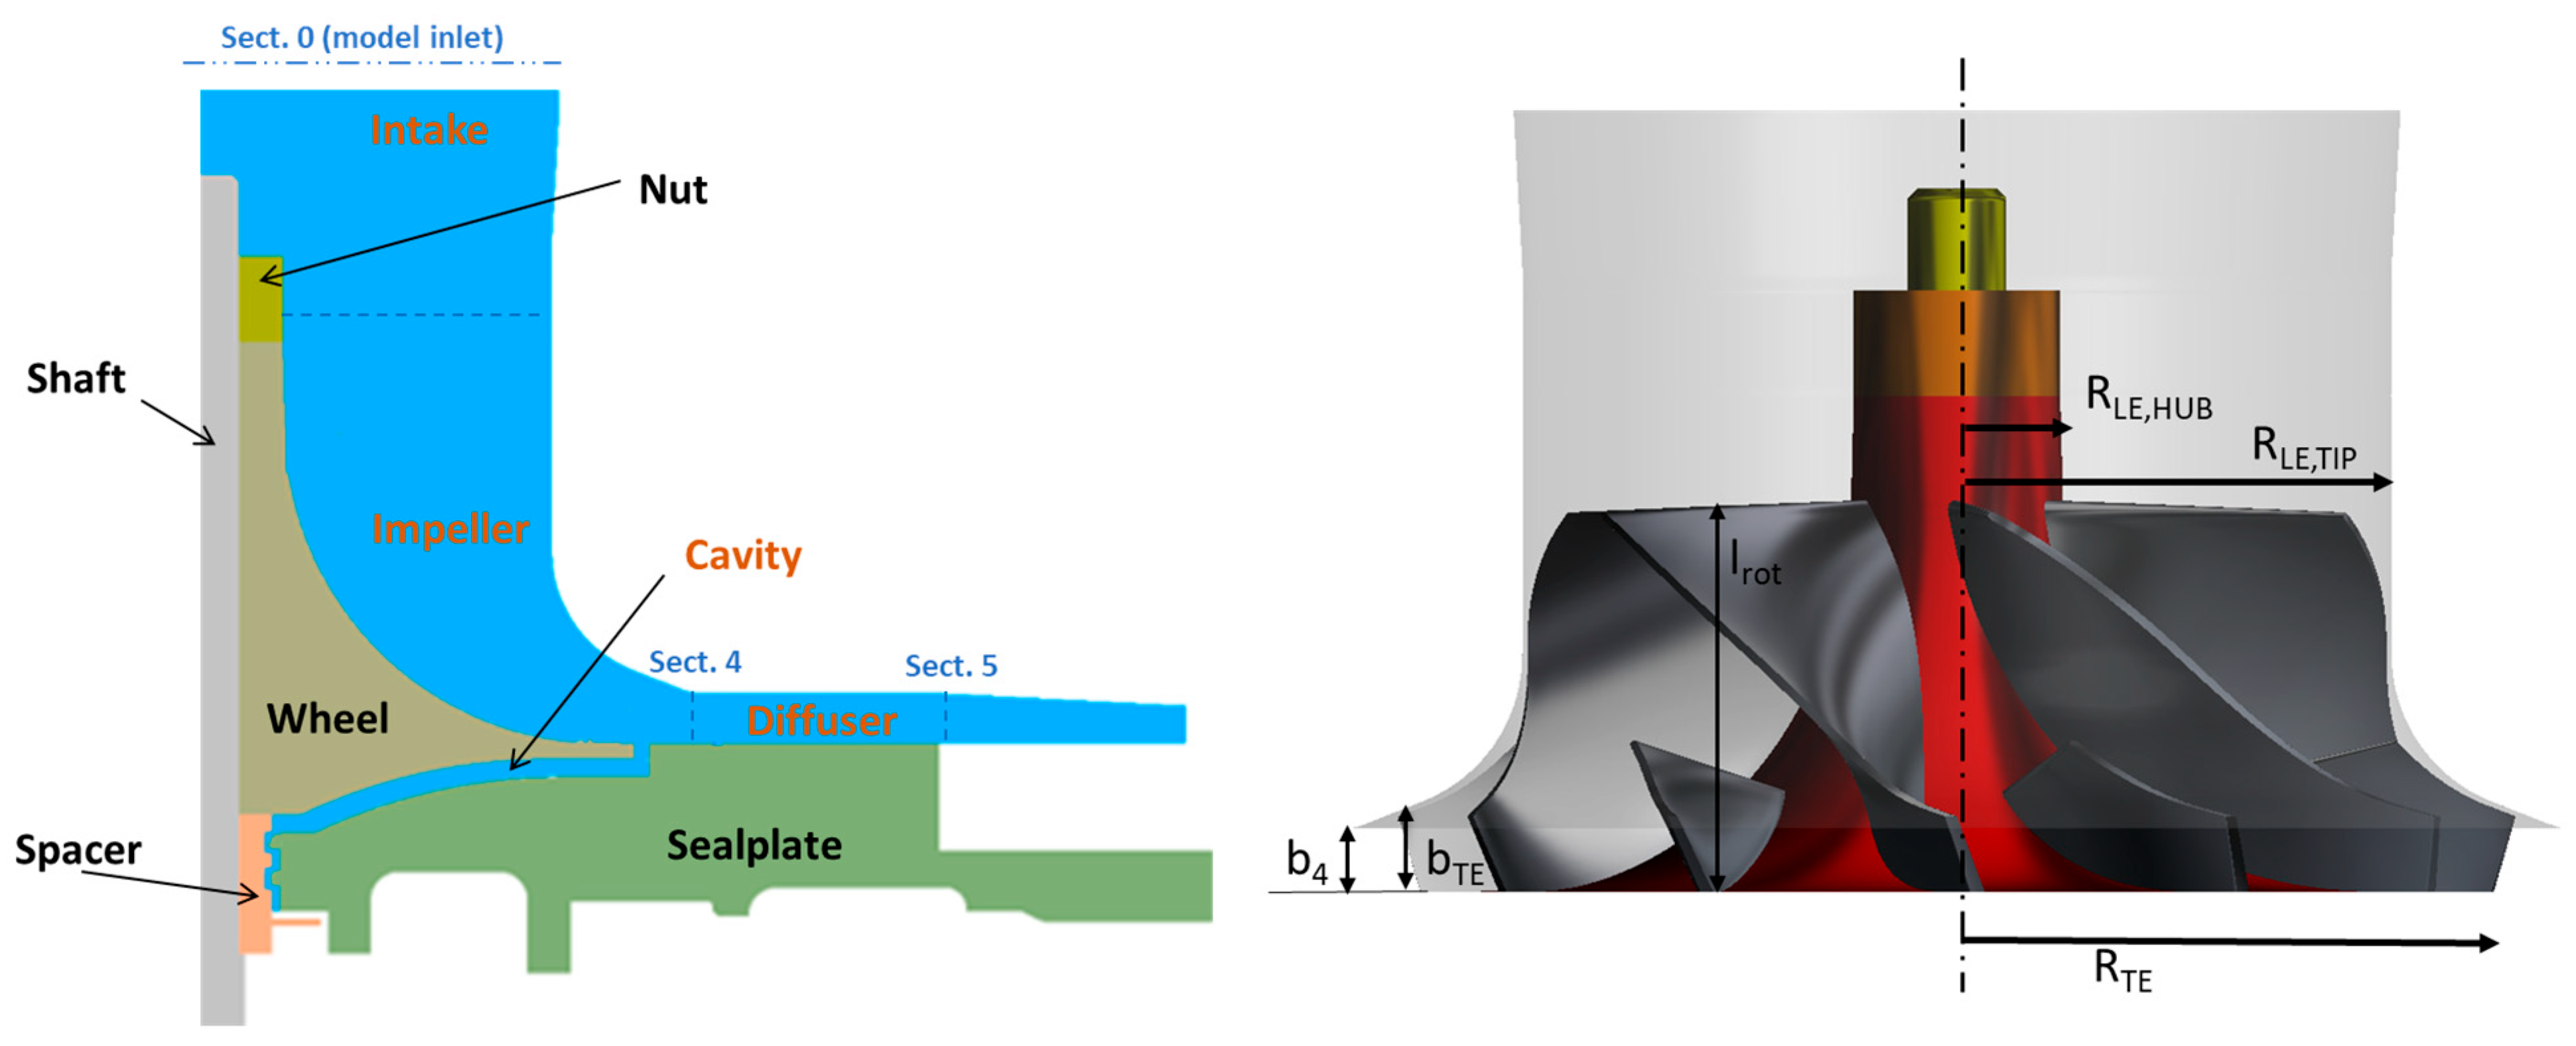
Figure 1. Middle plane of the compressor with the different solid and fluid domains highlighted (left) and sketch of the reference centrifugal compressor with the main geometrical parameters superimposed (right).
Energies 18 03348 g001
Figure 2. Scheme of the thermal boundary conditions adopted for the different models.
Energies 18 03348 g002
Figure 3. Calculation grid of the intake (with hub details) and of a single channel of the stage (impeller and diffuser).
Energies 18 03348 g003
Figure 4. Calculation grid of the back cavity: upper surface (left) and lower surface (right).
Energies 18 03348 g004
Figure 5. Calculation grid of the solid domains: shaft, nut, rotor and spacer (from left to right).
Energies 18 03348 g005
Figure 6. Calculation grid of seal plate: upper surface (left) and lower surface (right).
Energies 18 03348 g006
Figure 7. Comparison of the corrected pressure ratio curve of the centrifugal compressor calculated with the full adiabatic, the CHT only wheel and the CHT complete models.
Energies 18 03348 g007
Figure 8. Comparison of the corrected isentropic efficiency curve of the centrifugal compressor calculated with the full adiabatic, the CHT only wheel and the CHT complete models.
Energies 18 03348 g008
Figure 9. Corrected temperature contours on the hub, main blades and splitters for the full adiabatic, CHT only wheel and CHT complete models, under the OP2 condition.
Energies 18 03348 g009
Figure 10. Corrected temperature contours on the rotor middle plane for the CHT only wheel (lower) and CHT complete (upper) models, under the OP1 (left) and OP3 (right) conditions.
Energies 18 03348 g010
Figure 11. Corrected temperature contours of the fluid on a back cavity plane for the CHT complete (left) and CHT only wheel (right) models, under the OP1 condition.
Energies 18 03348 g011
Figure 12. Ratio trends between the impeller hub temperature referred to the inlet total temperature for the full adiabatic, CHT only wheel and CHT complete models, under the OP1 condition.
Energies 18 03348 g012
Figure 13. Ratio trends between the impeller hub temperature obtained in the CHT models and the temperature obtained with the full adiabatic case under different operating conditions: for the CHT only wheel (left) and CHT complete (right) models.
Energies 18 03348 g013
Figure 14. Histograms of the thermal flux ratio with the solid components for the different fluid domains for the CHT complete (upper) and CHT only wheel (below) model, for different operating conditions.
Energies 18 03348 g014
Figure 15. Boundary condition scheme of the different seal plates modeled.
Energies 18 03348 g015
Figure 16. Ratio trends between the impeller hub temperature referred to the inlet total temperature for the different seal plate conditionings, under the OP2 condition.
Energies 18 03348 g016
Figure 17. Comparison of corrected temperature contours on the rotor middle plane for different oil temperatures, under the OP2 condition.
Energies 18 03348 g017
Table 1. Geometrical non-dimensional data of the reference compressor.
Geometric ParameterValue
Impeller blade number: Zb6 main + 6 splitter blades
Span at diffuser inlet: b4/R40.0706
Radius at rotor leading edge hub: RLE,hub/R40.1755
Radius at rotor leading edge tip: RLE,tip/R40.7166
Radius at diffuser outlet: R5/R41.5323
Table 2. Mesh configurations used to determine the mesh sensitivity with the PRcor and the mass flow rate through the back cavity.
MeshCell Number
(Mcells)
PRcorMRF
[%]
M10.80.9770.49
M21.20.9800.45
M31.60.9800.45
Table 3. Percentage variations of the performance in the CHT models with respect to the full adiabatic model, under different operating conditions.
Case
OP1
PR; η
OP2
PR; η
OP3
PR; η
OP4
PR;η
CHT only wheel−2.04%; 1.50%−1.05%; −0.68%−2.14%; −1.70%−0.72%; −1.19%
CHT complete−1.55%; 4.11%−0.71%; 1.22%−1.98%; −0.39%−0.60%; −0.1%
Table 4. Performance variations in the full adiabatic model without the back cavity with respect the case with it, under different operating conditions.
OP1
PR; η
OP2
PR; η
OP3
PR; η
OP4
PR; η
2.17%; 1.07%1.83%; 0.14%2.02%; 0.3%0.98%; 0.86%
Table 5. Thermal power exchanged by the seal plate with different fluid domains, for the OP1 condition.
E [W]
Impeller
E [W]
Cavity
E [W]
Diffuser
E [W]
Oil
E [W]
Ambient
126.6236.6786.4−1117.4−32.2
Table 6. Percentage variations of the performance in the adiabatic and the reduced cases with respect to the baseline case, for different operating conditions.
CaseOP1
PR; η
OP2
PR; η
OP3
PR; η
OP4
PR; η
Adiabatic−0.35%; −2.37%−0.29%; −2.0%−0.19%; −1.39%−0.07%; −1.23%
Reduced−0.25%; −1.79%−0.21%; −1.51%−0.18%; −1.04%−0.05%; −0.86%
Table 7. Percentage variation of the performance with the different oil temperatures with respect to the original condition, for different operating conditions.
CaseOP1
PR; η
OP2
PR; η
OP3
PR; η
OP4
PR; η
75%*Toil0.02%; 0.02%0.01%; 0.01%0.06%; 0.02%0.01%; 0.04%
125%*Toil−0.01%; −0.04%−0.01%; −0.04%−0.13%; −0.19%−0.01%; −0.01%
150%*Toil−0.04%; −0.09%−0.04%; −0.06%−0.22%; −0.22%−0.02%; −0.03%
Table 8. Percentage variations of the performance in the case with the shroud heat exchange with respect to the adiabatic shroud, for different operating conditions.
OP1
PR; η
OP2
PR; η
OP3
PR; η
OP4
PR; η
0.05%; 0.08%0.02%; 0.06%−0.11%; −0.02%−0.01%; 0.07%
Disclaimer/Publisher’s Note: The statements, opinions and data contained in all publications are solely those of the individual author(s) and contributor(s) and not of MDPI and/or the editor(s). MDPI and/or the editor(s) disclaim responsibility for any injury to people or property resulting from any ideas, methods, instructions or products referred to in the content.