Abstract
Anthropogenic CO2 emissions are a major driver of climate change, highlighting the urgent need for effective mitigation strategies. Carbon Capture, Utilization, and Storage (CCUS) offers a promising approach, particularly through CO2-enhanced gas recovery (EGR) in shale reservoirs, which enables simultaneous hydrocarbon production and CO2 sequestration. This study employs a numerical simulation model to compare two injection strategies: CO2 flooding and huff-and-puff (H&P). The results indicate that, without accounting for key mechanisms such as adsorption and molecular diffusion, CO2 H&P provides minimal improvement in methane recovery. When adsorption is included, methane recovery increases by 9%, with 14% of the injected CO2 stored over 40 years. Incorporating diffusion enhances recovery by 19%, although with limited storage potential. In contrast, CO2 flooding improves methane production by 26% and retains up to 94% of the injected CO2. Higher storage efficiency is observed in reservoirs with high porosity and low permeability, particularly in nano-scale pore systems. Overall, CO2 H&P may be a viable EGR option when adsorption and diffusion are considered, while CO2 flooding demonstrates greater effectiveness for both enhanced gas recovery and long-term CO2 storage in shale formations.
1. Introduction
Recently, increasing attention has been directed toward the use of carbon dioxide (CO2) in enhanced gas recovery (CO2-EGR), particularly within unconventional reservoirs such as shale formations. Unlike conventional enhanced oil recovery (CO2-EOR), which has been widely applied in mature oil fields, CO2-EGR presents a promising alternative for boosting hydrocarbon recovery from tight gas-bearing formations. This approach not only improves gas recovery but also enables the permanent geological storage of CO2, addressing both energy security and environmental concerns. The dual-purpose nature of CO2-EGR—enhancing production from difficult-to-develop resources while contributing to long-term carbon sequestration—aligns closely with global climate mitigation goals [1,2,3]. There are two strategies for CO2 injection, which are CO2 flooding and CO2 H&P. In CO2 flooding, CO2 is injected from the injection well, and methane is produced from the production wells. The injection can be continuous or pulsed, with continuous injection offering improved gas recovery. Huff-and-puff injection in unconventional oil reservoirs has been extensively tested in numerous field pilots and has been successfully scaled up over the past decade [4,5]. In gas H&P operations, the same well serves as both the injector and the producer, following three key phases: the injection period, where CO2 is injected into the reservoir through fractures; the soaking period, allowing CO2 to diffuse into the rock and interact with hydrocarbons; and the production period, during which the pressure gradient drives hydrocarbons from the matrix to the fractures and into the wellbore. This method provides an economically viable approach for both CO2 injection and hydrocarbon recovery. However, there is an ongoing debate about the superiority of continuous CO2 flooding and H&P injection modes in these reservoirs.
Unconventional reservoirs, such as shale formations, differ markedly from conventional reservoirs due to their ultra-low permeability, complex pore structures, and reliance on artificial stimulation for production. Unlike conventional systems, gas in shale is often stored through adsorption onto organic matter and transported primarily via molecular diffusion rather than convection. These unique flow mechanisms play a critical role in fluid transport and must be carefully considered when designing and optimizing CO2-enhanced gas recovery strategies. Ding et al. [2] demonstrated that CO2 exhibits significantly higher adsorption volumes in tight cores compared to natural gas, enabling the efficient displacement of methane during injection. This competitive adsorption mechanism enhances gas recovery while simultaneously increasing CO2 storage potential. Wang and Rezaei [3] highlighted adsorption capacity as a key factor in determining the theoretical maximum storage of CO2 in reservoirs, though challenges remain in understanding CO2 adsorption in multicomponent gas systems. Temizel et al. [6] further emphasized the importance of Langmuir isotherm modeling for different gas fractions to improve predictions of CS-EGR performance.
In shale reservoirs with extremely low permeability, diffusion dominates over convection, enabling the deeper penetration of CO2 into the matrix and enhancing hydrocarbon recovery [7]. Research has shown that diffusion-driven composition changes in the reservoir can delay liquid dropout, leading to prolonged hydrocarbon production [8]. However, conventional empirical correlations for diffusion coefficients, widely used in the industry, require further refinement to improve the accuracy of gas injection models. Additionally, the effect of diffusion on carbon sequestration has been less extensively investigated. Porosity and permeability are fundamental reservoir rock properties that significantly influence the success of the gas recovery process. Therefore, in this subsequent simulation study, we conducted a sensitivity analysis for the CO2 flooding scenario, considering varying permeability and porosity.
Previous works such as Yu & Sepehrnoori [9] have examined the role of gas desorption and geomechanics in shale gas recovery, while Wang & Yu [7] focused on lean gas huff-and-puff processes in naturally fractured systems, including considerations of methane adsorption and gas trapping. Although these studies provided valuable insights into operational design, they primarily focused on short-term production metrics or did not directly compare CO2 flooding with huff-and-puff under consistent modeling conditions. In contrast, the present study provides a systematic, side-by-side comparison of CO2 flooding and CO2 huff-and-puff using a unified simulation framework. This comparative approach aims to clarify which CO2 injection strategy offers superior performance for long-term shale gas production and CO2 storage efficiency.
This study aims to enhance the understanding of CO2-enhanced gas recovery (EGR) and CO2 storage in unconventional reservoirs through a comprehensive reservoir simulation-based investigation. Key processes such as adsorption dynamics and molecular diffusion will be analyzed to determine their impact on gas recovery and long-term CO2 sequestration. Sensitivity analyses will be conducted to identify the most influential geological and engineering parameters governing these processes. The primary objectives of this research include optimizing CO2 injection strategies to maximize EGR efficiency in shale reservoirs, improving CO2 sequestration potential while mitigating early breakthrough risks, and comparing the effectiveness of CO2 flooding and CO2 H&P mechanisms in shale gas reservoirs for CS-EGR. Addressing these gaps will be essential for unlocking the full potential of CO2-EGR as a sustainable solution for both carbon management and hydrocarbon production.
The remainder of this paper is structured as follows: The next section presents the development of the numerical simulation model used in this study, including the approach for modeling natural fractures. The Results and Discussion section follows, detailing the outcomes of CO2 injection optimization for both enhanced gas recovery and geological storage. This section also investigates the effects of key mechanisms such as adsorption and molecular diffusion, while comparing the performance of CO2 H&P and CO2 flooding strategies. Additionally, a sensitivity analysis is conducted to evaluate the influence of reservoir properties, including permeability and porosity. Finally, the paper concludes with a summary of the key findings and offers recommendations for future research.
2. Reservoir Simulation Model
To analyze the realistic effects of CO2 injection in an unconventional gas reservoir, we have constructed a numerical model of a shale reservoir. We have collected daily pressure and gas production data of shale gas formation in the Eagle Ford which is published in the literature [7,10]. We addressed the uncertain or missing parameters by assigning arbitrary values within reasonable ranges associated with shale gas reservoirs. For numerical modeling, the compositional simulator CMG-GEM [11] was used to construct a 3D reservoir model with dimensions of 545 ft × 800 ft × 130 ft, corresponding to length, width, and thickness, respectively, which was simplified for computational efficiency (Figure 1). The simulation focused on a binary gas system consisting of methane (CH4) and carbon dioxide (CO2), with an emphasis on the accurate prediction of phase behavior, transport mechanisms, and flow in hydraulically fractured shale formations. The model solves mass conservation equations for each component ii across all fluid phases α:
Here, φ is porosity, is phase density, is the mole fraction of component i in phase α, Sα is saturation, is Darcy velocity, and is the source/term. Fluid velocities are determined using Darcy’s law:
where is the absolute permeability, is the relative permeability, is dynamic viscosity, and g is gravitational acceleration. Phase behavior was modeled using the Peng–Robinson equation of state (EOS):
where P is pressure, T is temperature, V is molar volume, and and b are EOS parameters derived from critical properties and acentric factors. For the exploitation of shale reservoirs with multi-stage hydraulic fractured horizontal wells, some more equations or models were applied to address the specialty. By implementing the correlation proposed by Evan and Civan [12], the non-Darcy beta factor used in the Forchheimer model can be used to determine how to deal with a high gas flow rate within hydraulic fractures. Local grid refinement with logarithmic spacing was implemented to accurately depict the detailed transient gas flow phenomenon around the hydraulic fractures. The initial reservoir pressure was set to 4700 psi, with a temperature of 256 °F and fluid composition of 100 mol% CH4 and 0 mol% CO2. No-flow boundary conditions were applied on all outer boundaries unless otherwise specified. Time stepping was adaptive, with the Newton–Raphson method used to solve the nonlinear system of equations. The parameters used to construct the basic reservoir model are listed in Table 1.
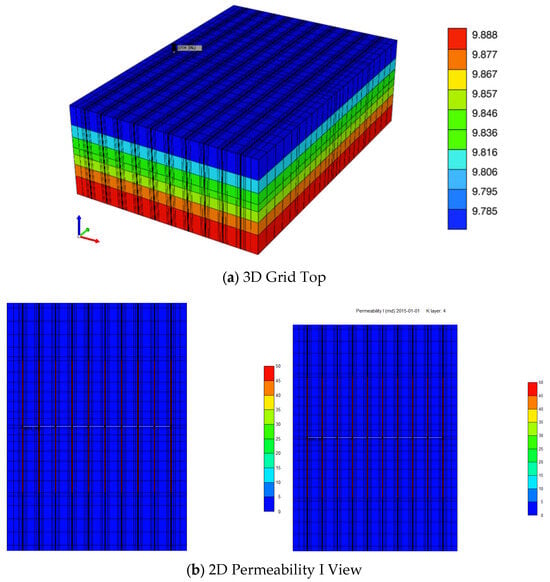
Figure 1.
Shale gas reservoir model.

Table 1.
Parameters used in the basic reservoir model.
This study assumes a laterally confined, homogeneous reservoir with impermeable and adiabatic boundaries at the top and bottom. This simplification helps isolate key CO2 displacement behaviors without added complexity from geological heterogeneity or cross-formational flow. However, in field applications, overburden and underburden formations can affect vertical fluid and heat transfer. The current setup may underestimate thermal losses or gas leakage pathways over long simulation periods. This simplification is commonly used in mechanism-focused simulation studies to reduce computational complexity and avoid confounding effects introduced by geological heterogeneity. While this assumption limits the ability to capture field-scale variability, it enables a clearer interpretation of parameter sensitivity and fluid behavior under controlled conditions [13,14].
The single-component methane system was assumed to represent the reservoir gas composition. While this is a simplification, it was intentionally adopted to isolate the fundamental mechanisms of CO2–CH4 interaction—such as adsorption, diffusion, and displacement—without the added complexity of multicomponent thermodynamic effects. This approach allows for a clearer interpretation of the physical processes governing CO2-based enhanced gas recovery. Real shale gas reservoirs, however, typically contain multicomponent gas mixtures, including ethane, propane, and other hydrocarbons. These components have distinct adsorption affinities and phase behaviors, which can influence the overall gas transport, recovery efficiency, and CO2 storage potential. Nevertheless, methane is the dominant component in most shale formations, often accounting for over 90–95% of the total gas content. As such, it is frequently used as a proxy in preliminary modeling and mechanism-driven studies. Table 2 lists the critical properties of these pseudo components, which were used for phase behavior calculation. The gas properties were determined for this well using the Peng–Robinson equation of state using CMG-WinProp 2021.10 [15]. Figure 2 presents the relative permeability curves for the matrix as defined in the CMG-GEM. This study does not explicitly model the dissolution of CO2 or methane into formation water, nor does it include gas adsorption on inorganic mineral surfaces. These simplifications were made to reduce computational complexity and to focus on the dominant flow and transport mechanisms in gas-bearing organic-rich shale. While these processes can influence long-term storage and transport behavior, their quantitative impact over the simulation timeframe is relatively small. Based on estimates in the literature, the exclusion of CO2 solubility and inorganic adsorption typically introduces an uncertainty of less than 5–10% in storage predictions, and less than 5% in methane recovery under similar reservoir conditions [14,16]. As such, these effects are considered secondary for the current scope of the study.
Table 2.
Compositional data for the Peng–Robinson equation of state.
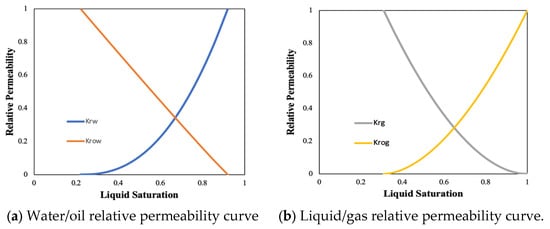
Figure 2.
Relative permeability curves for the matrix.
The local grid refinement (LGR) technique is used to represent the fractures by assigning their properties to the innermost block of a refined block (see Figure 1). The reservoir model is designed for a 452 ft section of a horizontal well and includes 10 fracture clusters, each of which is represented by a planar fracture (Figure 3). The cluster spacing and fracture half-length are set at 52 ft and 200 ft, respectively. In this study, SRV permeability refers to the effective permeability within the Stimulated Reservoir Volume (SRV)—the region around the hydraulic fracture where permeability has been enhanced due to stimulation. This zone governs the majority of gas production and fluid transport in tight shale formations and is modeled separately from the unstimulated matrix. In a multifractured horizontal well, hydraulic fractures are repeated through the well so that simplification performed in this study has no effect on the results, with the assumption that reservoir is homogeneous and that the properties of hydraulic fractures are same. Table 3 shows the other parameters of the fractures. Figure 4 also shows the fracture relative permeability curves used in this study.
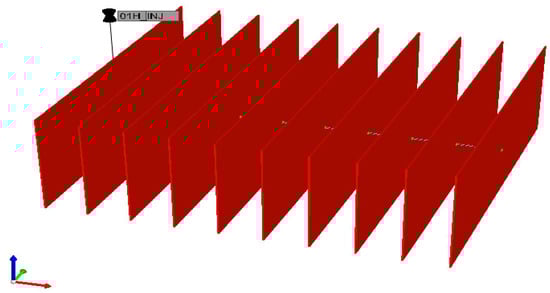
Figure 3.
Hydraulic fractures along the considered section of a horizontal well. Red arrows: X-direction; green arrows: Y-direction; blue arrows: Z-direction.
Table 3.
Parameters of the hydraulic fractures.
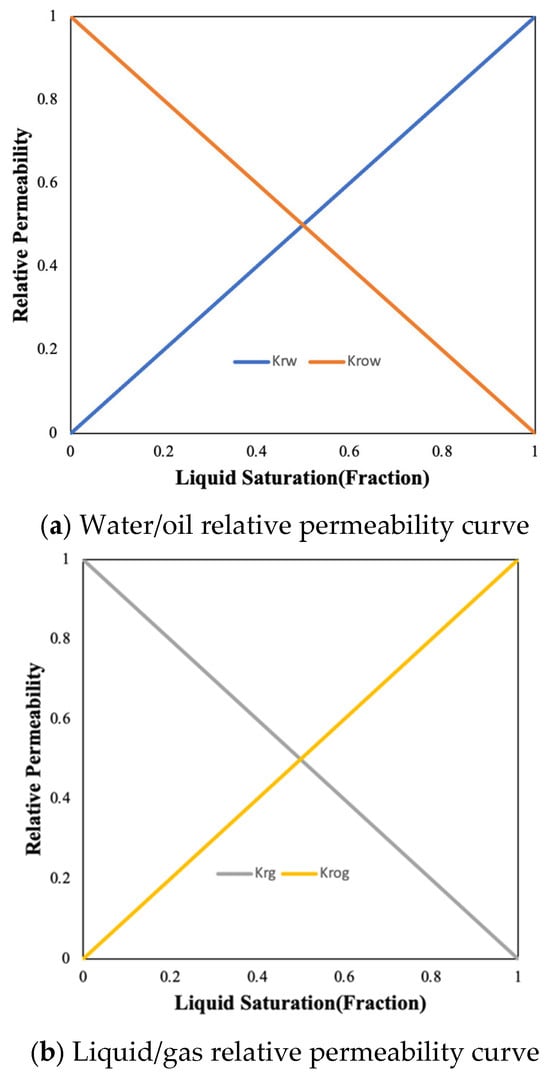
Figure 4.
Relative permeability curves for fractures.
We investigate the impact of CO2 H&P on our reservoir model with a single porosity system without considering mechanisms such as adsorption and diffusion at first. In the simulation of the CO2 H&P scenario, we assume a development plan that starts with initial production for three years, and then the H&P cycles begin with CO2 injection. Each H&P cycle consists of one year of CO2 injection, followed by one year of production, and this process is repeated until the completion of 40 years. Figure 5 illustrates the average pressure and initial production of the reservoir for the base case without the CO2 H&P scenario, with initial reservoir pressure at 4700 psi for 160,000 days (43 years).
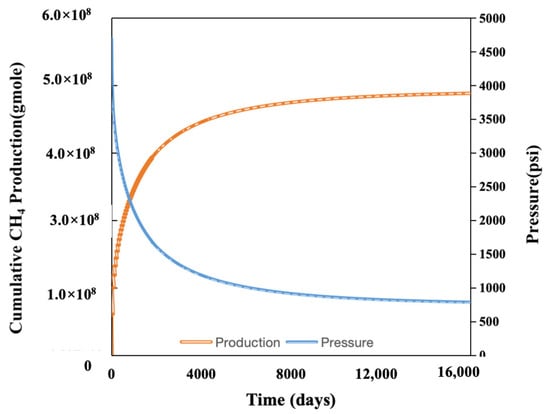
Figure 5.
Base case: average reservoir pressure and cumulative CH4 production.
CO2 flooding is the method of injecting CO2 from the injection well and producing methane from the production wells. An additional horizontal well, parallel to the production well, is modeled for CO2 injection, with a spacing of 800 feet between them (Figure 6). The red-colored cells indicate the high-permeability fracture zones, while the surrounding transparent grid represents the matrix. Injector and producer wells are also labeled within the model. The 3D reservoir model has been extended two times in the y direction while keeping the other parameters consistent with the model mentioned above.
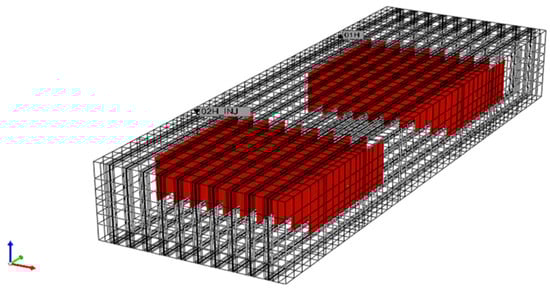
Figure 6.
Numerical model of CO2 flooding in a 3D reservoir with two hydraulically fractured horizontal wells. Red arrows: X-direction; green arrows: Y-direction; blue arrows: Z-direction.
3. Results and Discussion
3.1. CO2 Huff-and-Puff Scenario
The efficiency of the CO2 injection process depends on various factors, which can be categorized into controlled and measured parameters. Measured parameters, such as reservoir rock and fluid characteristics, are beyond our control. On the other hand, controlled parameters, including injection pressure, injection rate, and soaking time, are within our influence. Hence, the initial step involved assessing the influence of key operational parameters—specifically, injection pressure, injection rate, and soaking time—on both cumulative methane production and CO2 storage. Following the sensitivity analysis of these parameters, we identified an optimal injection rate of 800 MCF/d and an injection pressure of 5500 psi, while excluding any soaking period, as being the most effective conditions for further study. The results of the sensitivity analysis, based on the base H&P design used in the subsequent study for all gas injection scenarios, are presented in Table 4. Notably, all injection periods are kept equal.
Table 4.
The base H&P design variables.
Figure 7 and Figure 8 illustrate the cumulative methane production and average reservoir pressure of the CO2 H&P scenario with and without CO2 injection. The figures show that, despite the increase in reservoir pressure during H&P injection, the overall methane recovery in the CO2 H&P scenario is lower than in the case without CO2 injection. Methane recovery decreases by approximately 2.5% by the end of the production period. Although methane recovery under the CO2 H&P scenario was lower compared to natural depletion, the method demonstrated strong potential for simultaneous carbon storage and gas recovery. In unconventional reservoirs with poor primary recovery, this approach may offer a viable path to monetize gas assets while contributing to emission reduction goals.Further analysis reveals that about 97% of the injected CO2 is produced back at the end of production period (Figure 9).
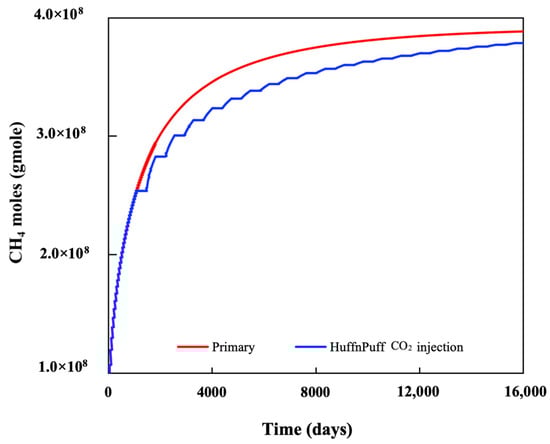
Figure 7.
Cumulative CH4 production for primary and CO2 H&P.
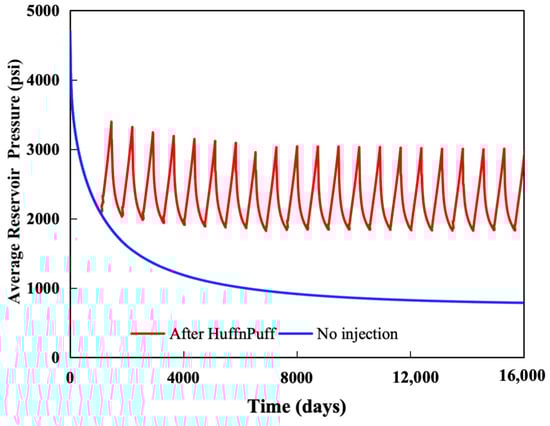
Figure 8.
Average reservoir pressure with and without CO2 injection over time.
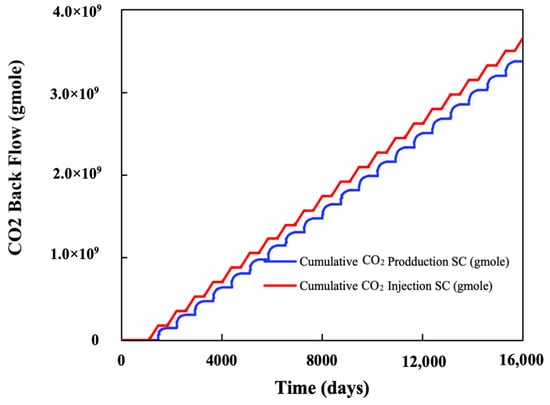
Figure 9.
CO2 Moles Injected and Produced in the Base Case.
One possible reason for the decrease in production is a crucial aspect of the CO2 H&P process—the adsorption of CO2 in small, confined spaces, which limits methane desorption and reduces overall recovery. Some lab and theoretical calculations suggest that CO2 has a stronger affinity to be adsorbed compared to methane. Injecting CO2 into the shale reservoir could enhance the recovery of shale gas due to the competitive adsorption between carbon dioxide and shale gas. Moreover, molecular diffusion could significantly contribute to the transportation of CO2 deeper into the formation. Therefore, its incorporation into the simulation could be crucial. In unconventional reservoirs, these mechanisms work together to facilitate the flow between the matrix and the fracture networks. However, the relative importance of the individual mechanisms varies from case to case depending on factors such as reservoir rock and fluid properties and flow conditions.
3.1.1. Effect of Adsorption
Due to the stronger adsorption capacity of CO2 compared to CH4, injecting CO2 into the reservoir can displace the CH4 adsorbed on the surface of organic matter and rocks while increasing the ultimate recovery of the reservoir [17]. Langmuir isotherm is one of the most popular models used to describe the gas adsorption/desorption physical process.
To explore the impact of adsorption on methane recovery and CO2 storage, as outlined previously, the Langmuir isotherm adsorption curve is chosen to describe the adsorption of the two components [18]. The adsorption equation is used to describe the adsorption behavior of CH4 and CO2. The Langmuir isotherm equation with two fitting parameters is as follows [17]:
where is the gas volume of adsorption at pressure ; is the Langmuir volume, referred to the maximum adsorbed gas volume at the infinite pressure; and is the Langmuir pressure, which represents the pressure corresponding to a one-half Langmuir volume. In the model, an extended Langmuir isotherm is implemented to model the competitive multicomponent adsorption and desorption process:
where is the mole of adsorbed component per unit mass or rock, is the maximum mole of adsorbed component per unit mass or rock, is the parameter for Langmuir isotherm relation, P is the pressure, and is the molar fraction of adsorbed component in the gas phase. The Langmuir isotherm is often determined in the laboratory using core samples. From the adsorption data of various components (Figure 10), we used the existing literature on shale formations to extract data for methane and carbon dioxide [18]. As shown in Figure 10, the adsorption amount increased with the carbon number of hydrocarbons. This behavior can be explained by the stronger van der Waals interactions and larger molecular surface area of heavier hydrocarbons, which enhance their affinity toward the pore surfaces. From a microscopic perspective, hydrocarbons with longer carbon chains exhibit greater polarizability and more extensive contact with the pore wall, leading to higher adsorption capacity. A molecular dynamics viewpoint suggests that heavier molecules experience stronger dispersion forces and more pronounced confinement effects in narrow pores, which further promote adsorption. These findings are consistent with prior studies on adsorption behavior in organic-rich shale systems. Although more advanced models exist to describe adsorption on heterogeneous surfaces or in nanopores, the extended Langmuir model remains widely accepted for binary systems such as CH4–CO2 and has been applied in numerous shale gas studies under reservoir conditions [16,19]. Its implementation in CMG-GEM provides a practical and computationally efficient approach to incorporating adsorption effects in compositional simulations.
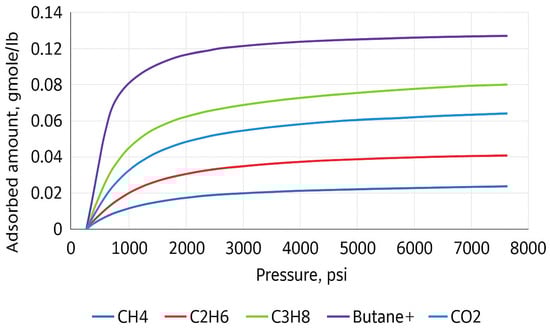
Figure 10.
Adsorption data for different components [18].
Figure 11 illustrates methane production by comparing scenarios of H&P injection to those with no injection while activating adsorption during the simulation. Taking adsorption into account results in a 9.2% increase in methane production by the end of the production period. It is evident that methane production has declined during the first five years after injection compared to the case without injection. This suggests that there is a time delay for gas molecules to adsorb into the rocks until they reach a level at which they become influential on the results. Around 14% of the injected CO2 is sequestrated in the shale reservoir, indicating an improvement compared to the case without adsorption. (Figure 12).
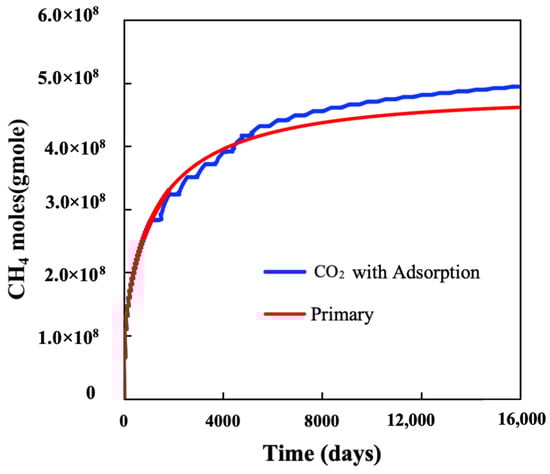
Figure 11.
CH4 production before and after CO2 huff-and-puff with adsorption process activated.
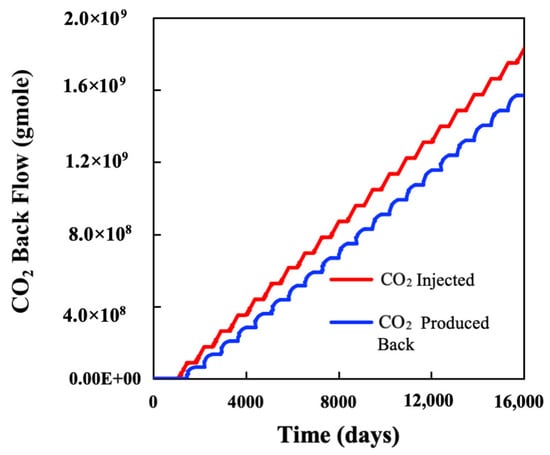
Figure 12.
ICO2 Moles Injected and Recovered with the adsorption process activated.
3.1.2. Effect of Molecular Diffusion
The mechanisms of gas transport and retention render traditional approaches relying on the Darcy flow law inadequate for characterizing flow in certain tight and shale gas reservoirs [20,21]. Due to the ultra-low permeability of the shale matrix, diffusion in the reservoir is quite important. Specifically, when CO2 is introduced into the reservoir, the effect of molecular diffusion between CH4 and CO2 should be considered. CO2 diffusion was modeled using the CMG-GEM compositional reservoir simulator [11] built-in capability to handle molecular diffusion.
There are two methods we consider to model diffusion: either by directly entering CO2 diffusion coefficients into the built-in model or utilizing the Sigmund correlation to estimate the diffusion coefficient for the individual components according to experimental and analytical studies [22,23,24].
To investigate the impact of molecular diffusion on methane recovery and CO2 storage, as outlined earlier, CO2 diffusion coefficients of 10−4 cm2/s and 10−3 cm2/s and Sigmund correlation are used. The effect of adsorption is not considered in this case. The case of CO2 injection, which does not have diffusion capacity, results in a piston-like displacement of the CO2 in the limited regions surrounding the hydraulic fractures.
As a result, the CO2 molecules tend not to travel further into the formation (Figure 13a). Ignoring the diffusion process may result in inaccuracies in describing the interaction between CO2 and methane in the subsurface, especially if the diffusion coefficient is large and if the soaking time is long. The presence of a large concentration gradient of CO2 molecules results in their diffusion into regions with small concentrations. As a result of this, the CO2 concentration is diluted more as it mixes with the CH4 present in neighboring cells (Figure 13b). It is worth noting that in addition to molecular diffusion, there is artificial mixing occurring because of numerical diffusion, which results from the discretization of the governing system of equations [5]. The numerical diffusion can be seen in Figure 13a, in which there is some “smear” in the CO2 concentrations in the near-wellbore region. The penetration of CO2 deeper into the formation is desirable as it generates larger quantities of gas through counter-current flow and increases the CO2 being stored in the subsurface. Figure 14 shows the effects of different CO2 diffusion coefficients on cumulative methane production.
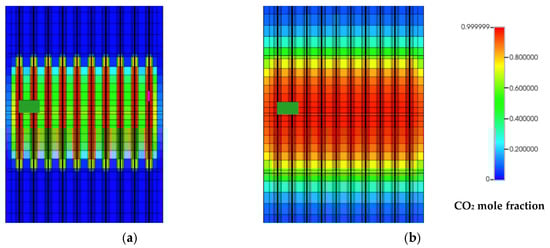
Figure 13.
Distribution of the CO2 mole fractions after five years of injection (a) without diffusion and (b) with diffusion (Sigmund correlation).
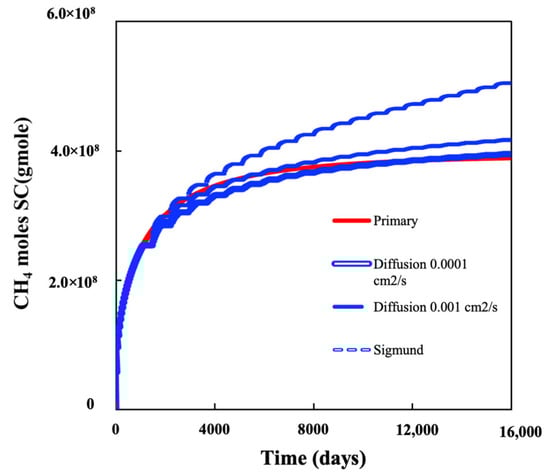
Figure 14.
CH4 production before and after CO2 H&P with different molecular diffusion coefficients.
The scenario with a small CO2 diffusion coefficient of 10−4 cm2/s has a negligible impact on methane production. In the case of a large CO2 diffusion coefficient of 10−3 cm2/s or of using Sigmund correlations, there is a substantial increase in CH4 production and CO2 storage compared to the case with no diffusion. The contribution to cumulative methane production after 40 years is about 6% and 19% for the two cases, with CO2 diffusion coefficients of 10−3 cm2/s and Sigmund correlation, respectively. Accordingly, the effect of CO2 molecular diffusion is very important when evaluating the CO2 H&P effectiveness in unconventional gas reservoirs. The rate of this diffusion process is largely dependent on the diffusion coefficient, and therefore, its characterization is crucial. Since the diffusion mechanism for CO2 has a significant effect on enhancing the gas recovery in shale gas reservoirs, any change in the CO2 diffusion rate would result in a significant change in the gas recovery factor.
The simulation findings indicate that approximately 95% of the injected CO2 is recovered after 40 years of injection, and changes in diffusion coefficients have an insignificant impact on CO2 sequestration (Figure 15). CO2 can spread widely through molecular diffusion, which may lead to increased methane recovery. However, it is important to note that CO2 is being produced quickly during the puff period.
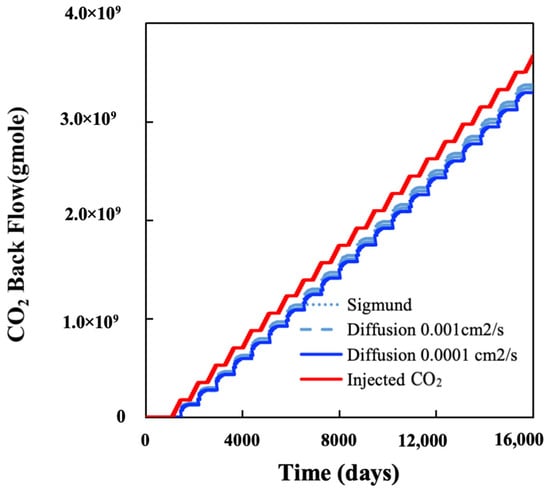
Figure 15.
CO2 Moles Injected and Recovered with Diffusion Effects.
Using processes like adsorption and diffusion, along with acknowledging the existence of natural fractures, offers the possibility of boosting methane production by using CO2 H&P. Nevertheless, achieving effective CO2 sequestration in shale formations through H&P injection has proven elusive, with outcomes not meeting the intended objectives.
3.2. CO2 Flooding Scenario
Given the ineffective results observed in the CO2 storage using the H&P case, where a single well was employed for both production and injection, the decision was made to implement a multiwell approach with CO2 flooding. CO2 flooding is the method of injecting CO2 from the injection well and producing methane from the production wells. An additional horizontal well, parallel to the production well, was modeled for CO2 injection, as mentioned in Section 2 (Figure 6).
In the following sections, the simulations are conducted considering a single porosity system, with diffusion and adsorption disabled. The production well operated for three years before the injection started. CO2 injection continued continuously until the end of the simulation. Figure 16 indicates a 26% increase in methane production.
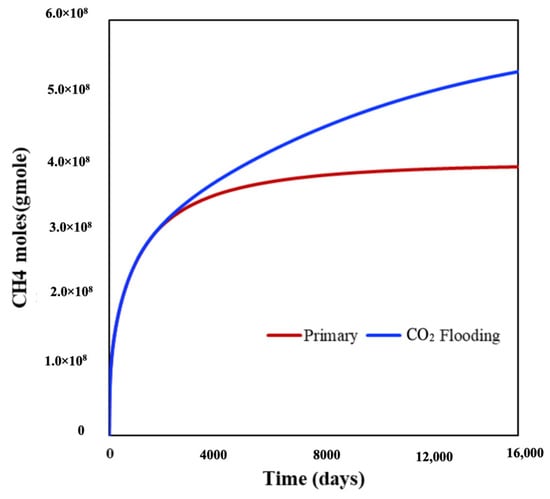
Figure 16.
CH4 production before and after CO2 flooding.
The injection well cumulatively injected 3 × 10 × 108 gmole of CO2. CO2 breakthrough is observed three years after the injection started, but the production rate of CO2 remains extremely low. After 20 years of injection, only 0.5% was produced back. At the end of the simulation, CO2 production amounted to 0.19 × 10 × 108, which is about 6% of the total injection quantity. In the 40-year simulation, approximately 94% of the injected CO2 was stored in the shale (Figure 17).
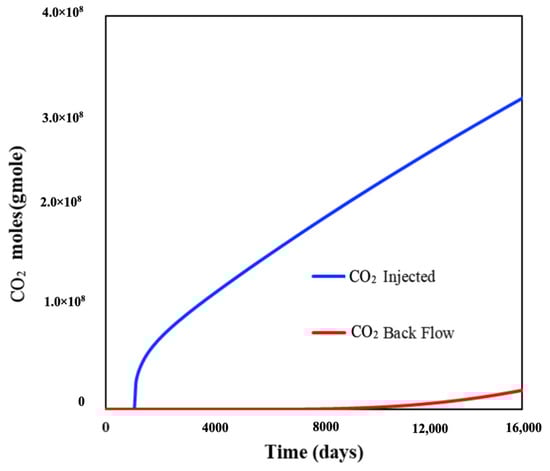
Figure 17.
Injected and Produced CO₂ Moles Under the Flooding Scenario.
3.3. Impact of Porosity and Permeability During CO2 Flooding
Shale gas reservoirs exhibit significant uncertainty, primarily attributed to numerous unpredictable factors like reservoir permeability and porosity. Porosity and permeability are fundamental reservoir rock properties that significantly influence the success of the gas recovery process. Therefore, in this subsequent simulation study, we conducted a sensitivity analysis for the CO2 flooding scenario, considering varying permeability and porosity. The aim was to explore which types of reservoirs are suitable for CS.
Porosities of 2%, 5%, and 10% were selected to assess the sensitivity to porosity during CO2 injection. Figure 18 depicts the distribution of CO2 mole fractions with varying porosities after 5 years of injection. As porosity increases, CO2 molecules tend to cluster more around the CO2 injector, resulting in a reduced CO2 drainage area.
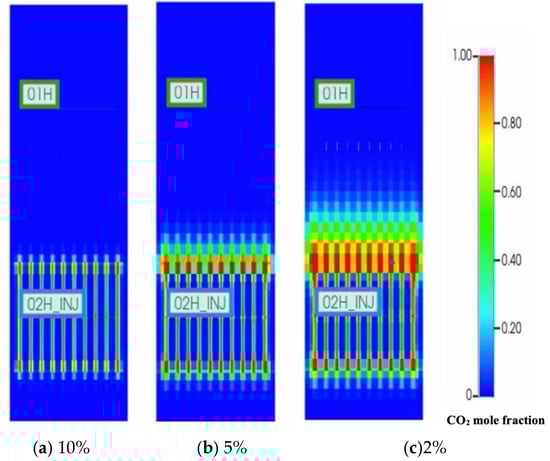
Figure 18.
CO2 mole fraction distribution with different porosities after 5 years of injection (model aerial view, permeability 500 nD).
Increased porosity enhances the reservoir’s capacity for storing and transmitting fluids, such as injected CO2. As illustrated in Figure 19, at a porosity of 10%, we can store 99.7% of CO2, whereas at 2% porosity, the storage capacity is 64%. This means that higher porosity in a reservoir indicates a greater volume of interconnected pore spaces within the rock. This increased pore volume provides more room for the storage and retention of CO2 molecules. Essentially, in reservoirs with higher porosity, there is a larger available space for the injected CO2 to be stored, leading to an enhanced storage capacity. The results of the simulation are summarized in Table 5.
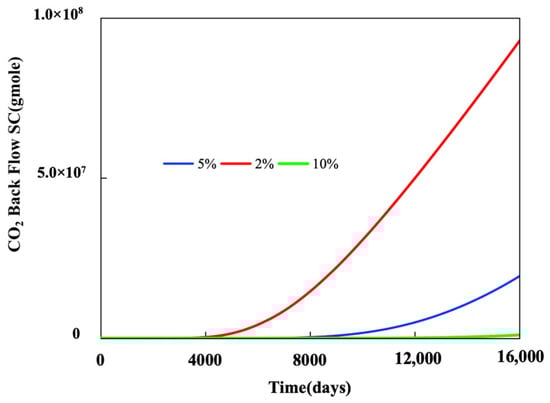
Figure 19.
CO2 backflow under different porosities.
Table 5.
Stored CO2 under varying porosities.
Sensitivity analysis involves systematically varying permeability values to assess their impact on CO2 injection and subsequent gas recovery. Figure 20 shows the CO2 mole fraction distribution with 0.00005 mD, 0.005 mD, and 5 mD permeability. CO2 molecules migrate closer to the CH4 producer, and a larger CO2 drainage area is achieved. The higher permeability facilitates the movement of CO2 through the reservoir, aiding in the displacement of native gases and enhancing overall recovery.
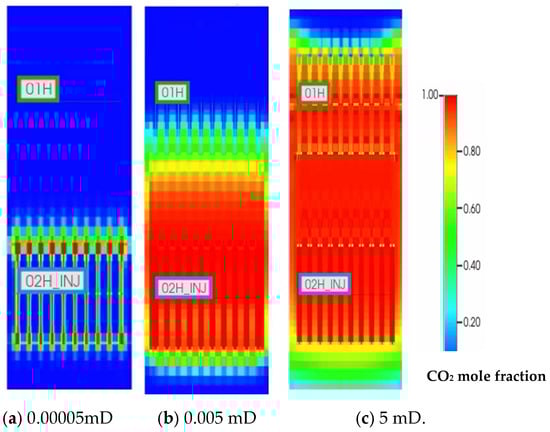
Figure 20.
CO2 mole fraction distribution with different permeabilities after 5 years of injection.
Nevertheless, at permeabilities of 5 mD and 0.005 mD, only approximately 9% of CO2 is retained, whereas at 500 nd, a successful storage of 94% of the injected CO2 is achieved after 40 years of CO2 injection. This suggests that nanopores are advantageous for CO2 storage (Figure 21).
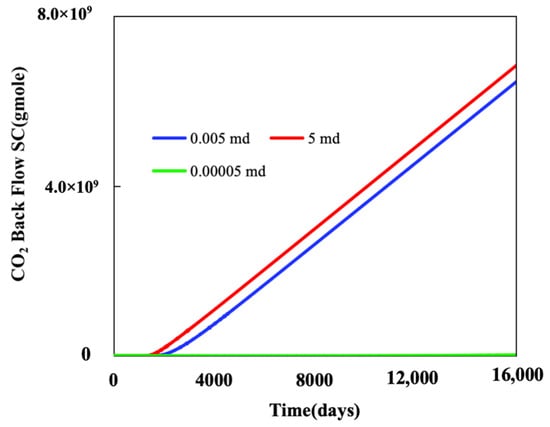
Figure 21.
CO2 back flow under different permeabilities.
While ultra-low permeability formations (e.g., 500 nD) exhibit high CO2 retention capacity—primarily due to reduced gas mobility and minimal flowback—these same formations pose significant challenges for CO2 injection, as evidenced by the injectivity results presented in Table 6. This contrast highlights the need to strike a balance between sequestration effectiveness and operational feasibility. Optimal reservoir conditions for CO2 storage should not only ensure long-term containment but also allow for technically and economically viable injection rates. Identifying permeability ranges that offer both adequate injectivity and high retention remains critical for evaluating the practical feasibility of CO2 sequestration projects.
Table 6.
Stored CO2 under varying permeabilities.
4. Conclusions
Our study was focused on enhancing gas and oil recovery and CO2 storage in shale gas reservoirs, considering various sensitive parameters and key mechanisms. CO2 flooding and CO2 H&P were investigated using numerical simulations. The following conclusions are drawn from this study:
- The CO2 H&P for EGR could be a viable choice, especially when considering mechanisms such as diffusion and adsorption.
- The CO2 H&P scenario is not suitable for CO2 storage, even considering diffusion, adsorption, and the presence of natural fractures, because more than 80% of the injected CO2 is reproduced quickly back to the surface.
- Gas adsorption leads to a roughly 9% increase in gas recovery, with approximately 14% of CO2 successfully sequestered during 40 years of gas production.
- The molecular diffusion of CO2 significantly contributes to the improvement of gas recovery in shale gas reservoirs. The utilization of the Sigmund correlation results in an approximate 19% increase in gas recovery. However, the impact on CO2 storage is found to be insignificant.
- The CO2 flooding scenario for shale gas reservoirs seems to be a promising solution for both EGR and CO2 storage. It contributes a 26% increase to methane production while maintaining 94% of the injected CO2 to be stored successfully.
- A higher porosity can improve reservoir storage capacity and facilitate effective CO2 distribution, while increased permeability aids in displacing native gases and boosting overall recovery.
- Nanopores exhibit favorable characteristics for CO2 storage, with a substantial retention of 94% observed at a permeability of 500 nD, while lower permeabilities resulted in limited CO2 retention.
Author Contributions
Conceptualization, N.Z. and K.S.; methodology, N.Z.; software, N.Z.; validation, N.Z., K.S. and D.D.; formal analysis, N.Z. and J.I.; investigation, N.Z.; resources, K.S.; data curation, N.Z. and J.I.; writing—original draft preparation, N.Z.; writing—review and editing, K.S. and N.Z.; visualization, F.K.; supervision, K.S.; project administration, D.D. and J.I.; funding acquisition, D.D. and J.I. All authors have read and agreed to the published version of the manuscript.
Funding
This research was funded by the Ministry of Science and Higher Education of the Republic of Kazakhstan, grant number AP23489740. The article was prepared as part of the project titled “Research salt precipitation’s impact on CO2 injection wells injectivity and improvement of salt precipitation model for effective CO2 sequestration”, funded under the 2024–2026 grant competition for scientific and/or scientific and technical projects. APC: The APC was funded by the same grant (AP23489740).
Data Availability Statement
The data presented in this study are available on request from the corresponding author due to privacy.
Acknowledgments
We would like to thank Cunqi Jia for reviewing this manuscript.
Conflicts of Interest
The authors declare no conflict of interest.
References
- Intergovernmental Panel on Climate Change (IPCC). Climate Change 2023: Synthesis Report Contribution of Working Groups I, II, III to the Sixth Assessment Report of the Intergovernmental Panel on Climate Change; Lee, H., Romero, J., Eds.; IPCC: Geneva, Switzerland, 2023. [Google Scholar] [CrossRef]
- Ding, J.; Cao, T.; Wu, J. Experimental Investigation of Supercritical CO2 Injection for Enhanced Gas Recovery in Tight Gas Reservoir. In Proceedings of the Carbon Management Technology Conference, Houston, TX, USA, 15–18 July 2019. All Days 2019, CMTC-558535-MS. [Google Scholar] [CrossRef]
- Wang, H.; Rezaee, R. CO2 Storage with Enhanced Gas Recovery CS-EGR in Conventional and Unconventional Gas Reservoirs in Australia. In Proceedings of the SPE Asia Pacific Oil & Gas Conference and Exhibition, Perth, Australia, 17–19 November 2020; p. D013S102R003. [Google Scholar] [CrossRef]
- Zhao, Y.; Zhang, L.; Zhang, R.; Chen, S.; Pang, Y.; Wang, R. Numerical Simulation the Supercritical CO2 Sequestration in Shale Gas Reservoir with Enhanced Gas Recovery. In Proceedings of the 8th Unconventional Resources Technology Conference, Houston, TX, USA, 20–22 July 2020. [Google Scholar] [CrossRef]
- Eltahan, E.; Ganjdanesh, R.; Yu, W.; Sepehrnoori, K.; Drozd, H.; Ambrose, R. Assisted History Matching using Bayesian Inference: Application to Multi-Well Simulation of a Huff-n-Puff Pilot Test in the Permian Basin. In Proceedings of the 8th Unconventional Resources Technology Conference, Houston, TX, USA, 20–22 July 2020. [Google Scholar] [CrossRef]
- Temizel, C.; Canbaz, C.H.; Palabiyik, Y.; Hosgor, F.B.; Atayev, H.; Ozyurtkan, M.H.; Aydin, H.; Yurukcu, M.; Boppana, N. A Review of Hydraulic Fracturing and Latest Developments in Unconventional Reservoirs. In Proceedings of the Offshore Technology Conference, Houston, TX, USA, 2–5 May 2022; p. D011S005R006. [Google Scholar] [CrossRef]
- Wang, L.; Yu, W. Lean Gas Huff and Puff Process for Eagle Ford Shale with Connecting Natural Fractures: Well Interference, Methane Adsorption and Gas Trapping Effects. In Proceedings of the SPE Liquids-Rich Basins Conference, North America, Odessa, TX, USA, 7–8 November 2019; p. D021S007R003. [Google Scholar] [CrossRef]
- Jing, M.; Yang, R.; Huang, Z.; Cong, R.; Chen, J.; Wen, H. Numerical Investigation on Field-Scale Fracture Propagation of Multi-Layered Formations Based on Unconventional Fracture Model. In Proceedings of the 57th U.S. Rock Mechanics/Geomechanics Symposium, Atlanta, GA, USA, 25–28 June 2023; p. ARMA-2023-0410. [Google Scholar] [CrossRef]
- Yu, W.; Sepehrnoori, K. Simulation of Gas Desorption and Geomechanics Effects for Unconventional Gas Reservoirs. In Proceedings of the SPE Western Regional & AAPG Pacific Section Meeting 2013 Joint Technical Conference, Monterey, CA, USA, 19–25 April 2013; p. SPE-165377-MS. [Google Scholar] [CrossRef]
- Yu, W.; Al-Shalabi, E.W.; Sepehrnoori, K. A Sensitivity Study of Potential CO2 Injection for Enhanced Gas Recovery in Barnett Shale Reservoirs. In Proceedings of the SPE Unconventional Resources Conference 2014, The Woodlands, TX, USA, 1–3 April 2014; p. D031S007R007. [Google Scholar] [CrossRef]
- Computer Modelling Group Ltd. GEM User Guide: General Equation-of-State Compositional Simulator, Version 2022; CMG: Calgary, Canada, 2022. [Google Scholar]
- Evans, R.D.; Civan, F. Characterization of Non-Darcy Multiphase Flow in Petroleum Bearing Formation; University of Oklahoma: Norman, OK, USA, 1994. [Google Scholar]
- Lake, L.W.; Johns, R.T.; Rossen, W.R.; Pope, G.A. Fundamentals of Enhanced Oil Recovery; Society of Petroleum Engineers: Richardson, TX, USA, 2014. [Google Scholar]
- Kim, T.H.; Lee, K.S. Effects of various uncertainties on the performance of CO2 injection in shale gas reservoirs. Appl. Energy 2017, 190, 1163–1174. [Google Scholar] [CrossRef]
- Computer Modelling Group Ltd. CMG WinProp (Version 2021.10). Calgary, Canada. 2021. Available online: https://www.cmgl.ca/ (accessed on 8 May 2025).
- Chalmers, G.R.L.; Bustin, R.M. Lower Cretaceous gas shales in northeastern British Columbia, Part II: Evaluation of regional potential gas resources. Bull. Can. Pet. Geol. 2008, 56, 22–61. [Google Scholar] [CrossRef]
- Zhang, H.; Cao, D. Molecular simulation of displacement of shale gas by carbon dioxide at different geological depths. Chem. Eng. Sci. 2016, 152, 60–67. [Google Scholar] [CrossRef]
- Langmuir, I. The Adsorption of Gases on Plane Surfaces of Glass, Mica and Platinum. J. Am. Chem. Soc. 1918, 40, 1361–1403. [Google Scholar] [CrossRef]
- Gensterblum, Y.; van Hemert, P.; Billemont, P.; Busch, A.; Charriére, D.; Li, D.; Krooss, B.; de Weireld, G.; Prinz, D.; Wolf, K.-H. European inter-laboratory comparison of high pressure CO2 sorption isotherms. I: Activated carbon. Carbon 2009, 47, 2958–2969. [Google Scholar] [CrossRef]
- Civan, F.; Rai, C.S.; Sondergeld, C.H. Shale gas permeability and diffusivity inferred by improved formulation of relevant retention and transport mechanisms. Transp. Porous Media 2012, 86, 925–944. [Google Scholar] [CrossRef]
- Javadpour, F. Nanopores and apparent permeability of gas flow in mudrocks (shales and siltstone). J. Can. Pet. Technol. 2009, 48, 16–21. [Google Scholar] [CrossRef]
- Du, X.; Gu, M.; Liu, Z.; Zhao, Y.; Sun, F.; Wu, T. Enhanced Shale Gas Recovery by the Injections of CO2, N2, and CO2/N2 Mixture Gases. Energy Fuels 2019, 33, 5091–5101. [Google Scholar] [CrossRef]
- Mukherjee, S.; Dang, S.T.; Rai, C.; Sondergeld, C. Novel Techniques to Measure Oil-Gas Diffusion at High Pressure and High Temperature Conditions: Application for Huff-N-Puff EOR in Shales. In Proceedings of the 8th Unconventional Resources Technology Conference, Houston, TX, USA, 20–22 July 2020. [Google Scholar] [CrossRef]
- Sigmund, P.M. Prediction of molecular diffusion at reservoir conditions. Part I—Measurement and prediction of binary dense gas diffusion coefficients. J. Can. Pet. Technol. 1976, 15, 48–57. [Google Scholar] [CrossRef]
Disclaimer/Publisher’s Note: The statements, opinions and data contained in all publications are solely those of the individual author(s) and contributor(s) and not of MDPI and/or the editor(s). MDPI and/or the editor(s) disclaim responsibility for any injury to people or property resulting from any ideas, methods, instructions or products referred to in the content. |
© 2025 by the authors. Licensee MDPI, Basel, Switzerland. This article is an open access article distributed under the terms and conditions of the Creative Commons Attribution (CC BY) license (https://creativecommons.org/licenses/by/4.0/).