Abstract
The aim of this article is to assess the sale structure impact of selected, popular brands of passenger vehicles on total CO2 emissions in the context of the energy transition in the transport sector. A detailed analysis was conducted of the projected sales of gasoline-, diesel-, hybrid-, as well as electric-powered vehicles over the years 2021–2028. Based on the available empirical data, a mathematical model was developed to estimate emissions over the entire life cycle of vehicles, taking into account the unit carbon footprint of each type of drivetrain and the expected number of vehicles sold. The results indicate a gradual decline in total CO2 emissions during the analyzed period, mainly due to the increasing share of alternative drivetrains. Despite the growth in electric vehicle sales, their impact on emission reductions remains limited due to the long lifespan of conventional vehicle fleets. The article concludes with a proposal to expand the LCA model to include regional, energy, and recycling components, which could help in formulating more effective climate policies.
1. Introduction
In the face of the growing global problem of greenhouse gas emissions and their impacts on climate change, the transport sector plays a crucial role [1,2,3]. It is estimated that transport accounts for a significant portion of total greenhouse gas (GHG) emissions, with carbon dioxide being one of the main contributors. Therefore, a precise assessment and comparison of CO2 emissions related to different types of passenger vehicles is fundamental for both consumers and policymakers to make informed decisions. One of the comprehensive methodologies for evaluating the environmental impacts of products and services is life cycle assessment (LCA), which covers all stages of a product’s life, from raw material extraction to its disposal.
The environmental advantage of electric vehicles (EVs) is intrinsically linked to the carbon intensity of the electricity grid they utilize. In regions with a high proportion of fossil fuels in their energy mix, the well-to-wheel emissions of EVs might be comparable to or even, in some specific analyses focusing on manufacturing, temporarily higher than those of efficient internal combustion engine vehicles (ICEVs), particularly when considering vehicle production. Conversely, as the energy sector decarbonizes through the increased adoption of renewable energy sources (solar, wind, and hydro), the life cycle emissions of EVs progressively decrease, solidifying their role as a key technology in mitigating transport-related CO2 emissions [1,4].
Whereas dealing with CO2 emissions generated by the transport sector is imperative, a comprehensive environmental assessment should also consider other pollutants and impacts. These include particulate matter (PM), nitrogen oxides (NOx), and other volatile organic compounds emitted during vehicle operation and manufacturing, as well as the environmental burdens associated with battery production (resource depletion, water usage, and land use) and end-of-life management. A broader perspective might reveal trade-offs between different powertrain technologies across various environmental indicators, highlighting the need for multi-criteria decision-making [3,4].
The successful transition to a low-carbon transport sector is not solely dependent on technological advancements. Consumer acceptance, driven by factors such as purchase price, range anxiety, charging infrastructure availability, and individual environmental consciousness, plays a crucial role in shaping market trends. Policy interventions, including subsidies, tax incentives, and the development of a robust charging infrastructure, are essential to accelerate the adoption of cleaner vehicles and influence consumer preferences [1,2].
The energy transition in the transport sector is regarded a gradual process affected by technological innovation, infrastructure development, policy changes, and economic factors. Whilst the increasing market share of alternative drivetrains is a positive trend, the inertia of the existing vehicle fleet entails that the full benefits of this transition in terms of emission reductions will be realized over several years. Therefore, long-term policy frameworks and consistent signals are necessary to guide investment and innovation toward sustainable mobility solutions [1,3].
This article consists of two stages. The first is a comparison of the total CO2 emissions in the life cycle of passenger vehicles powered by gasoline, diesel, and electricity, based on available studies and statistical data. The second stage focuses on the characterization and evaluation of the passenger vehicle market at the national level using a selected manufacturer as an example. Combining sales structure data with a discussion of the life cycle allows for a comprehensive analysis of the environmental impacts of dominant drivetrain (also known as powertrain or propulsion) technologies and an assessment of real market trends in terms of the energy transition in the transport sector.
This analysis will make it possible not only to determine which types of drivetrains have the lowest CO2 emissions across their entire life cycle but also to indicate to what extent the current market offer and consumer preferences contribute to the reduction in greenhouse gas emissions. This analysis can also serve as a starting point for discussions on future directions for transport policy development and strategies for automotive manufacturers.
2. Literature Review
The issues of emissions and their environmental impacts in the context of market dynamics of sales across various energy technologies and the overarching global energy transformation are deemed critical areas of contemporary research and policy. Understanding the connections among these subjects is crucial for navigating the transition toward a sustainable energy future and mitigating the adverse effects of climate change and pollution [4]. Future research should yet focus on further elucidating the complex interconnections and addressing the identified gaps in the existing body of knowledge.
The topic of emissions and environmental impact of energy systems, particularly when quantifying the produced emissions associated with different energy sources and their resulting environmental consequences, has been addressed in a wide range of works, for instance [5,6,7,8,9,10,11,12]. Specifically, extensive research [5] details the greenhouse gas emissions (e.g., CO2, CH4, and N2O) from the combustion of coal, oil, and natural gas, whilst [6] highlights air pollutants (e.g., SOx, NOx, and particulate matter) and their impacts on air quality, human health, and ecosystems. On the other hand, Sovacool focuses on low direct GHG emissions of nuclear power during operation but addresses concerns regarding radioactive waste disposal, potential accidents [7], and the nuclear fuel cycle, and in [8], research on solar, wind, hydro, geothermal, and biomass energy is discussed when emphasizing their potential for significantly lower GHG emissions compared to fossil fuels. However, several studies also investigate the life-cycle emissions associated with the manufacturing, deployment, and disposal of renewable energy technologies, e.g., Pehnt et al. focused on biomass [9] and Schleisner focused on wind [10]. In addition, environmental impacts beyond emissions, such as land use changes, habitat disruption, and water consumption, have been explored as well, e.g., by Godfray et al. on hydropower [11] and by Rykała et al. when using logistic regression [12].
As for the subject of the sales dynamics and market penetration of energy technologies with a special consideration of factors affecting the sales and market adoption of different energy technologies, including both fossil fuels and cleaner alternatives, multiple studies have been published as well [13,14,15,16,17,18,19,20]. While Acemoglu et al. deal with price competitiveness, investment costs, operational expenses, government subsidies, carbon pricing mechanisms, and tax incentives as key drivers of energy technology sales [13], Jaffe et al. analyze the price elasticity of demand for different energy sources and the impact of policy interventions on the market share [14]. On the other hand, innovation, performance improvements, technological maturity, infrastructure availability, and grid integration capabilities that significantly affect the marketability of energy technologies are dealt with by Foster [15], and Grübler et al. explore the diffusion of innovations and the role of learning curves in reducing the cost of new technologies [16]. Social and behavioral factors have been analyzed as well. For instance, Stern evaluates consumer preferences, awareness of environmental issues, social norms, and trust in new technologies as aspects that play crucial roles in adoption decisions [17], and Rogers provides insights into behavioral economics and sociology in terms of various energy technologies [18]. Last but not least, government policies, including renewable energy mandates, feed-in tariffs, emissions standards, and regulations on fossil fuels, having a profound impact on the sales and deployment of different energy technologies are discussed by Helm [19], and Vieira et al. compare the effectiveness of various policy instruments [20].
Apart from the above aspects and literature sources, the topic of the ongoing global energy transformation and its drivers (such as climate change, energy security, and technological advancements) have also been examined. For instance, Smil explores the pathways and challenges related to shifting away from fossil fuel-dominated energy systems. This includes analyses of stranded assets, the role of incumbent industries, and the need for new infrastructure [21]. Furthermore, a study [22] focused on the rapid growth of renewable energy technologies and their integration into existing energy systems, and Jacobson et al. address issues such as grid stability, energy storage, and the intermittency of renewable sources [23]. The increasing electrification of various sectors (e.g., transportation and heating) and the integration of different energy systems (e.g., power-to-gas) as key indicators of the energy transformation are discussed in [24]. This literature explores the potential for reducing emissions and increasing energy efficiency through these trends. And last but not least, Falkner investigates the role of international agreements (e.g., Paris Agreement), national energy strategies, and sub-national initiatives in driving the energy transition [25]. The effects of political economy, public opinion, and stakeholder engagement are analyzed as well.
While significant research exists in each area under investigation, a further in-depth and meticulous examination is needed to fully understand the comprehensive interconnections among emissions and environmental impacts, sales dynamics, and the broader energy transformation. For example, more research could explore
- The feedback loops between public awareness of environmental impacts and consumer demand for cleaner energy technologies;
- The influence of specific emission regulations on the market competitiveness of different energy sources;
- The roles of sales and market penetration in accelerating the learning curves and cost reductions of low-carbon technologies (so called “eco-friendly”), thus further driving down emissions;
- The social and economic consequences of different energy transition pathways, considering both environmental benefits and potential disruptions, and so forth.
The conducted research, in addition to scientific studies, was also based on available reports, analyses, and tests published by car manufacturers, specialist industry portals, and motoring enthusiasts. Such a wide range of sources allowed a more comprehensive and diverse picture of the subject matter to be obtained, taking into account both the theoretical foundations and practical aspects of use and the opinion of the automotive community.
3. Methodology
Life cycle assessment (LCA) is a well-established and standardized methodology for evaluating the environmental impacts of products, processes, and services, covering the full scope of their existence—from raw material extraction to final disposal [26]. The term “cradle to grave” means that LCA considers all stages of the life cycle: the extraction and processing of raw materials, component production and assembly, distribution of the finished product, its use by the consumer, as well as end-of-life waste management, including recycling and landfilling [27,28].
In the automotive sector, particularly for passenger vehicles, life cycle analysis enables a comprehensive assessment of the total environmental footprint of a given means of transport [29,30,31]. A particular emphasis is placed on estimating total greenhouse gas emissions, most commonly expressed in terms of the carbon dioxide equivalent (CO2e), generated at each of the mentioned stages. This approach allows not only for a comparison of different drivetrain technologies—such as internal combustion engines (gasoline and diesel) and electric drivetrains—but also for the identification of life cycle stages with the highest contribution to emissions [32,33].
In practice, LCA takes into account numerous variables, such as the type and origin of raw materials, the source of energy used in the production process, the energy intensity of vehicle use (including the fuel type or energy mix), as well as end-of-life scenarios for vehicle disposal. As a result, the findings can serve as a basis for developing more sustainable strategies for technological development, climate policy, and consumer decision-making. Operational emissions include all energy-related emissions occurring during vehicle use, including fuel consumption during engine idling, warm-up, and stop-and-go conditions, as captured in the total lifetime fuel consumption estimates.
This study considers the following key stages of a vehicle’s life cycle:
- Raw material extraction and processing—This stage includes emissions associated with obtaining the raw materials needed for vehicle production, such as steel, aluminum, plastics, and—in the case of electric vehicles—the materials used in battery production (lithium, cobalt, nickel, and manganese) [33]. These processes are often energy-intensive and generate significant amounts of CO2. For example, meta-analyses of lithium-ion battery production show a global warming potential ranging from 12 to 313 kg CO2e per kWh of battery capacity, with a global average around 187 kg CO2e/kWh [34,35]. Another study reports 110 g CO2e (≈0.11 kg CO2e) per Wh, i.e., 110 kg CO2e/kWh [36]. Vehicle and component manufacturing—This stage relates to emissions from manufacturing the vehicle itself and its key components, including the engine, gearbox, and, in the case of electric vehicles, the battery. The production of lithium-ion batteries for electric vehicles is particularly energy-intensive and can significantly contribute to their initial carbon footprint, causing increases of 15% to 68% in vehicle manufacturing emissions and adding roughly 53–356 kg CO2e per kWh of battery capacity (global average ~110–187 kg CO2e/kWh) [33,37,38].
- Fuel/energy production and distribution—For gasoline and diesel vehicles, this stage includes crude oil extraction, transport, and the energy-intensive refining process to produce gasoline and diesel fuel. For electric vehicles, this stage involves the generation of electricity from various sources (fossil fuels, nuclear power, and renewable energy) and its transmission and distribution to charging stations. It is important to emphasize that the energy mix of a given region plays a crucial role in determining the CO2 emissions associated with the use of electric vehicles [39].
- Vehicle use and maintenance—For gasoline and diesel vehicles, this stage focuses on direct CO2 emissions from fuel combustion in the engine. Electric vehicles do not emit CO2 directly during operation, but their use is indirectly associated with emissions from electricity generation. Indirect emissions related to the production and use of consumables such as tires and lubricants should also be considered.
End-of-life/recycling—This stage includes emissions related to the disposal of the vehicle and its components, as well as the potential environmental benefits from recycling materials (steel, aluminum, and battery components), and the energy savings and avoided emissions made possible by using recycled materials [33].
In the vehicle life cycle analysis, the well-To-wheels (WTW) approach is often used. It focuses on the life cycle of the energy carrier used to power the vehicle (liquid fuel or electricity), considering environmental protection aspects from the energy source to its use in the vehicle [33,40,41].
The methodology for calculating the linear regression applied to the sale forecasts is that the sale forecast was conducted independently for each drivetrain type using linear regression [42]:
where
is the number of vehicles of type (gasoline, diesel, hybrid, electric) sold in year ,
is the regression coefficients for the drivetrain,
are the observation years, and
predictions were made for the years 2026, 2027, 2028.
Based on the projected number of sold vehicles, CO2 emissions over the full lifecycle of each vehicle were estimated using the following equation:
where
is the CO2 emissions for vehicle type in year , in tons, and
is the unit CO2 emission per vehicle of type .
4. Results Obtained
4.1. CO2 Emissions of Petrol-Powered Passenger Cars
The life cycle of a petrol-powered car begins with the extraction of crude oil, its transportation, and the energy-intensive refining process required to produce petrol. Each of these stages contributes to CO2 emissions. Subsequently, during the production of the vehicle itself, additional emissions are generated due to the extraction and processing of raw materials such as steel and aluminum [33], the production of various components, and the final assembly of the car.
The largest share of CO2 emissions in the life cycle of a petrol car occurs during the usage phase [43,44]. Direct CO2 emissions result from burning petrol in the engine. Average CO2 emissions during the use phase of petrol cars are estimated at 120–150 g/km [45,46]. Studies show that the total life cycle CO2 emissions of a petrol car in Europe in 2021 were just under 250 g CO2/km. Forecasts for 2031, assuming the implementation of the Paris Agreement, predict only a slight decrease to around 240 g CO2/km [6]. Another study by VDI estimated that a petrol car emits 37.1 tons (≈186 gCO2/km) of CO2 over a lifetime distance of 200,000 km [47]. In comparison, the Renault Clio’s average total life cycle CO2 emissions in European use were estimated at approximately 47 tons (≈235 gCO2/km) [48].
The end-of-life phase of a petrol vehicle also generates CO2 emissions, related to its disposal, including potential emissions from landfills and the energy needed to recycle materials such as steel and aluminum [33].
Analyzing the life cycle of a petrol vehicle shows that fuel combustion is the dominant phase in terms of emissions, although fuel production and vehicle manufacturing also make significant contributions. The limited forecasted reductions in emissions for petrol cars by 2031 suggest that achieving a substantial environmental impact reduction may be difficult through internal combustion engine improvements alone [49].
4.2. CO2 Emissions of Diesel-Powered Passenger Cars
Similar to petrol vehicles, the life cycle of a diesel car begins with the extraction, transport, and refining of crude oil to produce diesel fuel. These processes generate CO2 emissions, which may differ slightly from those involved in petrol production. Manufacturing a diesel vehicle also results in CO2 emissions from material processing and assembly.
During operation, diesel vehicles emit CO2 directly. Average tailpipe emissions are estimated at 130–170 g/km [50]. WHO data for Europe in 2021 indicate total emissions for diesel cars comparable to petrol cars, around 250 g CO2/km [6]. A VDI study estimated emissions at 33.0 tons of CO2 over 200,000 km, slightly lower than petrol vehicles in this specific analysis [47]. A noteworthy result from the Green NCAP study showed that the Škoda Octavia Combi 2.0 TDI consumes 164 MWh of energy over its lifetime, which is comparable to, or even better than, some electric and hybrid vehicles [48].
The end-of-life stage for diesel vehicles is similar to that of petrol vehicles.
Although diesel cars are commonly thought to emit more CO2 during operation than petrol cars, some life cycle analyses suggest that due to potentially better fuel efficiency, their total emissions may be slightly lower [46,47,50]. However, these outcomes can vary depending on the adopted methodology and study assumptions. The Green NCAP study highlights the complexity of comparing different drivetrains, suggesting that in certain scenarios, modern diesel vehicles may have comparable or even lower life cycle energy consumption than some electric and hybrid vehicles [48]. This underscores the importance of the assumptions and methodologies used in LCA (life cycle assessment) studies [51].
4.3. CO2 Emissions of Electric Passenger Cars
The life cycle of electric passenger cars differs significantly from combustion engine vehicles, particularly in the usage phase. However, they generate CO2 emissions at other stages. The extraction and processing of raw materials necessary for battery production—such as lithium, cobalt, nickel, and manganese—are associated with significant CO2 emissions [33]. These processes are energy-intensive and have notable environmental impacts. The production of lithium-ion batteries itself is highly energy-consuming and represents a major contribution to the initial carbon footprint of electric vehicles [1,33]. This stage is estimated to account for 50% to 90% of the total CO2 emissions in the life cycle of an electric vehicle [38,52]. Nevertheless, due to technological advancements and the use of cleaner energy sources in manufacturing, CO2 emissions per kWh of battery production show a decreasing trend [38,52].
The production of the electric vehicle itself, excluding the battery, involves emissions from material processing and assembly similar to those in combustion vehicles [33].
CO2 emissions during the use phase of electric vehicles depend entirely on the source of electricity used for charging [53,54]. Assuming the average European energy mix in 2021, total CO2 emissions for electric vehicles were about 80 g CO2/km, with projections for 2030 indicating a decrease to around 65 g CO2/km [55]. When powered entirely by renewable energy, emissions drop below 50 g CO2/km [55]. In countries with a high share of fossil fuels in the energy mix, such as Poland, per-kilometer emissions during use can be higher compared to countries with cleaner energy sources [56].
The end-of-life stage of batteries and their recycling is critical for assessing the environmental impacts of electric vehicles. Battery recycling can help reduce CO2 emissions and recover valuable raw materials [33]. Developing an efficient and sustainable battery recycling infrastructure is therefore crucial.
A VDI study found that the electric Volkswagen ID.3 emits 24.2 tons of CO2 over 200,000 km [47]. For comparison, the Renault Zoe emits 32 tons of CO2 over its entire life cycle in Europe [48]. The potential reduction in life cycle emissions for electric vehicles ranges from 17–30% when using non-renewable electricity to 60–80% when powered entirely by renewables compared to a petrol vehicle [57]. A WHO study suggests that electric vehicles in Europe generate 66–69% fewer greenhouse gas emissions than comparable petrol vehicles [6]. A study by Volvo indicates that manufacturing an electric vehicle may produce 70% more CO2 than a combustion vehicle, but the total life cycle carbon footprint becomes lower over time and mileage [57].
The initial carbon footprint of electric vehicles is usually higher than that of petrol or diesel vehicles due to energy-intensive battery production [58]. However, operational emissions are significantly lower, especially when the electricity comes from renewable sources [59]. This leads to a lower overall life cycle emission level in many scenarios [58]. The point at which an electric vehicle’s total emissions become lower than those of a comparable petrol or diesel car depends largely on the carbon intensity of the power grid. In regions with a high share of fossil fuels in the energy mix, this point may be reached after a longer period of use [56]. Studies such as those by WHO [6] suggest that even with the current European energy mix, electric vehicles already offer a significant reduction in life cycle greenhouse gas emissions compared to conventional vehicles. This advantage is expected to grow as the energy sector becomes more decarbonized [59].
4.4. Emission Comparisons and Statistics
Table 1 presents a comparison of the vehicle whole-life carbon emissions analysis of estimated lifecycle emissions (tons CO2e) based on a 2015 vehicle in use for 150k KM using a 10% ethanol blend and 500 g/KWH grid electricity [60,61].

Table 1.
Life cycle CO2 emissions comparison: standard gasoline, hybrid, plug-in hybrid, and battery electric vehicles.
Table 2 presents the life-cycle greenhouse gas (GHG) emissions (100-year global warming potential, in g CO2e/MJ) for average fossil and biogenic blends of gasoline, diesel, and natural gas, as well as for grid electricity and hydrogen mixes in China, Europe (EU27+UK), India, and the United States. The data cover the 15–18 year lifetime of cars registered in 2021 and 2030, along with a sales-weighted global average across these regions. Emission values for gasoline, diesel, and natural gas are presented as (production emissions) + (consumption emissions) [60,61,62].
Table 2.
Life-cycle greenhouse gas (GHG) emissions for average fossil and biogenic blends of gasoline, diesel, and natural gas, as well as for grid electricity and hydrogen mixes in China, Europe (EU27+UK), India, and the United States.
From the presented data, it is evident that CO2 emissions over the vehicle life cycle vary depending on the type of vehicle and the study methodology. Gasoline (petrol) and diesel vehicles show similar levels of total CO2 emissions per kilometer in many studies, especially when life-cycle emissions (including fuel production, vehicle manufacturing, and usage) are taken into account. For example, a comprehensive life cycle assessment by the International Council on Clean Transportation found that the total life cycle CO2 emissions of diesel cars are only marginally lower (by about 3–5%) than those of gasoline cars, primarily due to slightly better fuel economy, which is largely offset by higher emissions during fuel production and vehicle manufacturing [61,63,64,65].
The energy mix has a significant impact on the life cycle emissions of electric vehicles. In countries where fossil fuels constitute a large share of the energy mix, the emission benefits of using electric vehicles may be reduced. However, as energy production shifts toward cleaner sources, the advantage of electric vehicles in terms of emissions will increase [66]. There is a trade-off between the higher initial emissions associated with the production of electric vehicles (especially batteries) and their lower operational emissions compared to gasoline and diesel vehicles.
This study is based on the assumption that renewable energy is low-emission in terms of CO2, without considering the full life cycle of its production, which would require separate analyses. Nevertheless, many studies question the zero-emission status of renewable energy production and point out its potential environmental harm—which should also be highlighted in the context of the studies presented in this paper. It is commonly assumed that renewable energy production is climate-friendly and essentially free of CO2 emissions, especially during the energy generation phase [67]. This argument is frequently raised, for example, regarding the direct operation of renewable energy installations, where solar panels convert sunlight and wind turbines convert wind energy into electricity without emitting CO2 [67]. However, such a simplified perspective ignores the complexity of processes involved throughout the entire life cycle of renewable technologies. CO2 emissions should be assessed at all stages of a renewable energy technology’s life cycle, including raw material extraction, component production, transportation, installation, operation, and end-of-life disposal or recycling. Relying on an incomplete picture of the environmental impacts of renewable energy development may lead to misguided strategies and ultimately hinder the achievement of a truly sustainable energy system [68].
Nevertheless, this aspect will be analyzed in future studies by the authors as the next stage of the analyses presented in the paper. For now, it has only been signaled.
4.5. CO2 Emissions Forecast Based on the Sales Structure of Selected Brands of Vehicles (2021–2028)
To expand the assessment of greenhouse gas emissions over the vehicle life cycle, an annual CO2 emissions forecast was conducted based on the sales structure of vehicles from 2021 to 2025 and extrapolated to 2028. The analysis included passenger cars, classified by drivetrain type: gasoline, diesel, hybrid, and electric.
The collected sales data were used not only to determine direct emissions associated with vehicle operation but also as a foundation for further modeling of future development trends in electromobility and their potential environmental impacts. The assessment covered not only the magnitude of emissions but also the dynamics of change, including the gradual decline in the share of internal combustion engine (ICE) vehicles and the growing significance of alternative drivetrains.
Additionally, based on the sales data, the following charts were created [61]:
- A radar chart of selected cars’ parameters (2020–2024), see Figure 1;
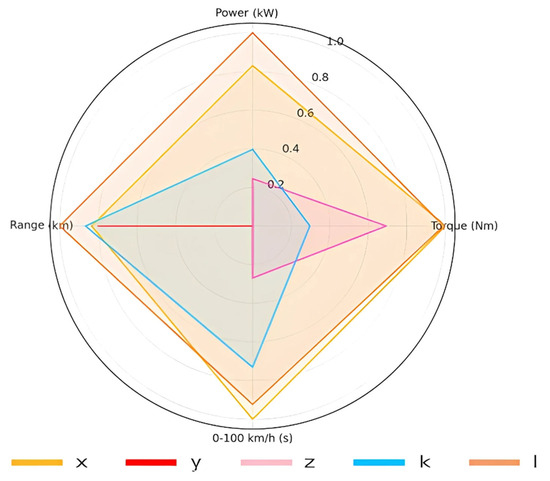 Figure 1. Comparison of the technical parameters of vehicles (2020–2024).
 - A three-dimensional histogram of the number of vehicles sold by type from 2020 to 2025 (no. of obs), see Figure 2;
- An annual CO2 emissions forecast by drivetrain type (2021–2028), see Figure 3.
For a comparative analysis, we selected five investigated vehicle models, each representing a different drivetrain type: x (electric drive), y (petrol engine), z (plug-in hybrid drive), k (petrol engine), and l (diesel engine).
Figure 1 above displays a radar chart that compares four key technical parameters: maximum power (kW), torque (Nm), 0–100 km/h acceleration (s), and range (km). To allow for a direct comparison despite varying units, these parameters were normalized within the (0, 1) range.
The values in the chart are sourced from Table 3 below and reflect actual technical data, consistent with official manufacturer specifications. The chart’s calibration sets the circle thresholds at normalized levels of 0.2, 0.4, 0.6, 0.8, and 1.0, thereby maintaining proper proportions between the models. Table 3 presents the actual values for each parameter.
Table 3.
Actual, catalog values of selected car parameters.
An analysis of the chart reveals that model x an electric vehicle, excels in range and torque. In contrast, model y demonstrates the highest power output. Model z, a plug-in hybrid, shows significantly lower power and range values, but it offers a good compromise between performance and efficiency.
Model k represents a premium car with high power and dynamic performance, making it suitable for fast highway driving, though it has moderate fuel efficiency.
Finally, model l is a more economical and practical choice that is well-suited for daily use, especially in urban and suburban conditions, with a focus on fuel efficiency and low emissions.
Figure 1 presents four key technical parameters of the selected models from the years 2020–2024: maximum power (in kW), maximum torque (Nm), acceleration from 0 to 100 km/h (s), and total driving range (km). The data for each parameter were normalized to standardize the scale and allow for direct comparison of values originally expressed in different units.
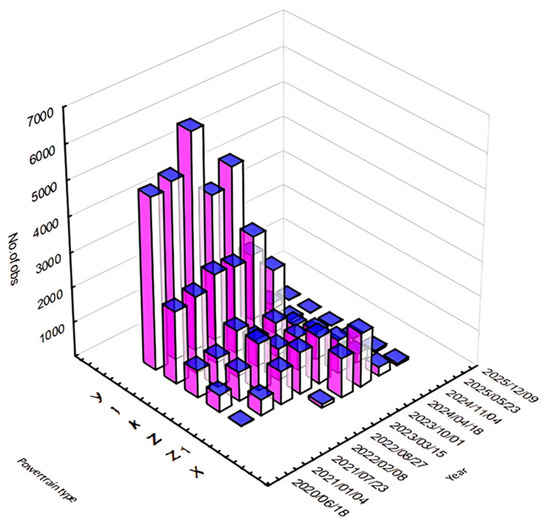
Figure 2.
Histogram of the number of vehicles sold by type (2020–2025).
Figure 2 presents the number of vehicles sold, with the axes representing the following [62]:
The X-axis represents the sales date, which covers the period from June 2020 to December 2025. Dates are marked at aggregate points (e.g., every few months), allowing an analysis of sales seasonality and dynamics over time.
The Y-axis represents the vehicle drivetrain type, where x denotes electric vehicles, y and k correspond to petrol-powered vehicles (with k referring specifically to an exclusive convertible model), z and z1 denote hybrid vehicles, and l represents diesel-powered vehicles.
The Z-axis represents the number of vehicles sold in a given period and for a given type/model (No. of obs = number of observations).
The results reveal that throughout the analyzed time frame, petrol-powered vehicles of type y consistently exhibited the highest sales volumes, with a pronounced peak observed between 2022 and early 2024. While a gradual decline is visible in the most recent data (2025), petrol engines still maintained a dominant market share.
The k variant, characterized as a premium convertible, showed significantly lower sales figures across the entire period, which aligns with its exclusive market positioning. Despite this, its relatively stable sales trajectory may suggest the presence of a steady, niche consumer base.
Electric vehicles, x, demonstrated a clear upward trend over time, with a noticeable acceleration in sales from 2023 onward. This pattern reflects the increasing adoption of electromobility, likely driven by broader regulatory, economic, and technological developments across the industry.
The hybrid category, z, experienced substantial sales during the mid-2021 to mid-2023 window, after which a modest decline occurred. In contrast, the alternative hybrid model z1 maintained a steady yet comparatively lower sales volume, suggesting consistent interest within a targeted segment of the market.
Finally, diesel-powered vehicles, l, consistently recorded the lowest sales levels across all time points. Their marginal and declining trend further supports the broader observation of their decreasing relevance in light of global decarbonization policies and shifting consumer preferences.
In summary, the data presented in Figure 2 reveal a progressive transformation in the automotive market, characterized by a gradual shift away from traditional internal combustion engines—particularly diesel—toward electrified powertrains. While petrol engines remain prevalent, the growing uptake of electric and hybrid vehicles indicates a transition toward more sustainable mobility solutions.
Calculation Methodology (see Section 3)
Assumed Unit Emission Values
Table 4.
The values adopted for individual vehicle types.
To better illustrate the changes, the relative change in emissions compared to the base year (2021) was introduced:
Assuming an average vehicle lifetime mileage of 200,000 km and average emissions per km, emissions can also be calculated with
where
is the average emissions per 1 km,
= 200,000 km and is the assumed mileage.
Results and Interpretation
For example, in 2026, the forecasted sales are
- 4527 gasoline vehicles;
- 3704 diesel vehicles;
- 100 hybrid vehicles;
- 893 electric vehicles.
This translates into
These calculations were repeated for each year, creating an annual emissions summary (see Table 5), which can serve as a basis for assessing the impacts of sales trends on emissions in the automotive sector.
Table 5.
Results for 2021–2028.
Figure 3 depicts a forecast of the vehicles under investigation according to the drivetrain type and year (2021–2028).
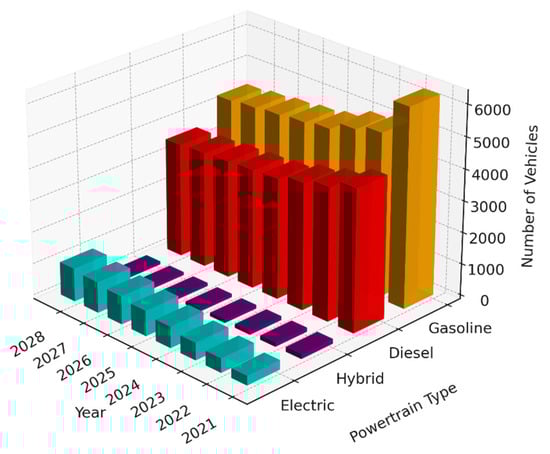
Figure 3.
Forecast of vehicles by type and year (2021–2028).
Figure 3 above shows the number of vehicles sold between 2021 and 2028, broken down by drivetrain type: gasoline, diesel, hybrid, and electric. A clear reduction in the sales of internal combustion engine vehicles and an increase in the sales of electric vehicles are evident during the analyzed period.
5. Discussion
Based on the results obtained (see Section 4 above), the estimated CO2 emissions (in tons) for four types of drivetrains: gasoline (orange line), diesel (red line), hybrid (dark pink line), and electric (light pink line) are depicted in Figure 4.
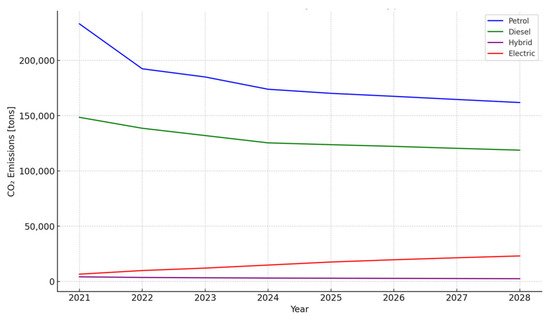
Figure 4.
Annual CO2 emissions forecast by drivetrain type (2021–2028).
A downward trend in CO2 emissions from gasoline vehicles is evident, from over 210,000 tons in 2021 to approximately 165,000 tons in 2028. Similarly, emissions from diesel vehicles declined from around 145,000 tons to just above 120,000 tons over the same period.
Hybrids generate significantly lower emissions than internal combustion engine (ICE) vehicles, on the order of several tens of thousands of tons annually, and show a stable, slow upward trend, which corresponds to an increasing number of hybrid vehicle sales.
Additionally, although CO2 emissions associated with electric vehicles remain low (mainly due to electricity production and charging), the chart indicates a growing share of this group: emissions increased from approximately 6600 tons in 2021 to nearly 23,000 tons in 2028. It is worth noting that even though the emissions generated by electric vehicles are significantly lower, their growing number may, in the coming years, contribute to a shift in the emissions profile from the usage phase to the electricity production phase.
Figure 4 illustrates the evolution of emission structures in the premium private transport sector in the context of the energy transition. It also confirms that the continuous increase in the share of electric and hybrid drivetrains contributes to reducing total CO2 emissions in the long term, although achieving this requires maintaining a high pace of technological transformation.
The results obtained confirm that, despite the growing share of electric vehicles, total CO2 emissions remain significant due to the dominance of internal combustion engine vehicles in the sales structure. Only a substantial change in the sales structure (a mass transition to zero-emission drivetrains) will result in a real reduction in emissions in the post-2030 period [71]. The presented methodology can be applied to a scenario-based analysis of climate policies and the modeling of potential benefits from accelerating the energy transformation in the transport sector.
Although the sales of electric vehicles are growing dynamically, their impact on the overall reduction of CO2 emissions by 2028 is still limited. A key factor that restricts the environmental effect is the high share of internal combustion vehicles from previous years, which remain in operation for many years [72,73].
The presented model also allows for the simulation of the impacts of decarbonization policies, changes in the energy mix, and tax regulations. In the next stages of the study, it is planned to introduce emission weights depending on the country of vehicle use and account for the effect of material recycling in the product’s end-of-life phase [74].
In the context of further development of the proposed model, it will also be crucial to consider the differentiated emission intensity depending on the vehicle segment and its lifecycle mileage. Commercial vehicles, such as delivery and heavy trucks, have significantly higher unit emissions than passenger cars, meaning that their energy transformation could result in relatively larger environmental benefits. Expanding the model to include these aspects will allow for a more accurate assessment of the potential impacts of different policy scenarios. This will be part of the authors’ further research [75,76].
It is also worth noting that the transport transformation is not limited to changes in the vehicle drivetrain itself. An important element will also be the development of the charging infrastructure, intelligent traffic management systems, and the promotion of alternative forms of mobility, such as public transport and micromobility. Only the synergistic actions of all these elements will provide a comprehensive and lasting reduction in emissions in the transport sector.
From the perspective of policymakers, it is therefore essential to develop integrated strategies that combine financial incentives, environmental regulations, and infrastructure investments. The presented model can support the decision-making process by identifying the most effective directions for action, considering both implementation costs and the expected effects in terms of emission reduction and economic impact.
In future research, it is also planned to include the social and economic aspects of the transformation, such as the availability of electric vehicles for different social groups, the impact on employment in the automotive sector, and changes in energy consumption patterns. Such an extension would enable a more comprehensive understanding of the consequences of transport decarbonization and assist in designing a just energy transition [77].
6. Conclusions
The conducted study aimed to evaluate the impact of the sales structure of the selected brands of passenger cars on total CO2 emissions with regard to the ongoing global energy transformation in the transport sector. By analyzing sales forecasts for gasoline, diesel, hybrid, and electric vehicles over the years 2021–2028, and employing the LCA-based mathematical model when incorporating the carbon footprint of each powertrain type (called also as engine propulsion or drivetrain type) and projected sales figures, this research provides valuable insights into the emission trends of a major automotive manufacturer.
Following the outcomes of the analysis obtained, the findings indicate a gradual decline in total CO2 emissions over the analyzed period. This reduction is primarily attributed to the increasing market share of alternative drivetrains, in particular hybrid and electric vehicles. However, this research highlights that despite the growth in electric vehicle sales, their immediate impact on overall emission reductions is somewhat constrained by the long lifespan of the existing fleet of conventionally powered vehicles. This suggests that a sustained and accelerated transition toward alternative drivetrains is inevitable to achieve significant emission reductions in the short to medium term.
Nevertheless, this study acknowledges several ensuing limitations that should be taken into consideration when interpreting the findings.
- First, this analysis is based on sales forecasts, which inherently carry a degree of uncertainty. Thus, deviations in actual sales figures could affect the projected emission reduction level.
- Second, the LCA model applied relies on mean emission factors for each drivetrain type. Variations in manufacturing processes, energy sources for electricity generation, and end-of-life treatment could affect the actual life cycle emissions.
- Third, this research focuses solely on the sales structure of passenger cars of one brand within a specific timeframe and does not account for the broader vehicle fleet or the impact of external factors (such as evolving energy policies, consumer behavior beyond purchasing decisions, and so on). To enhance the understanding of the automotive sector’s role in the energy transformation and to inform more effective climate policies, several avenues for further research are recommended, as follows:
- Expanding the LCA model to incorporate regional variations in energy grids, the environmental impacts of battery production and recycling, and the emissions associated with vehicle manufacturing would provide a more comprehensive evaluation.
- In addition, future research could explore the effects of government incentives, charging infrastructure development, and consumer adoption rates on the pace of electric vehicle penetration and its subsequent impact on emission reduction as well.
- Furthermore, analyzing the emission trends of other major automotive manufacturers and across different vehicle segments would offer a broader perspective on the sector’s overall contribution to the energy transition.
- Last but not least, investigating the potential of other alternative fuels and drivetrain technologies beyond electrification, such as hydrogen fuel cells and sustainable biofuels, within the same analytical framework could provide a more holistic understanding of future mobility scenarios and their environmental implications
Author Contributions
Conceptualization, O.O., O.S. and A.B.; methodology, O.O., O.S. and A.B.; software, A.B., E.K. and J.M.; validation, E.K., J.M. and P.K.; formal analysis, A.B. and P.K.; investigation, O.S. and A.B.; resources, O.O. and A.B.; data curation, A.B., J.M. and P.K.; writing—original draft preparation, O.O., O.S. and A.B.; writing—review and editing, O.S., A.B. and P.K.; visualization, O.O. and E.K.; supervision, O.S. and A.B.; project administration, O.S., A.B. and E.K. All authors have read and agreed to the published version of the manuscript.
Funding
This study was financed by the Faculty of Logistics and Security Management Military University of Technology, Research grant no. 065/2025.
Data Availability Statement
An anonymized, aggregated version of the sales data (source [62]) can be provided by the author upon reasonable request, subject to the data owner’s (Manufacturer X) approval. The data are not publicly available due to the confidentiality of sales data and business issues.
Conflicts of Interest
The authors declare no conflicts of interest.
References
- Niewczas, A.; Mórawski, Ł.; Rymarz, J.; Dębicka, E.; Hołyszko, P. Operational Risk Assessment Model for City Buses. Ekspl. Niezawodn. Maint. Reliab. 2023, 25, 14. [Google Scholar] [CrossRef]
- Yun, M.; Ren, J.; Zhang, L.; Chen, X. Fracture Process and Instability Precursor Determination of Freeze-thaw Red Sandstone Based on Acoustic Emission Monitoring. Ekspl. Niezawodn. Maint. Reliab. 2024, 26, 191193. [Google Scholar] [CrossRef]
- Folęga, P.; Burchart, D.; Kubik, A.; Turoń, K. Application of the life cycle assessment method in public bus transport. Ekspl. Niezawodn. Maint. Reliab. 2025. online first. [Google Scholar] [CrossRef]
- Jaroń, A.; Borucka, A.; Deliś, P.; Sekrecka, A. An Assessment of the Possibility of Using Unmanned Aerial Vehicles to Identify and Map Air Pollution from Infrastructure Emissions. Energies 2024, 17, 577. [Google Scholar] [CrossRef]
- IPCC. Climate Change 2014: Synthesis Report; IPCC: Geneva, Switzerland, 2014; ISBN 978-92-9169-143-2. Available online: https://www.ipcc.ch/site/assets/uploads/2018/05/SYR_AR5_FINAL_full_wcover.pdf (accessed on 7 April 2025).
- WHO. WHO Global Air Quality Guidelines: Particulate Matter (PM2.5 and PM10), Ozone, Nitrogen Dioxide, Sulfur Dioxide and Carbon Monoxide; World Health Organization: Geneva, Switzerland, 2021; ISBN 978-92-4-003422-8. [Google Scholar]
- Sovacool, B.K. Contesting the Science of Nuclear Power: A Critical Review of the Field. Energy Policy 2011, 39, 7263–7272. [Google Scholar] [CrossRef]
- IEA. World Energy Outlook 2023; International Energy Agency: Paris, France, 2023; ISBN 978-92-64-99157-8. [Google Scholar]
- Pehnt, M.; Oeser, T.; Scholz, R.W. Life Cycle Assessment of Biomass Electricity. Energy 2006, 31, 553–563. [Google Scholar] [CrossRef]
- Schleisner, L. Life Cycle Assessment of a Wind Farm. Renew. Energy 2000, 20, 129–142. [Google Scholar] [CrossRef]
- Godfray, C.; Beddington, J.; Crute, I.; Haddad, L.; Lawrence, D.; Muir, J.; Pretty, J.; Robinson, S.; Thomas, S.; Toulmin, C. Food Security: The Challenge of Feeding 9 Billion People. Science 2010, 327, 812–818. [Google Scholar] [CrossRef]
- Rykała, M.; Grzelak, M.; Borucka, A. Analysis of the Impact of Selected Dynamic Parameters of a Motor Vehicle on CO2 Emissions Using Logistic Regression. Appl. Sci. 2024, 14, 10349. [Google Scholar] [CrossRef]
- Acemoglu, D.; Aghion, P.; Bursztyn, L.; Hemous, D. The Environment and Directed Technical Change. Am. Econ. Rev. 2012, 102, 131–166. [Google Scholar] [CrossRef]
- Jaffe, A.B.; Newell, R.G.; Stavins, R.N. A Tale of Two Market Failures: Technology and Environmental Policy. Ecol. Econ. 2005, 54, 164–174. [Google Scholar] [CrossRef]
- Foster, R.N. Creative Destructional Innovation; Berrett-Koehler Publishers: San Francisco, CA, USA, 2010; ISBN 978-1-60509-677-8. [Google Scholar]
- Grübler, A.; Nakićenović, N.; Victor, D.G. Dynamics of Energy Technologies and Global Change. Energy Policy 1999, 27, 247–280. [Google Scholar] [CrossRef]
- Stern, P.C. Toward a Coherent Theory of Environmentally Significant Behavior. J. Soc. Issues 2000, 56, 407–424. [Google Scholar] [CrossRef]
- Rogers, E.M. Diffusion of Innovations, 5th ed.; Free Press: New York, NY, USA, 2003; ISBN 978-0-7432-5809-9. [Google Scholar]
- Helm, D. Climate Change Policy: Why Has So Little Been Achieved? Oxf. Rev. Econ. Policy 2010, 26, 78–91. [Google Scholar] [CrossRef]
- Vieira, A.S.; Stewart, R.A.; Lamberts, R.; Beal, C.D. Renewable Energy and Energy Conservation Area Policy (REECAP) Framework: A Novel Methodology for Bottom-Up and Top-Down Principles Integration. Energy Strategy Rev. 2020, 32, 100544. [Google Scholar] [CrossRef]
- Smil, V. Energy Transitions: Global and National Perspectives, 2nd ed.; Praeger: Santa Barbara, CA, USA, 2017; ISBN 978-1-4408-5405-4. [Google Scholar]
- IRENA. Renewable Energy Statistics 2023; International Renewable Energy Agency: Abu Dhabi, United Arab Emirates, 2023; ISBN 978-92-9260-537-7. Available online: https://www.irena.org/Publications/2023/Jul/Renewable-energy-statistics-2023 (accessed on 7 April 2025).
- Jacobson, M.Z.; Delucchi, M.A.; Bazouin, G.; Bauer, Z.A.F.; Heavey, C.C.; Fisher, E.; Morris, S.B.; Piekutowski, D.J.; Vencill, T.A.; Yeskoo, T.W. 100% Clean and Renewable Wind, Water, and Sunlight (WWS) All-Sector Energy Roadmaps for the 50 United States. Energy Environ. Sci. 2015, 8, 2093–2117. [Google Scholar] [CrossRef]
- IEA. The Future of Electrification; International Energy Agency: Paris, France, 2024; ISBN 978-92-64-86291-5. [Google Scholar]
- Falkner, R. The Paris Agreement and the New Logic of International Climate Politics. Int. Aff. 2016, 92, 1107–1125. [Google Scholar] [CrossRef]
- EUR-Lex. Reduction of CO2 Emissions from New Passenger Cars and New Light Commercial Vehicles. Available online: https://eur-lex.europa.eu/PL/legal-content/summary/reduction-in-co2-emissions-of-new-passenger-cars-and-of-new-light-commercial-vehicles.html?fromSummary=32 (accessed on 7 April 2025).
- Bandekar, P.A.; Putman, B.; Thoma, G.; Matlock, M. Cradle-to-Grave Life Cycle Assessment of Production and Consumption of Pulses in the United States. J. Environ. Manag. 2022, 302, 114062. [Google Scholar] [CrossRef]
- Gursel, I.V.; Moretti, C.; Hamelin, L.; Jakobsen, L.G.; Steingrimsdottir, M.M.; Junginger, M.; Høibye, L.; Shen, L. Comparative Cradle-to-Grave Life Cycle Assessment of Bio-Based and Petrochemical PET Bottles. Sci. Total Environ. 2021, 793, 148642. [Google Scholar] [CrossRef]
- Buberger, J.; Kersten, A.; Kuder, M.; Eckerle, R.; Weyh, T.; Thiringer, T. Total CO2-Equivalent Life-Cycle Emissions from Commercially Available Passenger Cars. Renew. Sustain. Energy Rev. 2022, 159, 112158. [Google Scholar] [CrossRef]
- Wang, N.; Tang, G. A Review on Environmental Efficiency Evaluation of New Energy Vehicles Using Life Cycle Analysis. Sustainability 2022, 14, 3371. [Google Scholar] [CrossRef]
- Oda, H.; Noguchi, H.; Fuse, M. Review of Life Cycle Assessment for Automobiles: A Meta-Analysis-Based Approach. Renew. Sustain. Energy Rev. 2022, 159, 112214. [Google Scholar] [CrossRef]
- Koroma, M.S.; Costa, D.; Philippot, M.; Cardellini, G.; Hosen, M.S.; Coosemans, T.; Messagie, M. Life Cycle Assessment of Battery Electric Vehicles: Implications of Future Electricity Mix and Different Battery End-of-Life Management. Sci. Total Environ. 2022, 831, 154859. [Google Scholar] [CrossRef]
- Verma, S.; Dwivedi, G.; Verma, P. Life Cycle Assessment of Electric Vehicles in Comparison to Combustion Engine Vehicles: A Review. Mater. Today Proc. 2022, 49, 217–222. [Google Scholar] [CrossRef]
- Li, J.; Li, L.; Yang, R.; Jiao, J. Assessment of the lifecycle carbon emission and energy consumption of lithium-ion power batteries recycling: A systematic review and meta-analysis. J. Energy Storage 2023, 65, 107306. [Google Scholar] [CrossRef]
- Zhao, E.; Walker, P.D.; Surawski, N.C.; Bennett, N.S. Assessing the life cycle cumulative energy demand and greenhouse gas emissions of lithium-ion batteries. J. Energy Storage 2021, 43, 103193. [Google Scholar] [CrossRef]
- Peters, J.F.; Baumann, M.; Zimmermann, B.; Braun, J.; Weil, M. The environmental impact of Li-Ion batteries and the role of key parameters–A review. Renew. Sustain. Energy Rev. 2017, 67, 491–506. [Google Scholar] [CrossRef]
- Bouter, A.; Guichet, X. The greenhouse gas emissions of automotive lithium-ion batteries: A statistical review of life cycle assessment studies. J. Clean. Prod. 2022, 344, 130994. [Google Scholar] [CrossRef]
- Li, P.; Xia, X.; Guo, J. A review of the life cycle carbon footprint of electric vehicle batteries. Sep. Purif. Technol. 2022, 296, 121389. [Google Scholar] [CrossRef]
- Aguilar, P.; Groß, B. Battery electric vehicles and fuel cell electric vehicles, an analysis of alternative powertrains as a mean to decarbonise the transport sector. Sustain. Energy Technol. Assess. 2022, 53, 102624. [Google Scholar]
- Edwards, R.; Larivé, J.-F.; Rickeard, D. Well-to-Wheels Analysis of Future Automotive Fuels and Powertrains in the European Context. SAE Trans. 2004, 113, 1072–1084. [Google Scholar]
- Orsi, F.; Muratori, M.; Rocco, M.; Colombo, E.; Rizzoni, G. A Multi-Dimensional Well-to-Wheels Analysis of Passenger Vehicles in Different Regions: Primary Energy Consumption, CO2 Emissions, and Economic Cost. Appl. Energy 2016, 169, 197–209. [Google Scholar] [CrossRef]
- Zhang, Y.; Zhao, L. Linear regression applications for environmental emissions trend forecasting. Environ. Model. Softw. 2022, 150, 105318. [Google Scholar] [CrossRef]
- Andrych-Zalewska, M.; Chłopek, Z.; Pielecha, J.; Merkisz, J. Investigation of Exhaust Emissions from the Gasoline Engine of a Light Duty Vehicle in the Real Driving Emissions Test. Ekspl. Niezawodn. Maint. Reliab. 2023, 25, 165880. [Google Scholar] [CrossRef]
- Furch, J.; Jelínek, J. Design of a Tribotechnical Diagnostics Model for Determining the Technical Condition of an Internal Combustion Engine during Its Life Cycle. Ekspl. Niezawodn.–Maint. Reliab. 2022, 24, 5. [Google Scholar] [CrossRef]
- Tucki, K. A computer tool for modelling CO2 emissions in driving tests for vehicles with diesel engines. Energies 2021, 14, 266. [Google Scholar] [CrossRef]
- Benga, G.C.; Savu, S.V.; Stefan, I. Analysis of CO2 Emissions for a Supercharged Engine and a Series-Parallel Hybrid System. In Proceedings of the International Conference on Mechanical Engineering (ICOME 2022); Springer Nature: Berlin/Heidelberg, Germany, 2023; Volume 15, p. 331. [Google Scholar]
- Scherelis, G.; Ludewig, C. Volkswagen Group, Media Information NO. 128/2019 Electric Vehicles with Lowest CO2 Emissions; Volkswagen Group: Wolfsburt, Germany, 2019. [Google Scholar]
- Green NCAP. Life Cycle Assessment Results & Fact Sheets. 2024. Available online: https://www.greenncap.com/european-lca-results/ (accessed on 4 June 2025).
- Joshi, A. Review of vehicle engine efficiency and emissions. SAE Int. J. Adv. Curr. Pract. Mobil. 2022, 4, 1704–1733. [Google Scholar] [CrossRef]
- Chandrashekar, C.; Rawat, R.S.; Chatterjee, P.; Pawar, D.S. Evaluating the real-world emissions of diesel passenger Car in Indian heterogeneous traffic. Environ. Monit. Assess. 2023, 195, 1248. [Google Scholar] [CrossRef]
- Gentil, E.C.; Damgaard, A.; Hauschild, M.; Finnveden, G.; Eriksson, O.; Thorneloe, S.; Kaplan, P.O.; Barlaz, M.; Muller, O.; Matsui, Y.; et al. Models for waste life cycle assessment: Review of technical assumptions. Waste Manag. 2010, 30, 2636–2648. [Google Scholar] [CrossRef]
- Baars, J.; Domenech, T.; Bleischwitz, R.; Melin, H.E.; Heidrich, O. Circular economy strategies for electric vehicle batteries reduce reliance on raw materials. Nat. Sustain. 2021, 4, 71–79. [Google Scholar] [CrossRef]
- Kostopoulos, E.D.; Spyropoulos, G.C.; Kaldellis, J.K. Real-world study for the optimal charging of electric vehicles. Energy Rep. 2020, 6, 418–426. [Google Scholar] [CrossRef]
- Cronshaw, M. Energy in Perspective; Springer: Berlin/Heidelberg, Germany, 2021. [Google Scholar] [CrossRef]
- Papadimitriou, D.; Duysinx, P. Future Move: A Review of the Main Trends in the Automotive Sector at Horizon 2030 in the Great Region; University of Liège: Liège, Belgium, 2022. [Google Scholar]
- Kawecka-Wyrzykowska, E. Financing Energy Transition in Poland: Possible Contribution of EU Funds. Eur. Integr. Stud. 2022, 16, 65–77. [Google Scholar] [CrossRef]
- Malik, F.H.; Ayadi, W.; Hussain, G.A.; Haider, Z.M.; Alkhatib, F.; Lehtonen, M. Evaluating Carbon Emissions: A Lifecycle Comparison Between Electric and Conventional Vehicles. World Electr. Veh. J. 2025, 16, 287. [Google Scholar] [CrossRef]
- Prystrom, J. Eco-innovation as a factor of competitiveness on the example of Volvo Car Corporation. Mark. Rynek 2023, 4, 35–46. [Google Scholar] [CrossRef]
- Razmjoo, A.; Kaigutha, L.G.; Rad, M.V.; Marzband, M.; Davarpanah, A.; Denai, M.J.R.E. A Technical analysis investigating energy sustainability utilizing reliable renewable energy sources to reduce CO2 emissions in a high potential area. Renew. Energy 2021, 164, 46–57. [Google Scholar] [CrossRef]
- Savage, J.; Esposito, G. Vehicle Life Cycle GHG Emissions Study to Show the Role of Renewable Fuels in Meeting Net Zero. Zemo Partnership. 2024. Available online: https://www.zemo.org.uk/assets/reports/Vehicle%20life%20cycle%20GHG%20emissions%20study%202024.pdf (accessed on 7 April 2025).
- Manufacturer, X. Sales Summary of Brand X Vehicles, 2020–2024 nationwide data, Poland, 2020–2024, available in 2025 (internal data, unpublished).
- Bieker, G. A Global Comparison of the Life-Cycle Greenhouse Gas Emissions of Combustion Engine and Electric Passenger Cars; ICCT: Berlin, Germany, 2021; Available online: https://theicct.org/wp-content/uploads/2021/12/zevtc-decarbonizing-by-2050-Jul2021%E2%80%AF.pdf (accessed on 7 April 2025).
- Searle, S.; Bieker, G.; Baldino, C. Decarbonizing Road Transport by 2050 Zero-Emission Pathways for Passenger Vehicles; International Council on Clean Transportation: Washington, DC, USA, 2021; Available online: https://theicct.org/publication/decarbonizing-road-transport-by-2050-zero-emission-pathways-for-passenger-vehicles/ (accessed on 5 May 2025).
- International Council on Clean Transportation. A Global Comparison of the Life-Cycle Greenhouse Gas Emissions of Combustion Engine and Electric Passenger Cars; International Council on Clean Transportation: Washington, DC, USA, 2022; Available online: https://theicct.org/publication/a-global-comparison-of-the-life-cycle-greenhouse-gas-emissions-of-combustion-engine-and-electric-passenger-cars/ (accessed on 7 April 2025).
- Adamiak, B.; Andrych-Zalewska, M.; Merkisz, J.; Chłopek, Z. The uniqueness of pollutant emission and fuel consumption test results for road vehicles tested on a chassis dynamometer. Eksploat. Niezawodn. Maint. Reliab. 2025, 27, 195747. [Google Scholar] [CrossRef]
- Stan, C. Flora and fauna have inversed carbon dioxide cycles. In Energy Versus Carbon Dioxide; Springer: Berlin/Heidelberg, Germany, 2022. [Google Scholar] [CrossRef]
- Sinn, H.W. The Green Paradox: A Supply-Side Approach to Global Warming; MIT Press: Cambridge, MA, USA, 2012. [Google Scholar]
- Maser, C.; Pollio, C.A. Resolving Environmental Conflict Towards Sustainable Community Development; CRC Press: Boca Raton, FL, USA, 1995. [Google Scholar]
- EUR-Lex. Regulation (EU) 2019/631: CO2 Emission Performance Standards for New Passenger Cars and for New Light Commercial Vehicles; European Commission: Brussels, Belgium, 2023; Available online: https://eur-lex.europa.eu/legal-content/EN/TXT/?uri=CELEX%3A32019R0631 (accessed on 7 April 2025).
- Umweltbundesamt. CO2 Emissions from Transport—Methodological Framework and Results from a Life Cycle Perspective; German Federal Environment Agency: Dessau-Roßlau, Germany, 2023; Available online: https://www.umweltbundesamt.de/en/publikationen/co2-emissions-from-transport (accessed on 7 April 2025).
- Turek, M.; Kalupová, B.; Cempírek, V.; Tůmová, K.; Abramović, B. Electromobility and the Environment in the Czech Republic. LOGI Sci. J. Transp. Logist. 2024, 15, 201–212. [Google Scholar] [CrossRef]
- Christoforidis, C.; Christakis, I.; Kotzasavva, F.; Fousekis, G.; Rimpas, D. Electric Vehicles Charging Stations and Their Influence on the Electricity Utility Grid. Arch. Motoryz. 2025, 107, 102–126. [Google Scholar] [CrossRef]
- Bhat, M.Y.; Sofi, A.A.; Ganie, J.A. Green Wheels in Motion: Electric Vehicle Sales in the Path to Decarbonization. Transp. Res. D Transp. Environ. 2025, 142, 104704. [Google Scholar] [CrossRef]
- Paisarnvirosrak, N.; Rungrueang, P. Firefly Algorithm with Tabu Search to Solve the Vehicle Routing Problem with Minimized Fuel Emissions: Case Study of Canned Fruits Transport. LOGI Sci. J. Transp. Logist. 2023, 14, 263–274. [Google Scholar] [CrossRef]
- Tilly, N.; Yigitcanlar, T.; Degirmenci, K.; Paz, A. How Sustainable Is Electric Vehicle Adoption? Insights from a PRISMA Review. Sustain. Cities Soc. 2024, 117, 105950. [Google Scholar] [CrossRef]
- Pečman, J.; Šarkan, B.; Ližbetinová, L.; Ľupták, V.; Loman, M.; Bartuška, L. Impact of Acceleration Style on Vehicle Emissions and Perspectives for Improvement through Transportation Engineering Solutions. Arch. Motoryz. 2024, 104, 48–62. [Google Scholar] [CrossRef]
- Hiller, D. Savings of Material Resources and Carbon Emissions When Converting Fossil Fuel Car to Electric: A Case Study for Sweden. Master’s Thesis, University of Stuttgart, Institute of Automotive Engineering, Stuttgart, Germany, 2022. Available online: https://urn.kb.se/resolve?urn=urn:nbn:se:kth:diva-311253 (accessed on 7 April 2025).
Disclaimer/Publisher’s Note: The statements, opinions and data contained in all publications are solely those of the individual author(s) and contributor(s) and not of MDPI and/or the editor(s). MDPI and/or the editor(s) disclaim responsibility for any injury to people or property resulting from any ideas, methods, instructions or products referred to in the content. |
© 2025 by the authors. Licensee MDPI, Basel, Switzerland. This article is an open access article distributed under the terms and conditions of the Creative Commons Attribution (CC BY) license (https://creativecommons.org/licenses/by/4.0/).