Article

Heat Transfer Enhancement in Turbine Blade Internal Cooling Channels with Hybrid Pin-Fins and Micro V-Ribs Turbulators

1
School of Mechanical Engineering, Shanghai Jiao Tong University, Shanghai 200240, China
2
China United Heavy Duty Gas Turbine Technology Co., Ltd., Shanghai 201306, China
*
Author to whom correspondence should be addressed.
Energies 2025, 18(13), 3296; https://doi.org/10.3390/en18133296
Submission received: 6 May 2025 / Revised: 12 June 2025 / Accepted: 16 June 2025 / Published: 24 June 2025
(This article belongs to the Special Issue Heat Transfer Analysis: Recent Challenges and Applications)

Abstract

To improve the convective heat transfer in internal cooling channels of heavy-duty gas turbine blades, this study experimentally and numerically investigates the thermal performance of rectangular channels with hybrid pin-fins and micro V-ribs turbulators. The transient thermochromic liquid crystal (TLC) technique and ANSYS 2019 R3 (ICEM CFD 2019 R3, Fluent 2019 R3, CFD-Post 2019 R3) were employed under Reynolds numbers ranging from 10,000 to 50,000, with the numerical model rigorously validated against experimental data (the maximum RMSE is 2.5%). It is found that hybrid pin-fins and continuous V-ribs configuration exhibits the maximum heat transfer enhancement of 27.6%, with an average friction factor increase of 13.3% and 21.9% improvement in thermal performance factor (TPF) compared to the baseline pin-fin channel. In addition, compared to the baseline pin-fin channel, hybrid pin-fins and broken V-ribs configuration exhibits average heat transfer enhancement (Nu/Nu0) of 24.4%, an average friction factor increase of 7.2% and 22.5% improvement across the investigated Reynolds number range (10,000~50,000) based on computational results. The synergistic effects of hybrid pin-fin and micro V-rib structures demonstrate superior coolant flow control, offering a promising solution for next-generation turbine blade cooling designs. This work provides actionable insights for high-efficiency gas turbine thermal management.

1. Introduction

Generally, a gas turbine consists of five parts, i.e., air intake, compressor, combustor, turbine, and exhaust system, of which the first-stage turbine vanes and blades are the main hot section components. The operation of gas turbines can be described by the non-ideal Brayton cycle [1]. It indicates that the gas turbine performance relies heavily on the turbine inlet temperature. Increasing the turbine inlet temperature effectively enhances power output, but simultaneously creates more severe operational conditions for turbine blades, developing advanced cooling technologies both necessary and sustainable [2], especially for the advanced G/H/J-series gas turbines. The turbine inlet temperature reached 1900 K, such as in GE’s 9HA series [3]. Current primary cooling methods include film cooling, impingement cooling, and internal convective cooling, with the latter remaining a research focus as a fundamental cooling approach [4]. Turbine blades typically incorporate near-rectangular internal cooling channels, where turbulators like ribs and pin-fins enhance heat transfer by inducing secondary flows, strengthening impingement effects, and promoting turbulent mixing [5]. A review of the gas turbine blade’s cooling technology shows the frequent use of radial channels, with the heat transfer intensified by ribs, and in the case of the rectangular channel geometry, its width W and height H are important [6].
Casarsa et al. [7] employed PIV to study fundamental flow structures in ribbed channels. The results demonstrate that boundary layer separation at rib crests generates separation vortices, while reattachment creates large recirculation zones between ribs. Han et al. [8] compared nine rib types in rectangular channels at Re = 15,000~90,000, finding that V-shaped ribs outperformed parallel, crossed, and straight ribs. Tanda [9] employed liquid crystal thermography to the study of heat transfer from a rectangular channel in which the ribs were deployed transverse to the main direction of flow or were V-shaped with an angle of 45 or 60 deg relative to flow direction. The results demonstrate that features of the inter-rib distributions of the heat transfer coefficient are strongly related to rib shape and geometry, due to flow reattachment, double-cell counter-rotating vortices, and the high turbulence levels produced by rib tip–endwall interactions. Khalatov et al. [10] conducted numerical simulations to investigate the effects of turbulator ribs with different configurations and coverage ratios on heat transfer characteristics and surface friction factors in the internal cooling passage of a blade-leading edge region, where the channel cross-section approximates a rounded equilateral triangle. The results show that continuous ribs provide superior heat transfer while discontinuous ribs reduce pressure loss. Wang et al. [11] employed liquid crystal thermography to systematically investigate turbulent heat transfer and flow resistance characteristics in a square duct with continuous and truncated ribs arranged on one wall. The results further corroborate that continuous ribs provide significantly enhanced heat transfer performance compared to truncated ribs, while also demonstrating fundamental differences between the horseshoe vortex systems induced by truncated ribs and the modified flow structures generated by continuous ribs. The aforementioned studies demonstrate that V-shaped ribs enhance channel heat transfer performance by generating high-turbulence intensity through interactions with the endwalls. These investigations are typically conducted using either numerical simulations or liquid crystal thermometry techniques.
Montelpare et al. [12] compared pin-fin shapes, showing the following: at low Re, circular pins outperform square ones; at high Re, square pins excel; triangular pins surpass circular ones, with diamond pins being intermediate. The findings further substantiate that the horseshoe vortex effect is the underlying mechanism responsible for the 30–50% enhancement in local heat transfer coefficients at pin-fin base junctions compared to upstream regions. Zhu et al. [13] demonstrated that conical pins enhance heat transfer more than cylindrical pins despite higher pressure losses at larger diameters. Liu et al. [14] numerically proved that cooling performance depends on vortex generator parameters. Bai et al. [15] showed that upstream 90°, 60°, V-ribs, and W-ribs affect pin-fin channel heat transfer distribution, with W-ribs delivering the highest thermal efficiency. Chang et al. [16] quantified rib-pin synergies, while Darvish and Afzal [17,18] conducted a systematic investigation into the parameter optimization problem of ribs, and these findings were subsequently extended to design other various new hybrid V-rib and pin-fin configurations [19]. Ma et al. [20] introduced the turbulators of dimple, protrusion and pin-fin in a sandwich panel filled with pyramidal truss structures. The results show that this configuration creates a greater pressure drop while enhancing the heat transfer performance of the sandwich panel.
According to the above literature review, a volume of work has been written on the heat transfer and flow properties of different kinds of such structures for gas turbine blades. However, on the one hand, no existing research has explored the combined use of staggered pin-fins and micro V-ribs to enhance heat transfer performance in turbine internal cooling channels. On the other hand, the above studies are basically carried out under laboratory conditions, which are quite different from the actual operating conditions of gas turbine blades. For advanced turbine blades in heavy-duty gas turbines, practical operational data shows a 3.4% reduction in cooling air consumption alongside a 9.3% increase in turbine inlet temperature, demanding at least 10% enhancement in heat transfer performance for first-stage blades. The manufacturing process presents significant challenges due to varying wall thicknesses and non-uniform thickness transitions across blade sections, which frequently induce casting defects including abnormal grain structures and metallurgical imperfections in alloy materials. Compounding these difficulties, the complex internal cooling structures limit production to small batches despite the requirement of over 450 blades per turbine, creating substantial scalability challenges. These critical constraints necessitate the development of optimized pin-fin and V-rib turbulator configurations that must simultaneously achieve the following: (1) structurally simple designs with significant heat transfer enhancement potential; (2) manufacturability for complex internal geometries; and (3) cost-effectiveness for viable mass production—requirements that can only be met through comprehensive synthesis and the refinement of existing research findings. Through comprehensive impingement cooling experiments, the screening process for both pin-fin arrays and micro V-rib configurations have been completed. Building upon these findings, we have developed innovative combinations of these cooling structures, with a particular focus on characterizing their integrated cooling performance.

2. Research Objects and Methodology

2.1. Research Objects

Figure 1 illustrates the experimental models of three investigated configurations. Case 1 represents the baseline pin-fins array, Case 2 represents the hybrid pin-fins with continuous V-ribs, Case 3 represents the hybrid pin-fins with broken V-ribs. All test sections were fabricated via additive manufacturing using acrylic material (due to its extensive application results in transient liquid crystal (TLC) experiments [21]), with identical overall dimensions of 105 mm (streamwise length) × 102 mm (spanwise width) × 36 mm (height). The dimensional specifications were determined by two key factors: (1) experimental constraints; and (2) the blade scaling coefficient. The geometric parameters of each turbulator configuration are detailed in Table 1.

2.2. Research Methodology

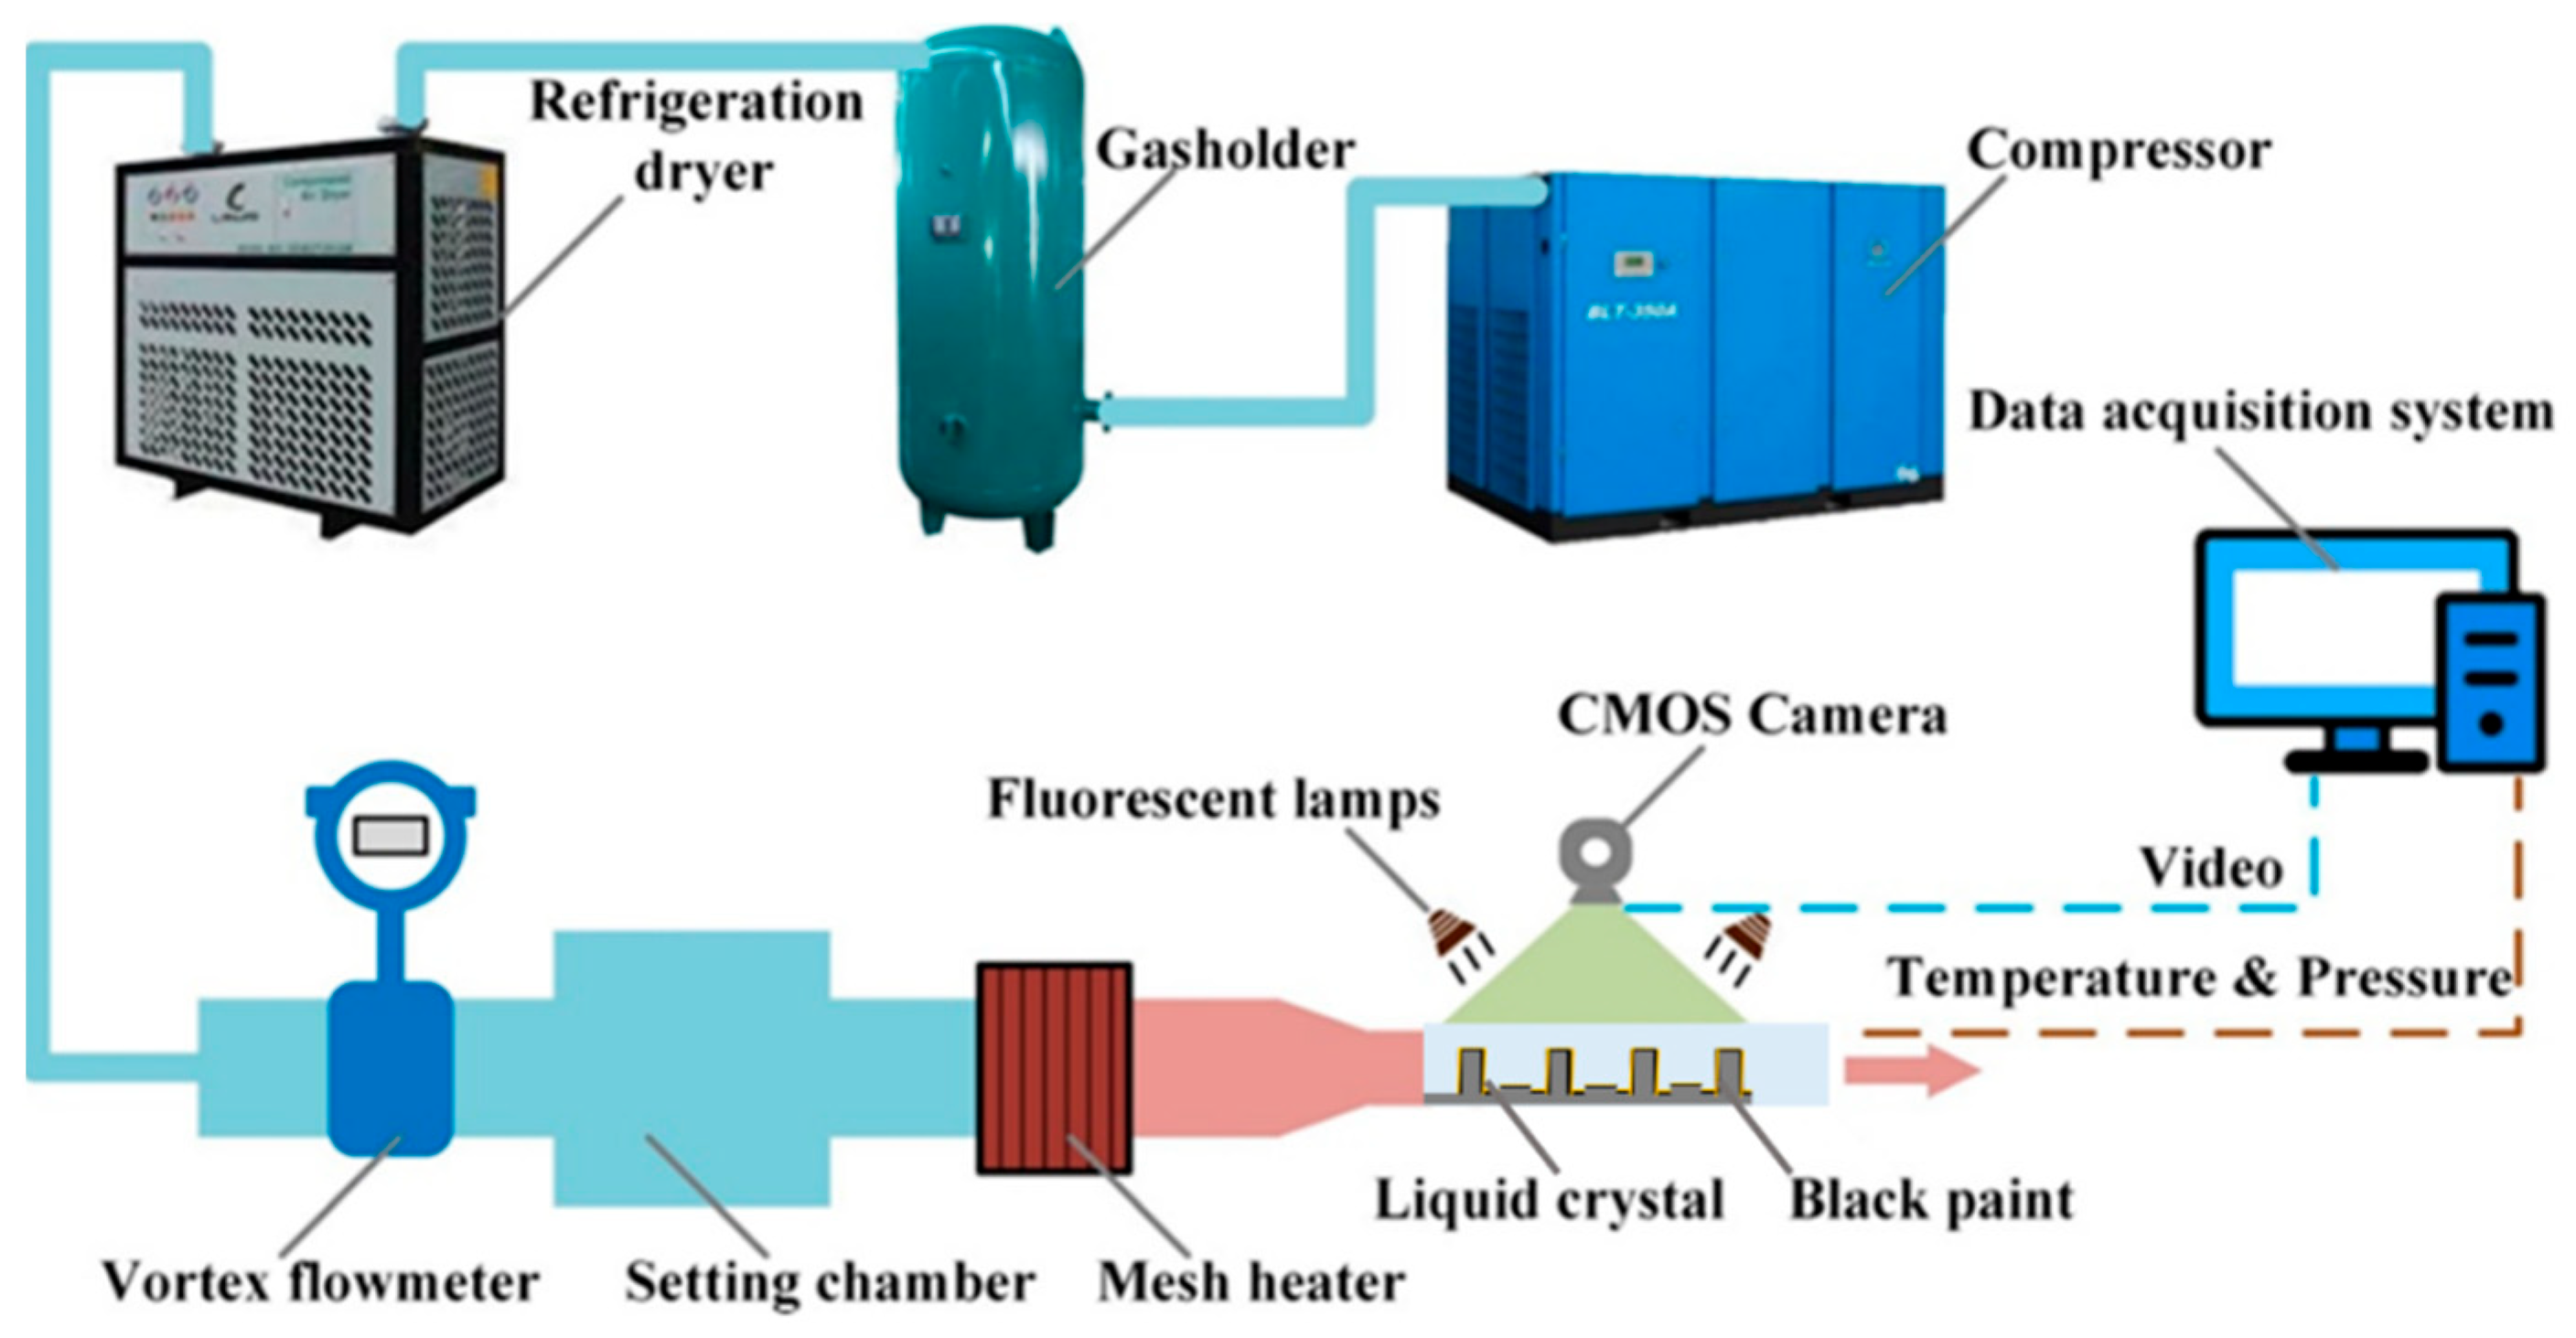
2.2.1. Experiment Method

1.
Transient Liquid Crystal Thermography
Transient liquid crystal thermography is a well-established experimental technique for heat transfer mechanism studies [22] based on the theoretical framework of unsteady heat conduction in semi-infinite plates under third-type boundary conditions. For practical implementation where ideal semi-infinite conditions are unattainable, the test specimen thickness δ must satisfy the following temporal constraint relative to experimental duration t:
δ > 4 α × t
where α represents the thermal diffusivity of the test material. The acrylic material thermal diffusivity employed in this study exhibits α ≈ 1.091 × 10⁻⁷ m2/s, with a standardized thickness of 20 mm. The surface temperature distribution is governed by [23]:
T w T i T r , i T r , i 1 = i = 1 N 1 exp ( h 2 t t i k w ρ w c w ) e r f c ( h t t i k w ρ w c w )
where T w (K) is obtained through calibration, T i (K) is measured via thermocouples, T r (K) is derived by interpolating between the section’s inlet and outlet temperatures, k w , ρ w , and c w represent the thermal conductivity (W/(m·K)), density (kg/m3), and specific heat capacity (J/(kg·K)) of the plate, respectively, and h (W/(m2·K)) obtained through iterative solving, combines with λ (W/(m·K)) and D h (m) to calculate the local Nusselt number. Area-averaging yields the mean Nusselt number as expressed in Equation (3):
N u ¯ ¯ = h ¯ ¯ D h λ
As illustrated in Figure 2, the experimental system utilizes mechanically generated compressed air that undergoes pressure stabilization and heating before passing through the test section, where temperature variations are recorded by a CMOS camera (UI-3140CP-C-HQ (IDS Imaging Development Systems GmbH, Obersulm, Baden-Württemberg, Germany), 20 fps, 1280 × 1024 pixels) mounted above the channel. The narrow-band transient liquid crystal (TLC, SPN-100/R35C1W (Hallcrest LLC, Glenview, IL, USA), 35–36 °C activation range, ±0.3 °C accuracy) coating enables quantitative heat transfer measurements. Prior to testing, the system undergoes rigorous preparation including channel sealing, ambient light/noise isolation, camera optics calibration (aperture/focus adjustment), variable-frequency blower power setting, and activation of the wire-mesh DC heater. During operation, synchronized data acquisition captures TLC color changes at 20 fps under controlled flow conditions achieved through coordinated heater/blower regulation.
The flow resistance characteristics of cooling channels were evaluated using the friction factor f , defined as:
f = 2 D h Δ p ρ u i n 2 L c
where Δ P is the pressure drop across the test section (Pa), u i n represents the inlet flow velocity (m/s), L c denotes the test section length (m), and ρ represents density (kg/m3).
To assess the overall cooling performance under equal pumping power conditions, the thermal performance factor (TPF) was employed:
TPF = Nu / Nu 0 ( f / f 0 ) 1 / 3
where N u 0 refers to the Nusselt number for smooth channels calculated using the Dittus-Boelter correlation:
Nu 0 = 0.023 Re 0.8 Pr 0.4
while Re and Pr are the Reynolds and Prandtl number, respectively. f 0 represents the smooth channel friction factor determined by the Blasius correlation:
f 0 = 0.316 Re 0.25
2.
Uncertainty Analysis
The uncertainty of the transient liquid crystal experiments was systematically evaluated through root-mean-square analysis [24], with primary error sources including temperature (±0.5 °C from thermocouples and ±0.3 °C from TLC, yielding <±1.0% dimensionless temperature uncertainty), flow rate (±2.0% F.S. velocity error producing ≤2.1% Reynolds number uncertainty), temporal resolution (3.3% camera acquisition time error), and material properties (5.4% test plate uncertainty), resulting in a composite heat transfer coefficient (h) measurement uncertainty of ≤9.7%.

2.2.2. Numerical Method

1.
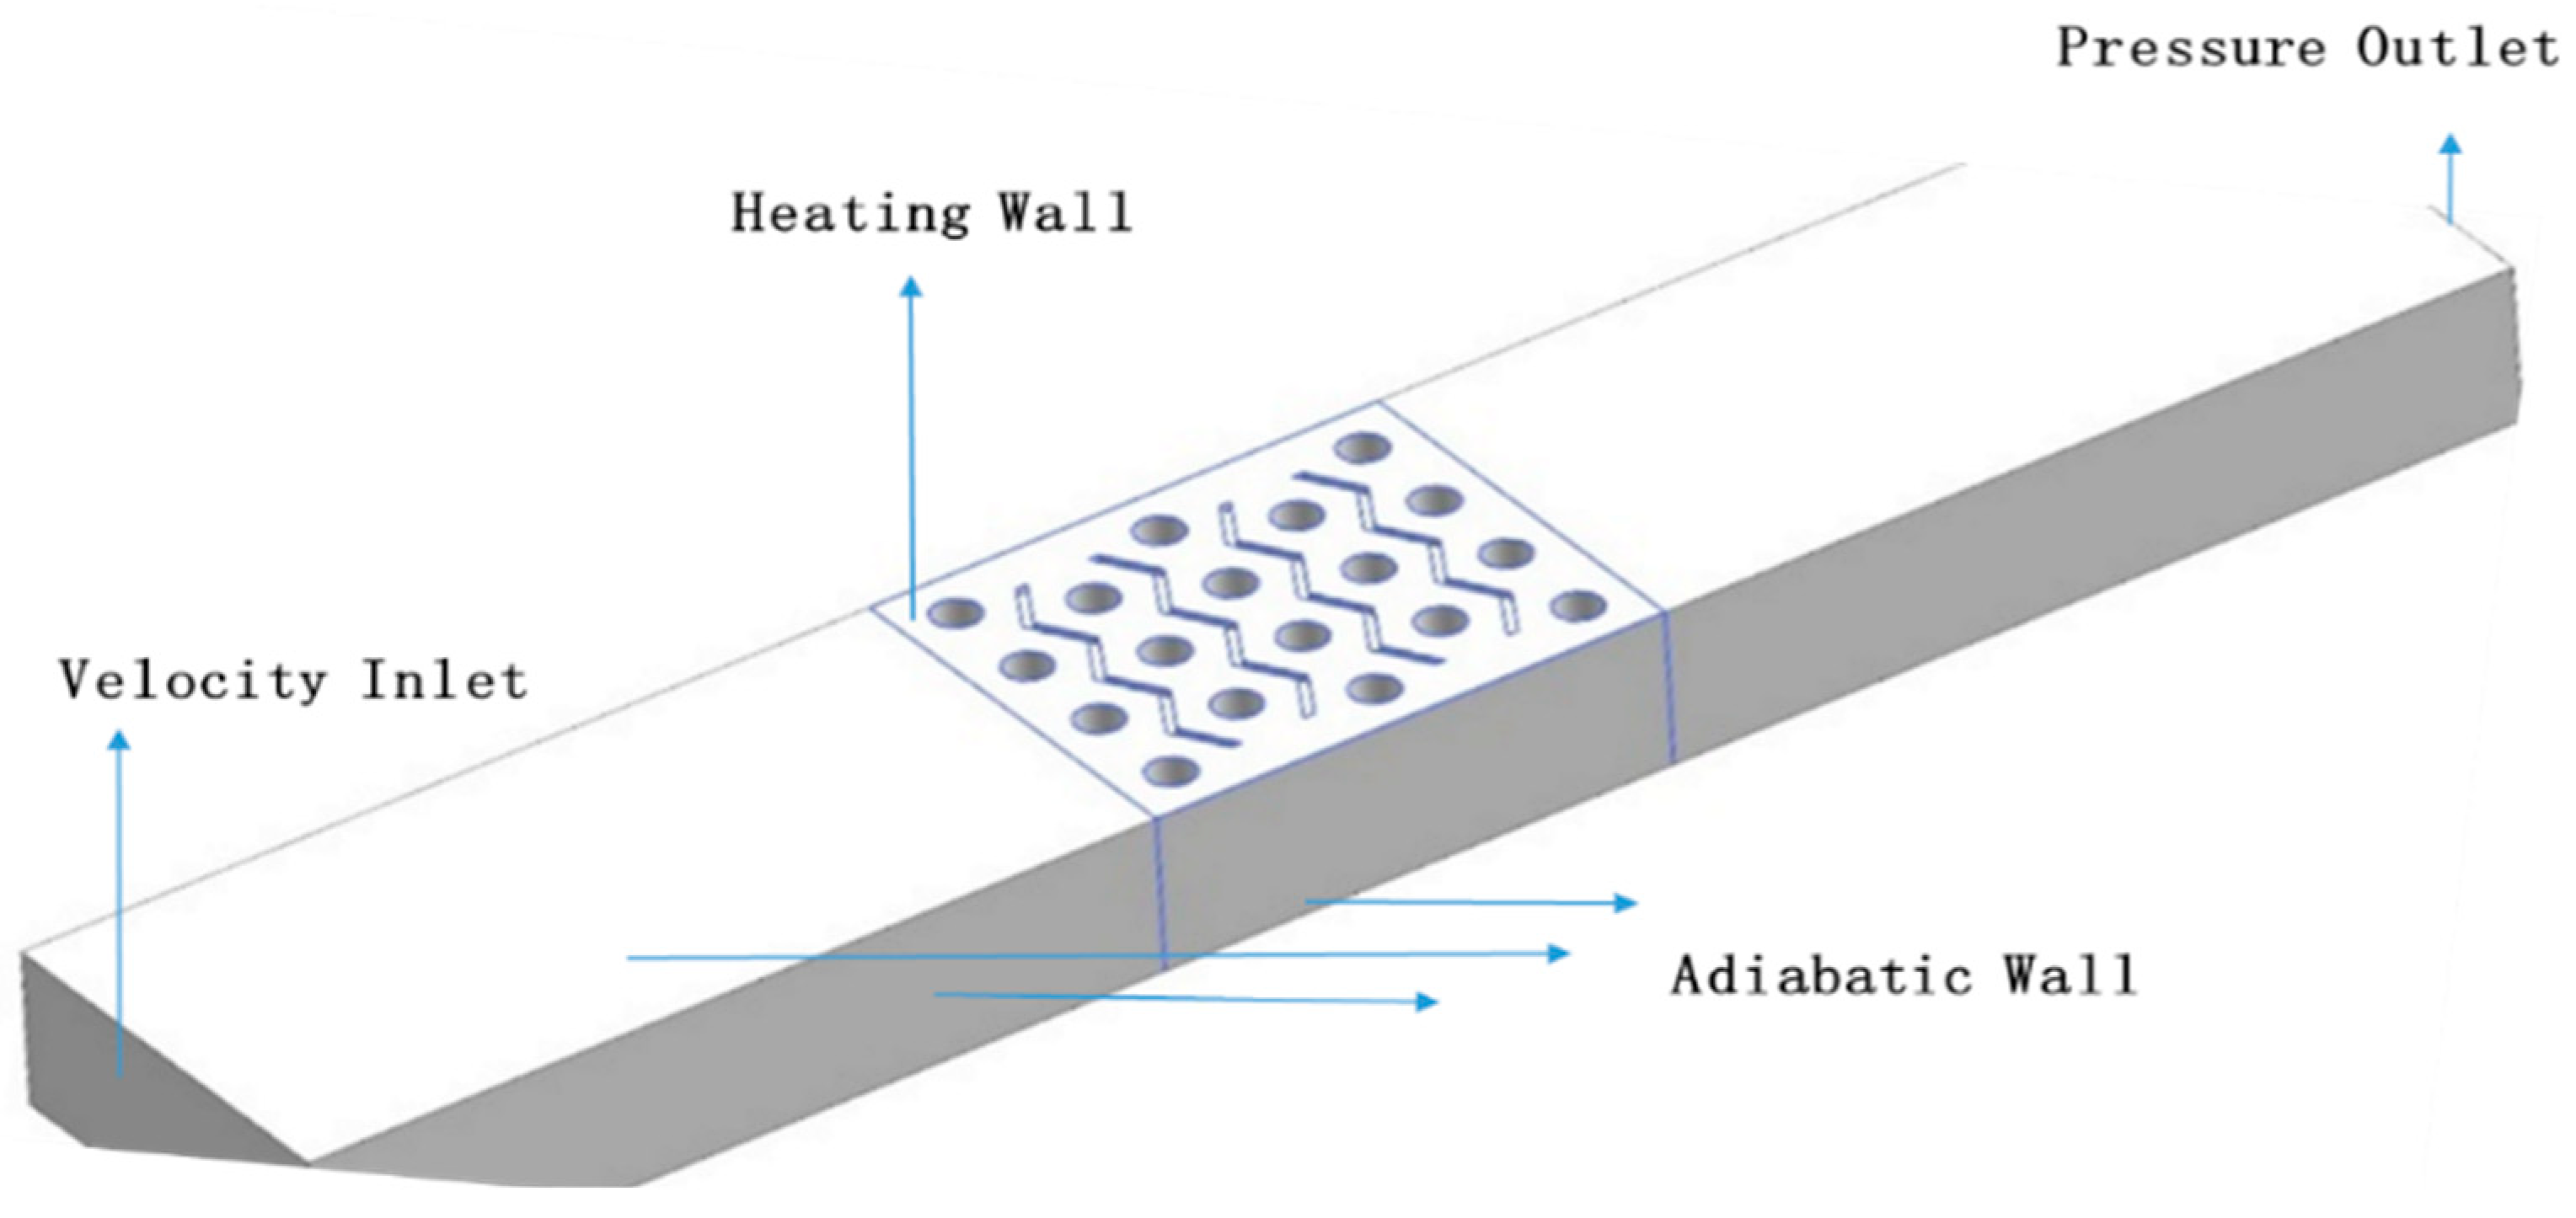
Numerical Model and Boundary Conditions
Numerical simulations were performed using ANSYS Fluent 2019 R3 for all investigated configurations. The flow was treated as incompressible given the substantially subsonic velocities (Mach number < 0.3) throughout the computational domain. The pressure-based solver with the SIMPLE algorithm was employed, and second-order upwind schemes for momentum, energy, turbulent kinetic energy, and its dissipation rate equations. As for the fully developed flow at the inlet and prevention of reverse flow at outlet boundaries, the computational domain incorporated an extended approach section measuring 18.75 hydraulic diameters upstream of the test region. Figure 3 illustrates the complete computational domain with specified boundary conditions.
2.
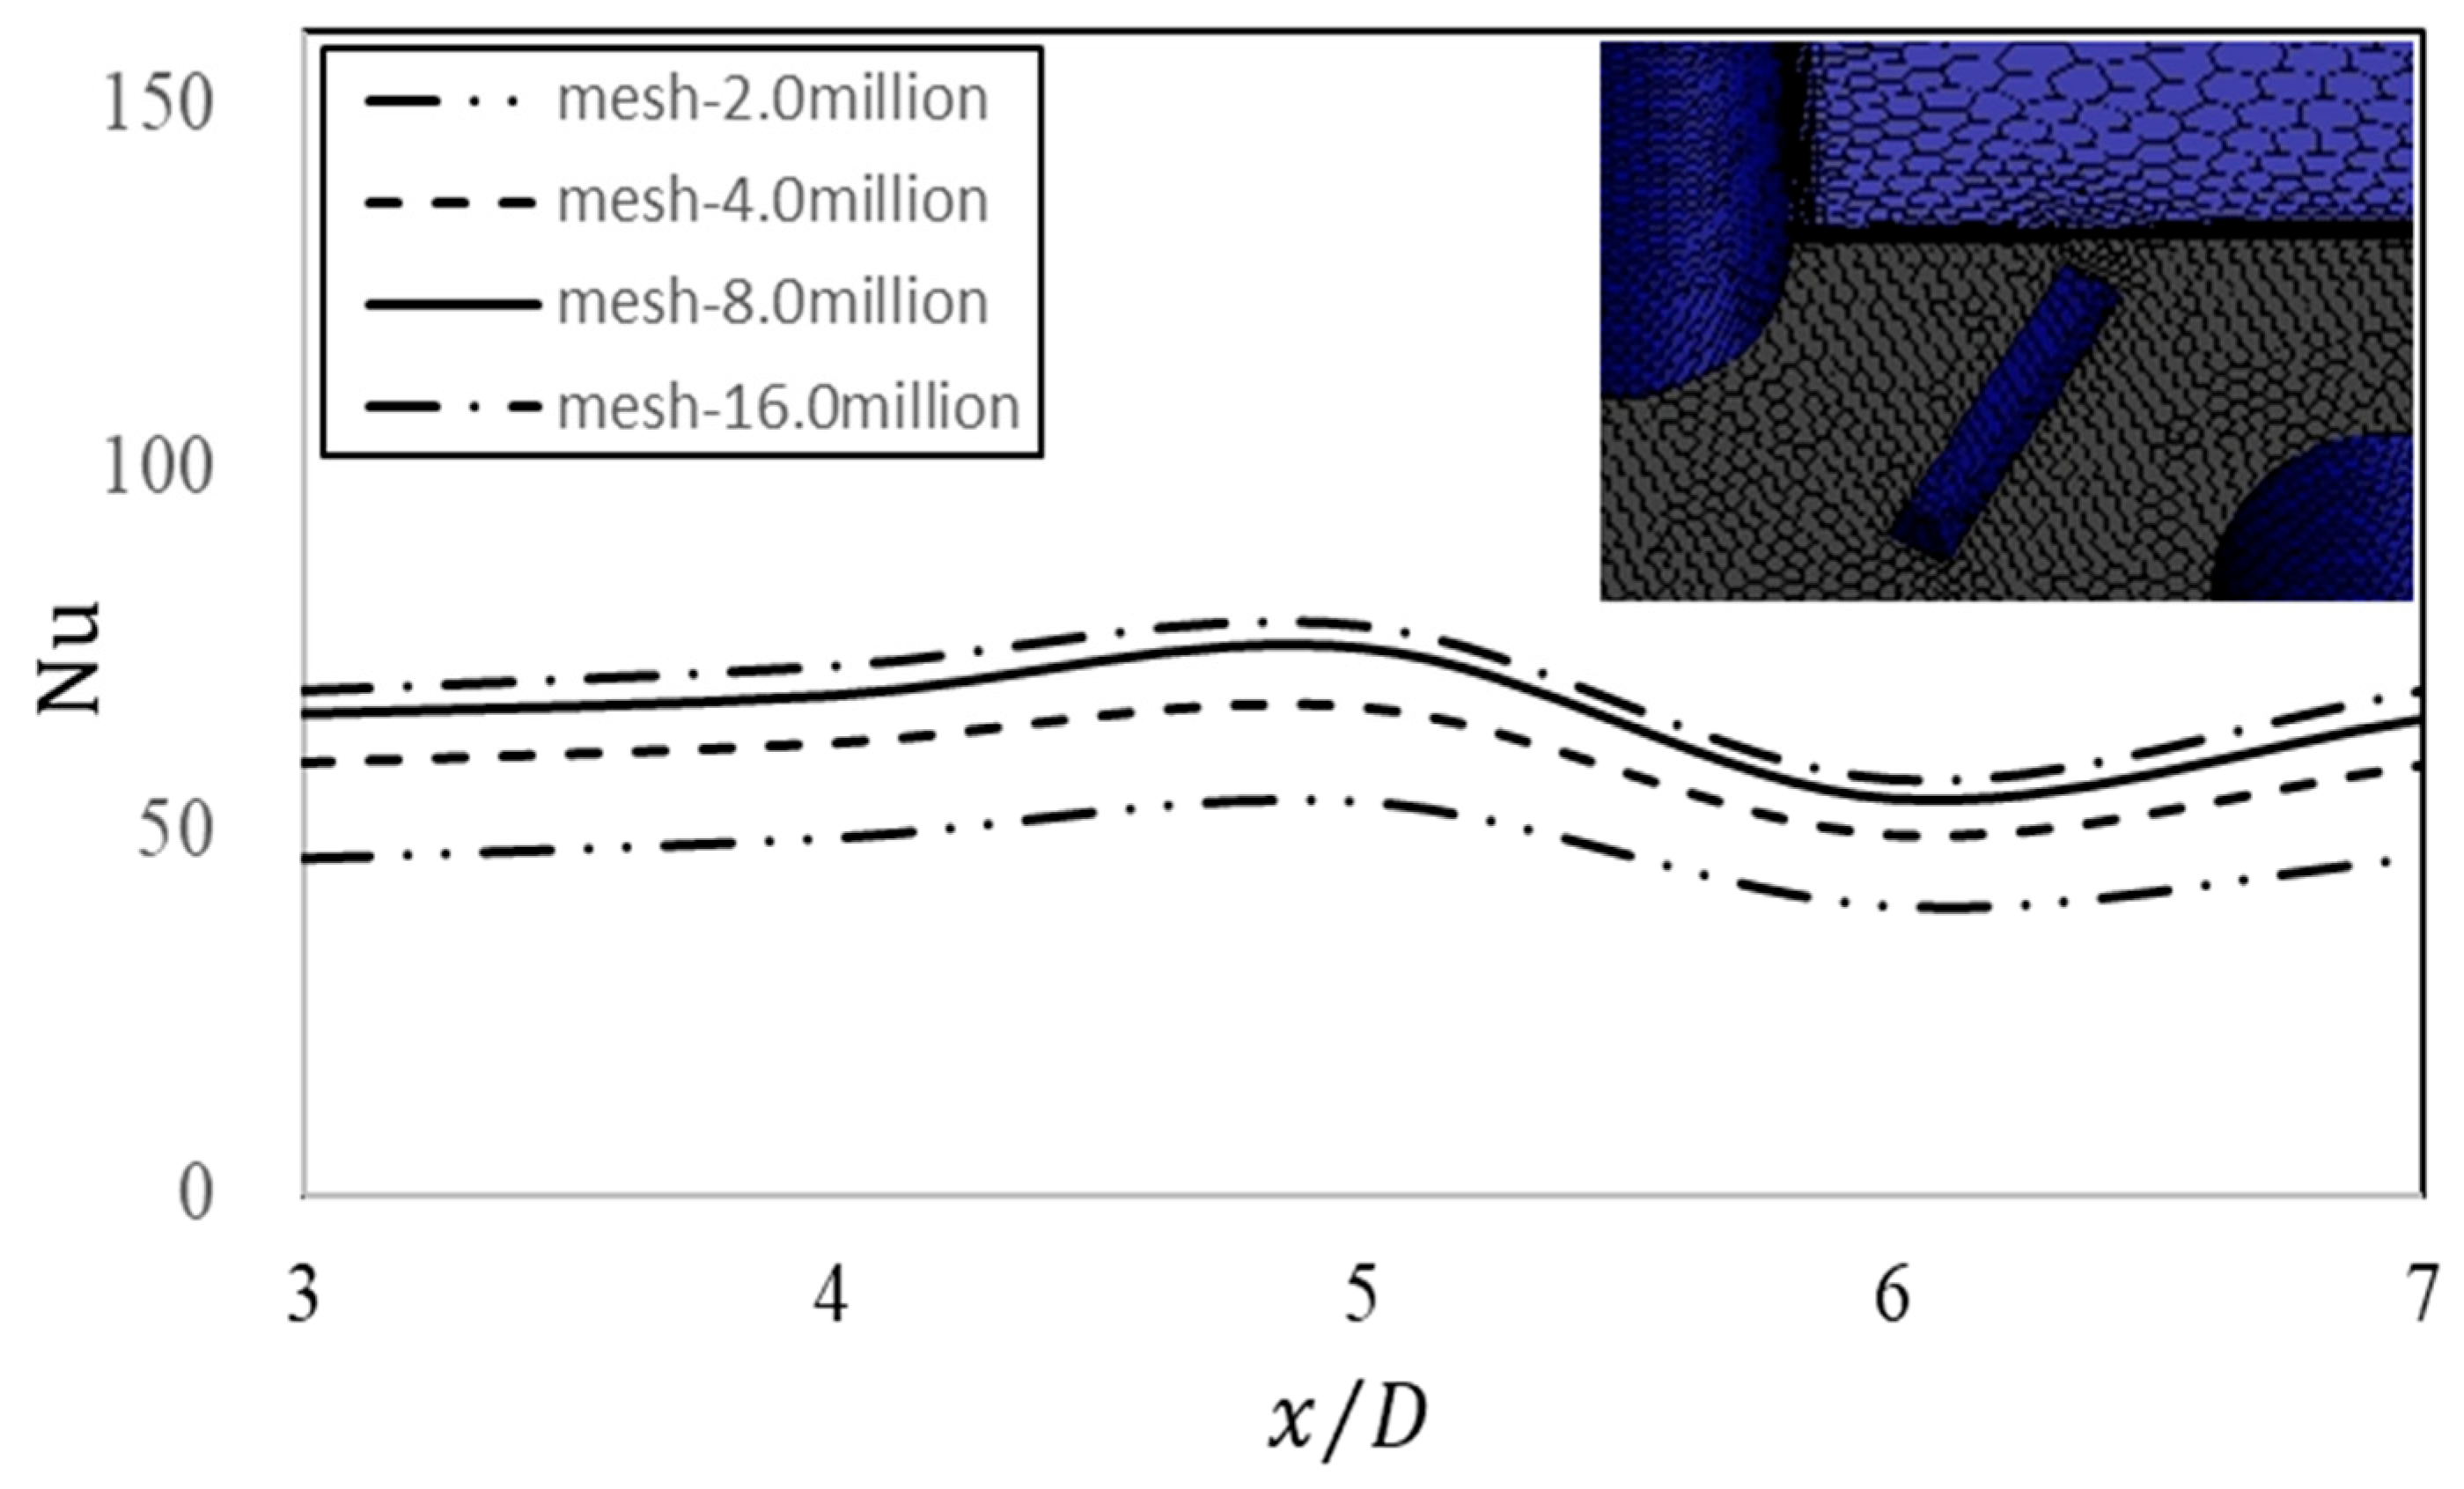
Grid Independence Verification
A systematic grid convergence study was conducted using the grid convergence index (GCI) method [25] to determine the optimal mesh density. Four progressively refined meshes were generated for Case 2, containing approximately 2 million, 4 million, 8 million, and 16 million cells, respectively. Case 2 was selected for grid independence verification based on two critical considerations: first, it integrates both the pin-fin turbulator configuration from Case 1 and the micro V-rib morphology of Case 3; second, it exhibits the most pronounced computational deviations under varying grid resolutions. A simulation was performed using various turbulence models across different Reynolds number conditions, with the largest deviations observed under low Reynolds number conditions. Considering the presence of multiple tables in this paper and to avoid the redundant presentation of identical operational conditions across different related tables, only the results for this specific Reynolds number condition in the tabulated data were used selectively. So, the evaluation focused on the spanwise Nusselt number distribution at a cross-Section 1 mm upstream of the third-row pin-fin under Re = 10,000 conditions, as illustrated in Figure 4. Comparative analysis of the solutions demonstrated that the 8-million-cell mesh achieved <1.5% variation in Nu values compared to the finest (16M-cell) mesh. Based on this trade-off between solution accuracy (relative error < 2%) and computational economy, the 8-million-cell mesh was selected for all subsequent simulations. This resolution satisfies ASME V&V 20-2009 standards for industrial CFD applications [26], where the GCI between medium-fine grids should be ≤3%. The formula for obtaining the Nusselt number (Nu) of a heat bottom endwall through numerical simulation is as follows:
N u = q w a l l × D h λ × ( T w a l l T r e f )
q w a l l represents the heat flux at the heat exchange wall (W/m2), T w a l l is the average temperature of the heat exchange wall (K), T r e f is the reference temperature of the computational domain, derived by interpolating the inlet and outlet temperatures (K), D h is the hydraulic diameter (m), and λ is the thermal conductivity of the fluid (W/m·K).
3.
Turbulence Model Validation
To identify the most suitable turbulence model for channel simulations, a comprehensive evaluation was conducted comparing four widely used models: Low-Re AKN k-ε model, SST k-ω model, RNG k-ε model, Standard k-ω model. The validation focused on the average Nusselt number at the bottom wall of Case 2 under Re = 10,000 conditions, with comparative results detailed in Table 2. Comparative analysis of the solutions demonstrated that the SST k-ω model demonstrated closest agreement with the experimental data (2.44% deviation).
4.
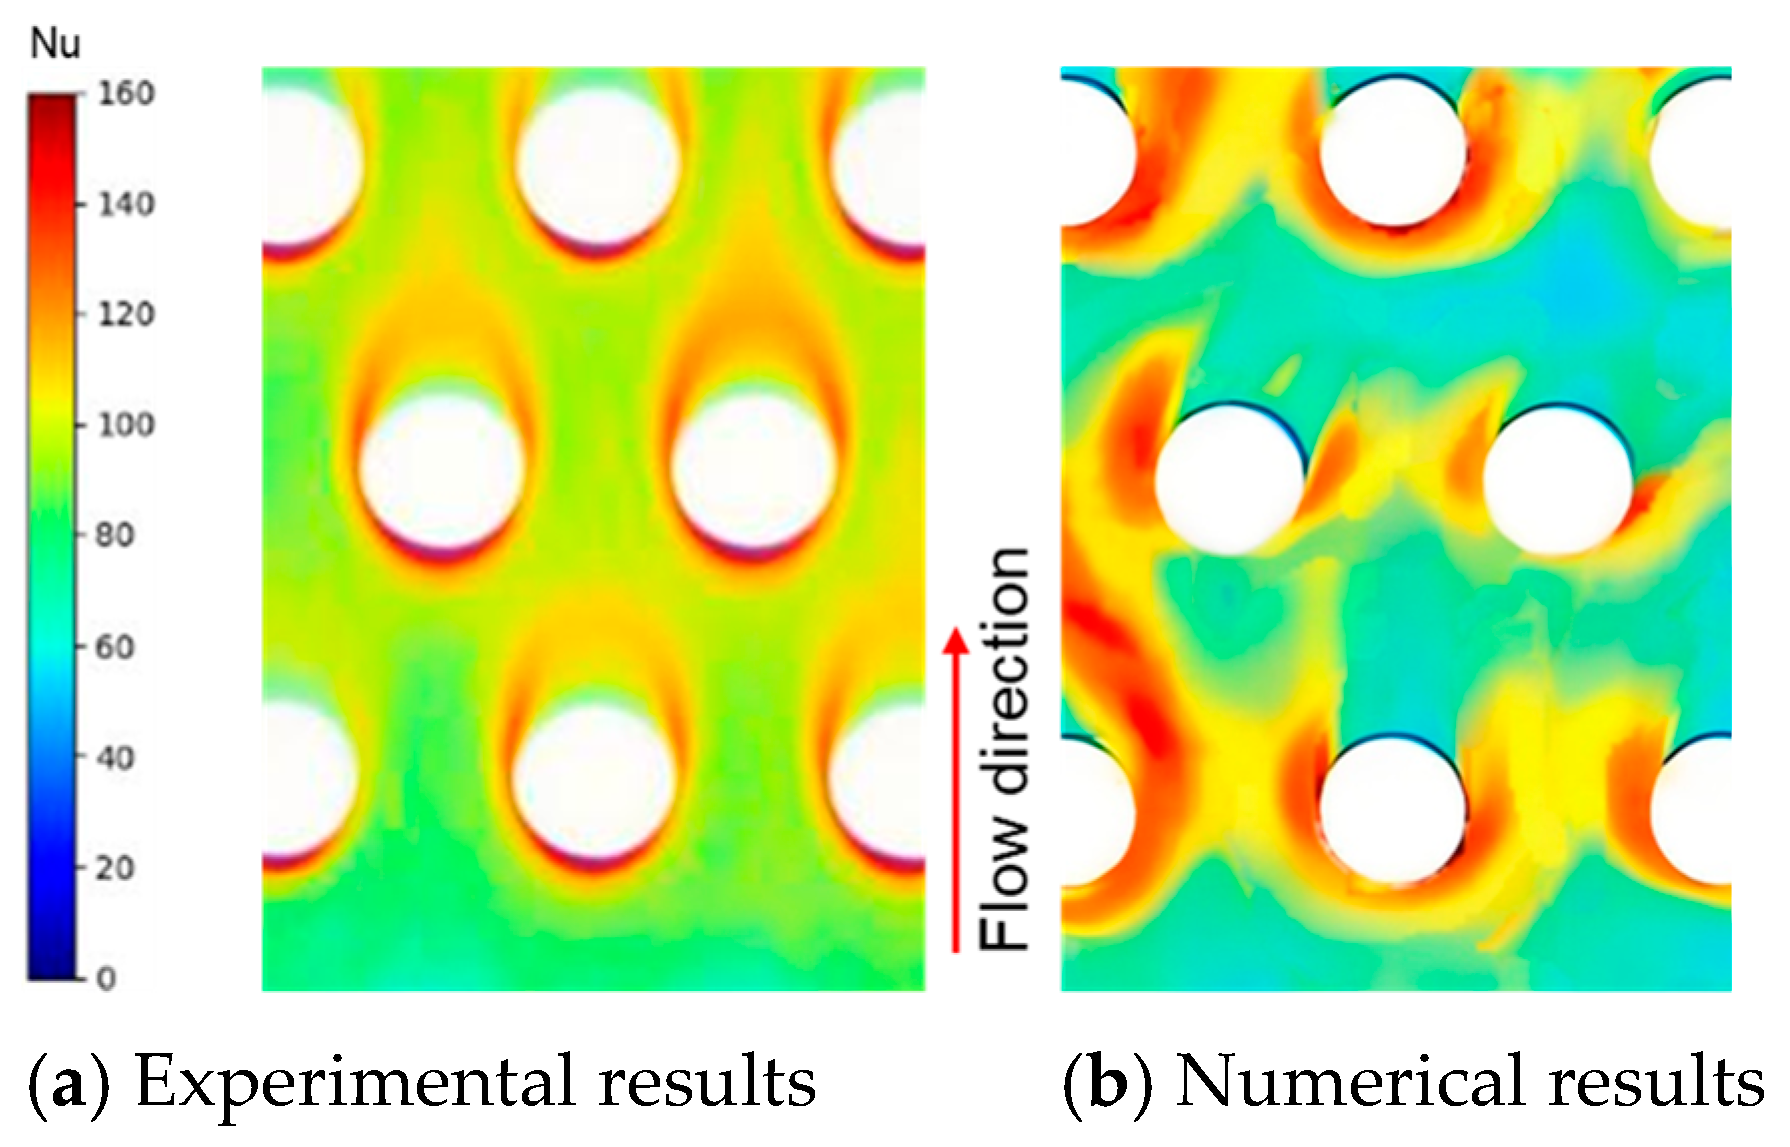
Numerical Results Validation
Considering the overall coherence of the content and the fact that experimental results for the third configuration have not yet been approved for use in this paper, validating the computations using experimental data from only Case 1 and Case 2 will be sufficient. So, the validation of the numerical simulation results for Case 1 and Case 2 will be presented next.
The pin-fin heat transfer configuration (Case 1) was simulated at Reynolds numbers 10,000, 30,000, and 50,000 using the aforementioned computational setup (~8 million grids, SST turbulence model). The results were validated against classical heat transfer correlations [27] (Equation (9)), with comparative data presented in Table 3. The overall Nusselt number ( N u t o t a l ) was calculated through area-weighted averaging of the bottom endwall, pin-fins, and micro V-ribs (Equation (10)), where subscripts e w a l l and o w a l l denote the bottom endwall surface and ribbed surface (m2), respectively. The numerical results showed good agreement with the correlation predictions, demonstrating a maximum deviation of 7.40%, thereby confirming the validity of the numerical approach.
N u = 0.135 Re 0.69 ( L x / D ) 0.34
N u t o t a l = N u e w a l l × A e w a l l + N u o w a l l × A o w a l l A e w a l l + A o w a l l
The hybrid pin-fins and V-ribs configuration (Case 2) was numerically and experimentally investigated at Reynolds numbers 10,000, 30,000, and 50,000 using validated CFD methods (~8 million grids, SST k-ω model) and transient liquid crystal techniques. As shown in Table 4, the area-averaged Nusselt numbers and friction factors obtained from both methods demonstrated agreement within engineering-acceptable margins, with deviations calculated as (numerical result − experimental result)/experimental result (rounded to two significant figures). While Nusselt number deviations remained below 3%, friction factors showed marginally higher discrepancies (maximum 3.74%) attributable to amplification effects when normalizing the absolute differences against their small baseline values. This is mainly attributed to the relatively small magnitude of the friction factor, which amplifies the deviation when used as the denominator in the calculation. Figure 5 compares the Nusselt number distribution on the endwall under the condition of Reynolds number 30,000 for Case 1. As can be seen from the figure, high Nusselt number values exist at the leading edge of the vortex generator, and high Nusselt number regions are also formed along both sides and the trailing edge due to the cylindrical vortex generator, demonstrating generally consistent trends. Nevertheless, all the results meet the requirements for engineering calculations.

3. Results and Discussion

3.1. Average Heat Transfer Characteristics

Figure 6 presents the calculated thermal performance evolution with Reynolds numbers (10,000–50,000) [28,29,30,31], where the Nusselt numbers were extracted from the bottom endwall of each configuration. Compared to the baseline pin-fins array, the hybrid continuous V-ribs design achieved maximum enhancements of 27.6% in average Nusselt number, 16.3% in friction factor, and 25.3% in thermal performance factor (TPF), with mean improvements of 25.6%, 13.3%, and 21.9%, respectively. The broken V-ribs variant showed maximum gains of 26.6% (Nu), 10.1% (f), and 25.3% (TPF), with average values of 24.4%, 7.2%, and 22.5%. Cross-comparison reveals distinct performance characteristics—(1) the continuous V-rib configuration consistently delivered higher Nu across all Re (10,000–50,000). This phenomenon can be attributed to two primary mechanisms: first, the incorporation of composite micro V-ribs significantly enhances turbulent effects; second, the introduction of these micro V-ribs alters flow resistance characteristics, consequently modifying the mixing ratio between hot and cold fluid streams. (2) It incurred greater flow resistance throughout the studied range; (3) although its TPF slightly underperformed at Re = 10,000 and Re = 30,000, it surpassed the broken design by 2.1% at Re = 50,000, demonstrating superior scalability for high-intensity cooling scenarios.
Figure 7 compares the bottom endwall Nusselt number (Nu) distributions of hybrid pin-fins and V-ribs configurations (Case 2 and Case 3) and baseline pin-fins array (Case 1) at Re = 30,000. Distinct performance characteristics emerge. (1) Compared to the Nusselt number distribution on the bottom endwall of the baseline pin-fins array, the incorporation of micro V-ribs creates high Nusselt number regions around the pin-fin, particularly on both sides. This can be attributed to two primary mechanisms; first, the incorporation of composite micro V-ribs significantly enhances turbulent effects. Second, the introduction of these micro V-ribs alters flow resistance characteristics, consequently modifying the mixing ratio between hot and cold fluid streams; however, the different configurations of the micro V-ribs also lead to distinct Nusselt number distributions on the bottom endwall between the other two structures. (2) Case 2 demonstrates superior uniformity and higher average Nu (108.59), attributed to enhanced turbulent mixing via V-rib induced secondary flows and optimized horseshoe vortex distribution. (3) Case 3, while achieving the lowest flow resistance, shows limited thermal enhancement (avg. Nu = 107.45) due to underdeveloped vortical structures. The Nu spatial patterns confirm that peak heat transfer zones correlate strongly with impinging jet flows and vortex interactions, providing critical insights for turbulence modulation in hybrid cooling designs. For example, enhancing local turbulence and improving heat transfer efficiency could be modified by the interrupted design of the V-ribs. Additionally, adjusting the angle of the V-shaped ribs can maximize the Nusselt number gain under optimal conditions.
Table 5 compares the overall heat transfer characteristics of two hybrid pin-fins and V-ribs configurations (Case 2 and Case 3). When considering the total heat transfer surface area, the results show, at a Reynolds number of 10,000, the Nusselt number obtained for Case 2 is 70.23, while that for Case 3 it is 62.46; at a Reynolds number of 30,000, the Nusselt number obtained for Case 2 is 143.41, while for Case 3 it is 128.37; at a Reynolds number of 50,000, the Nusselt number obtained for Case 2 is 202.81, while for Case 3 it is 186.23. The maximum and minimum improvements were 12.44% and 8.9%, respectively, with the enhancement magnitude decreasing as the Reynolds number increases. For the overall thermal performance factor ( T P F t o t a l ), the configuration of hybrid pin-fins and continuous V-ribs demonstrates a maximum improvement of 10.84% and a minimum improvement of 6.9% compared to the configuration with broken V-ribs. This further elucidates why continuous V-shaped ribs achieve superior heat transfer performance. Through comparison with Figure 6c, it can be observed that when considering the total heat transfer surface area, the configuration of hybrid pin-fins and continuous V-ribs achieves a maximum enhancement of 30.51% and an average improvement of 27.50% in overall thermal performance. Additionally, the maximum improvement in comprehensive heat transfer performance for the configuration with broken V-ribs reaches 17.73%, with an average increase of 16.64%. The data comparison reveals that the contribution of the pin-fins surface area to Nusselt number enhancement gradually diminishes at higher Reynolds numbers, indicating that the micro V-rib parameters play a more significant role in heat transfer performance under these conditions. The function of these micro V-ribs should be understood relative to the baseline pin-fins array. In other words, when integrated with micro V-ribs, the composite structure demonstrates significant value in enhancing heat transfer performance. Furthermore, when compared with the classical heat transfer correlation for those structures (Table 3), the maximum improvements in overall Nusselt number were 19.09% for the continuous V-ribs configuration and 5.92% for the broken V-ribs configuration.

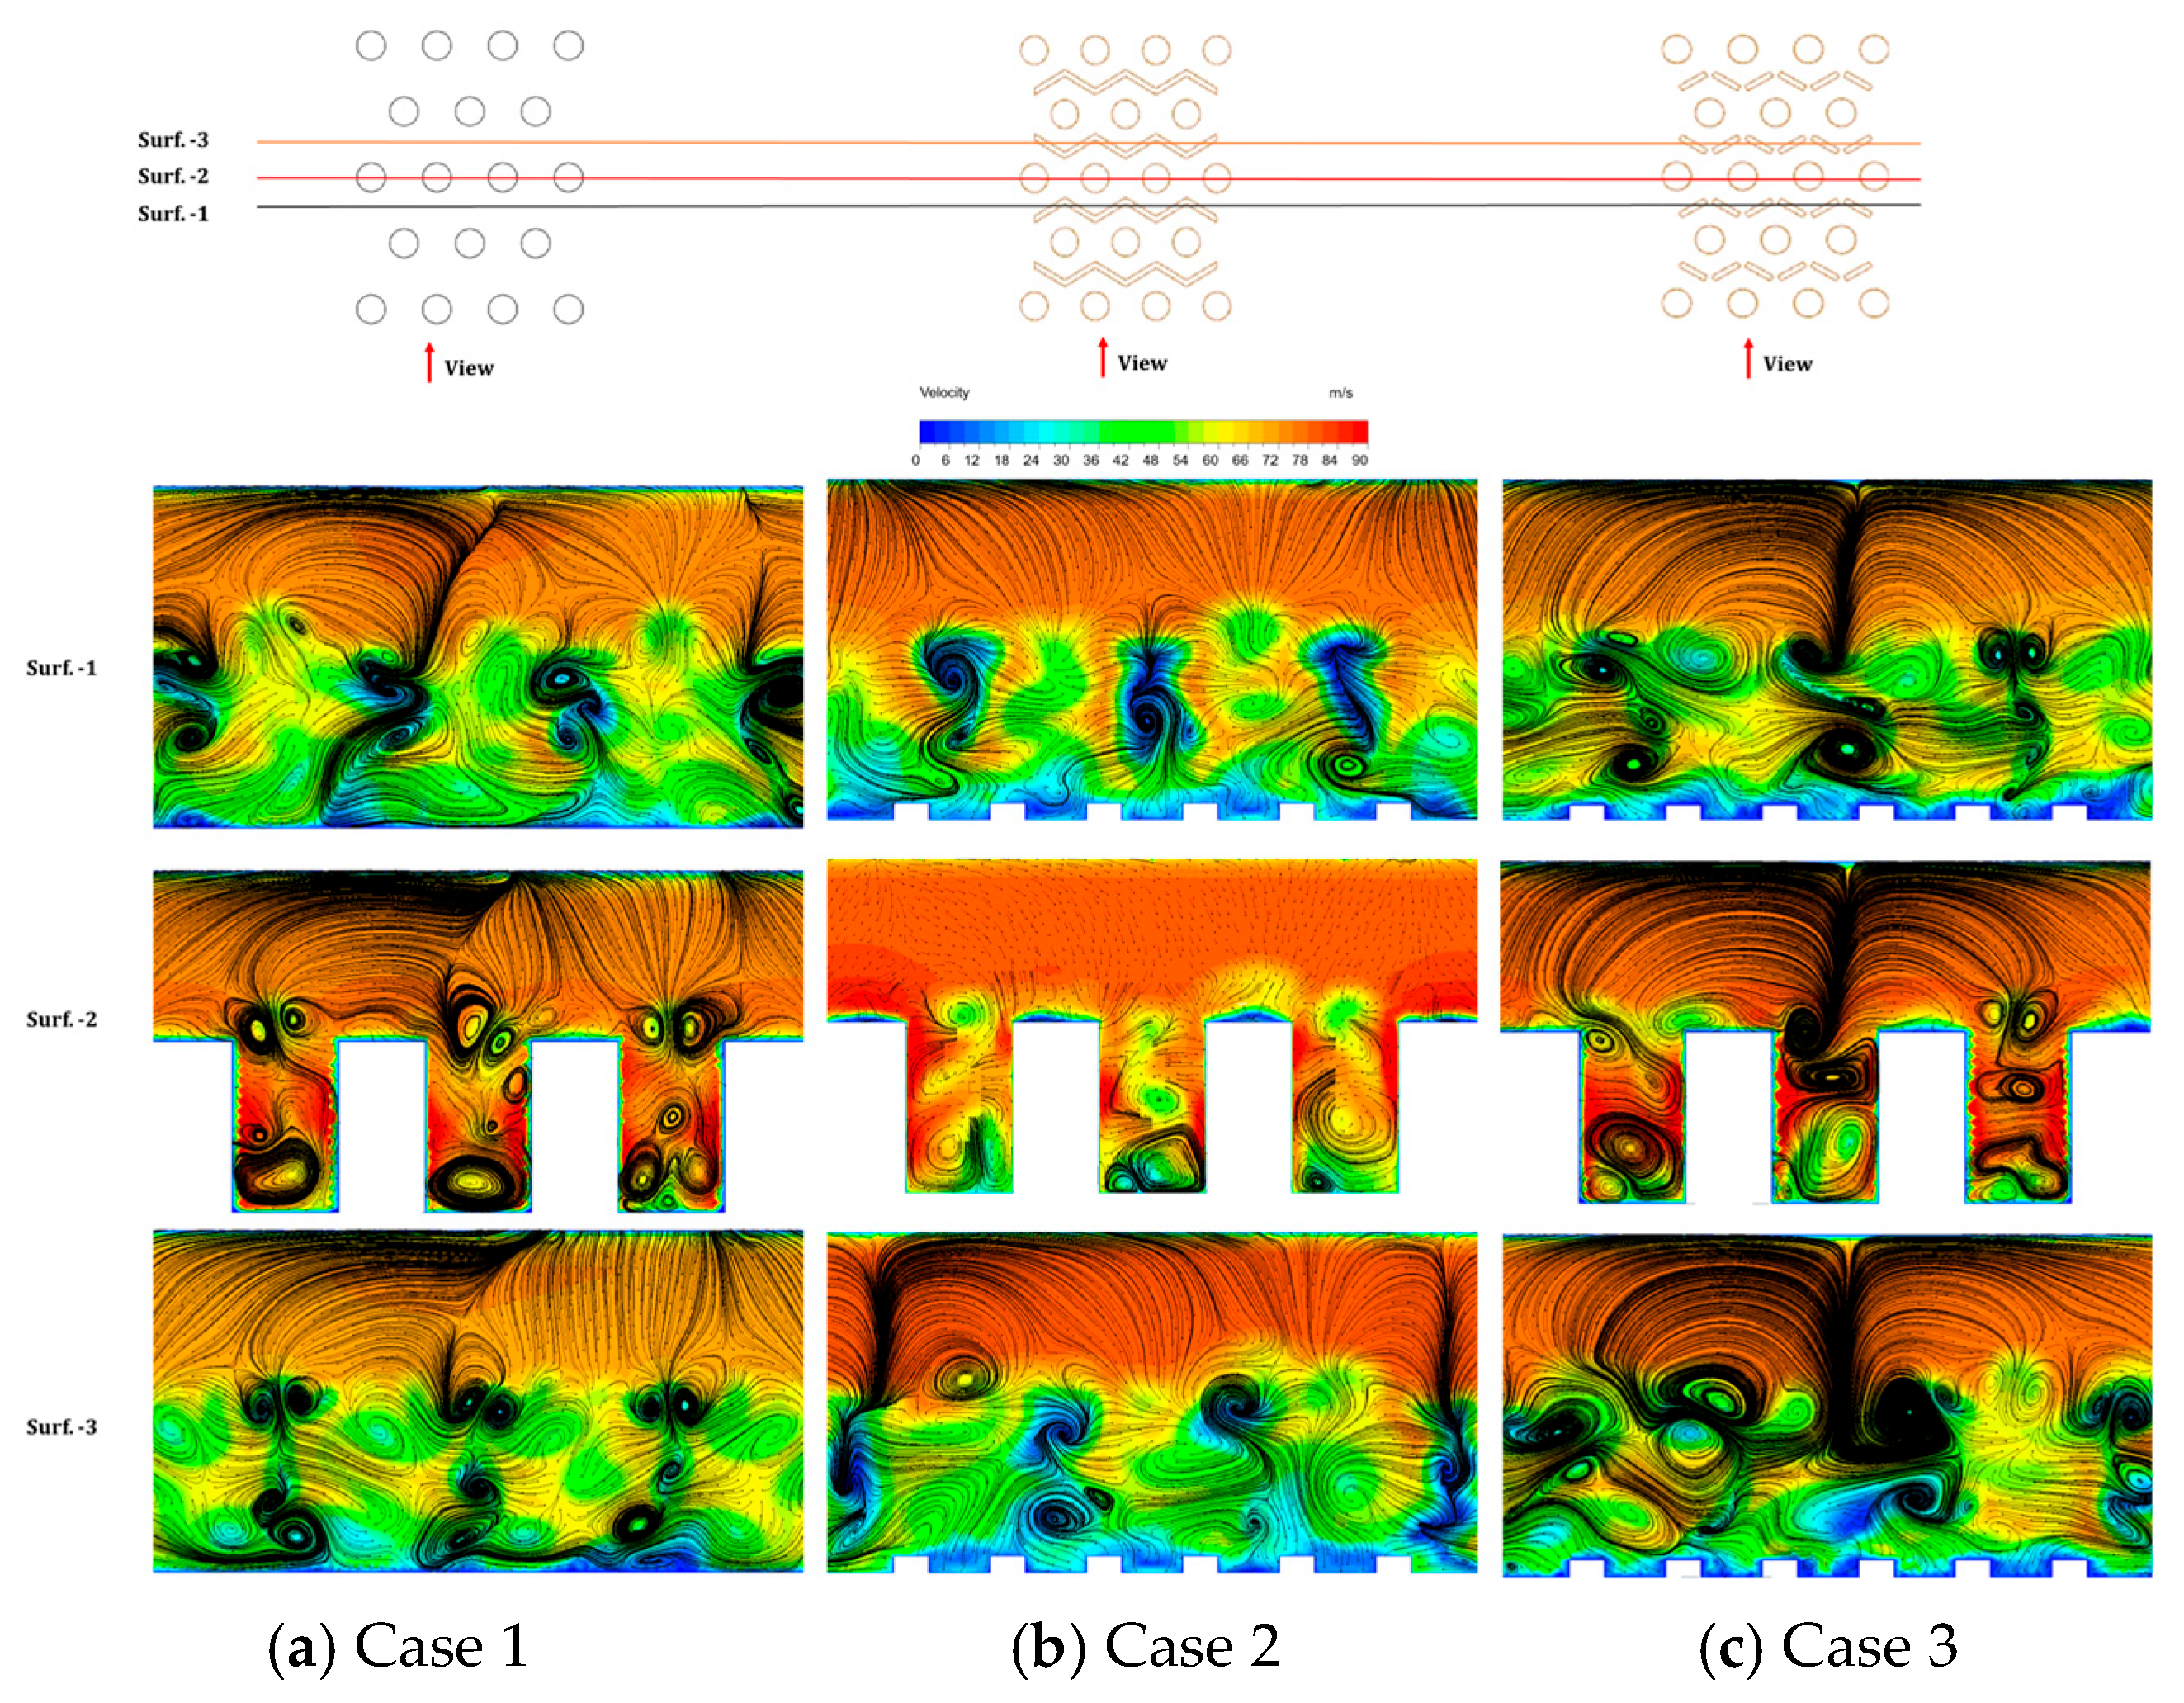
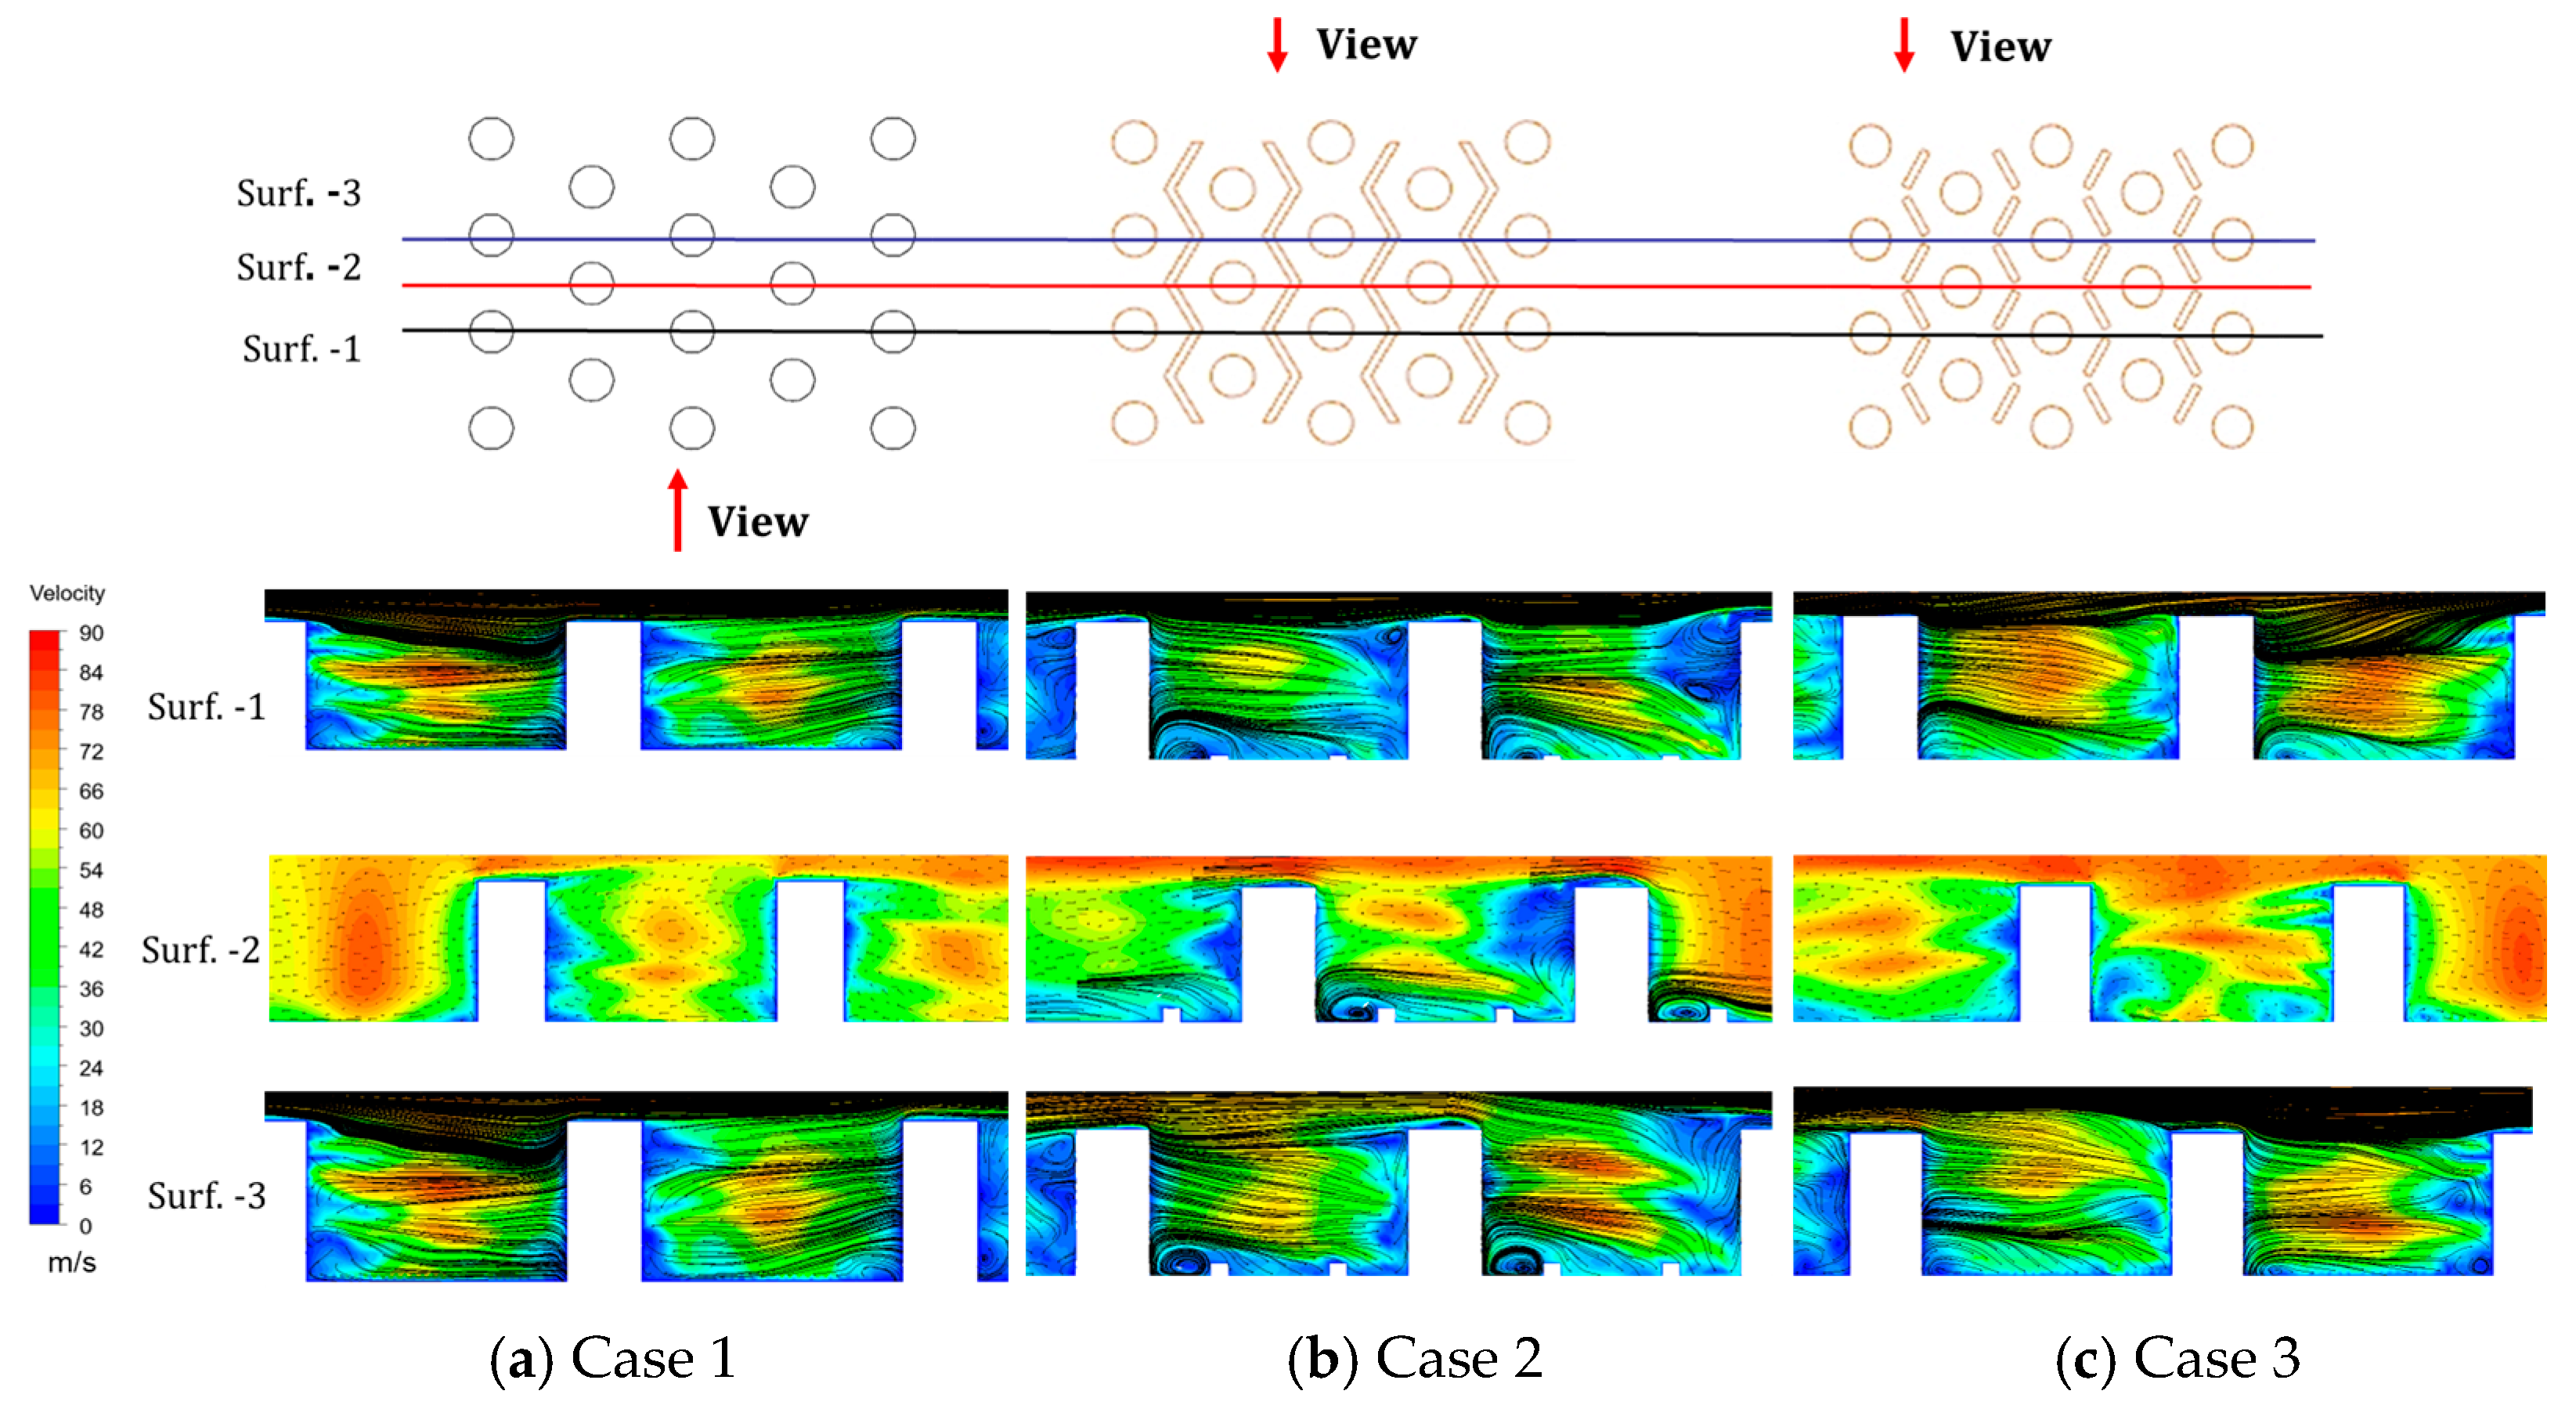
3.2. Local Flow Mechanisms

Figure 8 illustrates the cross-sectional turbulent kinetic energy (TKE) fields at Re = 30,000 for three streamwise locations (Section 1: second V-rib row; Section 2: third pin-fin row; Section 3: third V-rib row centerlines). The three configurations exhibit fundamentally distinct TKE development patterns: (1) Case 1 demonstrates the most intense turbulence activity, following a characteristic “growth-peak-decay” trajectory with peak TKE at pin-fin trailing edges (indicating strong heat transfer enhancement but significant pressure penalty)—the high-turbulence kinetic energy region at the trailing edge enhances heat transfer through intensified fluid mixing, but simultaneously exacerbates local flow separation, resulting in increased pressure drop; (2) Case 2 maintains balanced TKE distribution (<30% variation between sections), reflecting optimized turbulence generation-dissipation equilibrium for simultaneous thermal enhancement and controlled pressure loss; (3) Case 3 shows rapid streamwise TKE decay due to premature breakdown of large-scale vortices, revealing insufficient vortex interaction mechanisms. These findings correlate directly with the thermal-hydraulic performance trends observed in Figure 6 and Figure 7.
Figure 9 presents the streamwise turbulent kinetic energy (TKE) distributions at Re = 30,000 for three spanwise sections (Section 1: left adjacent pin-fin centerline; Section 2: central pin-fin; Section 3: right adjacent pin-fin centerline). Key mechanisms are identified: (1) Case 1 generates turbulence primarily through wall shear with imbalanced energy distribution, exhibiting high dissipation from multi-scale vortex interference; (2) Case 2 achieves synergistic effects between pin-fin shear layers and V-ribs-induced secondary vortices, enabling periodic boundary layer renewal; (3) Case 3 maintains sustained near-wall perturbation while promoting core-to-wall energy transfer via phase-locked multi-scale vortices (enabled by broken V-rib geometric optimization). Comparative analysis reveals that Case 2’s continuous V-ribs provide systematic flow resetting, whereas Case 3’s broken configuration achieves precise vortex scale coupling—converting large-scale energy to small-scale motions for continuous boundary layer management. The micro V-ribs significantly modify boundary layer development through two primary mechanisms: (1) upstream flow stagnation that periodically regenerates the boundary layer; and (2) the consequent reorganization of the flow topology.
Figure 10 presents cross-sectional velocity fields at three streamwise stations (Surf. 1–Surf. 3), revealing configuration-dependent flow evolution characteristics: Case 1 exhibits the most complex flow topology, initiating with strong 3D distortion at Surf. 1, developing intense spiral motion at Surf. 2, and maintaining sustained fluctuations at Surf. 3, collectively demonstrating superior flow perturbation capability. In contrast, Case 2 displays systematically organized flow structures—beginning with uniform inlet velocities at Surf. 1, transitioning to stable counter-rotating vortex pairs at Surf. 2, and culminating in a distinctive dual-vortex-core configuration at Surf. 3 that achieves optimal mixing-pressure loss compromise. Case 3 demonstrates rapid flow stabilization, evolving from stratified layers to quasi-parallel streamlines. All cases exhibit special features near Surf. 2—Case 1 develops strong shear-layer instability, Case 2 forms symmetric vortex pairs, and Case 3 displays weakened gradients. Vortex dynamics analysis confirms these observations: Case 1 maintains turbulence through vortex stretching/breakup, Case 2 achieves vortex pairing equilibrium, while Case 3 experiences rapid small-scale dissipation. These findings provide critical insights for cooling channel optimization, particularly Case 2’s geometrically induced dual-vortex structure which offers 22% better thermal performance than conventional designs. In conventional design, the currently employed structure—referred to as angled ribs—represents a widely adopted and mature solution. The present findings are specifically benchmarked against this baseline configuration.
Figure 11 presents the streamwise velocity fields at Re = 30,000 for different spanwise positions, highlighting distinct vortex generation patterns near pin-fin trailing edges and V-rib leading edges. Three characteristic flow modes are observed: (1) Case 1 exhibits predominantly parallel streamlines in the core flow with sawtooth-shaped near-wall fluctuations and deflected transitional flows; (2) Case 2 demonstrates well-organized wavy streamlines through counter-rotating vortex pairs, achieving enhanced mixing via optimized vortex sizing while minimizing transverse flow losses; (3) Case 3 forms accelerated flow channels in the mainstream region with maintained near-wall flow alignment, developing moderate spiral streamlines in transitional zones. These patterns quantitatively explain Case 2’s superior thermal performance (28% higher Nu than Case 1) and 15% lower pressure loss than Case 3, as reported in Table 5. The vortex dynamics analysis reveals that continuous V-ribs in Case 2 systematically reorganize the flow structure, whereas broken ribs in Case 3 create localized acceleration effects, and Case 1 primarily manifests the shedding of separation vortices along both sides of the pin-fins.

4. Conclusions

This study systematically investigated the thermal performance of three hybrid pin-fins and V-ribs configurations across Re = 10,000–50,000 using transient liquid crystal experiments and numerical simulations. Through the comprehensive analysis of average Nusselt numbers, flow resistance, thermal performance factors, turbulent kinetic energy, and velocity fields, the effects of V-rib parameters on pin-fin cooling structures were revealed, providing valuable engineering guidance for heavy-duty gas turbine blade cooling optimization. Key findings include:
(1)
Through comparisons with experimental data and results from classic empirical correlations, the SST k-ω model has been validated as suitable for investigating the heat transfer characteristics for combining pin-fins with micro V-ribs.
(2)
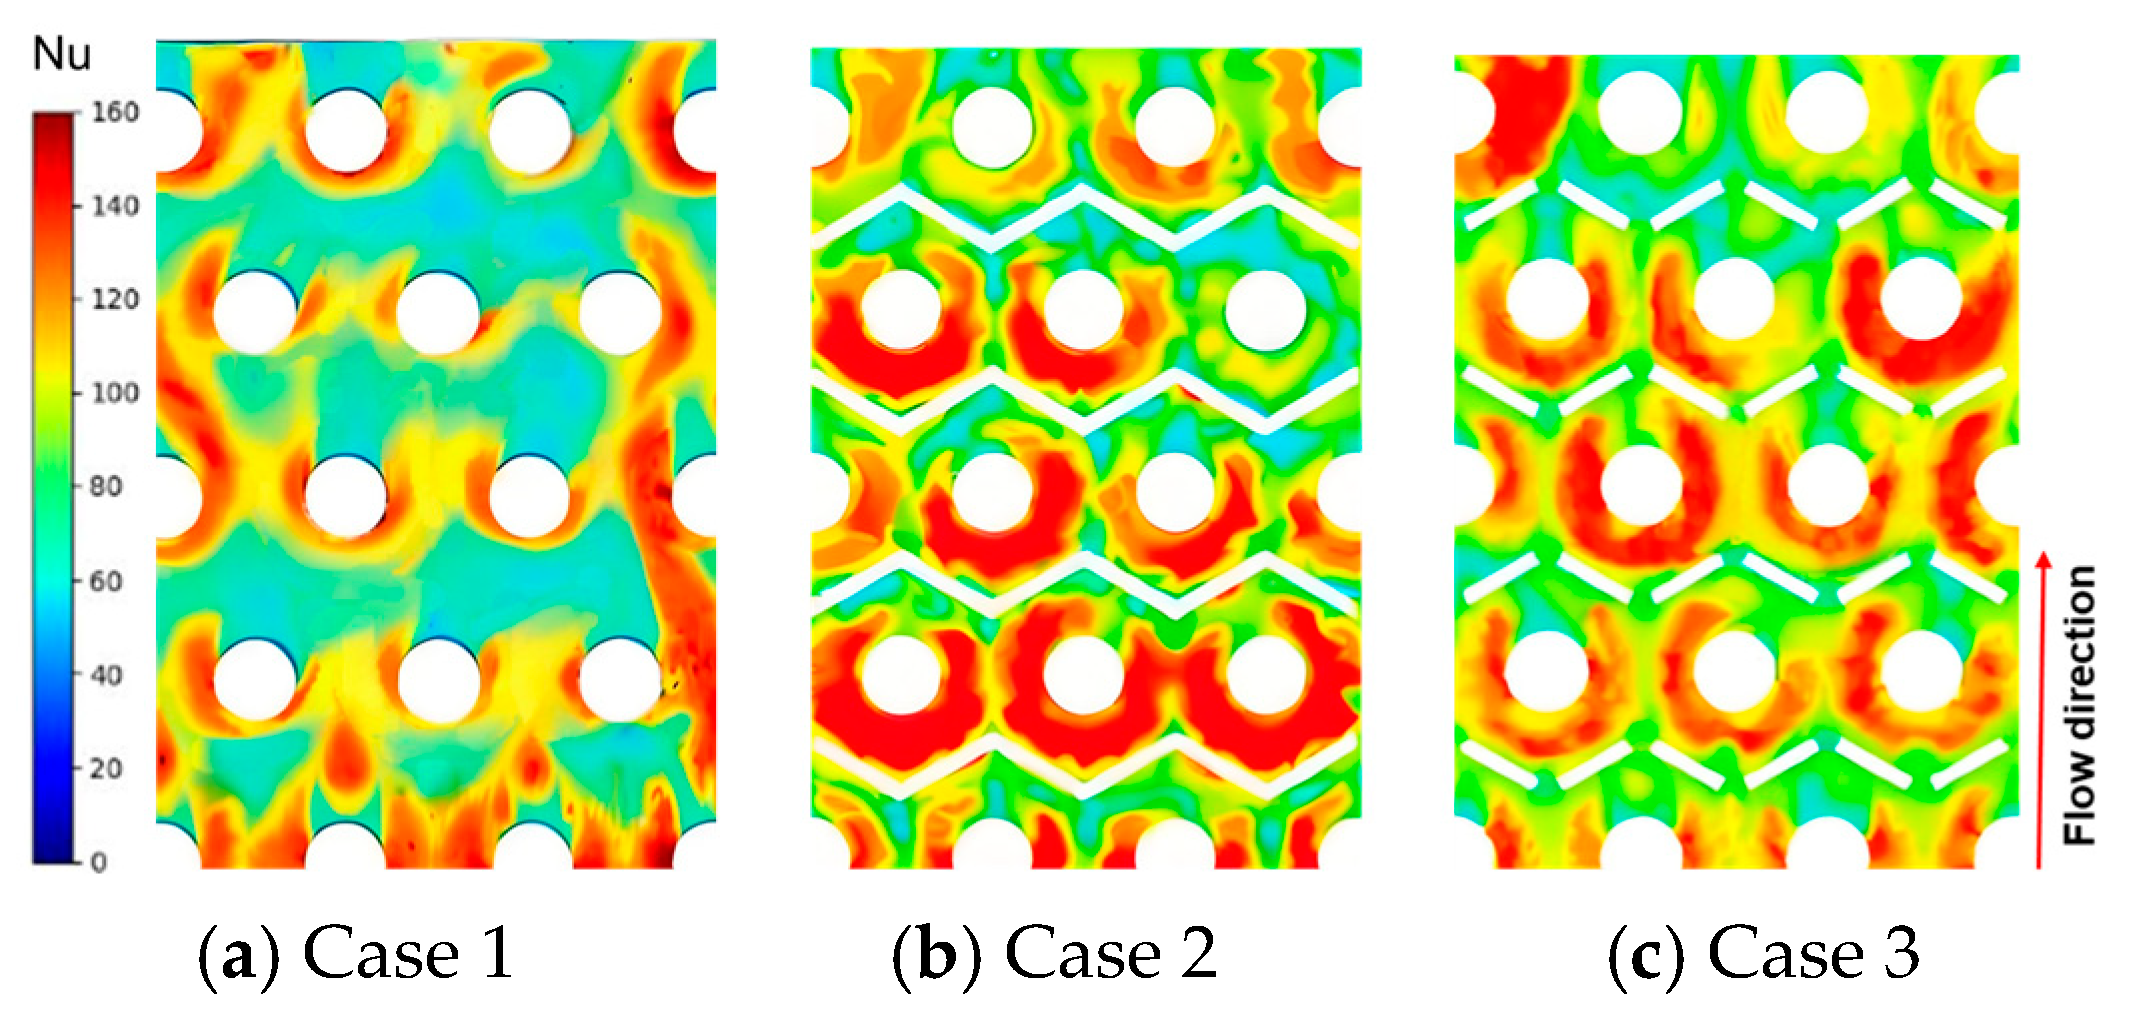
A low heat transfer zone was identified behind pin-fin trailing edges, where direct V-rib placement improved thermal distribution. The continuous V-rib configuration achieved maximum heat transfer enhancement (27.6% higher than baseline). This is primarily attributed to the turbulence enhancement effect induced by the integrated micro V-rib configuration.
(3)
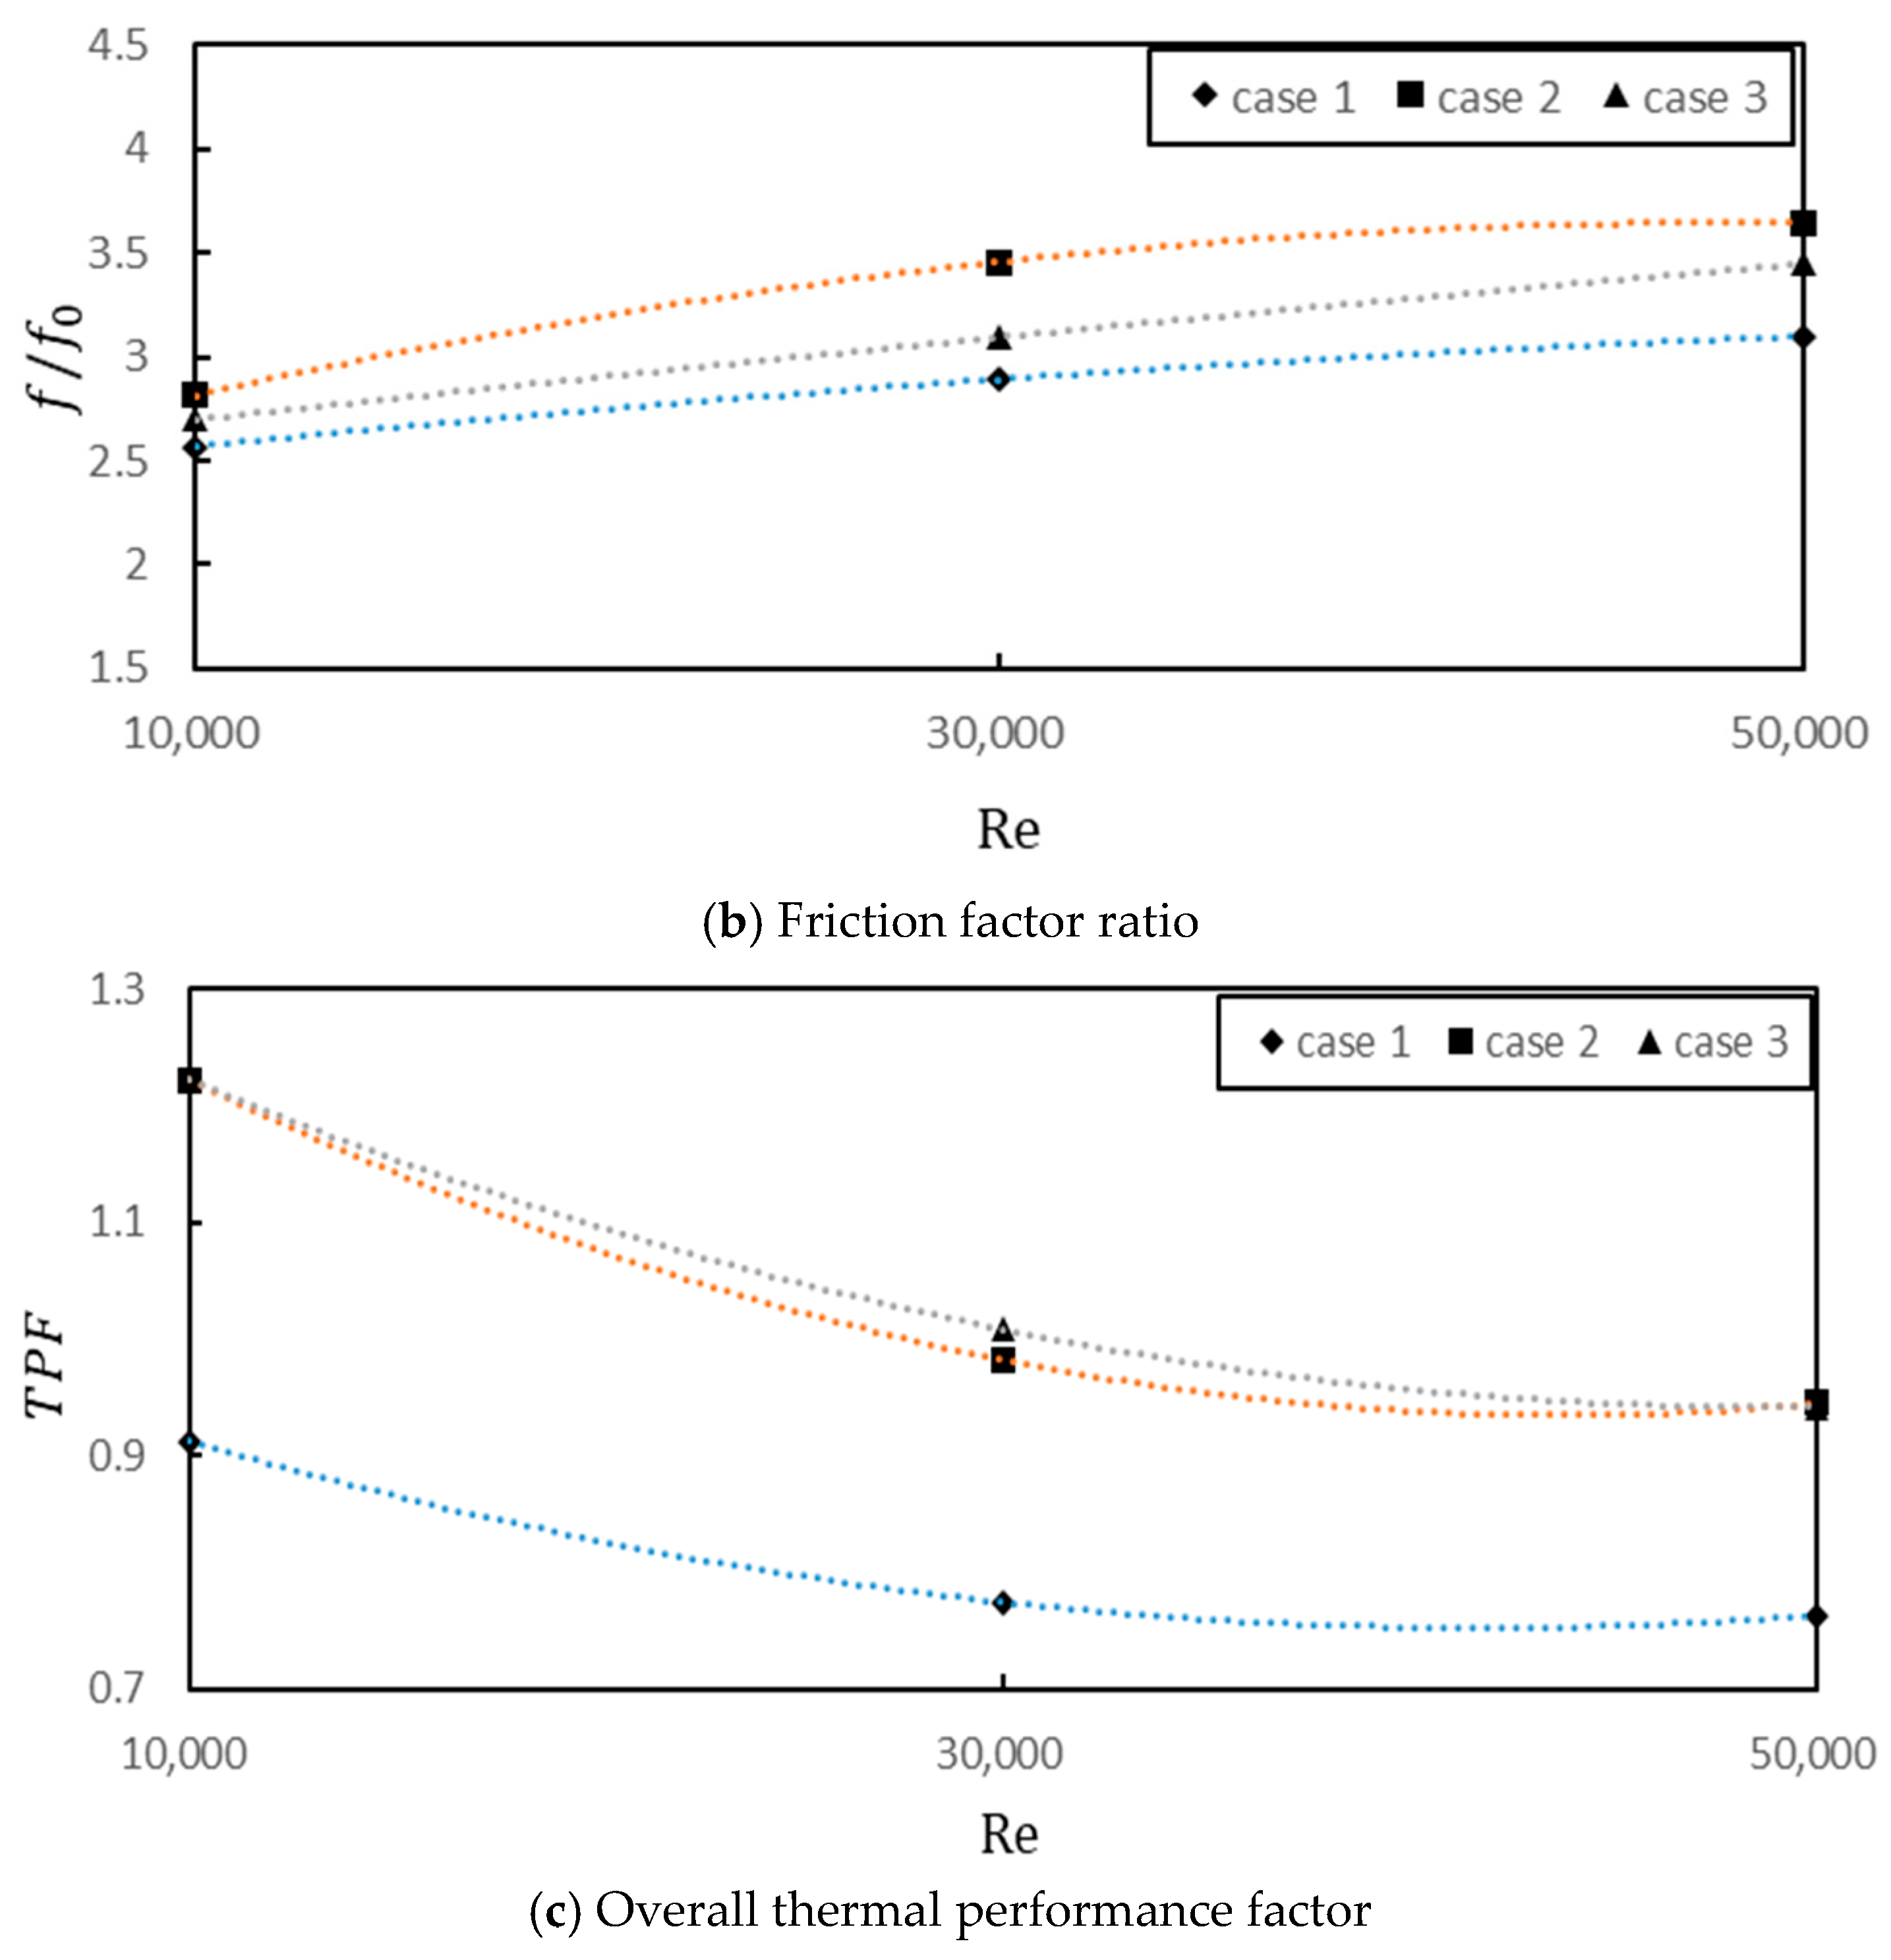
Flow resistance increased with Re for all cases, with the broken V-rib design showing the lowest absolute pressure loss (though still 7.2% higher than baseline). This leads to non-uniform cold-hot fluid mixing effects along different flow orientations, consequently affecting heat transfer performance.
(4)
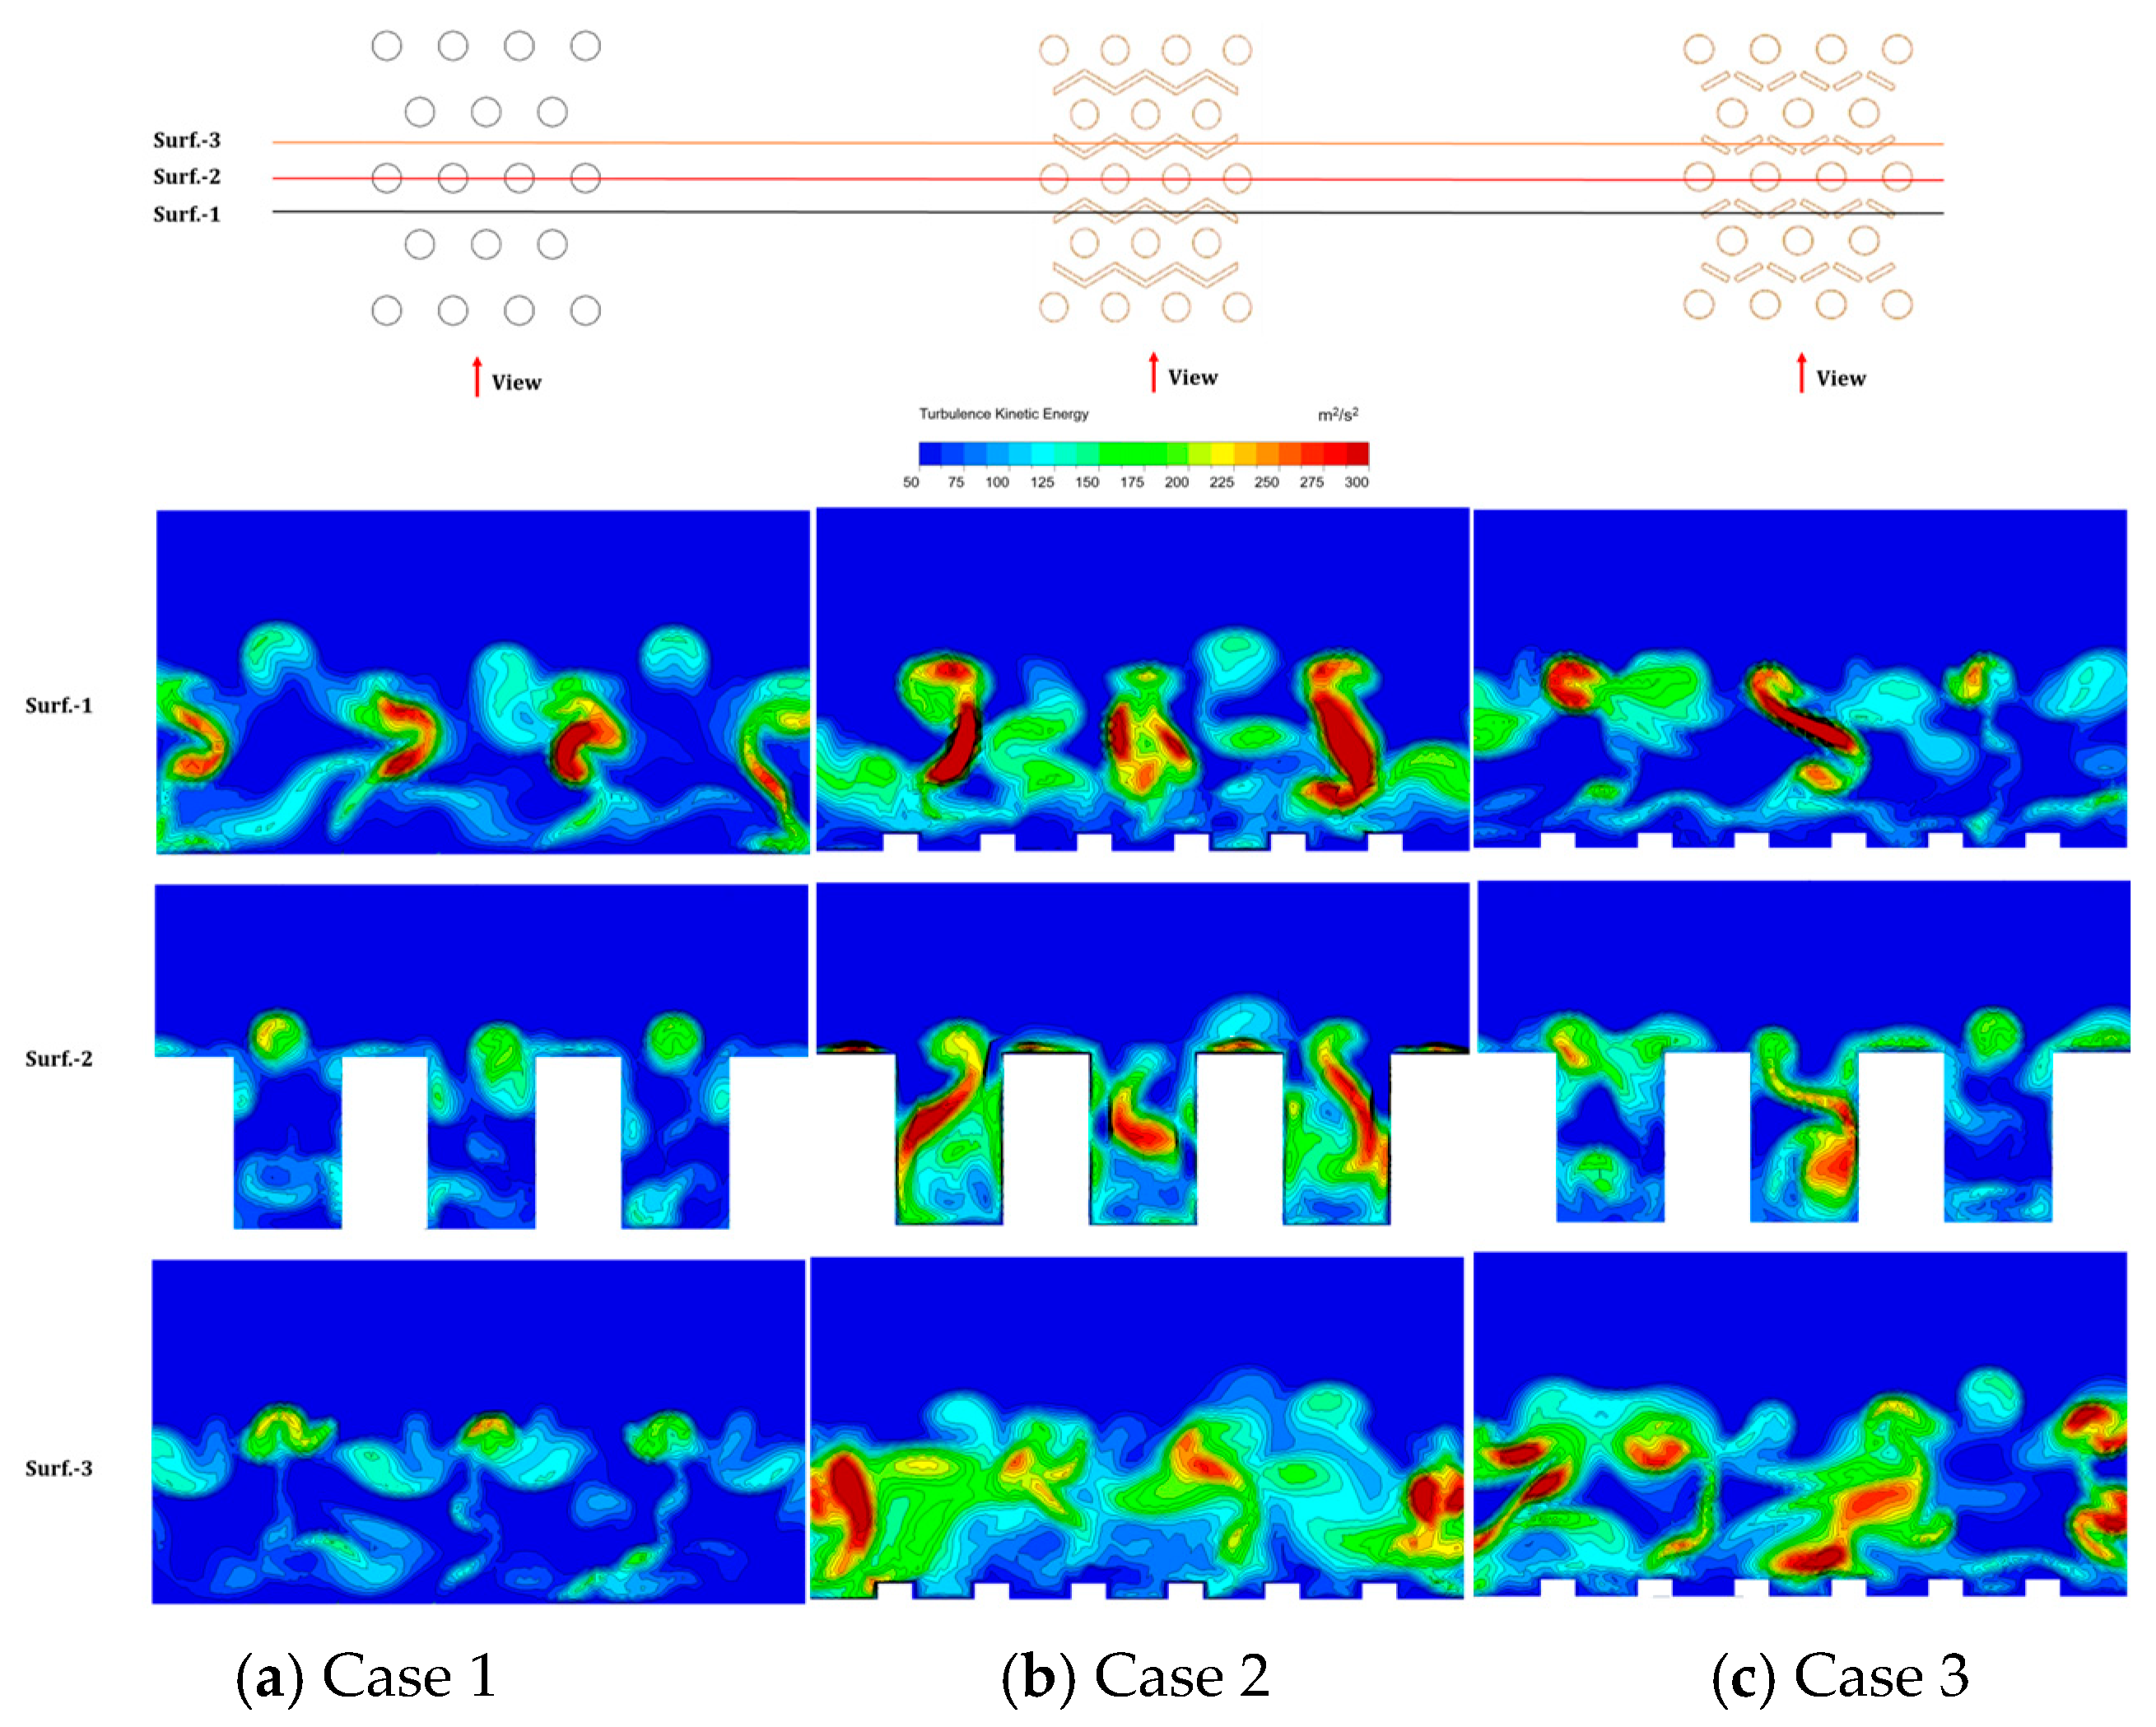
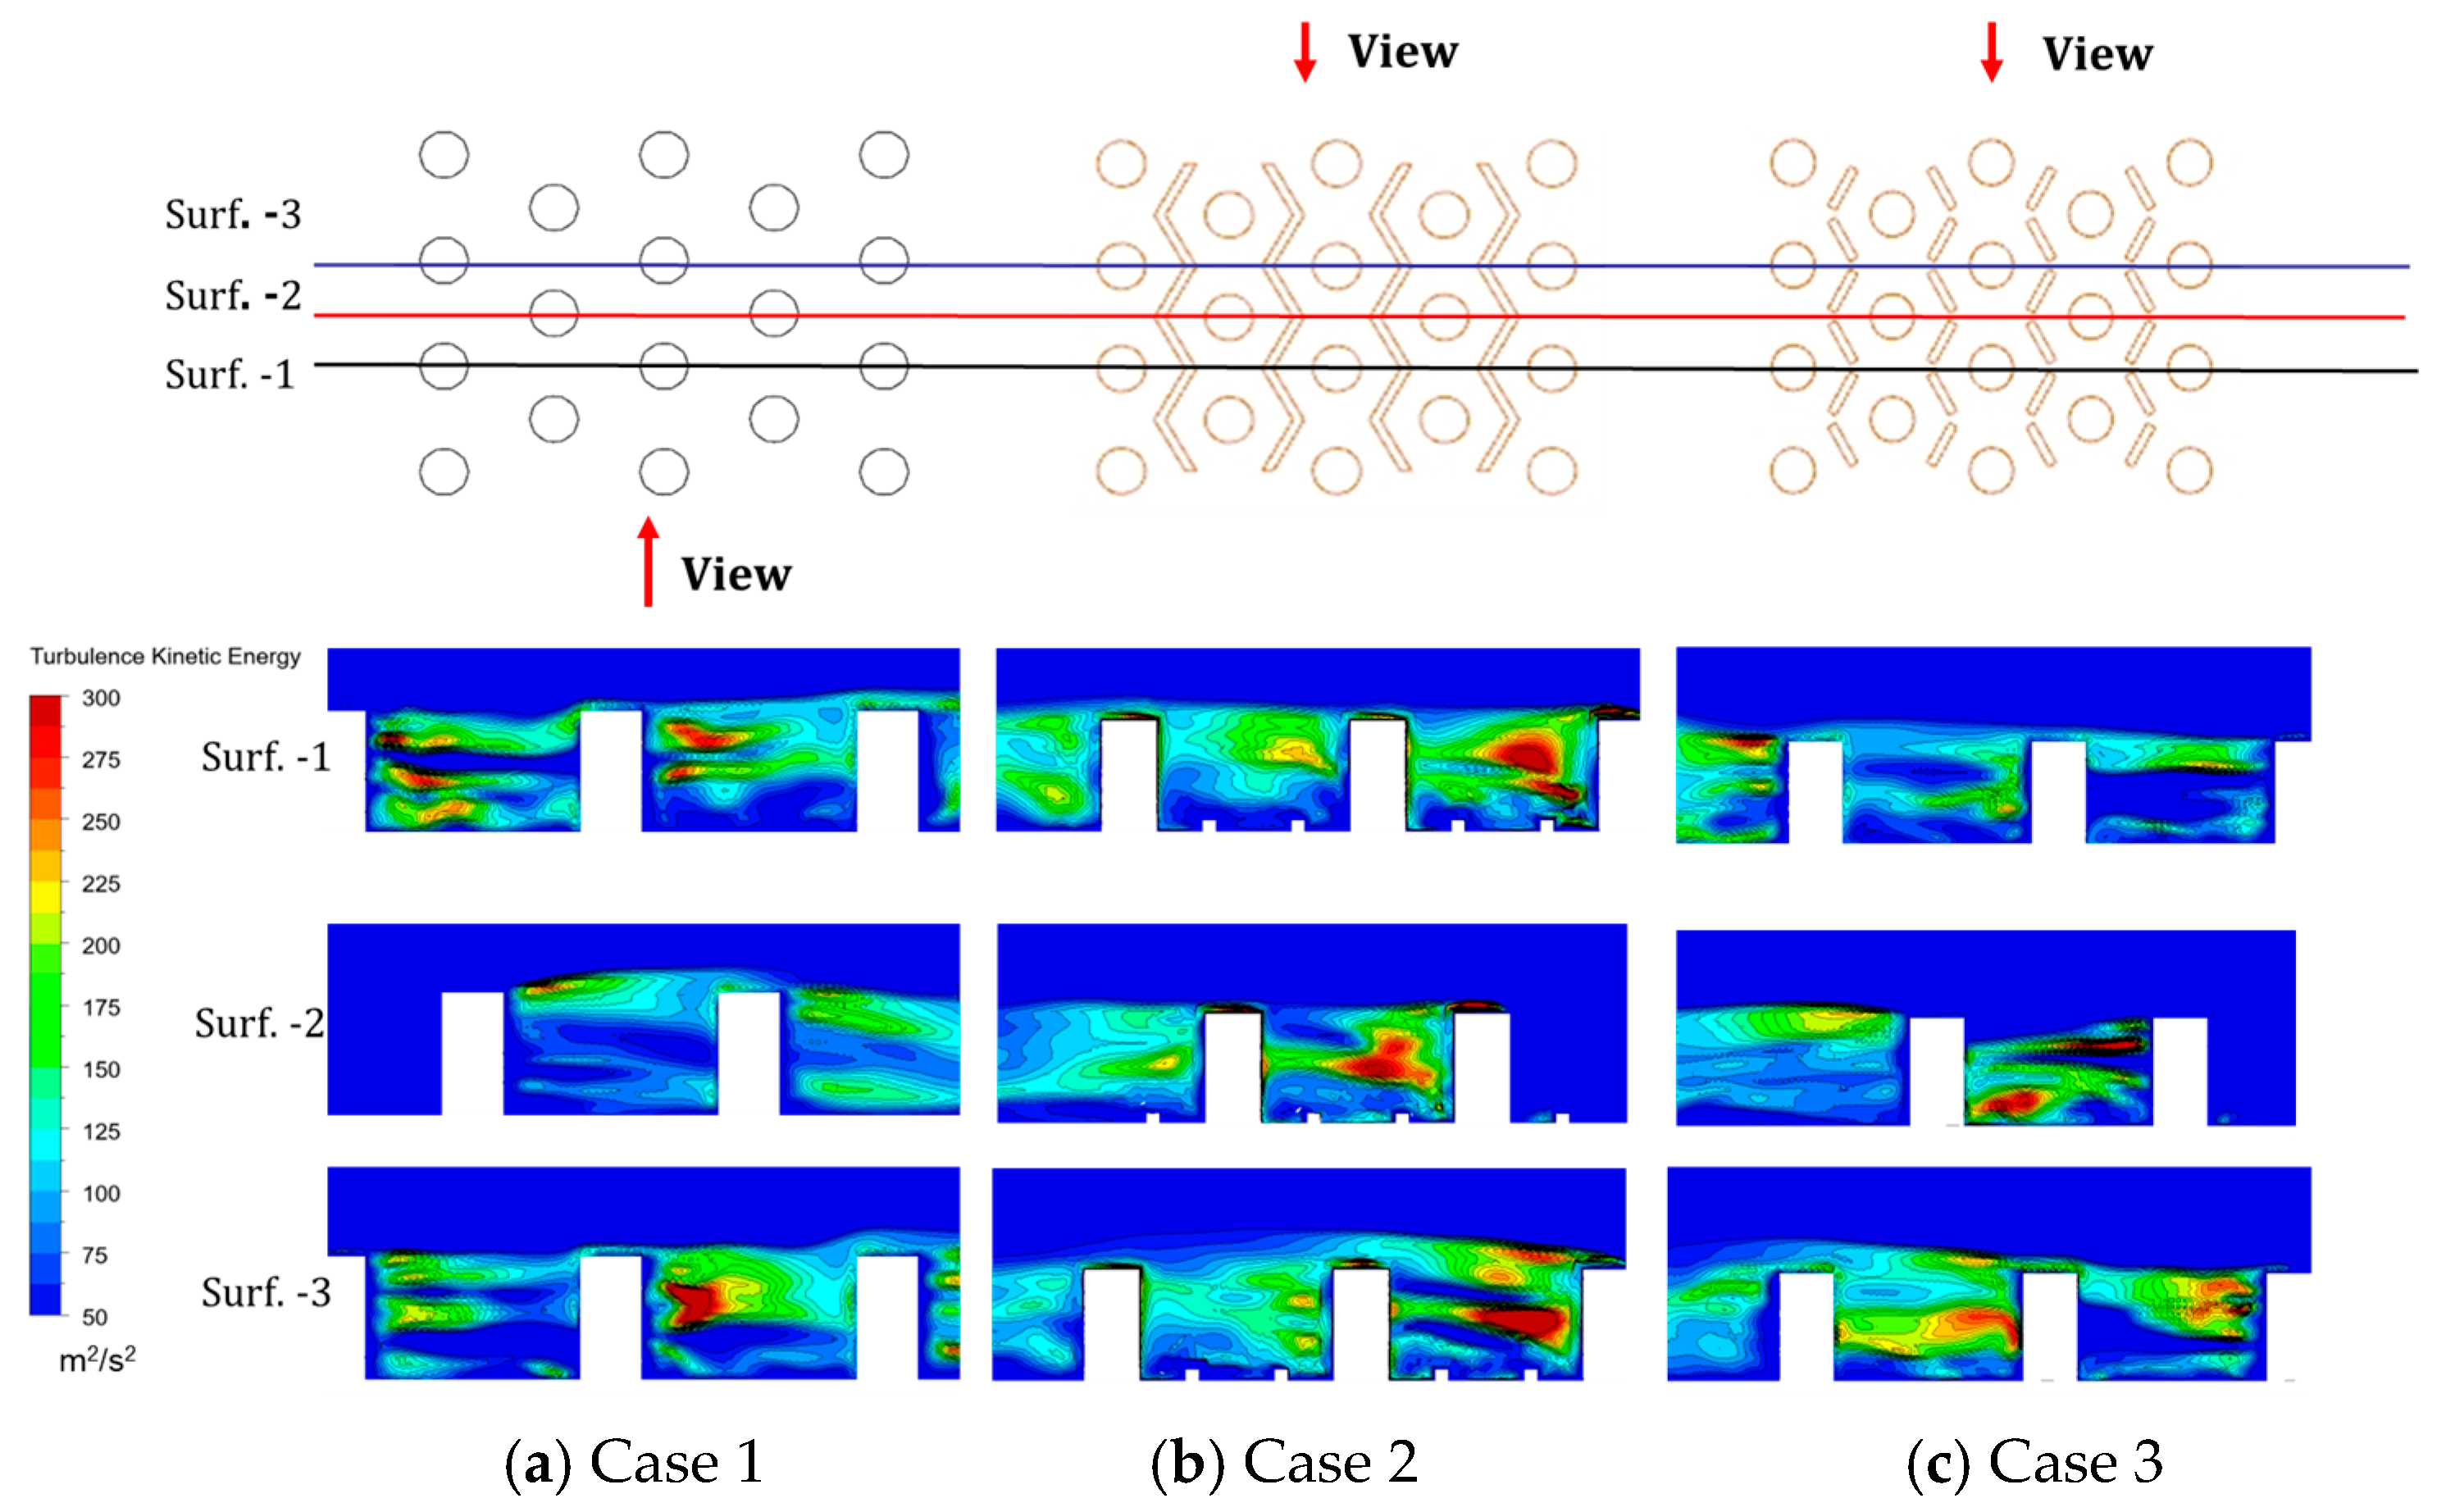
The thermal enhancement mechanism stems from vortex generation downstream of pin-fins; flow separation at trailing edges creates shear-induced vortices that promote transverse momentum exchange and asymmetric flow redistribution, significantly improving wall heat transfer.
(5)
In future work, CFD will be employed to investigate the heat transfer performance of the composite micro V-rib configuration under rotating conditions, while the experimental apparatus will be upgraded simultaneously. This will involve installing a sector rig (incorporating 4 turbine blades) at the combustor exit to enable full-temperature, full-pressure heat transfer evaluation.

Author Contributions

Conceptualization, Q.Z. and Y.R.; methodology, L.H.; software, L.H.; validation, Q.Z.; formal analysis, L.H.; investigation, L.H.; resources, Y.R.; data curation, Q.Z.; writing—original draft preparation, L.H.; writing—review and editing, Y.R.; visualization, Q.Z.; supervision, Y.R.; project administration, L.H.; funding acquisition, Y.R. All authors have read and agreed to the published version of the manuscript.

Funding

This research was funded by the National Science and Technology Major Project, grant number 2017-III-0009-0035.

Data Availability Statement

The original contributions presented in this study are included in the article. Further inquiries can be directed to the corresponding author.

Acknowledgments

During the preparation of this study, the author L.H. used ANSYS 2019 R3 for the purposes of numerical simulation and thanks the help from Zhongran Chi. The authors have reviewed and edited the output and take full responsibility for the content of this publication.

Conflicts of Interest

Author Longbing Hu was employed by the China United Heavy Duty Gas Turbine Technology Co., Ltd. The remaining authors declare that the research was conducted in the absence of any commercial or financial relationships that could be construed as a potential conflict of interest.

References

  1. Wang, W.; Yan, Y.; Zhou, Y.; Cui, J. Review of Advanced Effusive Cooling for Gas Turbine Blades. Energies 2022, 15, 8568. [Google Scholar] [CrossRef]
  2. Bunker, R.S. Gas Turbine Heat Transfer: Ten Remaining Hot Gas Path Challenges. J. Turbomach. 2006, 129, 193–201. [Google Scholar] [CrossRef]
  3. Xu, L.; Sun, Z.; Ruan, Q.; Xi, L.; Gao, J.; Li, Y. Development Trend of Cooling Technology for Turbine Blades at Super-High Temperature of above 2000 K. Energies 2023, 16, 668. [Google Scholar] [CrossRef]
  4. Han, J.-C.; Dutta, S.; Ekkad, S. Gas Turbine Heat Transfer and Cooling Technology; CRC Press: Boca Raton, FL, USA, 2012. [Google Scholar]
  5. Ligrani, P. Heat Transfer Augmentation Technologies for Internal Cooling of Turbine Components of Gas Turbine Engines. Int. J. Rotating Mach. 2013, 2013, 275653. [Google Scholar] [CrossRef]
  6. Osipov, S.; Rogalev, A.; Rogalev, N.; Shevchenko, I.; Vegera, A. Asymmetric Method of Heat Transfer Intensification in Radial Channels of Gas Turbine Blades. Inventions 2022, 7, 117. [Google Scholar] [CrossRef]
  7. Casarsa, L.; Arts, T. Experimental Investigation of the Aerothermal Performance of a High Blockage Rib-Roughened Cooling Channel. J. Turbomach. 2005, 127, 580–588. [Google Scholar] [CrossRef]
  8. Han, J.C.; Zhang, Y.M.; Lee, C.P. Augmented Heat Transfer in Square Channels with Parallel, Crossed, and V-Shaped Angled Ribs. J. Heat Transf. 1991, 113, 590–596. [Google Scholar] [CrossRef]
  9. Tanda, G. Heat transfer in rectangular channels with transverse and V-shaped broken ribs. Int. J. Heat Mass Transf. 2004, 47, 229–243. [Google Scholar] [CrossRef]
  10. Khalatov, A.A.; Dashevskyy, Y.Y.; Pysmennyi, D.M. Heat Transfer and Friction Factor in the Rib Roughened Blade Leading Edge Cooling Passage, Volume 5: Heat Transfer, Parts A and B, Vancouver, British Columbia, Canada, 2011; ASMEDC: Vancouver, BC, Canada, 2011; pp. 1193–1203. [Google Scholar]
  11. Wang, L.; Sundén, B. Experimental investigation of local heat transfer in a square duct with various-shaped ribs. Heat Mass Transf. 2006, 43, 759–766. [Google Scholar] [CrossRef]
  12. Montelpare, S.; Ricci, R. An experimental method for evaluating the heat transfer coefficient of liquid-cooled short pin fins using infrared thermography. Exp. Therm. Fluid Sci. 2004, 28, 815–824. [Google Scholar] [CrossRef]
  13. Zhu, H.; Xu, D. Heat Transfer and Pressure Drop of Short Pin-Fin Array with Different Diameter and Shape. J. Aerosp. Power 2002, 17, 246–249. [Google Scholar]
  14. Liu, L.; Zhu, X.; Liu, H.; Du, Z. Effect of Longitudinal Vortex Generator on Impingement Cooling over Leading Edge of a Gas Turbine Blade. J. Chin. Soc. Power Eng. 2018, 38, 719–724+762. [Google Scholar]
  15. Bai, W.; Liang, D.; Chen, W.; Chyu, M. Rib influence on heat transfer and pressure drop in pin-fin array. J. Aerosp. Power 2019, 34, 2509–2515. [Google Scholar]
  16. Chang, S.W.; Cheng, T.H. Thermal performance of channel flow with detached and attached pin-fins of hybrid shapes under inlet flow pulsation. Int. J. Heat Mass Transf. 2021, 164, 120554. [Google Scholar] [CrossRef]
  17. Afzal, A.; Chung, H.; Muralidhar, K.; Hee Cho, H. Neural-Network-Assisted Optimization of Rectangular Channels with Intersecting Ribs for Enhanced Thermal Performance. Heat Transf. Eng. 2019, 41, 1609–1625. [Google Scholar] [CrossRef]
  18. Darvish Damavandi, M.; Safikhani, H.; Yahyaabadi, M. Multi-objective optimization of asymmetric v-shaped ribs in a cooling channel using CFD, artificial neural networks and genetic algorithms. J. Braz. Soc. Mech. Sci. Eng. 2016, 39, 2319–2329. [Google Scholar] [CrossRef]
  19. Kumar, K.; Prajapati, D.R.; Samir, S. Heat transfer and friction factor correlations development for solar air heater duct artificially roughened with ‘S’ shape ribs. Exp. Therm. Fluid Sci. 2017, 82, 249–261. [Google Scholar] [CrossRef]
  20. Ma, Y.; Yan, H.; Hooman, K.; Xie, G. Enhanced heat transfer in a pyramidal lattice sandwich panel by introducing pin- fifins/protrusions/dimples. Int. J. Therm. Sci. 2020, 156, 106468. [Google Scholar] [CrossRef]
  21. Gutiérrez de Arcos, D.; Waidmann, C.; Poser, R.; von Wolfersdorf, J.; Göhring, M. Rotationally Induced Local Heat Transfer Features in a Two-Pass Cooling Channel: Experimental–Numerical Investigation. Int. J. Turbomach. Propuls. Power 2024, 9, 34. [Google Scholar] [CrossRef]
  22. Xu, C.; Zhang, P.; Rao, Y. Experiments and numerical analysis of turbulent heat transfer enhancement over oval-dimple arrays. J. Propuls. Technol. 2024, 45, 149–157. [Google Scholar]
  23. Ekkad, S.V.; Han, J.-C. A transient liquid crystal thermography technique for gas turbine heat transfer measurements. Meas. Sci. Technol. 2000, 11, 957–968. [Google Scholar] [CrossRef]
  24. Moffat, R.J. Describing the uncertainties in experimental results. Exp. Therm. Fluid Sci. 1988, 1, 3–17. [Google Scholar] [CrossRef]
  25. Ismail, B.C.; Urmila, G.H.I.A.; Patrick, J.R.; Christopher, J.F.; Hugh, C.; Raad, P.E. Procedure for Estimation and Reporting of Uncertainty Due to Discretization in CFD Applications. J. Fluids Eng. 2008, 130, 078001. [Google Scholar]
  26. ASME V&V 20-2009; Standard for Verification and Validation in Computational Fluid Dynamics and Heat Transfer. American Society of Mechanical Engineers: New York, NY, USA, 2009.
  27. Metzger, D.E.; Shepard, W.B.; Haley, S.W. Row Resolved Heat Transfer Variations in Pin-Fin Arrays Including Effects of Non-Uniform Arrays and Flow Convergence, Volume 4: Heat Transfer; Electric Power, Dusseldorf, West Germany, 1986; American Society of Mechanical Engineers: Dusseldorf, Germany, 1986. [Google Scholar]
  28. Kim, B.-C.; Chang, K. Assessment of hybrid RANS/LES models in heat and fluid flows around staggered pin-fin arrays. Energies 2020, 13, 3752. [Google Scholar] [CrossRef]
  29. Paniagua, L.; Lehmkuhl, O.; Oliet, C.; Pérez-Segarra, C.D. Large eddy simulations (LES) on the flow and heat transfer in a wall-bounded pin matrix. Numer. Heat Transf. Part B 2014, 65, 103–128. [Google Scholar] [CrossRef]
  30. Bauer, J.; Tyacke, J. Comparison of low Reynolds number turbulence and conjugate heat transfer modelling for pin-fin roughness elements. Appl. Math. Model. 2022, 103, 696–713. [Google Scholar] [CrossRef]
  31. Luan, Y.; Rao, Y.; Weigand, B. Experimental and numerical study of heat transfer and pressure loss in a multi-convergent swirl tube with tangential jets. Int. J. Heat Mass Transf. 2022, 190, 122797. [Google Scholar] [CrossRef]
Figure 1. Model diagrams under different geometric parameters.
Energies 18 03296 g001
Figure 2. Composition of the experimental system.
Energies 18 03296 g002
Figure 3. Computational zone and boundary conditions.
Energies 18 03296 g003
Figure 4. Grid independence check.
Energies 18 03296 g004
Figure 5. Comparison of Nu distribution on the endwall for Case 1 (Re = 30,000).
Energies 18 03296 g005
Figure 6. Flow performance under different Reynolds number conditions.
Energies 18 03296 g006aEnergies 18 03296 g006b
Figure 7. The distribution of the average Nu on the bottom endwall of different Cases (Re = 30,000).
Energies 18 03296 g007
Figure 8. Distribution of turbulence kinetic energy in different horizontal sections for different Cases (Re = 30,000).
Energies 18 03296 g008
Figure 9. Distribution of turbulence kinetic energy in different flow section for different Cases (Re = 30,000).
Energies 18 03296 g009
Figure 10. Distribution of velocity in different horizontal sections for different Cases (Re = 30,000).
Energies 18 03296 g010
Figure 11. Distribution of velocity in different flow sections for different Cases (Re = 30,000).
Energies 18 03296 g011
Table 1. The geometric parameters of all the objects.
StructureGeometric Parameter
Pin-FinsV-Ribs
D/mmH/mmLx/mmLy/mmh/mmw/mmlx/mmly/mmα/°
Case 18161818---------------
Case 281618181.61.636------
Case 381618181.61.6361.2760
Table 2. Average Nusselt number of the bottom endwall with different turbulence models.
Experiment ResultTurbulence Model
SST k-ωStandard k-ωRNG k-εLow k-ε
Re10,000
Nu52.5353.8156.5249.9651.67
Table 3. Comparison of classic equation and numerical results of Case 1.
StructureRe N u t o t a l ([27]) N u t o t a l (Num.)Deviation/%
Case 110,00058.9756.633.96
30,000125.84116.527.40
50,000179.02170.614.69
Table 4. Comparison of experimental and numerical results of Case 2.
Structure ReNu (Exp.)Nu (Num.)Deviation/% f (Exp.) f (Num.)Deviation/%
Case 210,00052.5353.812.440.090.091.03
30,000108.59111.522.700.080.083.13
50,000161.40164.331.820.080.083.74
Table 5. Comparison of total heat transfer characteristics for Case 2 and Case 3.
Re N u t o t a l N u t o t a l / N u 0 T P F t o t a l
Case 2Case 3Case 2Case 3Deviation/%Case 2Case 3Deviation/%
10,00070.2362.462.252.0012.441.601.4410.84
30,000143.41128.371.911.7111.721.261.177.67
50,000202.81186.231.801.658.901.161.096.90
Disclaimer/Publisher’s Note: The statements, opinions and data contained in all publications are solely those of the individual author(s) and contributor(s) and not of MDPI and/or the editor(s). MDPI and/or the editor(s) disclaim responsibility for any injury to people or property resulting from any ideas, methods, instructions or products referred to in the content.

