
An Analytical Study on the Correlations Between Natural Gas Pipeline Network Scheduling Decisions and External Environmental Factors


Abstract
1. Introduction
1.1. Background
1.2. Literature Review
2. Methodology
- (1)
- Select a specific region as the research subject;
- (2)
- Collect data on dispatch demand and factors that may have a potential correlation;
- (3)
- Test whether the values from each step follow a normal distribution;
- (4)
- Choose the appropriate correlation coefficient analysis method based on whether the dataset conforms to a normal distribution;
- (5)
- Identify the indicators with significant correlations.
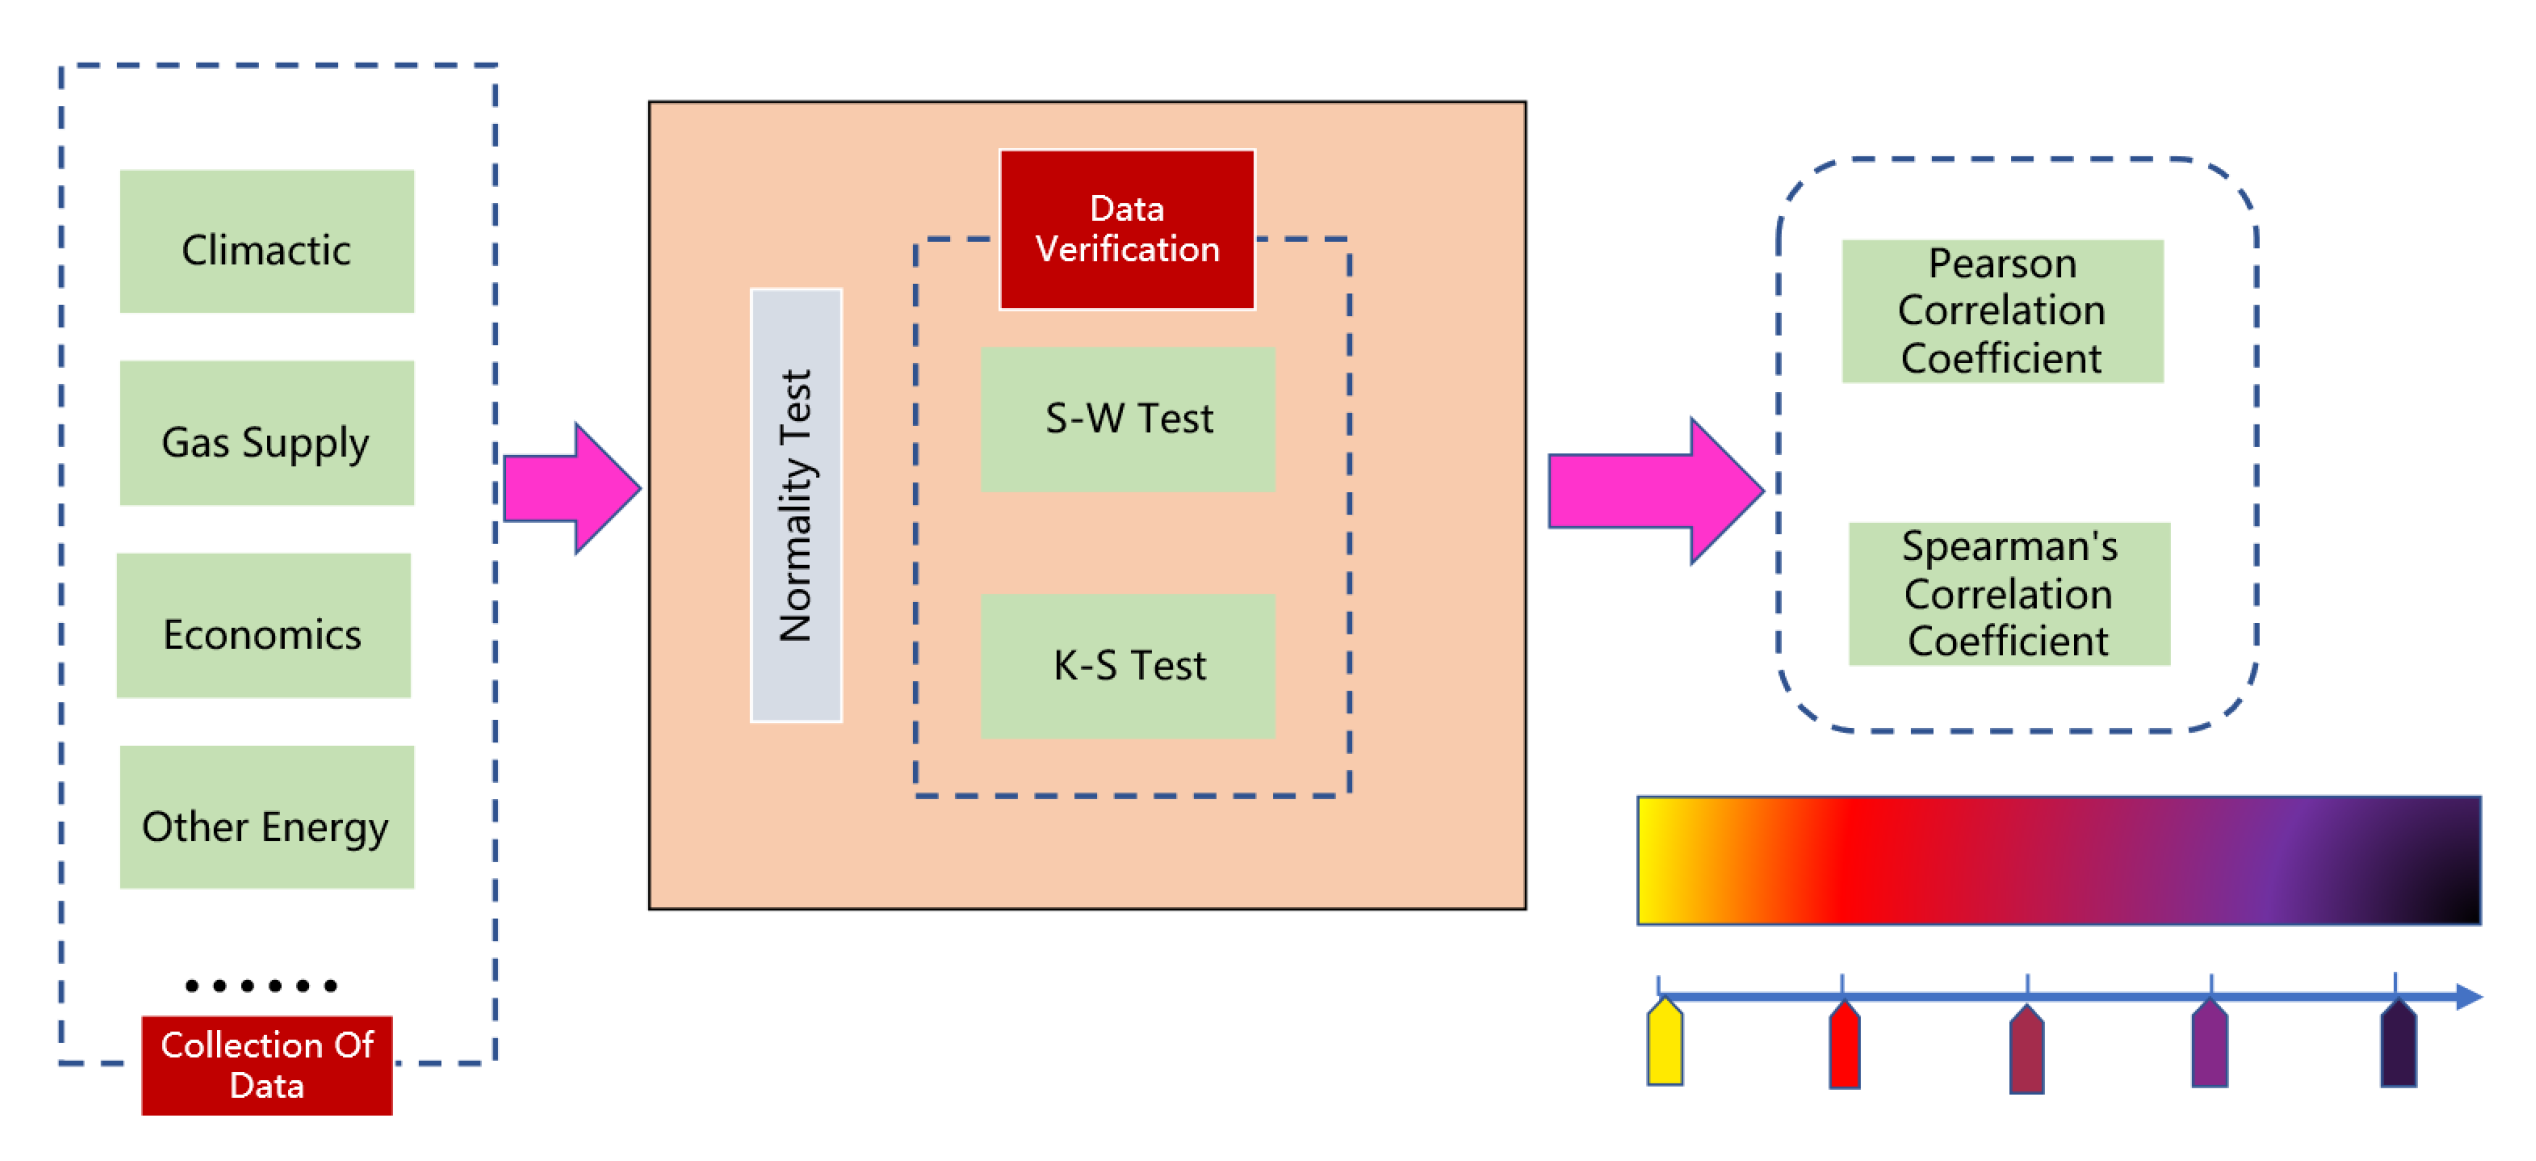
2.1. Normality Test
2.2. Pearson Correlation Coefficient
2.3. Spearman’s Correlation Coefficient
3. Case Studies
3.1. A Correlation Study of RA Temperature
3.1.1. RA Temperature Normality Test
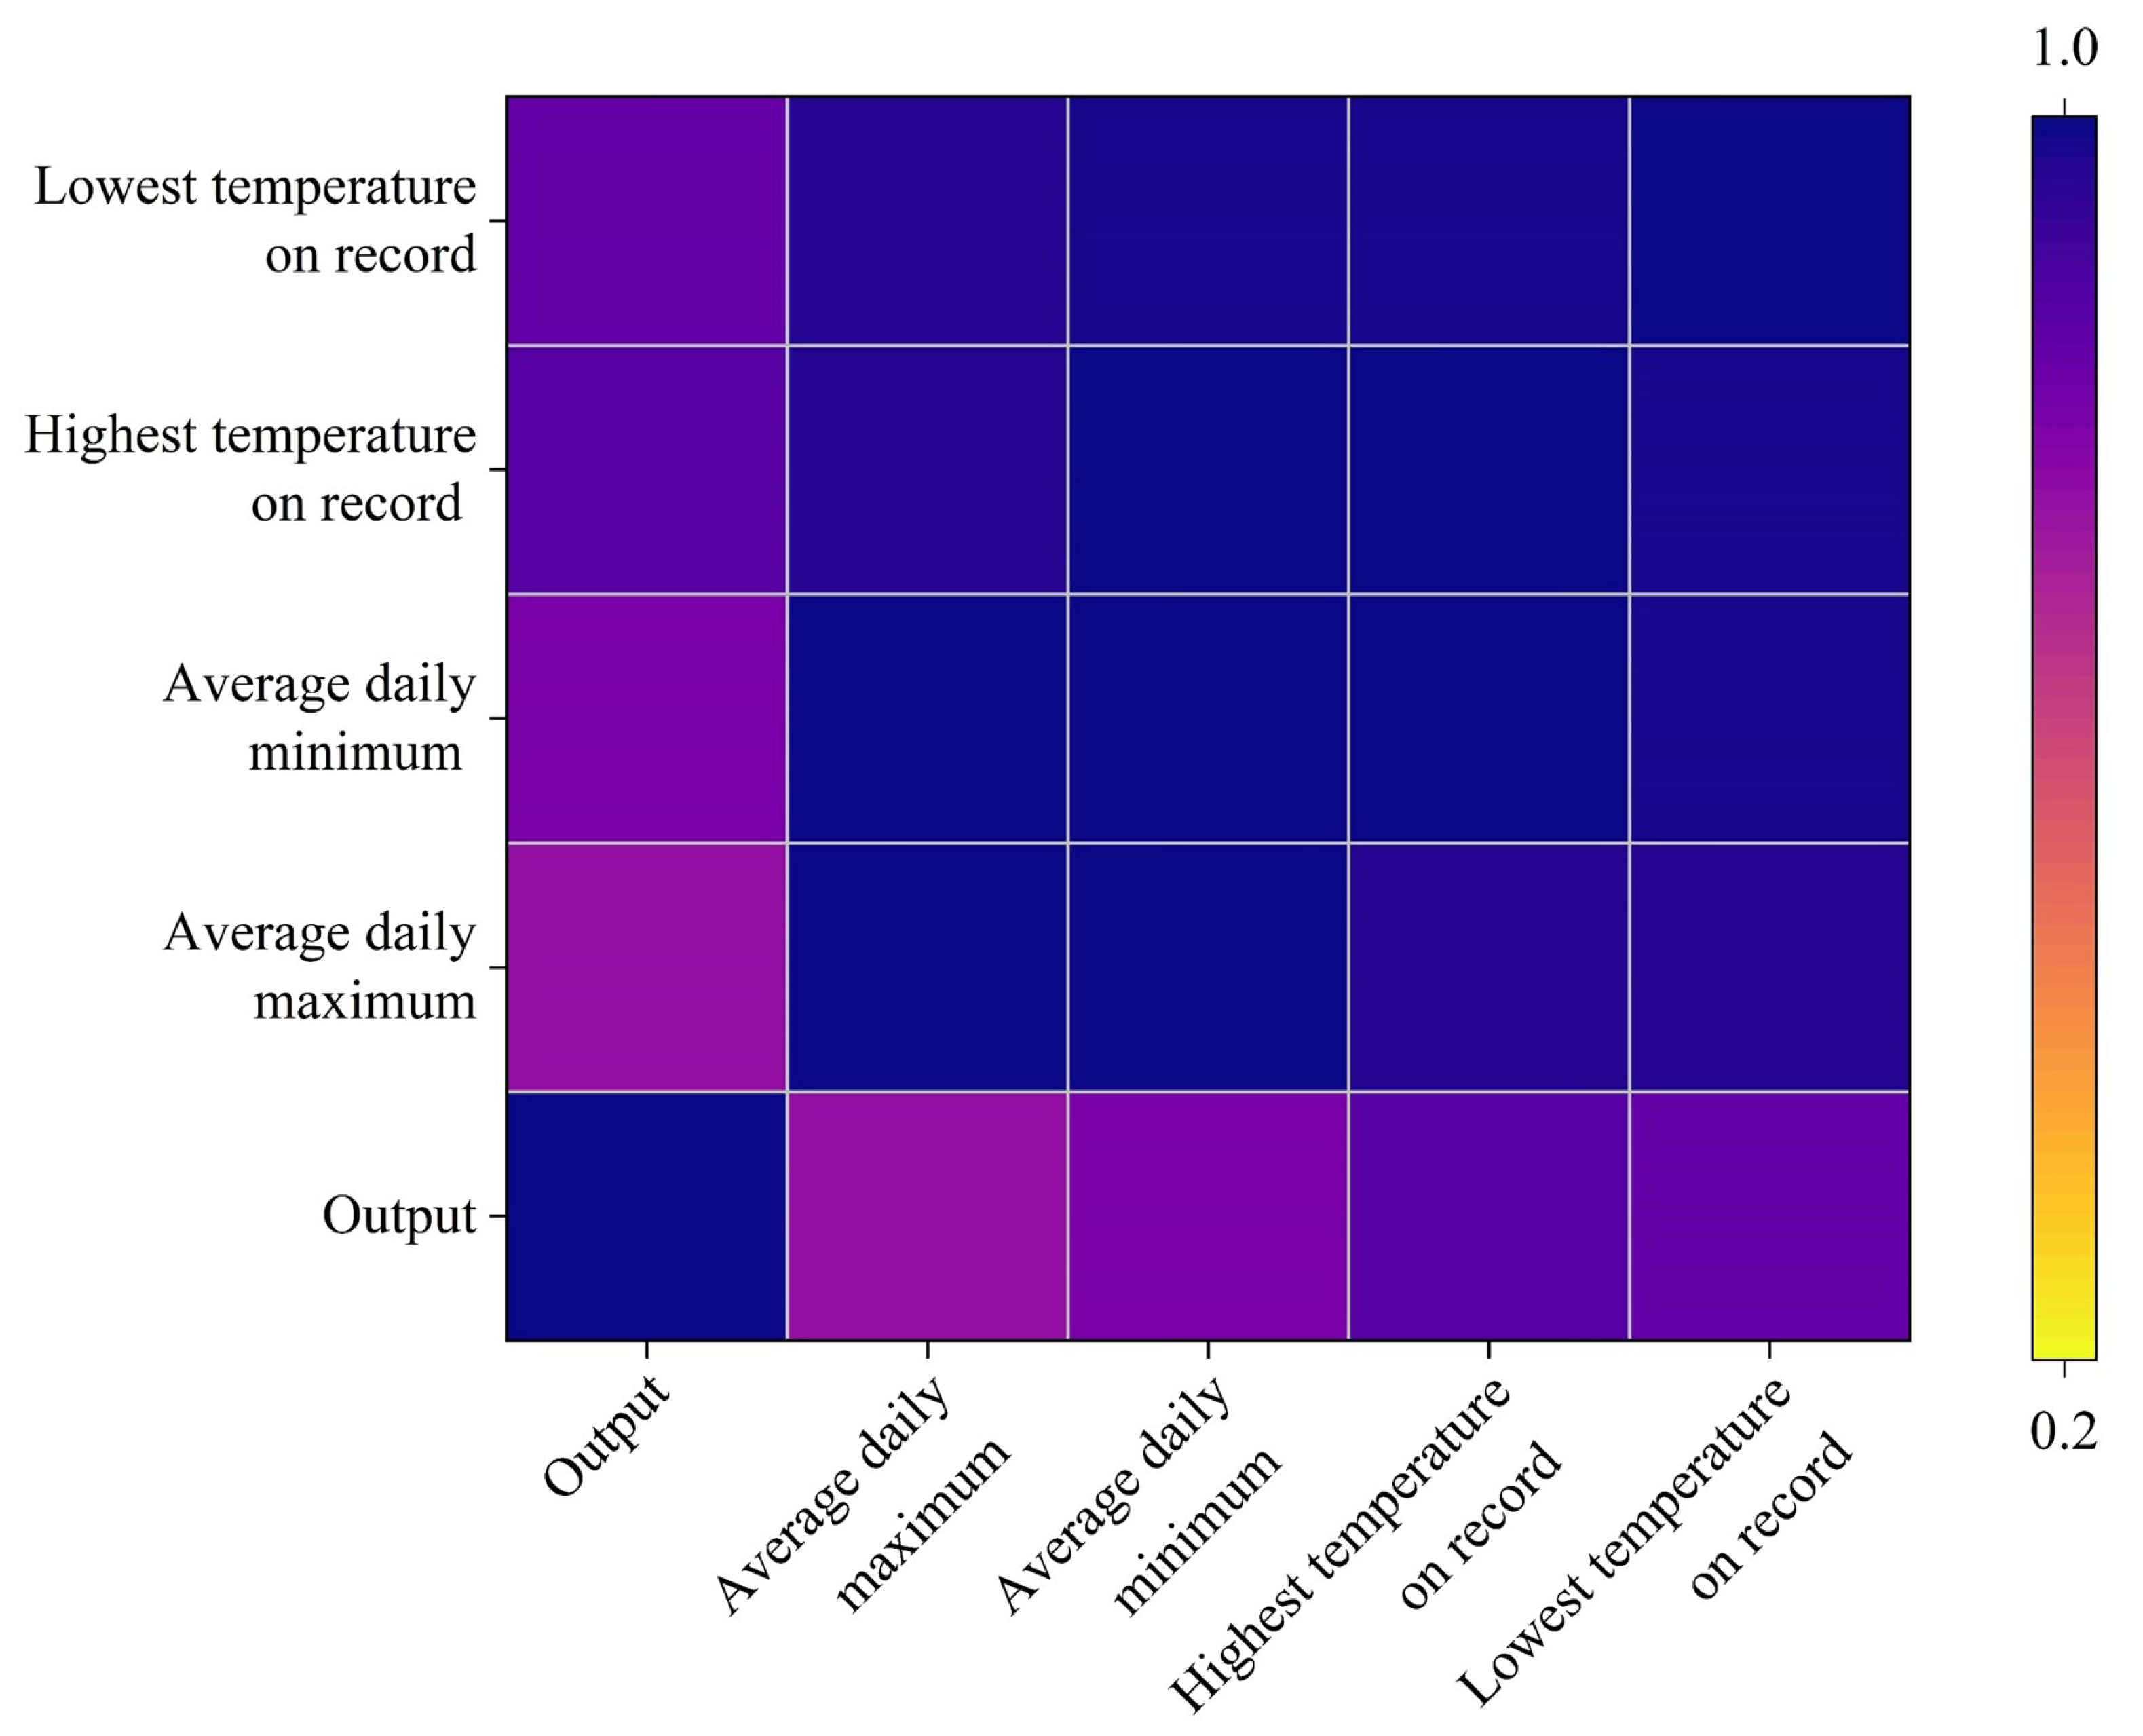
3.1.2. RA Temperature Pearson Correlation Analysis
3.2. A Correlation Study of Gas Supply to Pipeline Networks
3.2.1. Gas Supply Normality Test
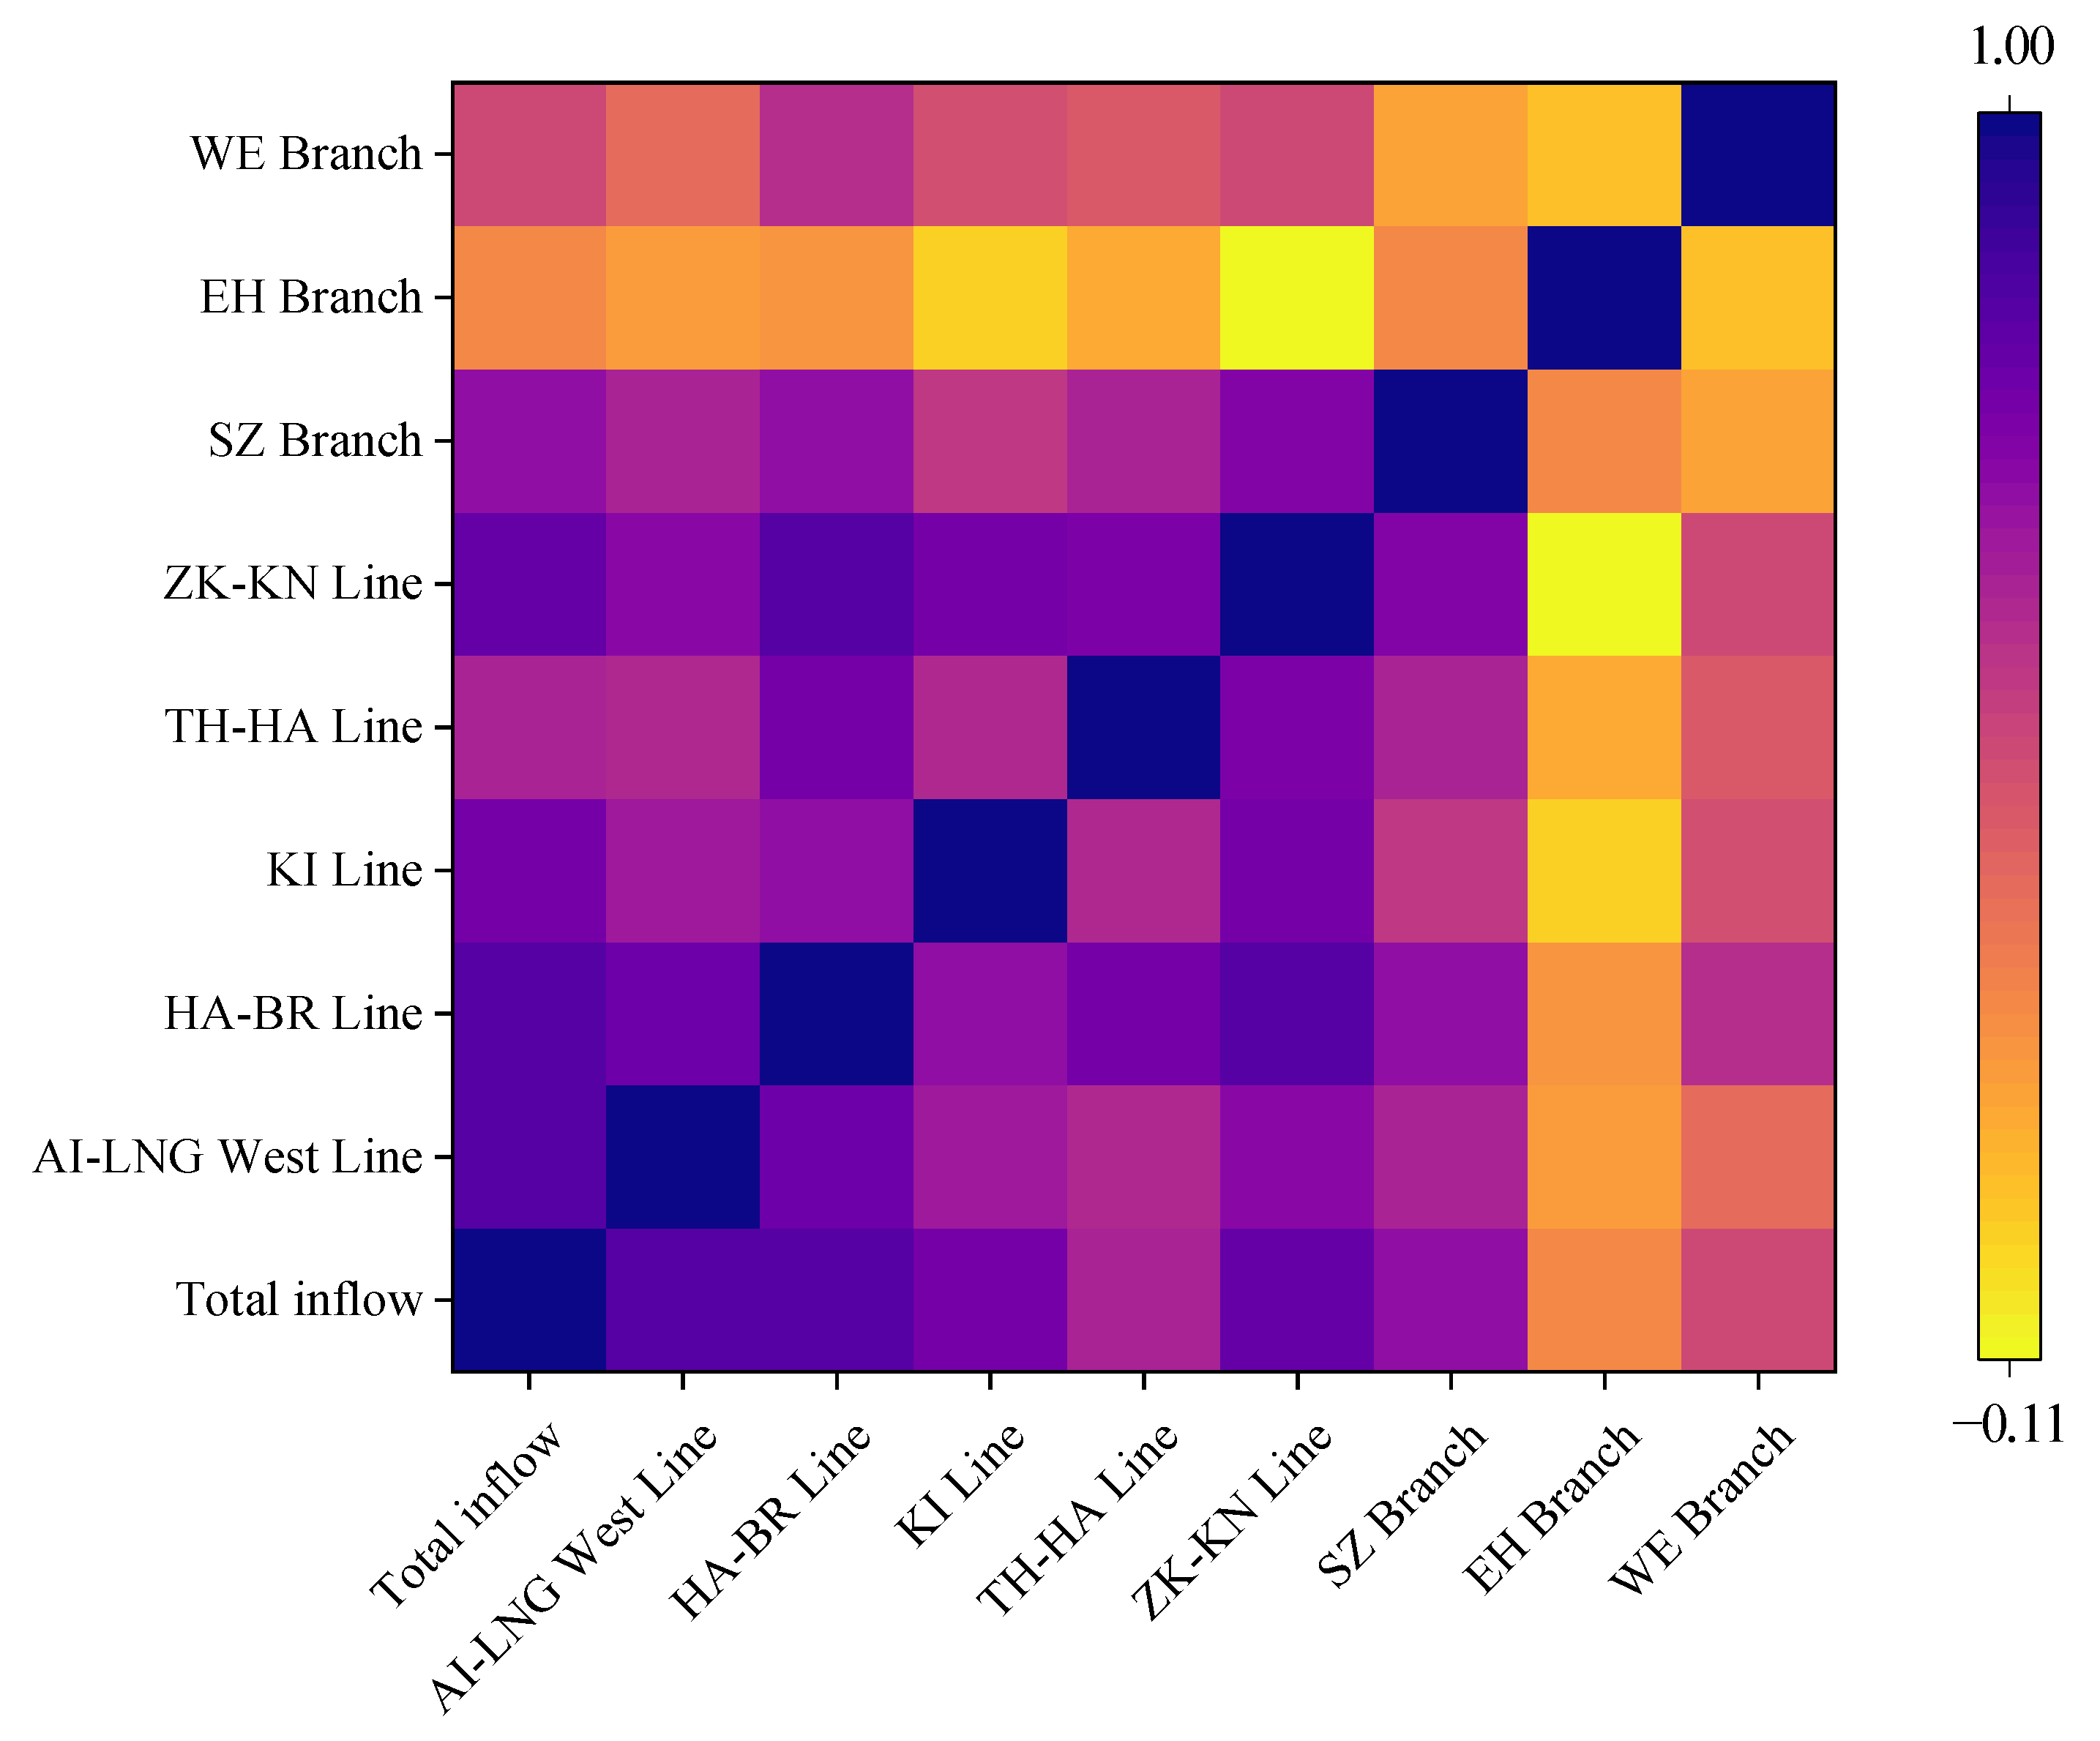
3.2.2. Gas Supply Spearman Correlation Analysis
3.3. Population-Economy Correlation Studies
3.3.1. Population-Economy Normality Test
3.3.2. Population-Economy Spearman Correlation Analysis
3.4. Correlation Studies of Energy Coupling
3.4.1. Energy Coupling Normality Test
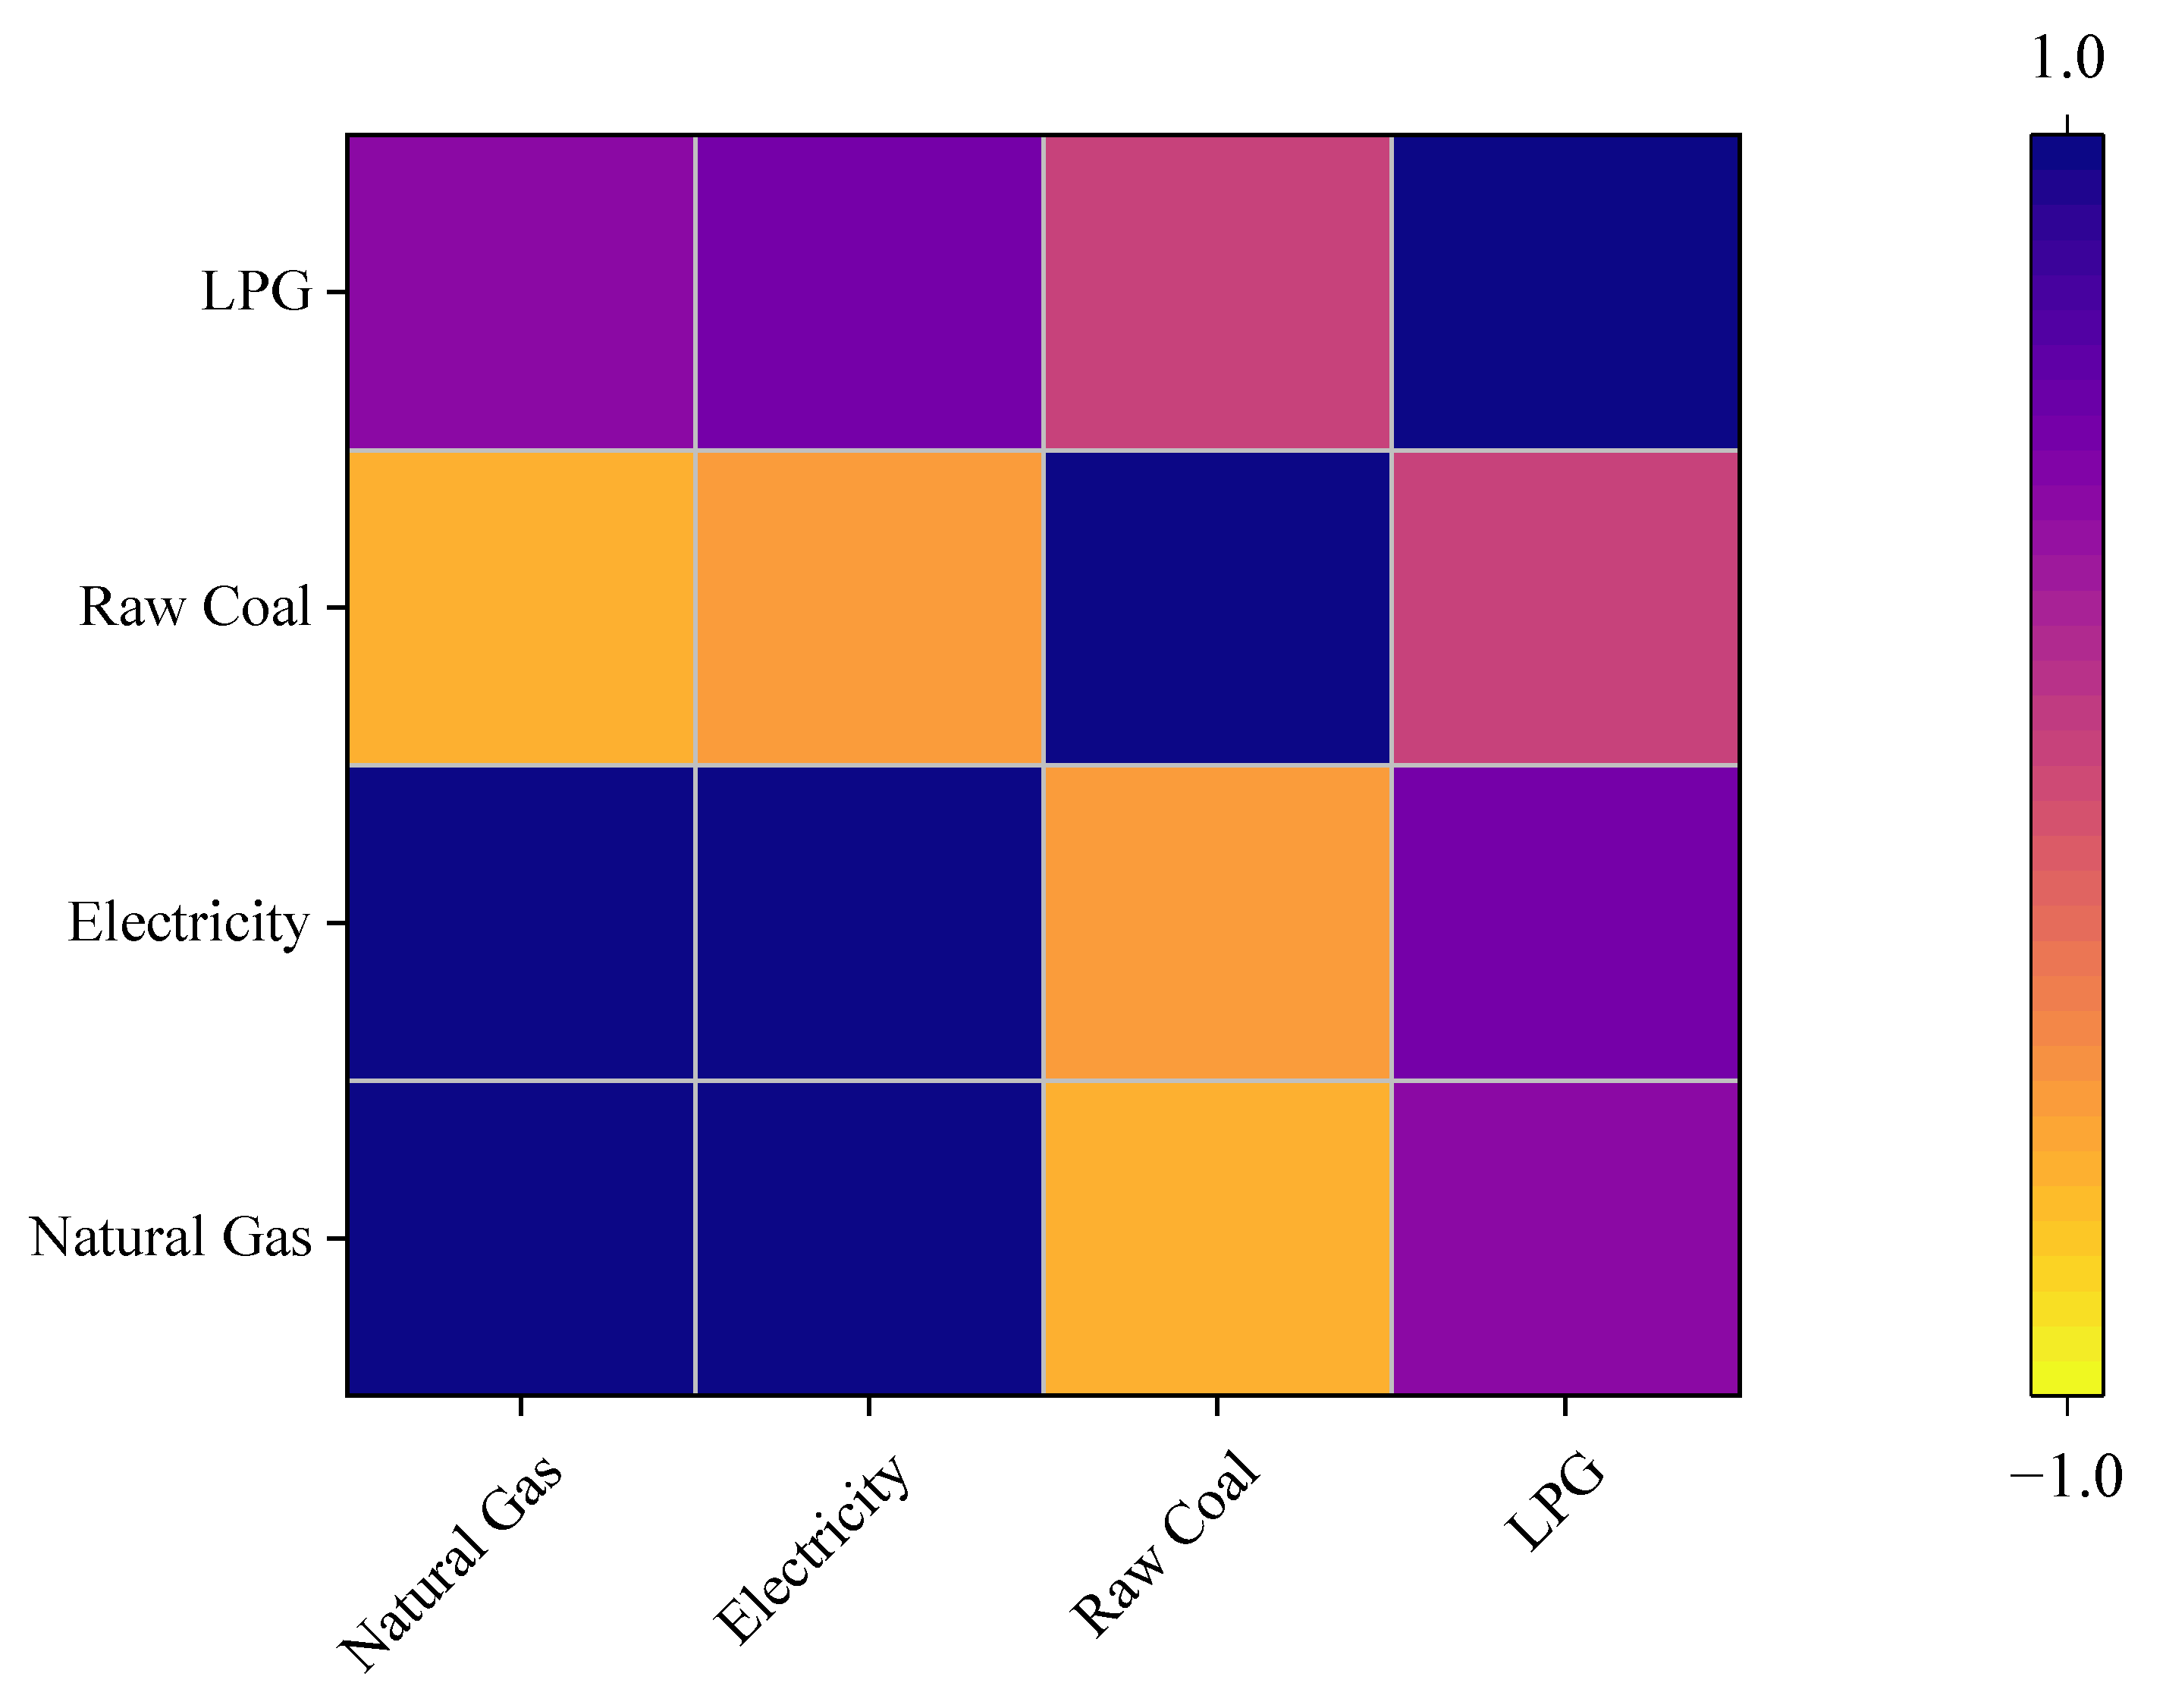
3.4.2. Energy Coupling Pearson Correlation Analysis
3.4.3. Spearman Correlation Analysis
4. Conclusions
- (1)
- Dynamic Dispatch Optimization: Operators can establish demand response models based on climate forecasts and macroeconomic indicators to dynamically adjust gas supply plans.
- (2)
- Multi-Energy Coordinated Management: In regions with peak electricity or coal consumption, special attention should be paid to the coupling relationship between natural gas and alternative energy sources to avoid short-term supply–demand imbalances caused by energy substitution effects.
- (3)
- Differentiated Infrastructure Planning: For areas with insufficient pipeline coverage but rapid demand growth, infrastructure improvements should be prioritized, while dispatch strategies should be aligned with local energy consumption patterns.
Author Contributions
Funding
Data Availability Statement
Conflicts of Interest
Nomenclature
| S-W | Shapiro–Wilk |
| GDP | Gross Domestic Product |
| LPG | Liquefied Petroleum Gas |
References
- Hong, B.; Wang, C.; Zhang, K.; Lim, J.S.; Varbanov, P.S.; Jia, X.; Ji, M.; Tao, H.; Li, Z.; Wang, B. Carbon Emission Pinch Analysis for Shipping Fuel Planning Considering Multiple Period and Fuel Conversion Rates. J. Clean. Prod. 2023, 415, 137759. [Google Scholar] [CrossRef]
- Liu, H.; Liu, Y.; Wang, C.; Song, Y.; Jiang, W.; Li, C.; Zhang, S.; Hong, B. Natural Gas Demand Forecasting Model Based on LASSO and Polynomial Models and Its Application: A Case Study of China. Energies 2023, 16, 4268. [Google Scholar] [CrossRef]
- Zhao, W.; Wang, B.; Pan, T.; Chen, Y.; Tao, H.; Guo, B.; Varbanov, P.S.; Lu, J. Optimization of Island Integrated Energy System based on Marine Renewable Energy. Fundam. Res. 2024, in press. [Google Scholar] [CrossRef]
- Energy Institute. Statistical Review of World Energy 2024. Available online: https://www.energyinst.org/statistical-review/home (accessed on 26 September 2024).
- Huang, Y.; Qin, G.; Yang, M.; Nogal, M. Dynamic Quantitative Assessment of Service Resilience for Long-Distance Energy Pipelines under Corrosion. Reliab. Eng. Syst. Saf. 2025, 256, 110792. [Google Scholar] [CrossRef]
- Wei, X.; Qiu, R.; Zhang, B.; Liu, C.; Wang, G.; Wang, B.; Liang, Y. Operation Optimization of Large-Scale Natural Gas Pipeline Networks Based on Intelligent Algorithm. Energy 2024, 310, 133258. [Google Scholar] [CrossRef]
- Wang, B.; Hao, H. Process Integration in Optimising the Oil and Gas Supply Chain. J. Sustain. Dev. Indic. 2025, 1, 1–20. [Google Scholar] [CrossRef]
- Peng, J.; Zhou, J.; Liang, G.; Li, C.; Qin, C. Multi-Period Integrated Scheduling Optimization of Complex Natural Gas Pipeline Network System with Underground Gas Storage to Ensure Economic and Environmental Benefits. Energy 2024, 302, 131837. [Google Scholar] [CrossRef]
- Özmen, A. Sparse Regression Modeling for Short- and Long-term Natural Gas Demand Prediction. Ann. Oper. Res. 2023, 322, 921–946. [Google Scholar] [CrossRef]
- Bazyar, A.; Zarrinpoor, N.; Safavian, A. Optimal Design of a Sustainable Natural Gas Supply Chain Network under Uncertainty. Chem. Eng. Res. Des. 2021, 176, 60–88. [Google Scholar] [CrossRef]
- Sesini, M.; Giarola, S.; Hawkes, A.D. Strategic Natural Gas Storage Coordination among EU Member States in Response to Disruption in the Trans Austria Gas Pipeline: A Stochastic Approach to Solidarity. Energy 2021, 235, 121426. [Google Scholar] [CrossRef]
- Oke, D.; Mukherjee, R.; Sengupta, D.; Majozi, T.; El-Halwagi, M. On the Optimization of Water-Energy Nexus in Shale Gas Network under Price Uncertainties. Energy 2020, 203, 117770. [Google Scholar] [CrossRef]
- Liu, Z.E.; Long, W.; Chen, Z.; Littlefield, J.; Jing, L.; Ren, B.; El-Houjeiri, H.M.; Qahtani, A.S.; Jabbar, M.Y.; Masnadi, M.S. A Novel Optimization Framework for Natural Gas Transportation Pipeline Networks Based on Deep Reinforcement Learning. Energy AI 2024, 18, 100434. [Google Scholar] [CrossRef]
- Peng, Y.; Qiu, R.; Zhao, W.; Zhang, F.; Liao, Q.; Liang, Y.; Fu, G.; Yang, Y. Efficient Energy Optimization of Large-Scale Natural Gas Pipeline Network: An Advanced Decomposition Optimization Strategy. Chem. Eng. Sci. 2025, 309, 121456. [Google Scholar] [CrossRef]
- Fan, L.; Su, H.; Wang, W.; Zio, E.; Zhang, L.; Yang, Z.; Peng, S.; Yu, W.; Zuo, L.; Zhang, J. A Systematic Method for the Optimization of Gas Supply Reliability in Natural Gas Pipeline Network Based on Bayesian Networks and Deep Reinforcement Learning. Reliab. Eng. Syst. Saf. 2022, 225, 108613. [Google Scholar] [CrossRef]
- Yan, Y.; Yan, J.; Liu, S.; Wang, Y.; Wang, B.; Han, S.; Yongqian, L. Review and Prospect on the Construction Method of Security Region for Integrated Natural Gas and Power Systems. Energy 2024, 307, 132543. [Google Scholar] [CrossRef]
- Huang, H.; Zhang, A.; Xu, X.; Li, Q.; Yang, W.; Qu, G. Optimal Scheduling of Bidirectional Coupled Electricity-Natural Gas Systems Based on Multi-Port Gas Network Equivalent Model. Int. J. Electr. Power Energy Syst. 2022, 139, 108049. [Google Scholar] [CrossRef]
- Yan, Y.; Wang, Y.; Yan, J.; Zhang, H.; Shang, W. Wind Electricity-hydrogen-Natural Gas Coupling: An Integrated Optimization Approach for Enhancing Wind Energy Accommodation and Carbon Reduction. Appl. Energy 2024, 369, 123482. [Google Scholar] [CrossRef]
- Messini, E.M.B.; Bourek, Y.; Ammari, C.; Pesyridis, A. The Integration of Solar-Hydrogen Hybrid Renewable Energy Systems in Oil and Gas Industries for Energy Efficiency: Optimal Sizing Using Fick’s Law Optimisation Algorithm. Energy Convers. Manag. 2024, 308, 118372. [Google Scholar] [CrossRef]
- Pearson, K. III. Contributions to the Mathematical Theory of Evolution. Proc. R. Soc. Lond. 1894, 54, 329–333. [Google Scholar] [CrossRef]
- Myers, J.L.; Well, A.D.; Lorch, R.F., Jr. Research Design and Statistical Analysis, 3rd ed.; Routledge: New York, NY, USA, 2010; ISBN 978-0-203-72663-1. [Google Scholar]
- Xu, L.; Wen, S.; Huang, H.; Tang, Y.; Wang, Y.; Pan, C. Corrosion Failure Prediction in Natural Gas Pipelines Using an Interpretable XGBoost Model: Insights and Applications. Energy 2025, 325, 136157. [Google Scholar] [CrossRef]
- Jia, J.; He, X.; Jin, Y. Statistics, 8th ed.; A series of textbooks on statistics for the 21st century; Renmin University Press: Beijing, China, 2021; ISBN 978-7-300-29310-3. [Google Scholar]
- Shapiro, S.S.; Wilk, M.B. An Analysis of Variance Test for Normality (Complete Samples). Biometrika 1965, 52, 591–611. [Google Scholar] [CrossRef]
- de Souza, R.R.; Toebe, M.; Mello, A.C.; Bittencourt, K.C. Sample Size and Shapiro-Wilk Test: An Analysis for Soybean Grain Yield. Eur. J. Agron. 2023, 142, 126666. [Google Scholar] [CrossRef]
- Razali, N.M.; Wah, Y.B. Power Comparisons of Shapiro-Wilk, Kolmogorov-Smirnov, Lilliefors and Anderson-Darling Tests. J. Stat. Model. Anal. 2011, 2, 21–33. [Google Scholar]
- Zhou, H.; Deng, Z.; Xia, Y.; Fu, M. A New Sampling Method in Particle Filter Based on Pearson Correlation Coefficient. Neurocomputing 2016, 216, 208–215. [Google Scholar] [CrossRef]
- Gong, H.; Li, Y.; Zhang, J.; Zhang, B.; Wang, X. A New Filter Feature Selection Algorithm for Classification Task by Ensembling Pearson Correlation Coefficient and Mutual Information. Eng. Appl. Artif. Intell. 2024, 131, 107865. [Google Scholar] [CrossRef]
- Jiang, J.; Zhang, X.; Yuan, Z. Feature Selection for Classification with Spearman’s Rank Correlation Coefficient-Based Self-Information in Divergence-Based Fuzzy Rough Sets. Expert Syst. Appl. 2024, 249, 123633. [Google Scholar] [CrossRef]
- Yan, S.; Peng, M.; Wu, L.; Xiong, P. A Novel Structural Adaptive Seasonal Grey Bernoulli Model in Natural Gas Production Forecasting. Eng. Appl. Artif. Intell. 2025, 148, 110407. [Google Scholar] [CrossRef]
- Zhang, J.; Shen, C.; Qin, Y.; Chen, J. Forecasting of Natural Gas Based on a Novel Discrete Grey Seasonal Prediction Model with a Time Power Term. Energy Strategy Rev. 2025, 58, 101677. [Google Scholar] [CrossRef]
- December Weather in Qinzhou, Guangxi _Qinzhou December Weather_Qinzhou December Weather Temperature_Qinzhou December Average Weather Temperature, Temperature_Weather.com. Available online: https://www.tianqi.com/qiwen/city-qinzhou-12/ (accessed on 7 April 2024).
- Zhao, Z.; Yang, Z.; Su, H.; Faber, M.H.; Zhang, J. A Methodology of Natural Gas Pipeline Network System Supply Resilience Optimization: Based on Demand-Side and Data Science-Driven Approach. Reliab. Eng. Syst. Saf. 2025, 261, 111071. [Google Scholar] [CrossRef]
- Xu, G.; Chen, Y.; Yang, M.; Li, S.; Marma, K.J.S. An Outlook Analysis on China’s Natural Gas Consumption Forecast by 2035: Applying a Seasonal Forecasting Method. Energy 2023, 284, 128602. [Google Scholar] [CrossRef]
- China Statistical Information Network—China Statistical Yearbook 2023. Available online: http://www.tjcn.org/ (accessed on 11 April 2024).
- Kou, Y.; Bie, Z.; Li, G.; Liu, F.; Jiang, J. Reliability Evaluation of Multi-Agent Integrated Energy Systems with Fully Distributed Communication. Energy 2021, 224, 120123. [Google Scholar] [CrossRef]
- Li, H.; Liu, H.; Ma, J.; Wang, J. Robust Stochastic Optimal Dispatching of Integrated Electricity-Gas-Heat System Considering Generation-Network-Load Uncertainties. Int. J. Electr. Power Energy Syst. 2024, 157, 109868. [Google Scholar] [CrossRef]
- Shabanian-Poodeh, M.; Hooshmand, R.-A.; Shafie-khah, M. Reliability-Constrained Configuration Optimization for Integrated Power and Natural Gas Energy Systems: A Stochastic Approach. Reliab. Eng. Syst. Saf. 2025, 254, 110600. [Google Scholar] [CrossRef]
- Chyou, Y.-P.; Chiu, H.-M.; Chen, P.-C.; Chien, H.-Y.; Wang, T. Coal-Derived Synthetic Natural Gas as an Alternative Energy Carrier for Application to Produce Power—Comparison of Integrated vs. Non-Integrated Processes. Energy 2023, 282, 128958. [Google Scholar] [CrossRef]
- Liu, H.; Liu, Y.; Yang, J.; Men, Z.; Wang, C. Forecast of Natural Gas Consumption in Jiangsu Province Based on Combination Forecast. Proc. SPIE 2023, 12642, 1264208. [Google Scholar] [CrossRef]
- Statistical Bureau of Jiangsu Province. Available online: https://tj.jiangsu.gov.cn/ (accessed on 11 May 2024).


| The Absolute Value of Correlation Coefficient | Interpretation |
|---|---|
| 0.8–1.0 | Highly correlated |
| 0.5–0.8 | Moderately correlated |
| 0.3–0.5 | Lowly correlated |
| 0–0.3 | Very weakly correlated or uncorrelated |
| Months | Average Daily Maximum Temperature/°C | Average Daily Minimum Temperature/°C | Highest Temperature on Record/°C | Lowest Temperature on Record/°C | Average Gas Output from Branch Lines/105 m3 |
|---|---|---|---|---|---|
| Nov. | 26 | 19 | 31 | 9 | 121.73 |
| Dec. | 20 | 13 | 28 | 4 | 116.64 |
| Jan. | 18 | 12 | 28 | 3 | 121.85 |
| Feb. | 19 | 13 | 29 | 5 | 131.62 |
| Mar. | 23 | 17 | 31 | 9 | 134.80 |
| Apr. | 28 | 22 | 33 | 12 | 147.39 |
| May. | 32 | 26 | 35 | 19 | 149.83 |
| Variable Name | Sample Size | Median | Average Value | Standard Deviation | Skewness | Kurtosis | S-W Test |
|---|---|---|---|---|---|---|---|
| Average daily maximum temperature/°C | 7 | 23 | 23.714 | 5.187 | 0.529 | −0.998 | 0.937 (0.610) |
| Average daily minimum temperature/°C | 7 | 17 | 17.429 | 5.255 | 0.636 | −0.825 | 0.913 (0.414) |
| Highest temperature on record/°C | 7 | 31 | 30.714 | 2.628 | 0.587 | −0.683 | 0.916 (0.436) |
| Lowest temperature on record/°C | 7 | 9 | 8.714 | 5.559 | 1.061 | 0.981 | 0.906 (0.366) |
| Average gas output from branch lines/105 m3 | 7 | 131.621 | 131.98 | 12.956 | 0.391 | −1.509 | 0.911 (0.400) |
| Variable Name | Average Gas Output from Branch Lines/105 m3 | Average Daily Maximum Temperature/°C | Average Daily Minimum Temperature/°C | Highest Temperature on Record/°C | Lowest Temperature on Record/°C |
|---|---|---|---|---|---|
| Average gas output from branch lines/105 m3 | 1 (0.000 ***) | ||||
| Average daily maximum temperature/°C | 0.756 (0.049 **) | 1 (0.000 ***) | |||
| Average daily minimum temperature/°C | 0.809 (0.027 **) | 0.996 (0.000 ***) | 1 (0.000 ***) | ||
| Highest temperature on record/°C | 0.878 (0.009 ***) | 0.971 (0.000 ***) | 0.988 (0.000 ***) | 1 (0.000 ***) | |
| Lowest temperature on record/°C | 0.841 (0.018 **) | 0.968 (0.000 ***) | 0.98 (0.000 ***) | 0.986 (0.000 ***) | 1 (0.000 ***) |
| Variable Name | Sample Size | Median | Average Value | Standard Deviation | Skewness | Kurtosis | S-W Test |
|---|---|---|---|---|---|---|---|
| Total gas inflow/105 m3 | 100 | 3528.46 | 3360.16 | 669.262 | −0.791 | −0.093 | 0.932 (0.000 ***) |
| AI-LNG West Line/105 m3 | 100 | 670.728 | 615.277 | 219.125 | −0.571 | −0.857 | 0.925 (0.000 ***) |
| HA-BR Line/105 m3 | 100 | 582.085 | 530.446 | 254.237 | −0.282 | −0.925 | 0.953 (0.001 ***) |
| KI Line/105 m3 | 100 | 386.693 | 395.011 | 71.952 | 0.397 | 0.171 | 0.978 (0.091 *) |
| TH-HA Line/105 m3 | 100 | 9.291 | 8.446 | 2.297 | −0.227 | −1.095 | 0.939 (0.000 ***) |
| SZ Branch/105 m3 | 100 | 54.038 | 47.563 | 16.033 | −0.769 | −0.83 | 0.869 (0.000 ***) |
| ZK-KN Line/105 m3 | 100 | 80.485 | 65.262 | 33.368 | −0.151 | −1.717 | 0.847 (0.000 ***) |
| EH Branch/105 m3 | 100 | 78.919 | 86.636 | 50.243 | 0.753 | 0.445 | 0.951 (0.001 ***) |
| WE Branch/105 m3 | 100 | 148.38 | 157.053 | 23.039 | 2.202 | 4.435 | 0.704 (0.000 ***) |
| Variable Name | Total Gas Inflow/105 m3 | AI-LNG West Line/105 m3 | HA-BR Line/105 m3 | KI Line/105 m3 | TH-HA Line/105 m3 | SZ Branch/105 m3 | ZK-KN Line/105 m3 | EH Branch/105 m3 | WE Branch/105 m3 |
|---|---|---|---|---|---|---|---|---|---|
| Total gas inflow/105 m3 | 1 (0.000 ***) | ||||||||
| AI-LNG West Line/105 m3 | 0.82 (0.000 ***) | 1 (0.000 ***) | |||||||
| HA-BR Line/105 m3 | 0.83 (0.000 ***) | 0.763 (0.000 ***) | 1 (0.000 ***) | ||||||
| KI Line/105 m3 | 0.746 (0.000 ***) | 0.618 (0.000 ***) | 0.665 (0.000 ***) | 1 (0.000 ***) | |||||
| TH-HA Line/105 m3 | 0.576 (0.000 ***) | 0.568 (0.000 ***) | 0.75 (0.000 ***) | 0.549 (0.000 ***) | 1 (0.000 ***) | ||||
| SZ Branch/105 m3 | 0.78 (0.000 ***) | 0.68 (0.000 ***) | 0.826 (0.000 ***) | 0.744 (0.000 ***) | 0.713 (0.000 ***) | 1 (0.000 ***) | |||
| ZK-KN Line/105 m3 | 0.663 (0.000 ***) | 0.575 (0.000 ***) | 0.664 (0.000 ***) | 0.501 (0.000 ***) | 0.581 (0.000 ***) | 0.702 (0.000 ***) | 1 (0.000 ***) | ||
| EH Branch/105 m3 | 0.201 (0.045 **) | 0.155 (0.124) | 0.166 (0.099 *) | −0.002 (0.988) | 0.11 (0.275) | −0.107 (0.290) | 0.199 (0.047 **) | 1 (0.000 ***) | |
| WE Branch/105 m3 | 0.434 (0.000 ***) | 0.321 (0.001 ***) | 0.541 (0.000 ***) | 0.417 (0.000 ***) | 0.373 (0.000 ***) | 0.425 (0.000 ***) | 0.126 (0.213) | 0.045 (0.656) | 1 (0.000 ***) |
| Variable Name | YX Branch/105 m3 | LJ Branch 105 m3 | DJ Branch/105 m3 | GL Branch/105 m3 | RA Branch/105 m3 | HC Branch/105 m3 | FCG Branch/105 m3 | YL Branch/105 m3 |
|---|---|---|---|---|---|---|---|---|
| Output/105 m3 | 10,574 | 664 | 2268 | 2420 | 4010 | 94 | 2077 | 1033 |
| GDP/ Billions CNY | 2521 | 620 | 241 | 2436 | 1917 | 1136 | 968 | 2167 |
| Resident population/104 | 224 | 125 | 50 | 496 | 332 | 341 | 106 | 582 |
| GDP per capita/CNY | 112,527 | 49,608 | 48,093 | 49,145 | 57,774 | 33,304 | 91,406 | 37,222 |
| Variable Name | Variable Name | Sample Size | Median | Average Value | Standard Deviation | Skewness | Kurtosis |
|---|---|---|---|---|---|---|---|
| Output/105 m3 | 8 | 2172.488 | 2892.585 | 3333.413 | 2.131 | 5.045 | 0.753 (0.009 ***) |
| GDP/ Billions CNY | 8 | 1526.27 | 1500.679 | 871.121 | −0.183 | −1.749 | 0.918 (0.411) |
| Resident population/104 | 8 | 277.905 | 281.962 | 190.705 | 0.417 | −1.087 | 0.94 (0.611) |
| GDP per capita/CNY | 8 | 49,376.262 | 59,884.909 | 27,643.986 | 1.288 | 0.662 | 0.834 (0.065 *) |
| Variable Name | Output/105 m3 | GDP/Billions CNY | Resident Population/104 | GDP Per Capita/CNY |
|---|---|---|---|---|
| Output/105 m3 | 1 (0.000 ***) | |||
| GDP/Billions CNY | 0.524 (0.183) | 1 (0.000 ***) | ||
| Resident population/104 | −0.095 (0.823) | 0.69 (0.058 *) | 1 (0.000 ***) | |
| GDP per capita/CNY | 0.667 (0.071 *) | 0.238 (0.570) | −0.429 (0.289) | 1 (0.000 ***) |
| Year | Natural Gas/Billion m3 | Electricity/GWh | Raw Coal/10 kt | Crude Oil/10 kt | LPG/10 kt |
|---|---|---|---|---|---|
| 2012 | 1124.3 | 4580.9 | 24,627.54 | 2942.17 | 33.39 |
| 2013 | 1237.8 | 4956.62 | 25,927.4 | 3382.97 | 41.86 |
| 2014 | 1268.4 | 5012.54 | 25,646.36 | 3498.79 | 34.19 |
| 2015 | 1627 | 5114.7 | 24,601.86 | 3810.32 | 33.85 |
| 2016 | 1698 | 5458.95 | 25,775.42 | 4078.99 | 47.51 |
| 2017 | 2335 | 5807.89 | 24,364.76 | 3866.06 | 35.4 |
| 2018 | 2697 | 6128.27 | 24,215.3 | 4067.87 | 35.97 |
| 2019 | 2819.6 | 6264 | 23,297.55 | 4120.2 | 45.25 |
| 2020 | 2733.2 | 6374 | 22,716.88 | 4017.88 | 40.46 |
| 2021 | 3137 | 7101.2 | 24,949.03 | 4019.99 | 45.79 |
| Variable Name | Sample Size | Median | Average Value | Standard Deviation | Skewness | Kurtosis | S-W Test |
|---|---|---|---|---|---|---|---|
| Natural Gas/Billion m3 | 10 | 2016.5 | 2067.73 | 757.747 | 0.049 | −1.879 | 0.891 (0.175) |
| Electricity/GWh | 10 | 5633.42 | 5679.907 | 789.165 | 0.368 | −0.679 | 0.959 (0.779) |
| Raw Coal/10 kt | 10 | 24,614.7 | 24,612.21 | 1043.787 | −0.509 | −0.313 | 0.94 (0.557) |
| Crude Oil/10 kt | 10 | 3941.97 | 3780.524 | 387.18 | −1.333 | 1.098 | 0.831 (0.034 **) |
| LPG/10 kt | 10 | 38.215 | 39.367 | 5.475 | 0.341 | −1.756 | 0.876 (0.117) |
| Variable Name | Natural Gas/Billion m3 | Electricity/GWh | Raw Coal/10 kt | LPG/10 kt |
|---|---|---|---|---|
| Natural Gas/Billion m3 | 1 (0.000 ***) | |||
| Electricity/GWh | 0.973 (0.000 ***) | 1 (0.000 ***) | ||
| Raw Coal/10 kt | −0.641 (0.046 **) | −0.502 (0.139) | 1 (0.000 ***) | |
| LPG/10 kt | 0.427 (0.218) | 0.536 (0.111) | 0.04 (0.913) | 1 (0.000 ***) |
| Variable Name | Natural Gas/Billion m3 | Crude Oil/10 kt |
|---|---|---|
| Natural Gas/Billion m3 | 1 (0.000 ***) | |
| Crude Oil/10 kt | 0.806 (0.005 ***) | 1 (0.000 ***) |
Disclaimer/Publisher’s Note: The statements, opinions and data contained in all publications are solely those of the individual author(s) and contributor(s) and not of MDPI and/or the editor(s). MDPI and/or the editor(s) disclaim responsibility for any injury to people or property resulting from any ideas, methods, instructions or products referred to in the content. |
© 2025 by the authors. Licensee MDPI, Basel, Switzerland. This article is an open access article distributed under the terms and conditions of the Creative Commons Attribution (CC BY) license (https://creativecommons.org/licenses/by/4.0/).
Share and Cite
Wang, C.; Wang, B.; Jia, N.; Zhao, W.; Xu, N.; Wang, B. An Analytical Study on the Correlations Between Natural Gas Pipeline Network Scheduling Decisions and External Environmental Factors. Energies 2025, 18, 3274. https://doi.org/10.3390/en18133274
Wang C, Wang B, Jia N, Zhao W, Xu N, Wang B. An Analytical Study on the Correlations Between Natural Gas Pipeline Network Scheduling Decisions and External Environmental Factors. Energies. 2025; 18(13):3274. https://doi.org/10.3390/en18133274
Chicago/Turabian StyleWang, Changhao, Bohong Wang, Ning Jia, Wen Zhao, Ning Xu, and Bosen Wang. 2025. "An Analytical Study on the Correlations Between Natural Gas Pipeline Network Scheduling Decisions and External Environmental Factors" Energies 18, no. 13: 3274. https://doi.org/10.3390/en18133274
APA StyleWang, C., Wang, B., Jia, N., Zhao, W., Xu, N., & Wang, B. (2025). An Analytical Study on the Correlations Between Natural Gas Pipeline Network Scheduling Decisions and External Environmental Factors. Energies, 18(13), 3274. https://doi.org/10.3390/en18133274