1. Introduction
The challenges posed by energy and environmental issues significantly impact the sustainable development of human society. The extensive use of fossil fuels is recognized as one of the primary contributors to climate change, primarily due to greenhouse gas emissions [
1]. To achieve the goals of peak carbon emissions and carbon neutrality, it is essential to establish a clean, low-carbon, safe, and efficient energy system. China has explicitly identified hydrogen energy as a strategic emerging industry, emphasizing its role as a key focus for developing a green, low-carbon industrial system and facilitating industrial transformation and upgrading [
2,
3]. Compared to traditional fossil energy sources, hydrogen energy offers the advantage of a high energy density, making it potentially one of the most important secondary energy sources in the future. It is crucial for achieving net-zero emissions and controlling global warming [
4]. In the context of carbon emissions during the hydrogen production process, hydrogen is typically categorized into grey hydrogen and green hydrogen. Grey hydrogen is produced through the combustion of fossil fuels such as oil, natural gas, and coal, emitting carbon dioxide and other pollutants during the process. Blue hydrogen is produced by steam methane reforming or self-heating steam reforming of natural gas. Although natural gas is a fossil fuel and produces greenhouse gases during the production of blue hydrogen, advanced technologies like carbon capture, utilization, and storage capture greenhouse gases and reduce their impact. On the other hand, green hydrogen is produced using renewable energy sources, such as solar, wind, and nuclear power. For instance, it is generated by electrolyzing water using electricity derived from renewable energy sources. During the production of green hydrogen, there are no carbon emissions [
5]. Among these categories, green hydrogen aligns with the requirements of low-carbon development, and electrolytic water hydrogen using renewable energy is anticipated to become a mainstream technological approach [
6].
Solar energy is a rich source of renewable energy; however, it exhibits significant fluctuations and uncertainties, especially when large-scale photovoltaic power generation is integrated into the grid. This poses substantial challenges to the stability and reliability of the power system. The integration with energy storage systems can reduce the complexities arising from the intermittent nature of renewable energy systems [
7,
8]. Utilizing hydrogen as an energy storage medium allows for large-scale, long-term, and efficient energy storage. Nevertheless, the process of electrolytic water and hydrogen production requires a considerable amount of electricity [
9]. Therefore, research on solar-driven hydrogen production systems has become one of the current hot topics in research.
Since the concept of the photoelectrolysis of water was first proposed by A. Fujishima et al. [
10], significant strides have been made in the field. Building on this foundation, Metin et al. [
11] designed and experimentally tested a photovoltaic/thermal (PV/T) water electrolysis system. This innovative system harnesses solar energy to concurrently generate hydrogen, electricity, and hot water, showcasing the potential for multifaceted energy production. However, early photovoltaic electrolysis systems for hydrogen production were generally inefficient, with efficiencies typically ranging from 2% to 6%. To address this, researchers have conducted studies and improvements on flat-plate solar cell photovoltaic electrolysis systems. Gibson et al. [
12] integrated a photovoltaic maximum power point track with a proton exchange membrane (PEM) electrolyzer for hydrogen production, thereby avoiding efficiency losses due to intermediate auxiliary equipment. This innovation led to an improvement of 12.4% in solar-to-hydrogen efficiency. Nonetheless, the relatively low hydrogen production efficiency can impact hydrogen production costs, potentially limiting the industrial application of hydrogen. The efficiency of solar-to-hydrogen conversion is directly related to both photovoltaic and electrolysis efficiencies. Therefore, to improve system efficiency, efforts should be directed toward enhancing both photovoltaic and electrolysis efficiencies. Burhan et al. [
13] designed a compact concentrating photovoltaic (CPV) hydrogen production system for rooftop use and developed low-cost optical sensors for system tracking. The CPV device, equipped with triple-junction cells, was indirectly coupled with a proton exchange membrane (PEM) electrolyzer, achieving a maximum solar-to-hydrogen conversion efficiency of 18%, with a daily average efficiency of 15%. Bashir et al. [
14] utilized a CPV electrolysis system directly connected to triple-junction cells with an alkaline membrane electrolyzer. They investigated the impact of factors such as the irradiance intensity, temperature, and electrolyte concentration, achieving a solar-to-hydrogen conversion efficiency of 16% through optimal power matching.
Arne et al. [
15] proposed focusing sunlight onto photovoltaic cells coupled with a hydrogen production system using Fresnel lenses, achieving a hydrogen production efficiency of 19.5%. However, due to significant energy losses and thermal issues in the overall system, there is room for improvement in hydrogen production efficiency. Building upon this, Tembhume et al. [
16] optimized the structure and operating parameters of the hydrogen production device, utilizing concentrated solar energy for both heating the reactor and driving the water-splitting reaction, achieving a hydrogen production efficiency of 27.5%. Senthilraja et al. [
17] conducted experimental research on photovoltaic electrolysis hydrogen production systems using PVT components. They compared the performance of systems using PV, PV/T (air), and PV/T (water) under different mass flow rates. Under the same conditions, the hydrogen production rates for the three systems were 8.19, 13.9, and 17.12 mL/min, respectively. Laoun et al. [
18] analyzed hydrogen production using a PEM electrolyzer directly driven by photovoltaics and proposed a photovoltaic hydrogen production model for predicting hydrogen production under varying solar irradiance, pressure, and temperature conditions. Sangeetha et al. [
19] achieved a hydrogen production of 9.7 kg in May using a PVT system with nanofluids. In another study by Sangeetha et al. [
20], experiments were conducted using a PVT system with graphene oxide nanoparticles, resulting in a significant increase in the hydrogen mass flow rate at a flow rate of 1.2 g/s.
In summary, the photovoltaic electrolysis of water for hydrogen production is in line with China’s energy transition trend and the “dual carbon” policy orientation. It also aligns with the energy strategies of various countries around the world, attracting widespread attention and research interest. At the component level, improvements have been made in materials, structures, processes, and other aspects of photovoltaic and electrolysis equipment. However, current approaches often involve simple connections between PV/T components and PEM electrolysis cells, potentially overlooking the comprehensive impact of solar irradiance fluctuations on system performance.
In this context, this study constructs a PEM electrolysis water and hydrogen production system with a rated input power of 4 MW. It analyzes the effects of different cooling water modes on system operation strategies. The study investigates the PV/T and CPV/T photovoltaic-coupled PEM hydrogen production systems and deeply explores the fluctuation of solar irradiation. It examines the performance of the photovoltaic/thermal-coupled hydrogen production system and determines its optimal operating parameters. This analysis aims to provide guidance for optimizing future photovoltaic-coupled hydrogen production systems.
3. Methodology
The total energy required for water electrolysis is provided by both electrical energy and thermal energy [
21]:
where Δ
G is the electrical energy required by the electrolysis cell, kJ;
TΔ
S is the required thermal energy, kJ.
The theoretical minimum voltage required for water electrolysis can be calculated based on the Gibbs free energy of the reaction, the Faraday constant, and the number of electrons transferred during the reaction process [
21]:
The energy efficiency of an electrolyzer system can be determined by considering the working voltage, which includes not only the voltage required for water electrolysis but also the sum of activation overpotential and ohmic overpotential. Those overpotentials represent the additional energy required for the electrolysis reaction to occur.
where
Ut is the thermal neutral voltage, V;
Uw is the operating voltage, V; U
min is the voltage required for water electrolysis, V;
Ua is the activation overpotential, V.
F is the Faraday’s constant.
Due to insufficient energy for an electron transfer or state change in some reactants, leading to an inadequate ion discharge at the cathode and anode, electrons accumulate. The electrode activity in this scenario is measured by activation overpotential [
22].
The ohmic overpotential arises from hindered proton transport, a factor that is particularly noticeable in PEM electrolysis cells. Enhancing the proton conductivity of the proton exchange membrane and optimizing its electronic properties are crucial strategies to reduce the ohmic overpotential [
23,
24].
where
is the ohmic overpotential in volts;
is the proton exchange membrane resistance, Ω;
is the proton exchange membrane conductivity, s/m.
i is the electric current density, A/m
2. The proton exchange membrane conductivity can be calculated using the Arrhenius equation [
22].
where
E is the activation energy required for mass transfer in kJ/mol;
a is the membrane conductivity at the reference temperature, s/m. The energy conservation equation is as follows [
25,
26]:
where
is the activity of water;
h is the specific enthalpy of water in J/kg.
The concentration of all components except water is determined using Henry’s law. The expression for the hydrogen production rate in the electrolysis cell is given by the following [
27]:
where
is the number of electrolysis cells;
is the Faraday efficiency.
The energy conservation equation for a Proton Exchange Membrane Electrochemical Reactor (PEM-ECR) is as follows:
where
T is the temperature, °C;
is the current density, A/m
2;
is the specific heat capacity at constant pressure, kJ/(kg·K);
is the density, kg/m
3, ∇⋅(
k∇
T) is the heat conduction term.
Considering the mass flow and conservation of fluid, the mass conservation model is expressed through the continuity equation:
where
represents the mass transfer source term in the gas/liquid phase;
Yi is the volume fraction of the gas/liquid phase;
u is the fluid velocity, m/s.
In this system, there are two independent energy source terms. One energy source term directly supplies energy to the PEM electrolysis cell, ensuring efficient hydrogen production through electrolysis. The other energy source term is used to supply energy to the feedwater tank heater, to meet the thermal energy requirements that may arise in the system. Additionally, the system is equipped with an energy analyzer for real-time monitoring and analysis of the energy density of each energy source. Through the energy analyzer, a precise evaluation and optimization of energy distribution can be achieved, thereby enhancing the overall energy efficiency and operational stability of the system.
4. Performance Evaluation Metrics
The evaluation of the system from an energy perspective and the control of thermophysical parameters, in accordance with the first law of thermodynamics, involves neglecting pressure losses, heat dissipation, and compressor power consumption along the flow path. Evaluation indicators include energy efficiency, hydrogen production, the input energy of the hydrogen production system, and the overall efficiency of the photovoltaic/thermal hydrogen production system. These indicators comprehensively assess the energy conversion efficiency, hydrogen production, and overall operational efficiency of the system, thereby optimizing system performance.
The production rates of hydrogen and oxygen in the electrolysis cell are, respectively, represented as follows [
25]:
where
n represents the number of electrolysis cells;
represents the Faraday efficiency.
The performance evaluation of the photovoltaic/thermal-coupled hydrogen production system is based on three main assumptions. Firstly, it assumes negligible energy losses along the transmission path between the photovoltaic system and the hydrogen production system. Secondly, to maximize solar energy utilization, maximum power point tracking (MPPT) is typically performed at the photovoltaic end, followed by a voltage transformation to match the working requirements of the PEM electrolysis system. The PEM electrolysis current can be determined using the PEM-ECR model based on the input energy and relevant parameters, thereby estimating the hydrogen production of the system. Lastly, considering the widespread load adaptability of PEM electrolysis cells, the system’s rated input power is set at 4 MW. Based on this, thermal performance evaluation indicators for the photovoltaic/thermal-coupled hydrogen production system are proposed.
The input energy of the PEM hydrogen production system is as follows [
25]:
The energy efficiency of the PEM water electrolysis system is as follows:
where
LHVH2 is the low heat generation of hydrogen gas, kJ/mol.
The efficiency of photovoltaic/thermal-coupled hydrogen production systems is influenced by various factors, including solar irradiance, temperature, and system design. It encompasses both the conversion efficiency of solar energy into electricity and the efficiency of utilizing that electricity to produce hydrogen. Typically, this efficiency is calculated as the ratio of the energy content of the produced hydrogen to the energy content of the incident solar radiation:
where
A is the effective surface area of the photovoltaic array, m
2, and
G is the solar irradiance intensity, W/m
2.
When employing photovoltaic-coupled hydrogen production, the main benefits include reduced coal consumption and carbon dioxide emissions. Therefore, in conducting economic analysis, the standard coal saving rate (SCSR) and the carbon dioxide reduction rate (CDRR) can be introduced as metrics to evaluate the impact of photovoltaic-coupled hydrogen production [
28]. The calculation expressions for those metrics are as follows:
where the SCSR is the standard coal saving rate;
is the energy conversion efficiency between coal and hydrogen;
is the combustion calorific value of standard coal;
is the mass ratio of the carbon dioxide produced by the combustion of standard coal.
5. Results and Discussion
5.1. The Effect of Water Temperature in the PEM Electrolyzer on Hydrogen Production
Under the condition of a fixed input system energy of 5000 kJ/s and an anode inlet water flow rate of 10 kg/s, simulations under varying electrolyzer inlet water temperatures are presented in
Figure 5. The study indicates that, as the operating temperature of the system increases, the hydrogen production rate rises, and the energy efficiency also improves. This phenomenon stems from the accelerated movement of water molecules at high temperatures, leading to a significant increase in the electrolysis reaction rate and conductivity, thereby promoting water ionization as well as the diffusion rate of hydrogen ions and oxygen ions. This acceleration effect enhances both the yield and purity of hydrogen gas, further enhancing the overall performance and efficiency of the system.
However, in general, the PEM used in PEM electrolytic hydrogen production systems can only withstand temperatures ranging from 80 °C to 100 °C. Similar to a fuel cell [
29], the durability of the cell is affected by this temperature range. The adaptive state-of-health temperature-sensitivity characteristics can be helpful for durability improvement, and thermal management is crucial for water electrolyzers [
30]. Moreover, operating at higher temperatures requires additional heat to warm the circulating water. Therefore, in practical applications, 70 °C is typically chosen as the maximum operating temperature of the system to ensure the maximization of system efficiency while maintaining operational safety.
By controlling the electrolier’s inlet water temperature, it is possible to effectively optimize the electrolysis process, thereby enhancing the hydrogen production efficiency and energy conversion efficiency of the hydrogen production system. This finding has significant implications for the design of efficient photovoltaic/thermal-coupled hydrogen production systems, as it can improve system performance while ensuring operational safety and thermal economy.
5.2. The Effect of Photovoltaic Performance on Hydrogen Production
In
Figure 6, simulations under varying input energy conditions are presented, with the electrolyzer’s inlet water temperature set at 70 °C and a constant flow rate of water at the anode inlet. The analysis reveals that, as the system’s input energy increases, hydrogen production rises from 5.68 g/s to 49.37 g/s. However, the energy efficiency gradually decreases from 72.22% to 65.90%, with the decreasing slope of efficiency reduction. This phenomenon arises because the efficiency of electrolytic hydrogen production depends on the extent of water electrolysis. Increasing input energy generates more heat, leading to a rise in temperature within the electrolyzer, thereby accelerating the electrolysis reaction rate. Nevertheless, if the electrolysis reaction rate increases too rapidly, ions in the water may fail to diffuse promptly to the electrode surface, and bubbles formed on the electrode surface may create a covering layer, impeding the progress of the reaction.
This observation indicates that, under high input energy conditions, although hydrogen production increases, the energy efficiency is affected due to restricted ion diffusion and bubble coverage effects. Therefore, optimizing PEM electrolytic hydrogen production systems requires balancing the relationship between the input energy and electrolysis efficiency. Future optimization directions encompass bubble management, electrode design optimization, the improvement of electrolyte membrane materials, electrolyzer temperature control, and energy distribution optimization. These efforts aim to further enhance the energy efficiency and hydrogen production of PEM electrolytic hydrogen production systems, thereby achieving more efficient energy utilization and system performance.
5.3. The Impact of PV System Performance on Hydrogen Production
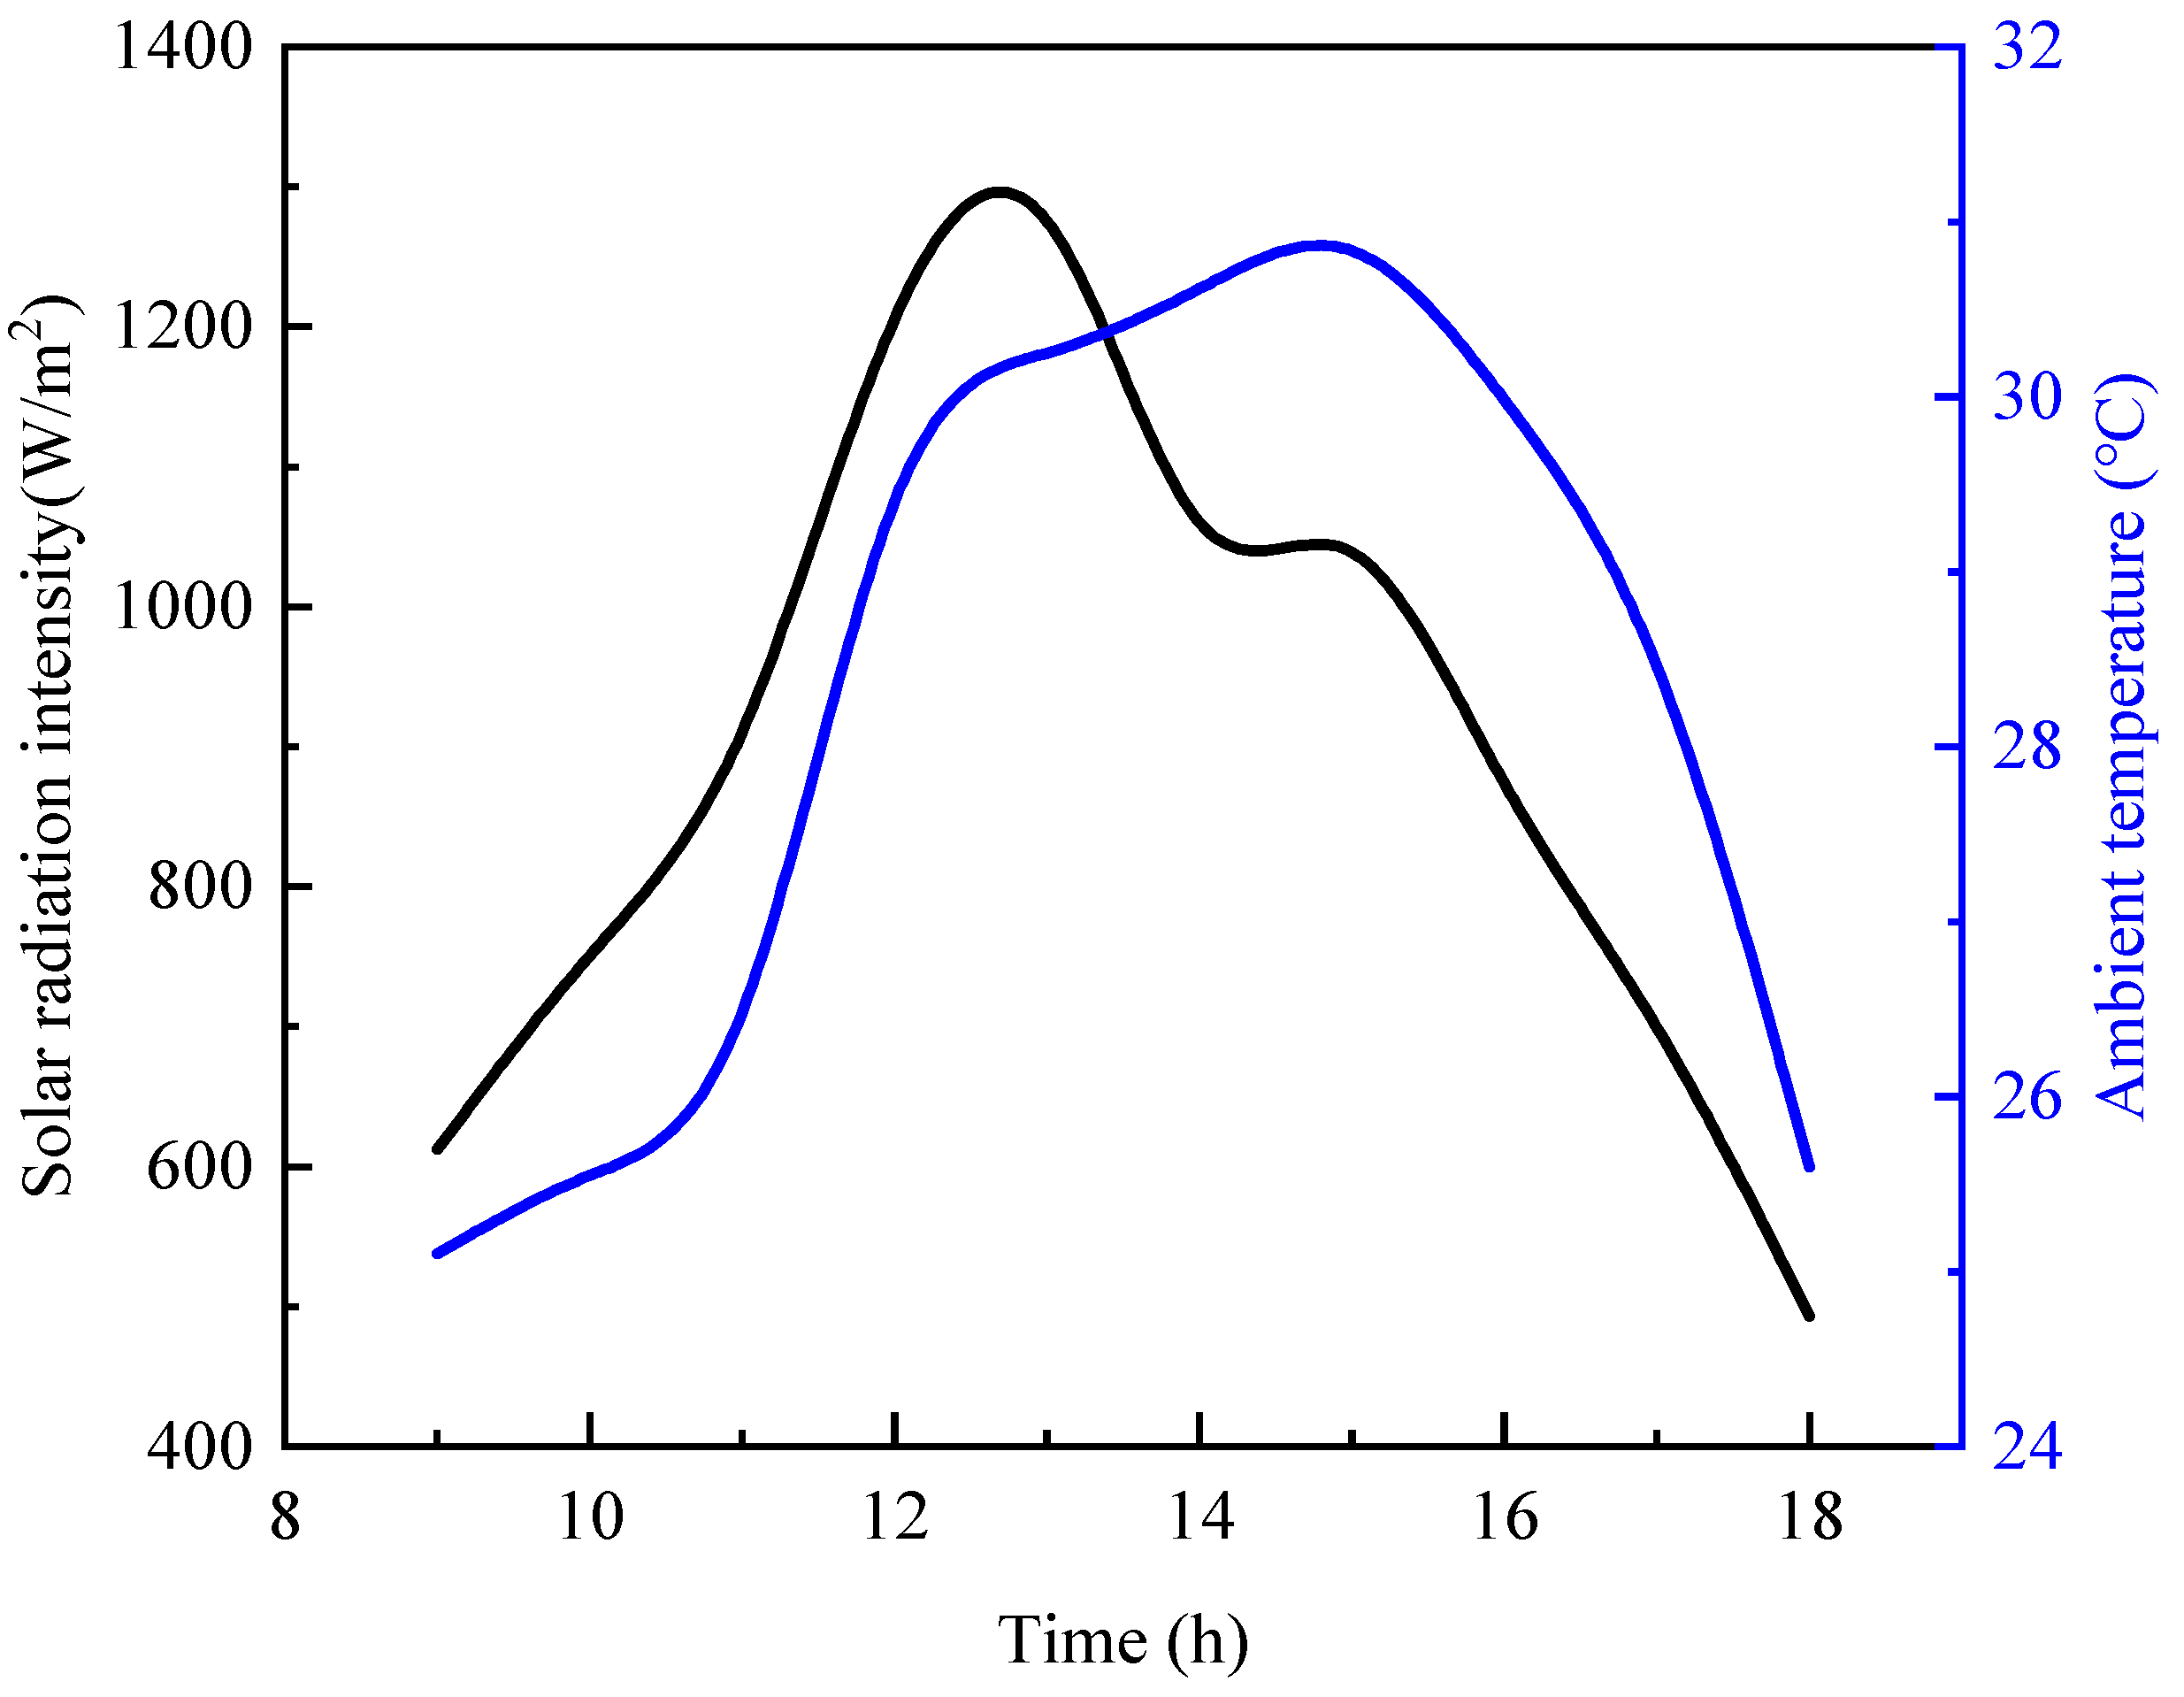
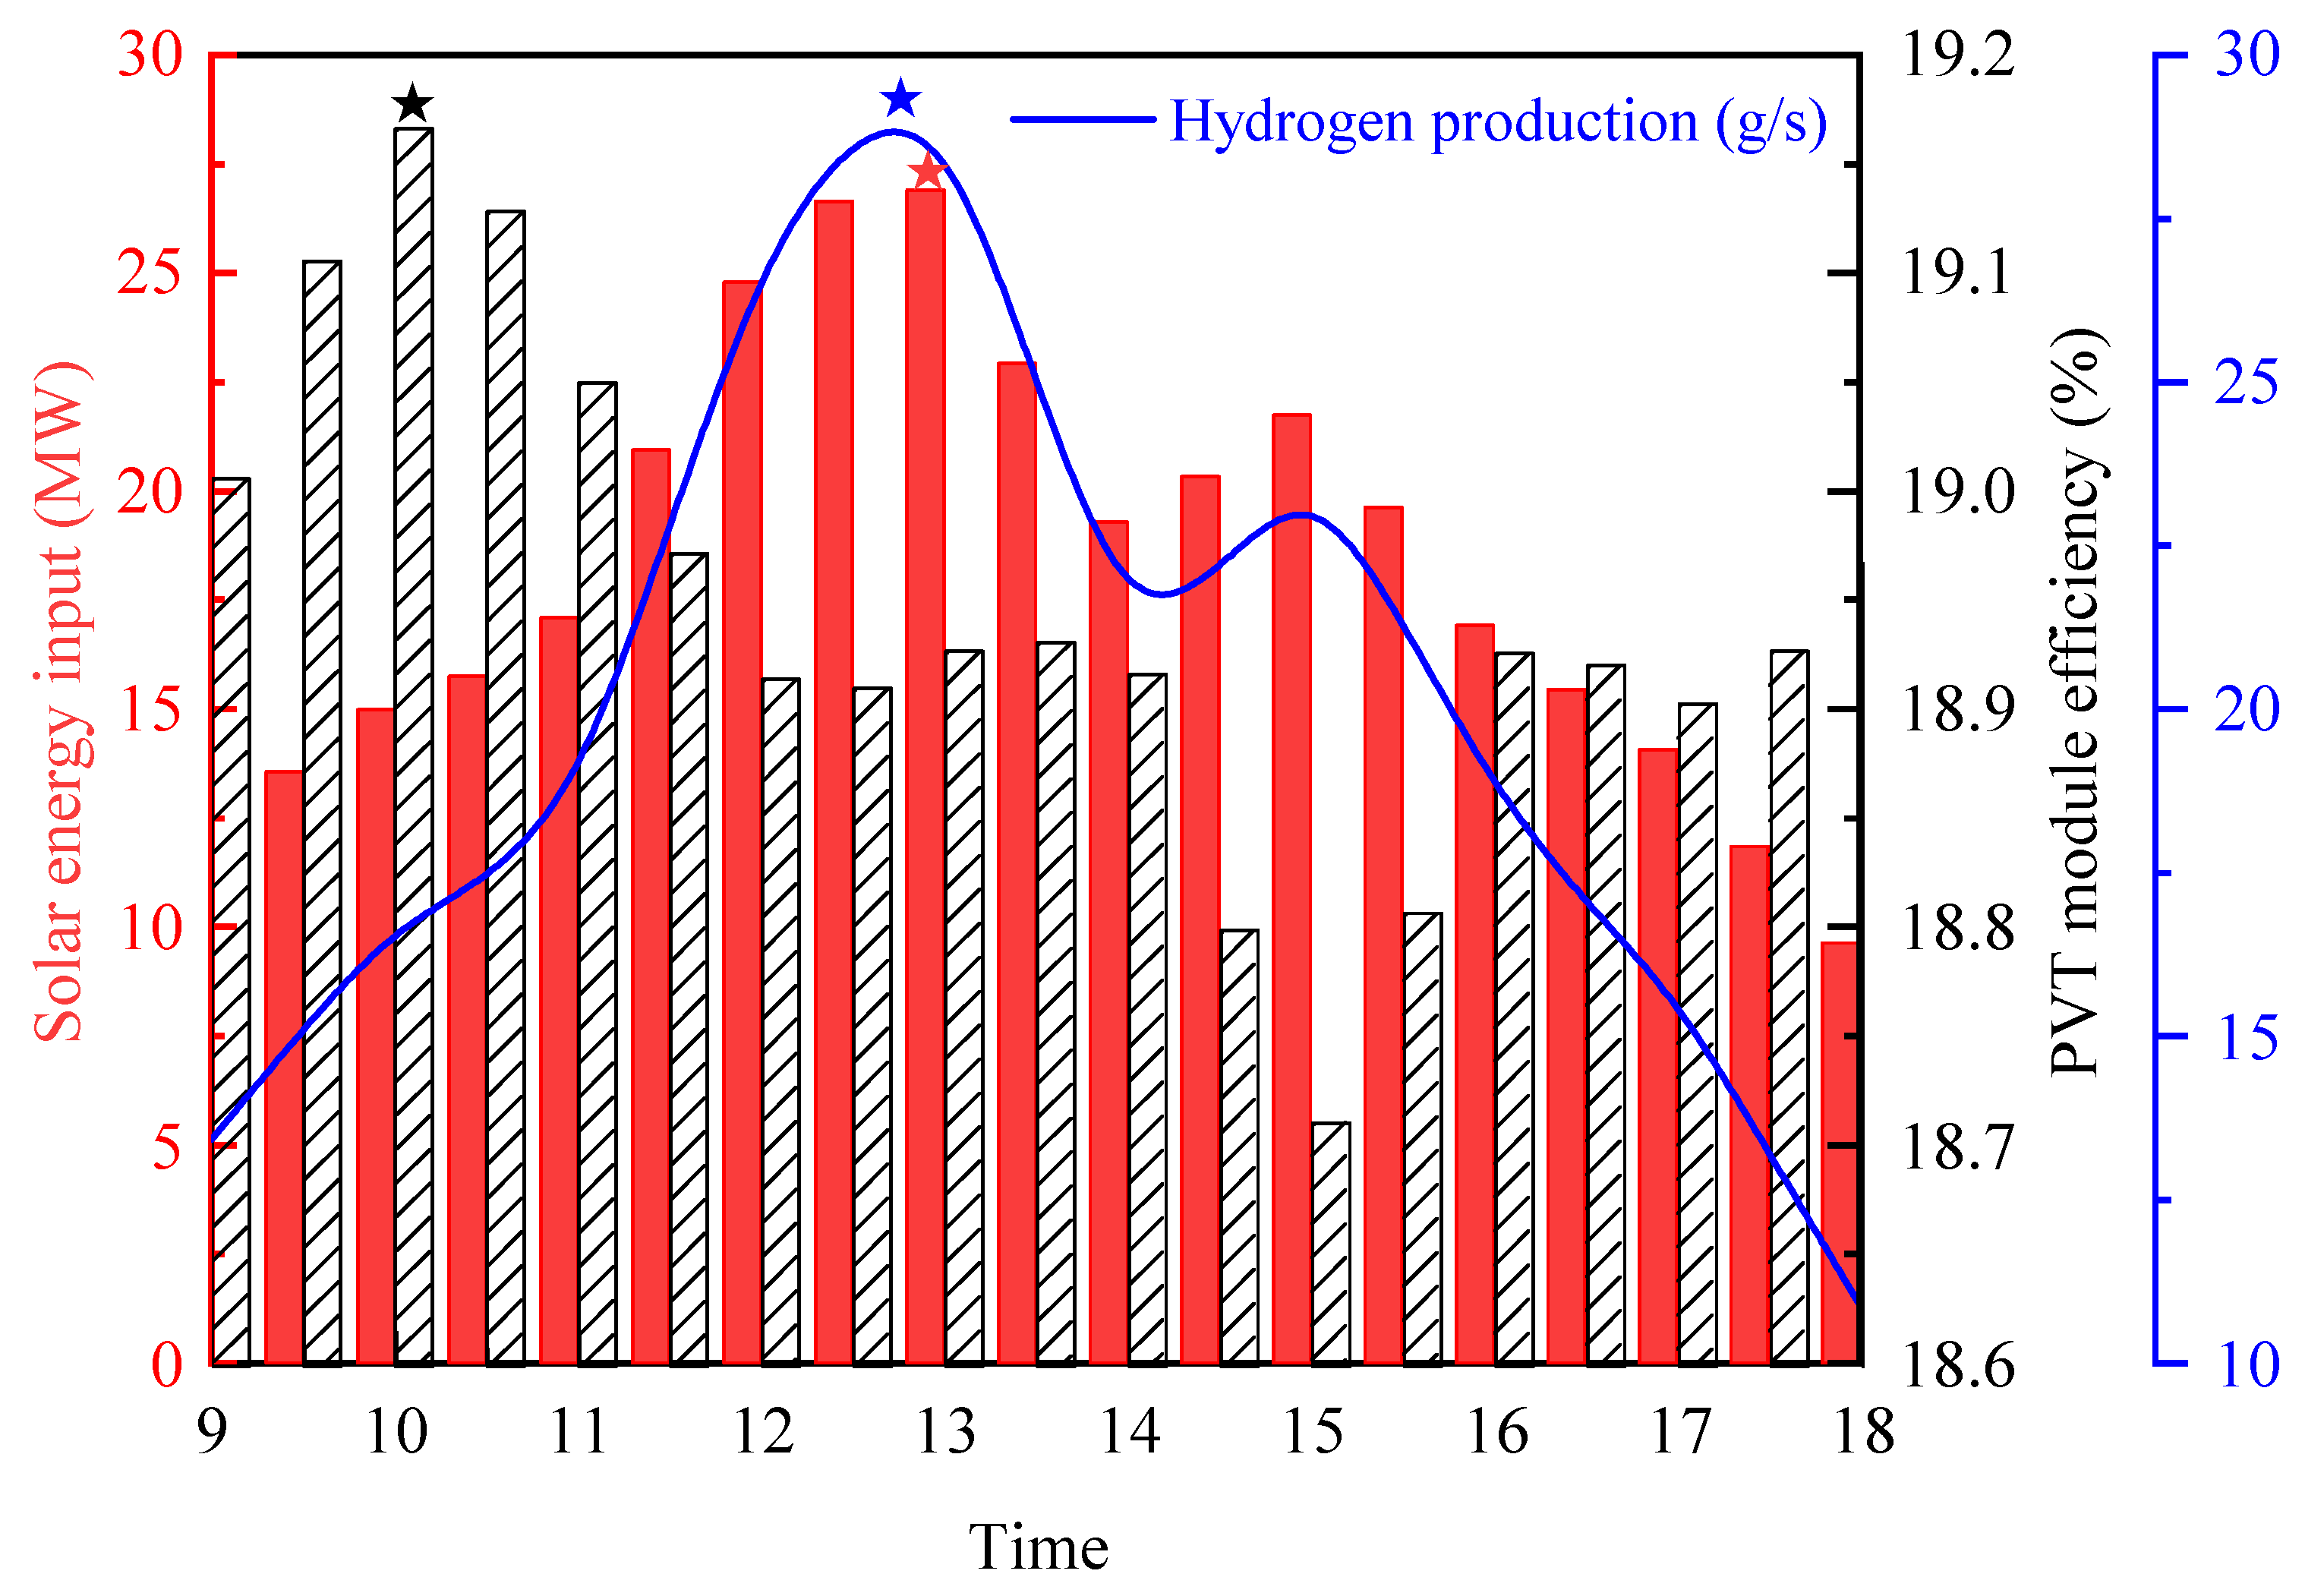
Figure 7 provides an analysis of the performance of the PV/T system. The asterisks represents the point of maximum value. During daylight hours, significant variations are observed in the solar energy absorption, electrical efficiency, and hydrogen production of the PV/T components. The PV/T modules receive the highest solar energy input between 12:00 p.m. and 1:00 p.m., coinciding with peak electrical efficiency and hydrogen production. The maximum hydrogen production is 29.02 g/s, the maximum PTV module efficiency is 19.16%, and the maximum solar energy input is 26.91 MW. However, it is noteworthy that, despite the maximum solar input during this period, the peak values of electrical efficiency and hydrogen production in the PEM system occur slightly later, between 1:00 p.m. and 2:00 p.m. This delay can be attributed to the temperature effect within the photovoltaic components, as high temperatures tend to reduce the photovoltaic conversion efficiency, thereby delaying the peak values of electrical efficiency and hydrogen production.
Furthermore, the PV/T-coupled hydrogen production system exhibits higher hydrogen production under conditions of high environmental temperature and solar irradiance, whereas hydrogen production significantly decreases under low light conditions. This indicates that the performance of photovoltaic/thermal-coupled hydrogen production systems is notably influenced by solar radiation intensity and environmental temperature. To optimize hydrogen production performance, it is proposed to introduce concentrated photovoltaic/thermal technology into hydrogen production systems. By enhancing the photovoltaic cell’s photovoltaic conversion efficiency and effectively utilizing the stored thermal energy at high temperatures for water thermolysis, hydrogen production can be further enhanced.
5.4. The Performance of Concentrated Photovoltaic- and Thermal-Coupled PEM Hydrogen Production
For the PV-coupled hydrogen production system, employing CPV/T systems offers additional benefits beyond increased hydrogen generation. These systems can utilize high-quality thermal cooling water for system cooling. By using heat exchangers to heat the cooling water and introducing it into the anode inlet of the hydrogen production system or directly into the anode of the electrolyze, system efficiency and hydrogen production can be further enhanced. This section will analyze the hydrogen production performance of this approach.
Based on the research in
Section 5.1, in the CPV/T-PEM hydrogen production system, utilizing the high-quality thermal cooling water provided by CPV/T as the feedwater for the electrolier’s hot end achieves solar energy cascade utilization, thereby enhancing the overall system efficiency as illustrated in
Figure 8.
5.4.1. System Performance Comparison
Figure 9 illustrates the hydrogen production performance of the two coupling systems. The left vertical axis represents the accumulation of hydrogen, and the right vertical axis represents the production rate of hydrogen. The blue curve represents the hydrogen production rate of the CPV/T-PEM, and the production rate of the PV/T-PEM is shown in
Figure 7. It is evident from the graph that the PV/T-PEM and the CPV/T-PEM exhibit significant differences in their hydrogen production rates and cumulative hydrogen production at different times. The CPV/T-PEM system reaches its maximum hydrogen production rate of 99.11 g/s at 12:30, as seen in
Figure 9, while the highest hydrogen production rate for the PV/T-PEM system is 29.02 g/s, occurring at 13:00, as seen in
Figure 7. This disparity is primarily attributed to the concentrator photovoltaic technology employed in the CPV/T system. This technology concentrates sunlight onto small-area photovoltaic cells using optical lenses or reflectors, significantly increasing solar irradiance and photovoltaic conversion efficiency, thereby enhancing electrical output and hydrogen production. In terms of cumulative hydrogen production, the CPV/T-PEM system consistently outperforms the PV/T-PEM system at all time points. By sunset, the cumulative hydrogen production of the CPV/T-PEM system can reach 2445.732 kg, which is 3.6 times that of the PV/T-PEM system. This significant advantage not only demonstrates the effectiveness of concentrator technology in improving instantaneous hydrogen production rates but also showcases its cumulative benefits over prolonged operation. By elevating the irradiance intensity, concentrator technology increases hydrogen production per unit time, thus exhibiting a clear advantage in total production.
From
Figure 10 and
Figure 11, it is evident that during the same time period, the PV/T-PEM exhibits higher hydrogen production efficiency and overall system efficiency compared to the CPV/T-PEM. This difference primarily stems from the use of monocrystalline silicon cells in the study. Under concentrated sunlight conditions, the surface temperature of the cells increases, leading to a reduction in their electrical efficiency, particularly at high solar irradiance levels. This phenomenon results in significant electrical efficiency losses induced by the concentration. Additionally, the energy input into the hydrogen production system increases after the concentration, leading to a decrease in energy efficiency. As the magnitude of energy input increases, this attenuation effect becomes more pronounced, thereby causing an overall decrease in system efficiency, particularly under high solar irradiance and temperature conditions.
However, the calculation method for system efficiency overlooks two main factors. Firstly, the heating energy required for electrolysis circulation water constitutes a significant energy loss during hydrogen production, particularly when using concentrated photovoltaics. The elevated temperature in such systems exacerbates the heating energy consumption of the circulation water. Secondly, the energy brought by CPV/T systems to heat the water tank is not considered. Based on this, the efficiency of PV/T-PEM and CPV/T-PEM systems should be adjusted. The correction formulas are as follows:
Figure 12 presents a comprehensive analysis of the thermal efficiency of cooling water and the required heating load for PV/T and CPV/T systems, revealing a significant advantage in energy efficiency for the CPV/T-coupled hydrogen production system. Specifically, the energy efficiency of the PV/T system ranges from 38.9% to 48.9%, while the CPV/T system achieves a higher energy efficiency, ranging from 50.9% to 55.8%. This discrepancy is primarily due to the different thermal management strategies employed under various operating conditions. The PV/T system requires additional heat to warm the electrolier’s circulating water under low irradiation conditions, whereas the CPV/T system circumvents this need by directly utilizing cooling water, resulting in superior energy efficiency under these conditions. Further analysis indicates divergent trends in the overall efficiency of CPV/T and PV/T-coupled hydrogen production systems under varying environmental conditions. The corrected total efficiency of the CPV/T system decreases under high solar irradiance and elevated ambient temperatures due to excessively high cooling water temperatures, which lead to insufficient cooling of the photovoltaic cells and a subsequent dual impact on electrical efficiency. Conversely, the total efficiency of the PV/T system diminishes under low solar irradiance and lower ambient temperatures, primarily because more heat is required to warm the electrolier’s circulating water, thus adversely affecting its energy efficiency.
From the perspective of the first law of thermodynamics, PV/T-coupled hydrogen production systems exhibit higher total efficiency and superior performance under high solar irradiance and high ambient temperature conditions. However, to comprehensively evaluate the performance of these systems, it is insufficient to consider only the quantity of energy. A qualitative assessment from the standpoint of the second law of thermodynamics is also necessary. For the CPV/T system, the utilization efficiency of the high-temperature cooling water’s thermal quality and the system’s thermal losses require further scrutiny. This can be achieved through a detailed analysis of entropy generation and system irreversibilities, leading to an optimized system design and enhanced overall performance.
5.4.2. An Exergy Analysis of a Photovoltaic Hydrogen Production System
In the PV/T-PEM system, photovoltaic modules convert a portion of solar energy into electrical energy, while the unused thermal energy is recovered through the cooling system. Due to the direct incorporation of cooling water, there is no need for additional heating of the circulating water, resulting in higher system efficiency. This efficiency is particularly notable under conditions of high solar irradiance and high ambient temperatures, where the system can maintain a high exergy output. In contrast, the CPV/T-PEM system, with its high concentration ratio, causes the photovoltaic cell surface temperature to rise. If the cooling system is insufficiently efficient, the electrical efficiency can significantly decline. This issue is exacerbated under high solar irradiance conditions, where excessively high cooling water temperatures lead to ineffective cooling of the cell surface, thereby reducing the system’s total exergy output. To further analyze the performance of PV/T-PEM and CPV/T-PEM systems, the detailed calculations for solar exergy, the chemical exergy of hydrogen, and thermal exergy for each system are presented as follows. The calculation formula for the system’s solar exergy is as follows [
24]:
In this formula, the PV/T system takes
C as 1 and
Tsun as 5770 K. The calculation of the chemical exergy of hydrogen is crucial for evaluating the efficiency and performance of the hydrogen production system. During the hydrogen production process, the generated hydrogen is converted into electrical energy or other forms of energy through its chemical exergy. Measuring its chemical exergy helps in determining the energy conversion efficiency of the hydrogen production process:
The exergy of heat flow represents the available energy difference between the inlet and outlet, reflecting the effectiveness of energy transfer and conversion processes within a system. In PV/T and CPV/T systems, calculating the exergy of heat flow requires consideration of the exergy change in cooling water at different temperatures.
PV/T systems exhibit lower cooling water temperatures, which hinder the effective enhancement of the hydrogen production efficiency. Moreover, reusing cooling water adds complexity and costs to the system. In contrast, CPV/T systems leverage concentrated photovoltaic technology, enabling higher cooling water temperatures that are directly usable for meeting hydrogen production heat demands, thereby improving overall energy utilization efficiency and cost-effectiveness. Consequently, CPV/T systems prioritize utilizing high-temperature cooling water to enhance hydrogen production efficiency, whereas PV/T systems do not reuse cooling water. Exergy flow analyses of these systems are depicted in
Figure 13 and
Figure 14. In PV/T-PEM systems, where cooling water from PV/T systems is not reused, the computation of its heat output necessitates the accurate measurement of the cooling water mass flow rate, coupled with temperature differentials at the inlet and outlet, alongside ambient temperature considerations, ensuring a precise assessment of the heat energy carried away by the cooling water. Concurrently, electrolyzer feed water undergoes preheating in a heater, with its entropy change computation accounting for state parameters at varying temperatures and pressures. The CPV/T-coupled hydrogen production system illustrated in
Figure 15 employs direct cooling water input, dividing the PV/T system cooling water into two streams: one is directly supplied to the proton exchange membrane electrolyzer as feed water, while the other is discharged from the system. This approach significantly enhances the thermal efficiency of the PEM electrolysis process by capitalizing on the high-temperature characteristics of the cooling water. Furthermore, this design simplifies thermal management processes, optimizes energy utilization pathways, and enhances overall system thermal efficiency and energy utilization rates. Exergy efficiency calculations for the system are detailed as follows:
where
ExH2 is the exergy of hydrogen, kJ/kg;
Exsun is the exergy of solar energy, kJ/kg;
ExQ is the exergy of heat flow, kJ/kg.
Figure 15 illustrates the disparity in exergy efficiencies between two photovoltaic systems for hydrogen production. From the graph, it is evident that the total exergy efficiency of the CPV/T-coupled hydrogen production system consistently surpasses that of the PV/T-coupled hydrogen production system across different time periods. Specifically, the total thermal exergy efficiency of the CPV/T system ranges from 2.4% to 4.35%, whereas that of the PV/T system remains below 1%. This significant difference primarily reflects variations in the efficiency of cooling water heat utilization. The CPV/T system enhances the thermal quality and utilization efficiency of cooling water effectively through direct cooling water input. In the CPV/T-coupled hydrogen production system, the thermal exergy output from the cooling water constitutes a major portion of the total system’s thermal exergy output. Particularly from 11:00 to 16:00 when solar irradiance is high, the elevated cooling water temperature significantly enhances its energy quality, reflected in increased thermal exergy efficiency. However, excessively high cooling water temperatures indicate poor cooling performance of the photovoltaic cells, leading to elevated temperatures and severe declines in electrical efficiency. The high-temperature cooling water not only affects the performance of photovoltaic cells but also adversely impacts the electrolyzer’s performance, resulting in substantial decreases in hydrogen production energy efficiency and chemical exergy efficiency during this period. Despite the lower chemical exergy efficiency of the CPV/T-coupled hydrogen production system under high solar irradiance compared to the PV/T system, its thermal exergy efficiency significantly increases under these conditions, sufficiently compensating for the decrease in the chemical exergy efficiency. Therefore, the overall exergy efficiency decline is not pronounced, with an absolute decrease in exergy efficiency within 1%, compared to low solar irradiance conditions. Thus, the CPV/T-coupled hydrogen production system maintains higher total exergy efficiency than the PV/T-coupled hydrogen production system under high solar irradiance conditions.
Therefore, dynamic control strategies can be implemented to adjust system operating parameters in real time based on solar irradiance, integrating thermal and electrical energy storage devices to balance energy supply and demand. Additionally, optimizing the cooling system design effectively reduces photovoltaic cell temperatures.
5.5. Economic Analysis
Based on our results, it is observed that the CPV/T-PEM system produces hydrogen at a rate of 2240.41 kg/day, with a standard coal saving rate of 15.5 tons/day and a carbon dioxide emission reduction rate of 38.0 tons/day. These findings reflect the potential economic and environmental benefits of photovoltaic hydrogen production technology. From an economic perspective, photovoltaic hydrogen production technology is expected to introduce new business models to the energy industry, reducing energy dependence and lowering energy costs. With the maturity of technology and the expansion of the market scale, the construction and operation costs of photovoltaic hydrogen production systems will gradually decrease, bringing more substantial economic returns to investors. From an environmental standpoint, the widespread application of photovoltaic hydrogen production technology is expected to reduce the demand for traditional fossil fuels and decrease greenhouse gas emissions, thereby mitigating climate change and improving environmental quality.
6. Conclusions
This study presents simulation-based analyses of two photovoltaic-coupled proton exchange membrane (PEM) hydrogen production systems: PV/T and CPV/T, with emphasis on the impact of solar irradiance variability.
The findings indicate that hydrogen production is notably higher between 11:00 and 16:00, peaking between 12:00 and 13:00. The CPV/T-PEM system achieves its peak hydrogen production rate of 99.11 g/s at 12:30, whereas the PV/T-PEM system peaks at 29.02 g/s at 13:00. The maximum energy efficiency for hydrogen production in the CPV/T-PEM and PV/T-PEM systems is 66.7% and 70.6%, respectively, with these peaks occurring at 9:00 and 18:00. The corresponding total efficiency maxima are 12.9% and 13.4%, also at 9:00 and 18:00.
Although the systems show increased hydrogen production under high solar irradiance, there is a notable decrease in the energy conversion efficiency. Detailed analysis shows that the CPV/T-coupled system surpasses the PV/T system in hydrogen yield, particularly under conditions of high solar irradiance and temperature. The system’s typical daily standard coal savings rate is 15.5 tons/day, with a carbon dioxide reduction rate of 38.0 tons/day, highlighting its environmental benefits and low-carbon profile. At high solar irradiance levels, the CPV/T system exhibits superior overall exergy efficiency compared to the PV/T system.
These findings offer substantial theoretical and practical insights for the practical implementation of photovoltaic hydrogen production technology, contributing new scientific knowledge to the advancement and utilization of clean energy. Future research should concentrate on improving system efficiency, reducing costs, and enhancing system stability and sustainability, thereby further advancing the application and development of photovoltaic hydrogen production technology in the energy transition.
Statement of Industrial Relevance: At present, most of China’s annual hydrogen production comes from fossil fuels, including coal gasification, natural gas reforming, and industrial by-product hydrogen. Developing clean electricity electrolysis technology for producing green hydrogen can provide strong support for China to achieve its carbon neutrality goals. The coupling of solar photovoltaics and electrolytic hydrogen production is an important component of green hydrogen production. Currently, alkaline electrolyzed water technology is relatively mature, but it has disadvantages such as corrosiveness, complex operation and maintenance, and a slow response. Proton exchange membrane electrolyzers have the characteristics of a fast start/stop speed, strong dynamic response, flexible operation, and variable load, and they are more suitable for matching renewable energy sources such as photovoltaic and wind power with fluctuations and intermittency. The photovoltaic hydrogen production system only involves the utilization of solar photovoltaic power generation. Photovoltaic thermal (PV/T) technology can reduce the temperature of PV cells, and the use of PV/T preheating electrolysis water can increase the hydrogen production rate while improving the comprehensive utilization rate of solar energy. PV/T can provide both electrical and thermal energy for the electrolysis of water, realizing the cascade utilization of cogeneration and energy. Moreover, the synchronous response of PV/T’s electrical and thermal energy under actual solar radiation fluctuations is beneficial for improving the dynamic operating performance of PEM.
Novelty or Significance: The present study conducts simulation-based investigations on two types of photovoltaic-coupled proton exchange membrane (PEM) hydrogen production systems, namely, PV/T and CPV/T, with a focus on the variability of solar irradiance, and analyzes the performance of key parameters in the hydrogen production process in response to the fluctuation of solar radiation intensity. This study adopted the maximum power point tracking algorithm of photovoltaic systems and combined it with the simulation analysis of solar radiation intensity and environmental temperature on a certain day in a certain place. The research results provide a reference for the engineering application of photovoltaic/photothermal-coupling hydrogen production technology, which helps to promote technological progress in this field.


