
A Parametric Study of a Fully Passive Oscillating Foil Turbine on a Swinging Arm in a Tandem Configuration


Abstract
1. Introduction
2. Methodology
2.1. Dynamics
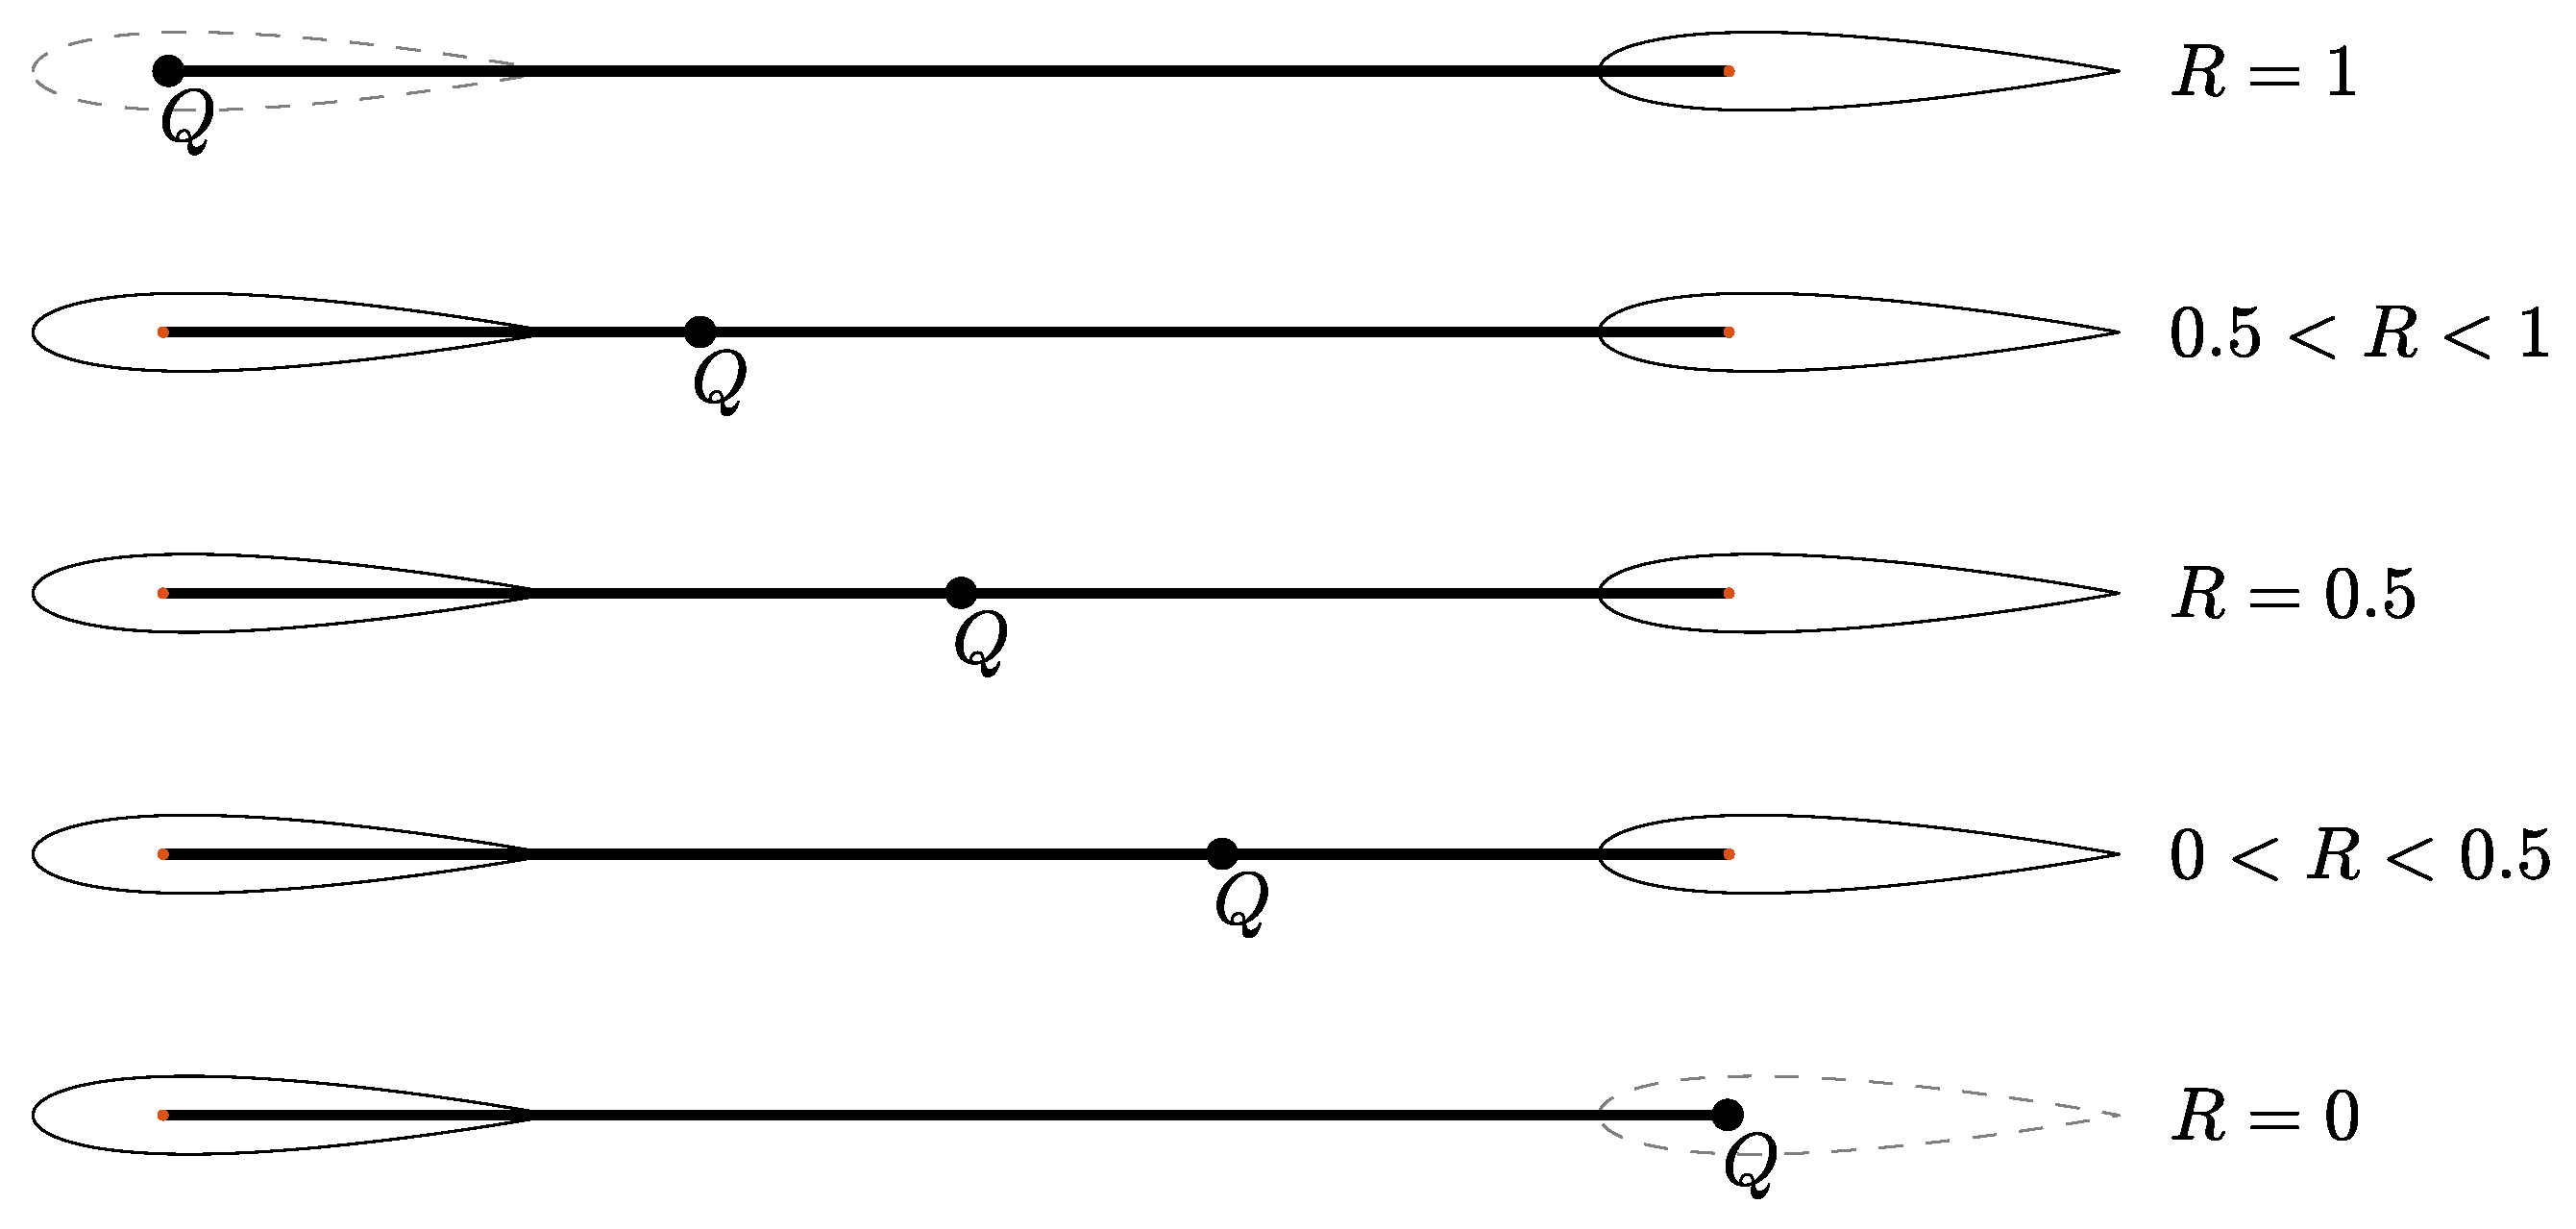
2.2. Evaluating the Structural Parameters

| Parameter | Coupled Flutter (Boudreau et al. [16]) | Coupled Flutter (Cloutier et al. [25]) | Stall Flutter (Veilleux et al. [13]) |
|---|---|---|---|
| 2 | 3.036 | ||
| 0.7 | 1.501 | ||
| 1.55 | 1.206 | ||
| 2 | 2 | 0.095 | |
| 0 | 0 | 0.119 | |
| 3.16 | 3.16 | 0.031 | |
| 0.65 | 0.65 | −0.029 |
2.3. Performance Metrics
2.4. Numerics
2.4.1. Fluid–Structure Interaction Algorithm
2.4.2. Cfd Domain and Mesh
2.5. Verification
3. Results and Discussion
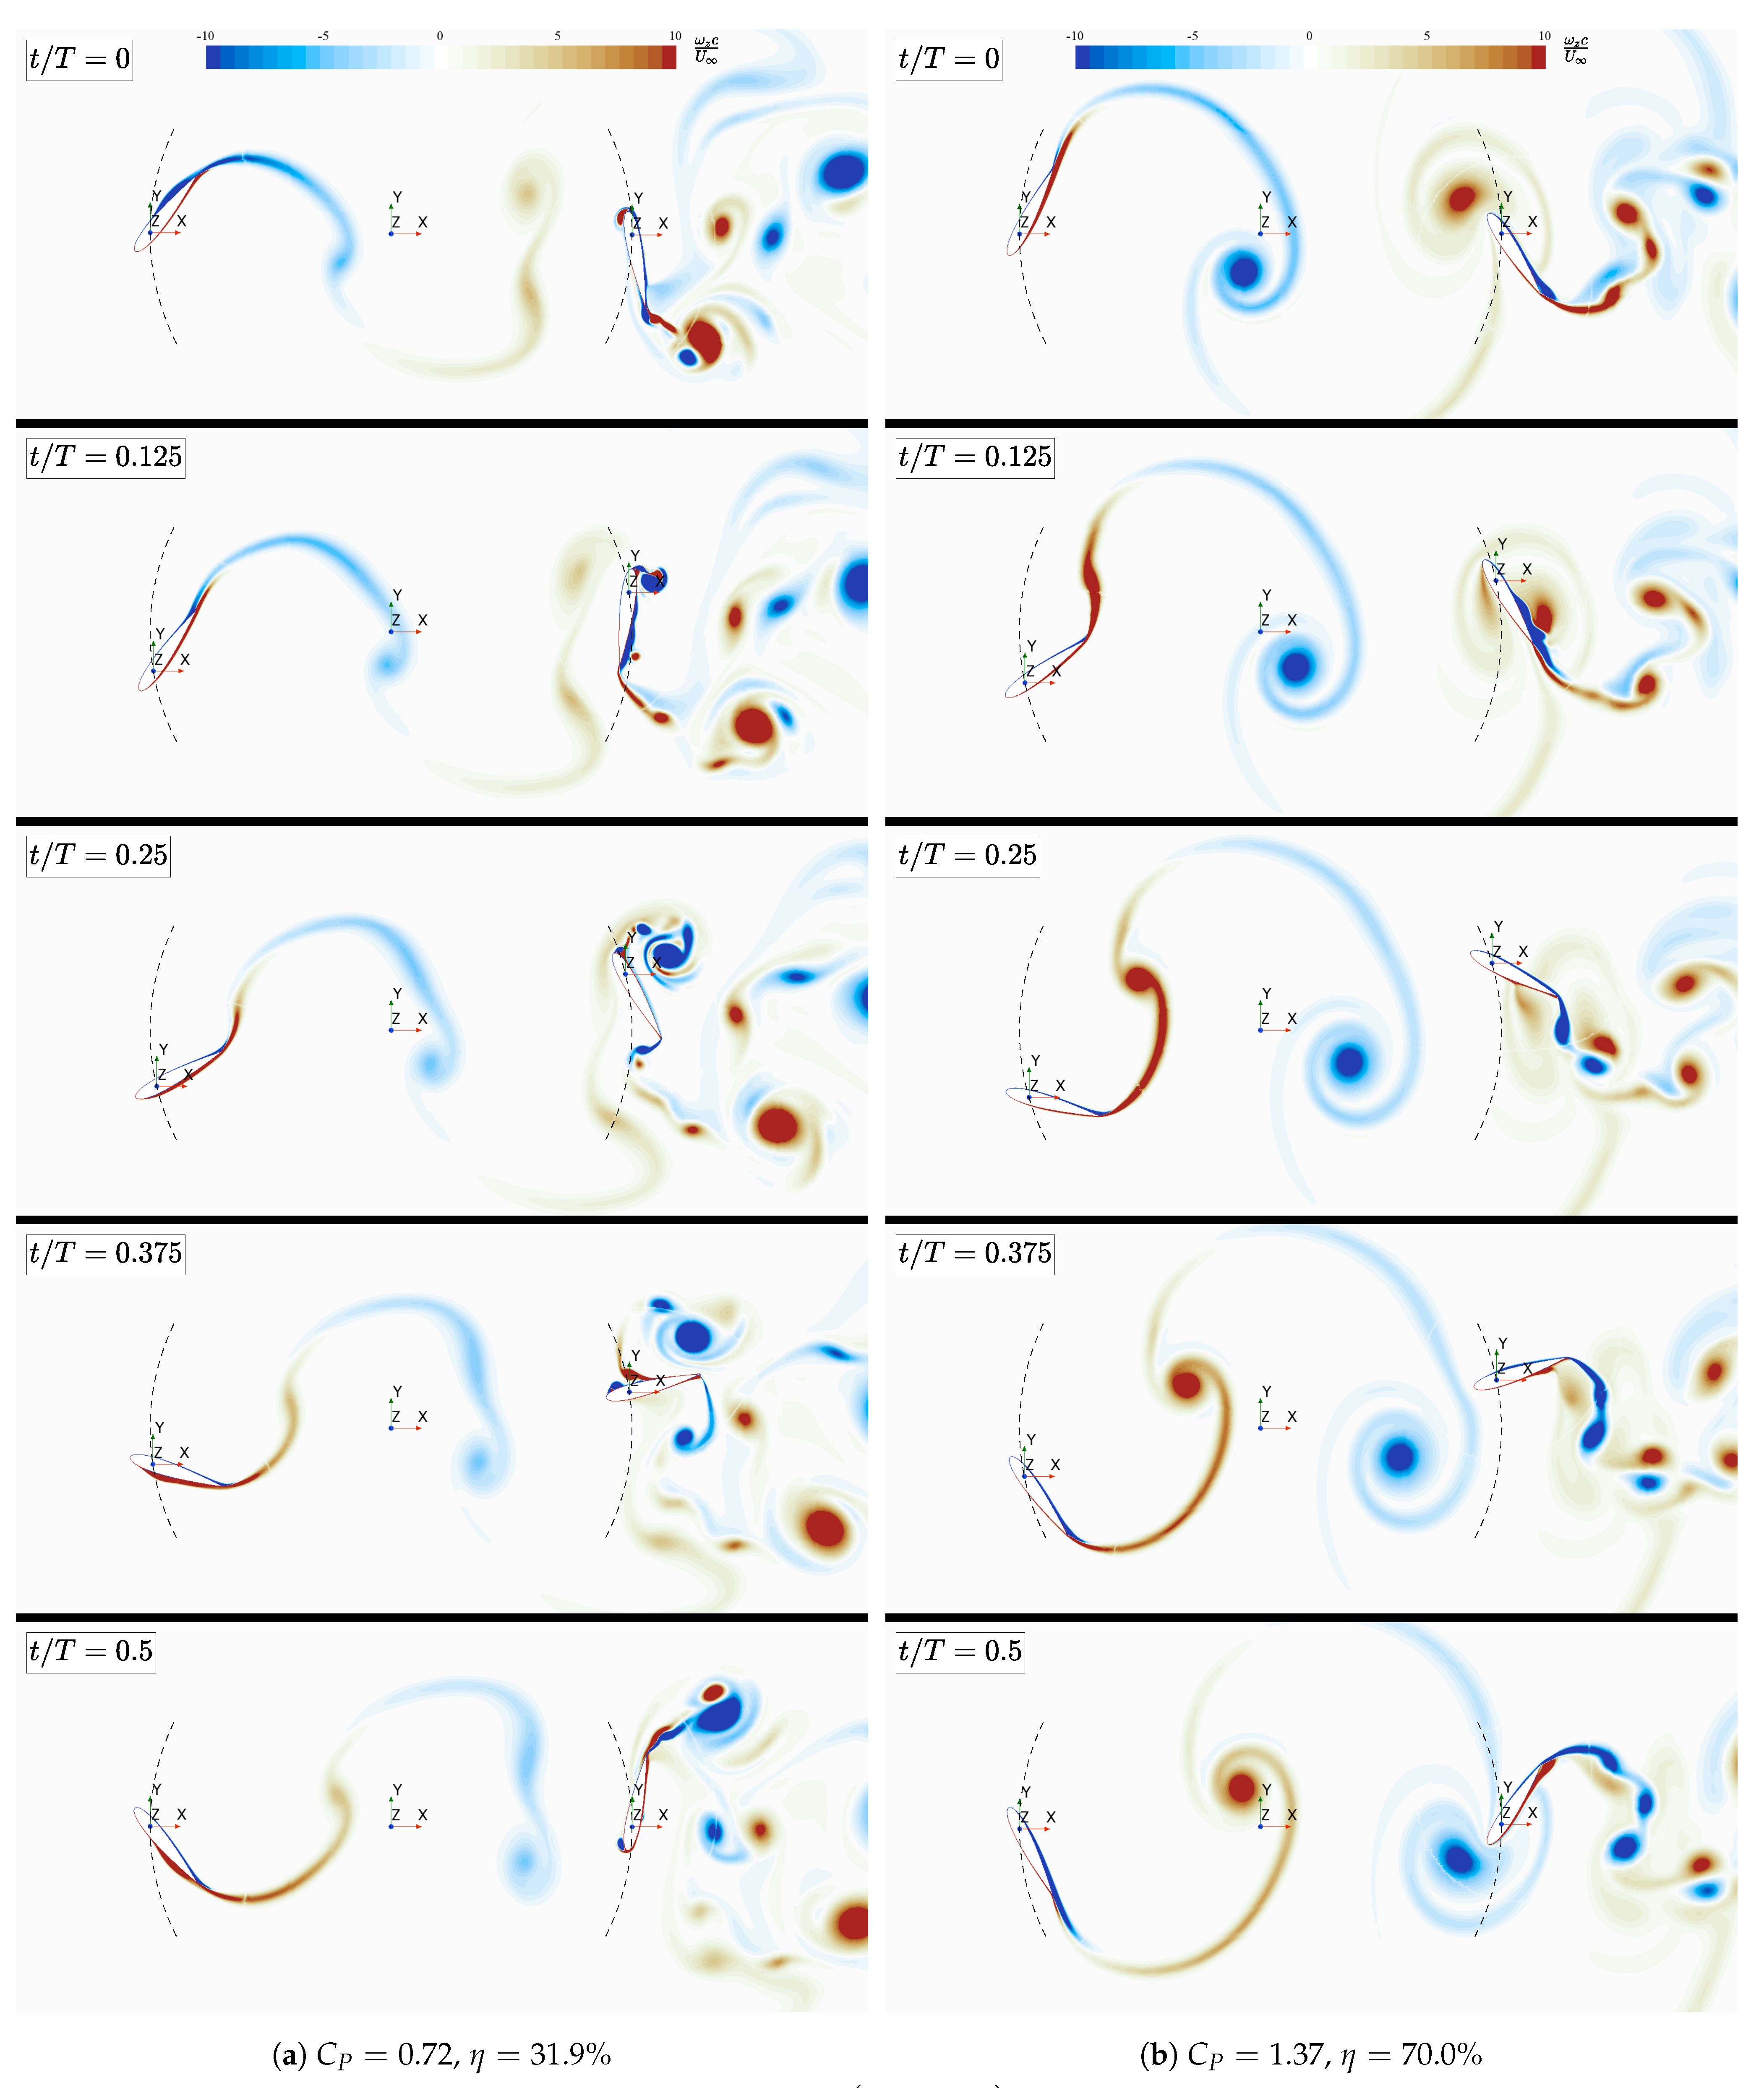
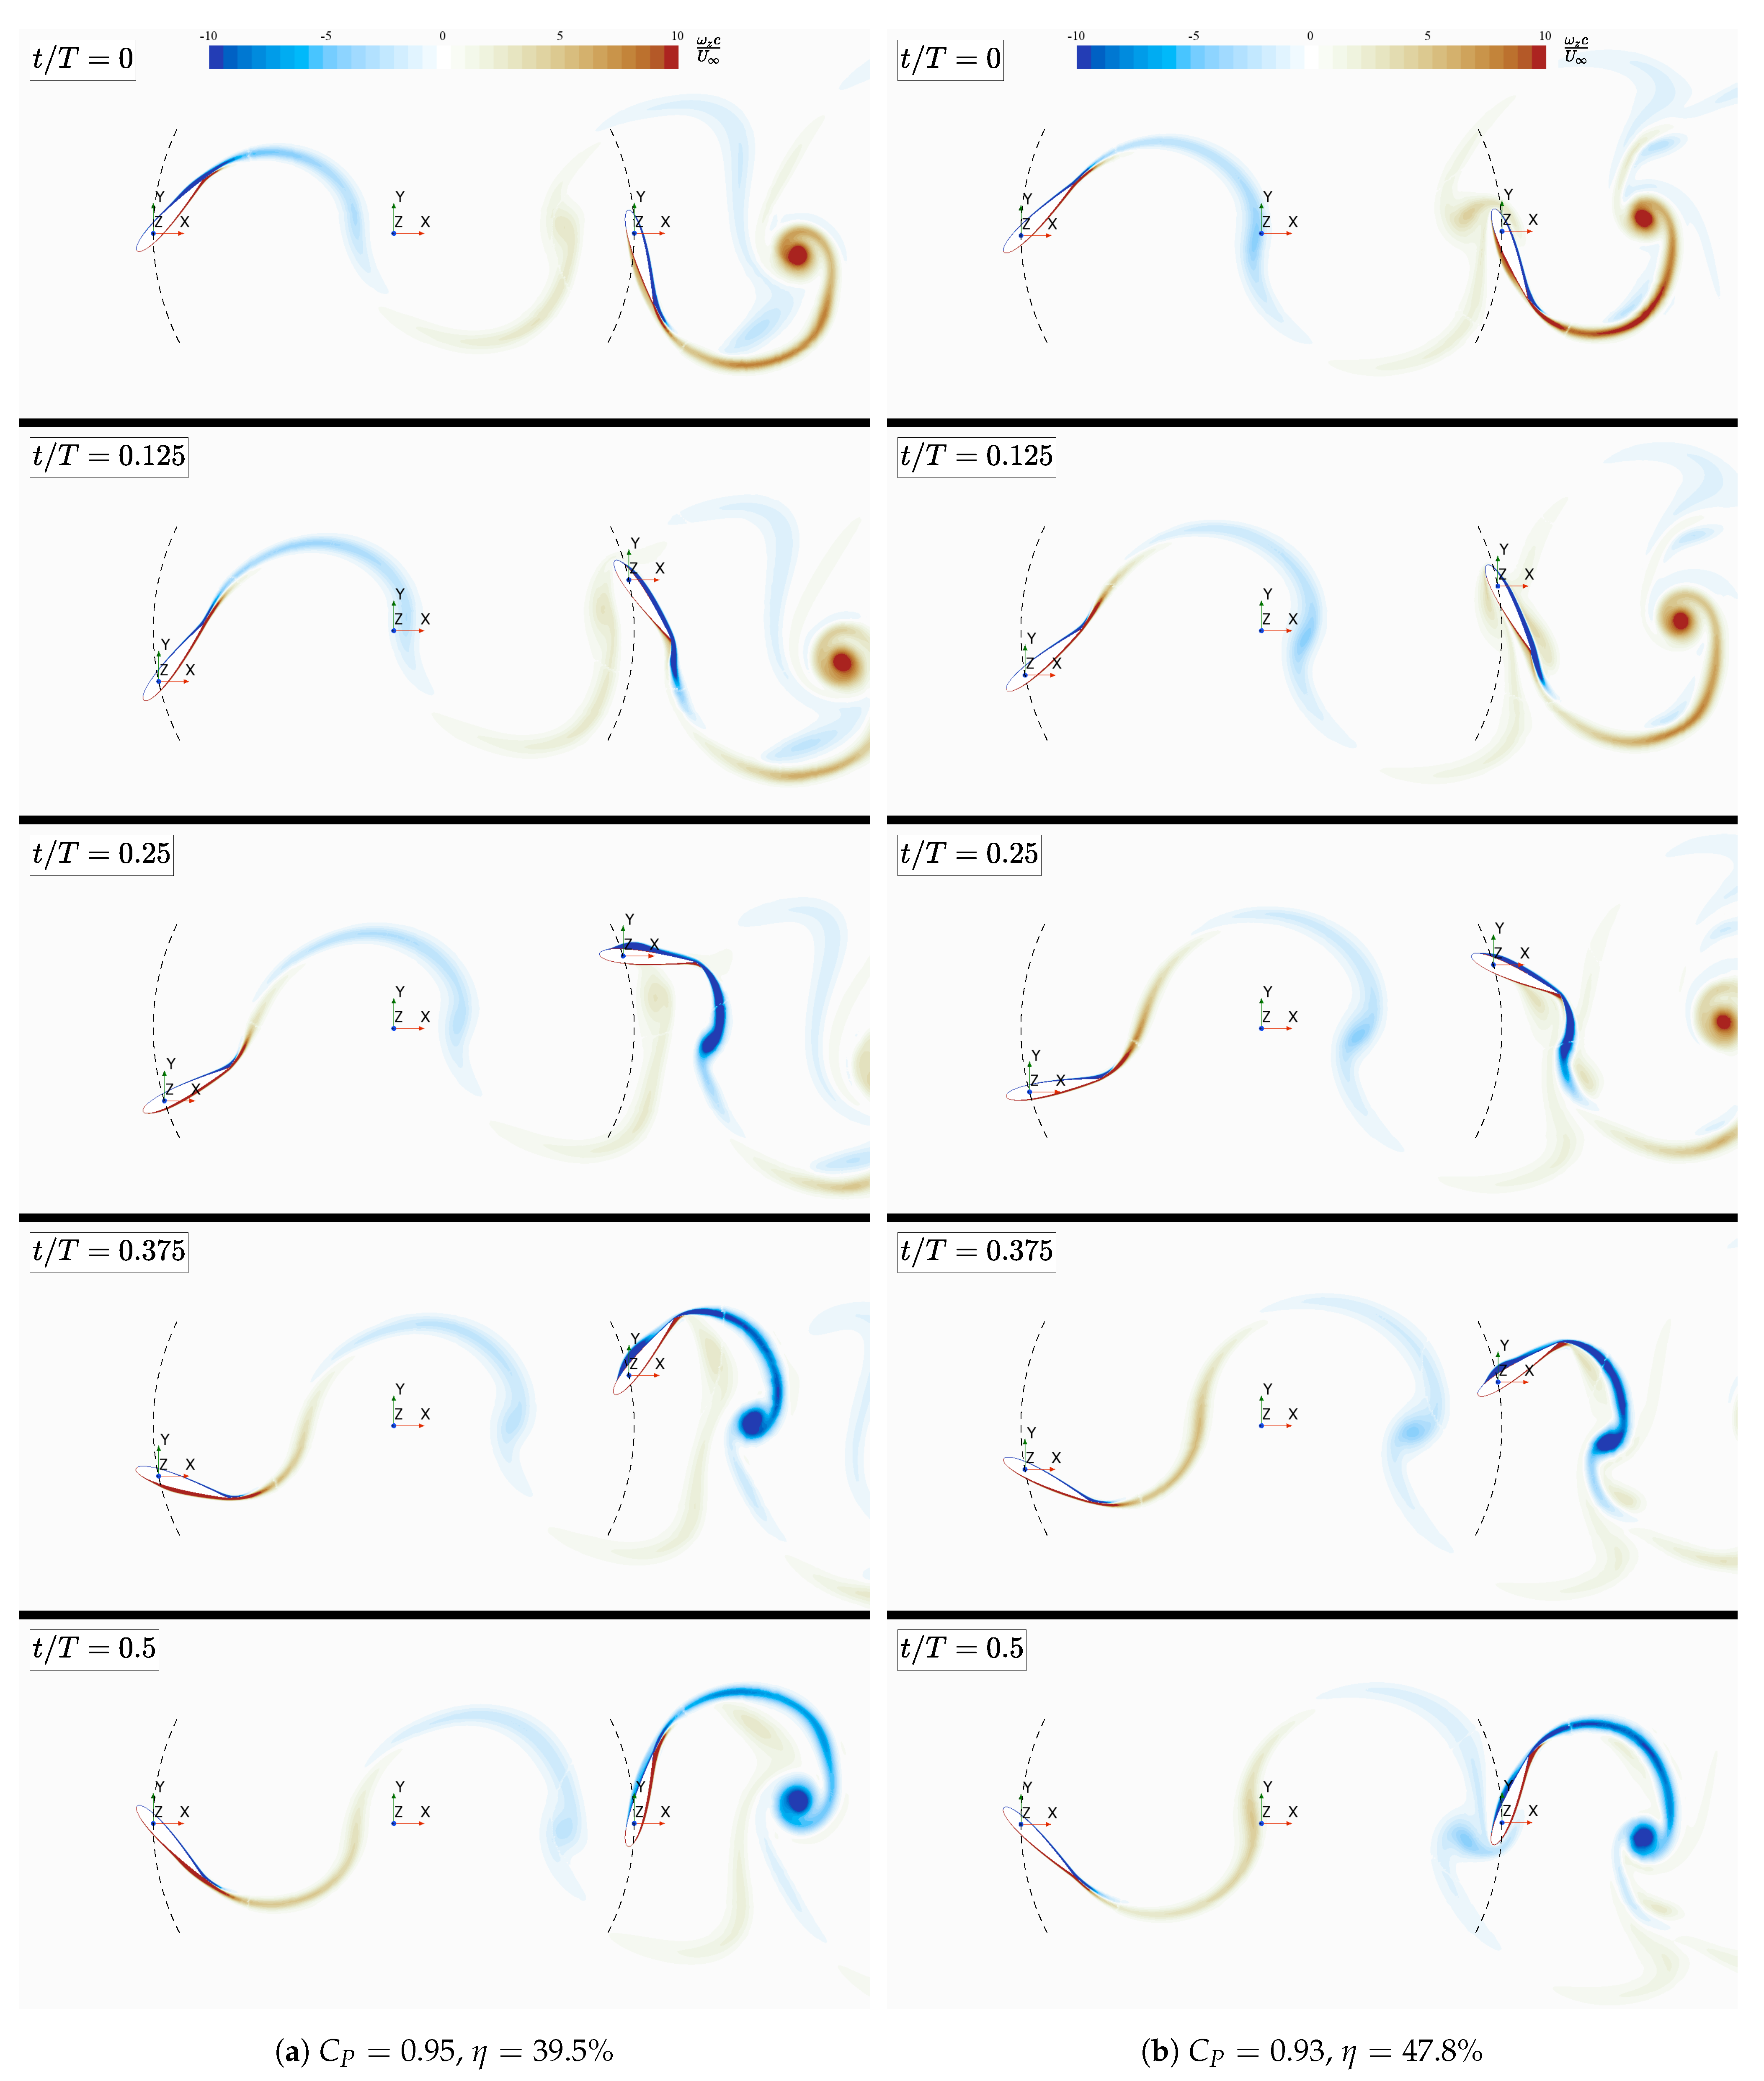
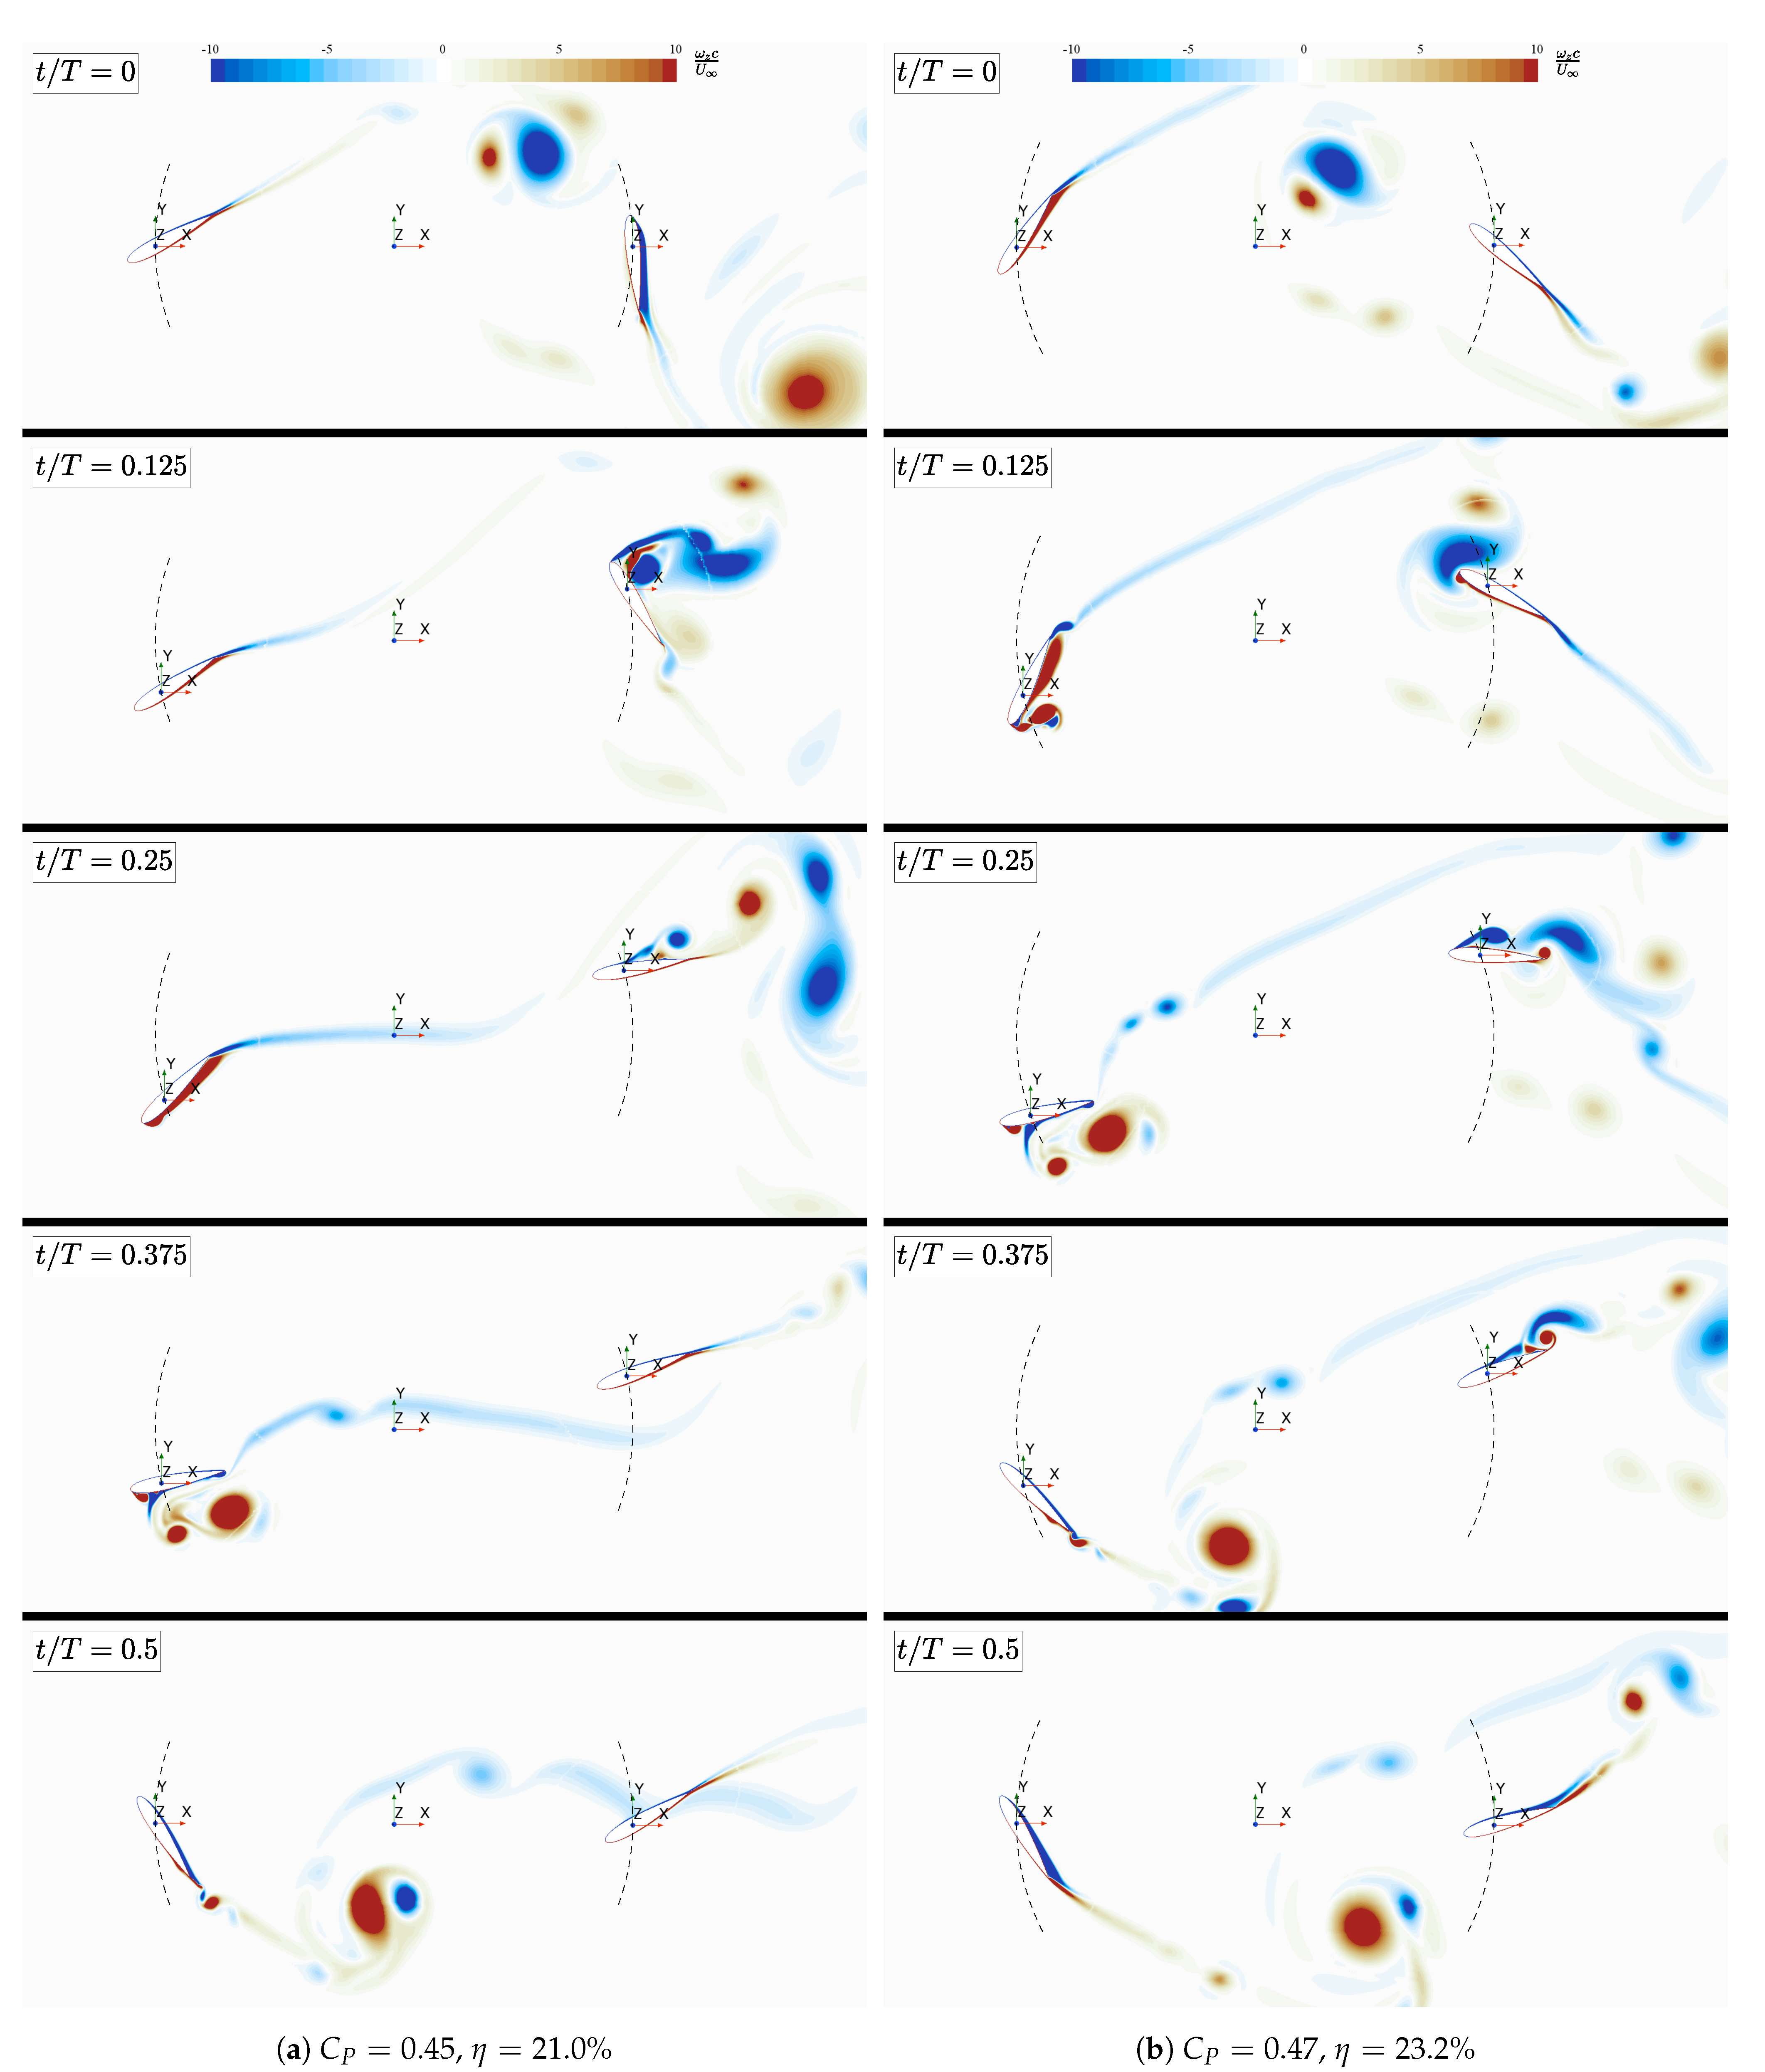
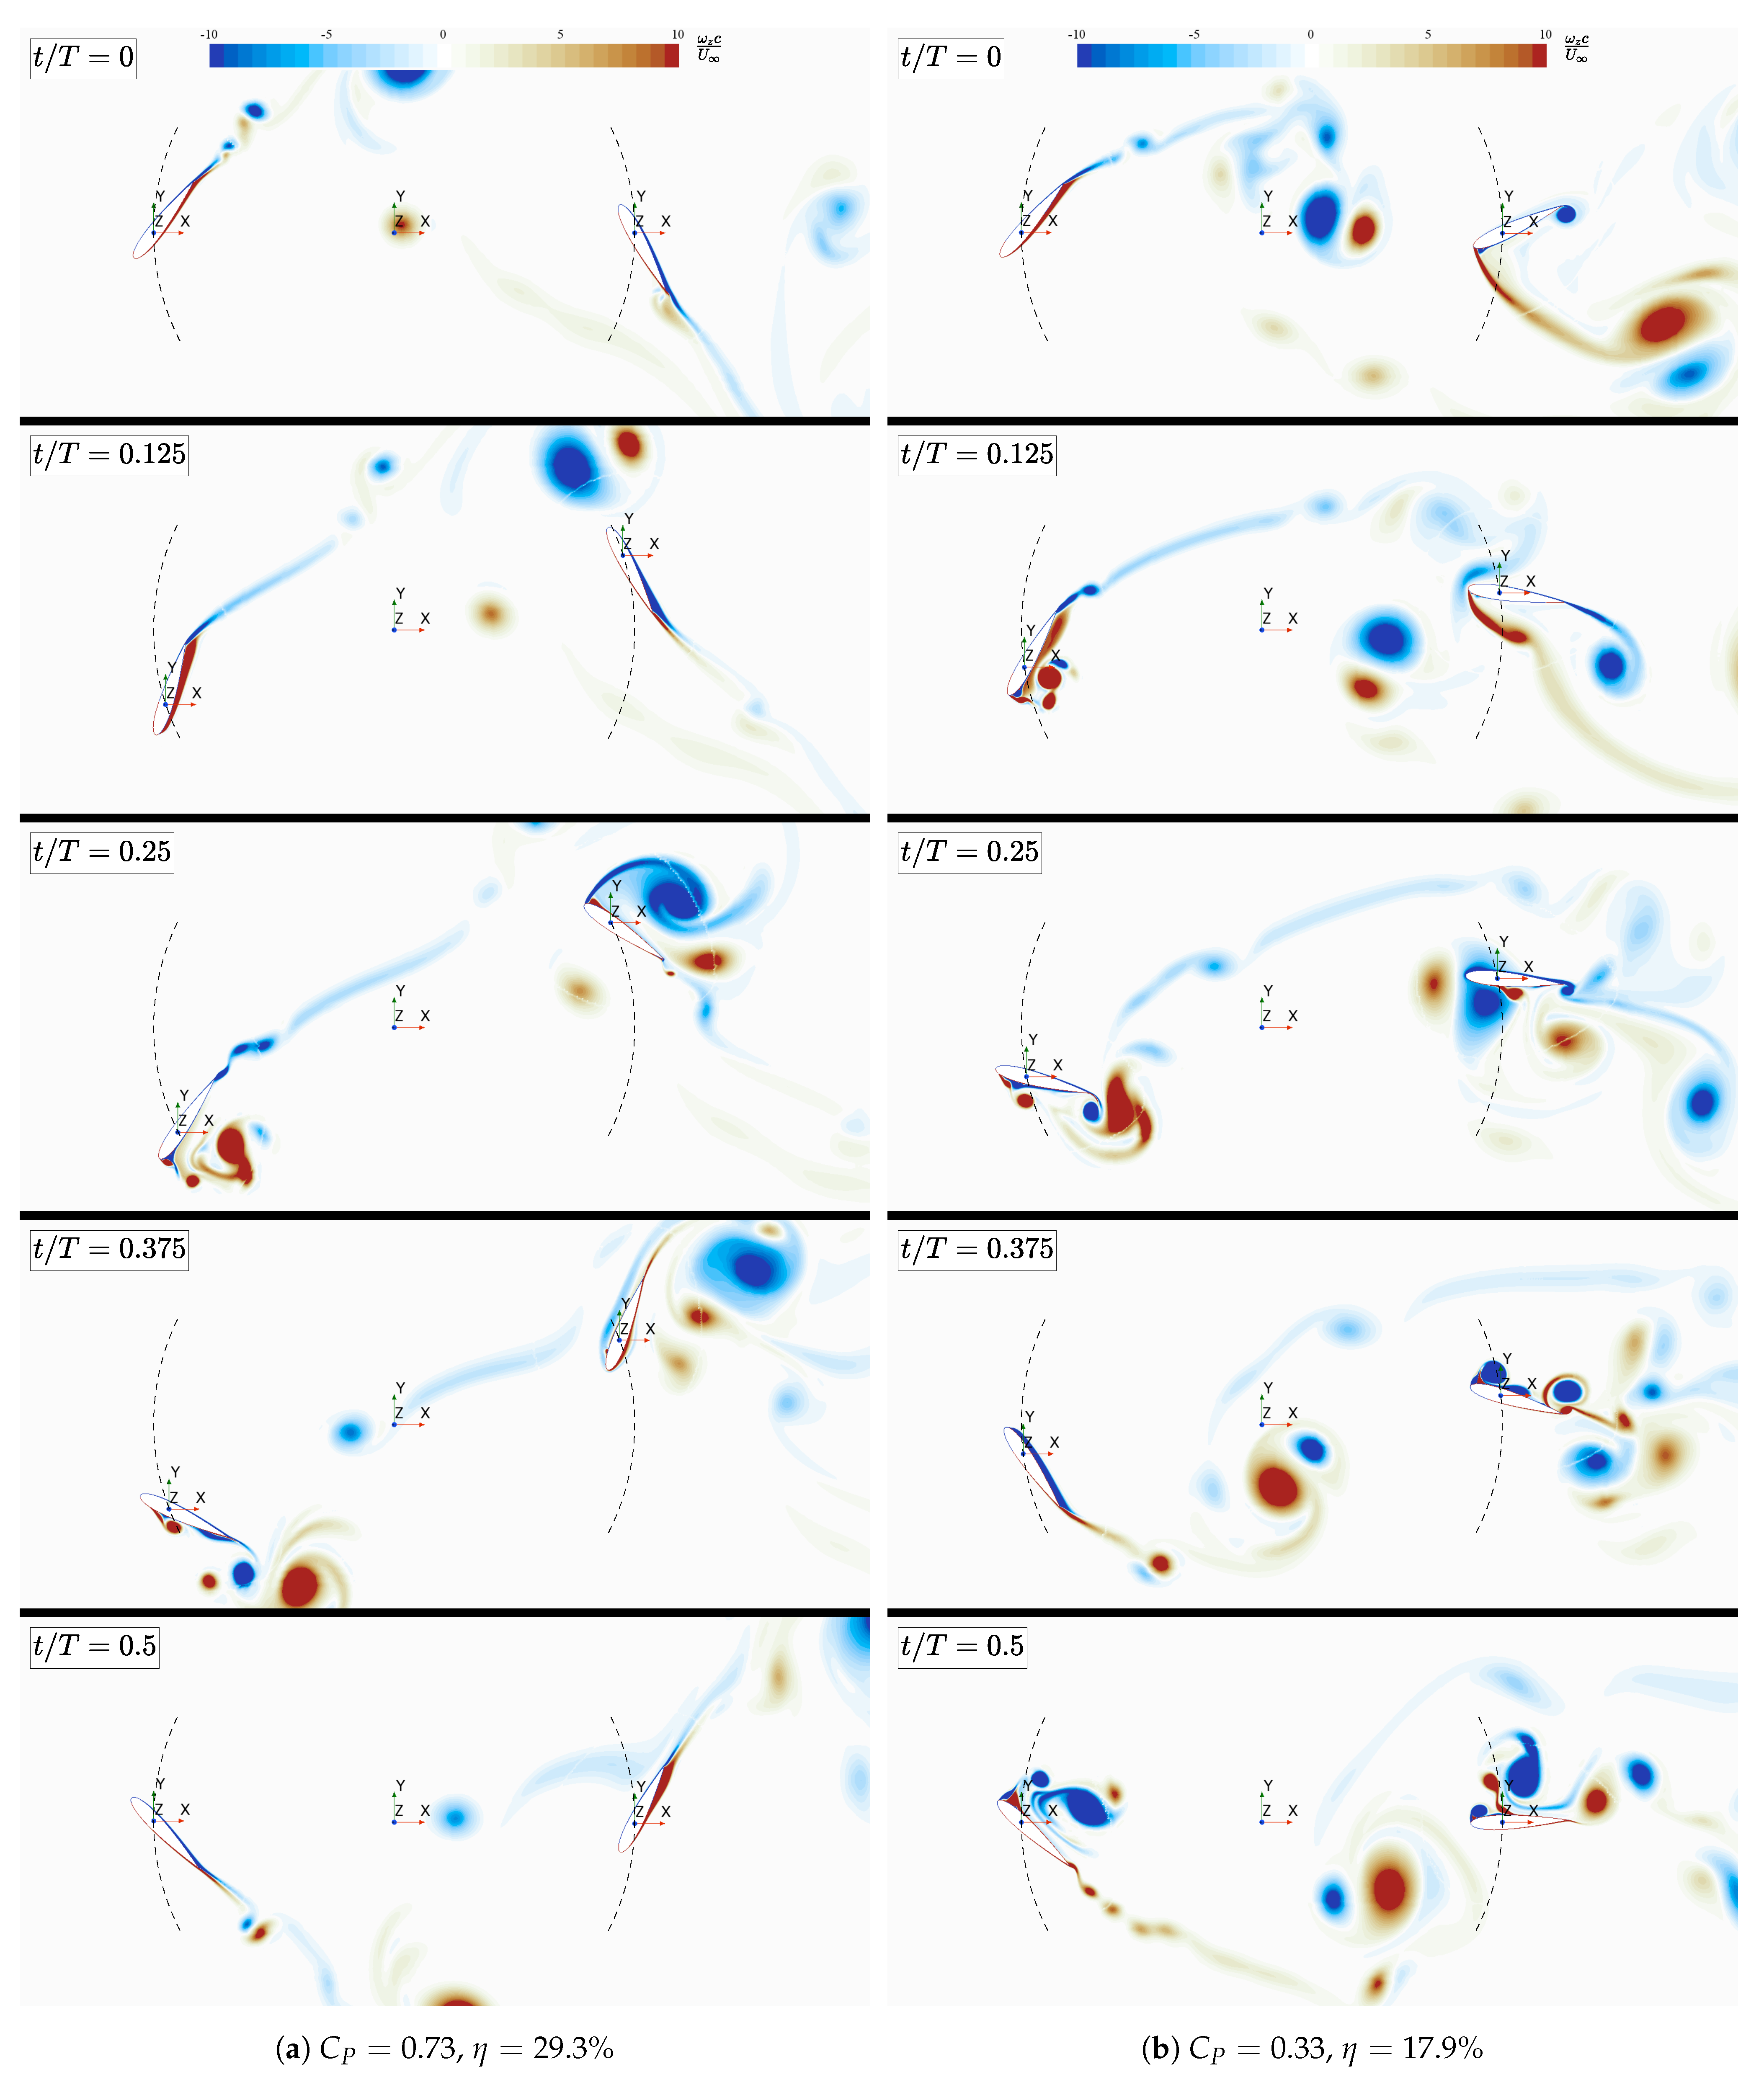
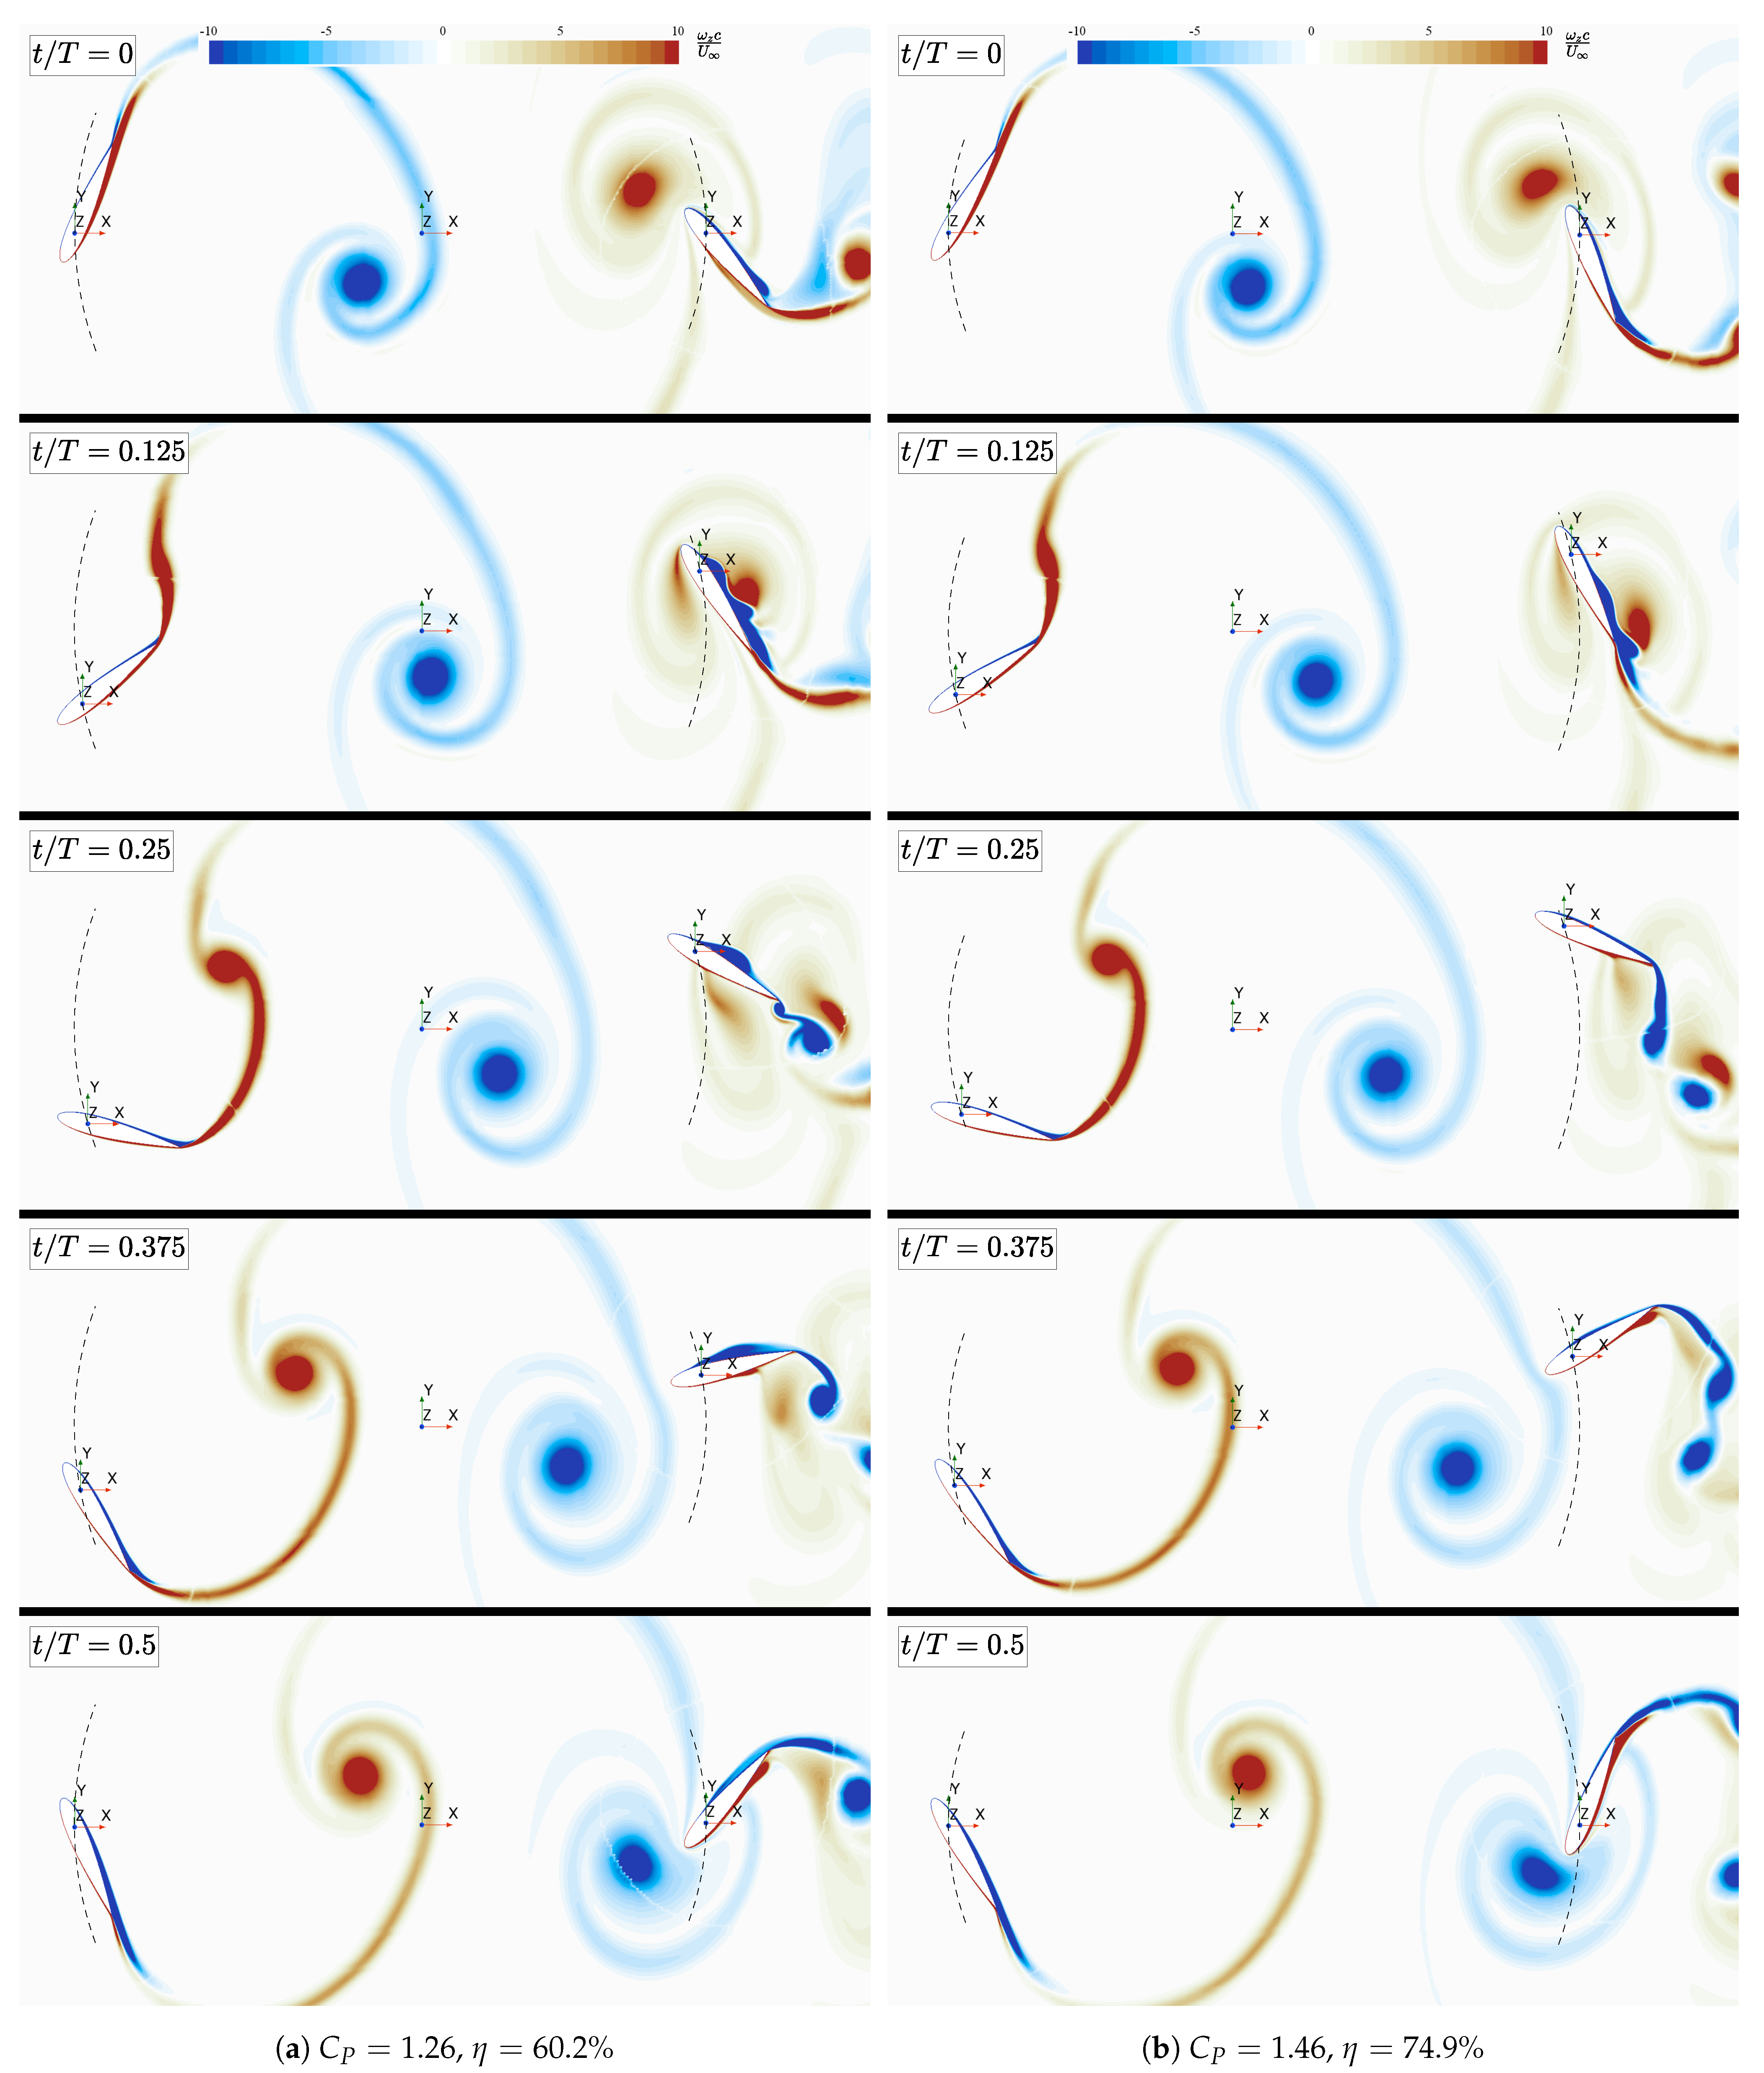
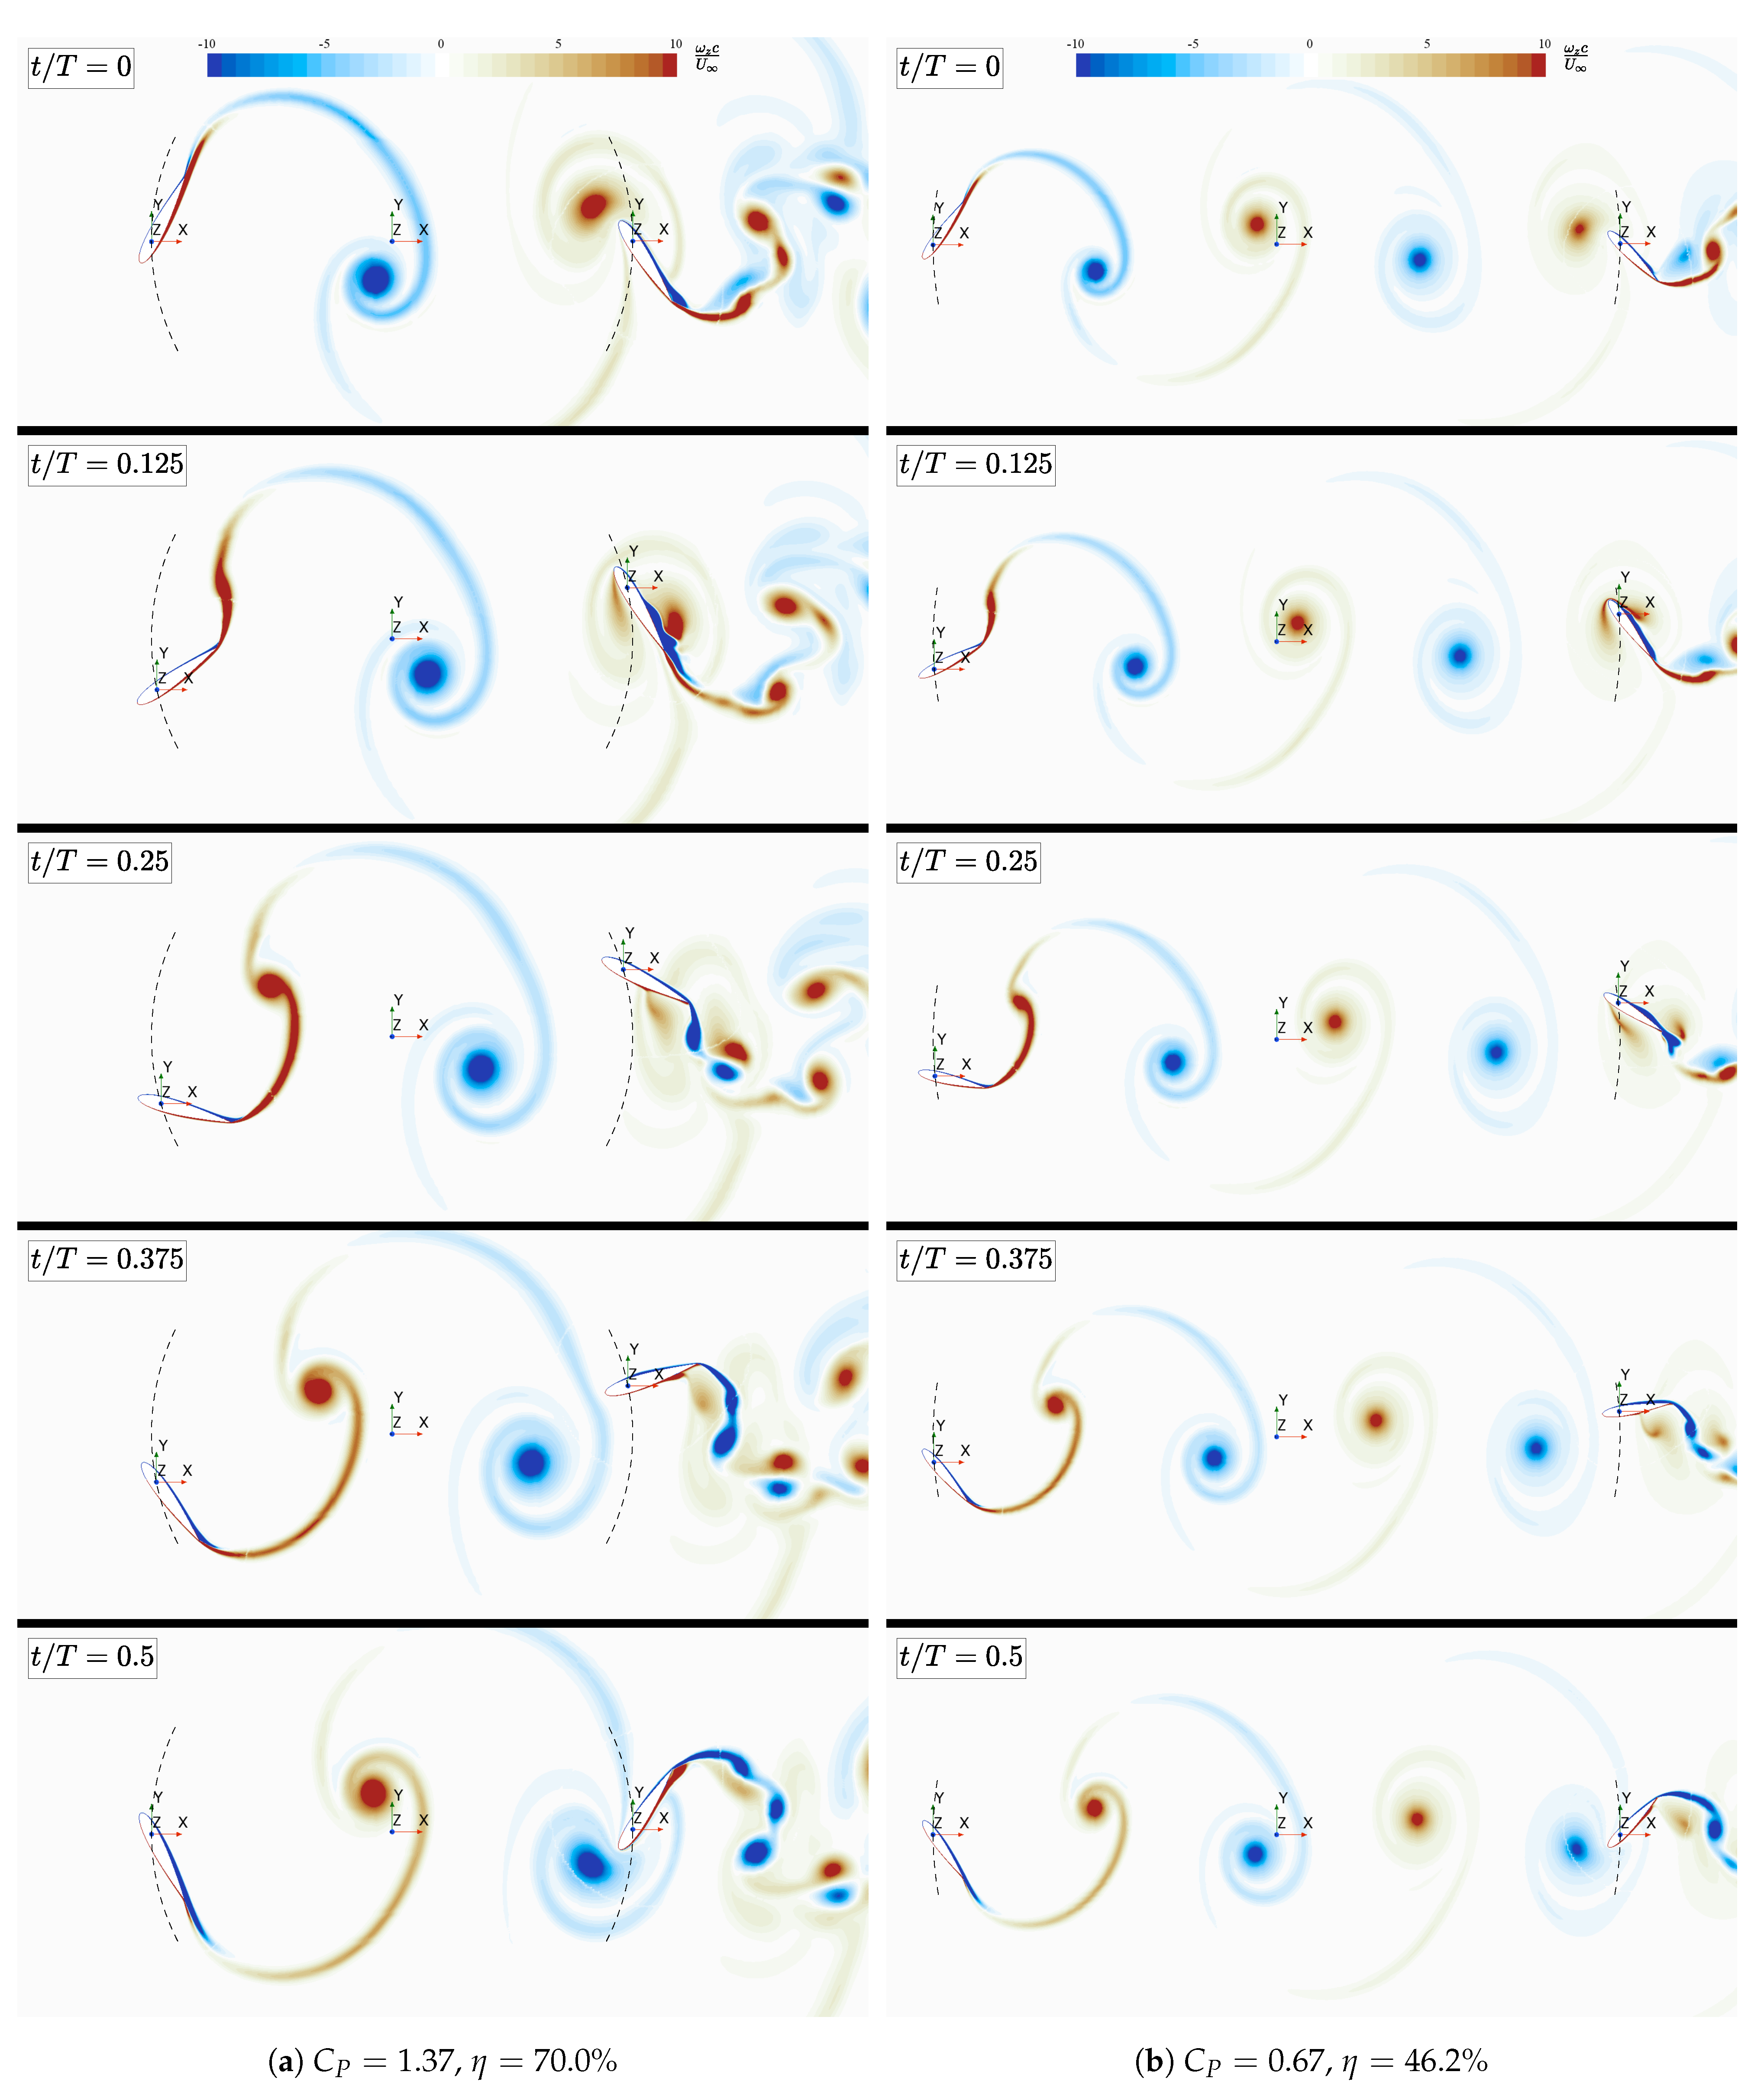
3.1. Effects of the Position of the Arm’s Pivot Point
3.2. Effects of the Length of the Arm
4. Conclusions
Author Contributions
Funding
Data Availability Statement
Acknowledgments
Conflicts of Interest
Abbreviations
| CFD | Computational fluid dynamics |
| FP-OFT | Fully passive oscillating foil turbine |
| FP-OFT-SA | Fully passive oscillating foil turbine on a swinging arm |
| FP-OFT-SAT | Fully passive oscillating foil turbine on a swinging arm in a tandem configuration |
| LEV | Leading-edge vortex |
| OFT | Oscillating foil turbine |
| SP-OFT | Semi-passive oscillating foil turbine |
| URANS | Unsteady Reynolds-averaged Navier–Stokes |
References
- Liu, Z.; Qu, H.; Song, X.; Chen, Z. A state-of-the-art review on energy-harvesting performance of the flapping hydrofoil with influential parameters. Renew. Energy 2025, 245, 122849. [Google Scholar] [CrossRef]
- McKinney, W.; DeLaurier, J. Wingmill: An Oscillating-Wing Windmill. J. Energy 1981, 5, 109–115. [Google Scholar] [CrossRef]
- Kinsey, T.; Dumas, G.; Lalande, G.; Ruel, J.; Méhut, A.; Viarouge, P.; Lemay, J.; Jean, Y. Prototype testing of a hydrokinetic turbine based on oscillating hydrofoils. Renew. Energy 2011, 36, 1710–1718. [Google Scholar] [CrossRef]
- Young, J.; Lai, J.C.; Platzer, M.F. A review of progress and challenges in flapping foil power generation. Prog. Aerosp. Sci. 2014, 67, 2–28. [Google Scholar] [CrossRef]
- Young, J.; Lai, J.; Platzer, M. Flapping foil power generation: Review and potential in pico-hydro application. In Proceedings of the 2015 International Conference on Sustainable Energy Engineering and Application (ICSEEA), Bandung, Indonesia, 5–7 October 2015; pp. 95–100. [Google Scholar] [CrossRef]
- Xiao, Q.; Zhu, Q. A review on flow energy harvesters based on flapping foils. J. Fluids Struct. 2014, 46, 174–191. [Google Scholar] [CrossRef]
- Wu, X.; Zhang, X.; Tian, X.; Li, X.; Lu, W. A review on fluid dynamics of flapping foils. Ocean. Eng. 2020, 195, 106712. [Google Scholar] [CrossRef]
- Ashraf, M.A.; Young, J.; Lai, J.C.S.; Platzer, M.F. Numerical Analysis of an Oscillating-Wing Wind and Hydropower Generator. Aiaa J. 2011, 49, 1374–1386. [Google Scholar] [CrossRef]
- Kinsey, T.; Dumas, G. Optimal Tandem Configuration for Oscillating-Foils Hydrokinetic Turbine. J. Fluids Eng. 2012, 134, 031103. [Google Scholar] [CrossRef]
- Young, J.; Ashraf, M.A.; Lai, J.C.S.; Platzer, M.F. Numerical Simulation of Fully Passive Flapping Foil Power Generation. Aiaa J. 2013, 51, 2727–2739. [Google Scholar] [CrossRef]
- Kim, J.; Kim, D.G.; Jung, S.; Moon, S.M.; Ko, J.H. Experimental study of a fully passive flapping hydrofoil turbine with a dual configuration and a coupling mechanism. Renew. Energy 2023, 208, 191–202. [Google Scholar] [CrossRef]
- Kim, D.G.; Kim, J.; Ko, J.H. An experimental investigation of the performance of a power transmission mechanism for a flapping-foil hydrokinetic turbine. Renew. Energy 2024, 237, 121636. [Google Scholar] [CrossRef]
- Veilleux, J.C.; Dumas, G. Numerical optimization of a fully-passive flapping-airfoil turbine. J. Fluids Struct. 2017, 70, 102–130. [Google Scholar] [CrossRef]
- Duarte, L.; Dellinger, N.; Dellinger, G.; Ghenaim, A.; Terfous, A. Flapping Foil Hydrokinetic Turbine: From a Strongly Coupled FSI Solver to the Experiment in a Confined Channel. In Proceedings of the Advances in Critical Flow Dynamics Involving Moving/Deformable Structures with Design Applications, Santorini, Greece, 18–22 June 2018; Braza, M., Hourigan, K., Triantafyllou, M., Eds.; Springer: Cham, Switzerland, 2021; pp. 315–325. [Google Scholar]
- Duarte, L.; Dellinger, N.; Dellinger, G.; Ghenaim, A.; Terfous, A. Experimental investigation of the dynamic behaviour of a fully passive flapping foil hydrokinetic turbine. J. Fluids Struct. 2019, 88, 1–12. [Google Scholar] [CrossRef]
- Boudreau, M.; Picard-Deland, M.; Dumas, G. A parametric study and optimization of the fully-passive flapping-foil turbine at high Reynolds number. Renew. Energy 2020, 146, 1958–1975. [Google Scholar] [CrossRef]
- Theodorakis, K.; Ntouras, D.; Papadakis, G. Investigation of a submerged fully passive energy-extracting flapping foil operating in sheared inflow. J. Fluids Struct. 2021, 113, 103674. [Google Scholar] [CrossRef]
- Duarte, L.; Dellinger, N.; Dellinger, G.; Ghenaim, A.; Terfous, A. Experimental optimisation of the pitching structural parameters of a fully passive flapping foil turbine. Renew. Energy 2021, 171, 1436–1444. [Google Scholar] [CrossRef]
- Huxham, G.H.; Cochard, S.; Patterson, J. Experimental Parametric Investigation of an Oscillating Hydrofoil Tidal Stream Energy Converter. In Proceedings of the 18th Australasian Fluid Mechanics Conference, Launceston, Australia, 3–7 December 2012; p. 4. [Google Scholar]
- Karbasian, H.; Esfahani, J.; Barati, E. The power extraction by flapping foil hydrokinetic turbine in swing arm mode. Renew. Energy 2016, 88, 130–142. [Google Scholar] [CrossRef]
- Sitorus, P.E.; Ko, J.H. Power extraction performance of three types of flapping hydrofoils at a Reynolds number of 1.7E6. Renew. Energy 2019, 132, 106–118. [Google Scholar] [CrossRef]
- Sitorus, P.E.; Le, T.Q.; Ko, J.H.; Truong, T.Q.; Park, H.C. Design, implementation, and power estimation of a lab-scale flapping-type turbine. J. Mar. Sci. Technol. 2016, 21, 115–128. [Google Scholar] [CrossRef]
- Liu, Z.; Qu, H.; Shi, H. Energy-harvesting performance of a coupled-pitching hydrofoil under the semi-passive mode. Appl. Energy 2020, 267, 114889. [Google Scholar] [CrossRef]
- Liu, Z.; Qu, H.; Zhang, G. Experimental and numerical investigations of a coupled-pitching hydrofoil under the fully-activated mode. Renew. Energy 2020, 155, 432–446. [Google Scholar] [CrossRef]
- Cloutier, D.; Olivier, M.; Dumas, G. Parametric Study of a Fully Passive Oscillating Foil on a Swinging Arm. Energies 2025, 18, 1277. [Google Scholar] [CrossRef]
- Zhao, F.; Jiang, Q.; Wang, Z.; Qadri, M.N.M.; Li, L.; Tang, H. Interaction of two fully passive flapping foils arranged in tandem and its influence on flow energy harvesting. Energy 2023, 268, 126714. [Google Scholar] [CrossRef]
- Wang, G.; Ng, B.F. Energy harvesting performance of a tandem-hydrofoil based closely-interconnected tidal array. Energy Convers. Manag. 2023, 280, 116796. [Google Scholar] [CrossRef]
- Zhao, F.; Wang, Z.; Qadri, M.N.M.; Khan, O.; Munir, A.; Shahzad, A.; Tang, H. Effects of wake interaction on energy extraction performance of tandem semi-active flapping foils. Phys. Fluids 2023, 35, 087112. [Google Scholar] [CrossRef]
- Qu, H.l.; Liu, Z. Numerical Study on the Energy Extraction Performance of Coupled Tandem Flapping Hydrofoils. China Ocean. Eng. 2022, 36, 38–49. [Google Scholar] [CrossRef]
- Naccache, G.; Paraschivoiu, M. Development of the Dual Vertical Axis Wind Turbine Using Computational Fluid Dynamics. J. Fluids Eng. 2017, 139, 121105. [Google Scholar] [CrossRef]
- Naccache, G.; Paraschivoiu, M. Parametric study of the dual vertical axis wind turbine using CFD. J. Wind. Eng. Ind. Aerodyn. 2018, 172, 244–255. [Google Scholar] [CrossRef]
- Siemens Digital Industries Software. Simcenter STAR-CCM+ User Guide, v.2021.2; Siemens Digital Industries Software: Plano, TX, USA, 2021. [Google Scholar]
- Spalart, P.; Rumsey, C. Effective Inflow Conditions for Turbulence Models in Aerodynamic Calculations. Am. Inst. Aeronaut. Astronaut. 2007, 45, 2544–2553. [Google Scholar] [CrossRef]
- Polyak, B. Some methods of speeding up the convergence of iteration methods. Ussr Comput. Math. Math. Phys. 1964, 4, 1–17. [Google Scholar] [CrossRef]
- Ruder, S. An overview of gradient descent optimization algorithms. arXiv 2016. [Google Scholar] [CrossRef]
- Newman, B. Multiple actuator-disc theory for wind turbines. J. Wind. Eng. Ind. Aerodyn. 1986, 24, 215–225. [Google Scholar] [CrossRef]


| Case | Number of Cells | Size of Cells in Refined Zone | |||
|---|---|---|---|---|---|
| Coarse | 88,471 | ||||
| Medium | 178,623 | ||||
| Fine | 514,832 | ||||
| Kinsey and Dumas [9] | 181,200 |
| Parameter | Coupled Flutter | Stall Flutter | ||
|---|---|---|---|---|
| Geared | Gearless | Geared | Gearless | |
| 30.237 | 123.486 | 41.670 | 38.263 | |
| 9.131 | 8.396 | 21.433 | 19.070 | |
| 17.948 | 169.883 | 13.914 | 15.235 | |
| 1.712 | 0.431 | 0.125 | 0.108 | |
| 1.458 | 0.397 | 0.087 | 0.103 | |
| 0 | 0 | 0.139 | 0.126 | |
| 0 | 0 | 0.128 | 0.116 | |
| 2.812 | 0.484 | 0.031 | 0.031 | |
| 2.800 | 0.635 | 0.031 | 0.031 | |
| 0.561 | 0.583 | −0.030 | −0.035 | |
| 0.683 | 0.407 | −0.030 | −0.032 | |
| (SD) | 1.52 (0.00) | 0.77 (0.01) | 0.03 (0.17) | −0.08 (0.12) |
| (SD) | −0.15 (0.00) | 0.16 (0.00) | 0.42 (0.08) | 0.41 (0.08) |
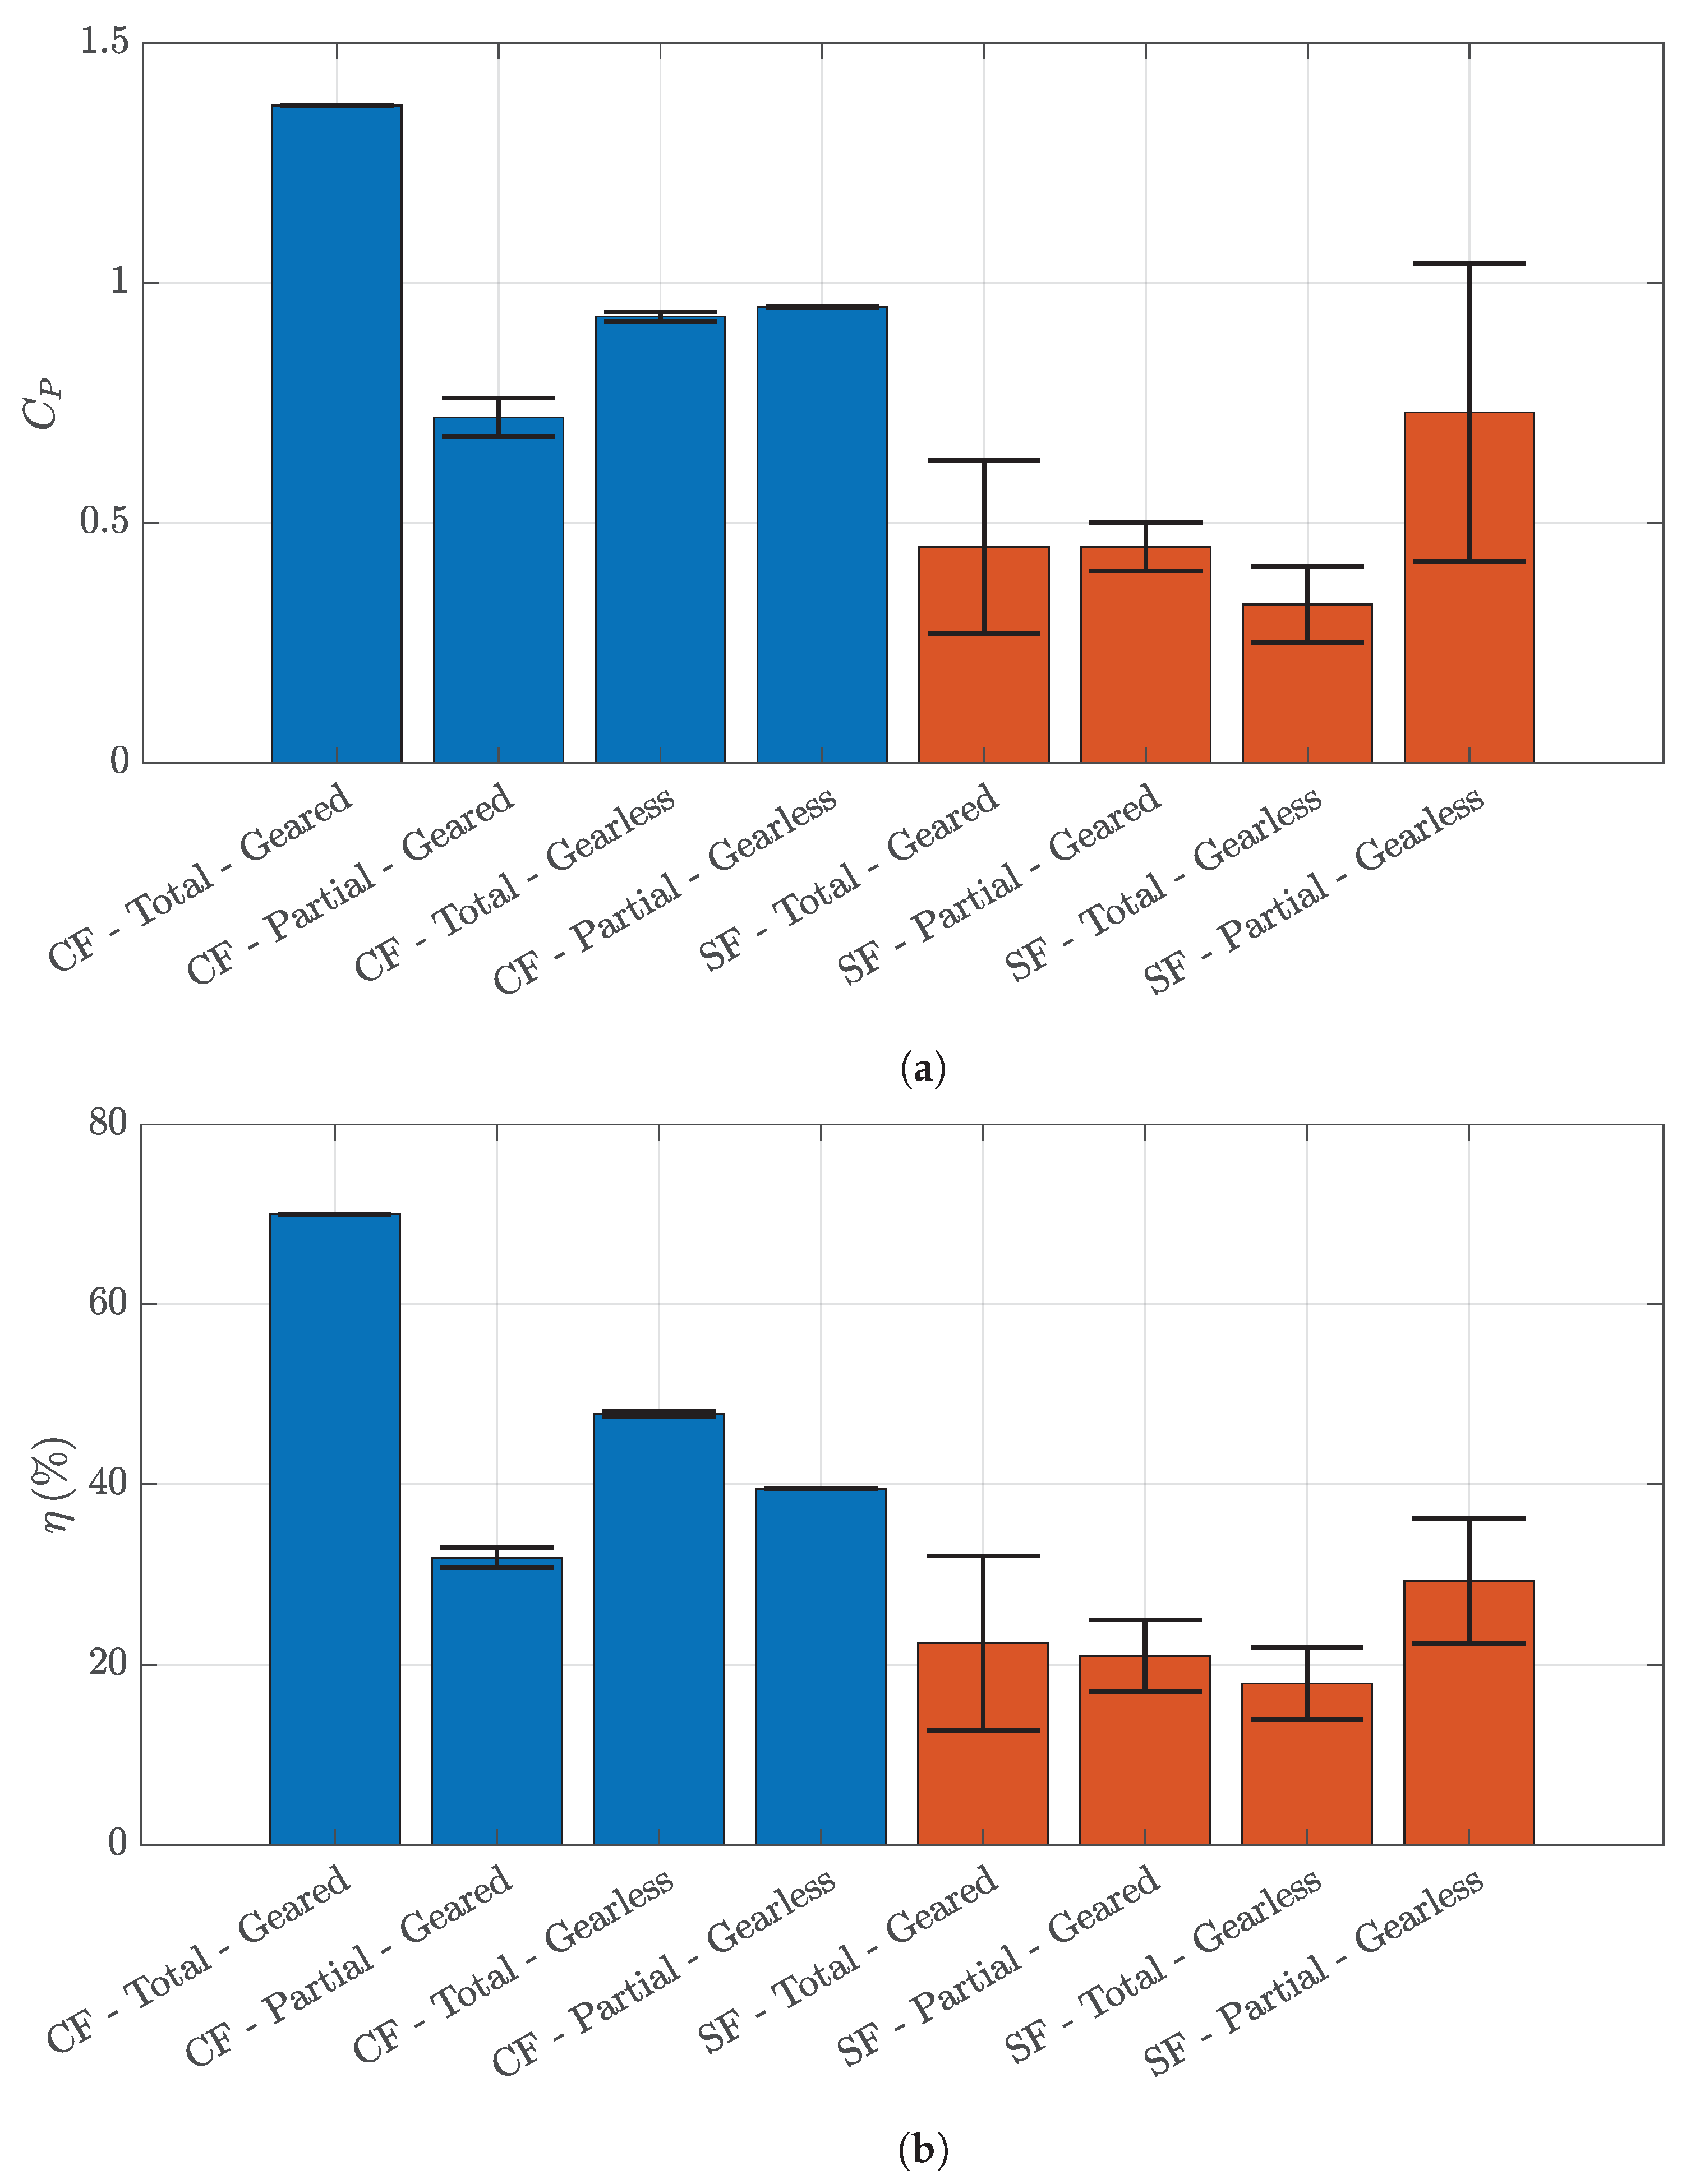
| (SD) | 1.37 (0.00) | 0.93 (0.01) | 0.45 (0.18) | 0.33 (0.08) |
| % (SD) | 70.0 (0.0) | 47.8 (0.3) | 22.4 (9.7) | 17.9 (4.0) |
| (SD) | 4.76 (0.00) | 5.08 (0.00) | 11.63 (1.14) | 10.94 (1.55) |
| (SD) | 1.96 (0.00) | 1.94 (0.00) | 1.90 (0.36) | 1.11 (0.35) |
| Parameter | Coupled Flutter | Stall Flutter | ||
|---|---|---|---|---|
| Geared | Gearless | Geared | Gearless | |
| 22.488 | 122.923 | 41.515 | 37.445 | |
| 10.008 | 7.492 | 19.945 | 18.510 | |
| 21.668 | 158.817 | 14.836 | 13.177 | |
| 2.474 | 0.397 | 0.088 | 0.084 | |
| 0 | 0 | 0.124 | 0.106 | |
| 3.024 | 0.495 | 0.031 | 0.031 | |
| 0.512 | 0.411 | −0.029 | −0.028 | |
| (SD) | 0.31 (0.03) | 0.61 (0.00) | −0.07 (0.09) | 0.09 (0.20) |
| (SD) | 0.41 (0.01) | 0.34 (0.00) | 0.52 (0.10) | 0.64 (0.16) |
| (SD) | 0.72 (0.04) | 0.95 (0.00) | 0.45 (0.05) | 0.73 (0.31) |
| % (SD) | 31.9 (1.1) | 39.5 (0.0) | 21.0 (4.0) | 29.3 (6.9) |
| (SD) | 5.84 (0.08) | 5.30 (0.00) | 12.07 (1.53) | 11.00 (1.24) |
| (SD) | 2.27 (0.05) | 2.41 (0.00) | 2.15 (0.20) | 2.38 (0.59) |
| Parameter | Initial | Constant Heave Parameters | Scaled Heave Parameters | ||
|---|---|---|---|---|---|
| 30.237 | 30.237 | 30.237 | 20.359 | 20.359 | |
| 9.131 | 9.131 | 9.131 | 6.148 | 6.148 | |
| 17.948 | 17.948 | 17.948 | 12.085 | 12.085 | |
| 1.712 | 1.712 | 1.712 | 1.712 | 1.712 | |
| 1.458 | 1.458 | 1.458 | 1.458 | 1.458 | |
| 0 | 0 | 0 | 0 | 0 | |
| 0 | 0 | 0 | 0 | 0 | |
| 2.812 | 2.812 | 2.812 | 2.812 | 2.812 | |
| 2.800 | 2.800 | 2.800 | 2.800 | 2.800 | |
| 0.561 | 0.561 | 0.561 | 0.561 | 0.561 | |
| 0.683 | 0.683 | 0.683 | 0.683 | 0.683 | |
| (SD) | 1.52 (0.00) | 1.26 (0.00) | 1.73 (0.00) | 0.56 (0.22) | 0.71 (0.37) |
| (SD) | −0.15 (0.00) | 0.00 (0.00) | −0.27 (0.00) | 0.23 (0.14) | −0.08 (0.12) |
| (SD) | 1.37 (0.00) | 1.26 (0.00) | 1.46 (0.00) | 0.79 (0.29) | 0.63 (0.42) |
| % (SD) | 70.0 (0.0) | 60.2 (0.0) | 74.9 (0.0) | 35.3 (11.0) | 32.8 (21.7) |
| (SD) | 4.76 (0.00) | 4.73 (0.00) | 4.78 (0.00) | 4.67 (0.25) | 4.68 (0.18) |
| (SD) | 1.96 (0.00) | 2.10 (0.00) | 1.95 (0.00) | 2.19 (0.15) | 1.97 (0.67) |
| Parameter | ||
|---|---|---|
| 30.237 | 120.947 | |
| 9.131 | 36.524 | |
| 17.948 | 71.791 | |
| 1.712 | 1.712 | |
| 1.458 | 1.458 | |
| 0 | 0 | |
| 0 | 0 | |
| 2.812 | 2.812 | |
| 2.800 | 2.800 | |
| 0.561 | 0.561 | |
| 0.683 | 0.683 | |
| (SD) | 1.52 (0.00) | 0.89 (0.08) |
| (SD) | −0.15 (0.00) | −0.22 (0.02) |
| (SD) | 1.37 (0.00) | 0.67 (0.08) |
| % (SD) | 70.0 (0.0) | 46.2 (4.2) |
| (SD) | 4.76 (0.00) | 4.73 (0.03) |
| (SD) | 1.96 (0.00) | 1.45 (0.06) |
Disclaimer/Publisher’s Note: The statements, opinions and data contained in all publications are solely those of the individual author(s) and contributor(s) and not of MDPI and/or the editor(s). MDPI and/or the editor(s) disclaim responsibility for any injury to people or property resulting from any ideas, methods, instructions or products referred to in the content. |
© 2025 by the authors. Licensee MDPI, Basel, Switzerland. This article is an open access article distributed under the terms and conditions of the Creative Commons Attribution (CC BY) license (https://creativecommons.org/licenses/by/4.0/).
Share and Cite
Cloutier, D.; Olivier, M.; Dumas, G. A Parametric Study of a Fully Passive Oscillating Foil Turbine on a Swinging Arm in a Tandem Configuration. Energies 2025, 18, 3253. https://doi.org/10.3390/en18133253
Cloutier D, Olivier M, Dumas G. A Parametric Study of a Fully Passive Oscillating Foil Turbine on a Swinging Arm in a Tandem Configuration. Energies. 2025; 18(13):3253. https://doi.org/10.3390/en18133253
Chicago/Turabian StyleCloutier, Dominic, Mathieu Olivier, and Guy Dumas. 2025. "A Parametric Study of a Fully Passive Oscillating Foil Turbine on a Swinging Arm in a Tandem Configuration" Energies 18, no. 13: 3253. https://doi.org/10.3390/en18133253
APA StyleCloutier, D., Olivier, M., & Dumas, G. (2025). A Parametric Study of a Fully Passive Oscillating Foil Turbine on a Swinging Arm in a Tandem Configuration. Energies, 18(13), 3253. https://doi.org/10.3390/en18133253