
Exergy-Based Sustainability Assessment of Gold Mining in Colombia: A Comparative Analysis of Open-Pit and Alluvial Mining

 ,
,  and
and 
Abstract
Highlights
- Exergy analysis quantifies the sustainability of a process based on the environmental burden generated by using energy resources.
- Open-pit mining relies on fossil fuels (53%), while alluvial mining is mostly water-dependent (94%)
- Strategies include improving efficiency, minimizing exergy losses, using renewables, and adopting circular economy principles.
- Exergy efficiency is improved by reduction in exergy inputs and exergy emissions/waste, i.e., reduction in the loss of useful energy.
- Findings highlight inefficiencies, guiding resource optimization, and reduced environmental impact.
Abstract
1. Introduction
Exergy Analysis in the Mining Sector
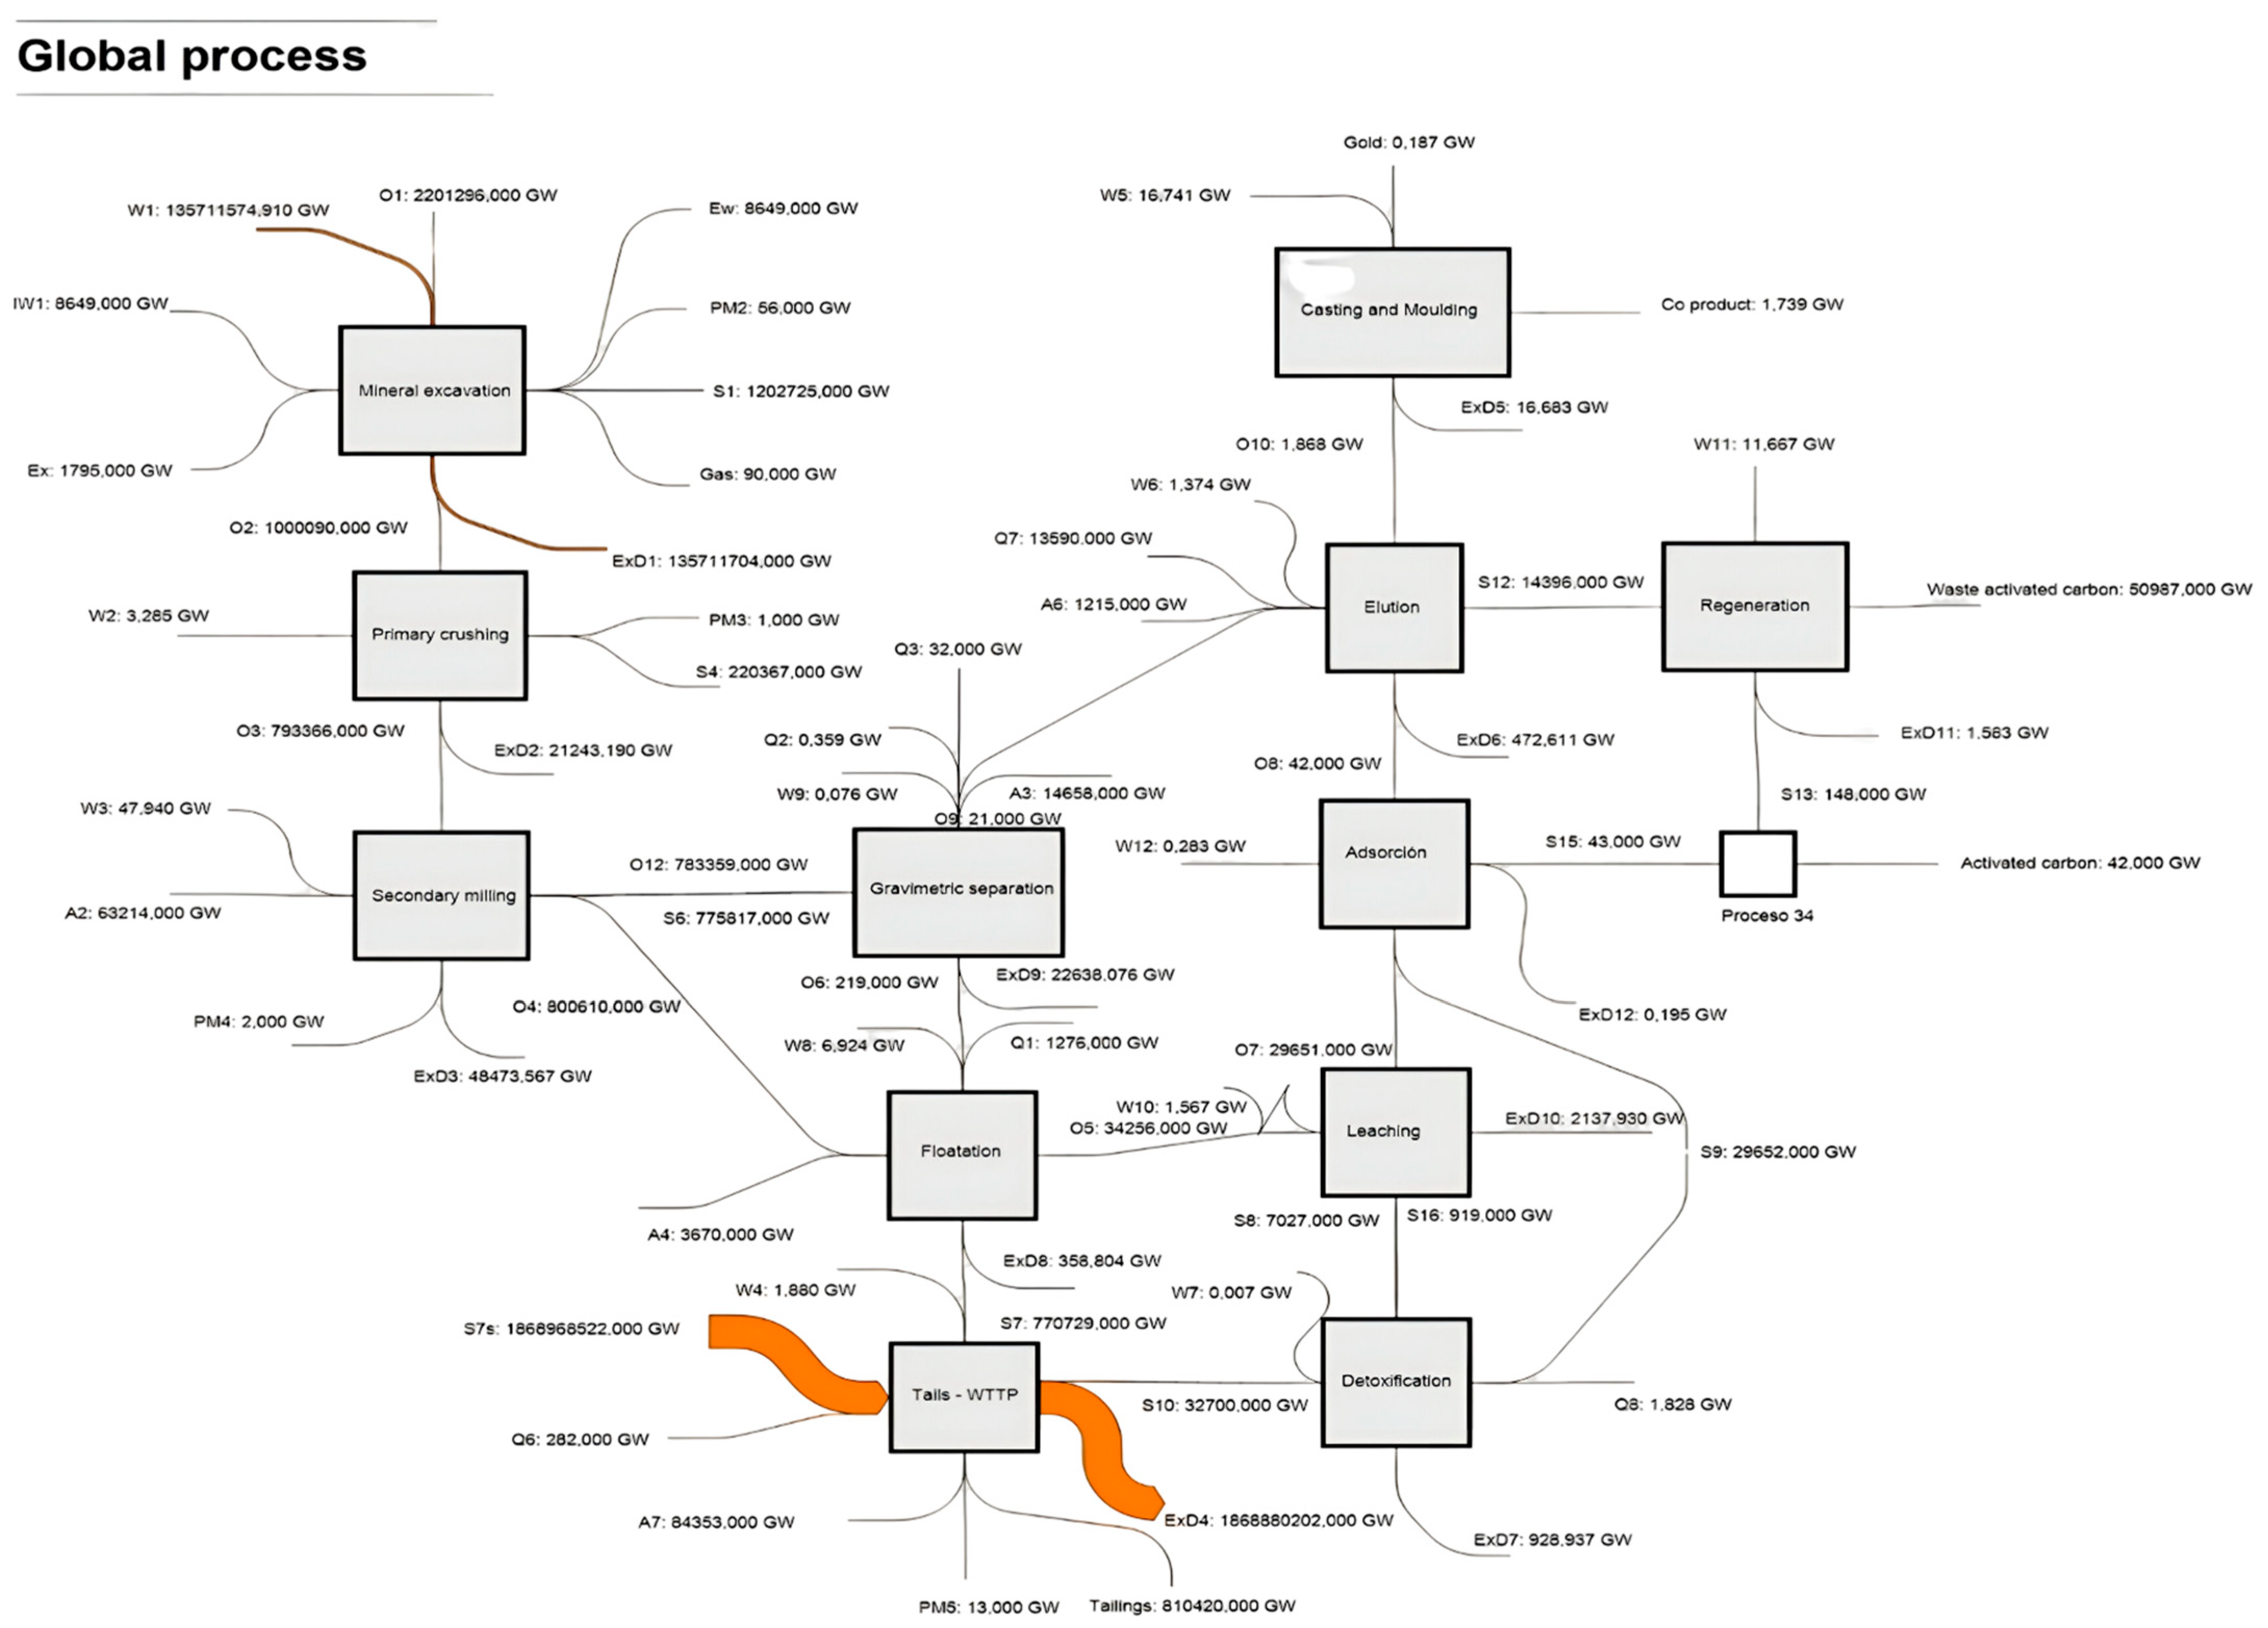
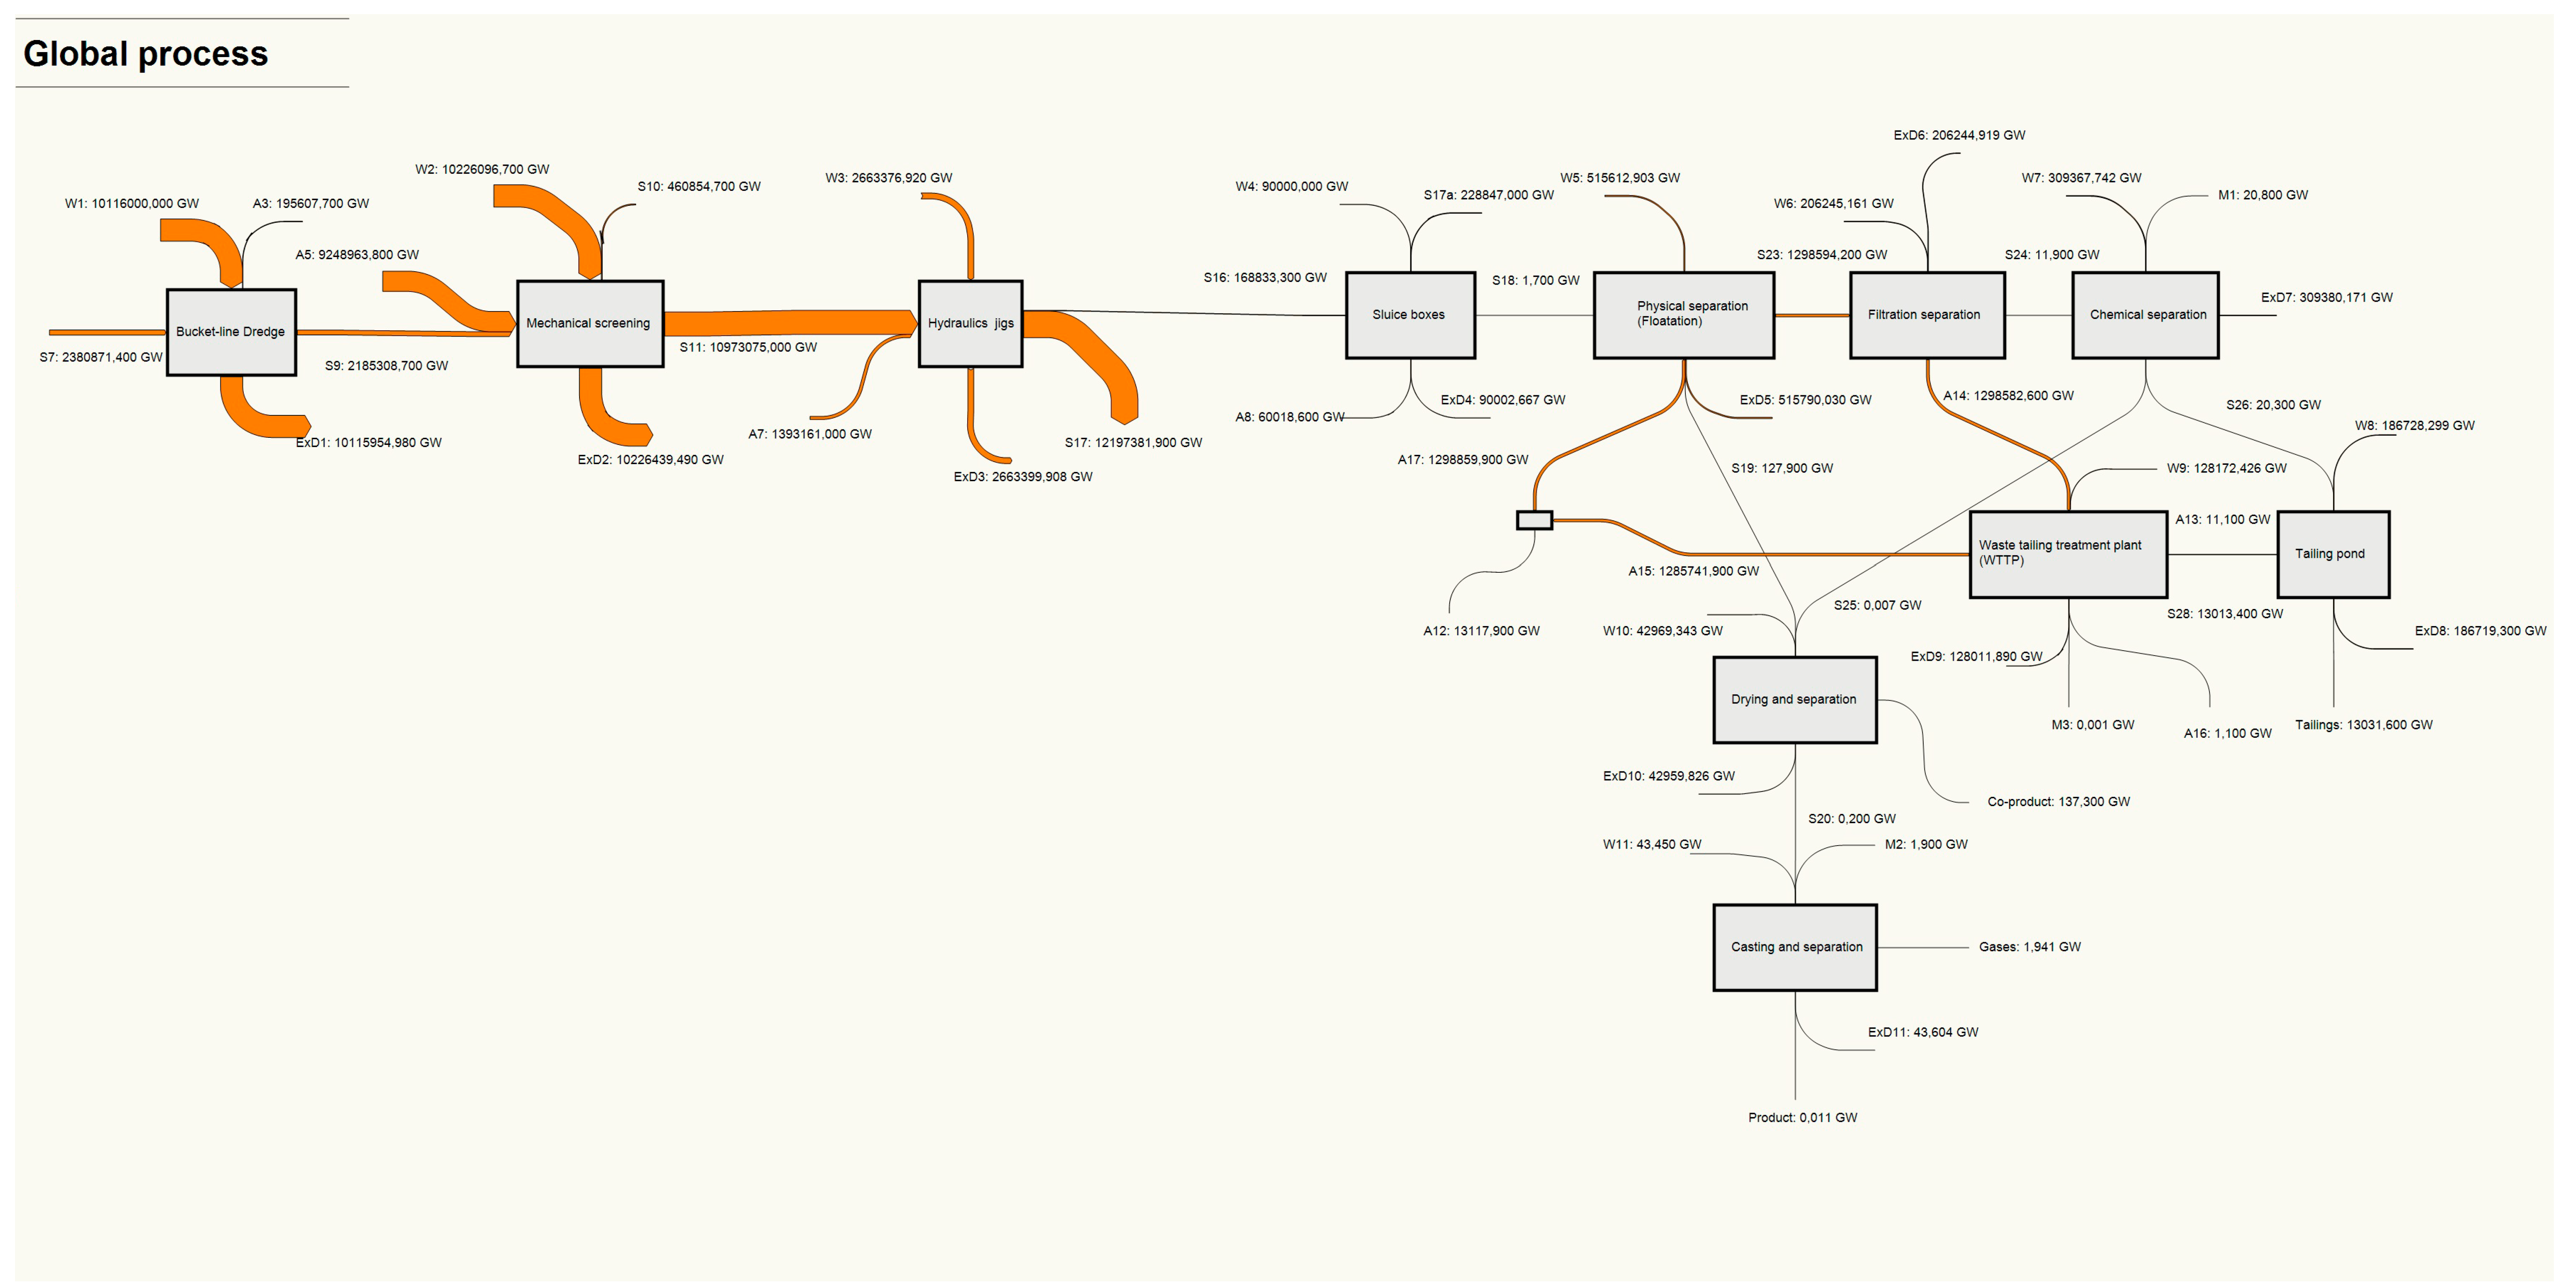
2. Case Study: Open-Pit and Alluvial Mining Technologies in Colombia
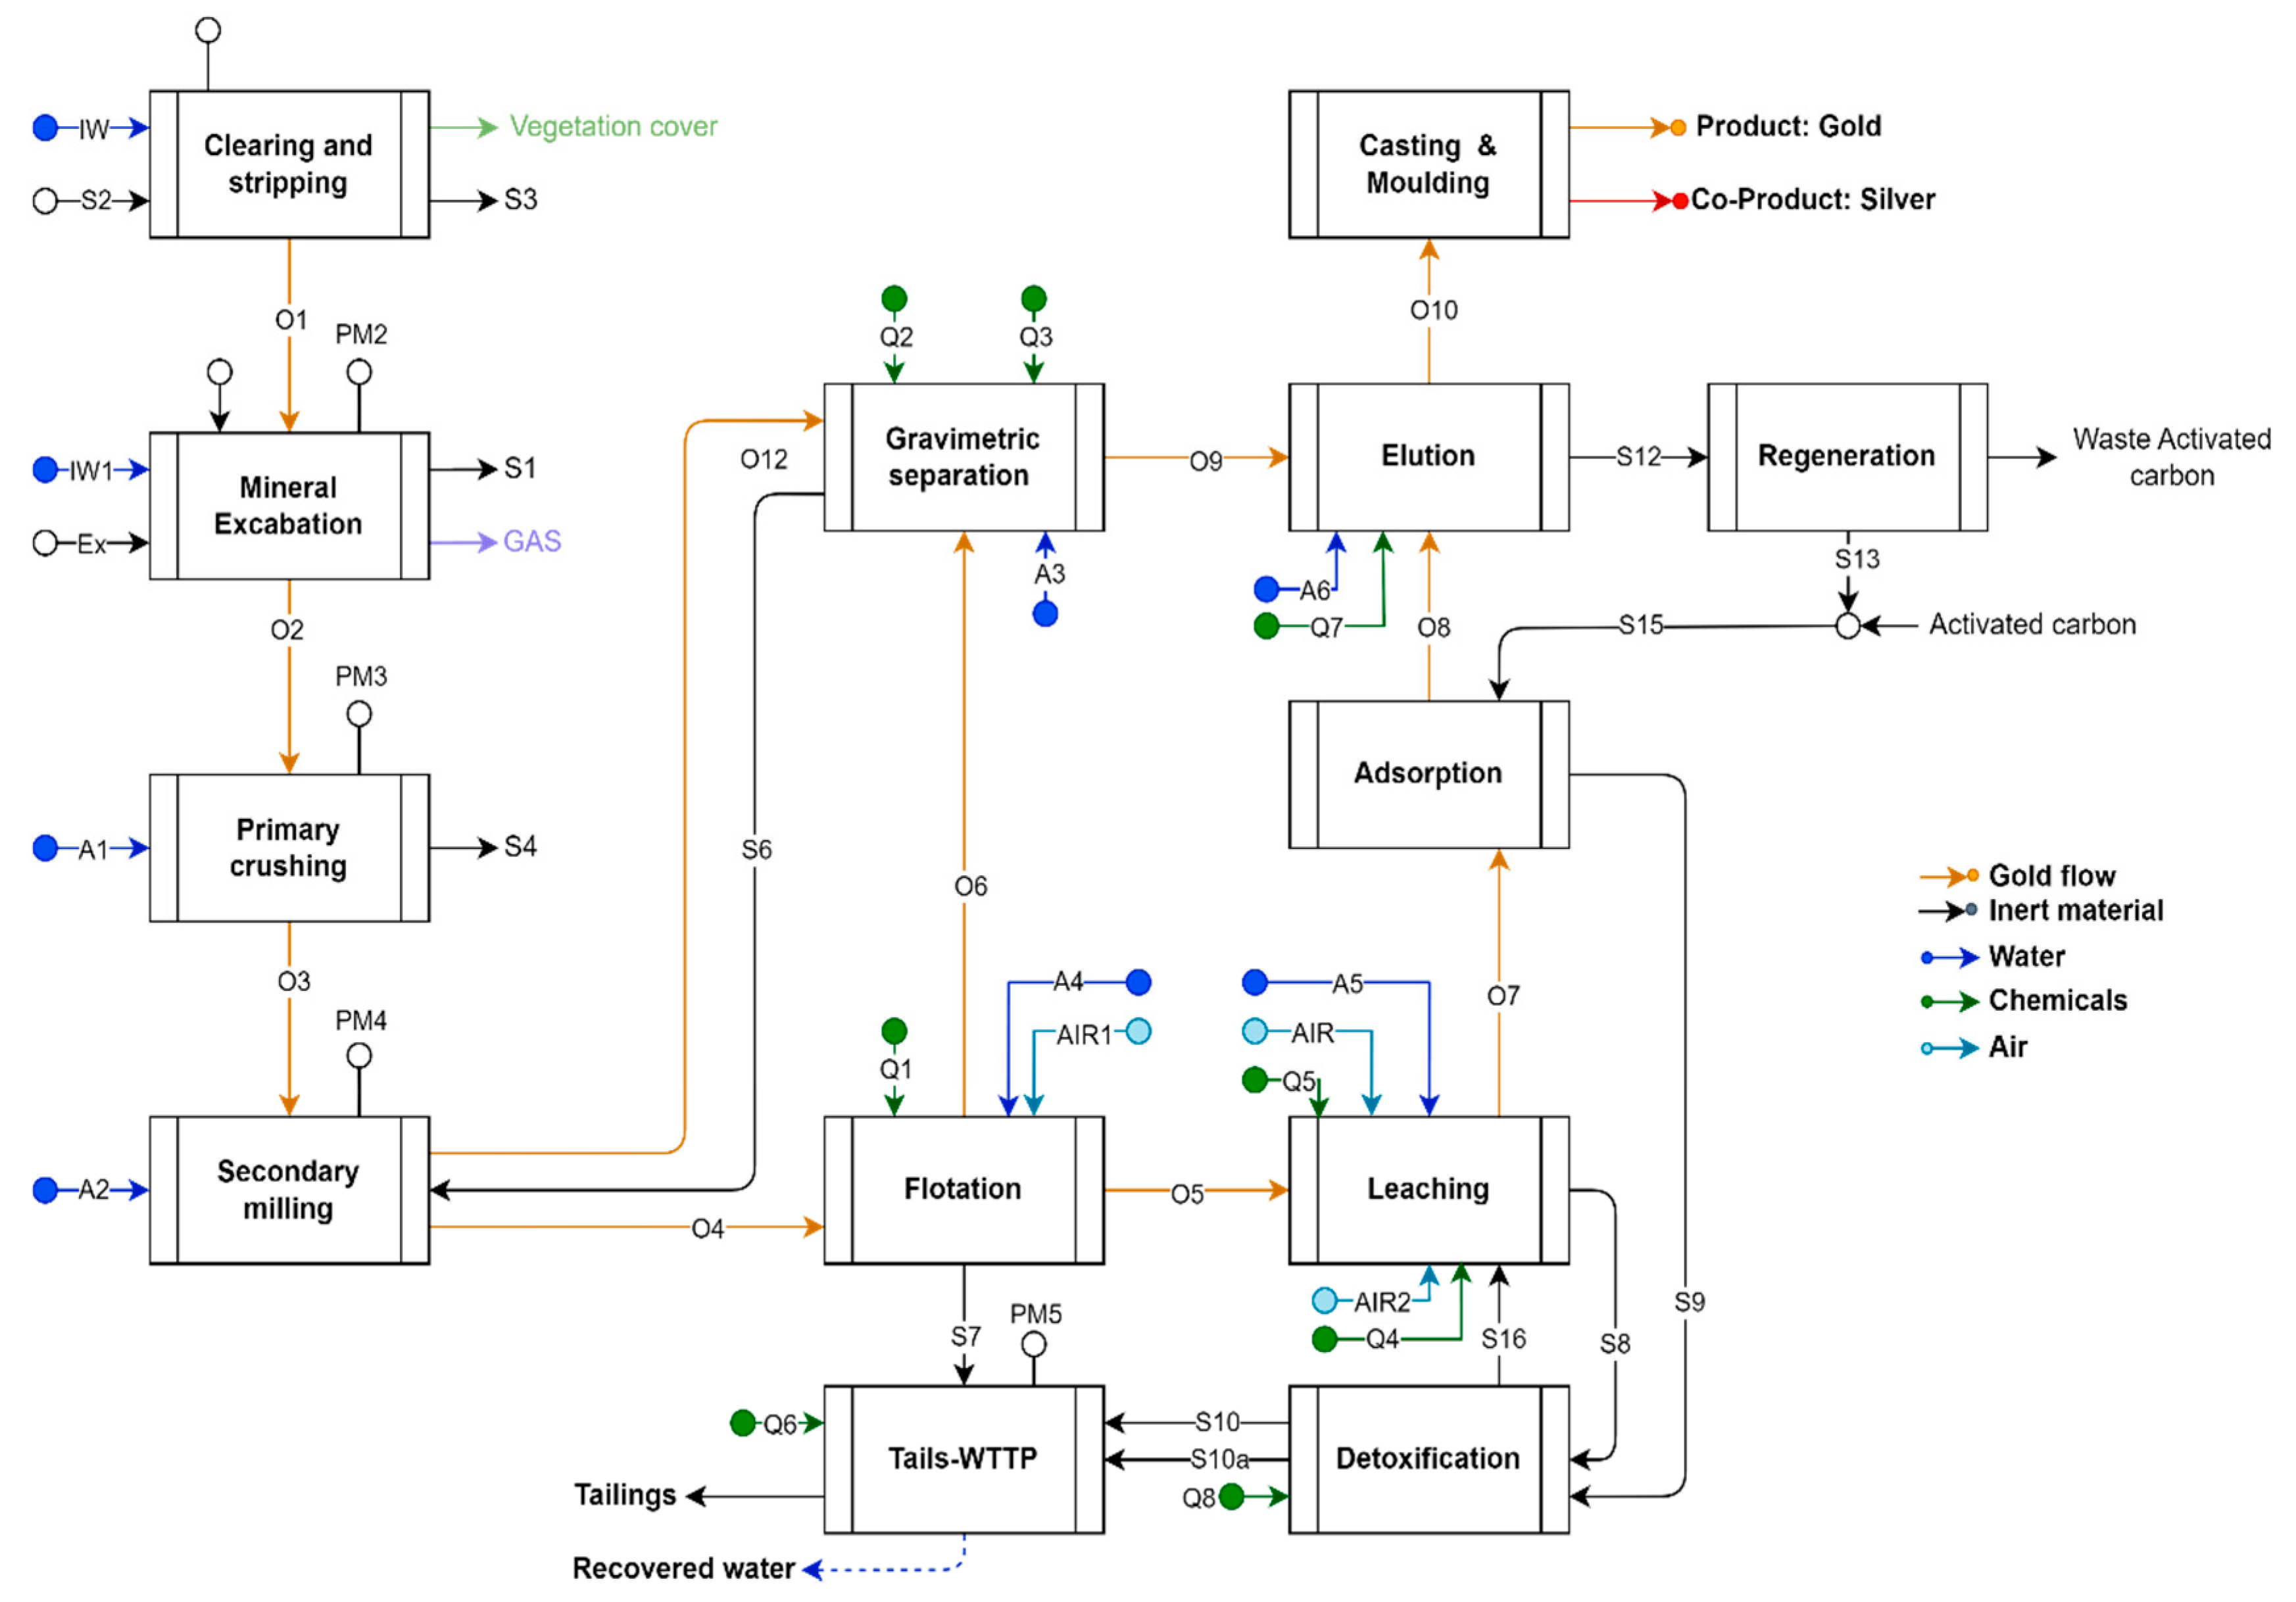
2.1. Open-Pit Mining Technology
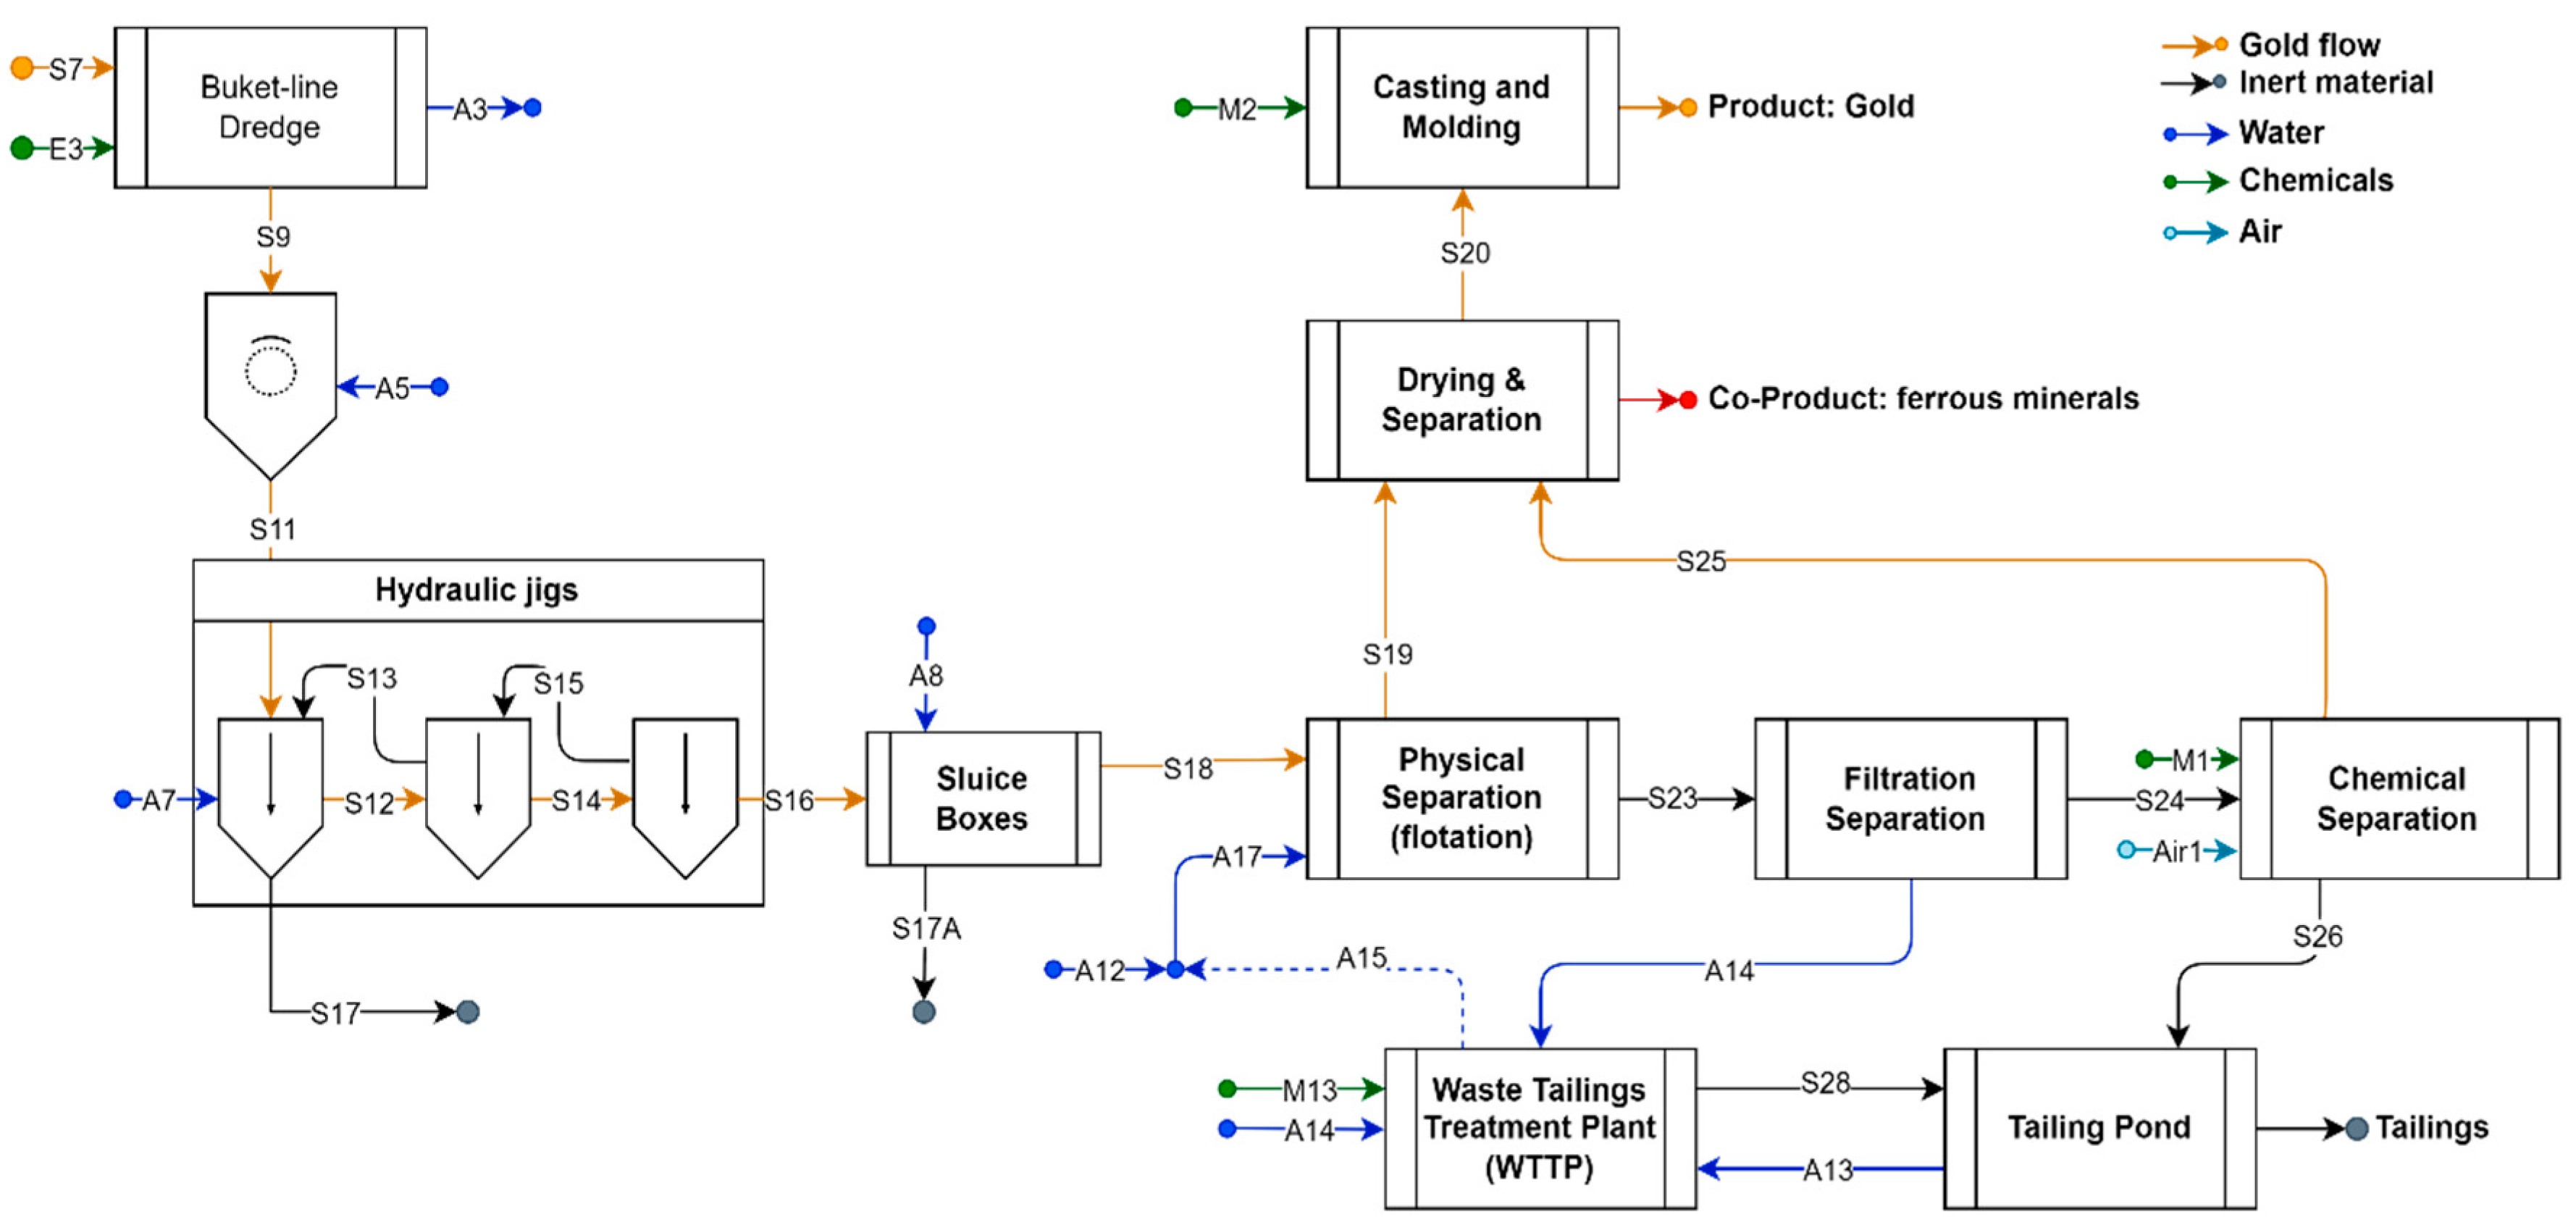
2.2. Alluvial Mining Technology
3. Methodology
3.1. Identification of Exergy Loss Stages
- Efficiency of the First Law
- Efficiency of the Second Law (exergy efficiency)
3.2. Exergy Sustainability Assessment
- Cumulative energy demand
- Cumulative exergy demand ()
- Exergy efficiency of the product
- Ecological efficiency
- Exergy sustainability index
- Relative irreversibility
- Environmental exergy indicator
- Environmentally unfavorable when ;
- Internally and externally reversible process, with the exclusive use of renewable resources when ;
- Environmentally favorable when ;
- Internally and externally reversible process, with the exclusive use of renewable resources when .
4. Results and Discussion
4.1. Energy/Exergy Indicators
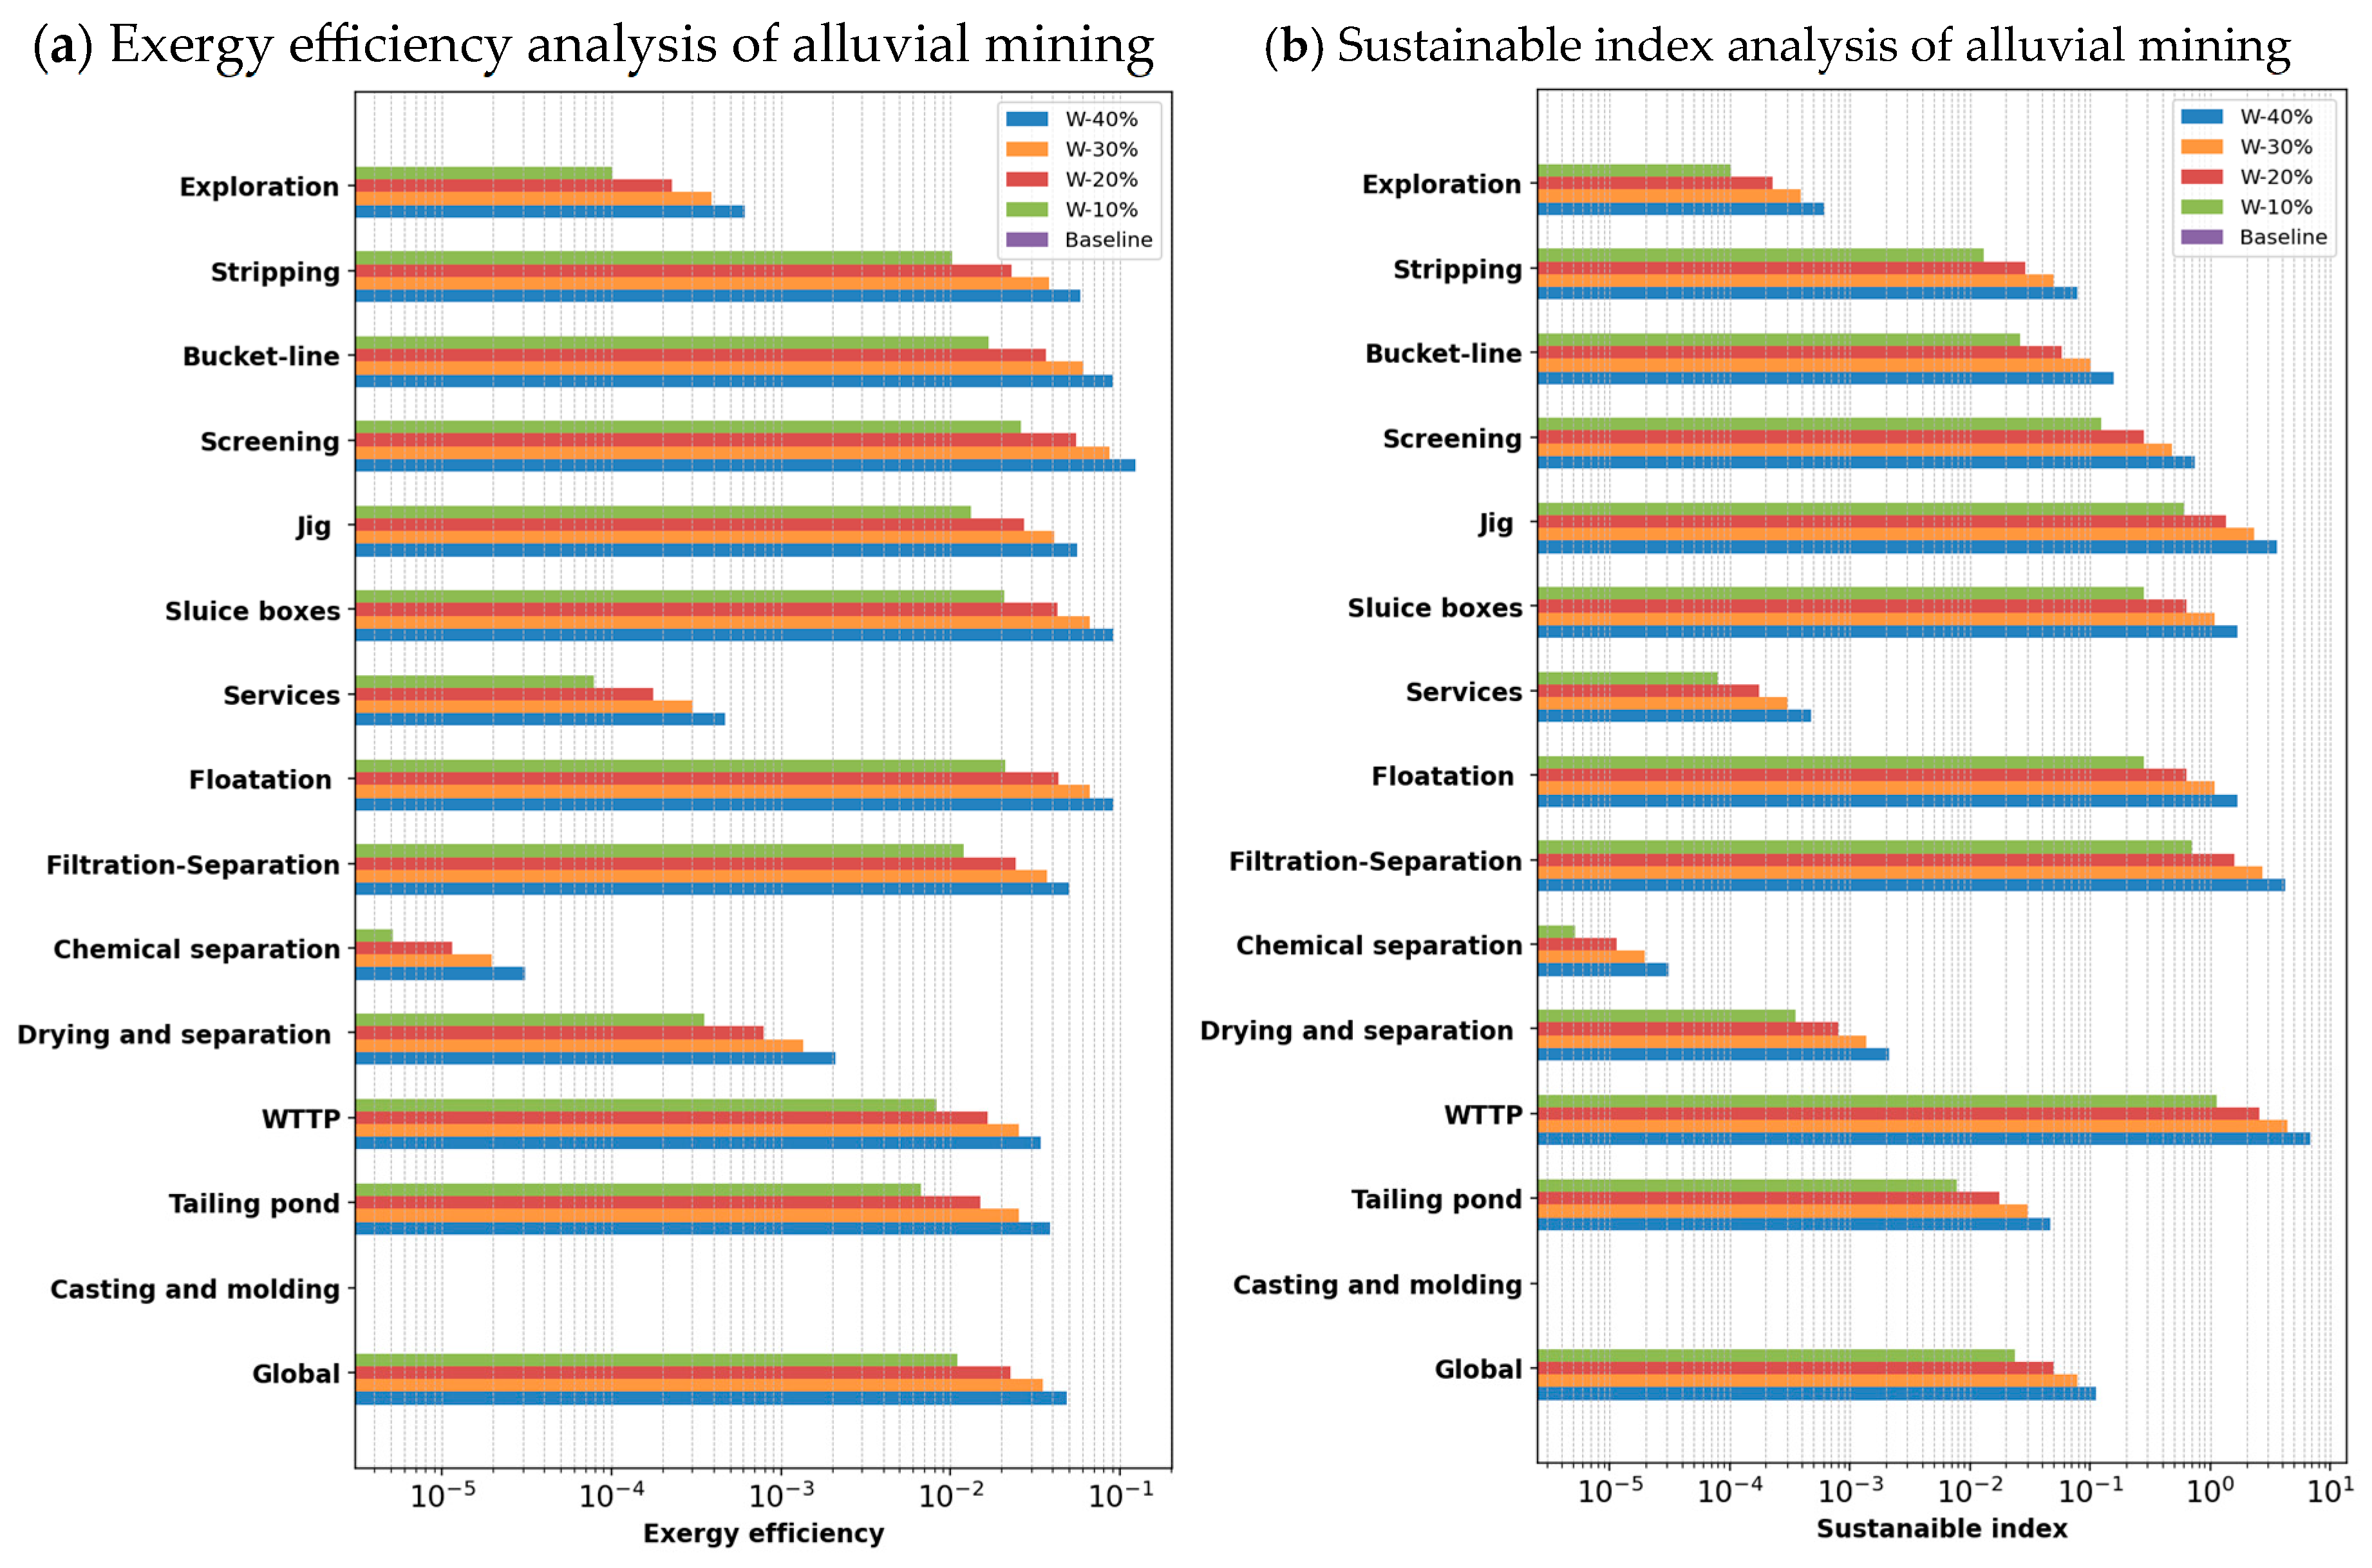
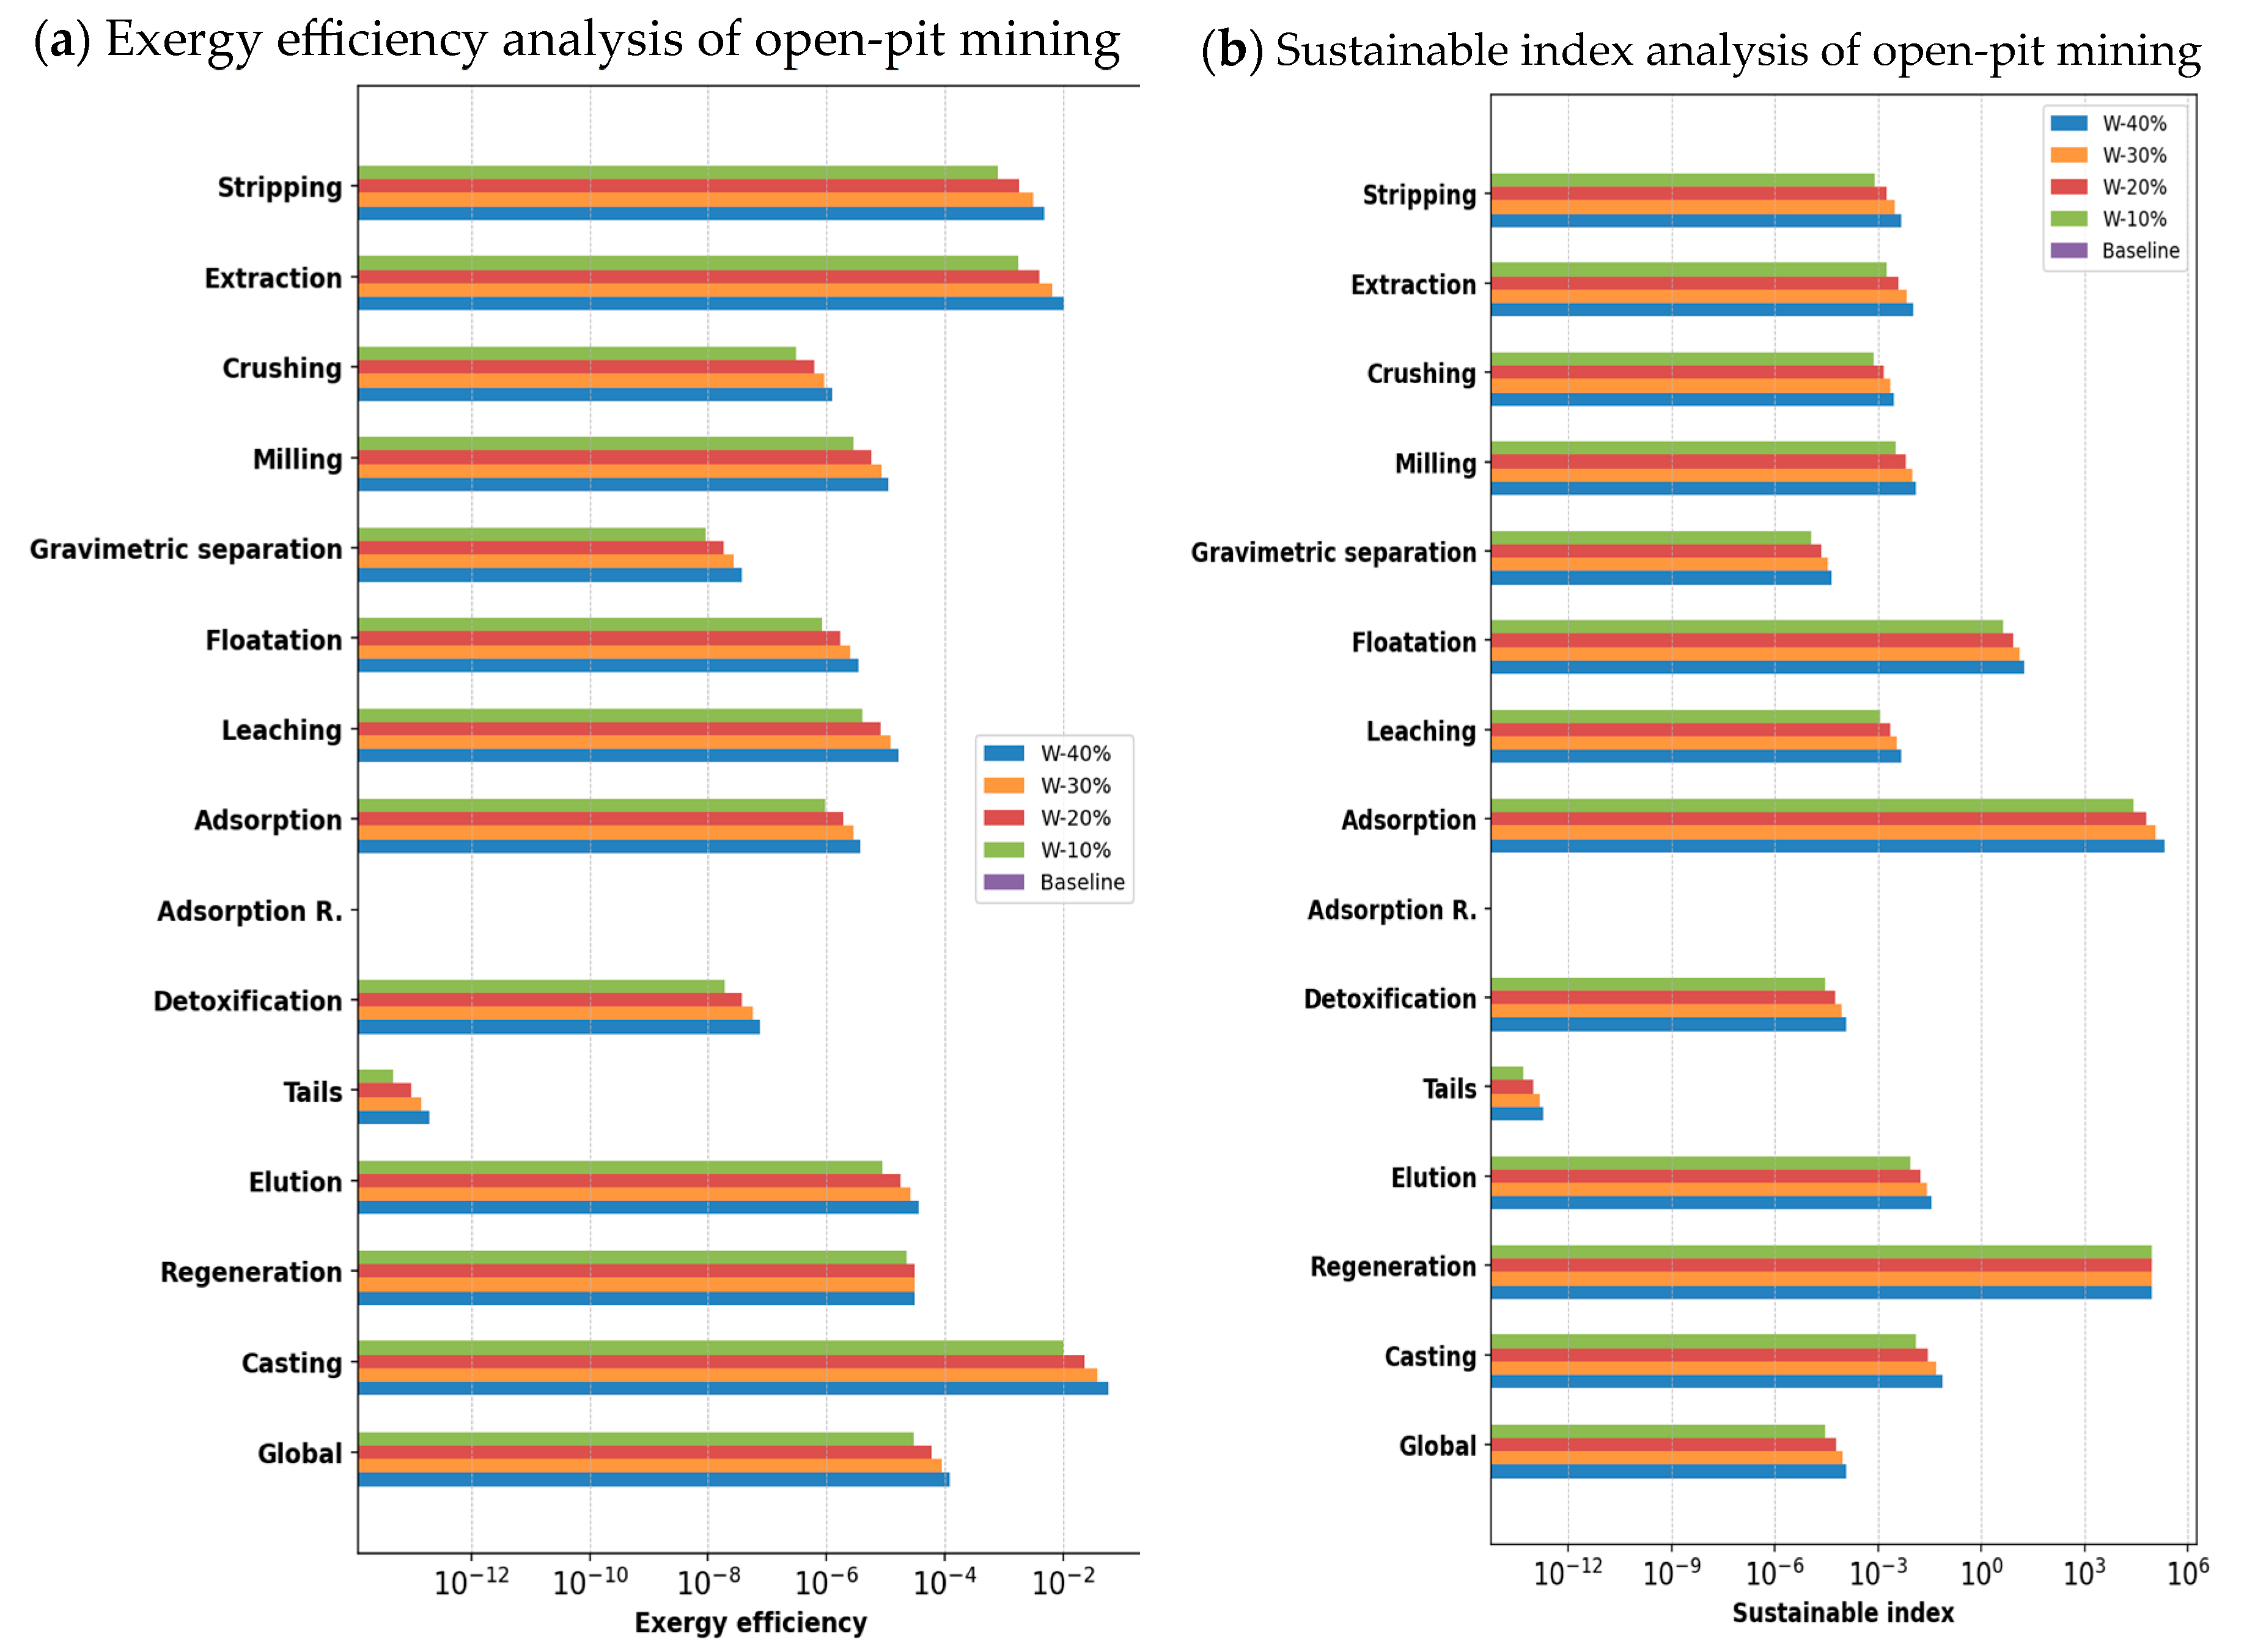
4.2. Sensitivity Analysis
5. Discussion and Conclusions
- Improving efficiency by reducing the exergy required in tail stages and extraction (in the open-pit mining process, casting and molding, and screening), where large exergy supplies are required.
- Increasing efficiency by reducing exergy emissions and residues in the casting and molding stage in alluvial mining and the stripping stage in open-pit mining, or by adding value to those exergetically exploitable streams. For example, S1 and S7 are used in extraction and flotation processes in open-pit mining, and S6 is used in the stripping process in alluvial mining. When released into the environment, these cause environmental degradation due to reactions that occur while achieving a balance or equilibrium with the environment.
- Using external exergy resources, such as renewable resources from nature (solar, wind, and hydraulic), as proposed by the exergy analysis method from a life-cycle perspective, where all direct and indirect resources used for the elaboration can be deemed sustainable. Open-pit mining relies on fossil fuels for approximately 53% of its exergy input, primarily through diesel combustion in excavation and transport. Replacing these inputs with renewable sources such as solar or hydropower, particularly for electricity-driven equipment, can significantly reduce exergy destruction associated with internal combustion processes. However, this strategy must consider Colombia’s contextual barriers, including limited electricity grid coverage in remote mining regions, high capital investment costs, and the prevalence of informal operations. Future work should explore scenario-based modeling to quantify the effect of progressive electrification on exergy efficiency and the sustainability index (SI). A complete techno-economic and logistical assessment is needed to define the actual feasibility of this transition in medium-scale mining operations.
- Applying the concept of circular economy and the nexus with the exergy [50] would imply a reduction in the consumption of resources in two ways:
- 4.1.
- By implementing circular economy principles with thermodynamic considerations, Circular economy strategies aim to valorize residual streams (e.g., tailings, process water, and waste heat) by reintegrating them into the process or recovering their remaining exergy. In theory, this reduces both the consumption of virgin resources and the environmental burden from waste.
- 4.2.
- By reducing the use of virgin resources within the process by reusing resources, since the rate of use of non-renewable resources must not exceed the rates at which renewable substitutes are developed. Nonetheless, not all residual streams are thermodynamically viable for recovery. For example, stream S7, which is composed of 65% water, has low exergy density and high entropy. According to the Second Law of Thermodynamics, recovering useful exergy from such dilute, high-entropy streams would require substantial energy input and is likely infeasible from both thermodynamic and economic perspectives [50,51].
Supplementary Materials
Author Contributions
Funding
Data Availability Statement
Acknowledgments
Conflicts of Interest
References
- Caldeira-Pires, A.; Seabra, D. The increase in embodied exergy to produce metal proportional to the decrease in mineral concentration. Clean. Eng. Technol. 2022, 6, 100363. [Google Scholar] [CrossRef]
- Ho, S.S.H.; Shin, J.; Oh, C.H. Conflicts between mining companies and communities: Institutional environments and conflict resolution approaches. Bus. Ethic-Environ. Responsib. 2023, 32, 638–656. [Google Scholar] [CrossRef]
- Cano-Londoño, N.A.; Capaz, R.S.; Mcintyre, N.R.; Corder, G.D.; Posada, J.A. Life cycle impacts assessment of two gold extraction systems in Colombia: Open-pit and alluvial mining. Int. J. Life Cycle Assess. 2023, 28, 380–397. [Google Scholar] [CrossRef]
- Kirchherr, J.; Hartley, K.; Yang, N.-H.N.; Schulze-Spüntrup, F.; Heerink, M.J. Conceptualizing the Circular Economy (Revisited): An Analysis of 221 Definitions. Resour. Conserv. Recycl. 2023, 194, 107001. [Google Scholar] [CrossRef]
- Lèbre, É.; Corder, G.; Golev, A. The Role of the Mining Industry in a Circular Economy: A Framework for Resource Management at the Mine Site Level. J. Ind. Ecol. 2017, 21, 662–672. [Google Scholar] [CrossRef]
- Ljunggren, M.; André, H. Towards comprehensive assessment of mineral resource availability? Complementary roles of life cycle, life cycle sustainability and criticality assessments. Resour. Conserv. Recycl. 2021, 167, 105396. [Google Scholar] [CrossRef]
- Valero, A.; Valero, A. Physical geonomics: Combining the exergy and Hubbert peak analysis for predicting mineral resources depletion. Resour. Conserv. Recycl. 2010, 54, 1074–1083. [Google Scholar] [CrossRef]
- Mora, P.; Ortega, M.F.; Fernández-Hernández, M.; Cabello, J.P. Development of a comprehensive sustainability index for extractive and mining companies: Integrating the Sustainable Development Goals. Heliyon 2025, 11, e41975. [Google Scholar] [CrossRef]
- Putri, A.A.; Sinansari, P.; Lopatka, A. Value of Sustainable Business Model in Mining Company: A Case Study. Procedia Comput. Sci. 2022, 207, 4142–4150. [Google Scholar] [CrossRef]
- Hosseinpour, M.; Nezakati, H.; Ho, J.A.; Bojei, J. Sustainability: The Effective Role of NGOs on Firms. In Achieving Sustainable Supply Chain through the Creation of Economic Growth, Environmental Protection and Social Progress; Abd Rahman, A., Nezakati, H., Eds.; Universiti Putra Malaysia Press: Serdang, Malaysia, 2016; pp. 151–163. [Google Scholar]
- ICMM. ICMM Mining Principles. United Kingdom, 2024. Available online: https://www.icmm.com/en-gb/our-principles/mining-principles/mining-principles (accessed on 20 April 2025).
- Chen, X.; Liu, Y.; Huang, W.; Zheng, D.; Li, X.; Yang, M.; Li, Y. Exergy-environment assessment for energy system: Distinguish the internal and total exergy loss, and modify the contribution of utility. Energy Convers. Manag. 2022, 251, 114975. [Google Scholar] [CrossRef]
- Tsatsaronis, G.; Morosuk, T.; Koroneos, C. Environmental impact reduction using exergy-based methods. J. Clean. Prod. 2016, 118, 118–123. [Google Scholar] [CrossRef]
- Hasenstab, C.; Velasquez, H.I.; Cano, N.A. Exergy life cycle assessment indicators in Colombian gold mining sector. J. Sustain. Min. 2020, 19, 2–165. [Google Scholar] [CrossRef]
- Cengel, Y.A.; Kanoglu, M.; Dincer, I. Exergy for better environment and sustainability. Environ. Dev. Sustain. 2008, 11, 971–988. [Google Scholar] [CrossRef]
- Valero, A.; Carpintero, Ó.; Valero, A.; Calvo, G. How to account for mineral depletion. The exergy and economic mineral balance of Spain as a case study. Ecol. Indic. 2014, 46, 548–559. [Google Scholar] [CrossRef]
- Orozco, C.; Velasquez, H.; Londoño, N.A.C.; Hasenstab, C. Evaluation of the extractive gold process: Open-pit mining through exergy analysis. In Proceedings of the 32nd International Conference on Efficiency, Cost, Optimization, Simulation and Environmental Impact of Energy Systems, Wrocław, Poland, 23–28 June 2008. [Google Scholar]
- Cano, N.; Hasenstab, C.; Velasquez, H. Life-Cycle Assessment (LCA) of exergy indicators in the Colombian gold mining sector: A case study in an open-pit and in an alluvial mining processes. In Proceedings of the 32nd International Conference on Efficiency, Cost, Optimization, Simulation and Environmental Impact of Energy Systems, Wrocław, Poland, 23–28 June 2008. [Google Scholar]
- Li, J.; Gao, Z.R.; Lin, Q.F.; Liu, C.; Gao, F.; Lin, C.; Zhang, S.; Deng, H.; Mayoral, A.; Fan, W.; et al. A 3D extra-large-pore zeolite enabled by 1D-to-3D topotactic condensation of a chain silicate. Science 2023, 379, 283–287. [Google Scholar] [CrossRef]
- Lu, X.; Zhang, P.; He, J. The risk-based environmental footprints and sustainability deficits of nations. Ecol. Econ. 2025, 230, 108501. [Google Scholar] [CrossRef]
- Domínguez, A.; Valero, A.; Valero, A. Exergy cost allocation of by-products in the mining and metallurgical industry. Resour. Conserv. Recycl. 2015, 102, 128–142. [Google Scholar] [CrossRef]
- Valero, A.; Carmona, L.G.; Whiting, K.; Valero, A. Colombian mineral resources: An analysis from a Thermodynamic Second Law perspective. Resour. Policy 2015, 45, 23–28. [Google Scholar] [CrossRef]
- Valero, A.; Valero, A.; Calvo, G. Assessing maximum production peak and resource availability of non-fuel mineral resources: Analyzing the influence of extractable global resources. Resour. Conserv. Recycl. 2017, 125, 208–217. [Google Scholar] [CrossRef]
- Soundararajan, K.; Ho, H.K.; Su, B. Sankey diagram framework for energy and exergy flows. Appl. Energy 2014, 136, 1035–1042. [Google Scholar] [CrossRef]
- Fani, M.; Maleki, F.; Ledari, M.B. Integrated analysis of a hydrogen-based port: Energy, exergy, environmental, and economic sustainability. Int. J. Hydrogen Energy 2025, 100, 1402–1420. [Google Scholar] [CrossRef]
- Domínguez, A.; Valero, A.; Valero, A. Exergy accounting applied to metallurgical systems: The case of nickel processing. Energy 2013, 62, 37–45. [Google Scholar] [CrossRef]
- Arushanyan, Y.; Finnveden, G.; Brandão, M. Exergy as a Measure of Resource Use in Life Cycle Assessment and Other Sustainability Assessment Tools. Resources 2016, 5, 23. [Google Scholar] [CrossRef]
- Nguyen, M.; Ziemski, M.; Vink, S. Application of an exergy approach to understand energy demand of mine water management options. J. Clean. Prod. 2014, 84, 639–648. [Google Scholar] [CrossRef]
- Anand, R.R.; Salama, W.; Iglesias-Martínez, M.; Espí, J.A.; Butt, C.R. Exploration and mining of lateritic gold deposits (Part I): Ore formation, characterization, and sampling of ferruginous gravel and duricrust. Ore Geol. Rev. 2024, 170, 106146. [Google Scholar] [CrossRef]
- Li, B.; Fuanya, C.; Tangko, T.E.; Ketchaya, Y.B.; Etutu, M.E.M.; Zhou, T.; Hamukwaya, S.L.; Agbor, E.B.; Nayongo, S.K. Morphological, mineralogical signatures, and biogeochemical cycle of gold from the Nyema and Zingui placer gold deposits in southern Cameroon: Implications for primary bedrock source and secondary gold formation. Ore Geol. Rev. 2024, 176, 106404. [Google Scholar] [CrossRef]
- Fedotov, P.K.; Senchenko, A.E.; Fedotov, K.V.; Burdonov, A.E.; Vlasova, V.V. Technology for Processing Low-Sulfide Gold-Quartz Ore. Izv. Tomsk. Polite-Univ. Inz. Georesursov 2022, 333, 178–189. [Google Scholar] [CrossRef]
- Hasenstab, C.; Loaiza, C.A.O.; Cano, N.A.; Velasquez, H.I. Evaluation of the extractive gold process: Open-pit mining through exergy analysis. J. Sustain. Min. 2020, 19, 3–181. [Google Scholar] [CrossRef]
- Cano, N. Sustainability Assessment of Alluvial and Open Pit Mining Systems in Colombia: Life Cycle Assessment, Exergy Analysis, and Emergy Accounting. Universidad Nacional de Colombia. 2018. Available online: https://repositorio.unal.edu.co/handle/unal/69523 (accessed on 1 May 2025).
- Sousa, T.; Carmona, L.G.; Whiting, K. A review of the use of exergy to evaluate the sustainability of fossil fuels and non-fuel mineral depletion. Renew. Sustain. Energy Rev. 2017, 76, 202–211. [Google Scholar] [CrossRef]
- Rosen, M.A.; Dincer, I. Chapter 1—Exergy and its Ties to the Environment, Economics, and Sustainability. In Exergy Analysis of Heating, Refrigerating and Air Conditioning; Elsevier: Amsterdam, The Netherlands, 2015. [Google Scholar] [CrossRef]
- Szargut, J.; Morris, D.R.; Steward, F.R. Exergy Analysis of Thermal, Chemical, and Metallurgical Processes; U.S. Department of Energy: Washington, DC, USA, 1988.
- Szargut, J. Exergy Method: Technical and Ecological Applications; WIT Press: Southampton, UK, 2005. [Google Scholar]
- Stanek, W.; Valero, A.; Czarnowska, L.; Valero, A.; Domínguez, A. Thermo-ecological and exergy replacement costs of nickel processing. Energy 2014, 72, 103–114. [Google Scholar] [CrossRef]
- Martínez, A.; Valero, A.; Valero, A. Inventory of the exergy resources on earth including its mineral capital. Energy 2010, 35, 989–995. [Google Scholar] [CrossRef]
- Wang, R.; Qi, H.; Wu, J.; Pu, G. Integrated assessment of exergy, energy and carbon dioxide emissions in an iron and steel industrial network. Appl. Energy 2016, 183, 430–444. [Google Scholar] [CrossRef]
- Kotas, T.J. The Exergy Method of Thermal Plant Analysis; Krieger Publishing Company: Malabar, FL, USA, 1995; pp. 37–51. [Google Scholar]
- Wedepohl, K.H. The composition of the continental crust. Geochim. Cosmochim. Acta 1995, 59, 1217–1232. [Google Scholar] [CrossRef]
- Joback, K.G.; Reid, R.C. Estimation of pure-component properties from group-contributions. Chem. Eng. Commun. 1987, 57, 233–243. [Google Scholar] [CrossRef]
- Perry, R.H.; Green, D.W.; Maloney, J.O. Chemical Engineers’ Handbook Seventh; McGraw-Hill: New York, NY, USA, 1997; Volume 27. [Google Scholar] [CrossRef]
- Wang, Z.; Qian, H.; Lu, X.; Huang, D.; Fan, S.; Zhu, W.; Chen, W.; Liu, C. Prediction models for chemical exergy of biomass on dry basis from ultimate analysis using available electron concepts. Energy 2017, 131, 251–258. [Google Scholar] [CrossRef]
- Cullen, J.M.; Allwood, J.M. Theoretical efficiency limits for energy conversion devices. Energy 2010, 35, 2059–2069. [Google Scholar] [CrossRef]
- Toxopeus, M.E.; Lutters, D.; Van Houten, F. Environmental indicators & engineering; an alternative for weighting factors. In Proceedings of the 13th CIRP International Conference on Life Cycle Engineering, Leuven, Belgium, 31 May–2 June 2006; pp. 75–80. [Google Scholar]
- Dincer, M.A.; Rosen, I. Exergy. In Energy, Environment and Sustainable Development, 1st ed.; Elsevier: Amsterdam, The Netherlands, 2007. [Google Scholar]
- Arredondo, H.I.V. Avaliação Exergética e Exergo-Ambiental da Produção de Biocombustíveis; Universidade de São Paulo: Butantã, Brazil, 2009. [Google Scholar]
- Cabezas, H.; Londoño, N.A.C. Perspectives on circular economy in the context of chemical engineering and sustainable development. Curr. Opin. Chem. Eng. 2021, 34, 100738. [Google Scholar] [CrossRef]
- Finnveden, G.; Östlund, P. Exergies of Natural Resources in Life Cycle Assessment and Other Applications. Energy 1997, 22, 923–931. [Google Scholar] [CrossRef]
- Song, G.H.; Shen, L.H.; Xiao, J. Estimating specific chemical exergy of biomass from basic analysis data. Ind. Eng. Chem. Res. 2011, 50, 9758–9766. [Google Scholar] [CrossRef]

| Open-Pit Mining Technology | Alluvial (or Placer) Mining Technology | Unit | |
|---|---|---|---|
| Input | |||
| Water | l 5.70 × 10⁷ | a 9.79 × 10⁷ | ton/year |
| Energy (electrical) | m 2.03 × 10¹² | b 2.53 × 10¹¹ | kJ/year |
| Energy (gas) | n 1.68 × 10¹⁰ | c 1.60 × 10⁷ | kJ/year |
| Energy (diesel) | o 1.15 × 10¹² | d 1.12 × 10⁹ | kJ/year |
| Oxygen (air) | p 3.75 × 10⁵ | e 40 | ton/year |
| Others | ** 1.01 × 10⁶ | * 318.8 | ton/year |
| Output | |||
| Inert material removed (sterile mineral) | q 6.94 × 10⁷ | f 1.06 × 10⁸ | ton/year |
| Vegetation cover harbors (clearing and stripping) | r 1.33 × 10³ | g 60 | ton/year |
| Sludge tails (wet weight) | s 2.42 × 10⁷ | h 4.52 × 10³ | ton/year |
| Energy losses | t 1.24 × 10¹² | i 4.74 × 10¹⁰ | kJ/year |
| Emissions of substances to air, water, and soil by combustion, detonation, trituration, leakage, etc. | u 2.22 × 10³ | --- | ton/year |
| Stored material containing minerals of interest | v 3.98 × 10⁷ | --- | ton/year |
| Ferrous metal co-product (dry weight, 55% iron) | --- | 1.55 | ton/year |
| Silver co-product (dry weight) | w 21.55 | --- | ton/year |
| Gold (dry weight) | x 19.05 | j 3.10 | ton/year |
| Recycling | |||
| Water | y 4.79 × 10⁷ | k 4.42 × 10⁵ | ton/year |
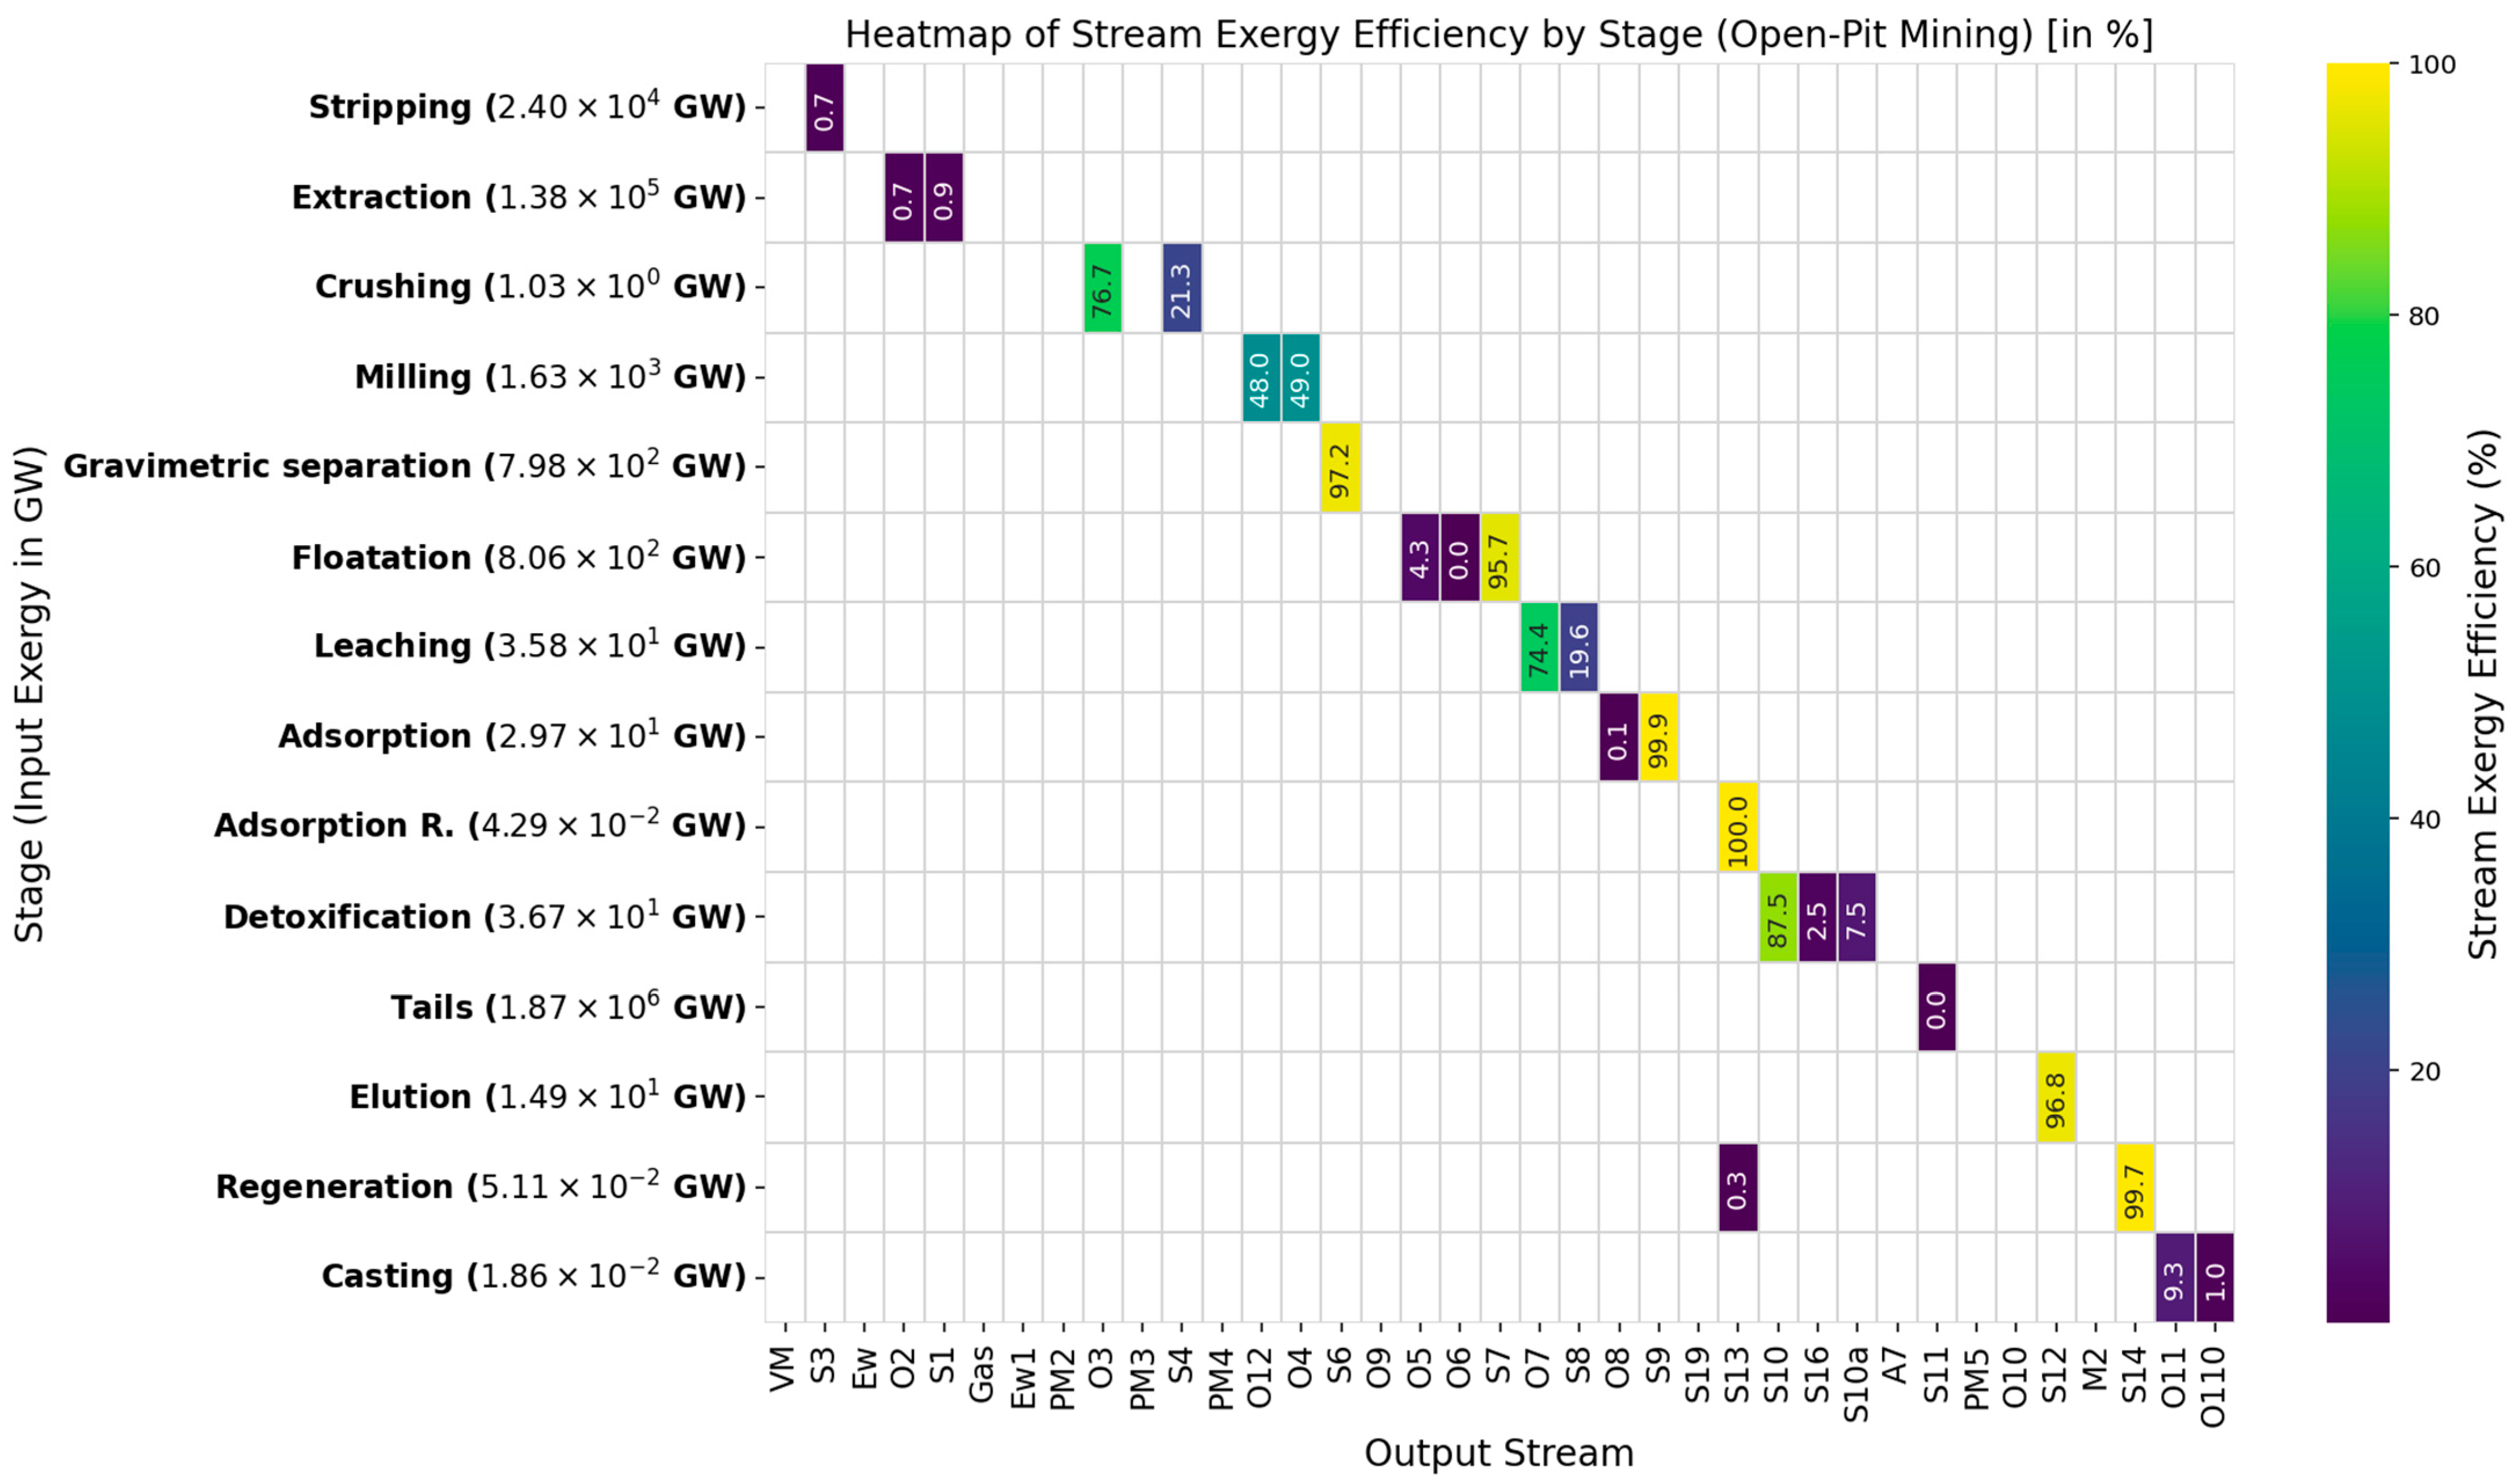
| Process | Energy Consumption [kW] | Input Exergy [kW] | Output Exergy [kW] | Destroyed Exergy [kW] | Exergy Efficiency [%] | Depletion Number (Dp) | Sustainable Index (SI) | Exergy Renewable Resource [GW] | Exergy Non-Renewable Resource [GW] | Ecology Efficiency [GW] | Exergy Environmental Indicator |
|---|---|---|---|---|---|---|---|---|---|---|---|
| Stripping | 2.39 × 10⁷ | 2.40 × 10⁷ | 1.73 × 10⁵ | 2.38 × 10⁷ | 0.72 | 0.993 | 1.01 | 9.61 × 10³ | 2.39 × 10⁷ | 0.721 | |
| Extraction | 1.36 × 10⁸ | 1.38 × 10⁸ | 2.21 × 10⁶ | 1.36 × 10⁸ | 1.60 | 0.984 | 1.02 | 8.65 × 10³ | 1.38 × 10⁸ | 1.604 | |
| Crushing | 3.29 × 100 | 1.03 × 10⁶ | 1.01 × 10⁶ | 2.12 × 10⁴ | 97.95 | 0.021 | 48.72 | 0.00 × 100 | 1.57 × 10⁶ | 97.14 | |
| Milling | 4.79 × 101 | 1.63 × 10⁶ | 1.58 × 10⁶ | 4.85 × 10⁴ | 97.03 | 0.030 | 33.68 | 6.32 × 10⁴ | 1.03 × 10⁶ | 97.95 | |
| Gravimetric separation | 7.56 × 10⁻² | 7.98 × 10⁵ | 7.76 × 10⁵ | 2.26 × 10⁴ | 97.16 | 0.028 | 35.26 | 1.47 × 10⁴ | 7.84 × 10⁵ | 97.21 | |
| Floatation | 6.92 × 100 | 8.06 × 10⁵ | 8.05 × 10⁵ | 3.59 × 10² | 99.96 | 0.000 | 2245.13 | 3.67 × 10³ | 8.02 × 10⁵ | 99.96 | |
| Leaching | 1.57 × 100 | 3.58 × 10⁴ | 3.37 × 10⁴ | 2.14 × 10³ | 94.04 | 0.060 | 16.77 | 0.00 × 100 | 3.58 × 10⁴ | 94.04 | |
| Adsorption | 2.83 × 10⁻¹ | 2.97 × 10⁴ | 2.97 × 10⁴ | 1.95 × 10⁻¹ | 100.00 | 0.000 | 152,383.17 | 0.00 × 100 | 2.97 × 10⁴ | 100.0 | |
| Adsorption R. | 0.00 × 100 | 4.29 × 101 | 4.29 × 101 | 0.00 × 100 | 100.00 | 0.000 | 0.00 | 0.00 × 100 | 4.29 × 101 | 100.0 | |
| Detoxification | 710 × 10−3 | 3.67 × 10⁴ | 3.58 × 10⁴ | 9.29 × 10² | 97.47 | 0.025 | 39.49 | 0.00 × 100 | 3.67 × 10⁴ | 97.47 | |
| Tails | 1.88 × 100 | 1.87 × 10⁹ | 8.95 × 10⁵ | 1.87 × 10⁹ | 0.05 | 1.000 | 1.00 | 0.00 × 100 | 1.87 × 10⁹ | 0.048 | |
| Elution | 1.37 × 100 | 1.49 × 10⁴ | 1.44 × 10⁴ | 4.73 × 10² | 96.82 | 0.032 | 31.46 | 1.21 × 10³ | 1.37 × 10⁴ | 97.07 | |
| Regeneration | 1.17 × 101 | 5.11 × 10⁴ | 5.11 × 10⁴ | 1.58 × 100 | 100.00 | 0.000 | 32,309.98 | 0.00 × 100 | 5.11 × 10⁴ | 100.00 | |
| Casting | 1.67 × 101 | 1.86 × 101 | 1.93 × 100 | 1.67 × 101 | 10.35 | 0.897 | 1.12 | 0.00 × 100 | 1.87 × 100 | 10.35 | |
| Global | 1.60 × 10⁸ * | 1.62 × 10⁸ ** | 2.54 × 10⁶ | 1.59 × 10⁸ | 1.57 | 0.98 | 1.02 | 1.01 × 10⁵ | 1.62 × 10⁸ | 1.58 | 5.95 × 10⁻⁹ |
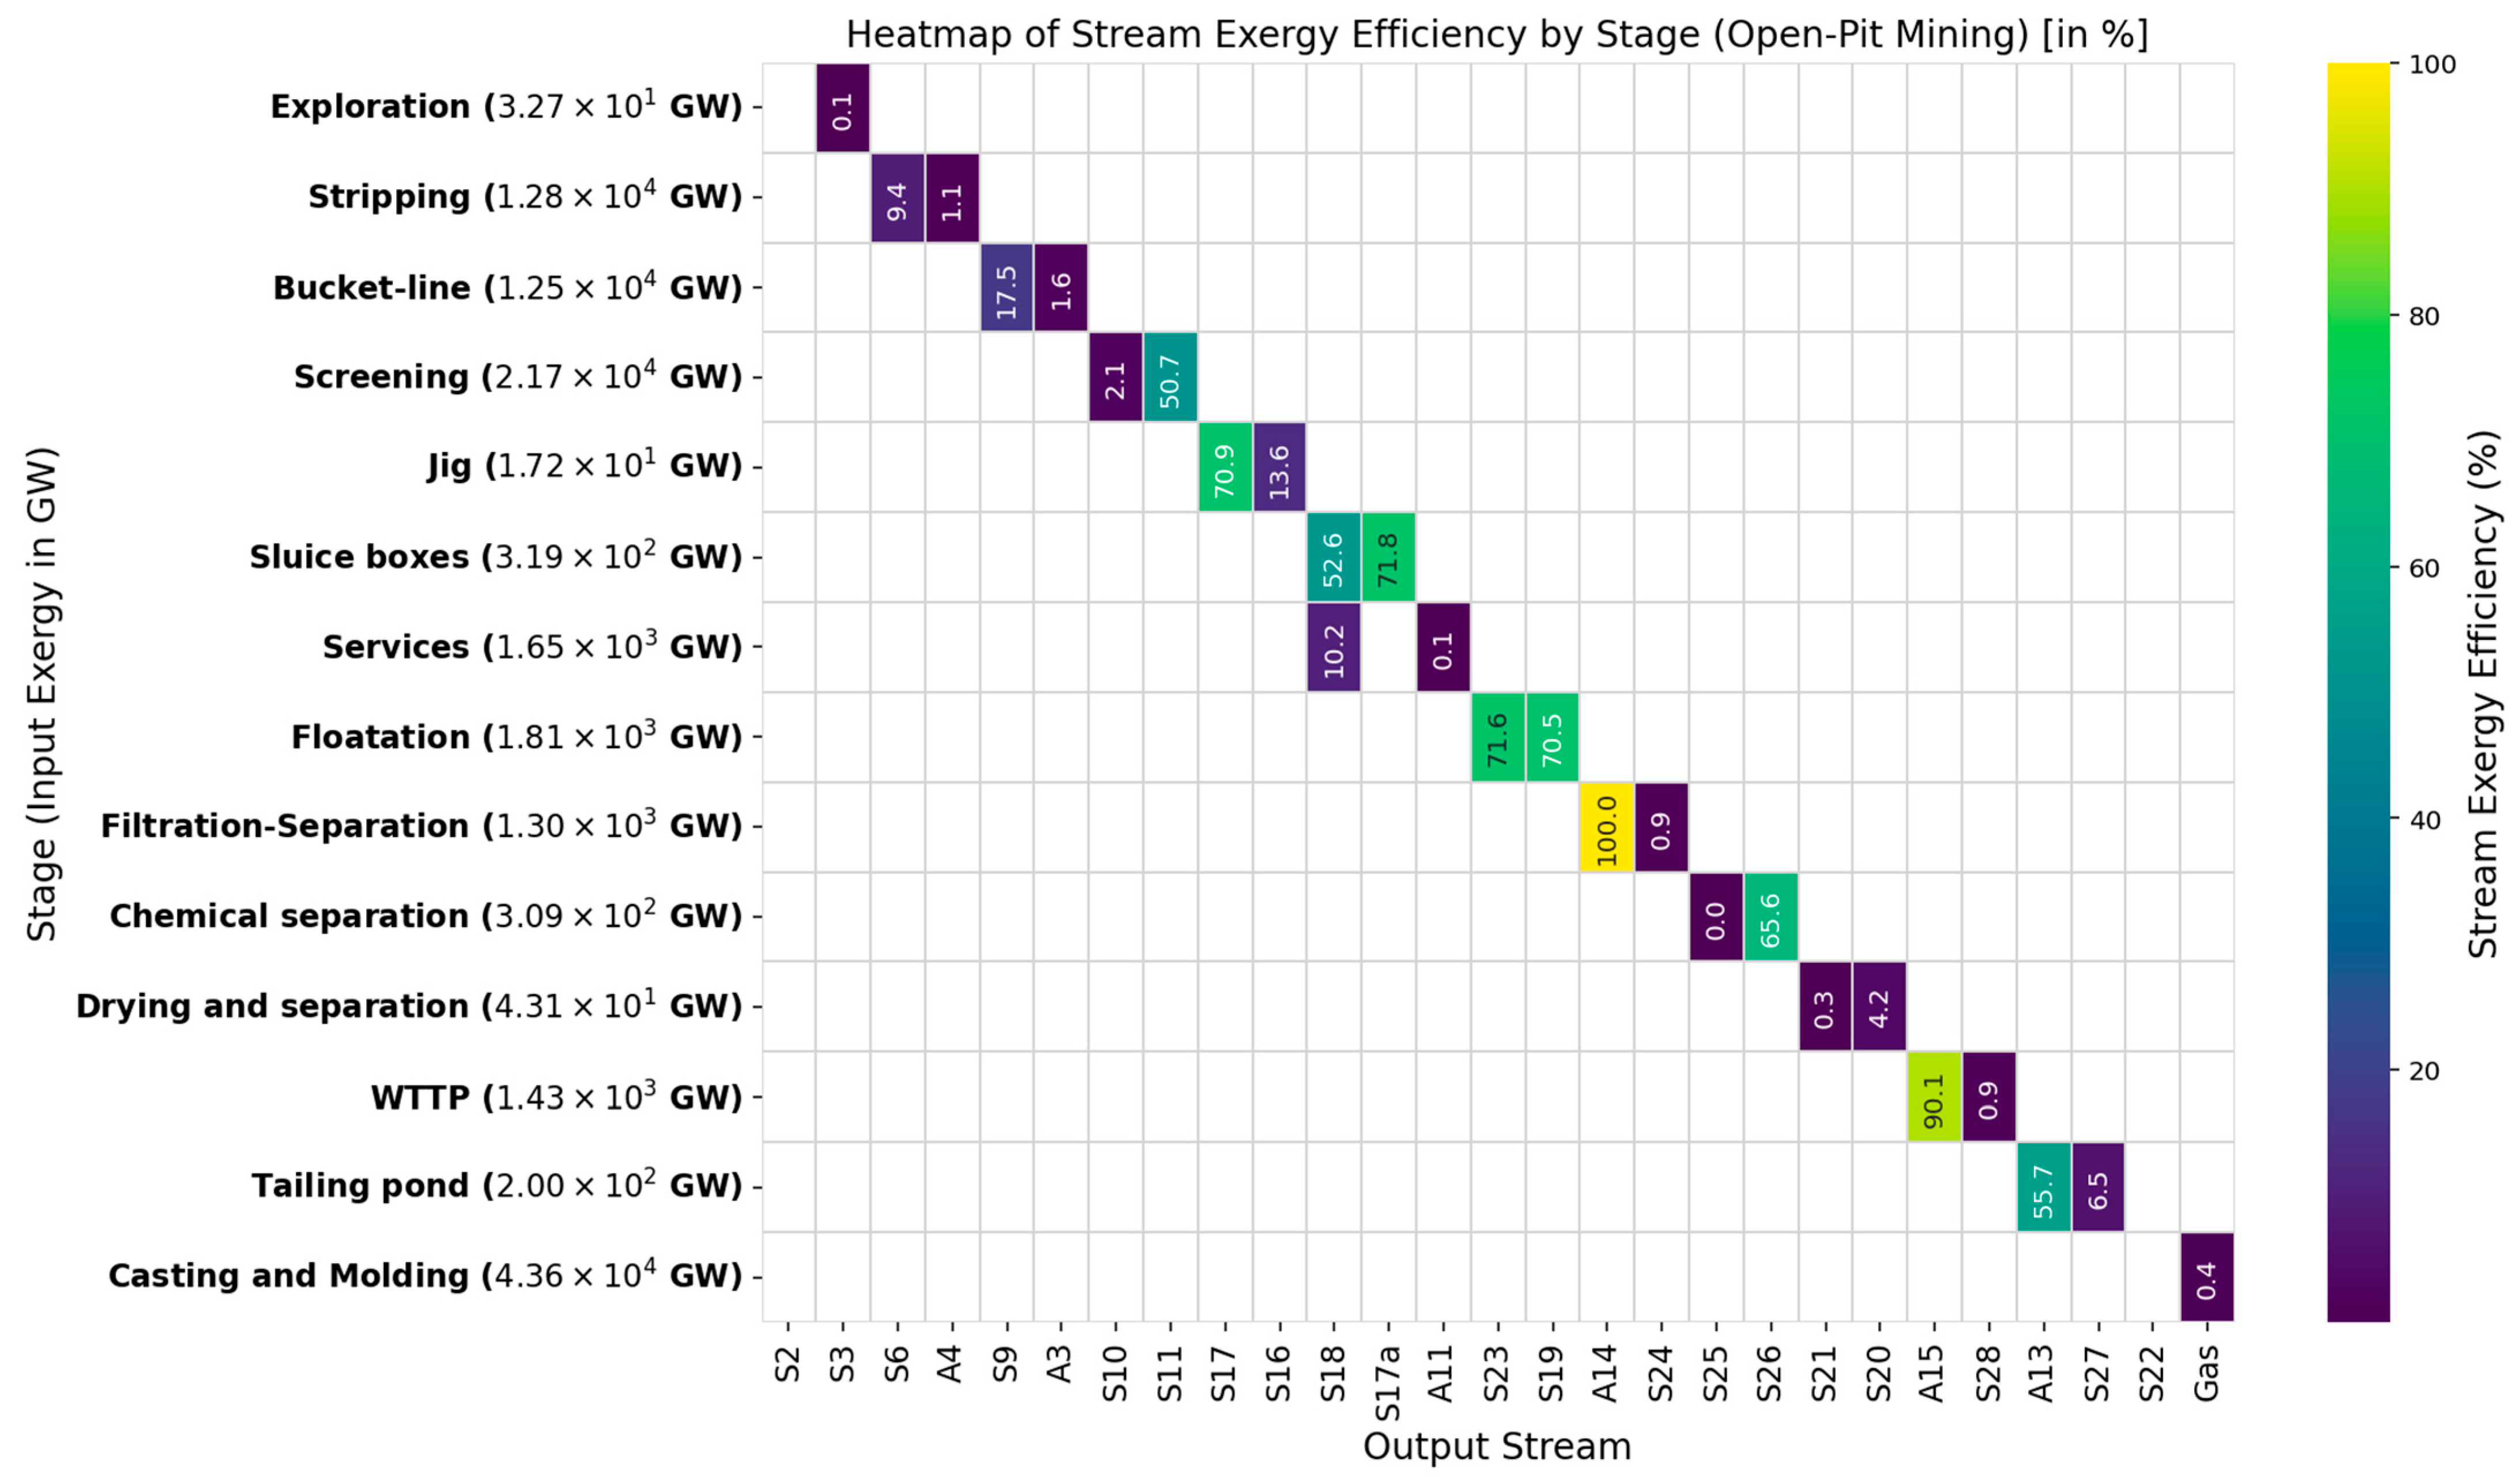
| Process | Cumulative Energy Demand [kW] | Input Exergy [kW] | Output Exergy [kW] | Destroyed Exergy [kW] | Exergy Efficiency [%] | Depletion Number (Dp) | Sustainable Index (SI) | Exergy Renewable Resource [GW] | Exergy Non-Renewable Resource [GW] | Ecology Efficiency [GW] | Exergy Environmental Indicator |
|---|---|---|---|---|---|---|---|---|---|---|---|
| Exploration | 3.27 × 10⁴ | 3.27 × 10⁴ | 3.00 × 101 | 3.27 × 10⁴ | 0.09 | 0.999 | 1.00 | 1.55 × 101 | 3.27 × 10⁴ | 0.09 | |
| Stripping | 1.14 × 10⁷ | 1.28 × 10⁷ | 1.33 × 10⁶ | 1.14 × 10⁷ | 10.46 | 0.895 | 1.12 | 1.43 × 10⁵ | 1.26 × 10⁷ | 10.61 | |
| Bucket-line | 1.01 × 10⁷ | 1.25 × 10⁷ | 2.37 × 10⁶ | 1.01 × 10⁷ | 19.01 | 0.810 | 1.23 | 0.00 × 100 | 1.25 × 10⁷ | 19.05 | |
| Screening | 1.02 × 10⁷ | 2.17 × 10⁷ | 1.14 × 10⁷ | 1.02 × 10⁷ | 52.72 | 0.473 | 2.11 | 9.25 × 10⁶ | 1.24 × 10⁷ | 66.12 | |
| Jig | 2.66 × 10⁶ | 1.72 × 10⁷ | 1.45 × 10⁷ | 2.66 × 10⁶ | 84.50 | 0.155 | 6.45 | 1.39 × 10⁶ | 1.58 × 10⁷ | 85.60 | |
| Sluice boxes | 9.00 × 10⁴ | 3.18 × 10⁵ | 2.28 × 10⁵ | 9.01 × 10⁴ | 71.70 | 0.283 | 3.53 | 6.00 × 10⁴ | 2.59 × 10⁵ | 75.80 | |
| Services | 1.65 × 10⁶ | 1.65 × 10⁶ | 1.17 × 10³ | 1.65 × 10⁶ | 0.07 | 0.999 | 1.00 | 1.16 × 10³ | 1.65 × 10⁶ | 0.07 | |
| Floatation | 5.16 × 10⁵ | 1.81 × 10⁶ | 1.30 × 10⁶ | 5.16 × 10⁵ | 71.57 | 0.284 | 3.52 | 1.30 × 10⁶ | 5.16 × 10⁵ | 89.86 | |
| Filtration−separation | 2.06 × 10⁵ | 1.50 × 10⁶ | 1.30 × 10⁶ | 2.06 × 10⁵ | 86.29 | 0.137 | 7.30 | 0.00 × 100 | 1.50 × 10⁶ | 100.00 | |
| Chemical separation | 3.09 × 10⁵ | 3.09 × 10⁵ | 1.43 × 101 | 3.09 × 10⁵ | 0.00 | 1.000 | 1.00 | 0.00 × 100 | 3.09 × 10⁵ | 0.01 | |
| Drying and separation | 4.30 × 10⁴ | 4.31 × 10⁴ | 1.37 × 10² | 4.30 × 10⁴ | 0.32 | 0.997 | 1.00 | 0.00 × 100 | 4.31 × 10⁴ | 0.32 | |
| WTTP | 1.28 × 10⁵ | 1.43 × 10⁶ | 1.30 × 10⁶ | 1.28 × 10⁵ | 91.03 | 0.090 | 11.15 | 1.30 × 10⁶ | 1.28 × 10⁵ | 99.12 | |
| Tailing pond | 1.87 × 10⁵ | 2.00 × 10⁵ | 1.30 × 10⁴ | 1.87 × 10⁵ | 6.52 | 0.935 | 1.07 | 0.00 × 100 | 2.00 × 10⁵ | 6.53 | |
| Casting and Molding | 6.99 × 10² | 4.36 × 10⁷ | 1.95 × 100 | 4.36 × 10⁷ | 0.00 | 1.000 | 1.00 | 0.00 × 100 | 7.01 × 10² | 0.00 | |
| Global | 3.76 × 10⁷ * | 5.20 × 10⁷ ** | 1.44 × 10⁷ | 3.76 × 10⁷ | 27.75 | 0.723 | 1.38 | 1.22 × 10⁷ | 4.12 × 10⁷ | 34.56 | 1.14 × 10⁻¹⁰ |
Disclaimer/Publisher’s Note: The statements, opinions and data contained in all publications are solely those of the individual author(s) and contributor(s) and not of MDPI and/or the editor(s). MDPI and/or the editor(s) disclaim responsibility for any injury to people or property resulting from any ideas, methods, instructions or products referred to in the content. |
© 2025 by the authors. Licensee MDPI, Basel, Switzerland. This article is an open access article distributed under the terms and conditions of the Creative Commons Attribution (CC BY) license (https://creativecommons.org/licenses/by/4.0/).
Share and Cite
Cano-Londoño, N.A.; Ordoñez-Loza, J.; Velásquez, H.I.; Cabezas, H. Exergy-Based Sustainability Assessment of Gold Mining in Colombia: A Comparative Analysis of Open-Pit and Alluvial Mining. Energies 2025, 18, 3247. https://doi.org/10.3390/en18133247
Cano-Londoño NA, Ordoñez-Loza J, Velásquez HI, Cabezas H. Exergy-Based Sustainability Assessment of Gold Mining in Colombia: A Comparative Analysis of Open-Pit and Alluvial Mining. Energies. 2025; 18(13):3247. https://doi.org/10.3390/en18133247
Chicago/Turabian StyleCano-Londoño, Natalia A., Javier Ordoñez-Loza, Héctor I. Velásquez, and Heriberto Cabezas. 2025. "Exergy-Based Sustainability Assessment of Gold Mining in Colombia: A Comparative Analysis of Open-Pit and Alluvial Mining" Energies 18, no. 13: 3247. https://doi.org/10.3390/en18133247
APA StyleCano-Londoño, N. A., Ordoñez-Loza, J., Velásquez, H. I., & Cabezas, H. (2025). Exergy-Based Sustainability Assessment of Gold Mining in Colombia: A Comparative Analysis of Open-Pit and Alluvial Mining. Energies, 18(13), 3247. https://doi.org/10.3390/en18133247