Abstract
The design of channel geometry plays a critical role in the performance of proton exchange membrane electrolytic cells (PEMECs), particularly in addressing challenges such as bubble accumulation and pressure drop, which hinder efficient hydrogen production. This study introduces an innovative uneven wave-like protrusion channel structure for PEMECs, designed to optimize mass transfer and bubble removal while minimizing energy losses. A combination of three-dimensional numerical simulations and the Taguchi design method is employed to systematically investigate the impact of protrusion height, width, and spacing on key performance metrics, including pressure drop, oxygen output, and volumetric gas content. The effects of different water supply flow rates and temperatures on the electrolytic cell were also investigated through visualization experiments. The results show that the channel with inhomogeneous waveform protrusions has superior PEMEC performance compared with the conventional single serpentine channel. In addition, the waveforms of the waveform protrusions were optimized using the Taguchi design method. The results obtained further optimized the PEMEC performance by increasing the outlet oxygen volume by 8.97%, reducing the average pressure drop by 4.4%, and decreasing the volumetric gas content by 20.26%.
1. Introduction
Undoubtedly, greenhouse gas emissions are a major driver of global warming, primarily stemming from fossil fuel use in energy production and transportation [1]. While these fuels have enabled continuous societal progress, they are progressively degrading the vital environmental conditions necessary for human survival. Over recent years, extensive haze coverage in many regions of China has not only stifled economic development but also caused significant health impacts [2]. Therefore, the effective use of clean energy is crucial to combat this haze. Faced with the dual challenges of energy shortages and environmental degradation, nations all over the world are actively exploring renewable, clean energy sources. They are keenly developing new energy technologies, aiming to reduce the reliance on traditional fossil fuels and address the growing issue of environmental pollution. Among emerging energy solutions, hydrogen is regarded as one of the most promising sources of energy due to its abundant resources, lightweight nature, and high energy density. Hydrogen, as an efficient and environmentally friendly energy carrier, offers numerous advantages. It has a calorific value of approximately 120 MJ·kg−1, about 2.7 times that of petroleum, and the only product of hydrogen combustion is water, making it exceptionally clean [3,4,5,6,7]. The proton exchange membrane electrolysis cell (PEMEC), which converts water molecules into electrons, hydrogen ions, and oxygen using electrical energy, is especially advantageous. Compared to alkaline and solid oxide electrolysis cells, the PEMEC offers a compact structure, small volume, higher current density, high purity, low-temperature operation, and enhanced safety [8,9,10,11,12].
The structural framework of the PEMEC closely resembles that of the PEMFC (proton exchange membrane fuel cell). However, their reaction mechanisms are inverse. During water electrolysis in the PEMEC, water molecules are oxidized on the anode side, releasing oxygen, protons, and electrons, producing oxygen bubbles. These bubbles migrate through the diffusion layer to the channel and are expelled with the liquid water flow. Accumulation of these bubbles in the channel impedes water transfer, adversely affecting performance [13,14]. Addressing this, a key challenge in the performance optimization of the PEMEC is ensuring the prompt delivery of liquid water and rapid removal of oxygen gas bubbles. Thus, the flow field design is crucial in the PEMEC. Typical flow field configurations include parallel, serpentine, multi-channel serpentine, and interdigitated patterns [15]. Detailed assessments of these configurations help to identify the performance variations under different operational conditions. Immerz et al. [16] analyzed the impact of water flux variations on current density in the single-channel PEMEC, noting minor effects from slight water flux changes but significant performance degradation from water flux deficiencies. Ruiz et al. [17] found that serpentine channels were most effective for hydrogen production, optimizing current density, flow rates, and thermal management. Exploring various configurations, Yang et al. [18] determined that parallel grid flow fields produced the highest current density. Ni et al. [19] observed the dynamics of multiphase flow in the anodic porous transport layer, noting how flow rate, pressure, and water–oxygen ratios influence two-phase flow behavior. Shen et al. [20] highlighted that strategic perturbations in the flow field enhance reactant transfer to the gas diffusion layer, thereby improving the PEMEC performance. Furthermore, Yang et al. [21] utilized machine learning to optimize the PEMEC flow field design of the PEMEC, successfully predicting optimal conditions for achieving commercial-scale hydrogen production rates ranging from 50 to 3000 mL⋅min−1.
In order to improve the performance of PEMEC, innovative research has been carried out on the channel structure of conventional PEMEC. Toghyani et al. [22] constructed three-dimensional models for five flow field configurations: parallel, single-path serpentine (one-path), dual-path serpentine (two-path), triple-path serpentine (three-path), and quadruple-path serpentine (four-path). They conducted experiments and, through the analysis of numerical and experimental results, concluded that serpentine channels improve the distribution of current density and temperature. Conversely, dual-path serpentines show advantages in terms of pressure drop, current density distribution, and hydrogen molar fraction, among other factors. Olesen et al. [12,23] developed a numerical model for three distinct circular, interdigitated anode flow fields, considering electrochemical reactions, heat transfer in the electrolyzer, phase changes of water, and comprehensive bubble transport. Their model accurately predicts the polarization curves of high-current-density electrolyzers at temperatures ranging from 323 K to 353 K. They discovered that at lower water flow rates, oxygen gas bubbles tend to accumulate significantly in the flow field, impeding the diffusion of liquid water. Their research aims to establish reasonable pressure drops, temperatures, and more uniform current density conditions for hydrogen production. Even in relatively straightforward experiments, their findings offer valuable insights for the flow field design of the PEMEC in the future.
To further enhance the flow field performance of the PEMEC, current research increasingly focuses on modifying channel structures or materials. Zhou et al. [24] examined the effects of uneven channel depths and the porosity of the anode gas diffusion layer on mass transfer characteristics. Their findings indicated that decreasing channel depth while increasing gas diffusion layer porosity significantly enhanced mass transfer at the channel’s outlet, thereby boosting the overall performance of the PEMEC. Wang et al. [25] introduced a novel interdigitated jet flow field derived from a single serpentine channel, featuring a metal plate with jet orifices. This configuration enhanced liquid saturation, ensured the uniform distribution of temperature and current density, and improved the polarization performance of the PEMEC. Wrubel et al. [26] simulated a two-dimensional multiphysics model of a PEMEC equipped with a thin-film porous transport layer at the anode, which includes a highly structured pore array. Their simulation, accounting for coupled electrochemical and multiphase transport phenomena, demonstrated that a higher air content promoted water entry into the reaction zone, facilitating the oxygen evolution reaction and membrane hydration. Ma et al. [27] created a PEMEC model with a 25 cm² active electrode area and three serpentine channels to evaluate electrochemical reactions, mass transfer, and thermal-fluid processes. This model was instrumental in optimizing components, conducting lab tests, and advancing material development, providing crucial insights for future flow field design. Toghyani et al. [28] replaced traditional bipolar plates with lightweight, rigid, high-temperature-resistant, and corrosion-resistant metal foam. Their study revealed that these structural enhancements significantly lowered pressure and achieved a more uniform distribution of temperature gradient, current density, and hydrogen mass fraction compared to those of double serpentine channels. Finally, Laube et al. [29] designed a tubular PEMEC that effectively reduced sealing length and the number of components, thereby lowering production costs.
However, conventional serpentine channels are prone to bubble buildup, which can be ameliorated by adding microstructures to the channel [30]. And the addition of microstructures will inevitably increase the pressure drop inside the channel. The pressure drop inside the channel of a conventional wavy runner increases due to the addition of microstructures [31]. Therefore, in order to minimize the bubble buildup inside the channel and to minimize the pressure drop inside the channel, our research group designed a channel characterized by uneven wave-like protrusions based on the conventional wavy channel. In this study, inspired by the optimization of two-phase flow by Lin et al. [32], we utilized Solidworks to create a three-dimensional model of the flow channel of the PEMEC, incorporating these wave-like protrusions on the surface of a single serpentine channel. Our investigation primarily examined the impact of these protrusions on the pressure drop of the channel and oxygen output at the outlet. We also compared these results with those from a standard single serpentine channel model. Furthermore, by employing Minitab software (19, MinitabInc, State College, PA, USA) and the Taguchi design method, we optimized the height, breadth, and spacing of the wave-like protrusions, achieving the optimal waveform under various operational conditions. Finally, the polarization curves were compared with the two-phase flow pattern in the flow channel by changing the water supply flow rate and temperature through visualization experiments.
2. Methodology
2.1. PEMEC
A standard PEMEC contains some key components, including proton exchange membrane (PEM), catalyst layers (CLs), liquid/gas diffusion layers (LGDLs), bipolar plates with flow channels, and endplates. During electrolysis, there are a series of mass transport actions inside the PEM electrolysis cell. Water flows into the flow field from the anode-side bipolar plate, then passes through the LGDL to reach the CL, where it undergoes an electrochemical reaction that generates oxygen, electrons, and protons. The produced oxygen is channeled back to the anode-side bipolar plate through the LGDL, while protons migrate to the cathode side via the PEM, where they combine with electrons to form hydrogen, as shown in Figure 1.
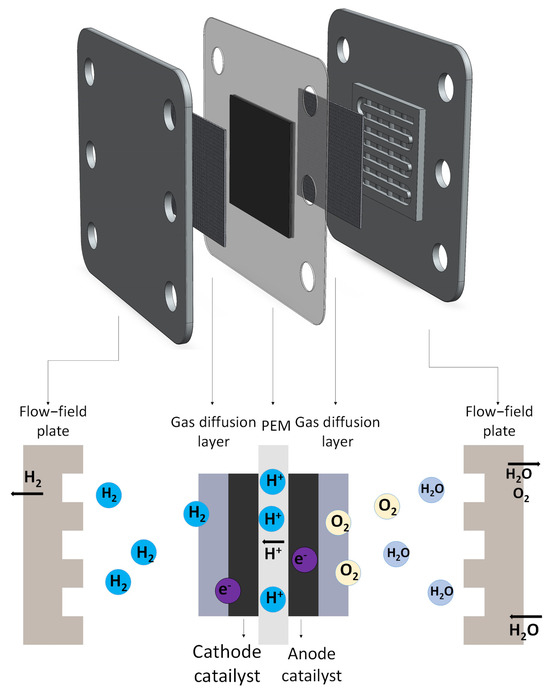
Figure 1.
Three-dimensional schematic of a PEMEC.
2.2. Theoretical Model
Figure 2a,b show the geometric structures of a conventional serpentine flow channel and a channel with an uneven wave-like protrusion structure of the PEMEC, respectively. In Figure 2b, the wave-like channel structure with uneven protrusions is illustrated. Along the flow direction of the fluid inside the channel, the upper surface of the channel is adorned with a wave-like protrusion structure. The outer contour of these wave-like protrusions is designed using a sine function, arranged unevenly with alternating highs and lows within the channel. The connection between the two protrusions is facilitated by a smooth plane. One high and one low protrusion, along with smooth planes at both ends, constitute a complete cycle, extending throughout the entire channel. However, it is important to note that at the bends within the channel, the upper surface maintains a smooth plane without protrusion structures to ensure that the kinetic energy loss of the fluid at the bends is not excessive.
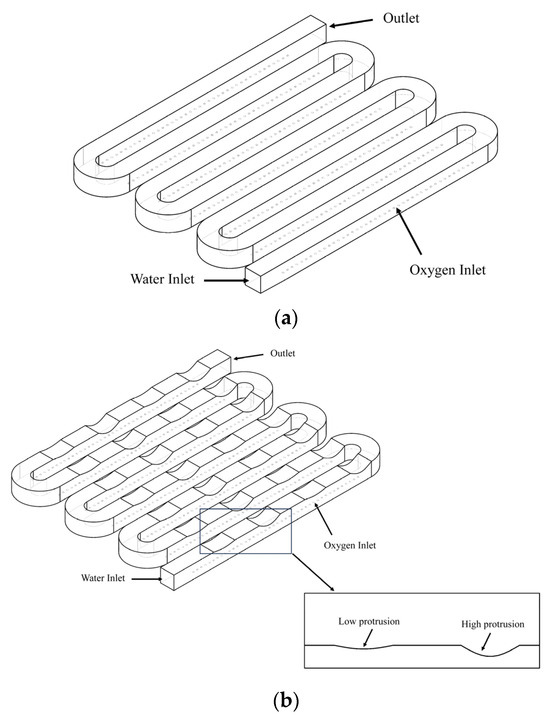
Figure 2.
The flow channel schematic of the PEMEC: (a) traditional serpentine flow channel; (b) wave-like channel with uneven protrusion.
2.3. Optimization Techniques
The Taguchi method is a highly effective experimental design technique used for optimizing multiple parameters. It identifies the best settings for control factors, examines their effects on outcomes, and explores the interplay between controllable and uncontrollable variables. Three structural parameters of the protrusion are selected for this study, which are the height, breadth, and interval, specifically shown by the side view of the flow channel in Figure 3, and optimization of three variables using the DOE (Design of Experiments). The Taguchi algorithm is carried out to capture the optimal waveform of the uneven wave-like channel, ensuring the attainment of maximum exit oxygen concentration and minimum inlet–outlet pressure drop. In this study, we make use of the Taguchi L9 standard array, comprising three factors: height, breadth, and interval of the wave-like protrusions. The Taguchi analysis involves three approaches: the larger-the-better (LTB), the smaller-the-better (STB), and the nominal-the-better (NTB), wherein the exit oxygen volume is analyzed using the LTB approach, while the pressure drop is assessed using the STB approach during experimental analysis. Table 1 outlines the three variables corresponding to the Taguchi design sequence numbers. Table 2 presents the specific numerical values and main differences of the nine models employed in this study, corresponding to the model groups of three variables in the Taguchi design sequence, with all other values remaining constant in the optimization analysis.
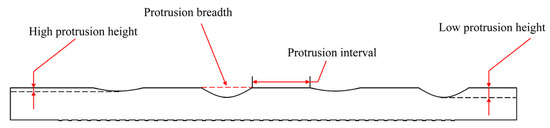
Figure 3.
Side view of the wave-like channel with uneven protrusion.

Table 1.
Taguchi design of the serial number against the strain gauge value.
Table 2.
The specific data and differences of the nine models used in this study.
2.4. Model Development
2.4.1. Computational Domain and Model Assumptions
In this study, a novel serpentiform channel with uneven wave-like protrusions is meticulously investigated. The channel is modeled using Solidworks (2022 SP05, Dassault Systemes, Waltham, MA, USA). To accurately simulate the fluid dynamics within the anode flow field, an isothermal 3D model with multiple physical fields and multiphase flow is established. To investigate the influence of the uneven wave-like protrusion channel on the overall performance, several models with varying protrusion heights, breadths, and intervals between high and low protrusions are established for comparison. To better approximate the practical flow channel, the entire serpentiform channel with uneven wave-like protrusions is employed as the computational domain.
Numerical simulations of three-dimensional multiphase flow entail substantial computational demands and suffer from poor real-time performance. To facilitate computation, a series of assumptions were made in this study: the model operates in a transient environment where bubbles are uniformly generated across the entire effective area surface (implying uniform current density under realistic conditions). Due to the use of a double-precision Volume-of-Fluid (VOF) model in Ansys (2024 R1, ANSYS, Canonsburg, PA, USA) for simulation, the pressure in the porous medium due to capillarity was neglected. The water phase change is also neglected. The process is adiabatic. Fluids are at the same temperature, and correspondingly, the energy equation is neglected.
2.4.2. Governing Equations
The model established is described by the governing equations expressed as follows:
Continuity equation:
Momentum equation:
Volume fraction:
where denotes the velocity vector, the pressure, the density, and the dynamic viscosity of the gas–liquid mixture. is the surface tension force approximated as a body force in the neighborhood of the interface, and is the volume fraction of the gas phase. Bulk properties like density and viscosity are calculated as the volume-fraction weighted averages of the properties of the two fluids.
2.4.3. Turbulence
The k-epsilon model is widely employed in viscous simulations due to its advantages, such as good convergence, reliability, low memory requirements, and fast computation speed. As this model assumes incompressible flow, the k-epsilon two-equation model is simplified as follows:
where denotes the density, t the time, the velocity, μ the dynamic viscosity, μt the turbulent viscosity, and ε the dissipation rate. σk, K, Cε1, and Cε2 are empirical coefficients. Typically, Cε1 is set at 1.44 and Cε2 is set at 1.92.
2.4.4. Geometric Parameters and Boundary Conditions
The inlet of the PEMEC is defined as a mass flow inlet, and the outlet is a pressure outlet. Ansys Fluent is used to solve the proposed system of equations. For the water inlet, the velocity is specified to be perpendicular to the inlet surface and determined by the volumetric flow rate of the recirculation pump. The total volumetric flow rate is set at 2.3 L·min−1, assuming a uniform distribution of water supply in the vertical cross-section of the flow channel and an inlet channel cross-sectional area of 1 mm². The resulting velocity is calculated to be 0.533 m·s−1. To ascertain the turbulent characteristics at the inlet, further assumptions must be made. The k-ε turbulence model is employed due to its suitability for preliminary flow field calculations involving physical phenomena like multiphase interactions [33]. Based on the findings of Wu et al. [34], a contact angle of 40° is set for the hydrophilic bottom surface of the channel, yielding improved results in data analysis, with a wall roughness set at 0.5. The oxygen inlet velocity is also specified to be perpendicular to the inlet. The geometric parameters of the channels in this study are listed in Table 3, and specific numerical values for the fluid and boundary conditions are provided in Table 4.
Table 3.
The geometric parameters.
Table 4.
Fluid and boundary conditions.
2.4.5. Mesh Sensitivity Analysis
This study focuses on the PEMEC single-channel structure with different wavy block structural parameters, so a tetrahedral mesh is used to delineate the runners. In order to capture the drastic physical changes caused by the gas–liquid interface at the oxygen inlet holes, local mesh encryption measures are applied to the holes. In the numerical calculations using the simulation software, the Navier–Stokes equations are solved by the PISO algorithm for constant-temperature, two-phase, and steady-state flow conditions. The PISO algorithm improves the computational accuracy and the convergence speed by performing multiple pressure–velocity coupling corrections in each time step, and it is suitable for dealing with complex transient flow problems. The number of meshes of the model was tested, and the number of meshes tested ranged from 30,000 to 50,000; furthermore, the exported oxygen volumes in each simulation were compared, as shown in Figure 4. When the mesh density is about 400,000 elements, the results tend to be stable with a change rate of less than 2%, which indicates that this is the critical value for achieving grid independence.
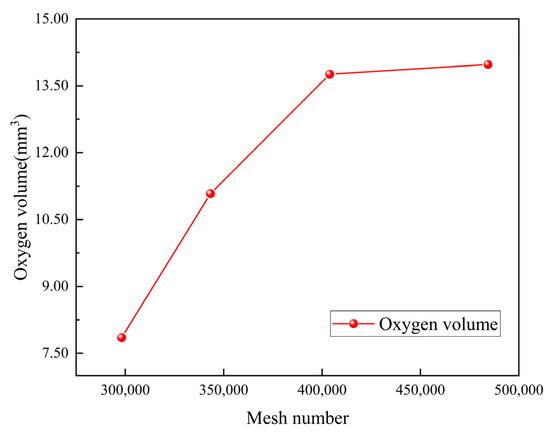
Figure 4.
Flow channel mesh independent verification of the PEMEC.
3. Simulation Results and Discussion
In this section, the primary focus is on evaluating the specific impact of wave-like protrusion structures on the PEMEC channel. This study investigates the effects of the height, breadth, and interval between two protrusions of the wave-like structures on the outlet oxygen volume and the inlet–outlet pressure drop of the channel. It is crucial to emphasize that in the context of this research, changes in the height of the wave-like protrusions refer to simultaneous increases or decreases in the heights of both the high and low protrusions. Protrusion interval variation pertains to changes in the gap between a high and a low protrusion, while breadth variation involves an increase or decrease in the breadth of each protrusion with a constant interval. The comprehensive comparison of these nine channels provides insights into how variations in the geometric parameters of the wave-like protrusions impact the performance of the PEMEC channel in the PEMEC, as indicated by the velocity, the gas coverage area, the outlet oxygen volume, the inlet–outlet pressure drop, and the volumetric gas content.
3.1. The Influence of Protrusion on the Velocity in the Flow Channel
To verify the performance differences between the new channel and the traditional serpentine channel, streamline analysis was performed on the longitudinal cross-sections of the new model with high and low protrusions, as well as the traditional serpentine channel. The cross-sections are closer to the outlet from left to right. The selected high and low protrusion longitudinal cross-sections are located in the middle of a single channel, which helps avoid interference from corners that might influence the streamlined analysis results.
As shown in Figure 5, due to the short reaction time, the flow rate in the channel near the inlet is relatively low. In contrast, the flow rate in the channel near the outlet changes due to sufficient reaction time and the formation of bubbles, which leads to increases in the flow speed. By comparing the channels with protrusions and those without protrusions, it is evident that protrusions significantly accelerate the fluid flow. This is because the improved structure reduces the height of the channel along the Z-axis, which in turn decreases the cross-sectional area of the channel. Therefore, under the assumption of constant volumetric flow, the flow rate increases, resulting in accelerated flow of the reactants in the areas with protrusions. The reduction in cross-sectional area also increases the flow resistance, promoting flow in the Z-direction and generating more longitudinal turbulence within the channel. This turbulence not only enhances the interaction between bubbles and liquid, improving the uniform distribution of the reactant gas within the channel, but also enables better distribution of the reactant gas toward the gas diffusion layer. Thus, the new channel with protrusion structures exhibits a higher fluid acceleration effect compared to the traditional serpentine channel. Below, the analysis will focus on the gas coverage area, outlet oxygen volume, inlet–outlet pressure drop, and volumetric gas content of the new channel and will specifically discuss the impact of different protrusion structures on the channel’s performance.
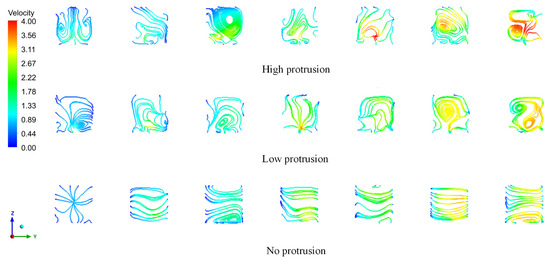
Figure 5.
Comparison of longitudinal cross-section flow lines.
3.2. The Influence of Three Variables on the Gas Coverage Area
Reducing the gas coverage area on the GDL (gas diffusion layer) surface can significantly enhance electrode surface contact, thereby improving electrolysis efficiency, reducing energy losses, and increasing system stability. As illustrated in Figure 6, the average gas coverage area on the GDL surface during the simulation process is compared across nine new flow channel designs with protrusion structures and the original serpentine channel design. The results indicate that the gas coverage areas in the nine protrusion flow channels are considerably smaller than that of the original serpentine channel. This improvement is attributed to the fact that the protrusion in the new flow channels effectively increases the water velocity. Higher water velocity generates greater shear lift forces on the bubbles, facilitating their detachment and promoting the formation of smaller bubbles. Furthermore, the likelihood of bubble accumulation into annular flows is reduced, thereby enhancing the gas discharge capability of the flow channel.
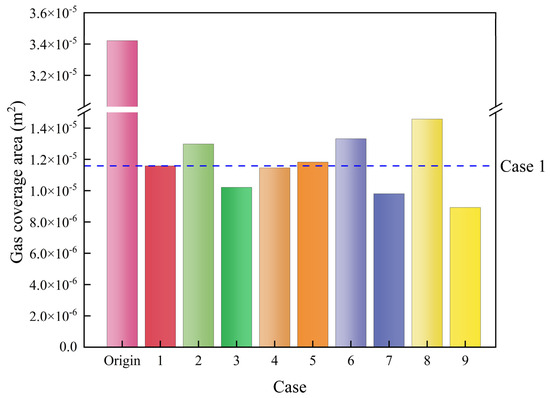
Figure 6.
Comparison of the gas coverage area of nine channels with different protrusions.
Subsequently, the impact of different protrusion parameters on the surface gas coverage area is analyzed. When comparing Case 1, Case 2, and Case 3, it is observed that reducing the height of the protrusion effectively reduces the surface gas coverage area. A comparison of Case 1, Case 4, and Case 5 reveals that the protrusion spacing has a minimal effect on the gas coverage area, although slightly increasing the spacing can marginally reduce the GDL surface coverage. In Case 1, Case 6, and Case 7, it is found that decreasing the protrusion width is the most effective method for reducing the gas coverage area among the three parameters. Finally, a comparison of Case 1, Case 8, and Case 9 demonstrates that simultaneously reducing all three parameters (protrusion height, width, and spacing) also contributes effectively to decreasing the gas coverage area on the GDL surface.
3.3. The Influence of Three Variables on the Outlet Oxygen Volume
In Figure 7, baseline parameters are established in Case 1 for subsequent comparisons. Cases 2, 3, and 1 illustrate the effect of varying protrusion heights on the outlet oxygen volume in the PEMEC with a wavy channel. The simulation results demonstrate that the presence of a wavy channel significantly enhances the outlet oxygen volume compared with a standard serpentine channel. Notably, at a protrusion height of 0.25 mm (Case 3), the flow field shows superior performance in oxygen output compared with other configurations. This suggests that excessively high protrusions increase flow resistance and energy loss in water and oxygen transport, indicating the requirement for lower protrusion heights to maximize oxygen output.
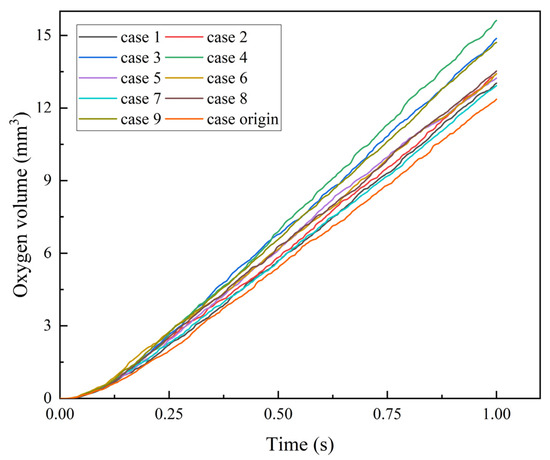
Figure 7.
Comparison of outlet oxygen volumes of nine channels with different protrusions.
Figure 7 also compares Cases 4, 5, and 1, revealing the impact of different wavy protrusion intervals on oxygen output. It is observed that a narrower protrusion interval increases the number of protrusions, enhancing the disturbance effect on the fluid, and forcing it to change direction. This introduces a substantial vertical velocity component that opposes the desired flow direction, leading to energy loss. Therefore, a wider protrusion interval (Case 4) yields a higher oxygen output by reducing undesired velocity components.
Further comparisons in Figure 7 (Cases 6, 7, and 1) show the influence of varying wavy protrusion breadths on oxygen output. A narrower protrusion breadth increases the slope of the protrusion sides due to its constant height, creating more vortices and dead zones, thereby reducing oxygen output. Conversely, wider protrusions decrease the vertical velocity component when interacting with the water, thus conserving energy and enhancing oxygen output.
Lastly, Figure 7 (Cases 8, 9, and 1) explores the simultaneous adjustment of breadth, interval, and height of the wavy protrusions. Increasing all three dimensions leads to a larger overall volume of the protrusion, enhancing flow quality within the channel. Conversely, decreasing these parameters allows more protrusion to fit within the same channel length, also benefiting flow quality. These findings highlight that the PEMEC with parametric wavy protrusion significantly outperforms a standard serpentine channel in terms of oxygen discharge rate and efficiency.
The results of the average signal-to-noise ratio are presented in Figure 8. As depicted in Figure 8, the highest signal-to-noise ratio (23.4) is achieved when the high protrusion height is 0.25 mm, the low protrusion height is 0.05 mm, the protrusion interval is 3.8 mm, and the protrusion breadth is 0.5π mm. This implies that under these protrusion conditions, the outlet oxygen volume of the uneven wave-like channel attains its maximum value. The conclusion drawn is that as the height of the protrusions increases, the outlet oxygen volume also increases. The interval between high and low protrusions needs to be maximized to achieve the highest outlet oxygen volume. Meanwhile, the breadth of the protrusions is optimal when moderate, resulting in the maximum outlet oxygen volume. This conclusion is consistent with that of the preceding paragraph.
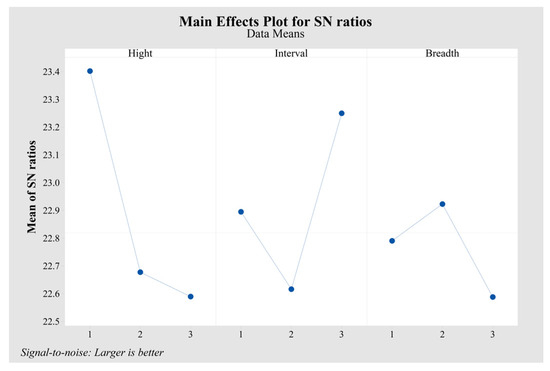
Figure 8.
Taguchi analysis: outlet oxygen volume versus height, interval, and breadth.
The magnitude of the difference Δ(The absolute value of the difference between the maximum and minimum values) between the maximum and minimum signal-to-noise ratio values in the figure can determine the significance of the three independent variables. The independent variable with the highest Δ value represents a factor of greater significance. It can be concluded from Table 5 that the height of the protrusion has the greatest effect on the volume of oxygen exported, followed by the interval, and the breadth has the least effect.
Table 5.
Outlet oxygen volume response for signal-to noise ratios.
3.4. The Influence of Three Variables on Import and Export Pressure Drop
The two-phase flow regime within the channel has a significant impact on the pressure drop along the channel, which plays a crucial role in the performance of the PEMEC. A more uniform pressure distribution within the channel can result in a smaller pressure drop at the inlet and outlet, leading to reduced energy losses for oxygen and water flowing through the channel. Consequently, the overall flow becomes relatively smoother. Figure 9 depicts the average inlet and outlet pressure drops of the uneven wavy protrusion channel model and the conventional serpentine channel model employed in this study, while Figure 10 shows the standard deviation of the pressure drop, providing a comprehensive reflection of the overall stability.
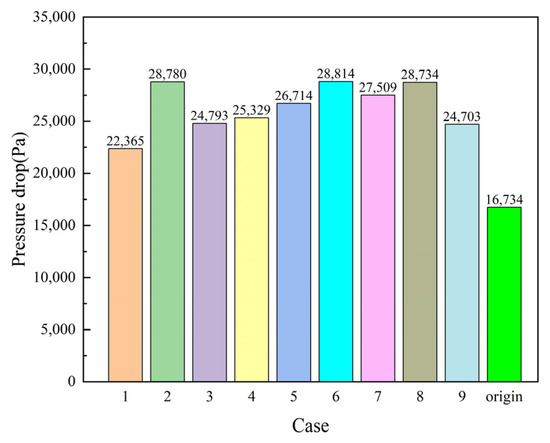
Figure 9.
Average pressure drop for all channel models.
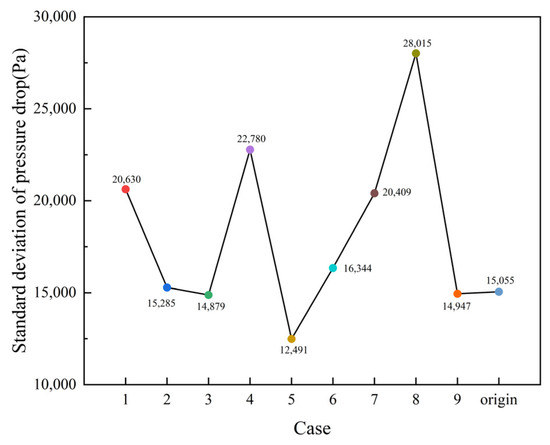
Figure 10.
Pressure drop standard deviation for all channel model entrances and exits.
As depicted in Figure 9 and Figure 10, compared with the traditional serpentine flow field channel, the flow field channel with uneven wavy protrusions causes more pressure loss. However, considering the higher efficiency of the flow field channel with uneven wavy protrusions than that of the traditional serpentine flow field channel, the difference in pressure drop between the two flow field channels is within a reasonable and acceptable range. When examining Cases 1−3 independently, it is observed that reducing the height of the protrusions can effectively decrease the standard deviation of the inlet and outlet pressure drops. This reduction ensures the uniformity of the reaction throughout the entire process. Analyzing Cases 1, 4, and 5 in Figure 9 and Figure 10, we can find that in Case 5, a significant reduction in the standard deviation of pressure drop is achieved despite only a modest increase in pressure, approximately 5% compared with Case 4. This improvement is attributed to better reaction stability in the experimental process. Additionally, we can also find that the protrusion breadth has a minor impact on the pressure drop from Cases 1, 6, and 7 in Figure 9 and Figure 10, and the magnitude of the average pressure drop is inversely proportional to the standard deviation of the pressure drop. Finally, an analysis of Case 1, 8, and 9 in Figure 9 and Figure 10 indicates that when all three variables increase simultaneously, the change in the average pressure drop is small. However, the standard deviation nearly doubles, suggesting that the simultaneous increase in these three variables intensifies pressure drop fluctuations at the inlet and outlet of the channel, leading to internal oscillations within the cell and consequently a decrease in the performance of the PEMEC.
In order to better distinguish which one of the three variables has the greatest impact on the pressure drop, the average value of the pressure drop is optimized for the Taguchi design, with the criterion of “smaller is better”. As can be seen in Figure 11, an increase in the signal-to-noise ratio means that the inlet–outlet pressure drop can be minimized, thus improving the operating conditions of the PEMEC. It is clear that the signal-to-noise ratio is lowest when the high protrusion height is 0.25 mm, the low protrusion height is 0.05 mm, the protrusion interval is 3 mm, and the protrusion breadth is 0.5π mm. In other words, the inlet–outlet pressure drop decreases as the protrusion height and interval increase. The minimum inlet–outlet pressure drop is obtained when the breadth is taken to the intermediate value of the three sets of data. Table 6 shows that among the three variables, the height of the protrusion has the greatest effect on the pressure drop, followed by breadth.
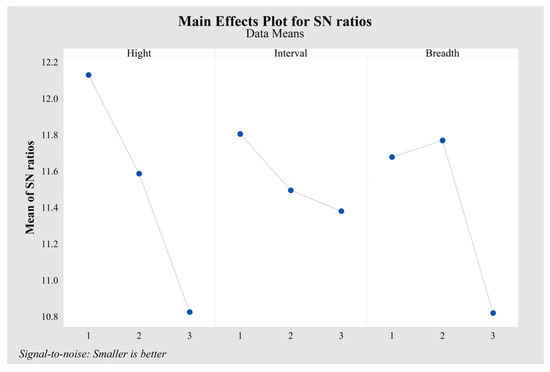
Figure 11.
Taguchi analysis: pressure drop versus height, interval, and breadth.
Table 6.
Pressure drop response for signal-to-noise ratios.
3.5. Influence of Different Flow Channel Values on Volumetric Gas Content
The volumetric gas content exerts a pivotal influence on the electrolysis efficiency within the flow channels. Elevated levels of this content indicate a predominance of the gas phase, which can hinder the movement of the liquid electrolyte and induce an uneven current density due to the non-conductive nature of gases. This disparity leads to localized areas of over-voltage and escalated energy usage. High volumetric gas content, therefore, detrimentally affects both gas transfer and electrolysis efficiency.
In the context of this research, the variability in channel volume resulting from different heights, breadths, and intervals of channel protrusions constitutes less than 1% of the total channel volume, exerting a negligible effect on the volumetric gas content of the channel. Therefore, it has been excluded from detailed consideration.
Figure 12 shows the volumetric gas content of nine different uneven wavy-like protrusion channels in this study. It is easy to find that the volumetric gas content of each channel starts to change significantly after 0.1 s. This phenomenon occurs due to the different parameters of the protrusion, resulting in different sizes of bubbles generated by the reaction in the channel. Meanwhile, it can be found that after 0.6 s, the fluctuation degree of each model curve becomes more intense compared with that of the first 0.4 s; this is because with the occurrence of the reaction in the channel, there is a portion of the tiny bubbles adsorbed on the inner wall of the channel, and at this time, the bubbles generated sometimes merge with these tiny bubbles, which makes the individual bubbles larger, resulting in greater fluctuations in the volumetric gas content.
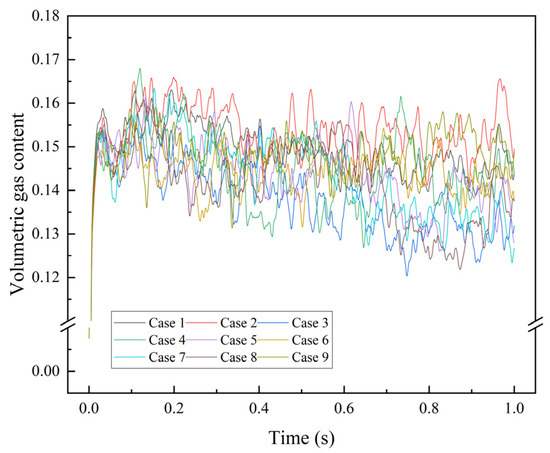
Figure 12.
Comparison of volumetric gas content of nine channels with different protrusions.
Figure 13 shows the mean and standard deviation of nine uneven wavy-like protrusion channels. The standard deviation illustrates the intensity of gas expulsion and the dimensions of the resulting bubbles. Analyzing the nine sets of data in Figure 13, it can be found that when the height of the protrusion (Cases 2 and 3) rises, the volumetric gas content of the flow channel rises. In addition, the interval (Cases 4 and 5) is similar to the height in a few ways, and a smaller interval can obtain lower volumetric gas content. The breadth (Cases 6 and 7) and the three variables (Cases 8 and 9) of the protrusion change at the same time for the standard deviation of the volumetric gas content rate and have a greater impact; when the breadth is larger, a smaller standard deviation can be obtained, and the volumetric gas content of bubbles discharged from the flow channel at this time is relatively small. The reason can be attributed to the large breadth of the protrusion, the compression degree of the gas, and the fact that the liquid inside the flow channel is low. The gas turbulence generated inside the flow channel is small because the gas bubbles produced become progressively smaller. The reason can be attributed to the fact that when the breadth of the protrusion is large, the compression of the gas and liquid in the flow channel is low, and the gas turbulence generated in the flow channel is small because the gas bubbles generated are smaller and more uniform.
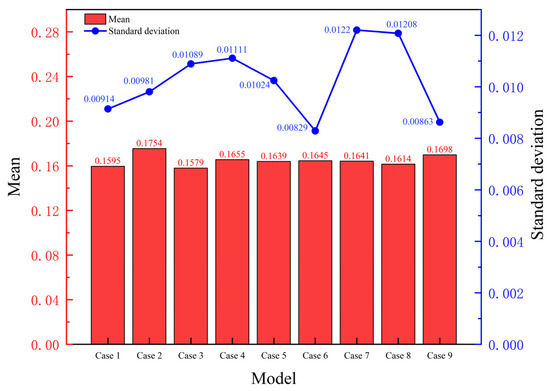
Figure 13.
Comparison of means and standard deviations of volumetric gas content of nine channels with different protrusions.
A Taguchi analysis was deployed to further scrutinize the influence of the three variables on volumetric gas content, optimizing based on the STB approaches. Figure 14 reveals that optimal SN ratios for volumetric air content are achieved with a protrusion height of 0.3/0.1 mm, an interval of 3.8 mm, and a breadth of 0.6π mm, indicating that these parameters facilitate a reduction in average volumetric air content. Additionally, the maximum delta values presented in Table 7 affirm that protrusion height has the most substantial impact on volumetric gas content, primarily due to its influence on the volume and morphology of the bubbles within the flow channel.
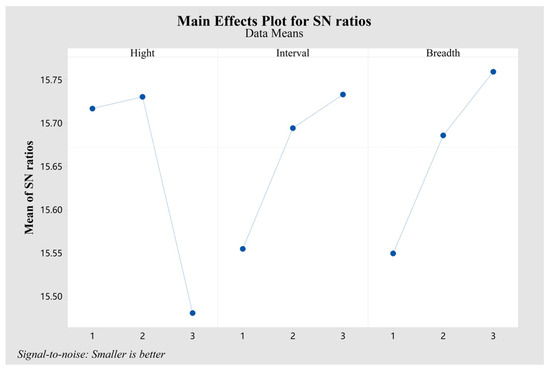
Figure 14.
Taguchi analysis: means of volumetric gas content versus height, interval, and breadth.
Table 7.
Volumetric gas content response for signal-to-noise ratios.
3.6. Validation of Optimization Results
To validate the optimization outcomes of Taguchi’s design, the model data derived from the optimization process were subjected to modeling and simulation under identical fluid and boundary conditions. The results were then compared with the best-performing data set from the original nine data sets, as illustrated in Figure 15. The three evaluation indices of the runner showed varying degrees of improvement: the outlet oxygen volumes increased by 8.97%, the average pressure drop was reduced by 4.4%, and the volumetric gas content decreased by 20.26%.
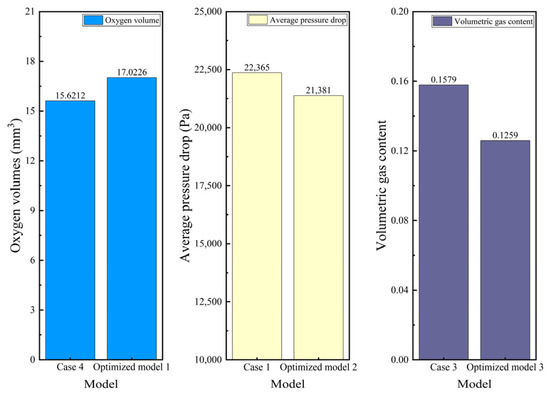
Figure 15.
Comparison of Taguchi design optimization results.
4. Experimental Results and Discussion
4.1. PEMEC Experiment Platform
The PEMEC experimental setup in this study consists of a heating system, a water control system, a power supply system, and a data detection system, as shown in Figure 16. The different numbers in the figure denote the following: 1—deionized water storage tank; 2—collector-type constant-temperature-heating magnetic stirrer; 3—peristaltic pump; 4—proton exchange membrane electrolysis cell; 5—DC (Direct Current) power supply; 6—high-speed video camera; and 7—soap film flow meter. In the electrolysis cell experiments, the water temperature is generally controlled by a preheater, and the deionized water is heated by a collector-type constant-temperature-heating magnetic stirrer to reach the target temperature before it is fed into the electrolysis cell for reaction. In addition to preheating the water, the overall structure of the cell is also preheated in actual experiments. In general, the PEMEC temperature is much higher than the ambient temperature, and the deionized water has a negligible heat loss in the pipeline before it reaches the electrolysis cell, so all the pipelines and preheating devices need to be insulated to ensure the accuracy of the experiment.
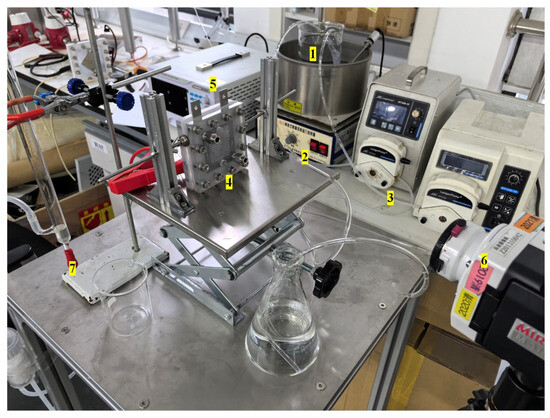
Figure 16.
PEMEC experimental setup diagram.
The PEM mono-electrolytic cell structure is the core component of the experimental setup. As shown in Figure 17, the disassembly diagram of the experimental PEMEC, respectively, includes the following: 1—acrylic end plate; 2—current distribution plate; 3—titanium felt diffusion layer; 4—acrylic parametric wavy runner plate; 5—silicone sealing gaskets with different thicknesses; 6—assemblies of the Nafinon115 PEM and iridium oxide catalytic layer; 7—assemblies of fastening parts containing M6 bolts, washers, compression rings, and nuts; 8—through-hole bolts. The end plates and runner plates were made of acrylic to facilitate the observation of the two-phase flow patterns in the runners; the PEM was clamped by two sealing washers with a thickness of 0.05 mm to facilitate the fixation, with an activation area of 4 cm × 5 cm. All the device components were fixed by a combination of twelve bolts with a torque of 2.5 N/m. The PEM was fixed with a sealing washer with a thickness of 0.05 mm to facilitate the fixation. The fully assembled PEM electrolytic cell is shown in Figure 18.
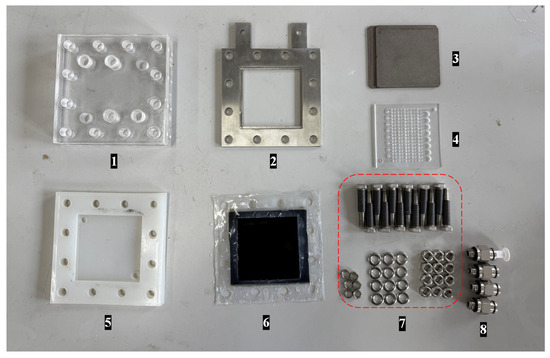
Figure 17.
PEMEC disassembled parts diagram.
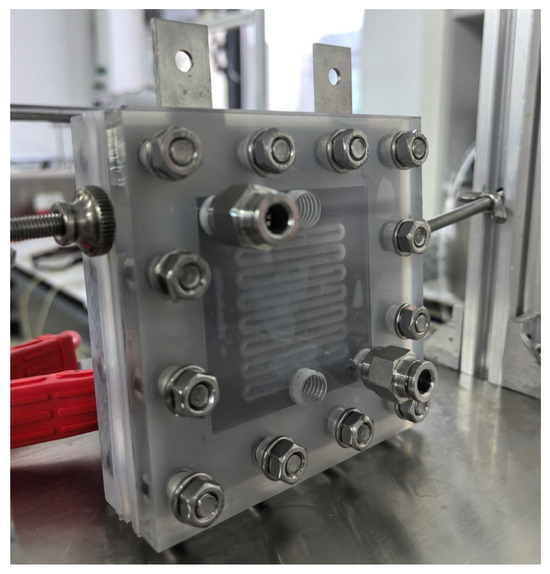
Figure 18.
PEMEC physical diagram.
4.2. Experimental Steps
Before the start of the experiment, preheating was required, which consisted of two parts. The first part was to stabilize the temperature of the deionized water entering the electrolysis cell, and the second part was to keep the temperature of the electrolysis cell stable after the water is passed through. The temperature difference between the device temperature and the preset temperature (60 °C) in the actual experiment was no more than 2 °C. After the temperature was stabilized, the unused MEA (Membrane Electrode Assembly) needed to be activated to activate the reaction channels of the catalyst in the catalytic layer. The activation process was maintained in a constant flow mode with a water supply flow rate of 10 mL/min, an inlet temperature of 60 °C, and a current density of 1 A/cm2, and the catalyst activation was completed after 10 h with a stable voltage per hour.
A constant current mode of water supply flow rate of 10 mL/min and inlet temperature of 60 °C was used to measure the polarization curve of the electrolytic cell. The current density was increased from 0.1 A/cm2 through nine current steps to 1 A/cm2. Each current density constant stayed constant for more than 10 min, and after the voltage values were stabilized, we undertook the following steps: (1) The time required for the electrolytic cell to produce a quantitative amount of hydrogen was measured. Five sets of hydrogen production times were recorded for each current density, and the average value of the five sets of times was obtained to minimize the experimental error to the highest degree. (2) We recorded the stabilized voltage value. The flow rate was set to 20 mL/min and 30 mL/min, the rest of the working conditions and results were recorded in the same way, and the above experiments were repeated.
Finally, the constant current water supply flow rate of 30 mL/min was used to analyze the effect of different inlet temperatures on the electrolytic cell by changing the inlet water temperature and shooting the gas–liquid two-phase flow pattern of the anode-side channel for 10 s at a current density of 1 A/cm2.
4.3. Analysis of Experimental Results
From Figure 19a, it can be clearly found that changing the water supply flow rate has a significant effect on the polarization curves of the electrolytic cell. When the water supply flow rate is 10 mL/min, the voltage value of the electrolytic cell is always the highest, which means that the performance of PEMEC is the worst at this time. When the current density was 1 A/cm2, the voltage of the electrolytic cell with a water supply flow rate of 30 mL/min decreased by 0.93 V compared with that of 10 mL/min. This is because the slower water supply flow rate resulted in a slower transport of the fluid in the flow channel, and the bubbles generated by the reaction process could not be discharged in time and accumulated on the surface of the electrodes and the flow channel, which impeded the transfer of electrons and reactants. An increase in the water supply flow rate helps to take away the air bubbles, so the polarization curve of the electrolytic cell is significantly improved.
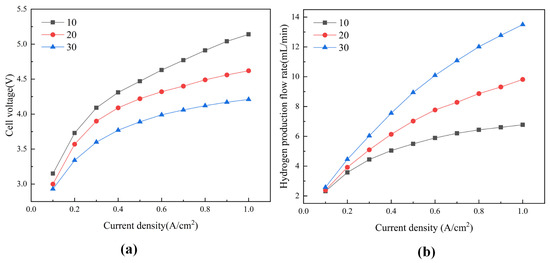
Figure 19.
Different water supply flow rates: (a) polarization curves and (b) hydrogen production flow rates.
Through further observation of Figure 19b, corresponding to Figure 19a, we see that the 30 mL/min water supply group showed not only the best performance in the polarization curve but also the best results in the hydrogen production flow rate. When the current density is in the range of 0.1–0.5 A/cm2, the electrochemical reaction of the electrolytic cell is mainly dominated by the activation process, so the variation in the hydrogen production flow rate is more significant and the slope of the data line is larger. However, when the current density exceeds 0.5 A/cm², the rate of increase in the hydrogen production flow rate tends to stabilize and the slope of the data line decreases, which can be attributed to the fact that a high current density increases the gas production in the electrolytic cell, reduces the concentration of liquid water on the electrode surface, aggravates the phenomenon of concentric polarization, and restricts the rate of increase in the hydrogen production flow rate. When the water supply flow rate is smaller than 10 mL/min, the water supply in the electrolytic cell is low, and the polarization performance is poor, which leads to the uneven distribution of current density and temperature inside the electrolytic cell, affecting the performance of the electrolytic cell. Increasing the water supply flow rate can effectively increase the liquid water volume fraction in the flow channel, reduce the phenomenon of concentration polarization, provide sufficient heat for the electrolytic cell for heat absorption reaction at low voltage, and take away the excess heat in the electrolytic cell at high voltage. As a result, when the water supply flow rate was increased from 10 mL/min to 30 mL/min, the hydrogen production flow rate was increased by 98.23%.
Figure 20 shows the visualized images of the two-phase flow pattern in the anode-side flow channel at different water supply temperatures. The two-phase flow videos were taken at water supply temperatures of 40 °C, 60 °C, and 80 °C, respectively. Representative images were extracted for comparison and analyzed frame by frame. The white area in the figure shows the cavity covered by water vapor due to unavoidable structural deformation, and its effect on the experiment is ignored because the cavity is small.
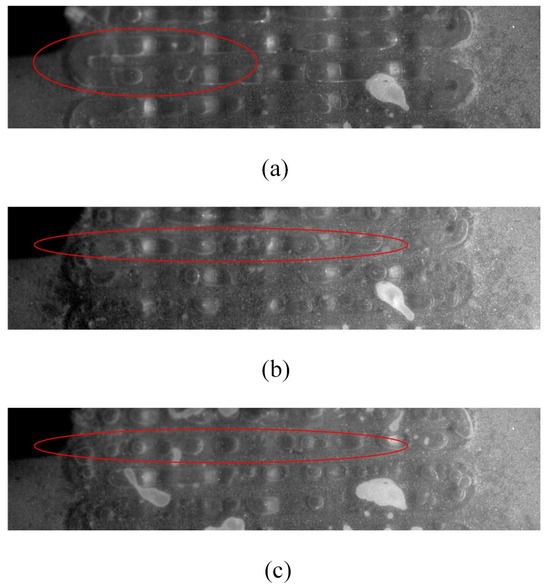
Figure 20.
Visualization image of the anode side at a water supply temperature of (a) 40 °C, (b) 60 °C, and (c) 80 °C.
Observation of Figure 20a reveals that two-phase flow performs poorly at lower water supply temperatures. The flow path is characterized by the presence of plunger flow at the flow path turn and severe bubble retention. This is attributed to the insufficient heat supply in the catalytic region due to the low water supply temperature, which reduces the intensity of the electrochemical reaction. The local current density gradually decreases along the flow direction, and the fluid state in the flow channel tends to be stable. This state cannot provide enough kinetic energy for the liquid water in the flow channel, resulting in a reduction of the flow velocity gradient, and the normal velocity generated by the parametric wave structure is also small, which makes it difficult to destroy the plunger flow; thus, it cannot effectively eliminate the air bubbles retained in the flow channel.
In contrast, the bubble-plunger flow phenomenon in Figure 20b is less common, occasionally appearing at the flow channel turn but quickly destroyed by the parametric wavy structure. More often observed are large bubbles with a maximum width of about 80% of the channel width. In Figure 20c, the size of bubbles in the flow channel is further reduced to a maximum width of about 70% of the flow channel width, and the phenomenon of easily discharged foam flow occurs. This is attributed to the fact that the higher water supply temperature helps to reduce the activation energy, increase the proton conductivity of the PEM, and facilitate the reaction. The increased water consumption made the fluid motion state unstable and enhanced the normal velocity in the flow channel, which favored normal mass transfer and bubble discharge.
Too low a reaction temperature can lead to a decrease in PEMEC electrolysis efficiency and an increase in energy consumption, affecting its performance and economy. However, it is important to note that too high a temperature may increase the ohmic heat of the electrolytic cell, affect the average temperature of the PEM, and even lead to dehydration and chemical degradation of the PEM, which can trigger the risk of performance degradation.
5. Conclusions
In order to further optimize the existing PEMEC channel structure, a wave-like uneven protrusion channel was designed. The performance of the PEMEC utilizing the uneven wave-like protrusion channel was investigated through three-dimensional numerical simulations, considering variations in protrusion height, interval, and breadth. A comparative analysis was also conducted to investigate the performance of the PEMEC using a traditional single serpentine channel. Subsequently, the Design of Experiments (DOE) Taguchi optimization algorithm was employed to optimize the waveforms of the protrusions. Finally, experiments were conducted on the novel flow channel. The results of this study are presented below:
1. In comparison with a traditional serpentine channel, the uneven wave-like channel alters the velocity of reactants within the channel due to the physical obstruction of protrusions, leading to improved gas coverage on GDL surfaces and an increase in the volume of outlet oxygen and an enhancement in the performance of the PEMEC.
2. Optimizing the design according to Taguchi methods can lead to improved performance in oxygen outlet volume and pressure drop. Increasing protrusion height, widening protrusion breadth, and adjusting the protrusion interval can enhance oxygen outlet volume. For the highest outlet oxygen volume and reaction efficiency, the optimal conditions are a high protrusion height of 0.35 mm, a low protrusion height of 0.15 mm, a protrusion interval of 3.8 mm, and a protrusion breadth of 0.6π mm, which can boost exported oxygen volume by 8.97%. Similarly, reducing inlet and outlet pressure drop can be achieved by increasing protrusion height, expanding protrusion interval, and widening protrusion breadth. The optimal conditions for the minimum pressure drop after Taguchi’s analysis are as follows: the high protrusion height is 0.35 mm, the low protrusion height is 0.15 mm, the protrusion interval is 3.8 mm, and the protrusion width is 0.6π mm. This makes the reaction process more stable and reduces the inlet and outlet pressure drop by 4.4%.
3. Reduction of the volumetric gas content within the flow channels is achievable through the diminution of protrusion height, the constriction of the protrusion interval, and the expansion of protrusion breadth. Simulation data indicate that an optimal configuration, characterized by a high protrusion height of 0.25 mm, a low protrusion height of 0.05 mm, an interval of 3 mm, and a breadth of 0.6π mm, yields volumetric gas content decreased by 20.26%. This configuration facilitates smaller bubble formation, which in turn enhances the ease of discharge and accelerates the reaction rate within the flow channel.
4. The influence of protrusion height on the volume of outlet oxygen, inlet/outlet pressure drop, and volumetric gas content is more pronounced compared to breadth and interval.
5. Increasing the water supply flow rate from 10 mL/min to 30 mL/min increases the electrolytic cell voltage by 0.93 V and the hydrogen production flow rate by 98.23%. Optimizing the water supply flow rate helps to reduce the concentration polarization improve bubble removal and enhance heat transfer.
6. As the temperature of the water supply increases, the removal of bubbles becomes easier, the size of bubbles in the flow channel decreases significantly, and the hydrogen production efficiency increases.
7. The optimization results obtained in this study are not globally optimal. To refine these results, advanced optimization algorithms, such as genetic algorithms, will be employed to enhance the robustness and accuracy of the flow channel model data. Long-term durability will also be verified through accelerated testing and material coatings, and specific experimental comparisons with manufacturing energy costs, and actual performance gains.
Author Contributions
Conceptualization, Z.-L.F. and T.-J.Z.; methodology, Z.-L.F. and S.X.; software, Z.-L.F., T.-J.Z. and S.X.; validation, B.H., T.-J.Z. and S.X.; formal analysis, L.-H.Z.; investigation, G.-L.W.; resources, B.H.; data curation, S.X.; writing—original draft preparation, Z.-L.F.; writing—review and editing, Z.-L.F. and T.-J.Z.; visualization, T.-J.Z.; supervision, B.H., G.-L.W., T.-J.Z. and S.X.; project administration, S.X.; funding acquisition, B.H. All authors have read and agreed to the published version of the manuscript.
Funding
This research was funded by the National Key R&D Program of China, grant number 2021YFA1500900.
Informed Consent Statement
Informed consent was obtained from all subjects involved in the study.
Data Availability Statement
The data presented in this study are available on request from the corresponding author due to project data confidentiality agreement.
Acknowledgments
The authors thank the National Key R&D Program of China (2021YFA1500900) for the grants that support this research.
Conflicts of Interest
The authors declare no conflict of interest.
References
- Zhao, H.; Kamp, L.M.; Lukszo, Z. Exploring supply chain design and expansion planning of China’s green ammonia production with an optimization-based simulation approach. Int. J. Hydrogen Energy 2021, 46, 32331–32349. [Google Scholar] [CrossRef]
- von Hinke, S.; Sørensen, E.N. The long-term effects of early-life pollution exposure: Evidence from the London smog. J. Health Econ. 2023, 92, 102827. [Google Scholar] [CrossRef] [PubMed]
- Barbir, F. PEM electrolysis for production of hydrogen from renewable energy sources. Sol. Energy 2005, 78, 661–669. [Google Scholar] [CrossRef]
- Momirlan, M.; Veziroglu, T.N. Current status of hydrogen energy. Renew. Sustain. Energy Rev. 2002, 6, 141–179. [Google Scholar] [CrossRef]
- Grigoriev, S.A.; Porembsky, V.I.; Fateev, V.N. Pure hydrogen production by PEM electrolysis for hydrogen energy. Int. J. Hydrogen Energy 2006, 31, 171–175. [Google Scholar] [CrossRef]
- Gholami, T.; Salavati-Niasari, M.; Varshoy, S. Electrochemical hydrogen storage capacity and optical properties of NiAl2O4/NiO nanocomposite synthesized by green method. Int. J. Hydrogen Energy 2017, 42, 5235–5245. [Google Scholar] [CrossRef]
- Bondarenko, A.V.; Islamov, S.R.; Ignatyev, K.V.; Mardashov, D.V. Laboratory studies of polymer compositions for well-kill under increased fracturing. Perm J. Pet. Min. Eng. 2020, 20, 37–48. [Google Scholar] [CrossRef]
- Belousov, A.; Lushpeev, V.; Sokolov, A.; Sultanbekov, R.; Tyan, Y.; Ovchinnikov, E.; Shvets, A.; Bushuev, V.; Islamov, S. Experimental Research of the Possibility of Applying the Hartmann–Sprenger Effect to Regulate the Pressure of Natural Gas in Non-Stationary Conditions. Processes 2025, 13, 1189. [Google Scholar] [CrossRef]
- Falcão, D.S.; Pinto, A.M.F.R. A review on PEM electrolyzer modelling: Guidelines for beginners. J. Clean. Prod. 2020, 261, 121184. [Google Scholar] [CrossRef]
- Marshall, A.T.; Haverkamp, R.G. Production of hydrogen by the electrochemical reforming of glycerol–water solutions in a PEM electrolysis cell. Int. J. Hydrogen Energy 2008, 33, 4649–4654. [Google Scholar] [CrossRef]
- Caravaca, A.; Sapountzi, F.M.; de Lucas-Consuegra, A.; Molina-Mora, C.; Dorado, F.; Valverde, J.L. Electrochemical reforming of ethanol–water solutions for pure H2 production in a PEM electrolysis cell. Int. J. Hydrogen Energy 2012, 37, 9504–9513. [Google Scholar] [CrossRef]
- Olesen, A.C.; Rømer, C.; Kær, S.K. A numerical study of the gas-liquid, two-phase flow maldistribution in the anode of a high pressure PEM water electrolysis cell. Int. J. Hydrogen Energy 2016, 41, 52–68. [Google Scholar] [CrossRef]
- Wang, Y.; Chen, K.S.; Mishler, J.; Cho, S.C.; Adroher, X.C. A review of polymer electrolyte membrane fuel cells: Technology, applications, and needs on fundamental research. Appl. Energy 2011, 88, 981–1007. [Google Scholar] [CrossRef]
- Bazarah, A.; Majlan, E.H.; Husaini, T.; Zainoodin, A.M.; Alshami, I.; Goh, J.; Masdar, M.S. Factors influencing the performance and durability of polymer electrolyte membrane water electrolyzer: A review. Int. J. Hydrogen Energy 2022, 47, 35976–35989. [Google Scholar] [CrossRef]
- Wei, Q.; Fan, L.; Tu, Z. Hydrogen production in a proton exchange membrane electrolysis cell(PEMEC) with titanium meshes as flow distributors. Int. J. Hydrogen Energy 2023, 48, 36271–36285. [Google Scholar] [CrossRef]
- Immerz, C.; Schweins, M.; Trinke, P.; Bensmann, B.; Paidar, M.; Bystroň, T.; Bouzek, K.; Hanke-Rauschenbach, R. Experimental characterization of inhomogeneity in current density and temperature distribution along a single-channel PEM water electrolysis cell. Electrochim. Acta 2018, 260, 582–588. [Google Scholar] [CrossRef]
- Ruiz, D.D.H.; Sasmito, A.P.; Shamim, T. Numerical Investigation of the High Temperature PEM Electrolyzer: Effect of Flow Channel Configurations. ECS Trans. 2013, 58, 99. [Google Scholar] [CrossRef]
- Yang, R.; Yesuraj, J.; Kim, K. Effect of Flow Channel Shape and Operating Temperature on the Performance of a Proton Exchange Membrane Electrolyzer Cell. Energy Fuels 2023, 37, 12178–12191. [Google Scholar] [CrossRef]
- Ni, A.; Upadhyay, M.; Kumar, S.S.; Uwitonze, H.; Lim, H. Anode analysis and modelling hydrodynamic behaviour of the multiphase flow field in circular PEM water electrolyzer. Int. J. Hydrogen Energy 2023, 48, 16176–16183. [Google Scholar] [CrossRef]
- Shen, J.; Tu, Z. Flow channel design in a proton exchange membrane fuel cell: From 2D to 3D. Int. J. Hydrogen Energy 2022, 47, 3087–3098. [Google Scholar] [CrossRef]
- Yang, R.; Mohamed, A.; Kim, K. Optimal design and flow-field pattern selection of proton exchange membrane electrolyzers using artificial intelligence. Energy 2023, 264, 126135. [Google Scholar] [CrossRef]
- Toghyani, S.; Afshari, E.; Baniasadi, E.; Atyabi, S.A. Thermal and electrochemical analysis of different flow field patterns in a PEM electrolyzer. Electrochim. Acta 2018, 267, 234–245. [Google Scholar] [CrossRef]
- Olesen, A.C.; Frensch, S.H.; Kær, S.K. Towards uniformly distributed heat, mass and charge: A flow field design study for high pressure and high current density operation of PEM electrolysis cells. Electrochim. Acta 2019, 293, 476–495. [Google Scholar] [CrossRef]
- Zhou, H.; Chen, B.; Meng, K.; Luo, M.; Li, P.; Tu, Z. Combination effect of flow channel configuration and anode GDL porosity on mass transfer and performance of PEM water electrolyzers. Sustain. Energy Fuels 2022, 6, 3944–3960. [Google Scholar] [CrossRef]
- Wang, X.; Wang, Z.; Feng, Y.; Xu, C.; Chen, Z.; Liao, Z.; Ju, X. Three-dimensional multiphase modeling of a proton exchange membrane electrolysis cell with a new interdigitated-jet hole flow field. Sci. China Technol. Sci. 2022, 65, 1179–1192. [Google Scholar] [CrossRef]
- Wrubel, J.A.; Kang, Z.; Witteman, L.; Zhang, F.-Y.; Ma, Z.; Bender, G. Mathematical modeling of novel porous transport layer architectures for proton exchange membrane electrolysis cells. Int. J. Hydrogen Energy 2021, 46, 25341–25354. [Google Scholar] [CrossRef]
- Ma, Z.; Witteman, L.; Wrubel, J.A.; Bender, G. A comprehensive modeling method for proton exchange membrane electrolyzer development. Int. J. Hydrogen Energy 2021, 46, 17627–17643. [Google Scholar] [CrossRef]
- Toghyani, S.; Afshari, E.; Baniasadi, E. Metal foams as flow distributors in comparison with serpentine and parallel flow fields in proton exchange membrane electrolyzer cells. Electrochim. Acta 2018, 290, 506–519. [Google Scholar] [CrossRef]
- Laube, A.; Hofer, A.; Sánchez Batalla, B.; Ressel, S.; Chica, A.; Fischer, S.; Weidlich, C.; Bachmann, J.; Struckmann, T. Tubular membrane electrode assembly for PEM electrolysis. Int. J. Hydrogen Energy 2022, 47, 15943–15951. [Google Scholar] [CrossRef]
- Zhang, L.H.; Huang, B.; Zhou, T.J.; Xu, S. Enhancing oxygen transport performance with improved serpentine flow field on the anode side of the PEMEC. Int. J. Hydrogen Energy 2024, 82, 881–891. [Google Scholar] [CrossRef]
- Liu, M.; Fan, W.; Lu, G. Study on mass transfer enhancement of locally improved structures and the application in serpentine and parallel flow fields of PEM fuel cells. Int. J. Hydrogen Energy 2023, 48, 19248–19261. [Google Scholar] [CrossRef]
- Lin, Q.; Li, Q.; Xu, P.; Zheng, R.; Bao, J.; Li, L.; Tan, D. Transport Mechanism and Optimization Design of LBM–LES Coupling-Based Two-Phase Flow in Static Mixers. Processes 2025, 13, 1666. [Google Scholar] [CrossRef]
- Argyropoulos, C.D.; Markatos, N.C. Recent advances on the numerical modelling of turbulent flows. Appl. Math. Model. 2015, 39, 693–732. [Google Scholar] [CrossRef]
- Wu, J.; Li, Y.; Wang, Y. Three-dimension simulation of two-phase flows in a thin gas flow channel of PEM fuel cell using a volume of fluid method. Int. J. Hydrogen Energy 2020, 45, 29730–29737. [Google Scholar] [CrossRef]
Disclaimer/Publisher’s Note: The statements, opinions and data contained in all publications are solely those of the individual author(s) and contributor(s) and not of MDPI and/or the editor(s). MDPI and/or the editor(s) disclaim responsibility for any injury to people or property resulting from any ideas, methods, instructions or products referred to in the content. |
© 2025 by the authors. Licensee MDPI, Basel, Switzerland. This article is an open access article distributed under the terms and conditions of the Creative Commons Attribution (CC BY) license (https://creativecommons.org/licenses/by/4.0/).