
Next-Level Energy Management in Manufacturing: Facility-Level Energy Digital Twin Framework Based on Machine Learning and Automated Data Collection


Abstract
1. Introduction
2. Literature Review
2.1. Energy Management
2.2. Energy Digital Twin (DT)
2.3. Summary
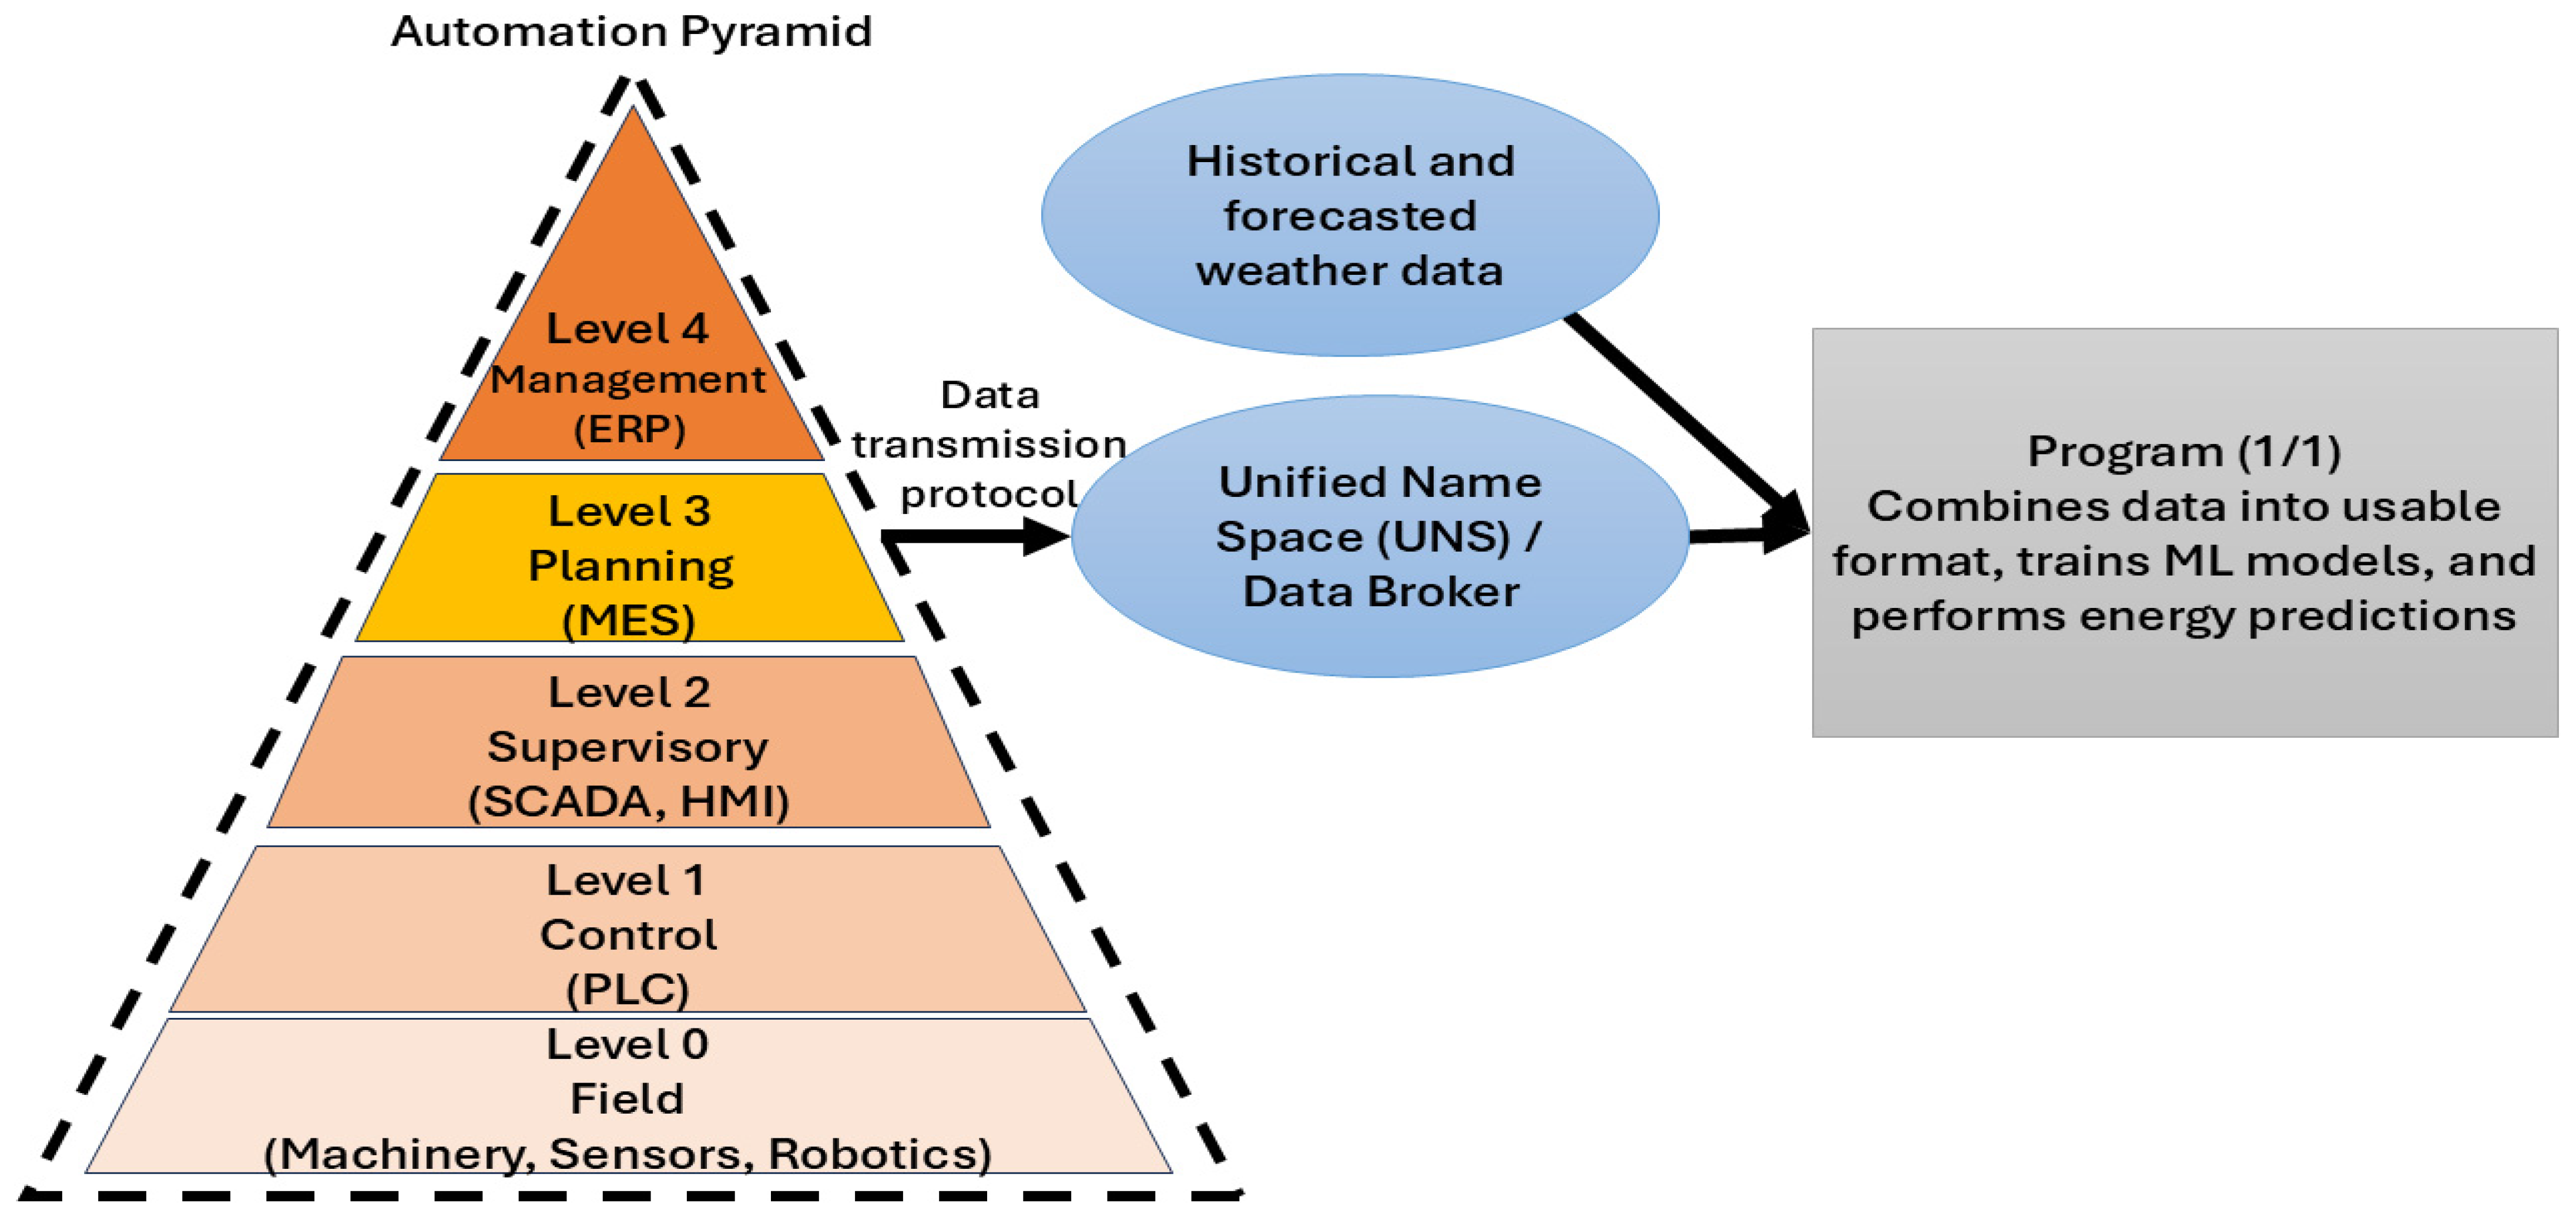
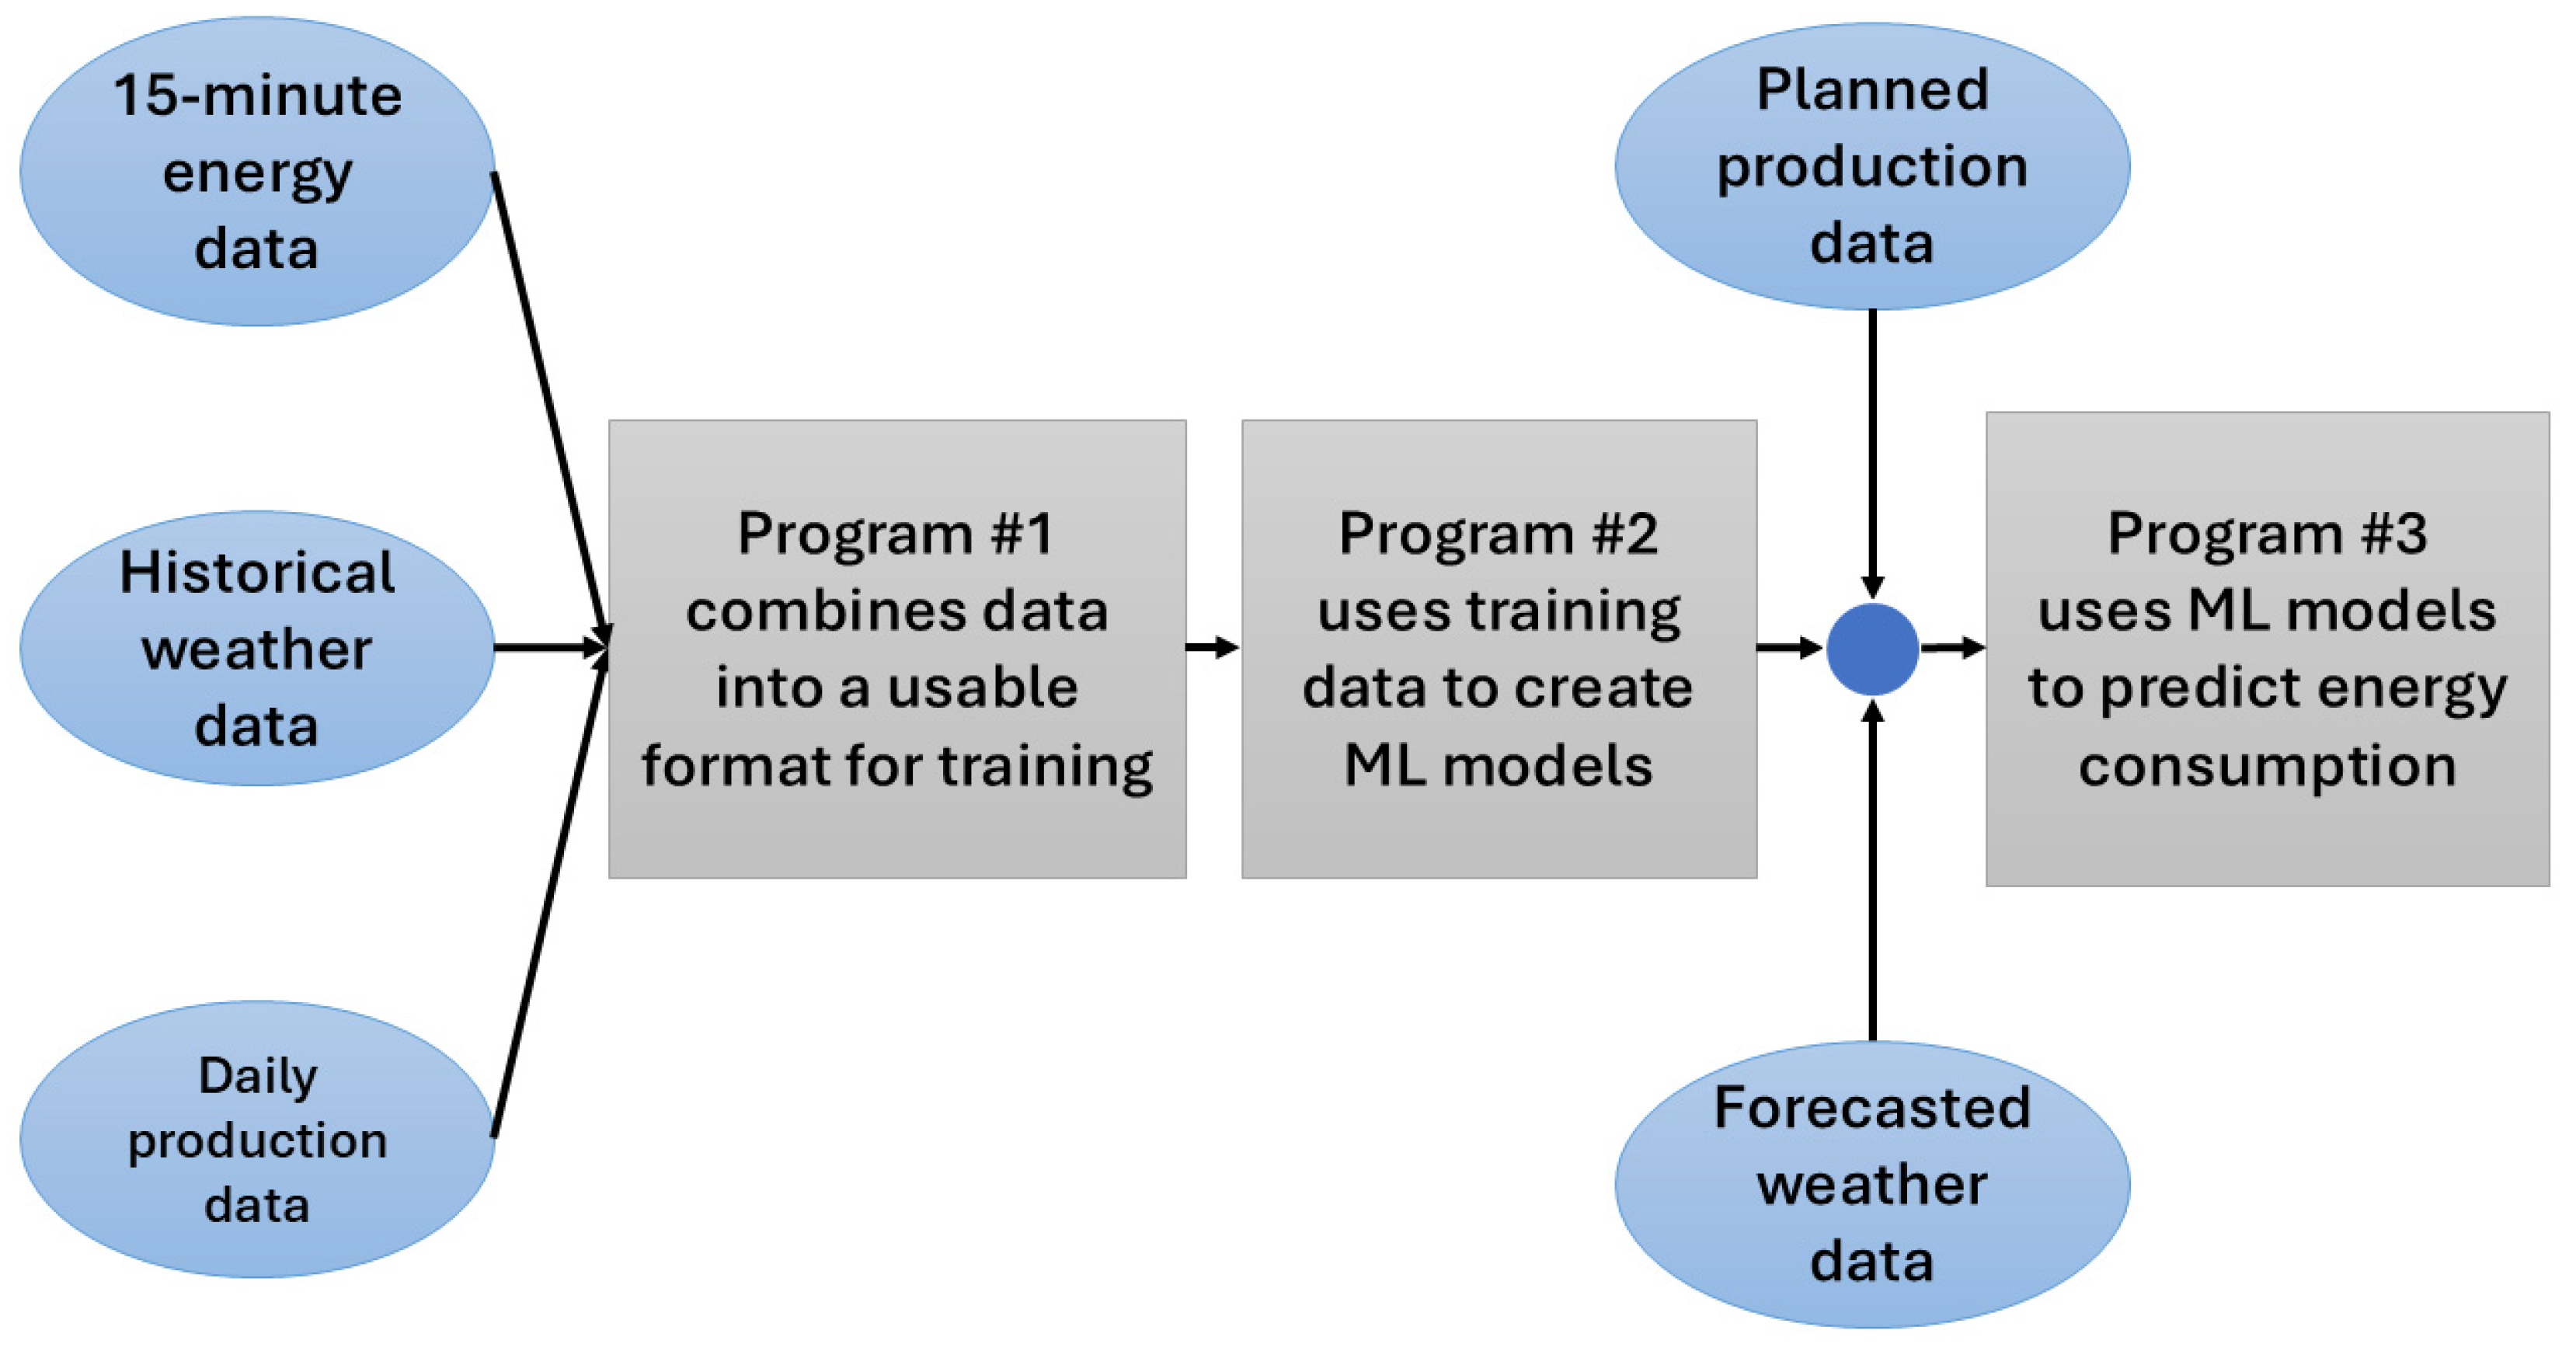
3. Methodology
3.1. Framework Overview
3.2. Prediction Models
- Naïve (Average)—A naïve model does not use sophisticated methods to make a prediction and is often used as a benchmark for testing ML models. An average naïve model takes the average of the training dataset and applies it to all future forecasts. If a model cannot achieve a lower root mean square error (RMSE) than the naïve model, it is not as good as random chance. The of an average naïve model is 0.
- Naïve (Historical)—A historical naïve model takes data from one year prior and applies it to the future forecast. This is an industry practice that often improves upon the naïve average method.
- Linear—A simple linear regression model involving only one variable, in this case, production. The equation for a line of best fit is , where represents any point that satisfies the equation. The -intercept, , is the -value when . The slope, m, is the change in when increases by 1.
- GLMNET (Net Regularized Generalized Linear Regression Model)—Considers all variables and gives a reasonable estimation of the significant predictors. It fits lasso and elastic-net models for linear, logistic, and multinomial regression using coordinate descent. It is extremely fast and exploits sparsity in the input x matrix, and can make various predictions accurately. For an alpha = 0, ridge regression is employed, which tends to yield equal coefficients and never fully eliminates predictors. For an alpha = 1, lasso regression picks fewer correlated predictors and discards the rest. For values between 0 and 1, the two methods are blended. A Generalized Linear Model (GLM) was also performed, but the results were close to GLMNET, and we chose not to include them.
- PCR (Principal Component Regression)—In PCR, principal component analysis is first performed on the original data, then dimension reduction is accomplished by selecting the number of principal components using cross-validation and test error, and finally, regression is conducted using the first dimension reduced principal components. PCR performs better than previous models on massive datasets and can accurately handle variables like “day of the week” and “month of the year.” Partial Least Squares Regression (PLSR) was also performed in this study, but the results were close to PCR, and we chose not to include them.
- KNN (K-Nearest Neighbor)—A non-parametric, supervised learning classification model that uses proximity to make classifications or predictions about the grouping of an individual data point. It is typically used as a classification algorithm for pattern recognition, working off the assumption that similar points can be found near one another. It can sometimes perform better on large datasets than previous models if there is an understanding to be developed based on neighborhoods or groupings that simple linear regression cannot determine.
- Random Forest (RF)—Random Forest is a popular ML algorithm that combines the output of decision trees to reach a result. It is popular due to its ease of use, flexibility, and ability to handle classification and regression problems.
- Bayesian Regularized Neural Net (BRNN)—A neural network that incorporates posterior inference to reduce overfitting and can be trained based on just one parameter, the number of neurons.
3.3. Determining the Best Model
3.4. Experimental Processes
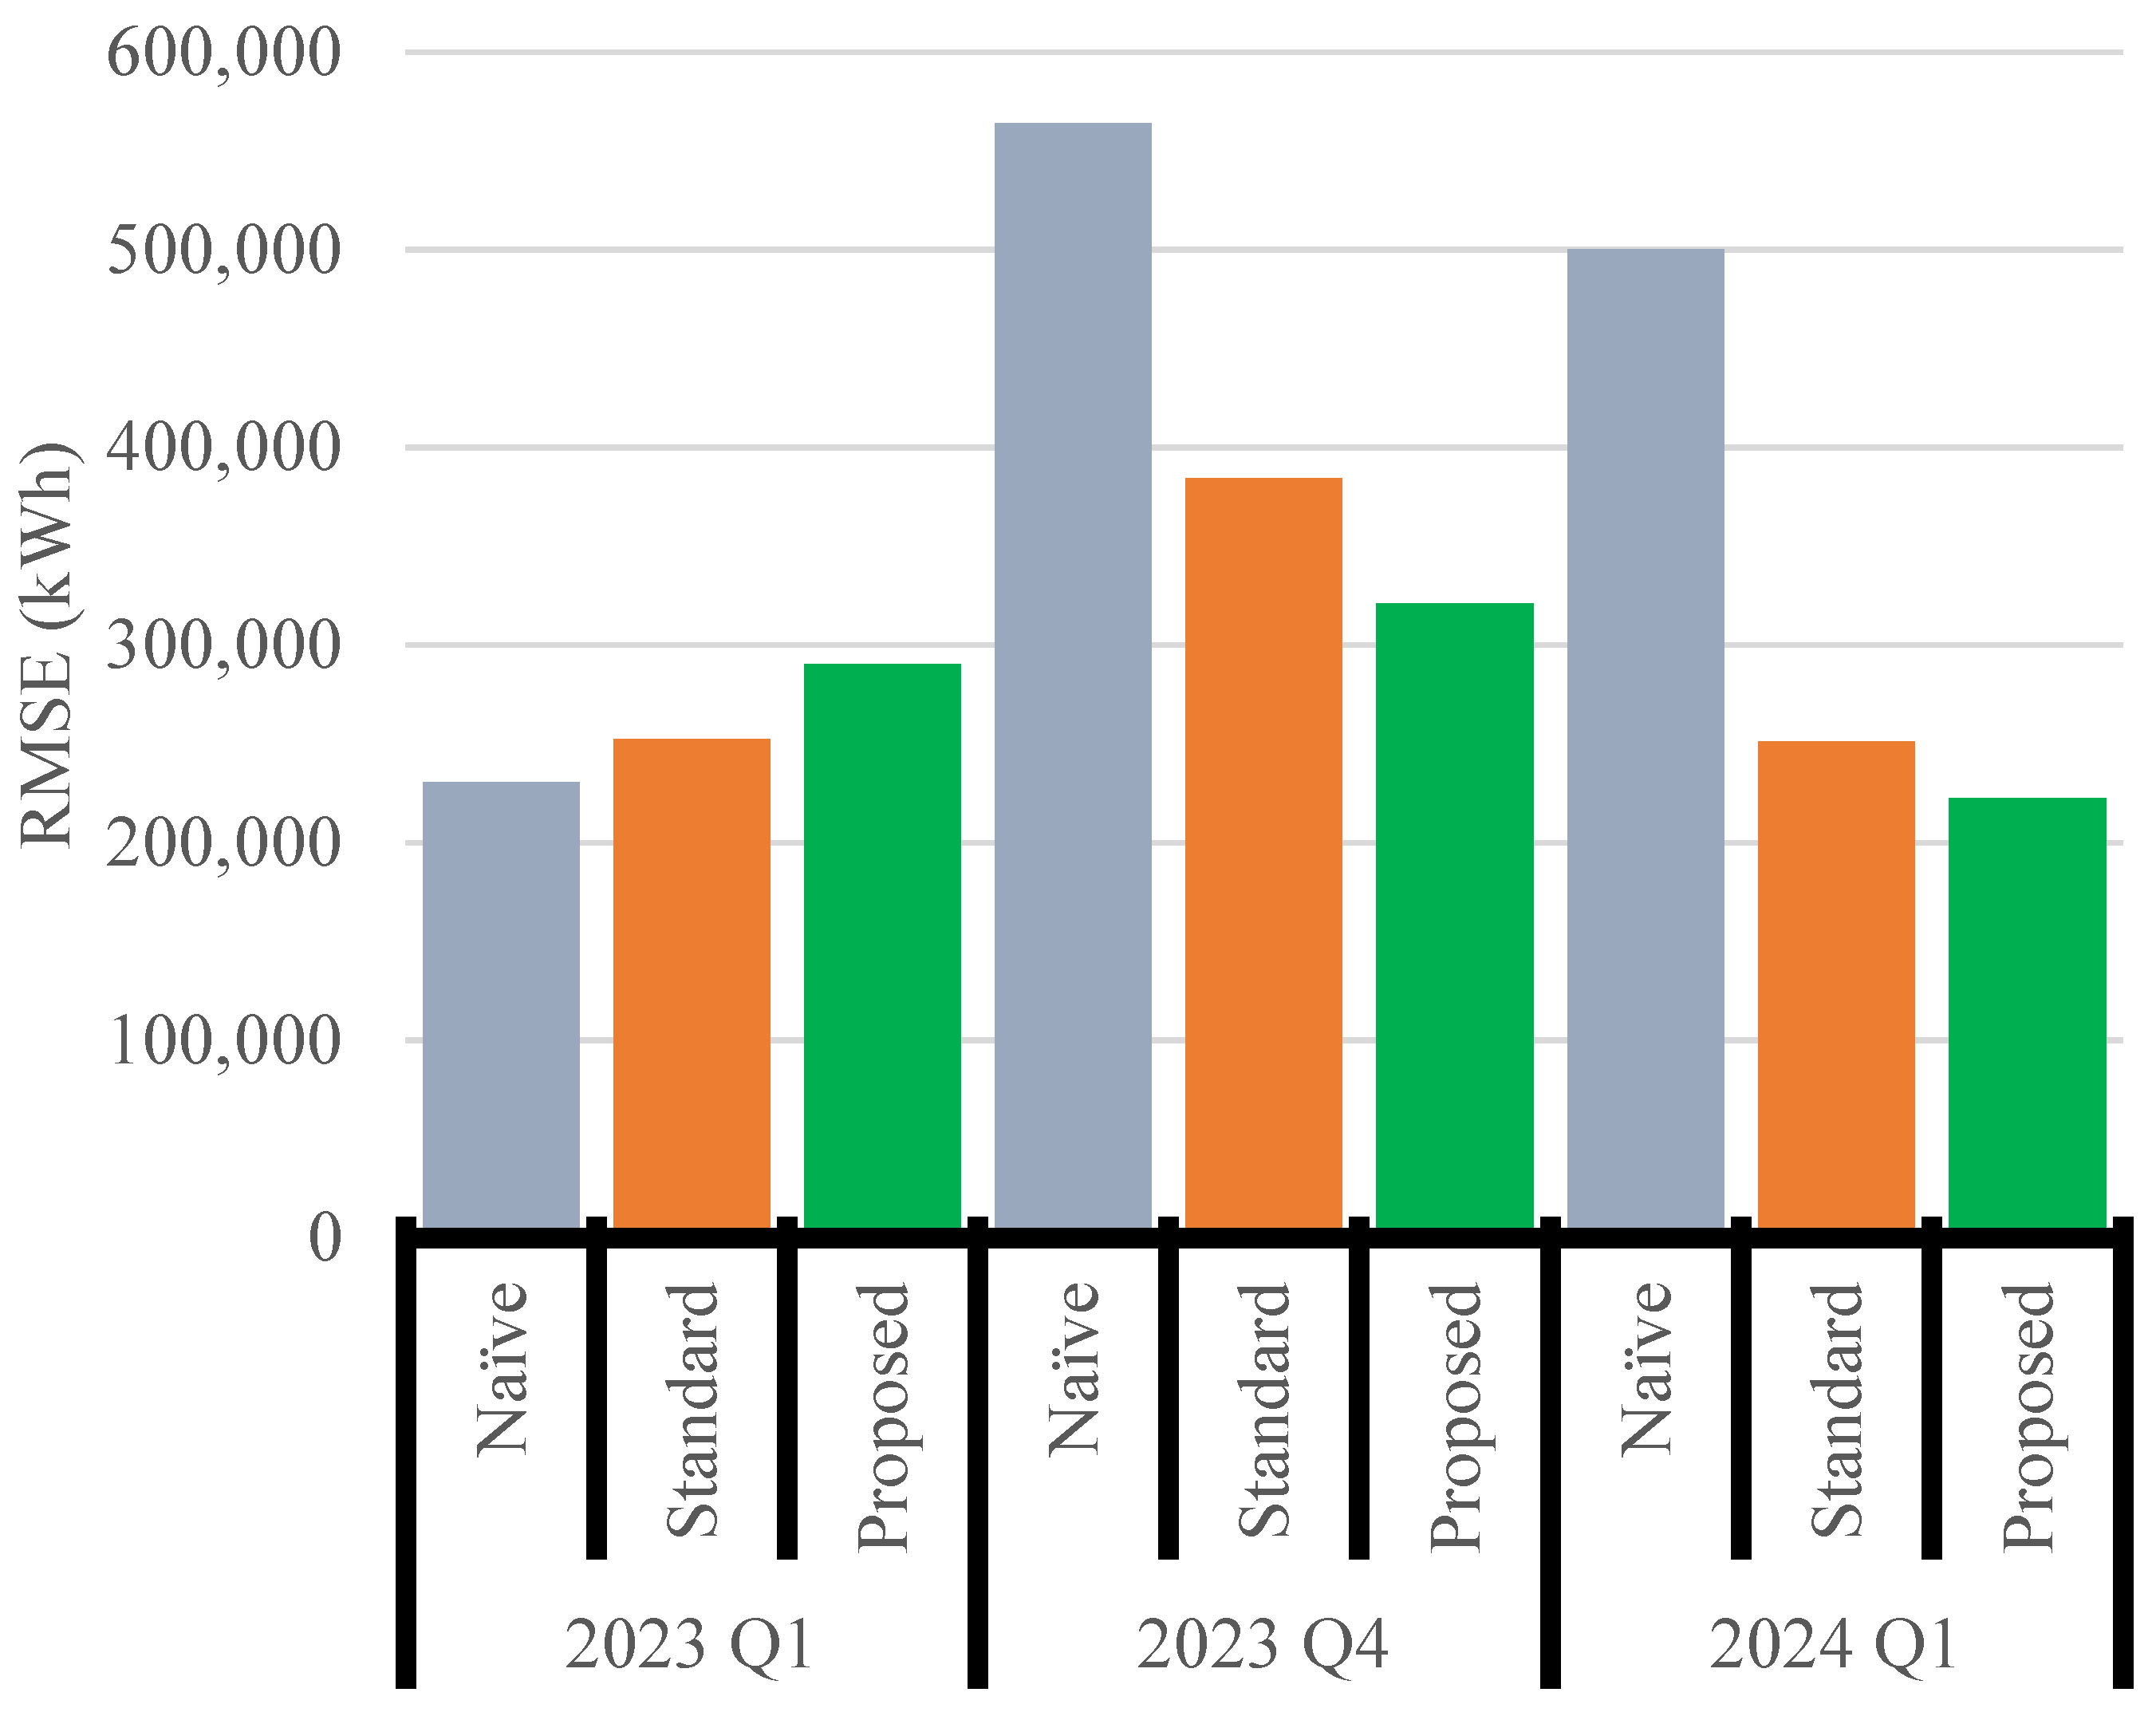
4. Results
4.1. Sitewide Energy Prediction
4.2. Shop-Level Energy Prediction
5. Discussion
5.1. Framework
5.2. Challenges
- Data transmission and retrieval
- Data formatting
- ML model training and retraining
- Energy consumption predictions
5.3. Lessons Learned
6. Conclusions
Author Contributions
Funding
Data Availability Statement
Conflicts of Interest
Appendix A. Production and Temperature Prediction
Appendix A.1. Production Prediction

| Shop | Period | 2023 Q1 | 2023 Q4 | 2024 Q1 |
|---|---|---|---|---|
| Assembly | Daily | 0.92 | 0.03 | 0.91 |
| Weekly | 0.88 | 0.52 | 0.98 | |
| Monthly | 1.00 | 0.04 | 1.00 | |
| Battery | Daily | 0.96 | 0.07 | 0.69 |
| Weekly | 0.88 | 0.08 | 0.88 | |
| Monthly | 1.00 | 0.00 | 0.94 | |
| Body (Electric) | Daily | 0.80 | 0.06 | 0.60 |
| Weekly | 0.76 | 0.28 | 0.52 | |
| Monthly | 1.00 | 0.02 | 0.74 | |
| Body (Gas) | Daily | 0.88 | 0.03 | 0.85 |
| Weekly | 0.74 | 0.32 | 0.97 | |
| Monthly | 1.00 | 0.00 | 1.00 | |
| Paint | Daily | 0.91 | 0.02 | 0.90 |
| Weekly | 0.88 | 0.52 | 0.97 | |
| Monthly | 1.00 | 0.05 | 1.00 | |
| Sitewide | Daily | 0.92 | 0.03 | 0.91 |
| Weekly | 0.86 | 0.53 | 0.96 | |
| Monthly | 1.00 | 0.06 | 0.99 |
Appendix A.2. Temperature Prediction
| Period | 2023 Q1 | 2023 Q4 | 2024 Q1 |
|---|---|---|---|
| Daily | 0.26 | 0.83 | 0.42 |
| Weekly | 0.50 | 0.92 | 0.62 |
| Monthly | 0.92 | 0.99 | 0.86 |
Appendix B. Assembly and Painting Shop Energy Prediction
| Time Period | Parameter | Model Type | |||||||
|---|---|---|---|---|---|---|---|---|---|
| Historic | Average | Linear | GLMNET | PCR | KNN | RF | BRNN | ||
| 2023 Q1 | RMSE (Training) | 15,312 | 7657 | 4733 | 4775 | 9920 | 11,266 | 4534 | |
| (Training) | 0.00 | 0.76 | 0.91 | 0.91 | 0.73 | 0.89 | 0.91 | ||
| RMSE (Actual) | 16,080 | 13,191 | 7300 | 7627 | 7679 | 10,659 | 9617 | 7834 | |
| (Actual) | 0.73 | 0.00 | 0.83 | 0.85 | 0.85 | 0.79 | 0.86 | 0.83 | |
| 2023 Q4 A | RMSE (Training) | 17,409 | 15,396 | 7965 | 5783 | 5756 | 7260 | 5734 | 6220 |
| (Training) | 0.24 | 0.00 | 0.73 | 0.86 | 0.86 | 0.78 | 0.87 | 0.83 | |
| RMSE (Actual) | 16,436 | 19,472 | 24,411 | 18,633 | 18,608 | 14,538 | 18,757 | 23,882 | |
| (Actual) | 0.39 | 0.00 | 0.00 | 0.09 | 0.09 | 0.36 | 0.08 | 0.00 | |
| 2023 Q4 B | RMSE (Training) | 17,409 | 15,396 | 7965 | 6001 | 4780 | 6298 | 4267 | 3897 |
| (Training) | 0.24 | 0.00 | 0.73 | 0.84 | 0.90 | 0.80 | 0.93 | 0.93 | |
| RMSE (Actual) | 16,436 | 19,472 | 24,411 | 21,822 | 21,271 | 13,972 | 18,950 | 23,251 | |
| (Actual) | 0.39 | 0.00 | 0.00 | 0.02 | 0.01 | 0.40 | 0.08 | 0.01 | |
| 2024 Q1 A | RMSE (Training) | 16,988 | 15,908 | 9575 | 6740 | 10,356 | 13,893 | 8471 | 6568 |
| (Training) | 0.32 | 0.00 | 0.63 | 0.83 | 0.61 | 0.40 | 0.84 | 0.84 | |
| RMSE (Actual) | 20,120 | 16,804 | 8321 | 10,044 | 13,692 | 19,672 | 14,192 | 9985 | |
| (Actual) | 0.03 | 0.00 | 0.77 | 0.81 | 0.64 | 0.61 | 0.78 | 0.81 | |
| 2024 Q1 B | RMSE (Training) | 16,988 | 15,908 | 9575 | 5302 | 5263 | 7573 | 4659 | 4923 |
| (Training) | 0.32 | 0.00 | 0.63 | 0.89 | 0.89 | 0.80 | 0.92 | 0.91 | |
| RMSE (Actual) | 20,120 | 16,804 | 8321 | 8441 | 8341 | 12,438 | 9249 | 9355 | |
| (Actual) | 0.03 | 0.00 | 0.77 | 0.81 | 0.81 | 0.70 | 0.85 | 0.84 | |
| Time Period | Parameter | Model Type | |||||||
|---|---|---|---|---|---|---|---|---|---|
| Historic | Average | Linear | GLMNET | PCR | KNN | RF | BRNN | ||
| 2023 Q1 | RMSE (Training) | 52,182 | 35,366 | 33,472 | 30,211 | 26,820 | 32,923 | 24,567 | |
| (Training) | 0.00 | 0.66 | 0.70 | 0.66 | 0.74 | 0.75 | 0.67 | ||
| RMSE (Actual) | 75,220 | 34,297 | 31,968 | 21,609 | 27,232 | 34,451 | 31,692 | 36,957 | |
| (Actual) | 0.18 | 0.00 | 0.35 | 0.42 | 0.45 | 0.12 | 0.28 | 0.09 | |
| 2023 Q4 A | RMSE (Training) | 78,096 | 56,150 | 38,932 | 32,244 | 33,718 | 29,433 | 31,986 | 31,164 |
| (Training) | 0.21 | 0.00 | 0.45 | 0.69 | 0.64 | 0.73 | 0.73 | 0.71 | |
| RMSE (Actual) | 75,803 | 103,924 | 83,733 | 70,474 | 68,693 | 73,895 | 70,567 | 67,713 | |
| (Actual) | 0.67 | 0.00 | 0.23 | 0.70 | 0.72 | 0.63 | 0.78 | 0.79 | |
| 2023 Q4 B | RMSE (Training) | 78,096 | 56,150 | 38,932 | 29,435 | 29,515 | 28,280 | 36,526 | 24,926 |
| (Training) | 0.21 | 0.00 | 0.45 | 0.93 | 0.93 | 0.89 | 0.42 | 0.72 | |
| RMSE (Actual) | 75,803 | 103,924 | 83,733 | 61,223 | 57,416 | 74,220 | 83,150 | 49,462 | |
| (Actual) | 0.67 | 0.00 | 0.23 | 0.72 | 0.73 | 0.66 | 0.61 | 0.78 | |
| 2024 Q1 A | RMSE (Training) | 77,134 | 66,623 | 57,635 | 33,170 | 32,774 | 30,512 | 34,024 | 32,100 |
| (Training) | 0.42 | 0.00 | 0.42 | 0.71 | 0.71 | 0.80 | 0.75 | 0.76 | |
| RMSE (Actual) | 86,288 | 88,004 | 36,587 | 68,900 | 70,096 | 61,070 | 65,864 | 50,578 | |
| (Actual) | 0.38 | 0.00 | 0.83 | 0.75 | 0.75 | 0.79 | 0.74 | 0.84 | |
| 2024 Q1 B | RMSE (Training) | 77,134 | 66,623 | 57,635 | 30,910 | 30,910 | 32,955 | 37,381 | 25,074 |
| (Training) | 0.42 | 0.00 | 0.42 | 0.79 | 0.79 | 0.79 | 0.75 | 0.85 | |
| RMSE (Actual) | 86,288 | 88,004 | 36,587 | 67,905 | 74,861 | 61,521 | 73,195 | 81,244 | |
| (Actual) | 0.38 | 0.00 | 0.83 | 0.74 | 0.74 | 0.80 | 0.59 | 0.84 | |
| Time Period | Parameter | Model Type | ||||||
|---|---|---|---|---|---|---|---|---|
| Historic | Average | Linear | GLMNET | PCR | KNN | BRNN | ||
| 2023 Q1 | RMSE (Training) | 197,900 | 240,919 | 227,904 | 199,246 | |||
| (Training) | 0.00 | 0.65 | 0.78 | 0.71 | ||||
| RMSE (Actual) | 309,741 | 326,770 | 141,556 | 56,614 | 55,116 | |||
| (Actual) | 0.18 | 0.00 | 0.80 | 0.75 | 0.76 | |||
| 2023 Q4 | RMSE (Training) | 245,553 | 113,581 | 160,298 | 118,651 | 113,108 | 95,892 | 112,953 |
| (Training) | 0.85 | 0.00 | 0.77 | 0.71 | 0.73 | 0.81 | 0.49 | |
| RMSE (Actual) | 342,804 | 398,250 | 374,923 | 338,428 | 333,659 | 313,087 | 347,613 | |
| (Actual) | 1.00 | 0.00 | 0.15 | 0.67 | 0.61 | 0.65 | 0.71 | |
| 2024 Q1 A | RMSE (Training) | 263,020 | 205,093 | 237,222 | 121,327 | 118,610 | 141,539 | 149,992 |
| (Training) | 0.60 | 0.00 | 0.99 | 0.76 | 0.81 | 0.63 | 0.64 | |
| RMSE (Actual) | 217,806 | 151,258 | 59,200 | 198,204 | 210,728 | 249,189 | 206,641 | |
| (Actual) | 0.25 | 0.00 | 0.95 | 0.93 | 0.91 | 0.88 | 0.93 | |
| 2024 Q1 B | RMSE (Training) | 263,020 | 205,093 | 237,222 | 204,262 | 198,608 | ||
| (Training) | 0.60 | 0.00 | 0.99 | 1.00 | 0.99 | |||
| RMSE (Actual) | 217,806 | 151,258 | 59,200 | 108,648 | 100,846 | |||
| (Actual) | 0.25 | 0.00 | 0.95 | 0.94 | 0.94 | |||
| Time Period | Parameter | Model Type | |||||||
|---|---|---|---|---|---|---|---|---|---|
| Historic | Average | Linear | GLMNET | PCR | KNN | RF | BRNN | ||
| 2023 Q1 | RMSE (Training) | 44,368 | 19,378 | 20,837 | 20,384 | 30,314 | 16,229 | 17,829 | |
| (Training) | 0.00 | 0.80 | 0.77 | 0.78 | 0.71 | 0.87 | 0.82 | ||
| RMSE (Actual) | 48,017 | 38,083 | 18,475 | 17,080 | 17,804 | 23,335 | 15,754 | 17,468 | |
| (Actual) | 0.63 | 0.00 | 0.86 | 0.86 | 0.86 | 0.86 | 0.90 | 0.89 | |
| 2023 Q4 A | RMSE (Training) | 48,959 | 42,474 | 19,001 | 18,980 | 18,812 | 15,731 | 22,087 | 15,588 |
| (Training) | 0.10 | 0.00 | 0.81 | 0.80 | 0.80 | 0.86 | 0.83 | 0.87 | |
| RMSE (Actual) | 44,075 | 42,849 | 60,281 | 54,436 | 54,818 | 59,459 | 41,851 | 58,686 | |
| (Actual) | 0.37 | 0.00 | 0.00 | 0.01 | 0.01 | 0.02 | 0.11 | 0.00 | |
| 2023 Q4 B | RMSE (Training) | 48,959 | 42,474 | 19,001 | 16,465 | 16,398 | 21,848 | 13,160 | 15,536 |
| (Training) | 0.10 | 0.00 | 0.81 | 0.82 | 0.82 | 0.65 | 0.88 | 0.83 | |
| RMSE (Actual) | 44,075 | 42,849 | 60,281 | 58,745 | 59,753 | 33,828 | 49,966 | 55,902 | |
| (Actual) | 0.37 | 0.00 | 0.00 | 0.00 | 0.00 | 0.34 | 0.03 | 0.00 | |
| 2024 Q1 A | RMSE (Training) | 46,950 | 38,894 | 20,466 | 21,258 | 21,216 | 28,645 | 17,084 | 17,585 |
| (Training) | 0.20 | 0.00 | 0.71 | 0.77 | 0.77 | 0.59 | 0.85 | 0.84 | |
| RMSE (Actual) | 51,195 | 45,512 | 34,246 | 52,924 | 52,962 | 42,894 | 41,670 | 40,496 | |
| (Actual) | 0.04 | 0.00 | 0.50 | 0.26 | 0.26 | 0.24 | 0.30 | 0.32 | |
| 2024 Q1 B | RMSE (Training) | 46,950 | 38,894 | 20,466 | 18,438 | 18,247 | 20,213 | 14,835 | 14,810 |
| (Training) | 0.20 | 0.00 | 0.71 | 0.76 | 0.76 | 0.77 | 0.84 | 0.84 | |
| RMSE (Actual) | 51,195 | 45,512 | 34,246 | 35,670 | 35,744 | 38,636 | 30,729 | 33,414 | |
| (Actual) | 0.04 | 0.00 | 0.50 | 0.50 | 0.54 | 0.39 | 0.54 | 0.49 | |
| Time Period | Parameter | Model Type | |||||||
|---|---|---|---|---|---|---|---|---|---|
| Historic | Average | Linear | GLMNET | PCR | KNN | RF | BRNN | ||
| 2023 Q1 | RMSE (Training) | 146,524 | 62,475 | 61,884 | 63,412 | 82,614 | 82,291 | 64,279 | |
| (Training) | 0.00 | 0.85 | 0.84 | 0.84 | 0.75 | 0.80 | 0.84 | ||
| RMSE (Actual) | 180,142 | 343,888 | 79,420 | 70,357 | 78,674 | 66,431 | 66,089 | 63,193 | |
| (Actual) | 0.12 | 0.00 | 0.23 | 0.24 | 0.23 | 0.25 | 0.07 | 0.14 | |
| 2023 Q4 A | RMSE (Training) | 209,886 | 154,557 | 61,519 | 62,394 | 70,766 | 73,959 | 81,432 | 58,131 |
| (Training) | 0.01 | 0.00 | 0.81 | 0.81 | 0.78 | 0.75 | 0.73 | 0.82 | |
| RMSE (Actual) | 189,218 | 228,054 | 153,305 | 151,124 | 151,124 | 146,692 | 159,584 | 138,733 | |
| (Actual) | 0.63 | 0.00 | 0.50 | 0.51 | 0.51 | 0.64 | 0.52 | 0.62 | |
| 2023 Q4 B | RMSE (Training) | 209,886 | 154,557 | 61,519 | 61,665 | 61,694 | 71,290 | 91,609 | 68,477 |
| (Training) | 0.01 | 0.00 | 0.81 | 0.89 | 0.89 | 0.73 | 0.44 | 0.74 | |
| RMSE (Actual) | 189,218 | 228,054 | 153,305 | 176,921 | 176,916 | 211,926 | 181,527 | 152,407 | |
| (Actual) | 0.63 | 0.00 | 0.50 | 0.32 | 0.32 | 0.02 | 0.41 | 0.51 | |
| 2024 Q1 A | RMSE (Training) | 201,401 | 169,952 | 93,298 | 51,997 | 52,582 | 62,606 | 62,235 | 52,162 |
| (Training) | 0.17 | 0.00 | 0.88 | 0.82 | 0.82 | 0.78 | 0.80 | 0.83 | |
| RMSE (Actual) | 242,688 | 261,967 | 137,637 | 156,351 | 165,697 | 125,986 | 139,460 | 111,233 | |
| (Actual) | 0.41 | 0.00 | 0.81 | 0.66 | 0.67 | 0.76 | 0.69 | 0.82 | |
| 2024 Q1 B | RMSE (Training) | 201,401 | 169,952 | 93,298 | 85,256 | 86,346 | 108,465 | 95,284 | 87,986 |
| (Training) | 0.17 | 0.00 | 0.88 | 0.82 | 0.85 | 0.72 | 0.78 | 0.86 | |
| RMSE (Actual) | 242,688 | 261,967 | 137,637 | 130,600 | 132,931 | 183,532 | 168,898 | 126,133 | |
| (Actual) | 0.41 | 0.00 | 0.81 | 0.78 | 0.78 | 0.78 | 0.74 | 0.89 | |
| Time Period | Parameter | Model Type | ||||||
|---|---|---|---|---|---|---|---|---|
| Historic | Average | Linear | GLMNET | PCR | KNN | BRNN | ||
| 2023 Q1 | RMSE (Training) | 411,711 | 87,117 | 80,919 | 86,222 | |||
| R2 (Training) | 0.00 | 0.97 | 0.97 | 0.97 | ||||
| RMSE (Actual) | 746,943 | 555,007 | 133,179 | 230,830 | 179,902 | |||
| R2 (Actual) | 0.71 | 0.00 | 0.73 | 0.68 | 0.69 | |||
| 2023 Q4 | RMSE (Training) | 661,834 | 382,636 | 118,913 | 131,181 | 126,773 | 134,763 | 122,933 |
| R2 (Training) | 0.00 | 0.00 | 0.93 | 0.95 | 0.95 | 0.79 | 0.94 | |
| RMSE (Actual) | 760,446 | 607,307 | 505,900 | 453,618 | 454,308 | 402,379 | 436,012 | |
| R2 (Actual) | 0.15 | 0.00 | 0.03 | 0.01 | 0.01 | 0.34 | 0.03 | |
| 2024 Q1 A | RMSE (Training) | 704,602 | 368,219 | 222,891 | 90,046 | 90,729 | 218,414 | 134,467 |
| R2 (Training) | 0.01 | 0.00 | 0.97 | 0.98 | 0.98 | 0.65 | 0.93 | |
| RMSE (Actual) | 543,199 | 608,067 | 311,394 | 571,267 | 576,672 | 251,302 | 500,319 | |
| R2 (Actual) | 0.29 | 0.00 | 1.00 | 0.65 | 0.65 | 0.80 | 0.71 | |
| 2024 Q1 B | RMSE (Training) | 704,602 | 368,219 | 222,891 | 328,567 | 342,848 | ||
| R2 (Training) | 0.01 | 0.00 | 0.97 | 0.97 | 0.97 | |||
| RMSE (Actual) | 543,199 | 608,067 | 311,394 | 152,201 | 132,343 | |||
| R2 (Actual) | 0.29 | 0.00 | 1.00 | 1.00 | 1.00 | |||
References
- Weinert, N.; Chiotellis, S.; Seliger, G. Methodology for Planning and Operating Energy-Efficient Production Systems. CIRP Ann. 2011, 60, 41–44. [Google Scholar] [CrossRef]
- Lee, D.; Cheng, C.-C. Energy Savings by Energy Management Systems: A Review. Renew. Sustain. Energy Rev. 2016, 56, 760–777. [Google Scholar] [CrossRef]
- Duflou, J.R.; Sutherland, J.W.; Dornfeld, D.; Herrmann, C.; Jeswiet, J.; Kara, S.; Hauschild, M.; Kellens, K. Towards Energy and Resource Efficient Manufacturing: A Processes and Systems Approach. CIRP Ann. 2012, 61, 587–609. [Google Scholar] [CrossRef]
- ISO 50001:2018; Energy Management Systems—Requirements with Guidance for Use. International Organization of Standardization: Geneva, Switzerland, 2018. Available online: https://web.archive.org/web/20250429212254/https://www.iso.org/standard/69426.html (accessed on 28 April 2025).
- DOE AMO. Energy Performance Indicator Tool. Available online: https://web.archive.org/web/20250406045512/https://www.energy.gov/eere/iedo/articles/energy-performance-indicator-tool?nrg_redirect=465586 (accessed on 28 April 2025).
- DOE AMO. Better Plants Software Tools. Available online: https://web.archive.org/web/20250416042229/https://betterbuildingssolutioncenter.energy.gov/better-plants/software-tools (accessed on 28 April 2025).
- Vance, D.; Jin, M.; Price, C.; Nimbalkar, S.U.; Wenning, T. Smart Manufacturing Maturity Models and Their Applicability: A Review. J. Manuf. Technol. Manag. 2023, 34, 735–770. [Google Scholar] [CrossRef]
- Narciso, D.A.C.; Martins, F.G. Application of Machine Learning Tools for Energy Efficiency in Industry: A Review. Energy Rep. 2020, 6, 1181–1199. [Google Scholar] [CrossRef]
- Liu, Z.; Wang, X.; Zhang, Q.; Huang, C. Empirical Mode Decomposition Based Hybrid Ensemble Model for Electrical Energy Consumption Forecasting of the Cement Grinding Process. Measurement 2019, 138, 314–324. [Google Scholar] [CrossRef]
- Moghadasi, M.; Izadyar, N.; Moghadasi, A.; Ghadamian, H. Applying Machine Learning Techniques to Implement the Technical Requirements of Energy Management Systems in Accordance with ISO50001:2018, An Industrial Case Study. Energy Sources Part A Recovery Util. Environ. Eff. 2021, 1–18. [Google Scholar] [CrossRef]
- Shrouf, F.; Ordieres, J.; Miragliotta, G. Smart Factories in Industry 4.0: A Review of the Concept and of Energy Management Approached in Production Based on the Internet of Things Paradigm. In Proceedings of the 2014 IEEE International Conference on Industrial Engineering and Engineering Management, Selangor, Malaysia, 9–12 December 2014; IEEE: Piscataway, NJ, USA, 2014; pp. 697–701. [Google Scholar] [CrossRef]
- Medojevic, M.; Villar, P.D.; Cosic, I.; Rikalovic, A.; Sremcev, N.; Lazarevic, M. Energy Management in Industry 4.0 Ecosystem: A Review on Possibilities and Concerns. Ann. DAAAM Proc. 2018, 29, 674–680. [Google Scholar] [CrossRef]
- Shrouf, F.; Miragliotta, G. Energy Management Based on Internet of Things: Practices and Framework for Adoption in Production Management. J. Clean. Prod. 2015, 100, 235–246. [Google Scholar] [CrossRef]
- Khan, M.; Wu, X.; Xu, X.; Dou, W. Big Data Challenges and Opportunities in the Hype of Industry 4.0. In Proceedings of the 2017 IEEE International Conference on Communications (ICC), Paris, France, 21–25 May 2017; IEEE: Piscataway, NJ, USA, 2017; pp. 1–6. [Google Scholar] [CrossRef]
- Sievers, J.; Blank, T. A Systematic Literature Review on Data-Driven Residential and Industrial Energy Management Systems. Energies 2023, 16, 1688. [Google Scholar] [CrossRef]
- May, G.; Stahl, B.; Taisch, M.; Kiritsis, D. Energy Management in Manufacturing: From Literature Review to a Conceptual Framework. J. Clean. Prod. 2017, 167, 1464–1489. [Google Scholar] [CrossRef]
- Pater, J.; Stadnicka, D. Towards Digital Twins Development and Implementation to Support Sustainability—Systematic Literature Review. Manag. Prod. Eng. Rev. 2021, 13, 63–73. [Google Scholar] [CrossRef]
- Walther, J.; Weigold, M. A Systematic Review on Predicting and Forecasting the Electrical Energy Consumption in the Manufacturing Industry. Energies 2021, 14, 968. [Google Scholar] [CrossRef]
- Dietmair, A.; Verl, A. A Generic Energy Consumption Model for Decision Making and Energy Efficiency Optimisation in Manufacturing. Int. J. Sustain. Eng. 2009, 2, 123–133. [Google Scholar] [CrossRef]
- Su, C.-L. Load Estimation in Industrial Power Systems for Expansion Planning. IEEE Trans. Ind. Appl. 2011, 47, 2311–2323. [Google Scholar] [CrossRef]
- Walther, J.; Spanier, D.; Panten, N.; Abele, E. Very Short-Term Load Forecasting on Factory Level–A Machine Learning Approach. Procedia CIRP 2019, 80, 705–710. [Google Scholar] [CrossRef]
- Mawson, V.J.; Hughes, B.R. Deep Learning Techniques for Energy Forecasting and Condition Monitoring in the Manufacturing Sector. Energy Build. 2020, 217, 109966. [Google Scholar] [CrossRef]
- Chen, Z.; Xiao, F.; Guo, F.; Yan, J. Interpretable Machine Learning for Building Energy Management: A State-of-the-Art Review. Adv. Appl. Energy 2023, 9, 100123. [Google Scholar] [CrossRef]
- Mahir, S.M.; Koch, G.; Herne, J.; Lee, J.J. Data Acquisition Platform for The Energy Management of Smart Factories and Buildings. In Proceedings of the 2023 17th International Conference on Ubiquitous Information Management and Communication (IMCOM), Seoul, Republic of Korea, 3–5 January 2023; IEEE: Piscataway, NJ, USA, 2023; pp. 1–7. [Google Scholar] [CrossRef]
- Weber, C.; Königsberger, J.; Kassner, L.; Mitschang, B. M2DDM—A Maturity Model for Data-Driven Manufacturing. Procedia CIRP 2017, 63, 173–178. [Google Scholar] [CrossRef]
- Grieves, M. Digital Twin: Manufacturing Excellence Through Virtual Factory Replication. White Pap. 2014, 1, 1–7. [Google Scholar]
- Glaessgen, E.; Stargel, D. The Digital Twin Paradigm for Future NASA and US Air Force vehicles. In Proceedings of the 53rd AIAA/ASME/ASCE/AHS/ASC Structures, Structural Dynamics and Materials Conference, Honolulu, HI, USA, 23–26 April 2012; p. 1818. [Google Scholar] [CrossRef]
- Garetti, M.; Rosa, P.; Terzi, S. Life Cycle Simulation for the Design of Product-Service Systems. Comput. Ind. 2012, 63, 361–369. [Google Scholar] [CrossRef]
- Kritzinger, W.; Karner, M.; Traar, G.; Jan, H.; Wilfried, S. Digital Twin in Manufacturing: A Categorical Literature Review and Classification. IFAC-Pap. 2018, 51, 1016–1022. [Google Scholar] [CrossRef]
- Shao, G.; Helu, M. Framework for a Digital Twin in Manufacturing: Scope and Requirements. Manuf. Lett. 2020, 24, 105–107. [Google Scholar] [CrossRef] [PubMed]
- Yu, W.; Patros, P.; Young, B.; Klinac, E.; Walmsley, T.G. Energy Digital Twin Technology for Industrial Energy Management: Classification, Challenges and Future. Renew. Sustain. Energy Rev. 2022, 161, 112407. [Google Scholar] [CrossRef]
- Haag, S.; Anderl, R. Digital twin—Proof of Concept. Manuf. Lett. 2018, 15, 64–66. [Google Scholar] [CrossRef]
- Tao, F.; Zhang, H.; Liu, A.; Nee, A.Y.C. Digital Twin in Industry: State-of-the-Art. IEEE Trans. Ind. Inf. 2018, 15, 2405–2415. [Google Scholar] [CrossRef]
- Assad, F.; Konstantinov, S.; Ahmad, M.H.; Rushforth, E.J.; Harrison, R. Utilising Web-based Digital Twin to Promote Assembly Line Sustainability. In Proceedings of the 2021 4th IEEE International Conference on Industrial Cyber-Physical Systems (ICPS), Victoria, BC, Canada, 10–12 May 2021; pp. 381–386. [Google Scholar] [CrossRef]
- Schulze, M.; Nehler, H.; Ottosson, M.; Thollander, P. Energy Management in Industry—A Systematic Review of Previous Findings and an Integrative Conceptual Framework. J. Clean. Prod. 2016, 112, 3692–3708. [Google Scholar] [CrossRef]
- Vikhorev, K.; Greenough, R.; Brown, N. An Advanced Energy Management Framework to Promote Energy Awareness. J. Clean. Prod. 2013, 43, 103–112. [Google Scholar] [CrossRef]
- Zhang, M.; Zuo, Y.; Tao, F. Equipment Energy Consumption Management in Digital Twin Shop-Floor: A Framework and Potential Applications. In Proceedings of the 2018 IEEE 15th International Conference on Networking, Sensing and Control (ICNSC), Zhuhai, China, 27–29 March 2018; IEEE: Piscataway, NJ, USA, 2018; pp. 1–5. [Google Scholar] [CrossRef]
- Wei, M.; Hong, S.H.; Alam, M. An IoT-Based Energy-Management Platform for Industrial Facilities. Appl. Energy 2016, 164, 607–619. [Google Scholar] [CrossRef]
- Sitterson, J.; Sinnathamby, S.; Parmar, R.; Koblich, J.; Wolfe, K.; Knightes, C.D. Demonstration of an Online Web Services Tool Incorporating Automatic Retrieval and Comparison of Precipitation Data. Environ. Model. Softw. 2020, 123, 104570. [Google Scholar] [CrossRef]
- BizEE Software. Degree Days Calculated Accurately for Locations Worldwide. Available online: https://web.archive.org/web/20250402181725/https://www.degreedays.net/ (accessed on 28 April 2025).
- R. What is R? Available online: https://web.archive.org/web/20250424231453/https://www.r-project.org/about.html (accessed on 28 April 2025).
- Prabhakaran, S. Caret Package—A Practical Guide to Machine Learning in R. Available online: https://web.archive.org/web/20250306212733/https://www.machinelearningplus.com/machine-learning/caret-package/ (accessed on 28 April 2025).
- James, G.; Witten, D.; Hastie, T.; Tibshirani, R.; Taylor, J. An Introduction to Statistical Learning; Springer Texts in Statistics; Springer International Publishing: Cham, Switzerland, 2023; Volume 112. [Google Scholar] [CrossRef]
- Mehdiyev, N.; Majlatow, M.; Fettke, P. Interpretable and Explainable Machine Learning Methods for Predictive Process Monitoring: A Systematic Literature Review. arXiv 2023. arXiv:2312.17584. [Google Scholar] [CrossRef]
- Caret Documentation. CARET: A List of Available Models in TRAIN, rdrr.io. Available online: https://web.archive.org/web/20250429202653/https://rdrr.io/cran/caret/man/models.html (accessed on 28 April 2024).
- Falk, C.F.; Muthukrishna, M. Parsimony in Model Selection: Tools for Assessing Fit Propensity. Psychol. Methods 2023, 28, 123–136. [Google Scholar] [CrossRef] [PubMed]
- David, J.; Martikkala, A.; Lobov, A.; Lanz, M. A Unified Ontology Namespace for Enterprise Integration—A Digital Twin Case Study. In Proceedings of the Instrumentation Engineering, Electronics and Telecommunications—2019, Izhevsk, Russia, 20–22 November 2019. [Google Scholar] [CrossRef]
- National Centers for Environmental Information. U.S. Climate Normals. Available online: https://web.archive.org/web/20250426104931/https://www.ncei.noaa.gov/products/land-based-station/us-climate-normals (accessed on 28 April 2025).


| Model | Predictors |
|---|---|
| Historic | A naïve model, meaning no predictors are used. The output is historical energy consumption. |
| Average | Another naïve model. The output is the average of historical energy consumption. |
| Linear | Production |
| GLMNET | Production, Temperature |
| PCR | Production, Temperature, Day of the Week, Week of the Year, Month |
| KNN | Production, Temperature, Day of the Week, Week of the Year, Month |
| RF | Production, Temperature, Day of the Week, Week of the Year, Month |
| BRNN | Production, Temperature, Day of the Week, Week of the Year, Month |
| B | An additional predictor, “Energy Data from Last Year”, is included. |
| Plant Area | Time Period | Predictors |
|---|---|---|
| Assembly | Daily | Assembly Production, Temperature, Day of the Week, Week of the Year, Month |
| Weekly | Assembly Production, Temperature, Week of the Year | |
| Monthly | Assembly Production, Temperature, Month | |
| Battery | Daily | Battery Production, Temperature, Day of the Week, Week of the Year, Month |
| Weekly | Battery Production, Temperature, Week of the Year | |
| Monthly | Battery Production, Temperature, Month | |
| Body (Electric) | Daily | Body (Electric) Production, Temperature, Day of the Week, Week of the Year, Month |
| Weekly | Body (Electric) Production, Temperature, Week of the Year | |
| Monthly | Body (Electric) Production, Temperature, Month | |
| Body (Gas) | Daily | Body (Gas) Production, Temperature, Day of the Week, Week of the Year, Month |
| Weekly | Body (Gas) Production, Temperature, Week of the Year | |
| Monthly | Body (Gas) Production, Temperature, Week of the Year | |
| Paint | Daily | Paint Production, Temperature, Day of the Week, Week of the Year, Month |
| Weekly | Paint Production, Temperature, Week of the Year | |
| Monthly | Paint Production, Temperature, Week of the Year | |
| Sitewide | Daily | Assembly Production, Battery Production, Body (Electric) Production, Body (Gas) Production, Paint Production, Temperature, Day of the Week, Week of the Year, Month |
| Weekly | Assembly Production, Battery Production, Body (Electric) Production, Body (Gas) Production, Paint Production, Temperature, Week of the Year | |
| Monthly | Assembly Production, Battery Production, Body (Electric) Production, Body (Gas) Production, Paint Production, Temperature, Month |
| Period | Parameter | Model Type | |||||||
|---|---|---|---|---|---|---|---|---|---|
| Historic | Average | Linear | GLMNET | PCR | KNN | RF | BRNN | ||
| 2023 Q1 | RMSE (Training) | 105,629 | 54,291 | 34,989 | 33,881 | 45,848 | 58,329 | 33,456 | |
| (Training) | 0.00 | 0.73 | 0.89 | 0.90 | 0.88 | 0.88 | 0.91 | ||
| RMSE (Actual) | 78,852 | 74,088 | 181,577 | 54,026 | 53,378 | 33,078 | 49,524 | 31,823 | |
| (Actual) | 0.70 | 0.00 | 0.87 | 0.92 | 0.92 | 0.89 | 0.92 | 0.87 | |
| 2023 Q4 A | RMSE (Training) | 113,657 | 103,478 | 54,356 | 34,990 | 34,845 | 32,749 | 30,351 | 27,950 |
| (Training) | 0.19 | 0.00 | 0.73 | 0.89 | 0.89 | 0.90 | 0.92 | 0.93 | |
| RMSE (Actual) | 112,459 | 124,464 | 160,524 | 132,719 | 135,631 | 135,333 | 140,233 | 143,182 | |
| (Actual) | 0.44 | 0.00 | 0.00 | 0.03 | 0.02 | 0.01 | 0.01 | 0.00 | |
| 2023 Q4 B | RMSE (Training) | 113,657 | 101,958 | 54,356 | 40,698 | 40,274 | 36,105 | 28,857 | 26,677 |
| (Training) | 0.19 | 0.00 | 0.73 | 0.84 | 0.84 | 0.87 | 0.91 | 0.92 | |
| RMSE (Actual) | 112,459 | 120,878 | 160,524 | 129,048 | 124,096 | 131,786 | 142,825 | 127,605 | |
| (Actual) | 0.44 | 0.00 | 0.00 | 0.03 | 0.04 | 0.03 | 0.00 | 0.02 | |
| 2024 Q1 A | RMSE (Training) | 113,028 | 103,345 | 68,079 | 42,906 | 42,834 | 37,580 | 30,844 | 31,530 |
| (Training) | 0.29 | 0.00 | 0.56 | 0.85 | 0.85 | 0.88 | 0.92 | 0.92 | |
| RMSE (Actual) | 114,349 | 107,524 | 58,084 | 57,842 | 60,113 | 78,928 | 67,846 | 58,269 | |
| (Actual) | 0.05 | 0.00 | 0.74 | 0.78 | 0.76 | 0.65 | 0.79 | 0.79 | |
| 2024 Q1 B | RMSE (Training) | 113,028 | 103,345 | 68,079 | 39,529 | 35,924 | 40,251 | 31,939 | 33,243 |
| (Training) | 0.29 | 0.00 | 0.56 | 0.85 | 0.87 | 0.86 | 0.91 | 0.89 | |
| RMSE (Actual) | 114,349 | 107,524 | 58,084 | 52,544 | 46,197 | 57,928 | 57,711 | 56,881 | |
| (Actual) | 0.05 | 0.00 | 0.74 | 0.78 | 0.81 | 0.78 | 0.79 | 0.81 | |
| Period | Parameter | Model Type | |||||||
|---|---|---|---|---|---|---|---|---|---|
| Historic | Average | Linear | GLMNET | PCR | KNN | RF | BRNN | ||
| 2023 Q1 | RMSE (Training) | 456,963 | 297,607 | 186,355 | 183,373 | 160,581 | 205,657 | 107,720 | |
| (Training) | 0.00 | 0.73 | 0.84 | 0.85 | 0.79 | 0.89 | 0.95 | ||
| RMSE (Actual) | 230,610 | 1,806,313 | 1,321,370 | 252,767 | 534,254 | 391,638 | 290,422 | 350,465 | |
| (Actual) | 0.40 | 0.00 | 0.45 | 0.41 | 0.45 | 0.23 | 0.17 | 0.27 | |
| 2023 Q4 A | RMSE (Training) | 507,147 | 406,336 | 293,128 | 160,703 | 160,628 | 150,152 | 193,717 | 95,710 |
| (Training) | 0.18 | 0.00 | 0.55 | 0.88 | 0.87 | 0.91 | 0.83 | 0.96 | |
| RMSE (Actual) | 564,164 | 697,198 | 553,789 | 384,559 | 384,182 | 403,828 | 461,169 | 333,189 | |
| (Actual) | 0.67 | 0.00 | 0.21 | 0.75 | 0.74 | 0.73 | 0.63 | 0.77 | |
| 2023 Q4 B | RMSE (Training) | 507,147 | 406,336 | 293,128 | 235,608 | 230,918 | 242,368 | 296,876 | 244,444 |
| (Training) | 0.18 | 0.00 | 0.55 | 0.96 | 0.96 | 0.99 | 0.25 | 0.53 | |
| RMSE (Actual) | 564,164 | 697,198 | 553,789 | 385,571 | 367,732 | 540,490 | 578,331 | 321,153 | |
| (Actual) | 0.67 | 0.00 | 0.21 | 0.72 | 0.75 | 0.59 | 0.54 | 0.78 | |
| 2024 Q1 A | RMSE (Training) | 532,016 | 474,094 | 419,285 | 157,103 | 158,933 | 150,871 | 173,645 | 110,520 |
| (Training) | 0.37 | 0.00 | 0.39 | 0.90 | 0.90 | 0.91 | 0.90 | 0.95 | |
| RMSE (Actual) | 500,572 | 609,475 | 251,523 | 280,070 | 279,656 | 222,876 | 273,626 | 262,489 | |
| (Actual) | 0.44 | 0.00 | 0.85 | 0.77 | 0.77 | 0.83 | 0.82 | 0.83 | |
| 2024 Q1 B | RMSE (Training) | 532,016 | 474,094 | 419,285 | 201,078 | 198,221 | 263,295 | 262,053 | 184,889 |
| (Training) | 0.37 | 0.00 | 0.39 | 0.87 | 0.88 | 0.87 | 0.81 | 0.95 | |
| RMSE (Actual) | 500,572 | 609,475 | 251,523 | 322,663 | 363,583 | 304,783 | 464,141 | 424,085 | |
| (Actual) | 0.44 | 0.00 | 0.85 | 0.79 | 0.79 | 0.76 | 0.57 | 0.85 | |
| Period | Parameter | Model Type | ||||||
|---|---|---|---|---|---|---|---|---|
| Historic | Average | Linear | GLMNET | PCR | KNN | BRNN | ||
| 2023 Q1 | RMSE (Training) | 1,747,3113 | 1,227,409 | 682,160 | 737,764 | |||
| (Training) | 0.00 | 0.66 | 0.91 | 0.92 | ||||
| RMSE (Actual) | 748,792 | 1,445,674 | 4,219,015 | 3,263,449 | 1,159,504 | |||
| (Actual) | 0.89 | 0.00 | 0.82 | 0.12 | 0.72 | |||
| 2023 Q4 | RMSE (Training) | 1,706,915 | 1,378,826 | 1,431,324 | 607,102 | 558,804 | 1,026,088 | 1,286,387 |
| (Training) | 0.58 | 0.00 | 0.38 | 0.97 | 0.97 | 0.64 | 0.69 | |
| RMSE (Actual) | 2,288,114 | 2,544,555 | 2,272,790 | 1,388,637 | 1,302,062 | 1,346,754 | 1,212,710 | |
| (Actual) | 0.68 | 0.00 | 0.15 | 0.77 | 0.79 | 0.86 | 0.80 | |
| 2024 Q1 A | RMSE (Training) | 1,970,030 | 1,533,310 | 1,757,608 | 585,057 | 606,529 | 1,021,876 | 567,022 |
| (Training) | 0.51 | 0.00 | 0.98 | 0.96 | 0.94 | 0.74 | 0.95 | |
| RMSE (Actual) | 1,067,821 | 1,625,809 | 630,998 | 680,560 | 966,446 | 1,009,443 | 758,261 | |
| (Actual) | 0.51 | 0.00 | 1.00 | 0.96 | 0.95 | 0.71 | 0.97 | |
| 2024 Q1 B | RMSE (Training) | 1,970,030 | 1,533,310 | 1,757,608 | 1,024,396 | 1,301,112 | 1,339,096 | |
| (Training) | 0.51 | 0.00 | 0.98 | 0.97 | 0.99 | 0.97 | ||
| RMSE (Actual) | 1,067,821 | 1,625,809 | 630,998 | 1,250,344 | 428,949 | 291,403 | ||
| (Actual) | 0.51 | 0.00 | 1.00 | 0.99 | 0.99 | 0.96 | ||
| Plant Area | Period | 2023 Q1 | 2023 Q4 | 2024 Q1 | |||
|---|---|---|---|---|---|---|---|
| Best Model | Best Model | Best Model | |||||
| Assembly | Daily | Linear | 0.83 | KNN (B) | 0.40 | Linear | 0.77 |
| Weekly | GLMNET | 0.42 | BRNN (B) | 0.78 | Linear | 0.83 | |
| Monthly | PCR | 0.76 | Historical | 0.72 | Linear | 0.95 | |
| Battery | Daily | KNN (B) | 0.49 | Linear | 0.42 | ||
| Weekly | GLMNET (B) | 0.72 | RF (B) | 0.58 | |||
| Monthly | BRNN | 0.78 | Average | 0 | |||
| Body (Electric) | Daily | KNN (B) | 0.23 | RF (B) | 0.78 | ||
| Weekly | BRNN (A) | 0.77 | RF (A) | 0.81 | |||
| Monthly | BRNN | 0.85 | GLMNET (B) | 0.86 | |||
| Body (Gas) | Daily | PCR | 0.93 | KNN (B) | 0.46 | GLMNET (A) | 0.79 |
| Weekly | Linear | 0.59 | BRNN (B) | 0.69 | Linear | 0.81 | |
| Monthly | Linear | 0.96 | KNN | 0.66 | PCR (B) | 0.98 | |
| Paint | Daily | RF | 0.90 | KNN (B) | 0.34 | RF (B) | 0.54 |
| Weekly | BRNN | 0.14 | BRNN (A) | 0.62 | BRNN (A) | 0.82 | |
| Monthly | Linear | 0.73 | KNN | 0.34 | PCR (B) | 1.00 | |
| Sitewide | Daily | PCR | 0.92 | Historical | 0.44 | PCR (B) | 0.80 |
| Weekly | Historical | 0.40 | BRNN (B) | 0.78 | Linear | 0.85 | |
| Monthly | Historical | 0.89 | GLMNET | 0.75 | BRNN (B) | 0.96 | |
Disclaimer/Publisher’s Note: The statements, opinions and data contained in all publications are solely those of the individual author(s) and contributor(s) and not of MDPI and/or the editor(s). MDPI and/or the editor(s) disclaim responsibility for any injury to people or property resulting from any ideas, methods, instructions or products referred to in the content. |
© 2025 by the authors. Licensee MDPI, Basel, Switzerland. This article is an open access article distributed under the terms and conditions of the Creative Commons Attribution (CC BY) license (https://creativecommons.org/licenses/by/4.0/).
Share and Cite
Vance, D.; Jin, M.; Wenning, T.; Nimbalkar, S.; Price, C. Next-Level Energy Management in Manufacturing: Facility-Level Energy Digital Twin Framework Based on Machine Learning and Automated Data Collection. Energies 2025, 18, 3242. https://doi.org/10.3390/en18133242
Vance D, Jin M, Wenning T, Nimbalkar S, Price C. Next-Level Energy Management in Manufacturing: Facility-Level Energy Digital Twin Framework Based on Machine Learning and Automated Data Collection. Energies. 2025; 18(13):3242. https://doi.org/10.3390/en18133242
Chicago/Turabian StyleVance, David, Mingzhou Jin, Thomas Wenning, Sachin Nimbalkar, and Christopher Price. 2025. "Next-Level Energy Management in Manufacturing: Facility-Level Energy Digital Twin Framework Based on Machine Learning and Automated Data Collection" Energies 18, no. 13: 3242. https://doi.org/10.3390/en18133242
APA StyleVance, D., Jin, M., Wenning, T., Nimbalkar, S., & Price, C. (2025). Next-Level Energy Management in Manufacturing: Facility-Level Energy Digital Twin Framework Based on Machine Learning and Automated Data Collection. Energies, 18(13), 3242. https://doi.org/10.3390/en18133242