Article

Integrated Analysis of Pore and Fracture Networks in Deep Coal Seams: Implications for Enhanced Reservoir Stimulation

by
Kaiqi Leng
1,2,3,*,
Baoshan Guan
1,2,3,
Chen Jiang
1,2,3 and
Weidong Liu
1,2,3
1
University of Chinese Academy of Sciences, Beijing 100049, China
2
Institute of Porous Flow and Fluid Mechanics, Chinese Academy of Sciences, Langfang 065007, China
3
Research Institute of Petroleum Exploration & Development, PetroChina, Beijing 100083, China
*
Author to whom correspondence should be addressed.
Energies 2025, 18(13), 3235; https://doi.org/10.3390/en18133235
Submission received: 8 May 2025 / Revised: 10 June 2025 / Accepted: 16 June 2025 / Published: 20 June 2025

Abstract

This study systematically investigates the pore–fracture architecture of deep coal seams in the JiaTan (JT) block of the Ordos Basin using an integrated suite of advanced techniques, including nuclear magnetic resonance (NMR), high-pressure mercury intrusion, low-temperature nitrogen adsorption, low-pressure carbon dioxide adsorption, and micro-computed tomography (micro-CT). These complementary methods enable a quantitative assessment of pore structures spanning nano- to microscale dimensions. The results reveal a pore system overwhelmingly dominated by micropores—accounting for more than 98% of the total pore volume—which play a central role in coalbed methane (CBM) storage. Microfractures, although limited in volumetric proportion, markedly enhance permeability by forming critical flow pathways. Together, these features establish a dual-porosity system that governs methane transport and recovery in deep coal reservoirs. The multiscale characterization employed here proves essential for resolving reservoir heterogeneity and designing effective stimulation strategies. Notably, enhancing methane desorption in micropore-rich matrices and improving fracture connectivity are identified as key levers for optimizing deep CBM extraction. These insights offer a valuable foundation for the development of deep coalbed methane (DCBM) resources in the Ordos Basin and similar geological settings.

1. Introduction

In recent years, with the increasing development of SCBM resources and their gradual depletion, DCBM reservoirs, buried at depths greater than 2000 m, are poised to become a critical focus for future CBM exploration and development [1]. China has abundant DCBM resources, with geological reserves of CBM in coal seams deeper than 2000 m estimated at approximately 20 trillion cubic meters, ranking among the highest in the world [2]. As development progresses, PetroChina Coalbed Methane Company has achieved high production breakthroughs in wells deeper than 1800 m in certain blocks of the Ordos Basin, such as the Daning-Jixian [3] and Yanchuan South areas [4], where some wells have reached a daily production of 25,000 cubic meters. This indicates that deep coalbed methane resources have promising potential for development and utilization under favorable conditions [5].
As coal mining extends to greater depths, the pore and fracture structure of deep coal seams becomes increasingly complex [6]. The pore structure and distribution significantly affect the occurrence and migration of deep coalbed methane, making accurate quantitative characterization of the pore structure in deep coal seams crucial. Internationally, pores are primarily classified into three categories based on pore diameter: micropores (<2 nm), mesopores (2 nm to 50 nm), and macropores (>50 nm) [7]. Deep coal seams exhibit a wide variety of pore types and distributions. The main methods for characterizing the pore structure of coal include high-pressure mercury injection [8], low-temperature nitrogen adsorption [9], and low-pressure carbon dioxide adsorption [10]. These methods allow for the calculation of pore structure parameters using relevant models [11]. Li et al. [12] employed a combined characterization approach using mercury intrusion porosimetry (MIP) and N2/CO2 adsorption to investigate the pore size distribution of coal samples. They elucidated the evolutionary features of nanopore structures under various natural deformation mechanisms and emphasized the complementary nature of these different techniques. Zhao et al. [13] constructed a dual-porosity coupling system of coal rock based on mercury intrusion porosimetry (MIP) and low-temperature N2 adsorption experiments using Voronoi diagrams. They further characterized the complexity of the fractal dual-porosity coal rock matrix through a mathematical framework.
However, for larger-scale microfractures, the aforementioned methods are no longer applicable; thus, techniques such as small-angle neutron scattering [14] and micro-CT scanning [15] are required for characterization. Image processing software is then used to obtain pore parameters at this scale. For the distribution characteristics of coal pores, image analysis methods can be employed, primarily including optical microscope (OM), atomic force microscope (AFM) [16], and scanning electron microscope (SEM) [17]. These techniques enable the visualization and identification of the shape, size, and distribution of coal pores and fractures. Chen et al. [18] employed SEM to characterize changes in porosity and permeability of thermally treated coal samples, and developed a predictive model correlating porosity with permeability. Ramandi et al. [19] developed an approach utilizing micro-CT to resolve microscopic fracture features in coal that are undetectable by conventional imaging techniques. Zhang et al. [20] used AFM to characterize the micro-morphology of coal rock, highlighting the influence of microscopic components on pore formation. They also discussed how pores associated with these components contribute to coalbed methane storage, diffusion, and flow.
The pore structure and distribution within coal play a significant role in the development of CBM. However, each method for characterizing coal pores and fractures has its limitations to varying degrees. Using a single method for characterization presents significant challenges in accurately and quantitatively describing the pore structure across different scales. Therefore, this study is based on three coal rock samples from the JT block in the northeastern region of the Ordos Basin. It employs multiple methods, including nuclear magnetic resonance, high-pressure mercury injection, low-temperature nitrogen adsorption, low-pressure carbon dioxide adsorption, and micro-CT scanning, to quantitatively characterize the nano- to microscale pore size distribution of the coal rock samples. Additionally, the results of methane isothermal adsorption experiments are integrated to discuss the effects of micropores and microfractures on the storage and flow of deep coalbed methane. This research aims to provide valuable insights for the development of deep coalbed methane resources in the Ordos Basin.

2. Geological Overview

The JT block is located in the northeastern part of the Ordos Basin. This block comprises various geological formations from the bottom up, including the Ordovician system, the Benxi Formation of the Upper Carboniferous, the Taiyuan Formation of the Lower Permian, the Shanxi Formation of the Lower Permian, and the Shihezi Formation of the Middle Permian. Among these, the coal seams within the Carboniferous–Permian system and the associated mudstones are the primary source rocks for hydrocarbon generation [21]. The depth of coal seams in the JT area primarily ranges from 2000 to 3000 m, representing a typical deep coal seam development zone. The formation pressure is generally high, with an average pressure gradient of approximately 1.2–1.4 MPa per 100 m, locally reaching up to 1.5 MPa per 100 m, providing favorable conditions for coalbed methane containment. The region is dominated by the eighth coal seam of the Carboniferous Benxi Formation, which exhibits considerable thickness and stable distribution. The seam gradually thins from northeast to southwest, with an average thickness of 7.1 m. Vertically, the coal seam shows good continuity and maintains a stable geological structure.
The 8# coal seam exhibits medium to high rank metamorphism, with maximum vitrinite reflectance (Ro,max) ranging from 1.90% to 2.45%, indicating an overmature stage favorable for coalbed methane generation and accumulation. The coal structure primarily consists of a combination of primary and secondary structural coal, resulting in complex but relatively strong storage conditions.
The original porosity of coal seams in the JT block ranges from 2.46% to 2.74%, with abundant development of micropores and transitional pores. The dominant pore types include biogenic pores, shrinkage fractures, and structural microfractures. Overall permeability is low, with the majority of matrix permeability values falling between 0.03 and 0.78 mD, characteristic of a typical low-permeability coal seam. As burial depth increases, intensified compaction enhances pore closure, resulting in a pore–fracture system that exerts dual control over coalbed methane storage and migration.
Adequate coal seam thickness, stable continuity, mature organic matter evolution, and a sealed pressure system collectively ensure favorable conditions for coalbed methane accumulation. These factors make the coal seams in the target block the primary focus for coalbed methane exploration and development.

3. Experimental Materials and Methods

3.1. Sample Selection and Preparation

In this study, three fresh coal rock samples at varying burial depths were collected from newly drilled wells in the northeastern JT area of the Ordos Basin using wireline coring. All three samples were taken from the 8# coal seam of the Benxi Formation. After allowing natural desorption at the site, the fresh coal samples were sealed and packaged for subsequent analysis.
The samples were prepared into standard cylindrical specimens (2.5 cm in diameter and 5 cm in height) using wire cutting, while the remaining coal samples were crushed to particle sizes of 60–80 mesh and 100–200 mesh. Following GB/T 6948-2008 [22] and SY/T 6414-2014 [23] standards, maximum vitrinite reflectance (Ro,max) measurements were conducted at 80 randomly selected points using a Leica DM4P photometric microscope under oil-immersion reflected light. Additionally, coal maceral analysis—including reflectance, color, fracture development, boundary morphology, and interference colors—was performed at 500 points in accordance with the SY/T 6414-2014 industry standard. Moisture, ash, volatile matter, and fixed carbon contents of the coal samples were determined based on GB/T 30732-2014 [24]. The physical properties of the three coal samples are summarized in Table 1.

3.2. Experimental Principles and Methods

3.2.1. NMR Technology

Currently, NMR technology has been maturely applied across various industries. In testing the pore sizes of coal and rock, its principle mainly involves measuring the hydrogen signal of fluids within the pores and the relaxation time (T2). Different T2 values correspond to different pore sizes. The number of peaks indicates the development of different pore sizes, the area under the peaks represents the proportion of each pore size, and the width of the peaks reflects the sorting quality of the pores [25,26,27]. In this experiment, the coal sample is first dried at 105 °C for 24 h to ensure that no impurities or gases interfere with the NMR signal. During this time, the T2 spectrum of the coal sample under dry conditions is measured. Subsequently, the T2 spectrum of the coal sample is measured in a saturated water state. The two sets of data are then plotted using Origin 2021 software.

3.2.2. High-Pressure Mercury Intrusion Method

The high-pressure mercury intrusion method primarily uses external force to enable mercury to overcome surface tension and enter the pore spaces of the coal sample. The greater the applied pressure, the smaller the pore size that mercury can access. Based on the principle of balance between the surface tension of mercury in the pores and the applied pressure, a calculation method for pore size can be derived, as shown in Equation (1) [28].
D = 2 r = 4 σ cos a p
In the equation, D represents the pore diameter of the coal and rock, in cm; r is the pore radius, in cm; α is the contact angle between mercury and the coal–rock surface, °; σ is the surface tension of mercury, 10−3 mN/m; and p is the injection pressure, Pa.
Using the AUTOPORE 9505 high-pressure mercury intrusion porosimeter (Micromeritics, Norcross, GA, USA), which can reach a maximum testing pressure of 400 MPa and minimum pore size of 2.5 nm, coal samples dried at 105 °C for 24 h will be placed in the instrument. It is essential to maintain a vacuum inside the instrument during testing. By automatically collecting the mercury intrusion and extrusion data at different pressures, and combining this with the Washburn equation, the distribution of pore parameters such as pore volume and specific surface area can be determined.

3.2.3. Low-Temperature N2 Adsorption Method

The low-temperature N2 adsorption method primarily involves the non-specific multilayer adsorption of N2 molecules on the adsorbent surface through van der Waals forces. The characteristics of non-specific and reversible adsorption due to physical adsorption, along with the ability to enter smaller pore sizes [29], make N2 a common method for measuring pore sizes in coal and rock ranging from 2 nm to 100 nm.
The low-temperature N2 adsorption method employs the Autosorb-iQ-MP-C fully automated physical and chemical adsorption instrument. According to GB/T21650.2-2008 [30], after high-temperature drying, 1–2 g of coal powder with a particle size of 60–80 mesh is degassed and placed in liquid nitrogen. The adsorption of nitrogen by the coal powder is then measured at 77 K under different pressures. Isothermal adsorption and desorption curves are plotted based on pressure and adsorption amount [31]. Following the classification of isotherms by the International Union of Pure and Applied Chemistry (IUPAC), and considering the shape of the specific isotherm, different calculation models are selected. Given the pore size range measured by the N2 adsorption method described in the introduction, the BET [32,33] and NLDFT [34,35] models can be used for calculations. The respective formulas are shown in Equation (2), allowing for the determination of the distribution of pore volume and specific surface area in the coal.
V = V m P C ( P s P ) 1 ( P / P s ) + C
In the equation, V represents the total volume of the adsorbed gas at equilibrium pressure P; Vm is the adsorption amount when a monolayer is formed; Ps is the saturation vapor pressure; P is the pressure of the adsorbed gas at equilibrium temperature; and C is a constant related to adsorption.
By rearranging Equation (2), we can obtain Equation (3). By plotting the data, the intercept and slope of the graph can be used to calculate the specific surface area of the pores.
P V ( P s P ) = 1 V m + C + C 1 V m × P P s

3.2.4. Low-Pressure CO2 Adsorption Method

The low-pressure CO2 adsorption method is similar in principle and experimental steps to the low-temperature nitrogen adsorption method, both falling under the category of gas adsorption methods. However, CO2 molecules have a smaller diameter than N2 molecules, allowing for the measurement of smaller pore sizes. Generally, CO2 can penetrate pores smaller than 2 nm [36].

3.2.5. Micro-Computed Tomography (Micro-CT)

Micro-CT is a high-resolution imaging technique that can be used for non-destructive characterization of the distribution of internal microstructures, such as certain pores and microcracks, within porous media [37]. The working principle of Micro-CT is based on the varying X-ray absorption capacities of different materials, resulting in different degrees of X-ray attenuation. The differences in density between pores, microcracks, and coal rock lead to varying contrast in the imaging, thereby characterizing their distribution [38].
In this experiment, a Nano Voxel 3502E multiscale high-resolution 3D micro-imaging system (Sanying Precision Instruments Co., Ltd., Tianjing, China) is used to conduct a helical scan of the coal sample. A cylindrical sample with a diameter of 25 mm and a length of approximately 200 mm is vertically placed in the scanning instrument. The voltage is set to 150–200 kV, and the temperature is maintained at 22 °C.

3.2.6. Scanning Electron Microscope (SEM)

The working principle of SEM involves scanning the sample surface with an electron beam. When the high-energy electron beam strikes the sample surface, it interacts with atoms in the sample, generating various signals. Detectors collect these electron signals and convert them into electrical signals, which are then amplified and processed to form high-resolution micrographs, characterizing surface morphology, structure, and other information of the rock [39].
In this experiment, high-resolution field emission SEM is used to observe the characteristics of pore structures, microcracks, and other features in coal and rock. According to GB/T 17366-1998 [40] and SY/T 5162-2014 [41], the coal and rock samples are fixed to the SEM sample stage, allowing the electron beam to scan the sample point by point. It is essential to ensure that the electron beam covers the entire sample during the scanning process. The accelerating voltage is set to 20 kV, with magnifications of 100, 500, 2000, and 10,000.

3.2.7. Methane Isothermal Adsorption

Methane isothermal adsorption is primarily based on the adsorption behavior of gas on solid surfaces. When gas molecules come into contact with a solid surface, they interact, leading to either physical or chemical adsorption. Physical adsorption is mainly driven by van der Waals forces, while chemical adsorption involves the formation of chemical bonds. Isothermal adsorption experiments typically focus on the characteristics of physical adsorption [42].
In this experiment, a Gravimetric Isotherm Rig 3 gravimetric isothermal adsorption apparatus (CSIRO, Melbourne, Australia) is used according to GB/T 19560-2008 [43]. Approximately 60 g of 60–80 mesh coal sample, dried at high temperature, is tested. The instrument temperature is set to a formation temperature of 70 °C, with 9 experimental pressure points and a maximum pressure of 25 MPa. At the start of the experiment, pressure is slowly and steadily increased from atmospheric pressure to the highest pressure point while injecting methane. The pressure is allowed to equilibrate at each point before moving to the next experimental point.
Methane isothermal adsorption generally conforms to the Langmuir adsorption model. Numerous studies [44,45,46,47] have shown that the Langmuir isotherm can accurately fit methane adsorption on coal and rock surfaces. The equation describing methane isothermal adsorption according to the Langmuir model can be expressed as Equation (4).
P V = P V L + P L V L
Let A = 1/VL, B = PL/VL. Plot the pressure at each equilibrium point against the adsorption data to create a linear graph with P as the x-axis and P/V as the y-axis. The coefficient of determination R2 for the linear graph can be calculated using the least squares method.

4. Results

4.1. Pore Distribution Characteristics from NMR

Figure 1 presents the T2 spectra of three coal samples from the JT block, analyzed under saturated water and after 24 h of drying. The shape of the curves in the spectra reflects the distribution ratio and porosity of the coal samples. The T2 spectra of the three coal samples exhibit significant similarities in overall trends and shapes, with peaks occurring at 0.1–1 ms and 10–10,000 ms, indicating that the pore structures of the JT block coal samples at different burial depths are quite similar. This also suggests a high proportion of pores at these relaxation times, with signal intensities reaching 80–90% in the 0.1–1 ms range. Additionally, using the spectral area method in Origin, the integral of the T2 spectra was calculated [48], yielding total porosities of 2.74%, 2.46%, and 2.48% for the three coal samples, respectively.
Analyzing the shape of the curves from the T2 spectra, all three sets of curves under saturated water conditions exhibit continuous bimodal T2 spectra. This indicates that there is good connectivity between the small and large pores in the JT coal samples [49].
According to the classification by Wang et al., for different relaxation times corresponding to pore sizes—adsorption pores (micropores, <0.1 μm), flow pores (mesopores, 0.1–100 μm), and microcracks/fractures (>100 μm)—the corresponding relaxation time ranges are 0.5–2.5 ms, 20–50 ms, and greater than 200 ms [50], respectively. By combining the signal proportions within these relaxation time ranges, it can be preliminarily indicated across all scales that the JT coal samples primarily develop adsorption pores smaller than 0.1 μm, while also containing a smaller quantity of flow pores and microcracks.

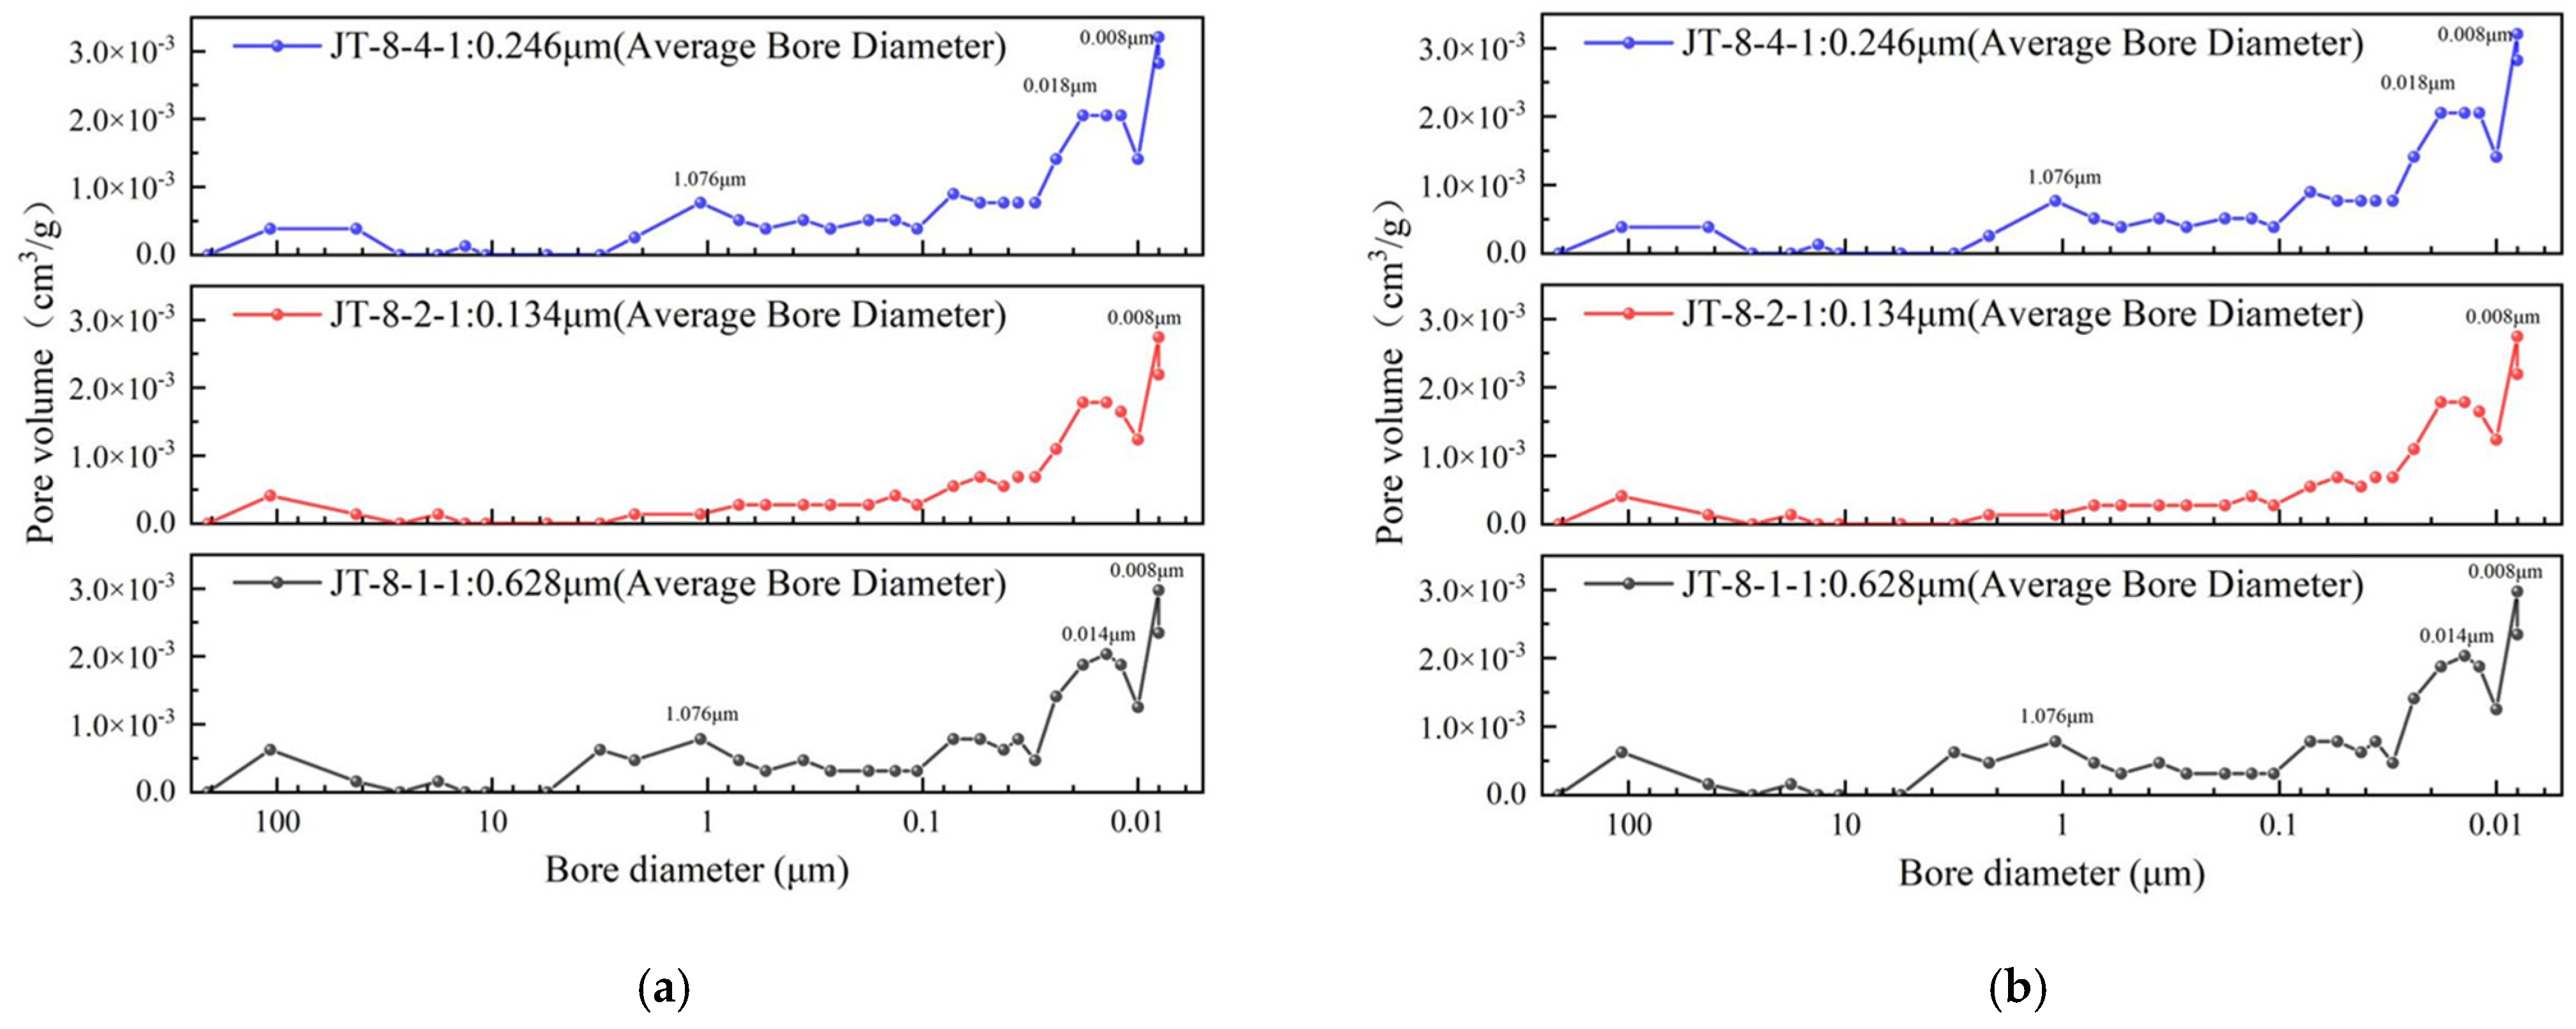
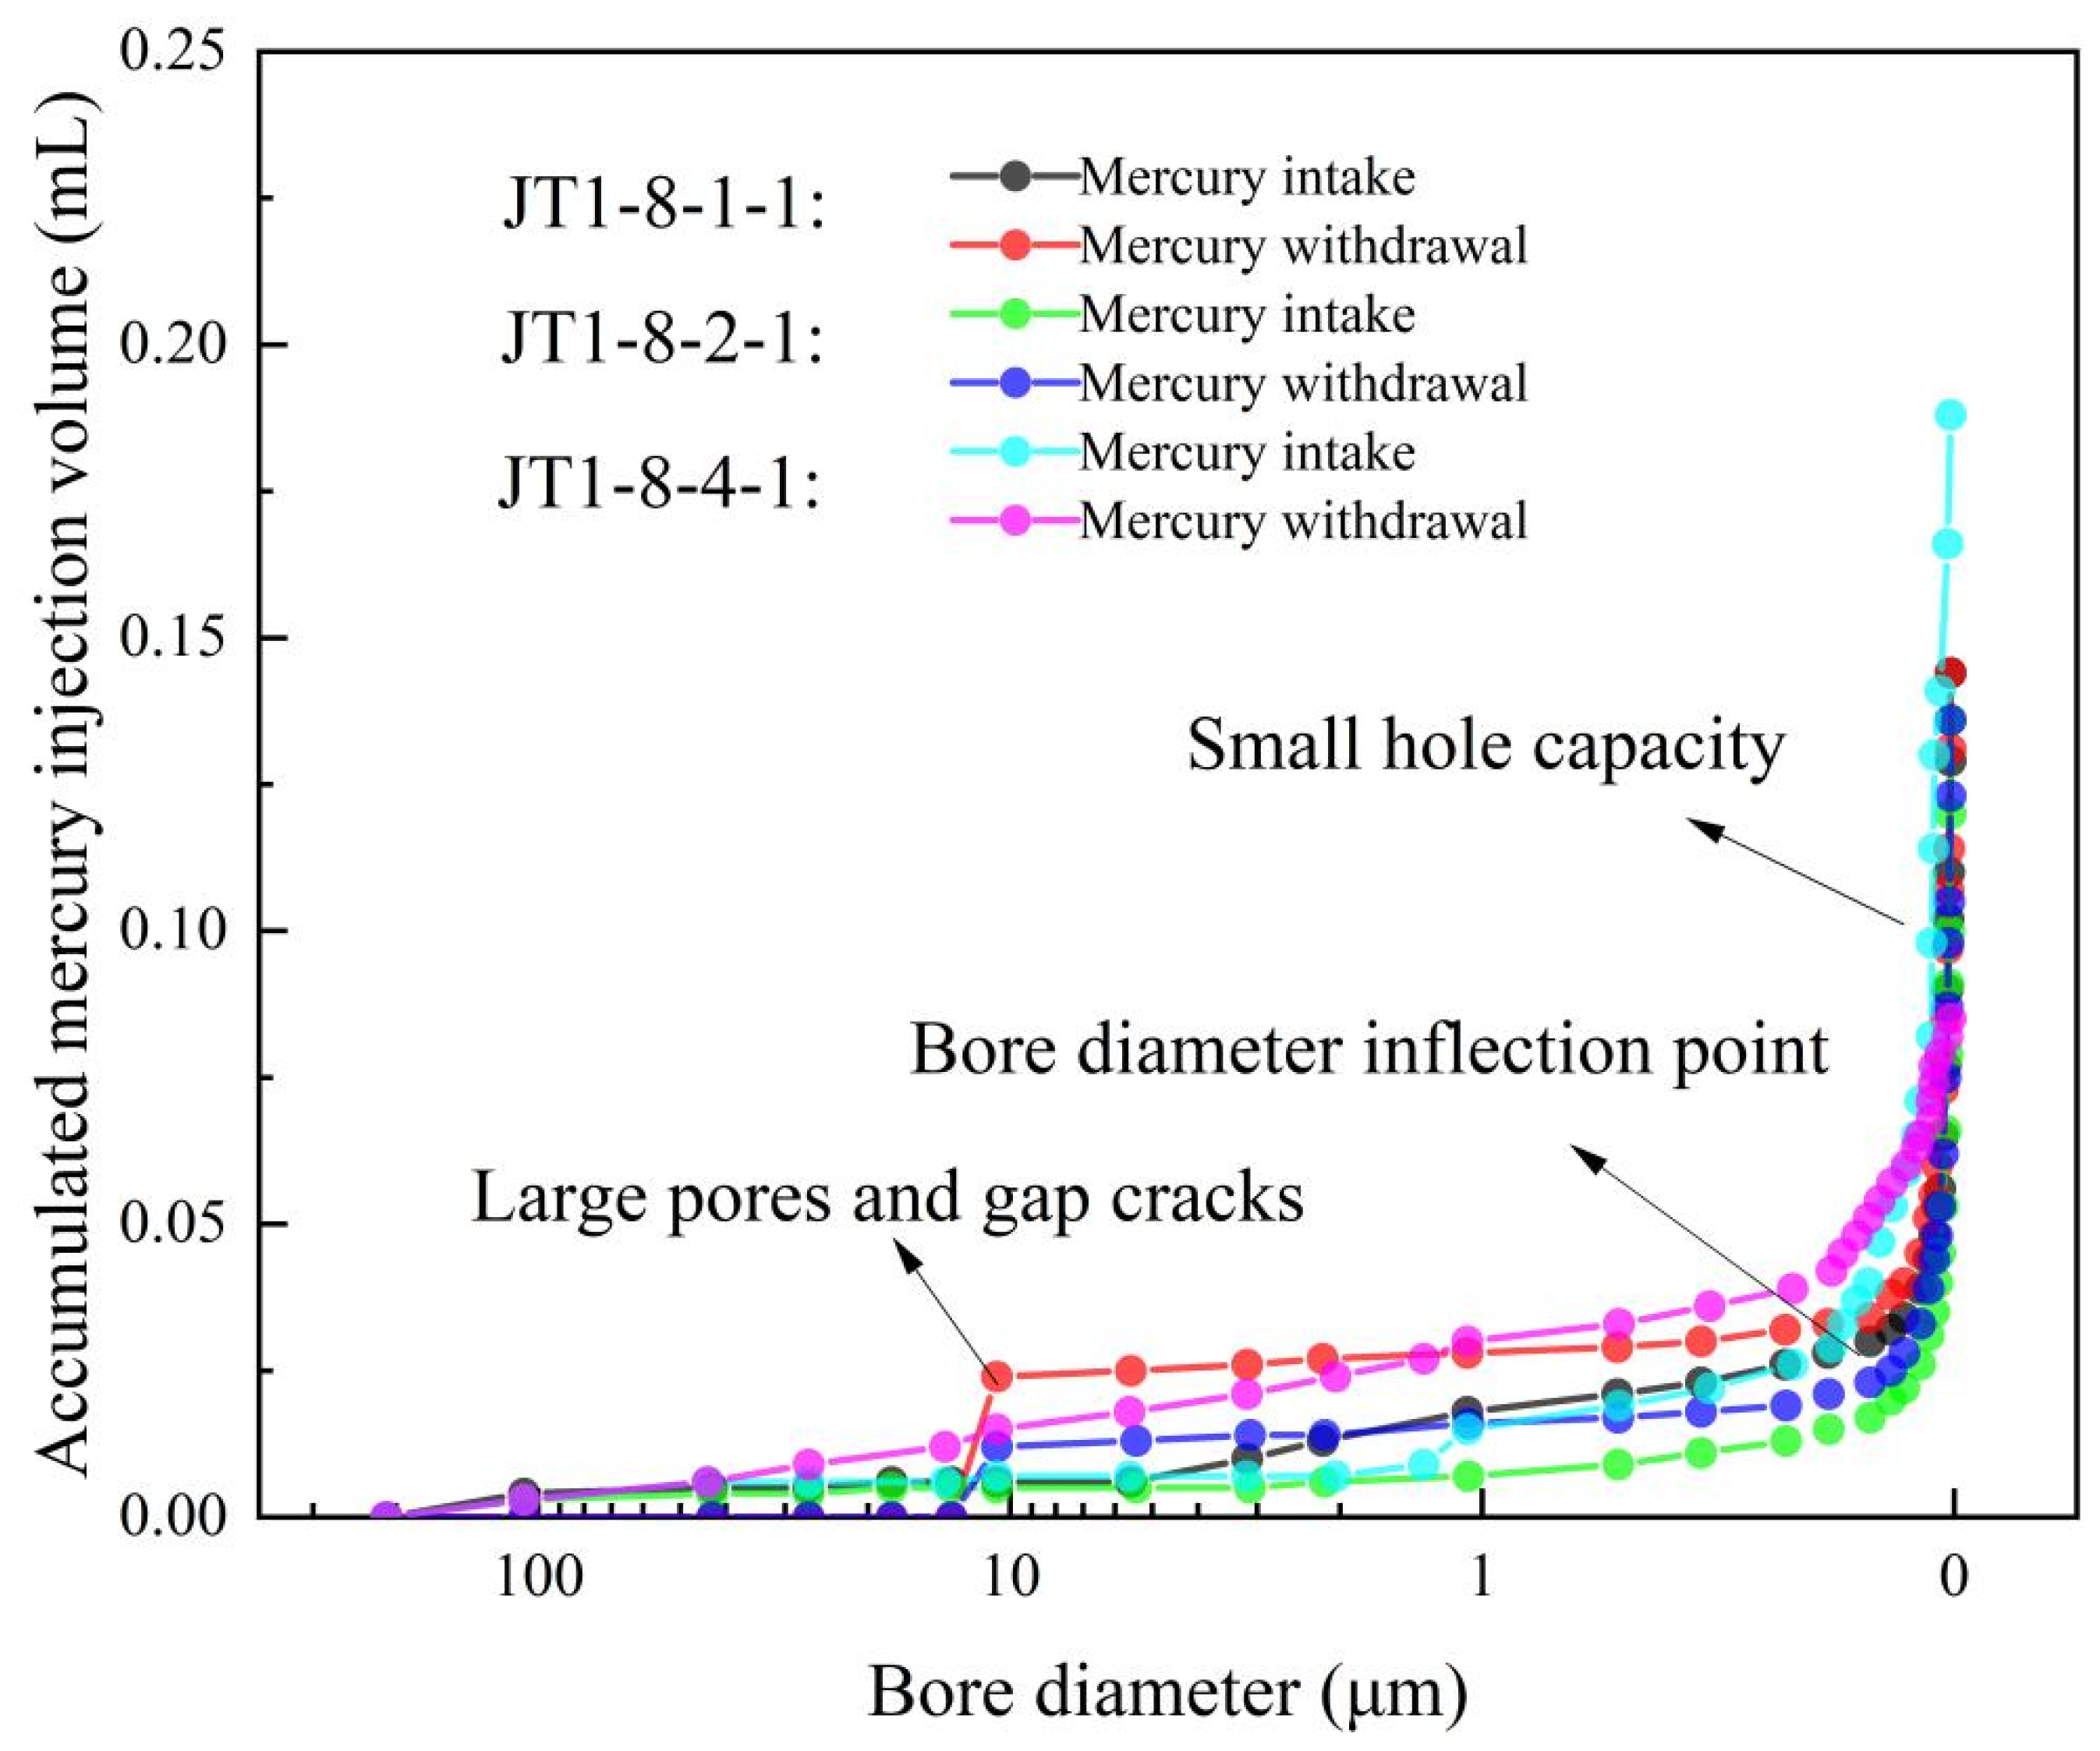
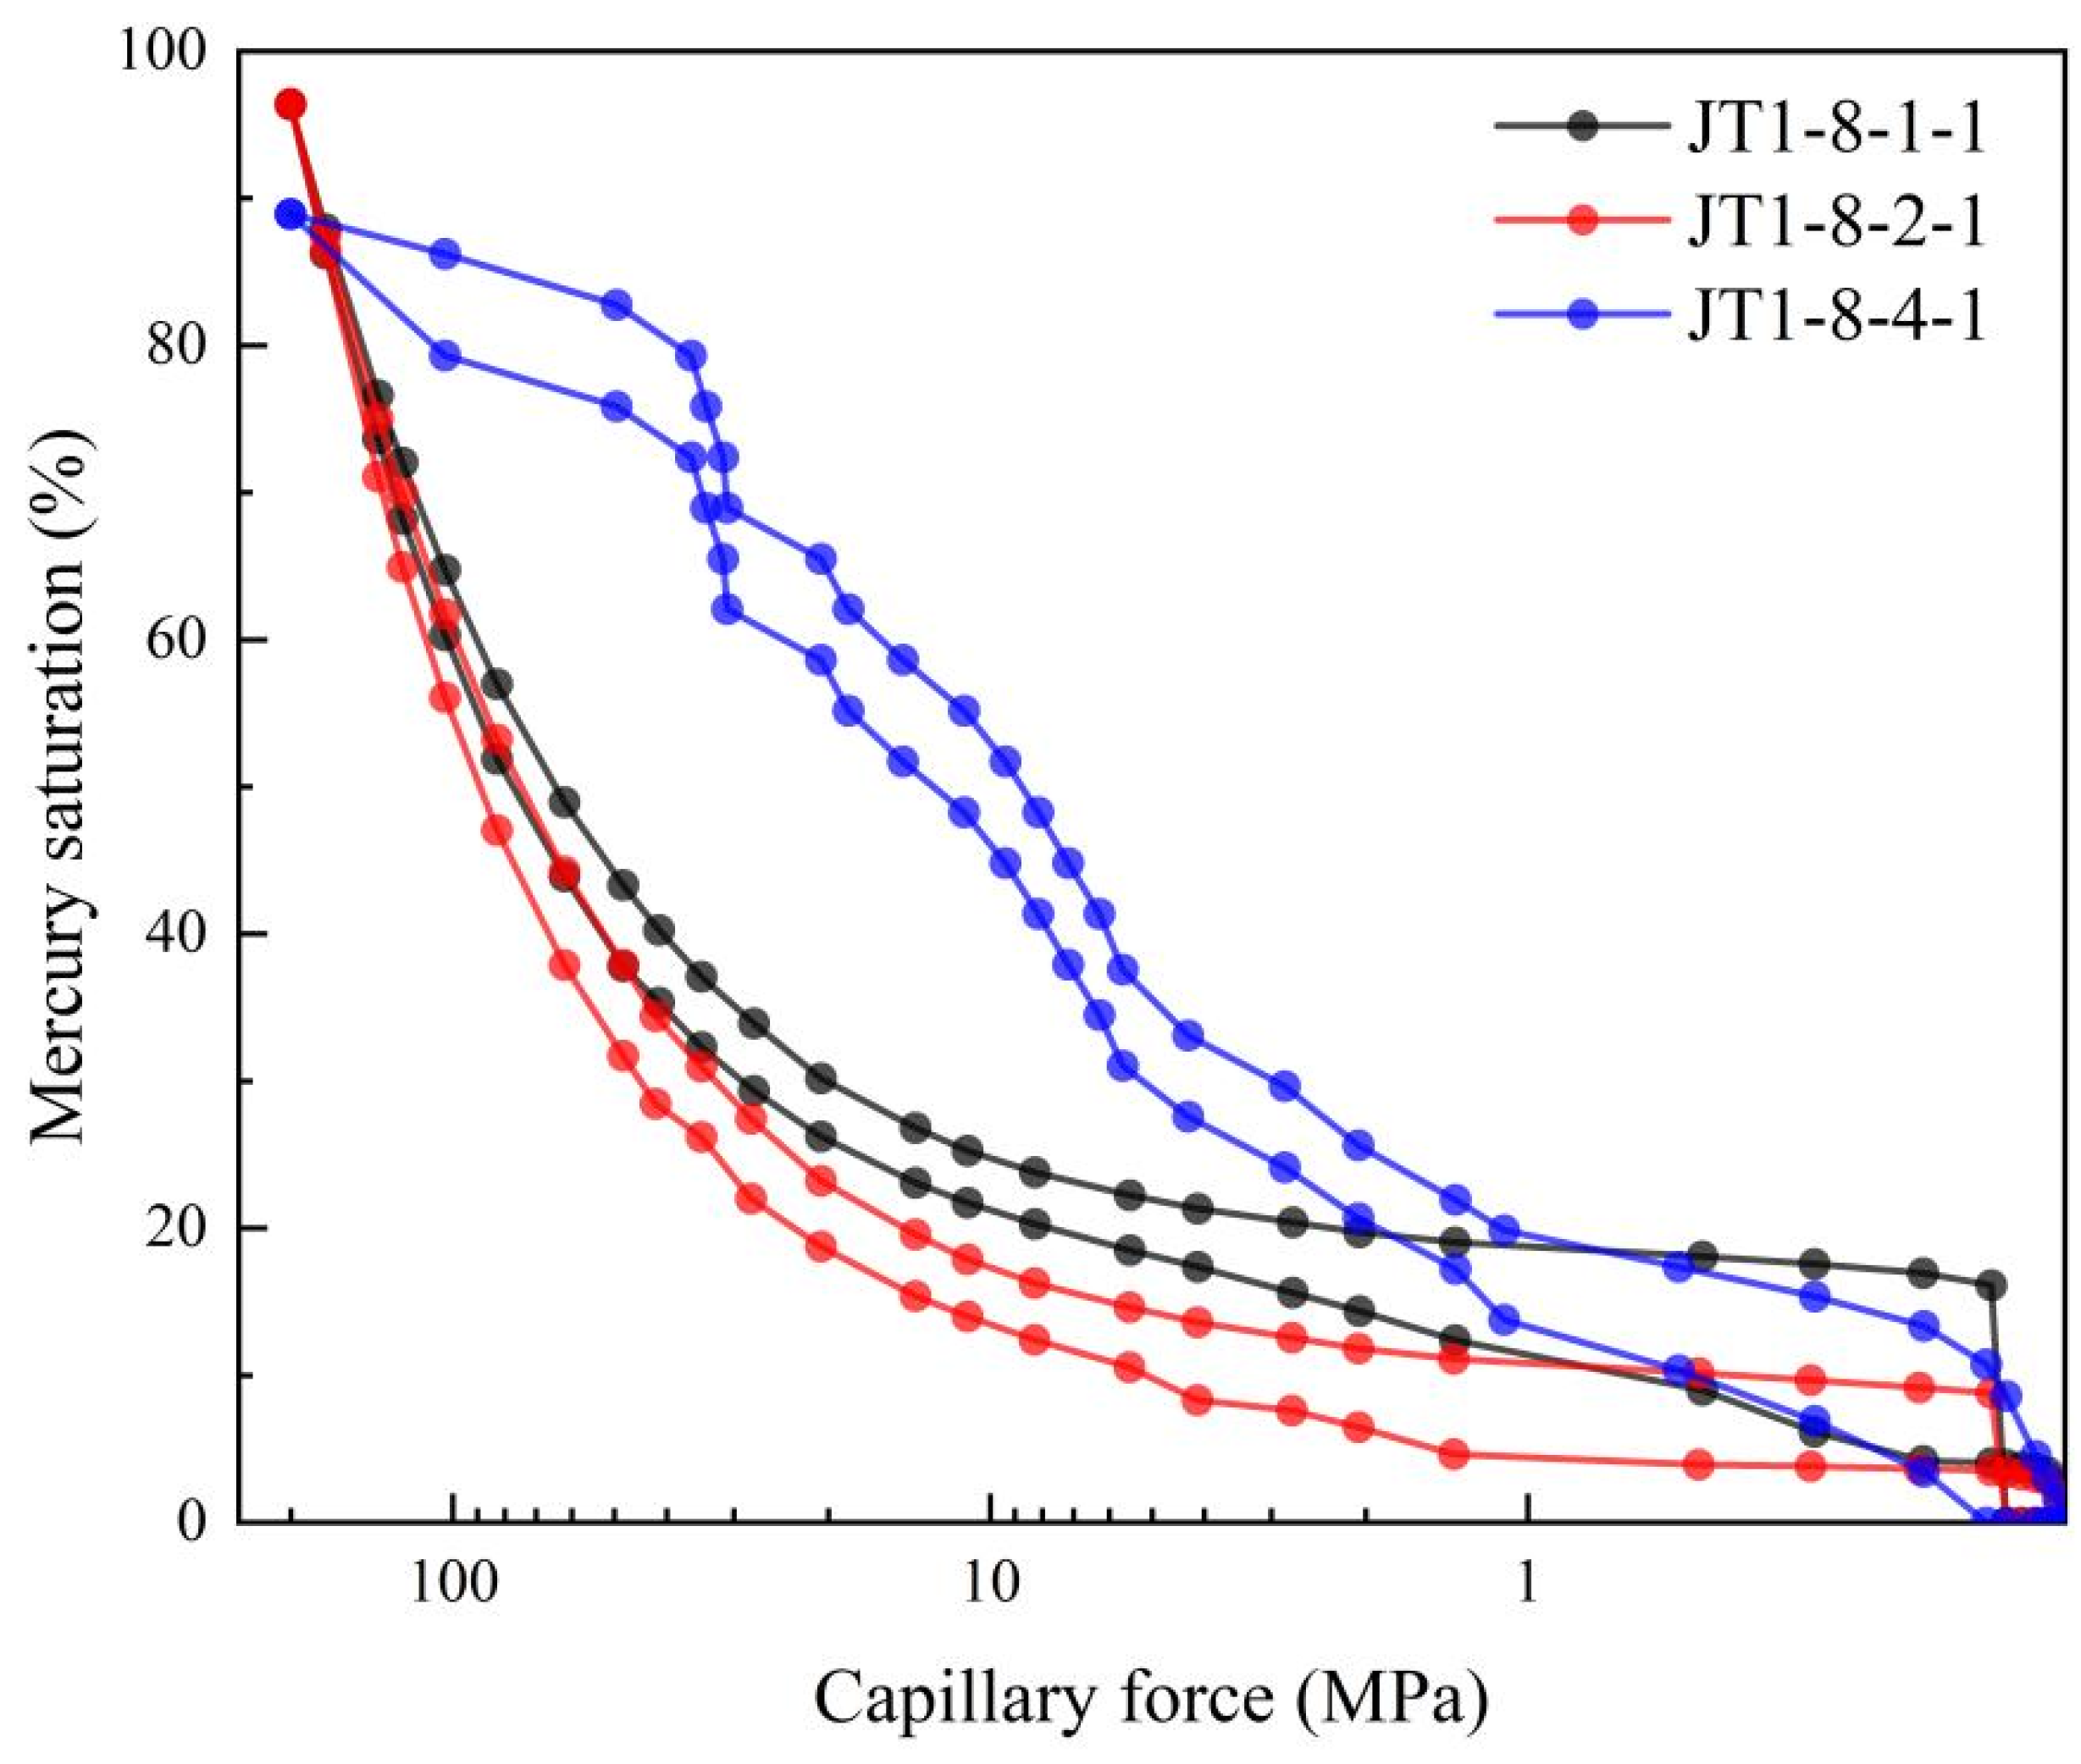
4.2. Pore Distribution Characteristics from High-Pressure Mercury Intrusion Experiments

The shape of the high-pressure mercury intrusion curve can reflect the development and connectivity of different pore throat segments [51]. Based on the Washburn equation, the intrusion and extrusion data from the high-pressure mercury tests yield the pore volume and specific surface area distribution curves shown in Figure 2. From the shape of these curves, the pore size distribution of the JT block coal samples is generally unimodal. The average pore sizes in the three coal samples from the mercury intrusion experiments are 0.628 μm, 0.134 μm, and 0.246 μm, with total pore volumes of 0.0225 cm3/g, 0.0187 cm3/g, and 0.0241 cm3/g, respectively, resulting in an average total pore volume of 0.0218 cm3/g. The total specific surface areas are 0.8132 m2/g, 0.7476 m2/g, and 0.5342 m2/g.
Figure 3 shows the mercury intrusion and extrusion curves for the JT coal samples. The curves for the three coal samples exhibit similar trends, characterized by a gentle slope at the beginning that gradually becomes steeper. The mercury intrusion curve indicates that in the low-pressure region, the curve is quite flat, suggesting that the corresponding pores and fractures in this pressure range are relatively underdeveloped. As pressure gradually increases, the curve steepens significantly, and the cumulative mercury intrusion rises exponentially, indicating that the pores and fractures in this range are well-developed, revealing the presence of a substantial amount of nanoscale pores and fractures in the JT coal samples. In terms of the mercury extrusion curve, the high extrusion efficiency across the three coal samples suggests that a significant proportion of the nanoscale pores in the JT coal samples are open and exhibit good connectivity.
Figure 4 illustrates the curves of capillary pressure and mercury saturation under high-pressure mercury intrusion experiments. It is evident that when the intrusion pressure exceeds 50 MPa, a significant volume of mercury enters the coal samples, with over 50% of the mercury entering pores sized at 18 nm. Notably, as the intrusion pressure increases, the maximum mercury saturation reaches up to 90%, indicating that the connectivity of nanoscale pores in the JT block coal reservoir is exceptionally good.

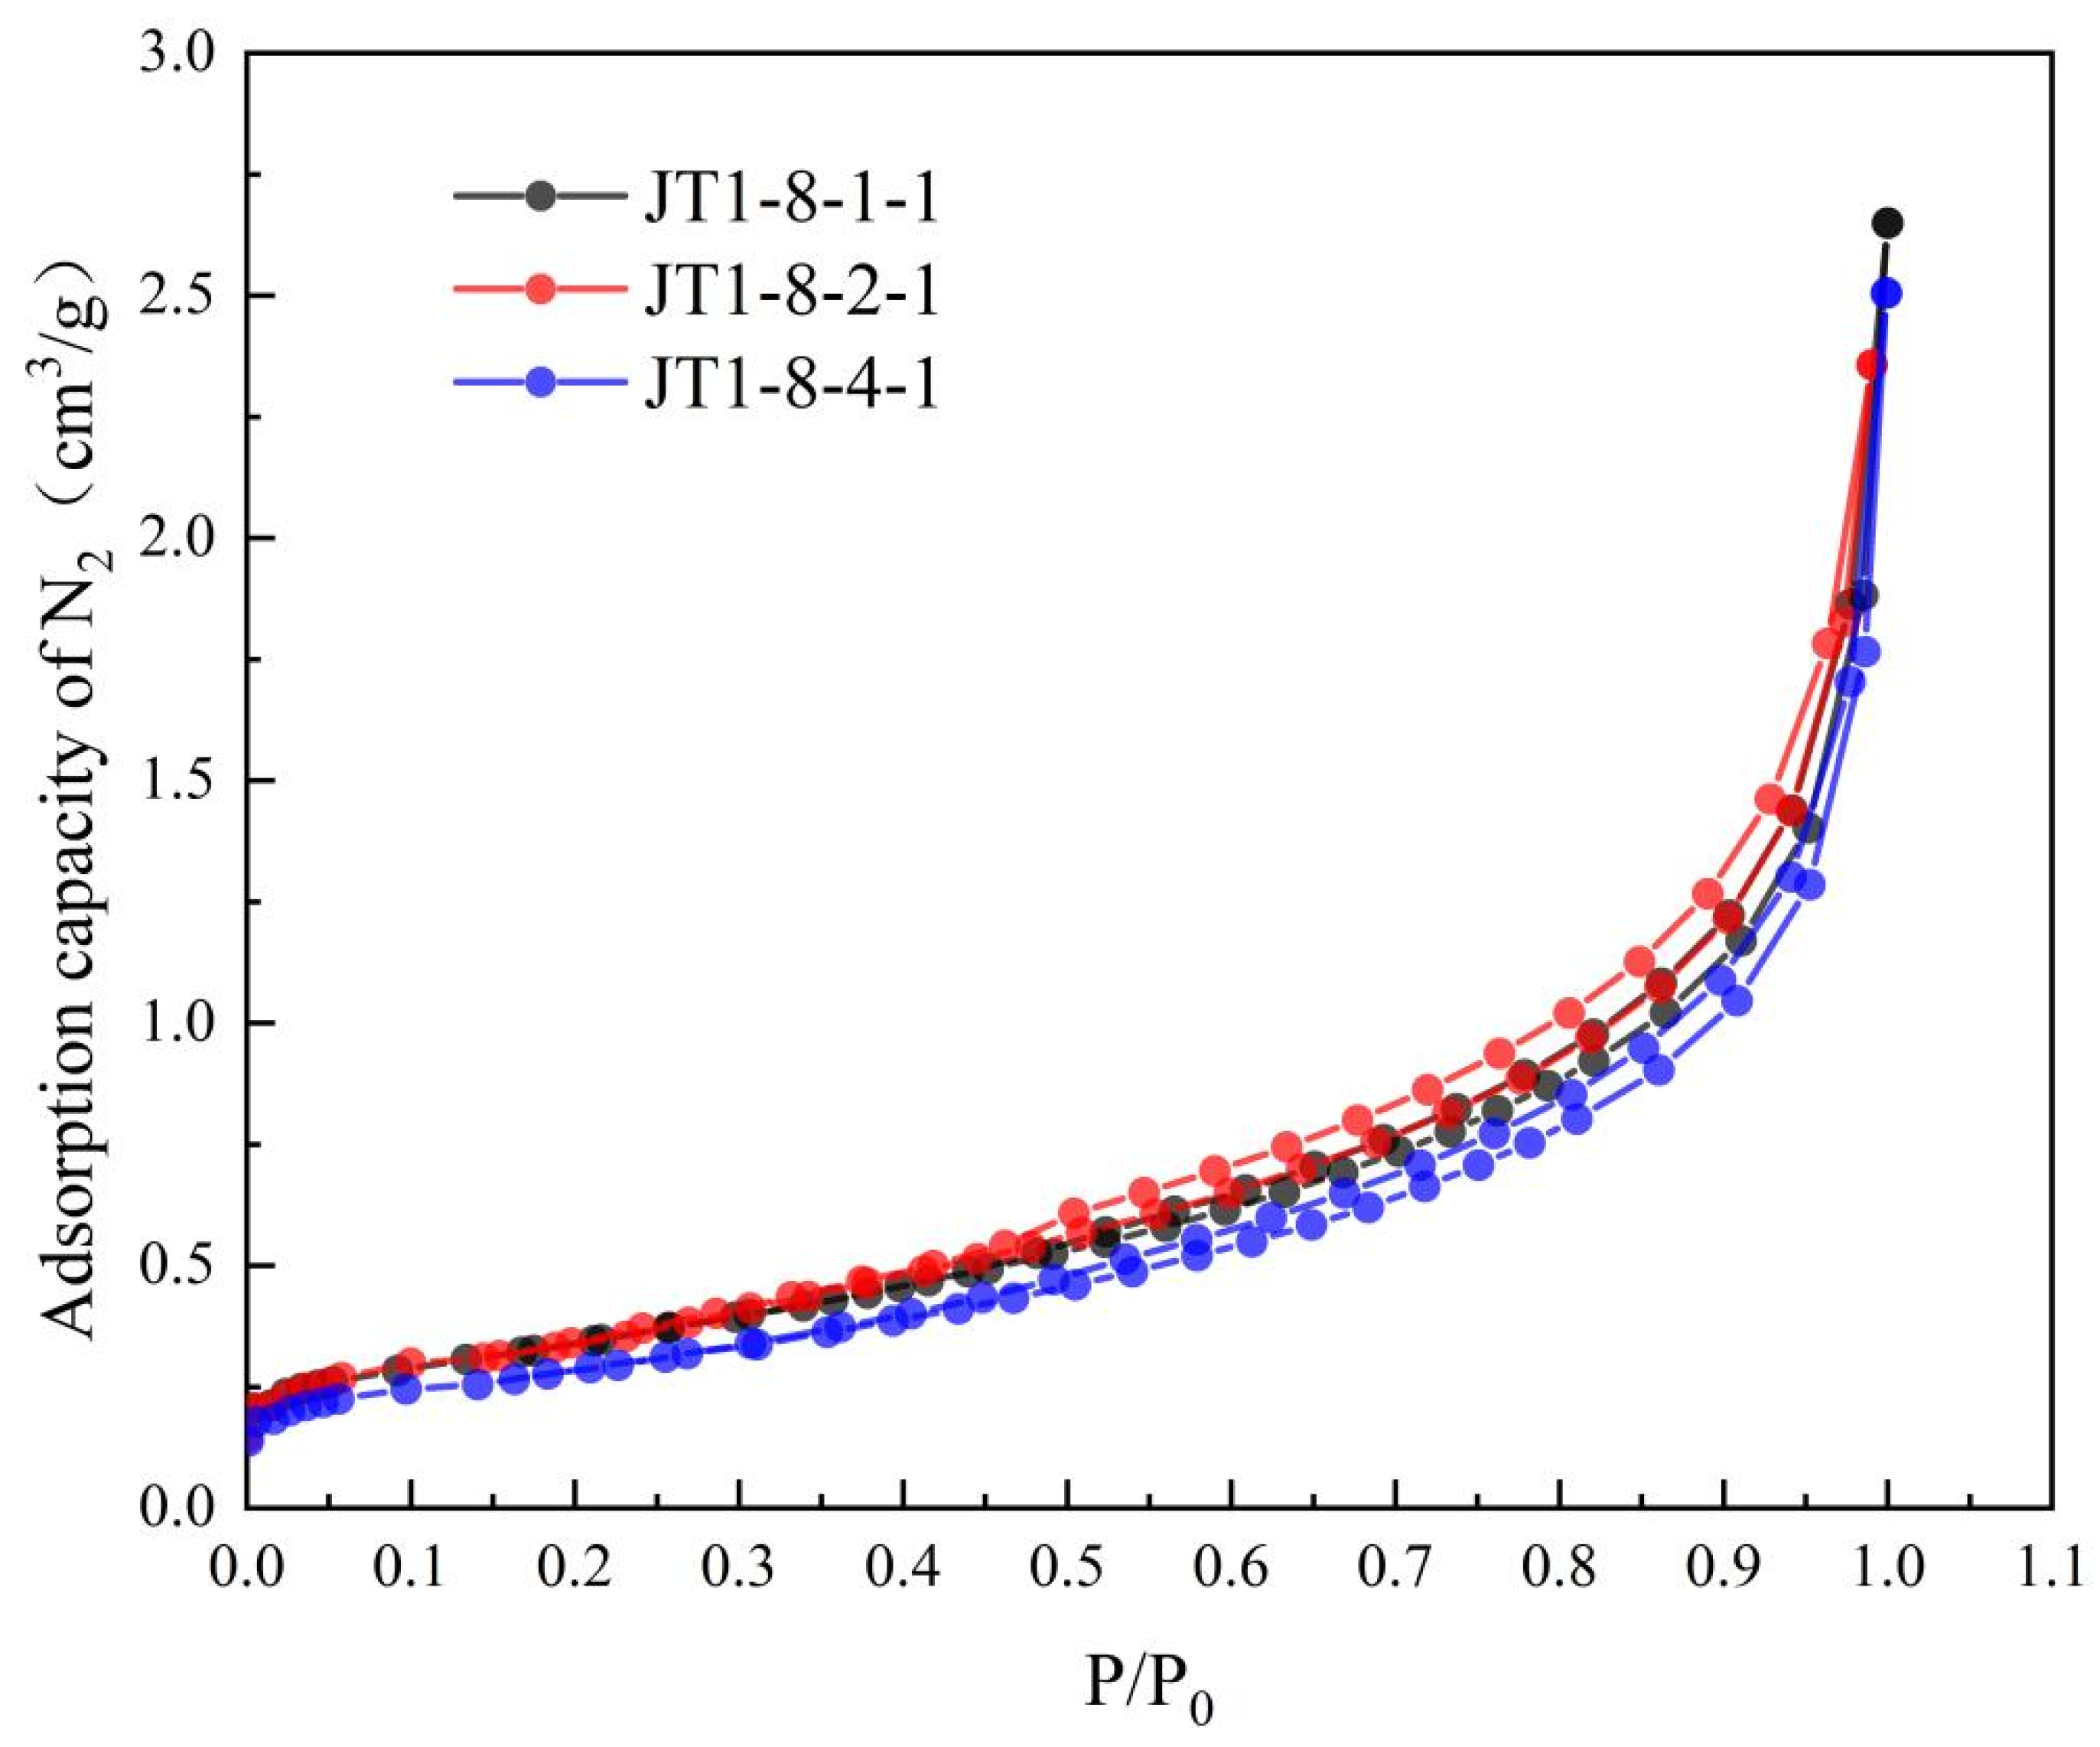
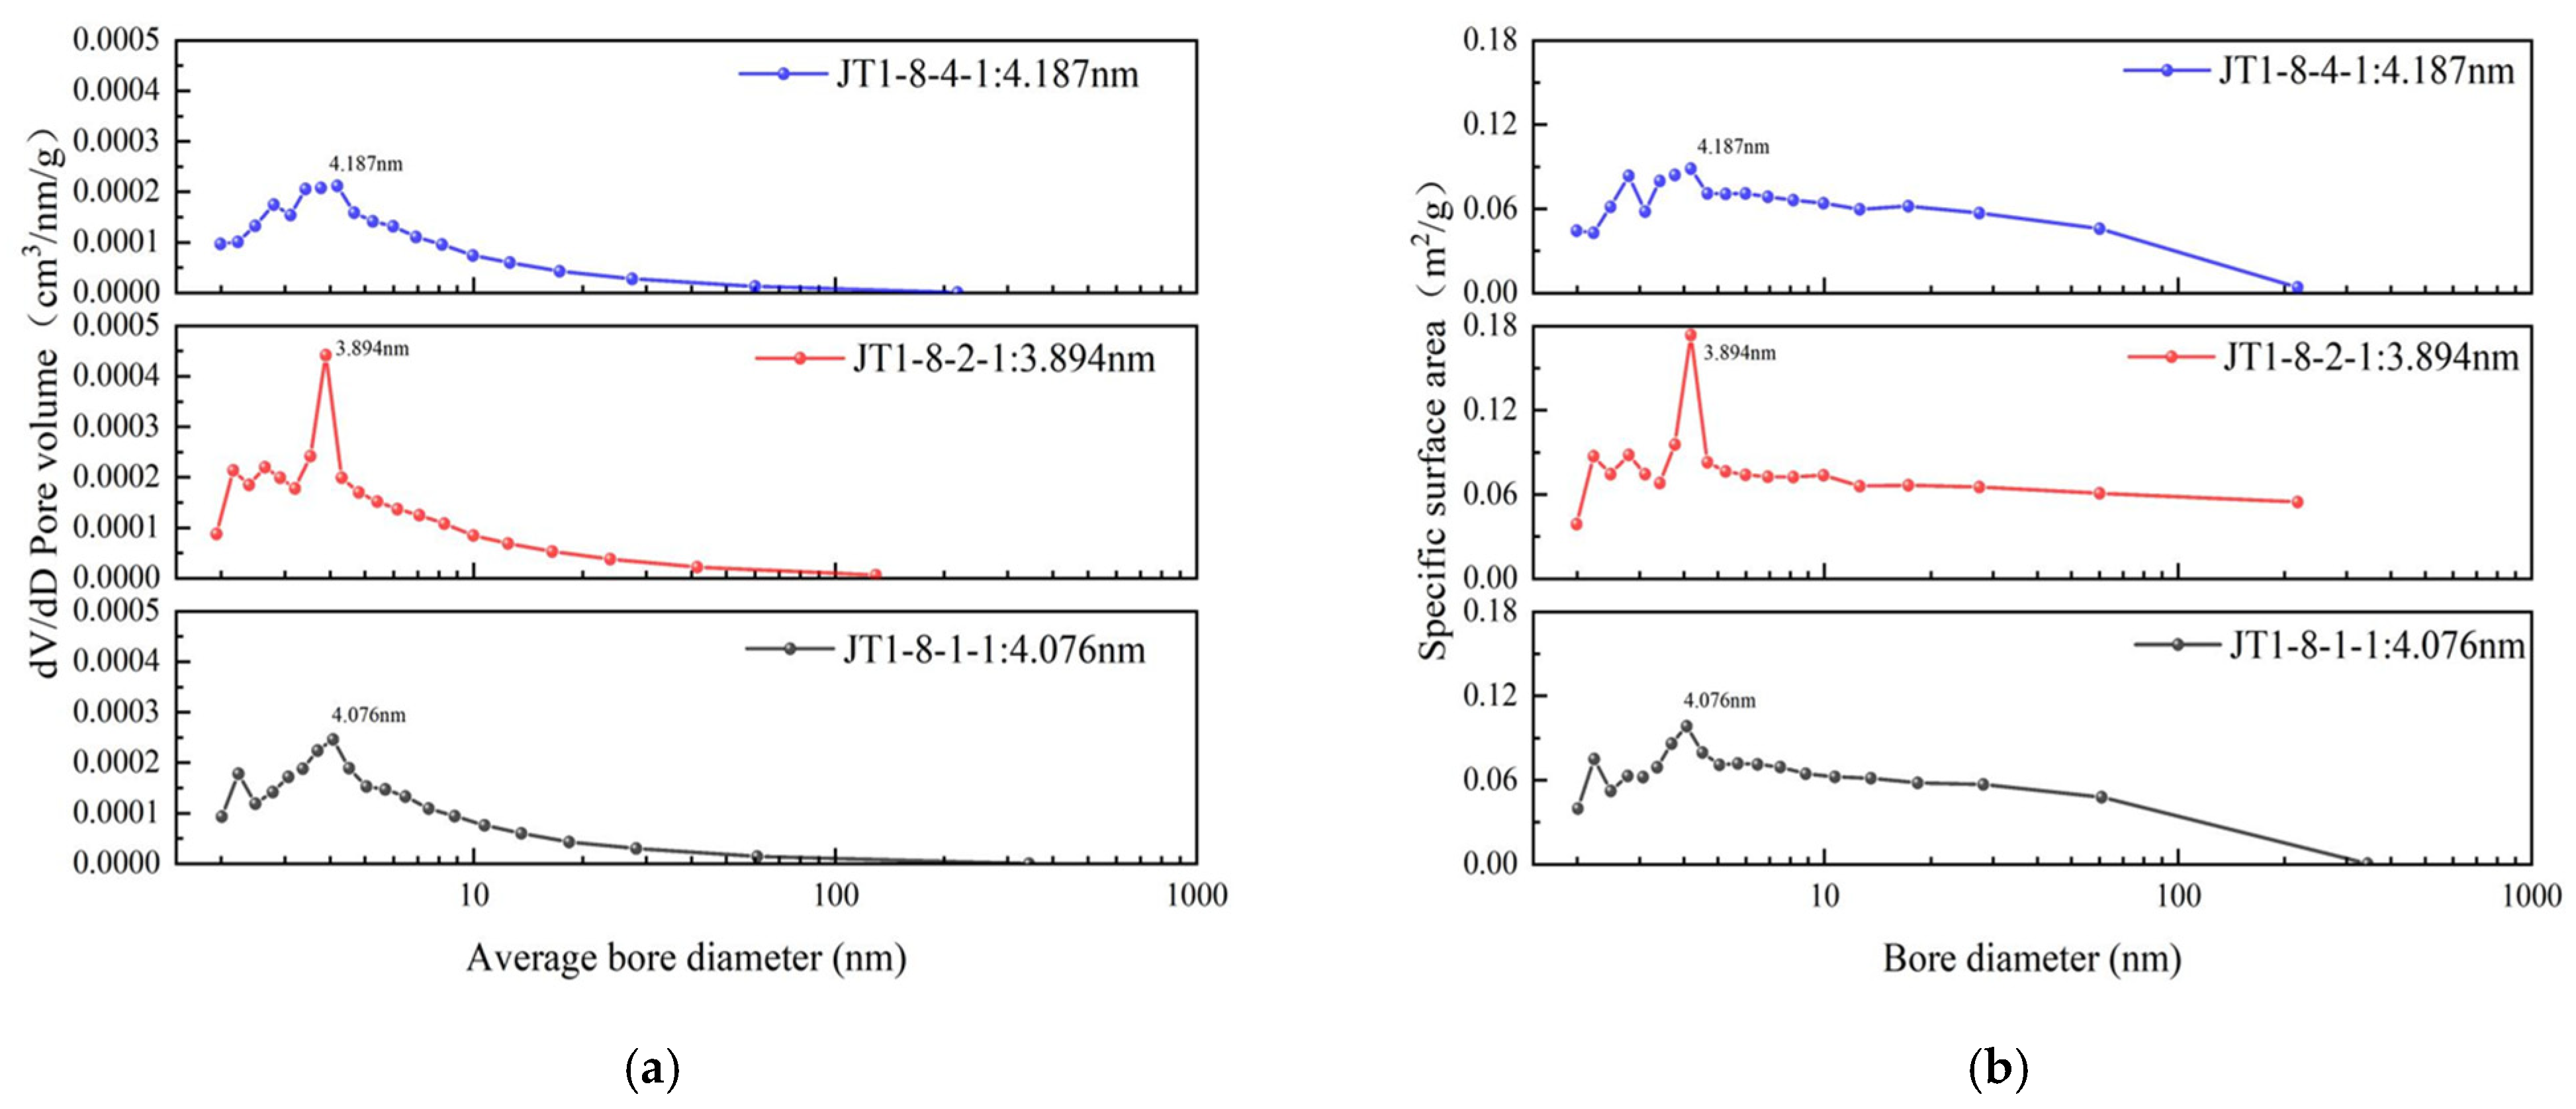
4.3. Pore Distribution Characteristics from Low-Temperature N2 Adsorption Experiments

Due to the limitations of high-pressure mercury intrusion experiments in measuring pore sizes below 18 nm [52], they cannot accurately characterize mesopores in coal and rock. Therefore, low-temperature nitrogen adsorption experiments are further employed to characterize the development characteristics of mesopores in the JT block coal samples, specifically those smaller than 18 nm and larger than 2 nm.
Figure 5 illustrates the characteristics of low-temperature N2 adsorption and desorption for the three coal samples from the JT block. The isotherm curves are similar in shape, generally following a trend of “initial slow increase, gradual leveling off, followed by a rapid rise”. According to the classification of adsorption–desorption isotherms by the International Union of Pure and Applied Chemistry (IUPAC), the isotherm curves for the JT block coal samples closely align with Type IV [53]. At relatively low pressures (P/P0 < 0.1), the adsorption curve rises rapidly, indicating that monolayer adsorption predominantly occurs in the micropores during this stage. This observation also suggests that the JT coal samples exhibit a strong affinity for nitrogen (N2) adsorption [54]. As the relative pressure gradually increases (P/P0 = 0.1~0.9), the amount of adsorption increases slowly, indicating that monolayer adsorption of N2 molecules is gradually coming to an end, transitioning to multilayer adsorption. When the relative pressure approaches 1, the adsorption curve rises exponentially, which is attributed to the occurrence of capillary condensation during the testing process [55]. This phenomenon suggests that, even when the relative pressure is near the saturation vapor pressure, the coal samples do not exhibit complete adsorption saturation and equilibrium. This indicates that there are still a small number of large open pores present in the JT coal samples.
Previous studies have shown that low-temperature adsorption–desorption isotherms can exhibit hysteresis loops, commonly associated with Type IV isotherms. The hysteresis loop refers to the phenomenon where the adsorption branch measured as equilibrium pressure increases does not overlap with the desorption branch measured as pressure decreases, resulting in a loop within a certain range of relative pressures [56,57]. From Figure 5, it can be observed that when P/P0 < 0.4, the adsorption and desorption lines tend to overlap. As P/P0 gradually increases, the adsorption and desorption lines no longer coincide. When P/P0 approaches 1, the adsorption and desorption lines overlap again, indicating that a hysteresis loop is formed in the JT coal samples within the relative pressure range of 0.4~1. According to IUPAC classifications of hysteresis loops for Type IV isotherms, the adsorption–desorption curves of the JT block are close to Type H3, suggesting that the pore structure of the coal samples in the studied area consists of plate-like slit structures, fractures, and wedge-shaped configurations [54,58,59].
Based on the NLDFT model, the low-temperature N2 adsorption experimental data were analyzed, yielding the pore volume and specific surface area distribution curves for the JT coal samples, as shown in Figure 6. The DFT pore volumes for the three coal samples were all 0.004 cm3/g, while the DFE specific surface areas were 1.230, 1.226, and 1.026 m2/g, with an average of 1.161 m2/g. The average pore diameters were 4.076, 3.894, and 4.187 nm, resulting in an overall average of 4.052 nm. From the trend of the curves in Figure 6, as the average pore diameter increases, the pore volume and specific surface area of the JT coal samples initially increase and then gradually decrease, with peak values occurring at 4.076, 3.894, and 4.187 nm. Additionally, it is evident from the figure that the pore volume and specific surface area on the left side of the peaks are higher than those on the right side. This observation further indicates that the JT coal samples predominantly develop mesopores around 4 nm.

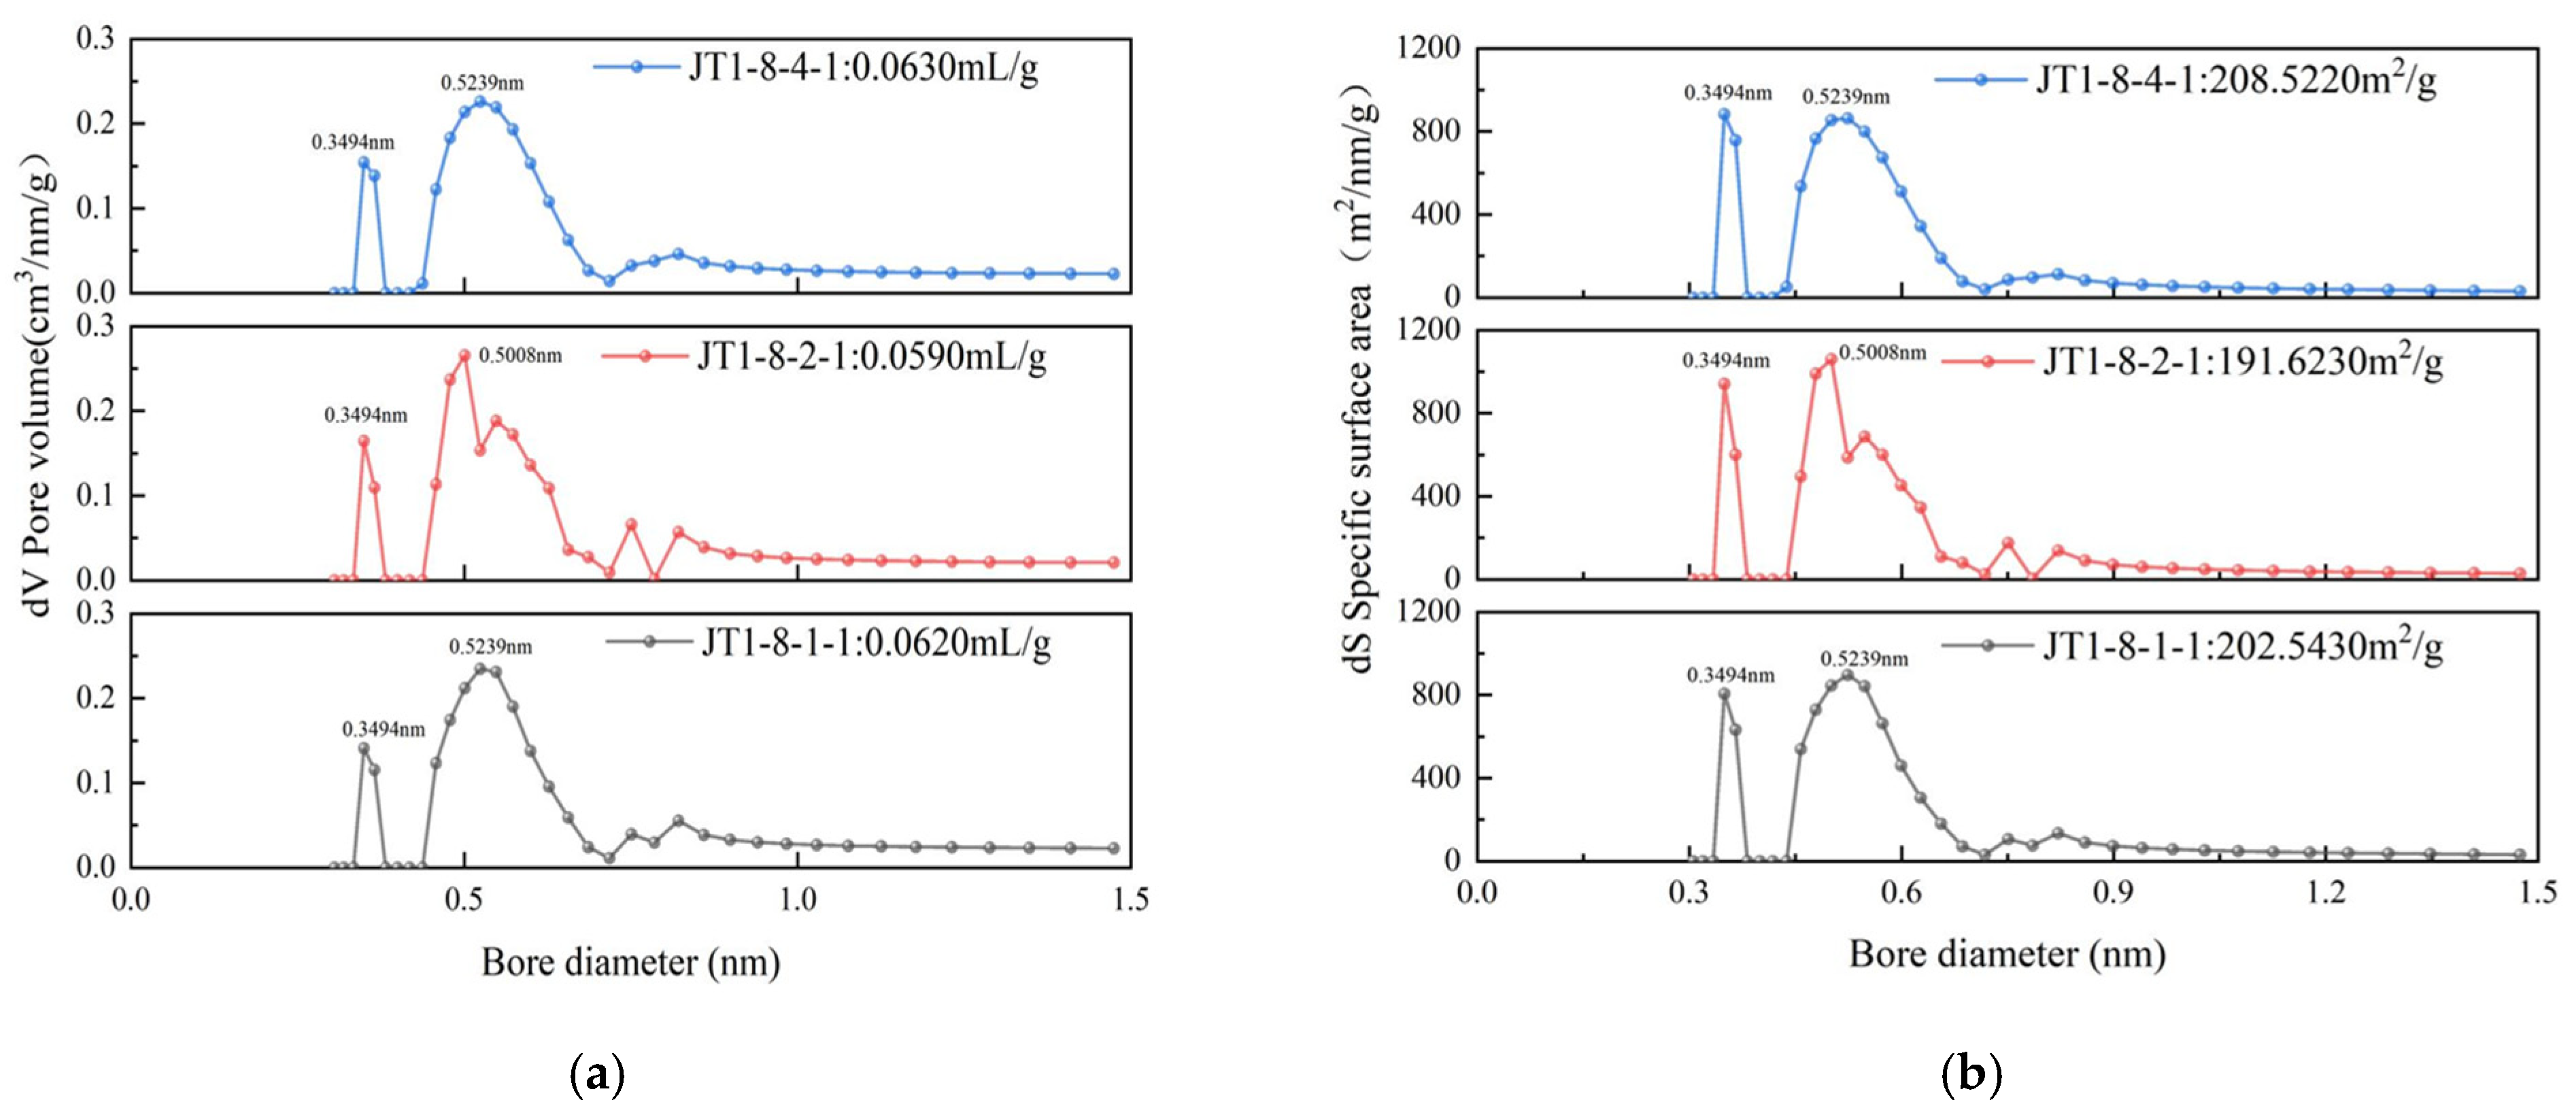
4.4. Pore Distribution Characteristics from Low-Pressure CO2 Adsorption Experiments

While low-temperature N2 adsorption is the optimal method for characterizing mesopores, the accuracy of experimental results for micropores with diameters less than 2 nm still requires improvement. Therefore, leveraging the advantage of CO2 molecules having a smaller diameter [60,61], low-pressure CO2 adsorption is further employed to characterize the micropores smaller than 2 nm in the JT coal samples. Figure 7 shows the isothermal adsorption curves obtained from low-pressure CO2 adsorption experiments for the three coal samples from the JT block. The curves for the three coal samples are similar in shape and trend, with the CO2 adsorption amount steadily increasing with pressure until it reaches the maximum adsorption capacity. According to the IUPAC classification of isothermal adsorption curves, the curves for the JT block coal samples exhibit characteristics of Type I, resembling Langmuir-type adsorption isotherms. This reflects the micropore filling phenomenon in microporous adsorbents such as the coal samples [62]. From Figure 6, it can be observed that sample JT1-8-4-1 exhibits the highest CO2 adsorption capacity, reaching 20.1149 cm3/g, indicating that this sample at a greater depth contains more micropores. In contrast, the CO2 adsorption capacity for JT1-8-1-1 is 18.4377 cm3/g, suggesting a relatively lower micropore content at this depth. Additionally, JT1-8-2-1 has an adsorption capacity of 18.6956 cm3/g, which further indicates that the number of micropores tends to increase with depth in the coal rock.
Based on the low-pressure CO2 adsorption experimental data, the pore volume and specific surface area distribution curves for the three coal samples from the JT block were calculated using the NLDFT model, as shown in Figure 8. The DFT pore volumes are 0.0620, 0.0590, and 0.0630 cm3/g, with an average of 0.0613 cm3/g. The DFT specific surface areas are 202.5430, 191.6230, and 208.5220 m2/g, averaging 200.8960 m2/g, which is significantly higher than the results from the N2 adsorption experiments. Furthermore, the shapes of both distribution curves exhibit a multimodal pattern, with main peaks in the ranges of 0.3–0.35 nm, 0.4–0.6 nm, and 0.7–0.85 nm. The average pore diameters are 0.524, 0.501, and 0.524 nm, indicating a broad distribution of micropores that occupy a significant proportion. From the trend of the distribution curves, it is evident that when the pore diameter exceeds 0.55 nm, both the pore volume and specific surface area distribution curves decrease sharply, and the curves stabilize as they approach 1 nm. This indicates that micropores are relatively well-developed when smaller than 0.5 nm. The specific surface area distribution curve also shows that this pore size range offers a significant specific surface area, providing a greater number of adsorption sites for coalbed methane [63].

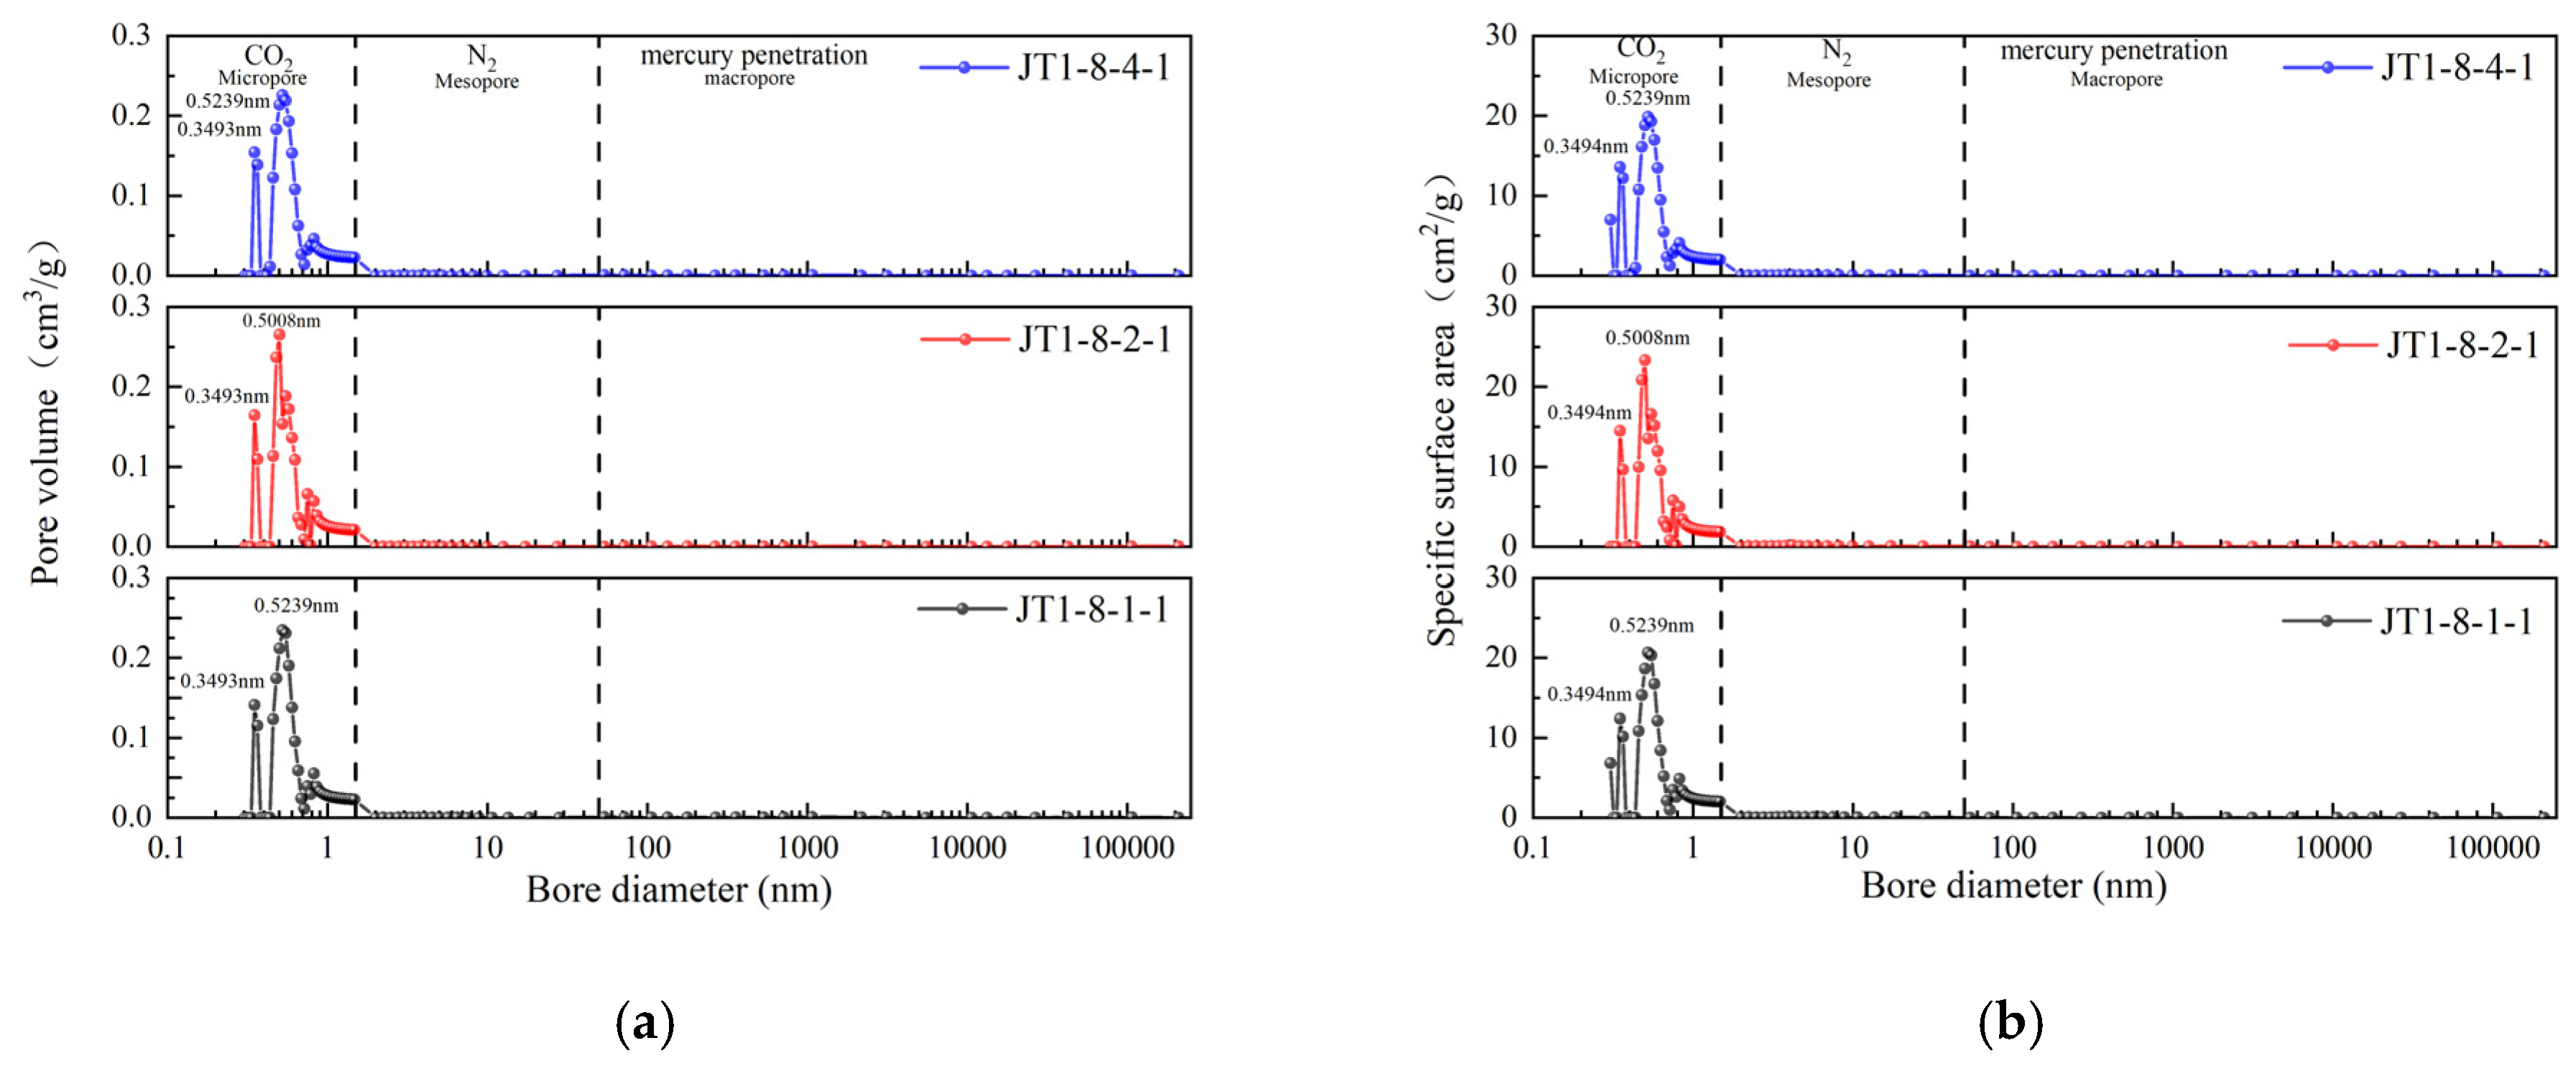
4.5. Pore Distribution Characteristics of Coal Rock Characterized by Multiple Complementary Techniques

Due to the smaller pore sizes and greater heterogeneity of deep coal rocks, as well as the variations in experimental methods, calculation principles, and the reliability of different testing techniques for various pore scales, it is essential to select the optimal pore size ranges for each method for a comprehensive analysis. This approach also takes into account the overlapping ranges of pore sizes measured by the different techniques [51]. For pore sizes greater than 50 nm, high-pressure mercury intrusion data were selected for characterization; for the range of 1.5 to 50 nm, low-temperature N2 adsorption data were used; and for pore sizes smaller than 1.5 nm, low-pressure CO2 adsorption data were applied. Finally, the selected data were concatenated to obtain the pore volume and specific surface area distribution of the JT coal rock based on the three experimental methods, as shown in Figure 9.
In contrast, the coal samples from the Shanxi Formation (4 + 5#) and the Taiyuan Formation (8 + 9#), which also belong to the Ordos Basin, exhibit a more developed average distribution of mesopores greater than 20 nm, along with some larger pores. This comparison reveals that the deep coal rocks have smaller pore sizes and greater heterogeneity, demonstrating significant differences when compared to shallow coal seams [64].

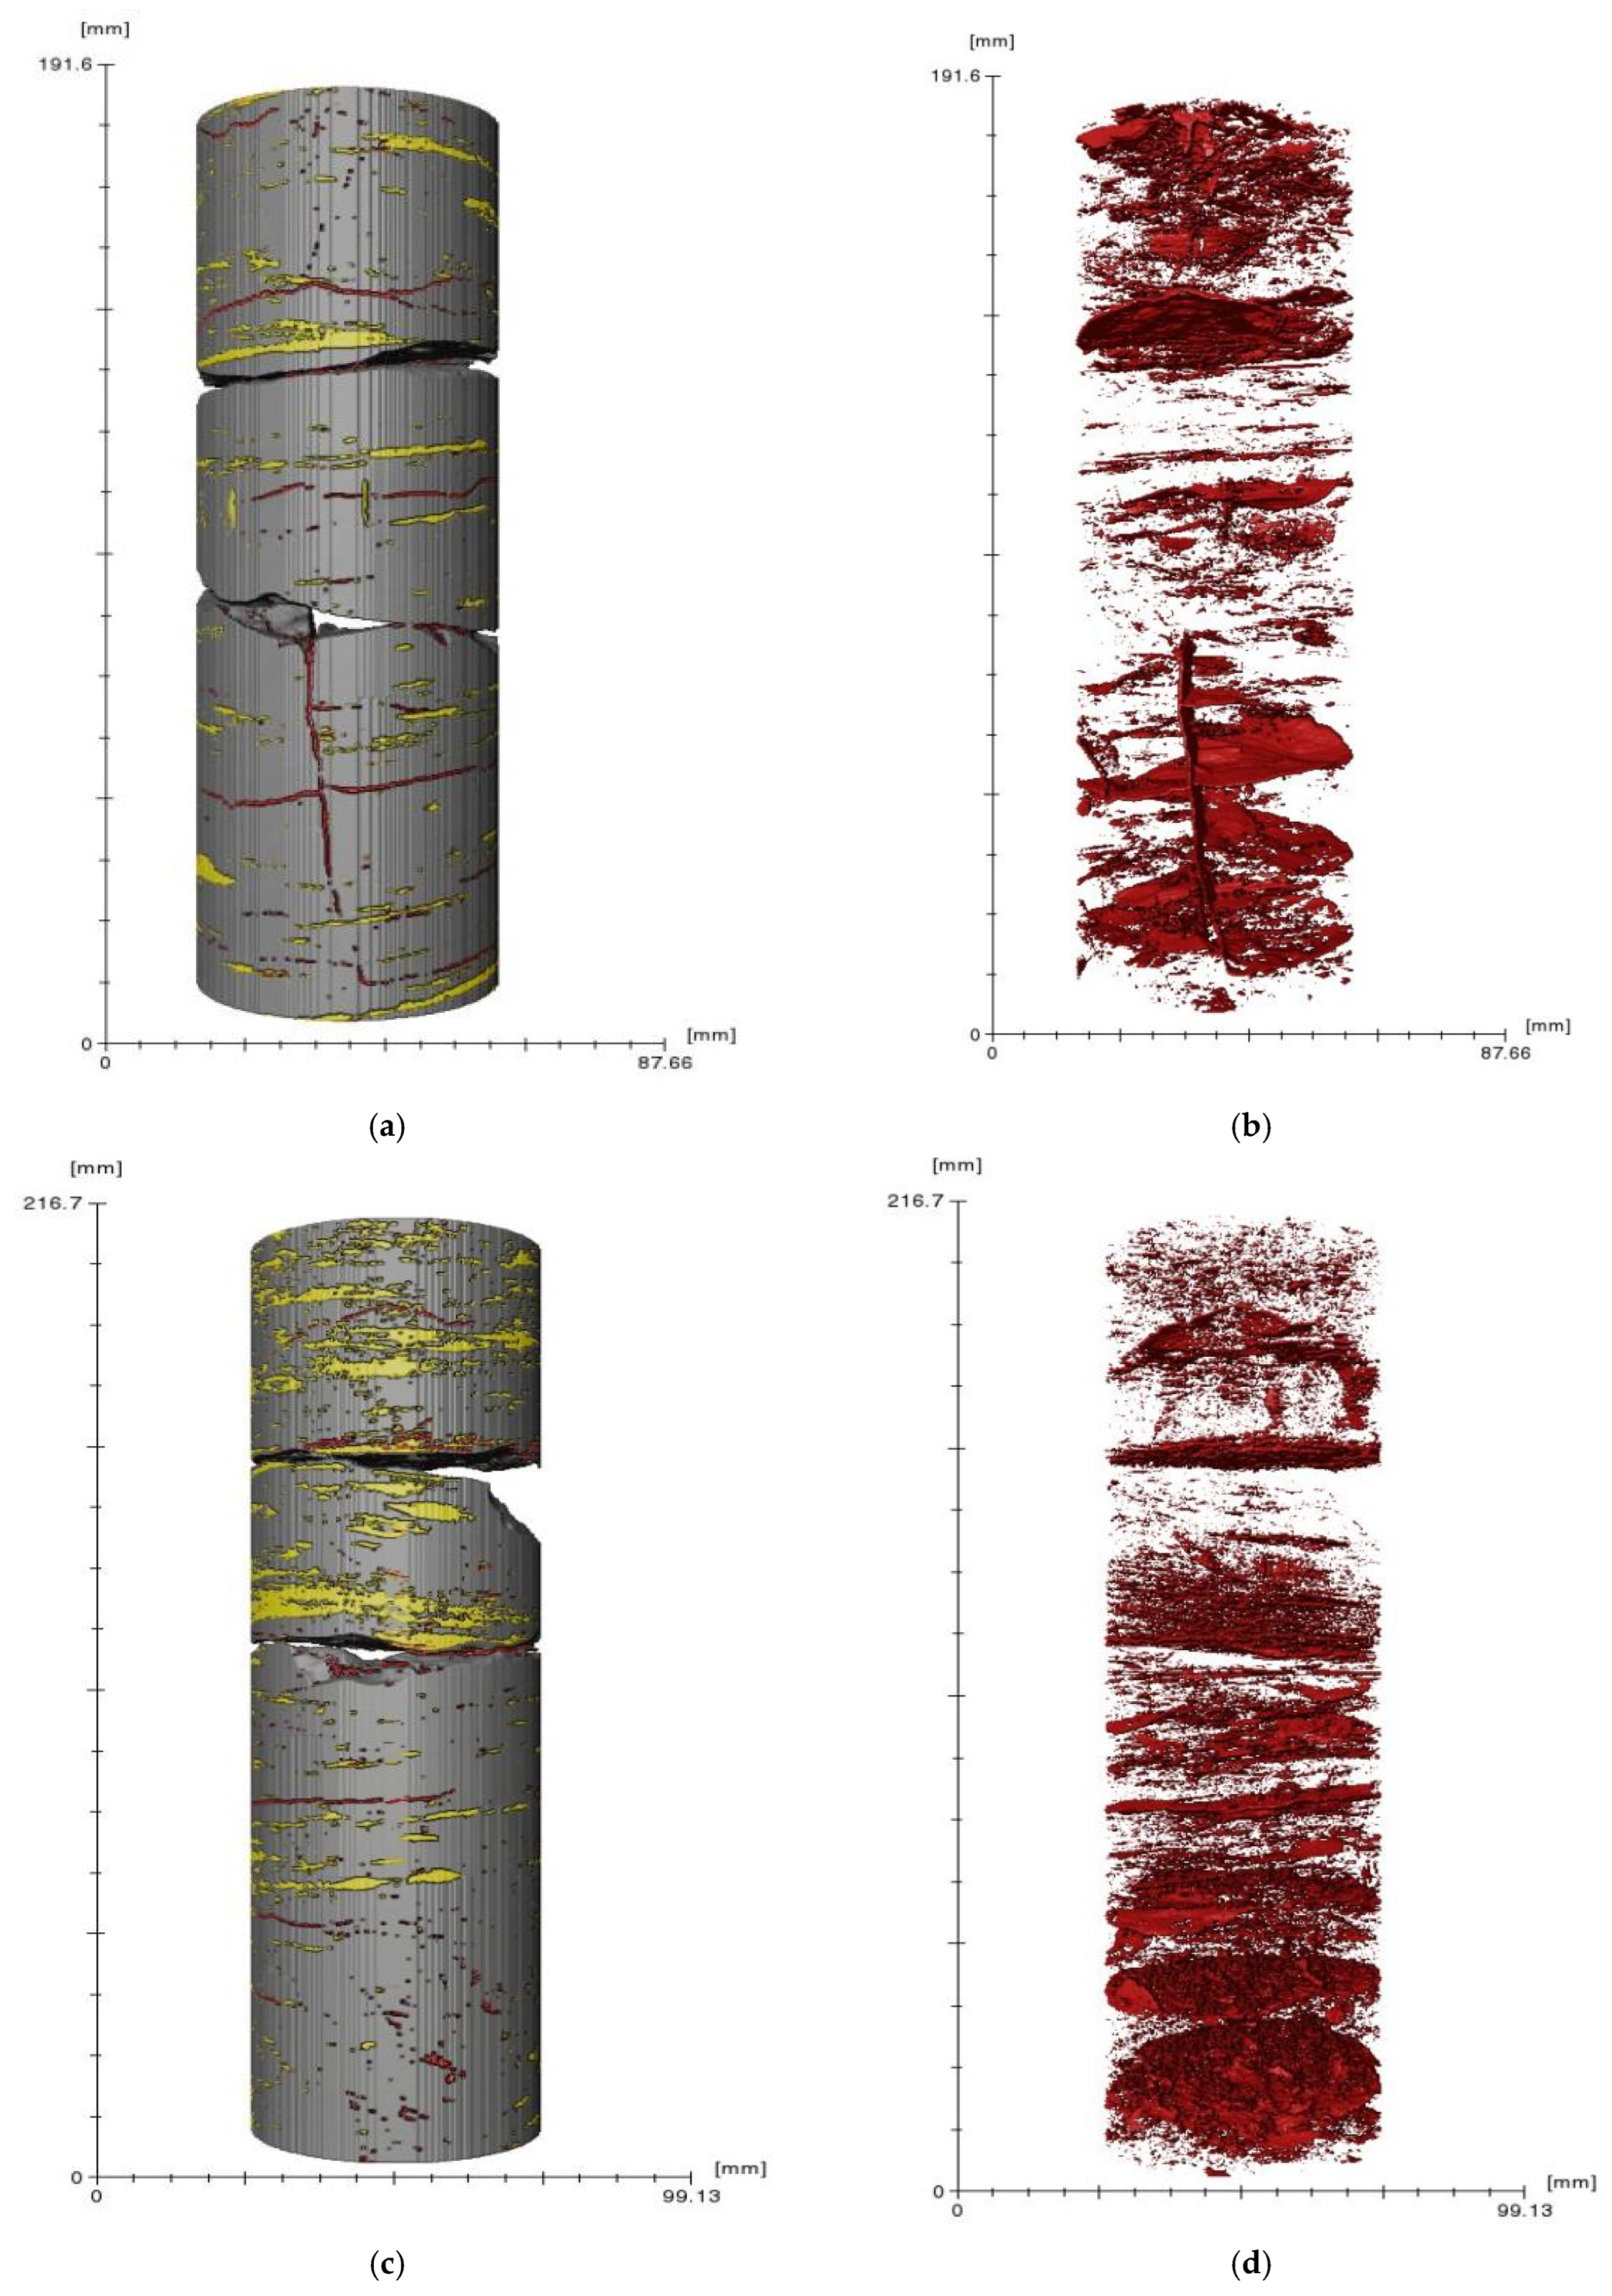
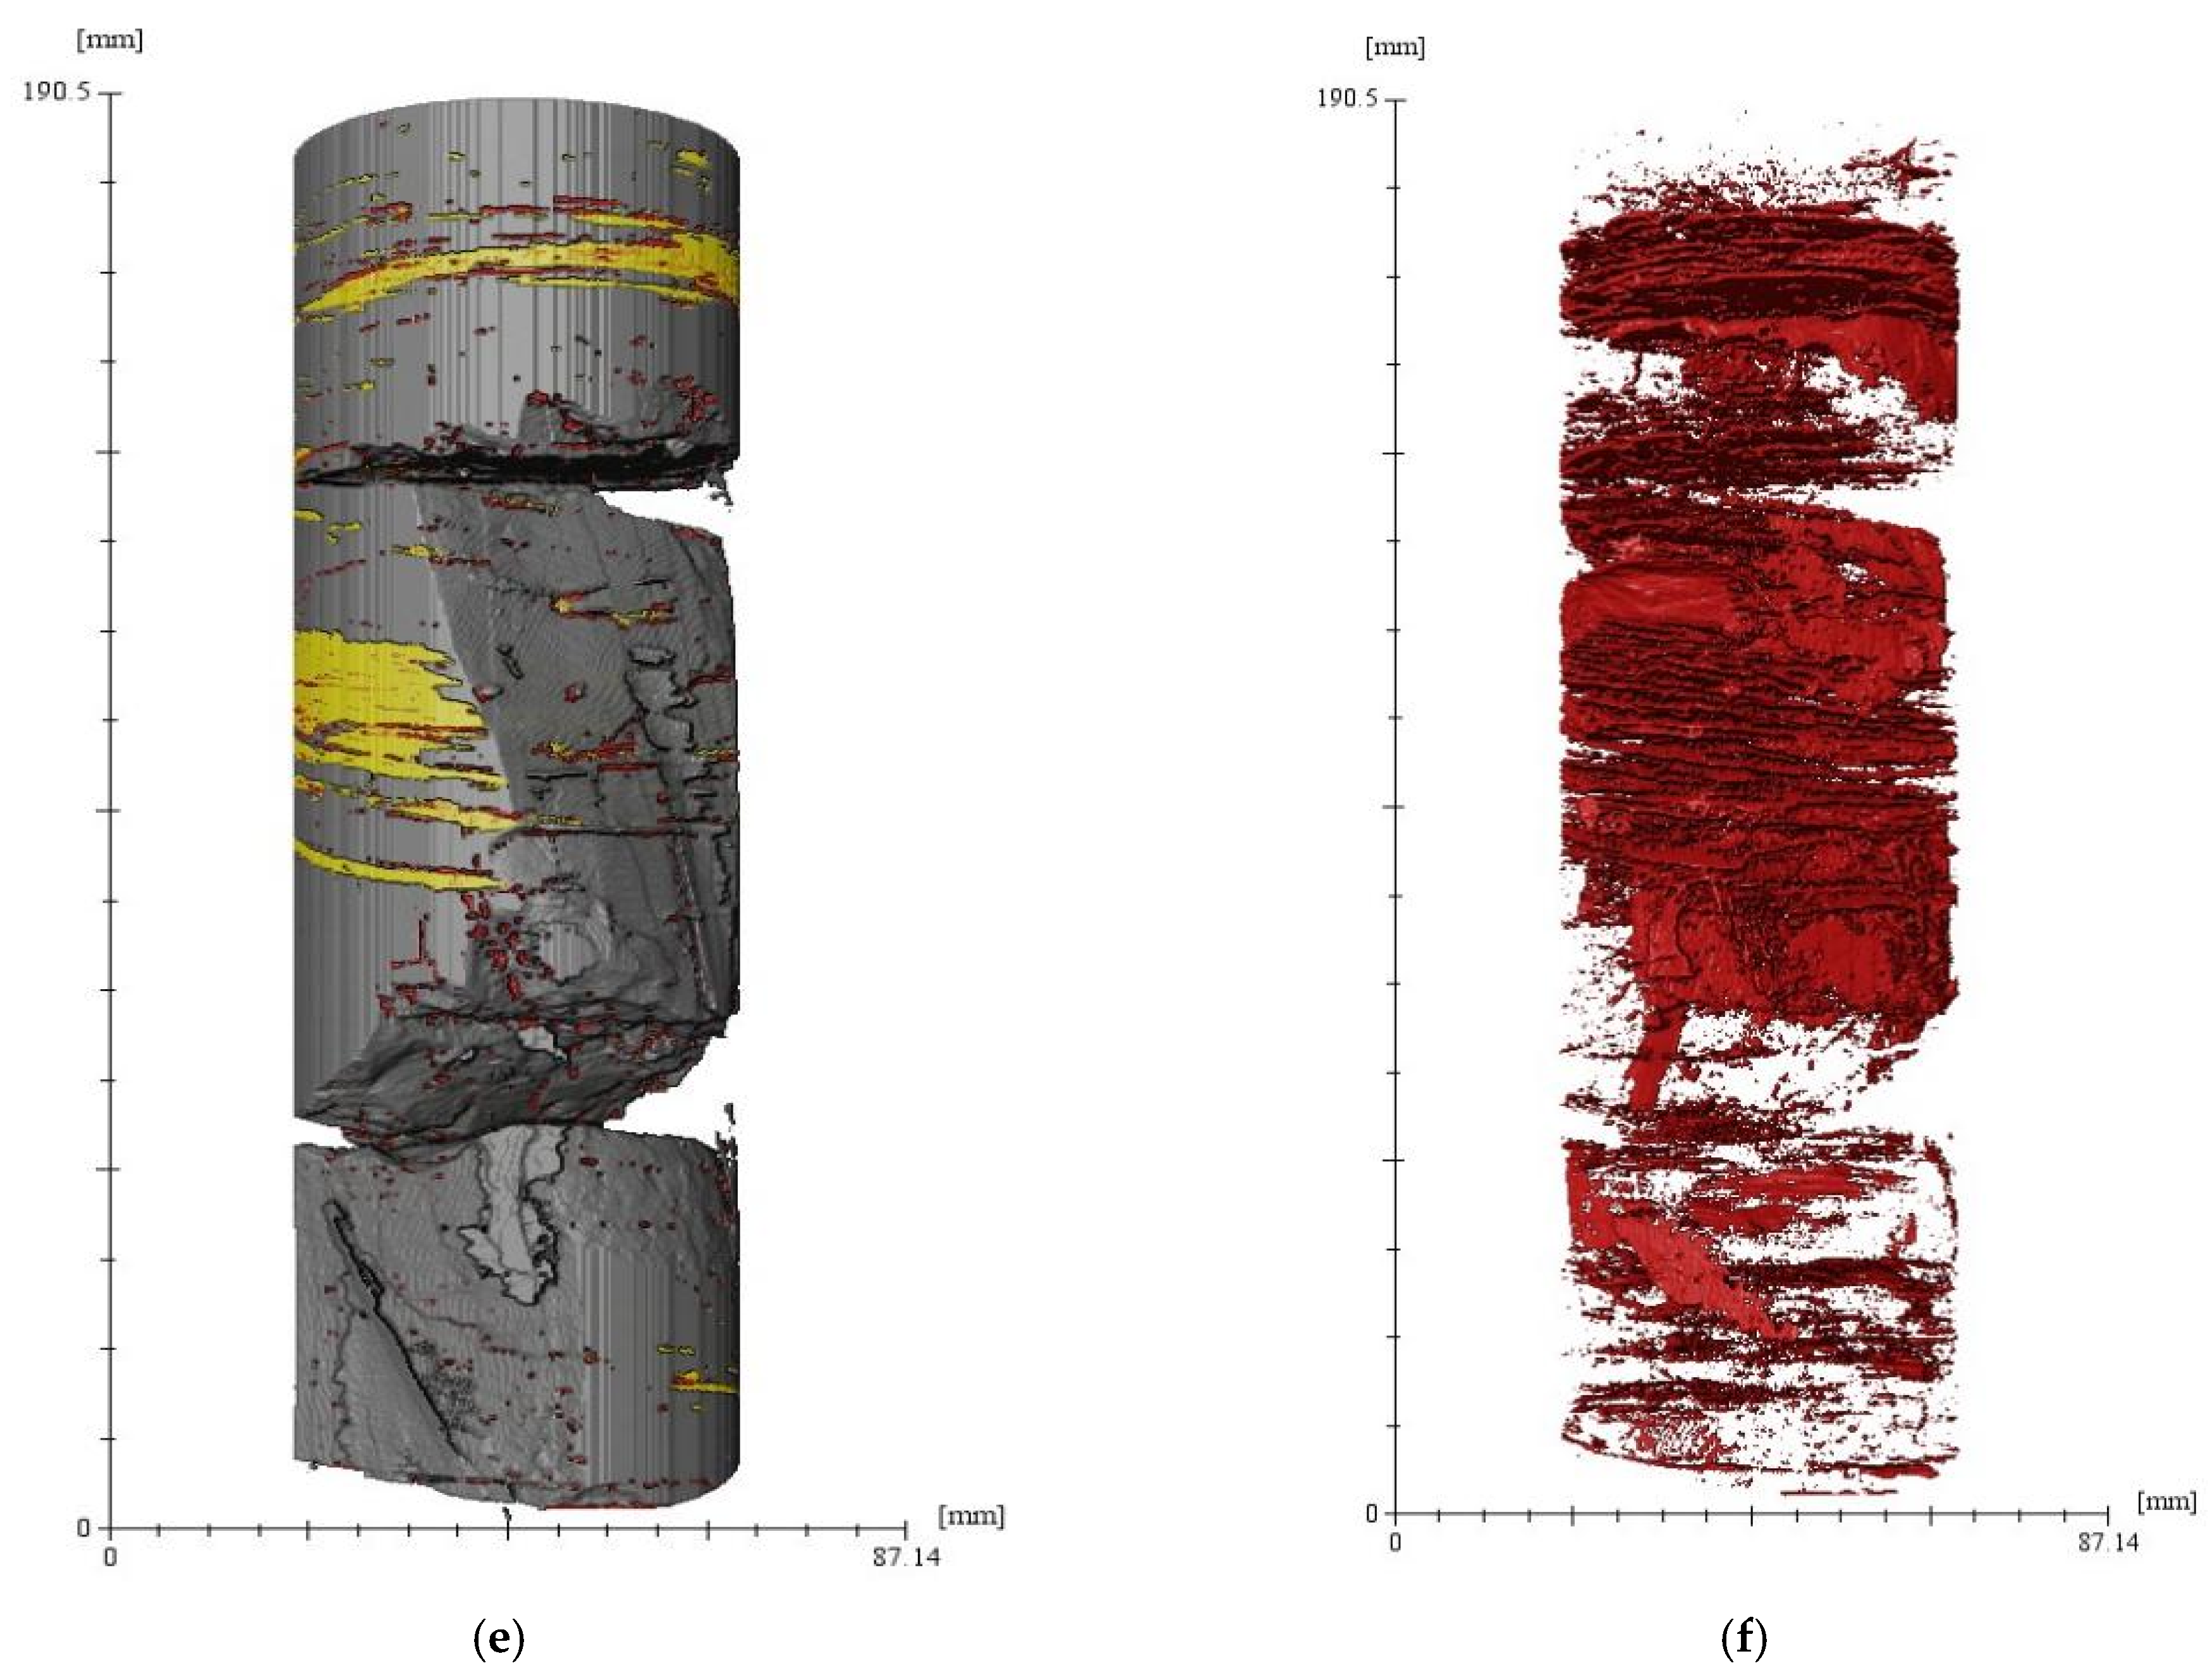
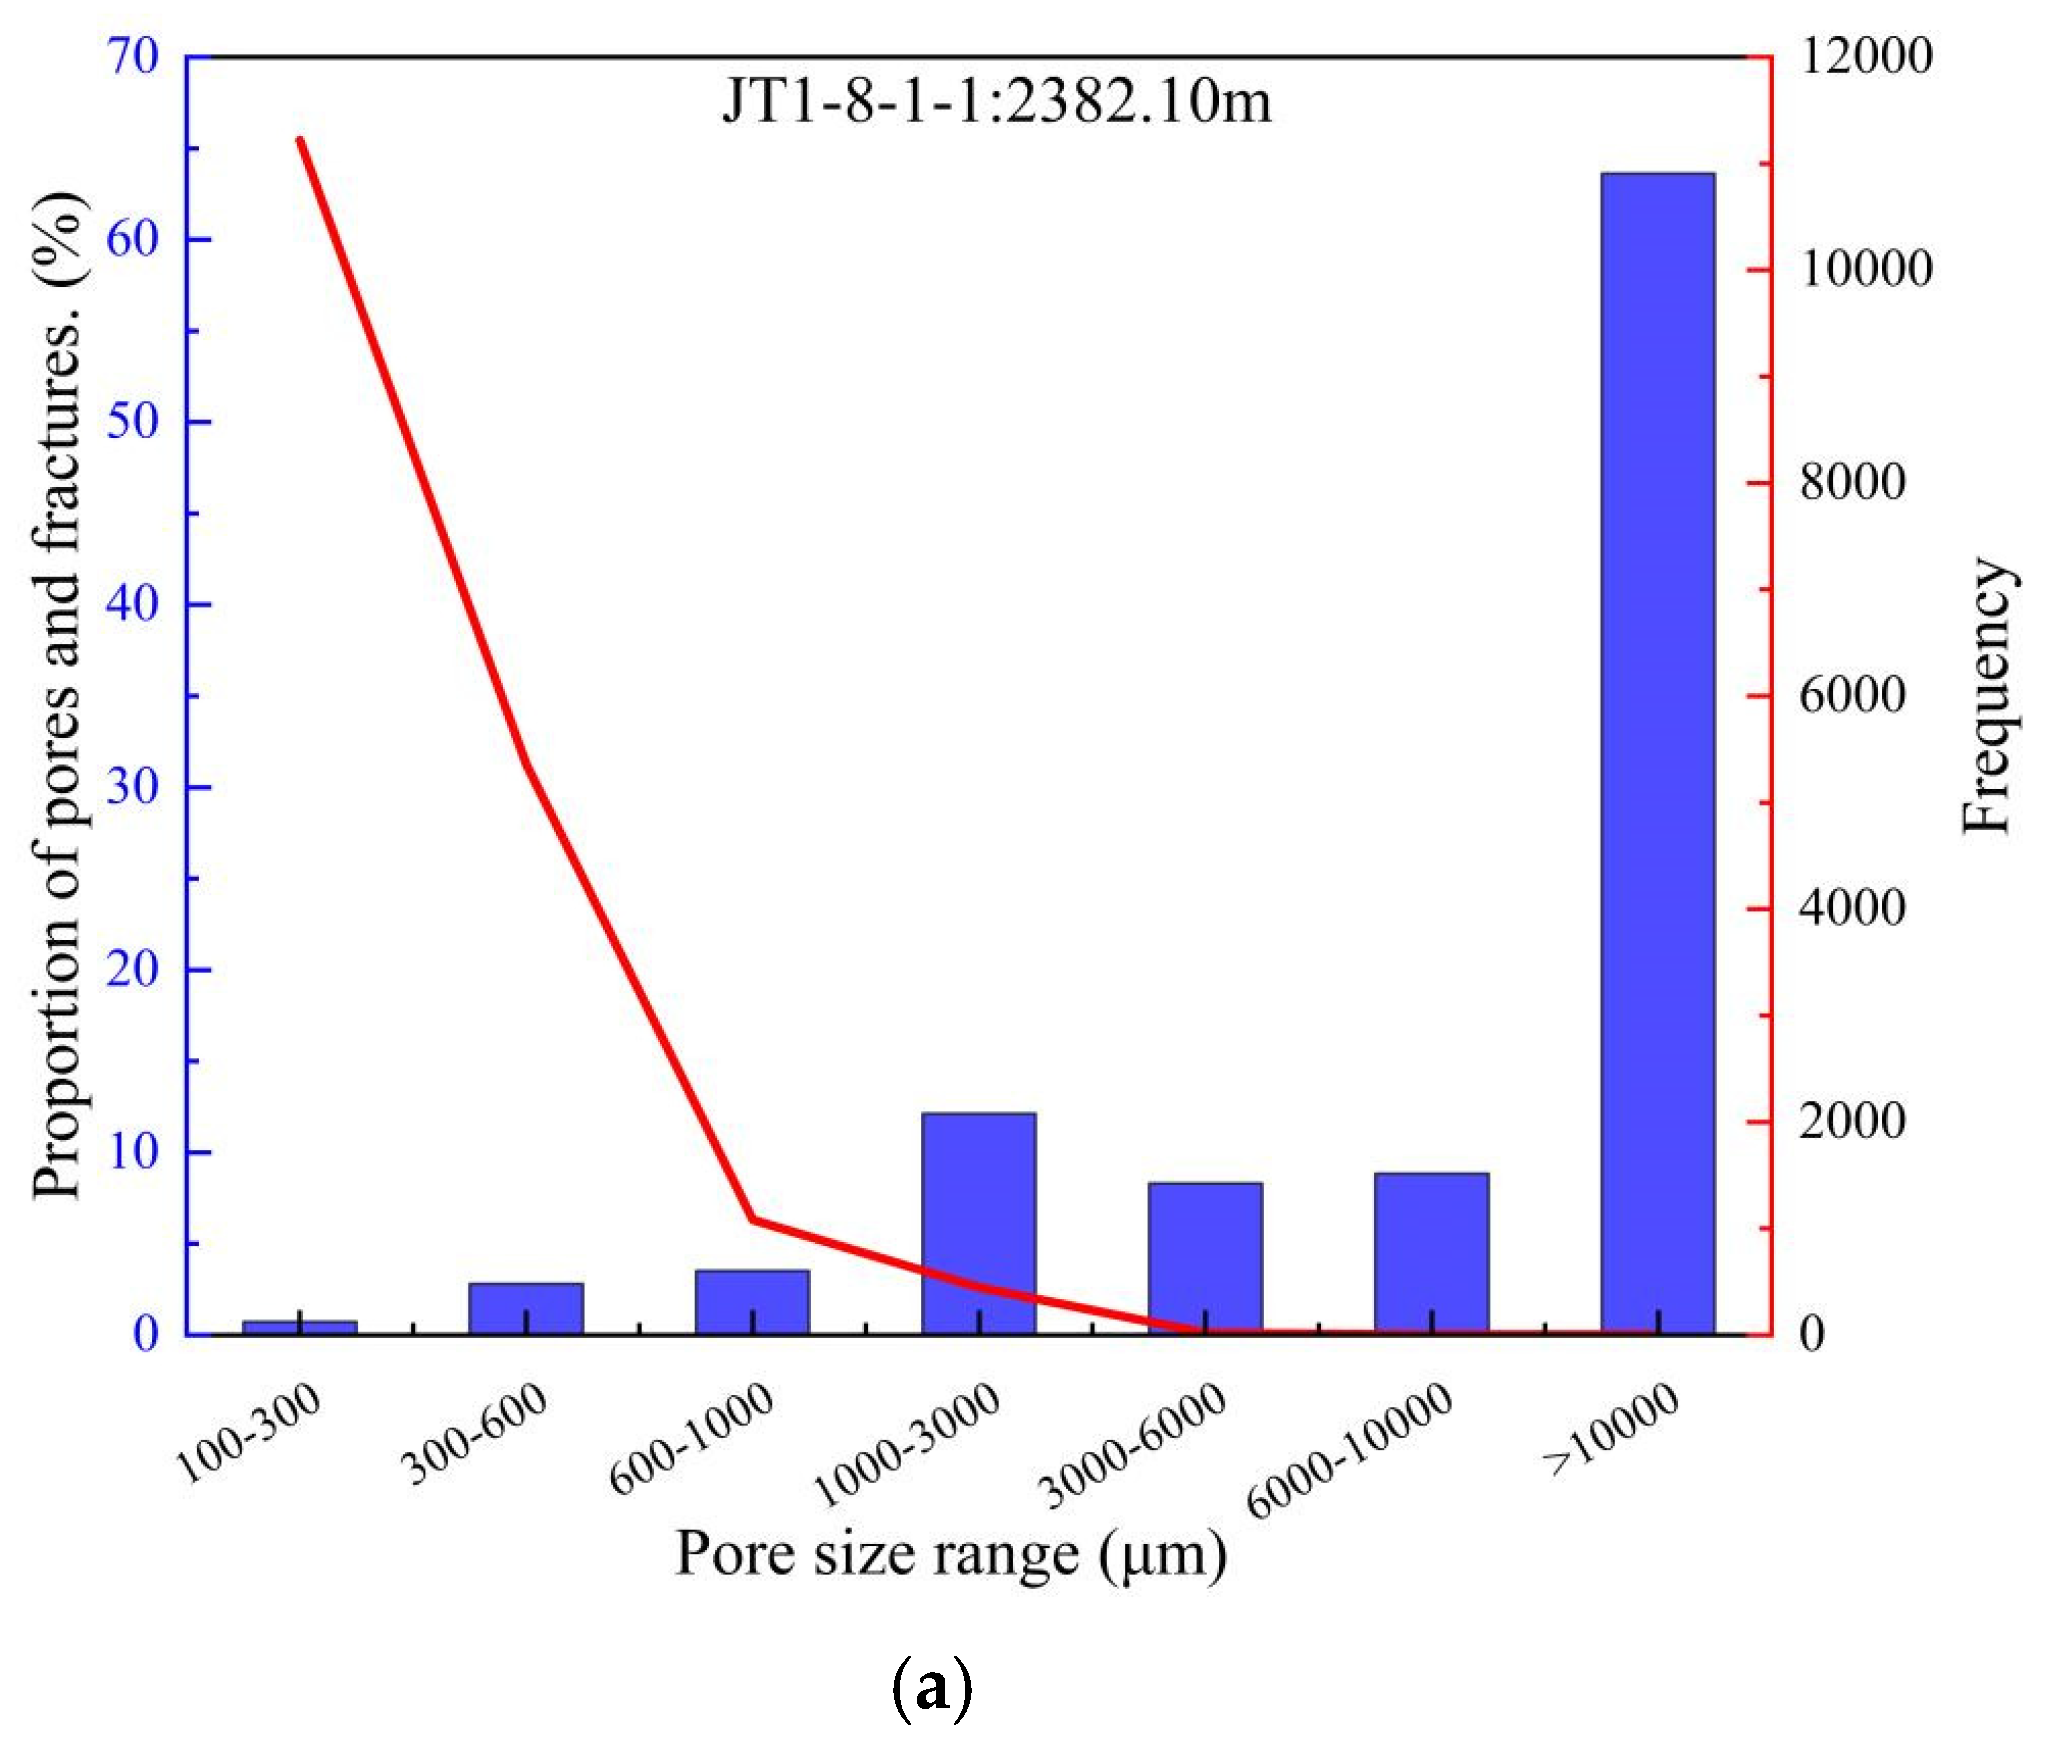
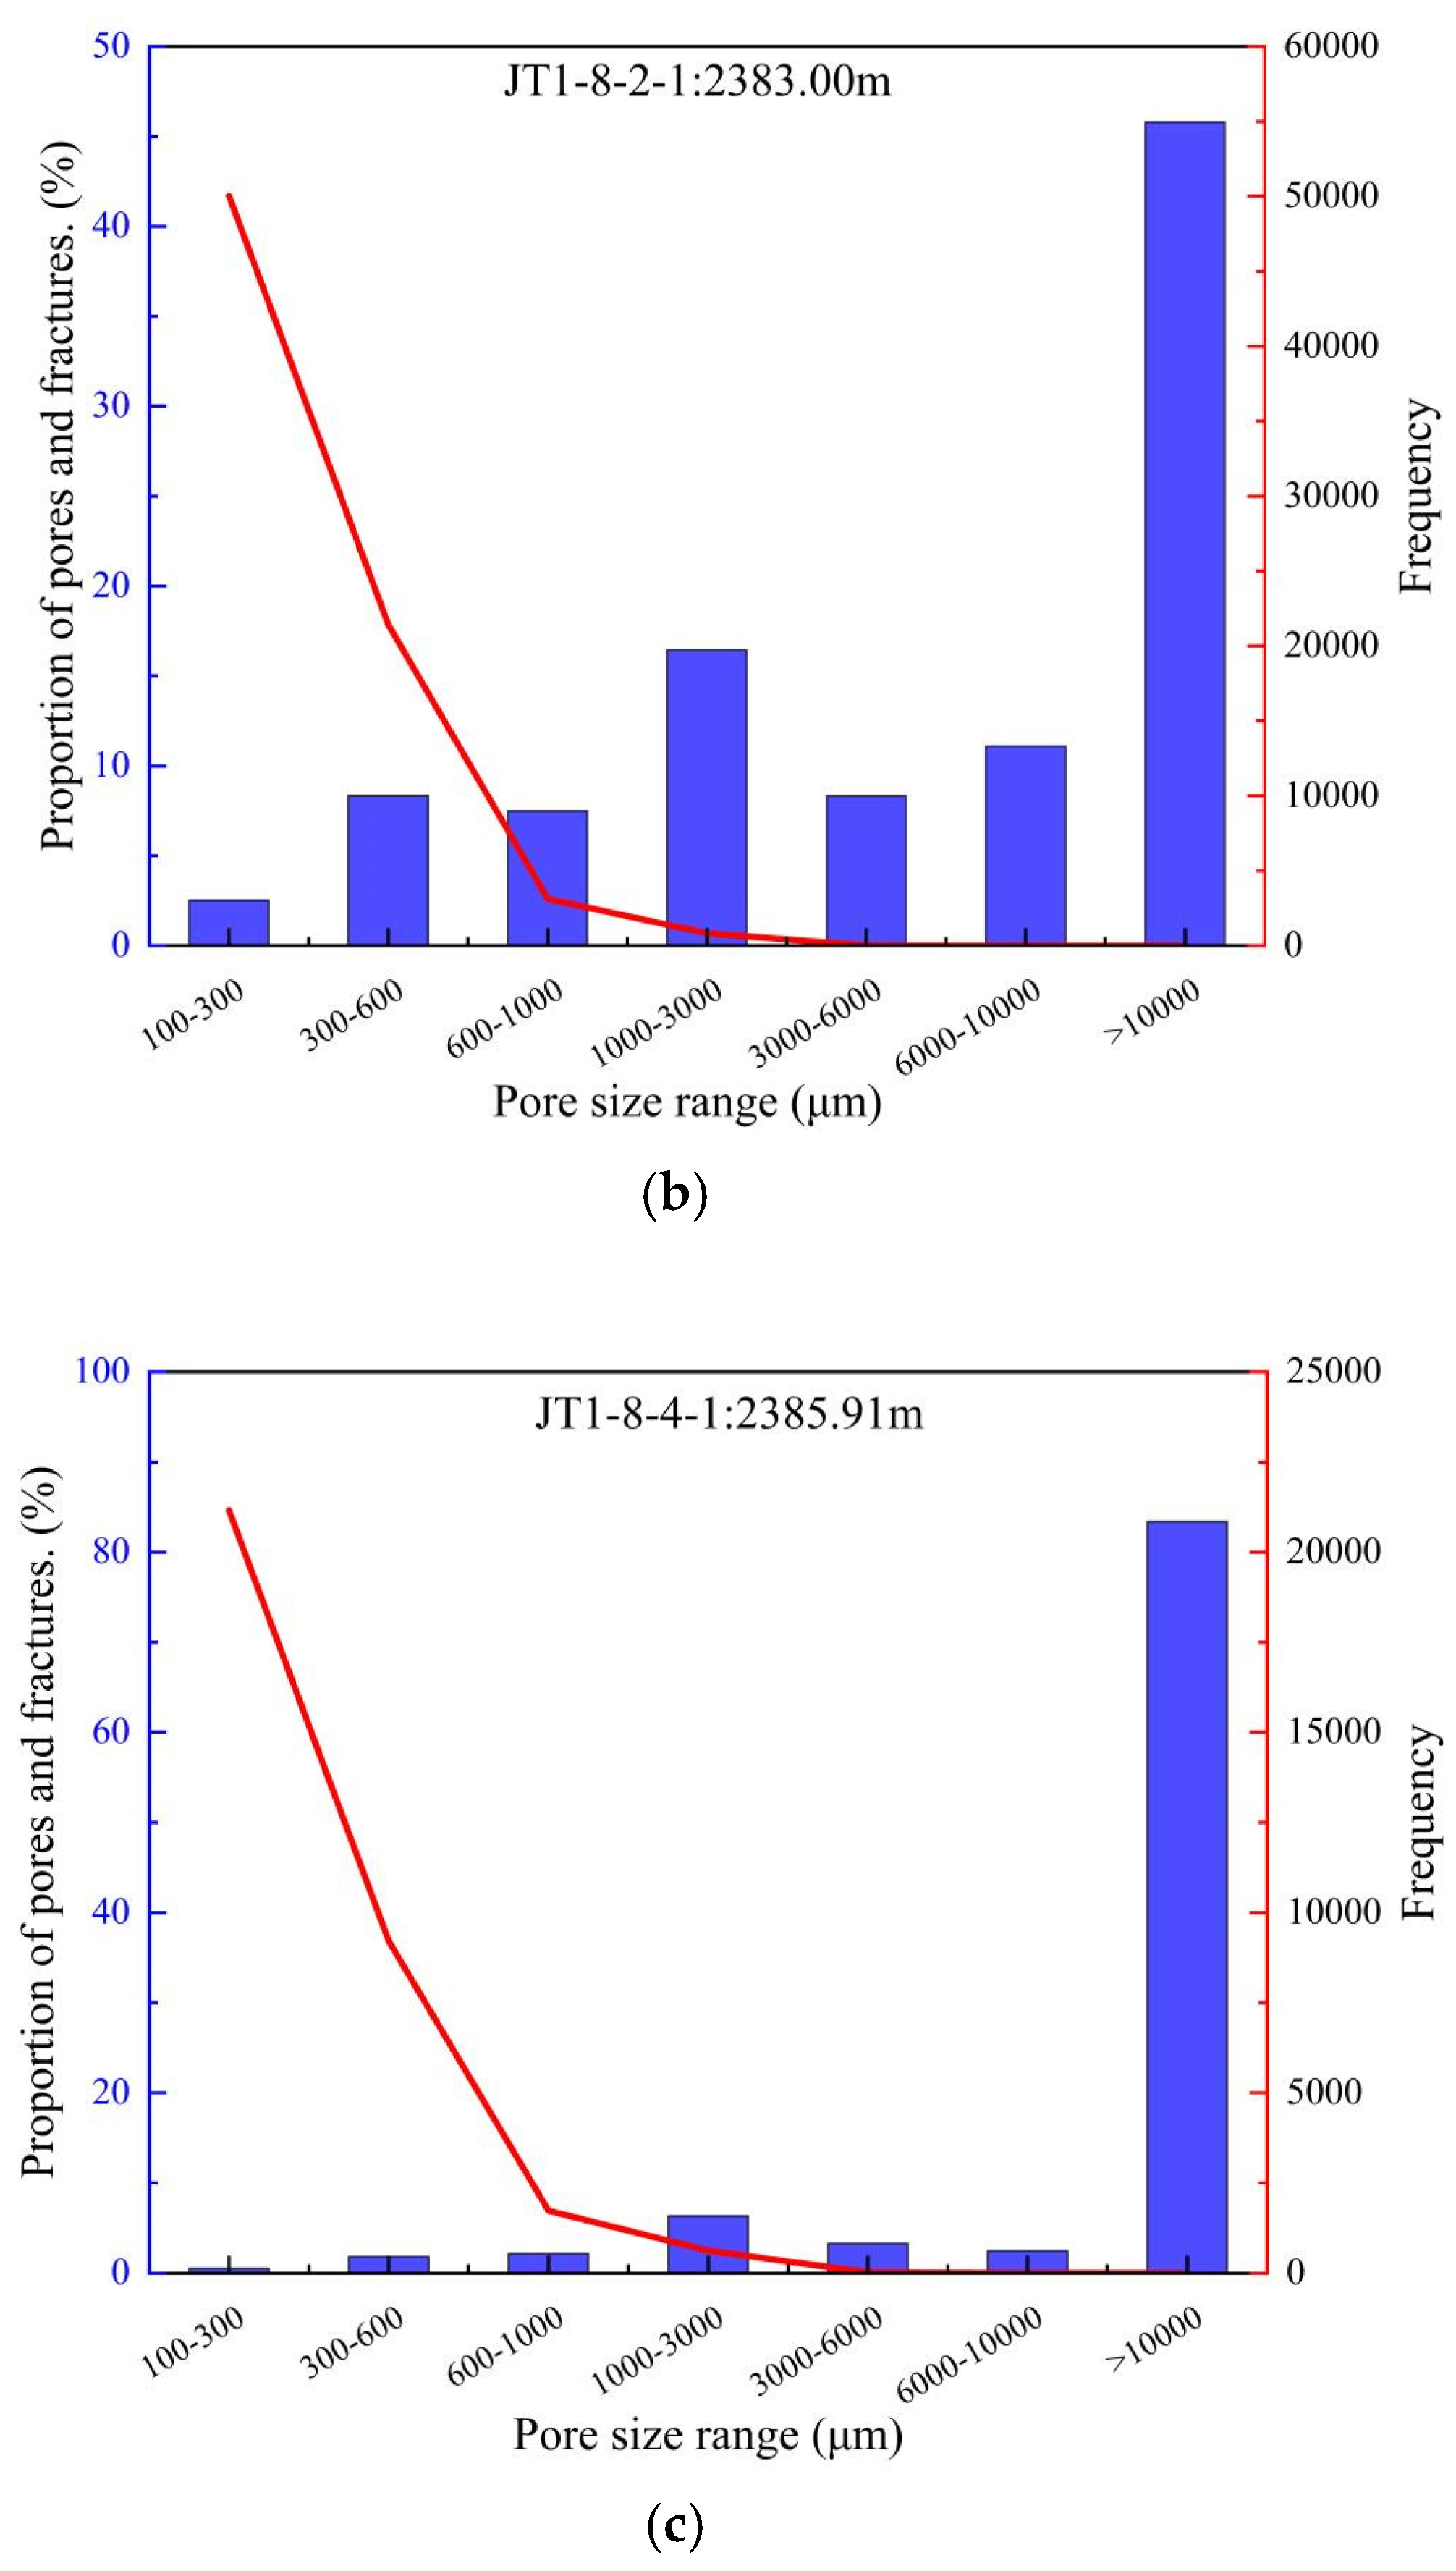
4.6. Pore Distribution Characteristics Based on Micro-CT Experiments

Although the mercury intrusion experiment can characterize pore sizes ranging from 3 nm to 100 μm, the compressibility of coal rock can lead to deformation under excessive intrusion pressure. This deformation may damage larger pores and fractures [65], causing the resulting pore distribution to not accurately reflect the actual pore characteristics. Although multiple methods have been employed to characterize the pores in coal rock, further techniques are needed to accurately describe larger features such as microfractures. According to previous studies [66,67], micro-CT technology, with its unique advantages of rapid and non-destructive imaging, can precisely depict the larger flow pores in coal rock. Therefore, micro-CT is utilized to characterize the larger pores and fractures.
In this experiment, micro-CT was utilized to identify three distinct components in the coal: pore fractures, mineral matter, and coal matrix. These components were superimposed to create a three-dimensional pore fracture structure model, as shown in Figure 10 [68]. The large-scale microfractures in the three JT coal samples form a fracture system within the coal reservoir, while a significant number of nanoscale pore systems also develop internally. As seen in Figure 10 (right), these pores are widely distributed, exhibiting polygonal and irregular shapes, with some relatively concentrated pore fractures existing in a lamellar form. This configuration facilitates good connectivity to the free gas residing in the same layer. Overall, the JT coal samples demonstrate excellent connectivity in three-dimensional space, where microfractures and nanoscale pores interconnect, forming a complex network structure that constitutes a dual porosity system within the coal [69]. Based on the micro-CT scanning and three-dimensional reconstruction, the pore and fracture volumes of the three coal samples are 7.2, 9.3, and 18.7 cm3, accounting for 2.6%, 3.0%, and 7.2% of their respective total components. By using the true density, length, diameter, and other data of each coal sample, as shown in Table 2, the mass of the tested coal samples is calculated, resulting in pore volumes of 0.0104, 0.0118, and 0.0274 cm3/g for the three samples. Notably, JT1-8-4-1 has the largest pore volume, while JT1-8-1-1 has the smallest proportion. This indicates that, at greater depths, the microfracture proportion increases significantly due to tectonic effects.
Figure 11 illustrates the distribution of pore volume fraction and frequency across different pore size ranges for the three JT coal samples. The histogram of pore size distribution indicates that the JT coal samples predominantly develop microfractures larger than 10,000 μm, with volume fractions exceeding 60%, 40%, and 80%, respectively. The frequency distribution reveals that the overall frequency of pores and fractures in the coal primarily falls within the 100–300 μm range. Overall, the coal exhibits a well-developed internal network of pores and fractures.

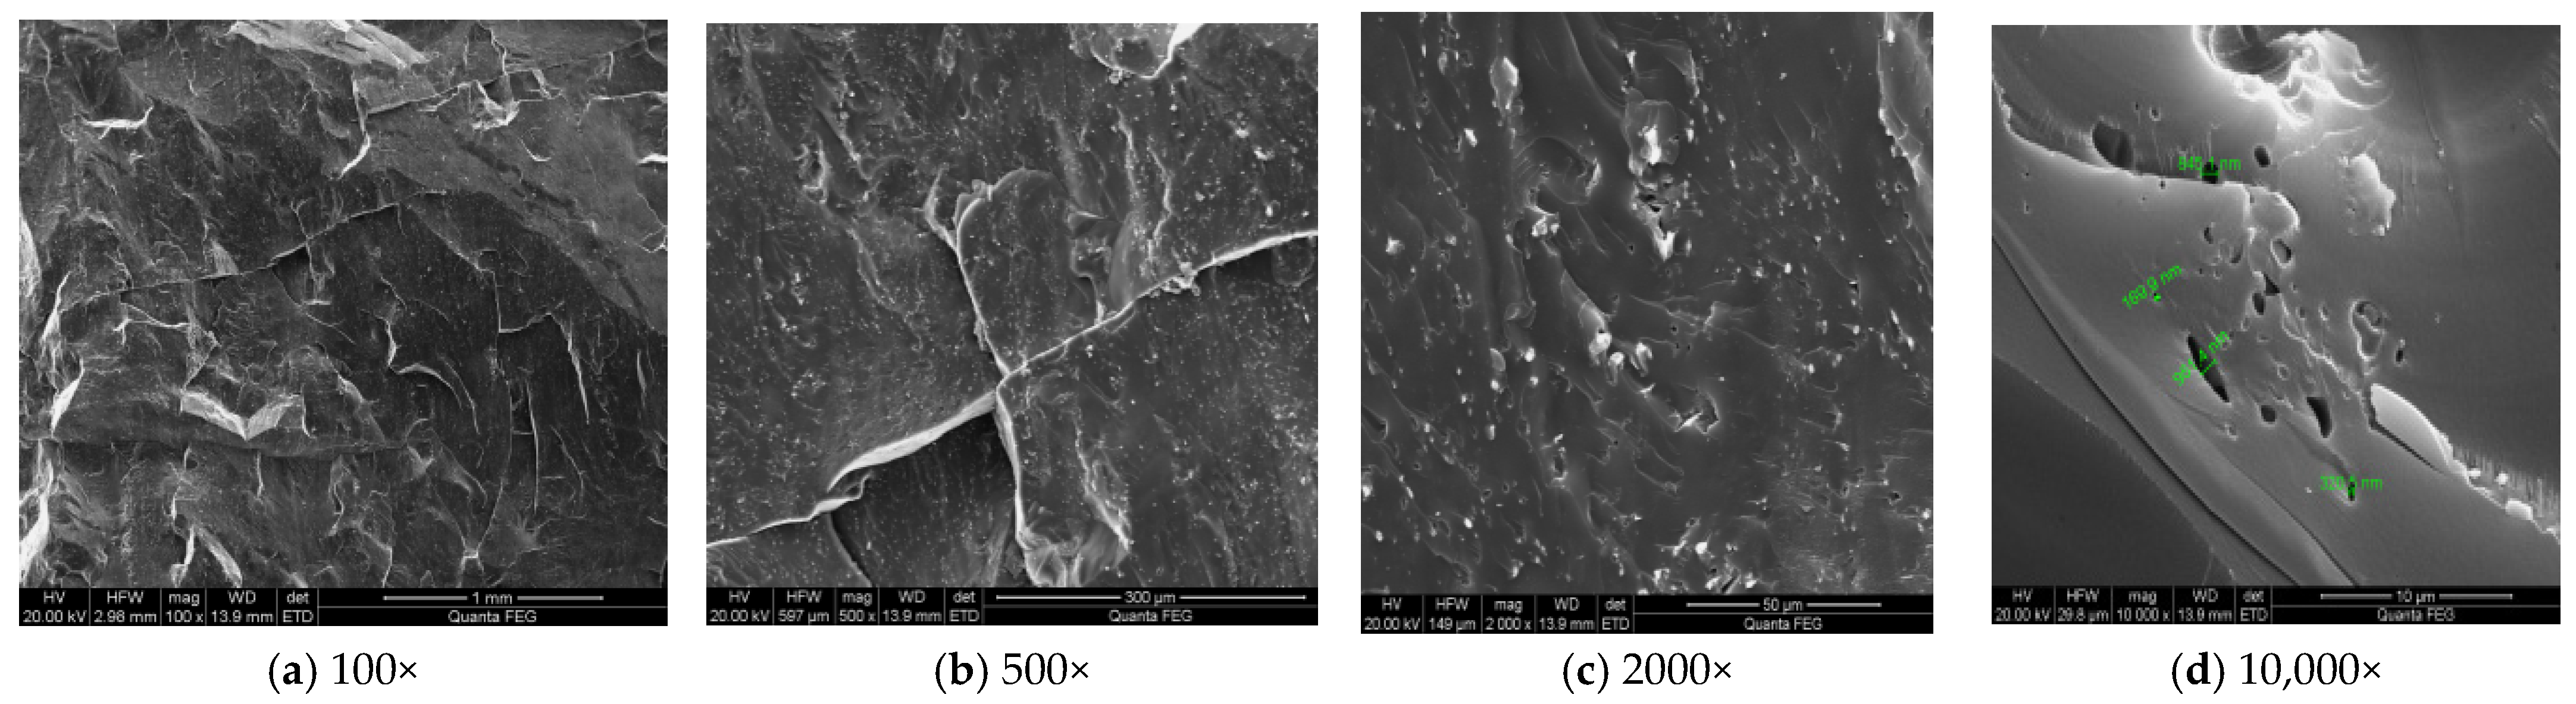
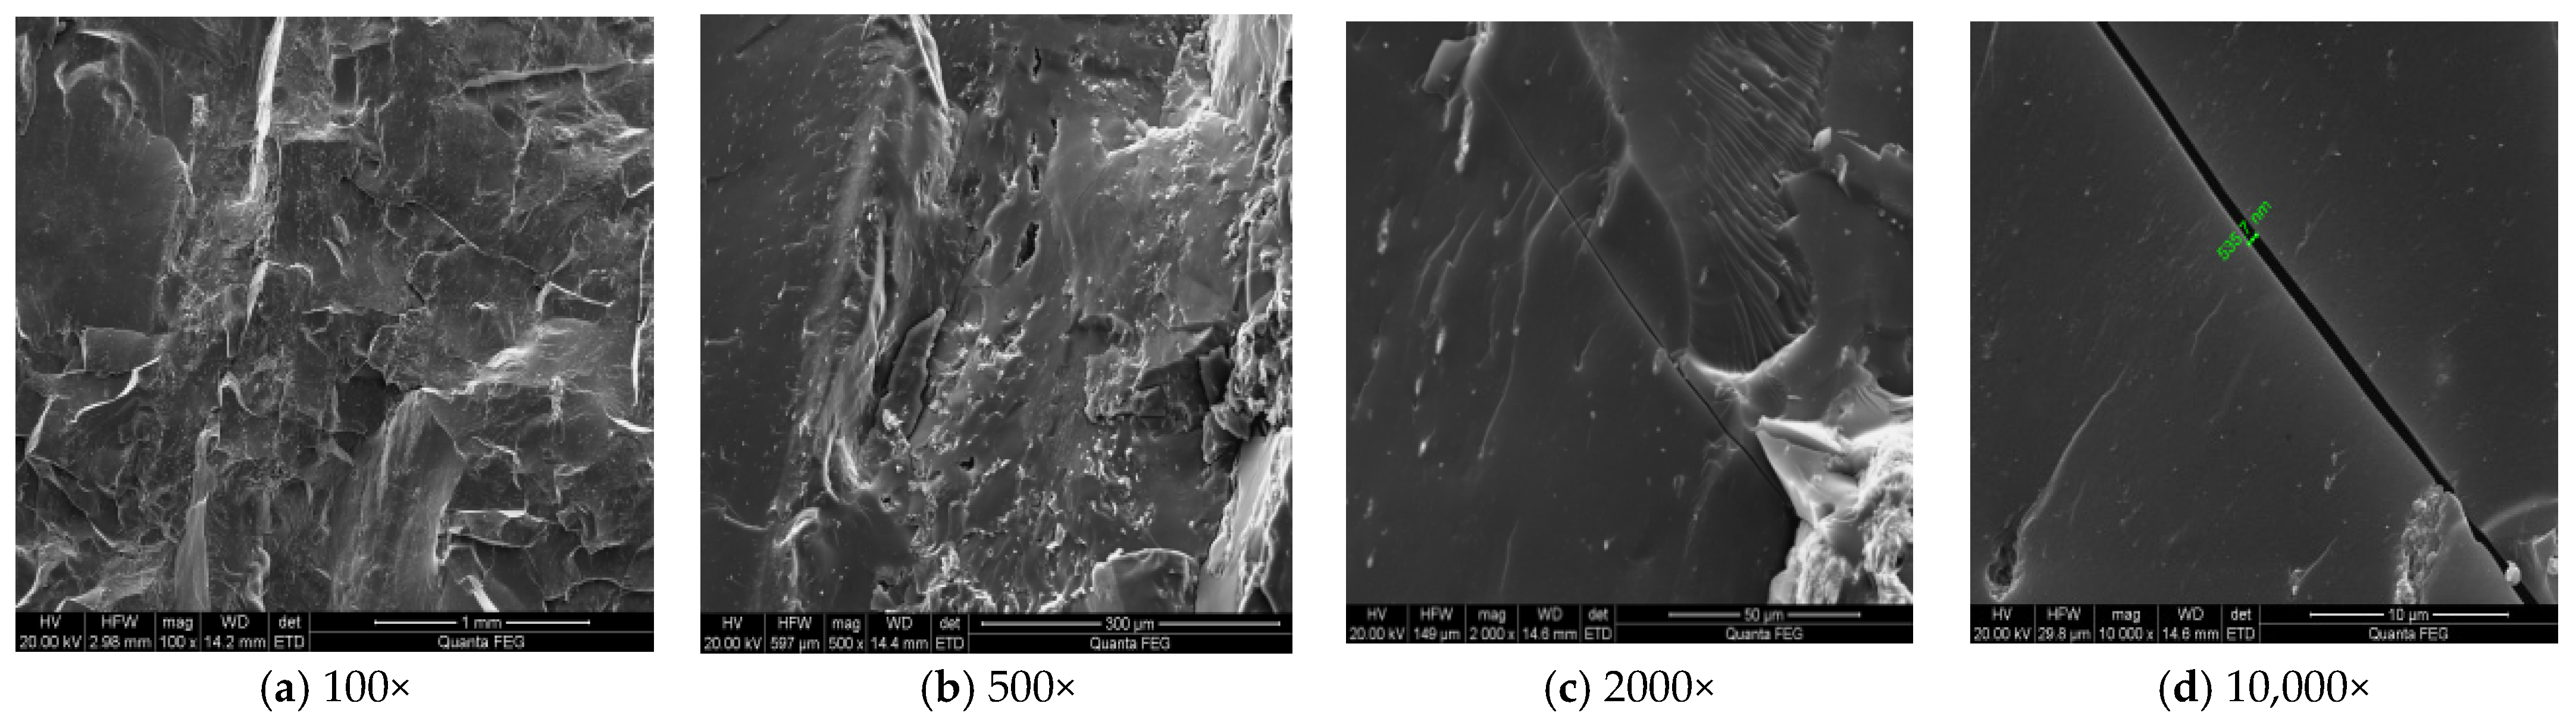
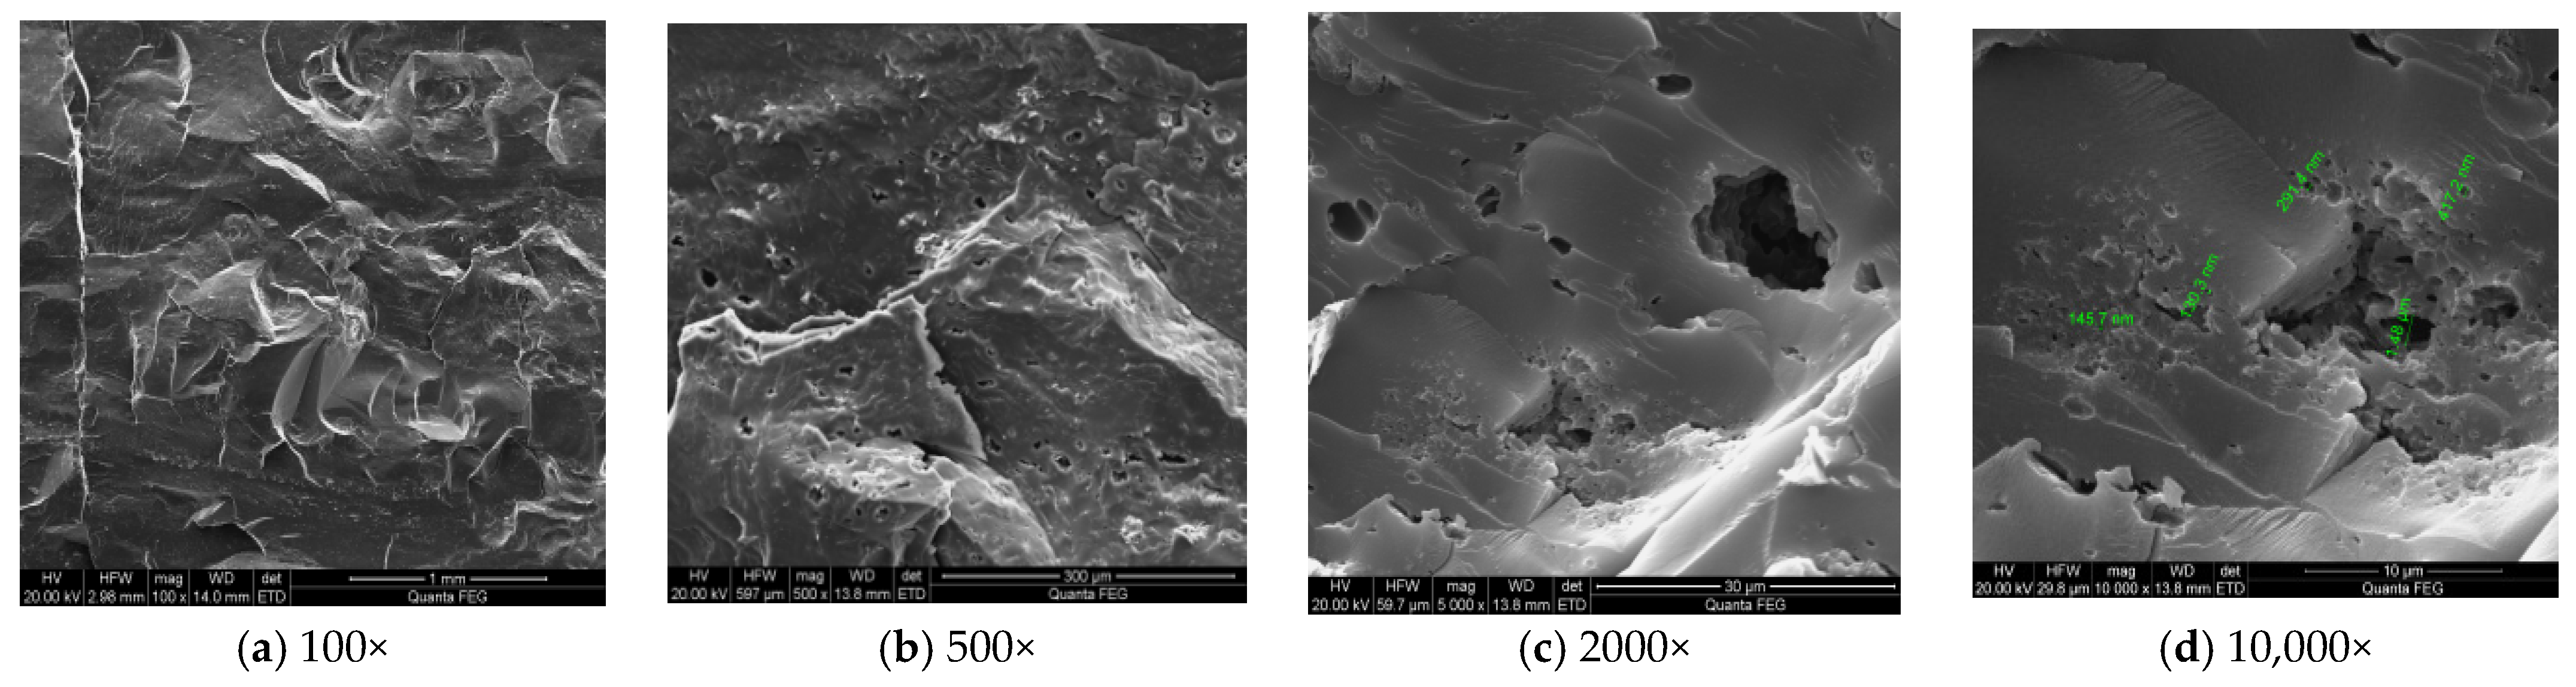
4.7. Pore Distribution Characteristics Based on SEM Experiments

Figure 12 presents the SEM images of JT1-8-1-1 at various magnifications. At 100× magnification, the micro-components of the coal sample are predominantly vitrinite, with faint layering visible, including vertical static pressure fractures, oblique layering fractures, short fissures, and other fractures. At 500× magnification, the matrix vitrinite and its fractures are clearly visible. At 2000× magnification, encapsulated minerals (such as kaolinite) and primary pores can be observed. At 10,000× magnification, a small number of gas pores ranging from 150 nm to 850 nm are present, although their development is relatively low.
Figure 13 illustrates the SEM images of JT1-8-2-1 at various magnifications. At 100× magnification, distinct layering of the coal sample is observed, predominantly featuring vitrinites, with visible layering including interlayer cracks with parallel stratification, vertical static pressure cracks, oblique stratification cracks, and short fissures. At 500× magnification, homogeneous vitrinites and matrix vitrinites, along with fissures and primary pores, are clearly visible. At 2000× magnification, developed cracks and shell-like fractures can be observed. At 10,000× magnification, cracks approximately 550 nm in size are identified. With increasing burial depth, the diagenetic processes under high temperature and pressure lead to the transformation of kaolinite to clay minerals, and at 2000× magnification, the observed nodular structures correspond to clay minerals and a small amount of kaolinite.
Figure 14 presents the SEM images of sample JT1-8-4-1 at various magnifications. At 100× magnification, the different components of the coal sample are layered, showing visible stratification with vertical stress fractures, oblique fractures, and short fissures. At 500×, well-developed pores and fractures are visible. At 2000×, irregular pores and primary fractures can be observed, along with secondary minerals such as mirabilite and inorganic salts. At 10,000×, pore sizes range from 130 nm to 420 nm.
Overall, the deep coal rocks exhibit various types of pores and fractures, including static pressure fractures, interlayer fractures, short cracks, occasional gas pores, and other primary fissures, although their development is relatively limited.

4.8. Characteristics of Methane Isothermal Adsorption

Figure 15 illustrates the isothermal adsorption lines at different depths, plotted according to the Langmuir equation. Based on Langmuir theory, the surface of the coal sample is considered to have uniform energy, and methane molecules are assumed to cover the surface of the coal in a monolayer adsorption form. The amount of methane adsorption is dependent on the specific surface area of the coal rock [70,71]. The isothermal adsorption experiments yielded Langmuir volumes of 23.821, 22.278, and 21.087 m3/t, with corresponding Langmuir pressures of 3.50, 3.55, and 3.77 MPa. Notably, JT1-8-1-1 exhibited the highest Langmuir volume, indicating that its micropores provide more adsorption sites for methane molecules. As depth increases, the Langmuir volume of JT1-8-4-1 decreases while the Langmuir pressure increases, suggesting greater compaction within the coal rock. This densification is attributed to the multiple tectonic movements, mechanical compaction, and dehydration effects experienced by the Benxi Formation in the Ordos Basin, which lead to a reduction in the size of the primary pores within the coal [72].

5. Discussion

In DCBM development, the pore structure of coal reservoirs fundamentally determines the methane occurrence mode, seepage pathways, and the effectiveness of hydraulic stimulation. Due to prolonged exposure to high temperature, high pressure, and tectonic stress, deep coal seams typically develop complex pore–fracture systems, making it difficult for a single technique to comprehensively characterize their microstructural features. To address this, the present study employs a suite of complementary techniques—including low-temperature nitrogen adsorption, high-pressure MIP, NMR, and micro-CT scanning—to quantitatively evaluate pore size distribution, spatial heterogeneity, and connectivity across nano- to microscale dimensions. Under high-stress conditions, the integration of these methods provides insights into the coexistence of adsorbed and free-phase methane and their implications for producible gas, offering a structural basis for accurate reservoir classification and targeted fracturing design.

5.1. Detailed Elucidation of the Fine Characteristics of the MultiScale Pore–Fracture System and Its Significance for Coalbed Methane Occurrence

Tectonic deformation and sedimentary evolution have induced considerable heterogeneity in the pore structures of deep coal reservoirs [73]. Characterization across multiple scales confirms that JT block coals exhibit both nanometer-scale pores and micrometer-scale fractures, forming a dual-scale pore–fracture system. Micro-CT images reveal that microfractures within the 100–300 μm range are dominant and spatially extensive. These fractures interconnect isolated pores, forming complex 3D networks that significantly enhance permeability [74]. However, results from CO2 adsorption, N2 adsorption, and MIP indicate that although nanometer-scale pores are abundant, they are poorly connected and contribute little to permeability enhancement.
Coal samples from the Benxi Formation in the JT block exhibit total pore volumes ranging from 0.0817 to 0.0911 cm3/g (avg. 0.0871 cm3/g) and specific surface areas between 192.924 and 210.082 m2/g (avg. 202.531 m2/g), both of which are significantly higher than those reported for the Taiyuan Formation in the Qinshui Basin (0.046–0.062 cm3/g), the Longmaxi Shale in the Sichuan Basin (0.0104 cm3/g), and the Shanxi Formation Shale in the Ordos Basin (0.655–11.42 m2/g) [75]. This indicates a more developed micropore system in JT coal, likely due to greater burial depth, optimal thermal maturity, and high vitrinite content. While this microporosity increases methane adsorption capacity, it simultaneously poses challenges by reducing desorption efficiency—a phenomenon commonly referred to as the “strong adsorption–weak transport” paradox in deep CBM recovery.
Given that micropores provide extensive surface area for methane adsorption, they are a major determinant of the gas content in deep coals [76]. By quantifying pore size fractions—micropores, mesopores, macropores, and microfractures—this study shows that micropores primarily influence gas-in-place, whereas microfractures control reservoir connectivity and development potential.

5.2. Precise Revelation of the Micro-Nanoscale Pore Structure and Spatial Distribution Characteristics of Coal Reservoirs

Using a multi-method approach (NMR, MIP, low-temperature N2 adsorption, low-pressure CO2 adsorption, micro-CT, and SEM), this study reveals the detailed pore–fracture architecture of deep coal reservoirs across nano- to micrometer scales. Two dominant structural types are identified: micropores (<2 nm), which account for up to 98.11% of pore volume and show high specific surface areas (avg. 200.90 m2/g) [77,78], and microfractures (>100 μm), which, despite representing only 0.74% of total volume, form interconnected 3D networks that are vital for gas flow.
Thus, this dual-scale structure—with micropores enabling storage and microfractures ensuring transport—is key to understanding methane mobility in deep coal seams. Multi-technique integration captures this structure with greater fidelity, thereby supporting rational design of stimulation techniques.

5.3. Scientific Elucidation of the Different Mechanisms of Micropores and Micropores Fractures in Reservoir Modification

CO2 and N2 adsorption analyses demonstrate that JT coals are rich in micropores ranging from 0.3 to 0.85 nm, which exhibit strong methane affinity [79]. NMR T2 spectra further show that pores < 0.1 μm account for 80–90% of the total signal, indicating the dominance of submicron features. MIP results reveal that pores < 1 μm remain well connected, and those < 18 nm dominate pore volume, with mercury saturation exceeding 90%, suggesting that nanometer-scale pores form a structurally connected network rather than isolated voids.
Additional information from CO2 and N2 adsorption confirms the presence of well-developed mesopores (~4 nm), which supplement storage capacity [80]. SEM and micro-CT imaging indicate that microfractures (>100 μm) contribute 40–80% of the total fracture volume. These include static, interlayer, and short fractures, which form a complex fracture network alongside the micropore system [81]. The distribution and morphology of these fractures influence pressure transmission and network propagation during hydraulic fracturing, providing a structural basis for optimizing fracture design.
When these fractures are sufficiently interconnected, they form efficient seepage pathways that enhance gas recovery. The spatial information obtained from SEM and micro-CT analyses thus informs practical decisions regarding fracturing fluid properties, fracture orientation, and treatment scale.

5.4. Provision of Targeted R&D Basis for Novel Deep Reservoir Enhancement Technologies

Isothermal methane adsorption tests indicate that Langmuir volumes (VL) for JT coals range from 21.087 to 23.821 m3/t, consistent with high microporosity and specific surface area. A significant positive correlation is observed between VL and micropore volume, confirming that adsorption capacity is predominantly controlled by micropore development [82,83].
With increasing burial depth, enhanced compaction reduces fracture aperture and pore connectivity, limiting desorption and flow. Thus, even with well-developed micropores, insufficient connectivity constrains production. Although the volume fraction of microfractures is low, their connectivity plays a critical role in improving permeability. Therefore, stimulation strategies must target the coupling between pore storage and fracture transport.
For DCBM applications, a combined approach using fracturing fluids and desorption agents is recommended. Such treatments can expand fractures, connect isolated microfractures, and improve methane release from micropores. The integration of structural data into stimulation design enhances reservoir productivity by aligning technical interventions with the intrinsic pore–fracture configuration.
In summary, this study provides both qualitative and quantitative insights into the multiscale pore–fracture architecture of deep coal reservoirs. The data elucidate the physical basis of methane occurrence and transport mechanisms, enabling more effective and targeted stimulation strategies. Tailored interventions—such as chemical-assisted desorption for micropore-dominated systems or fracture network enhancement for fracture-rich coals—can significantly improve gas recovery efficiency and reduce development risk. This refined, multi-method approach forms a critical foundation for high-resolution reservoir evaluation and optimized DCBM development.

6. Conclusions

This study employed a suite of multiscale characterization techniques—including NMR, MIP, low-temperature N2 adsorption, low-pressure CO2 adsorption, SEM, and micro-CT—to investigate the pore–fracture structures of 8# coal from the Benxi Formation in the JT Block. Combined with methane isothermal adsorption experiments, the findings elucidate the impact of microstructural features on CBM occurrence and migration in deep coal reservoirs.
(1)
The coal samples exhibit a dual pore–fracture system dominated by micropores. Micropores smaller than 2 nm account for 98.11% of the total pore volume, while microfractures contribute only 0.74% on average. Despite their low volume fraction, microfractures are well connected in three-dimensional space and play a critical role in linking isolated micropores, forming a complex pore–fracture network essential for gas storage and migration in deep coal seams.
(2)
Micro-CT imaging reveals that microfractures ranging from 100 to 300 μm comprise 40–80% of the total fracture volume in the samples, effectively enhancing the reservoir’s permeability. In contrast, N2 and CO2 adsorption as well as MIP results indicate widespread development of nanopores, yet with poor connectivity, contributing minimally to permeability. Therefore, gas occurrence is primarily controlled by micropores, while gas transport is dominated by the connectivity of microfractures.
(3)
Functional differentiation across pore-size scales is clearly observed. Micropores (<1.5 nm) contribute 99.6% of the total specific surface area and pore volume, serving as the principal adsorption space. Mesopores (1.5–50 nm) act as secondary storage sites, while macropores and microfractures (>50 nm) primarily affect gas transport and seepage connectivity. This understanding provides theoretical guidance for reservoir partitioning into desorption and flow zones in staged fracturing designs.
(4)
Methane isothermal adsorption experiments show that the Langmuir volumes of the three coal samples are 23.821, 22.278, and 21.087 m3/t, respectively, with a strong positive correlation to micropore volume and specific surface area. With increasing burial depth, coal compactness intensifies and adsorption capacity decreases, indicating significant interlayer heterogeneity. These results suggest that stratified and segmented stimulation strategies should be adopted to accommodate differences in micropore development.
(5)
The integrated use of NMR, MIP, CO2/N2 adsorption, SEM, and micro-CT demonstrates the complementary strengths of each method in characterizing pores across scales, enabling a comprehensive assessment of fracture–pore architecture from nanometers to microns. This approach provides key parameters for reservoir evaluation, fracture network modeling, and fracturing fluid optimization, offering a technical foundation for the precise modification of deep coal reservoirs and the efficient development of CBM.

Author Contributions

Conceptualization, K.L., B.G. and W.L.; Validation, K.L.; Formal analysis, K.L. and W.L.; Data curation, B.G. and C.J.; Writing—original draft, K.L.; Writing—review & editing, K.L. and C.J.; Project administration, W.L. All authors have read and agreed to the published version of the manuscript.

Funding

This research was funded by China Petroleum Institute of Science and Technology Co., Ltd., grant number 431123yj1cq004100137.

Data Availability Statement

The original contributions presented in this study are included in the article. Further inquiries can be directed to the corresponding author.

Conflicts of Interest

Authors Kaiqi Leng, Baoshan Guan, Chen Jiang and Weidong Liu were employed by the Research Institute of Petroleum Exploration & Development, PetroChina. The authors declare that the research was conducted in the absence of any commercial or financial relationships that could be construed as a potential conflict of interest.

References

  1. Lu, Y.J.; Yang, Z.Z.; Li, X.G.; Han, J.X.; Ji, G.F. Problems and Methods for Optimization of Hydraulic Fracturing of Deep Coal Beds in China. Chem. Technol. Fuels Oils 2015, 51, 41–48. [Google Scholar] [CrossRef]
  2. Xu, F.Y.; Hou, W.; Xiong, X.Y.; Xu, B.R.; Wu, P.; Wang, H.Y.; Feng, K.; Yu, J.; Li, S.G.; Zhang, L.; et al. The status and development strategy of coalbed methane industry in China. Pet. Explor. Dev. 2023, 50, 669–682. [Google Scholar] [CrossRef]
  3. Li, S.; Tang, D.Z.; Xu, H.; Tao, S. Progress in geological researches on the deep coalbed methane reservoirs. Earth Sci. Front. 2016, 23, 10–16. [Google Scholar]
  4. Chen, Z.L. Geological unit division and development countermeasures of deep coalbed methane in Southern Yanchuan Block. Coal Geol. Explor. 2021, 49, 13–20. [Google Scholar]
  5. Yang, J.S.; Feng, P.; Tang, S.L.; Tang, D.Z.; Wang, M.Z.; Li, S.; Zhao, Y.; Li, Z.W. Phase control factors and content prediction model of deep coalbed methane in Daning-Jixian block. Acta Pet. Sin. 2023, 44, 1879–1891. [Google Scholar]
  6. Li, S.; Qin, Y.; Tang, D.Z.; Shen, J.; Wang, J.J.; Chen, S.D. A comprehensive review of deep coalbed methane and recent developments in China. Int. J. Coal Geol. 2023, 279, 104369. [Google Scholar] [CrossRef]
  7. Sing, K.S.W. Reporting physisorption data for gas/solid systems with special reference to the determination of surface area and porosity (Recommendations 1984). Pure Appl. Chem. 1985, 57, 603–619. [Google Scholar] [CrossRef]
  8. Wei, J.G.; Zhou, X.F.; Shamil, S.; Yuriy, K.; Yang, E.L.; Yang, Y.; Wang, A.L. High-pressure mercury intrusion analysis of pore structure in typical lithofacies shale. Energy 2024, 295, 130879. [Google Scholar] [CrossRef]
  9. Lu, F.C.; Liu, Z.Y.; Zhang, X.B.; Jia, B.; Wang, Y.F.; Liu, S.; Tang, Y.J.; Liu, J.J.; Liu, P. Study on full-scale pores characterization and heterogeneity of coal based on low-temperature nitrogen adsorption and low-field nuclear magnetic resonance experimentse. Sci. Rep. 2024, 14, 16910. [Google Scholar] [CrossRef]
  10. Li, Y.; Zhang, Y.G.; Zhang, L.; Hou, J.L. Characterization on pore structure of tectonic coals based on the method of mercury intrusion, carbon dioxide adsorption. J. China Coal Soc. 2019, 44, 1188–1196. [Google Scholar]
  11. Mou, P.W.; Pan, J.N.; Niu, Q.H.; Wang, Z.Z.; Li, Y.B.; Song, D.Y. Coal Pores: Methods, Types, and Characteristics. Energy Fuel 2021, 35, 7467–7484. [Google Scholar] [CrossRef]
  12. Li, X.S.; Ju, Y.W.; Hou, Q.L.; Li, Z.; Wei, M.M.; Fan, J.J. Characterization of Coal Porosity for Naturally Tectonically Stressed Coals in Huaibei Coal Field, China. Sci. World J. 2014, 2014, 560450. [Google Scholar] [CrossRef] [PubMed]
  13. Zhao, M.Y.; Jin, Y.; Liu, X.H.; Zheng, J.L.; Liu, S.X. Characterizing the Complexity Assembly of Pore Structure in a Coal Matrix: Principle, Methodology, and Modeling Application. JGR Solid Earth 2020, 125, e2020JB020110. [Google Scholar] [CrossRef]
  14. Clarkson, C.R.; Solano, N.; Bustin, R.M.; Bustin, A.M.M.; Chalmers, G.R.L.; He, L.; Melnichenko, Y.B.; Padinski, A.P.; Blach, T.P. Pore Structure Characterization of North American Shale Gas Reservoirs Using USANS/SANS, Gas adsorption, and Mercury Intrusion. Fuel 2013, 103, 606–616. [Google Scholar] [CrossRef]
  15. Wang, G.; Shen, J.N.; Chu, X.Y.; Cao, C.J.; Jiang, C.H.; Zhou, X.H. Characterization and analysis of pores and fissures of high-rank coal based on CT three-dimensional reconstruction. J. China Coal Soc. 2017, 42, 2074–2080. [Google Scholar]
  16. Pan, J.N.; Zhu, H.T.; Hou, Q.L.; Wang, H.C.; Wang, S. Macromolecular and pore structures of Chinese tectonically deformed coal studied by atomic force microscopy. Fuel 2015, 139, 94–101. [Google Scholar] [CrossRef]
  17. Zhou, S.D.; Liu, D.M.; Cai, Y.D.; Yao, Y.B.; Li, Z.T. 3D characterization and quantitative evaluation of pore-fracture networks of two Chinese coals using FIB-sem tomography. Int. J. Coal Geol. 2017, 174, 41–54. [Google Scholar] [CrossRef]
  18. Chen, C.C.; Dong, X.H.; Chen, Y.P.; Dong, Z.; Zhao, B.; Jiang, L.L.; Chen, Z.X. Characterization of the Porosity and Permeability of Gasified Coal in UCG Process: An Experimental and Simulation Study. ACS Omega 2025, 10, 1308–1319. [Google Scholar] [CrossRef]
  19. Ramandi, H.L.; Mostaghimi, P.; Armstrong, R.T.; Saadatfar, M.; Pinczewski, W.V. Porosity and permeability characterization of coal: A micro-computed tomography study. Int. J. Coal Geol. 2016, 154–155, 57–68. [Google Scholar] [CrossRef]
  20. Zhang, X.M.; Wang, S.Q.; Chen, H.; Deng, J.; Huo, L. Micro morphology and pore structure of macerals in coal observed by atomic force microscopy (AFM). Coal Sci. Technol. 2023, 51, 127–132. [Google Scholar]
  21. Li, G.Y.; Yao, Y.B.; Wang, H.; Meng, L.J.; Li, P.J.; Zhang, Y.C.; Wang, J.W.; Ma, L.M. Deep coalbed methane resources in the Shenmu-Jiaxian block, Ordos Basin, China:Geological characteristics and potential for exploration and exploitation. Coal Geol. Explor. 2024, 52, 70–80. [Google Scholar]
  22. GT/T6948-2008; Method of Determining Microscopically the Reflectance of Vitrinite in Coal. Standards Press of China: Beijing, China, 2008.
  23. SY/T6414-2014; Maceral Identidication and Statistical Methods on Polished Surfaces of Whole Rocks. Standards Press of China: Beijing, China, 2014.
  24. GB/T 30732-2014; Proximate Analysis of Coal by Instrumental Method. Standards Press of China: Beijing, China, 2014.
  25. Yao, Y.B.; Liu, D.M. Comparison of low-field NMR and mercury intrusion porosimetry in characterizing pore size distributions of coals. Fuel 2012, 95, 152–158. [Google Scholar] [CrossRef]
  26. Yao, Y.B.; Liu, D.M.; Tang, D.Z.; Tang, S.H.; Huang, W.H. Fractal characterization of adsorption-pores of coals from North China: An investigation on CH4 adsorption capacity of coals. Int. J. Coal Geol. 2008, 73, 27–42. [Google Scholar] [CrossRef]
  27. Liu, Y.L.; Tang, D.Z.; Xu, H.; Zhao, J.L.; Li, B.Y. Description of the Storage-Permeability Under the Control of Macrolithotypes Based on the Nuclear Magnetic Resonance. Geol. J. China Univ. 2016, 22, 543–548. [Google Scholar]
  28. Tian, H.; Zhang, S.C.; Liu, S.Y.; Zhang, H. Determination of organic-rich shale pore features by mercury injectionand gas adsorption methods. Acta Pet. Sin. 2012, 33, 419–427. [Google Scholar]
  29. Gao, L.X. BET Analysis of Physical Properties of Porous Materials. Guangdong Chem. Ind. 2021, 48, 94–95. [Google Scholar]
  30. GB/T 21650.2-2008; Pore Size Distribution and Porosity of Solid Materials by Mercury Porosimetry and Gas Adsorption—Part 2: Analysis of Mesopores and Macropores by Gas Adsorption. Standardization Administration of the People’s Republic of China: Beijing, China, 2008.
  31. Hu, R.Z. Measurement of Powder Particles and Pores; Metallurgical Industry Press: Beijing, China, 1982. [Google Scholar]
  32. Brunauer, S.; Emmettm, P.H.; Teller, E. Adsorption of gases in multimolecular layers. J. Am. Chem. Soc. 1938, 60, 309–319. [Google Scholar] [CrossRef]
  33. Bustin, R.M.; Bustin, A.; Ross, D.; Chalmers, G. Shale Gas Opport Unities and Challenges; AAPG Annual Convention: San Antonio, TX, USA, 2008. [Google Scholar]
  34. Ravikovith, P.T.; Haller, G.L.; Neimark, A.V.; Neimark, A.B. Density functional theory model for calculating pore size distributions: Pore structure of nanoporous catalysts. Adv. Colloid Interface Sci. 1998, 76–77, 203–226. [Google Scholar] [CrossRef]
  35. Song, D.Y.; Ji, X.F.; Li, Y.B.; Zhao, H.T.; Song, B.Y.; He, K.K. Heterogeneous development of micropores in medium-high rank coal and its relationship with adsorption capacity. Int. J. Coal Geol. 2020, 226, 103497. [Google Scholar] [CrossRef]
  36. Liu, Y.W.; Zhang, S.; Zuo, W.Q.; Han, H.K.; Xu, P. tudy on differences of pore structure of typical soft and hard coal. Coal Sci. Technol. 2021, 49, 98–106. [Google Scholar]
  37. Soltanmohammadi, R.; Faroughi, S. A comparative analysis of super-resolution techniques for enhancing micro-CT images of carbonate rocks. Appl. Comput. Geosci. 2023, 20, 100143. [Google Scholar] [CrossRef]
  38. Vasarhelyi, L.; Konya, Z.; Kukovecz, A.; Vajtai, R. Kukovecz AMicrocomputed tomography–based characterization of advanced materials: A review. Mater. Today Adv. 2020, 8, 100084. [Google Scholar] [CrossRef]
  39. Kelly, S.; El-sobky, H.; Carlos, T.V.; Matthew, T.B. Assessing the utility of FIB-SEM images for shale digital rock physics. Adv. Water Resour. 2016, 95, 302–316. [Google Scholar] [CrossRef]
  40. GB/T 17366-1998; Methods of Mineral and Rock Specimen Preparation for EPMA. Standardization Administration of the People’s Republic of China: Beijing, China, 1998.
  41. SY/T 5162-2014; Analytical Method of rock Sample by Scanning Eletron Microscope. Petroleum Industry Press: Beijing, China, 2014.
  42. Yang, Y.; Liu, S.M.; Zhao, W.; Wang, L. Intrinsic relationship between Langmuir sorption volume and pressure for coal: Experimental and thermodynamic modeling study. Fuel 2019, 241, 105–117. [Google Scholar] [CrossRef]
  43. GB/T 19560-2008; Experimental Method of High-Pressure Isothermal Adsorption to Coal. Standards Press of China: Beijing, China, 2008.
  44. Bell, G.J.; Rakop, K.C. Hysteresis of methane/coal sorption isotherms. In Proceedings of the SPE Annual Technical Conference and Exhibition, Society of Petroleum Engineers, New Orleans, LA, USA, 5–8 October 1986. [Google Scholar]
  45. Clarkson, C.R.; Bustion, R.M.; Levy, J.H. Application of the mono/multilayer and adsorption potential theories to coal methane adsorption isotherms at elevated temperature and pressure. Carbon 1997, 35, 1689–1705. [Google Scholar] [CrossRef]
  46. Mavor, M.; Owen, L.; Pratt, T. Measurement and evaluation of coal sorption isotherm data. In Proceedings of the SPE Annual Technical Conference and Exhibition, Society of Petroleum Engineers, New Orleans, LA, USA, 23–26 September 1990. [Google Scholar]
  47. Ruppel, T.C.; Grein, C.T.; Bientock, D. Adsorption of methane on dry coal at elevated pressure. Fuel 1974, 53, 152–162. [Google Scholar] [CrossRef]
  48. Li, J.Z.; Guo, P.G.; Xie, W.H.; Chu, J.Q.; Yin, Z.Q.; Yuan, A.Y.; Zhang, M.; Jiao, Z.H. Experimental Study on Adsorption Pore Structure and Gas Migration of Coal Reservoir Using Low-Field Nuclear Magnetic Resonance. Adv. Civ. Eng. 2020, 9, 8839819. [Google Scholar] [CrossRef]
  49. Li, A.; Ding, W.L.; Wang, R.Y.; He, J.H.; Wang, X.H.; Sun, Y.X.; Gu, Y.; Jiao, N.L. Petrophysical characterization of shale reservoir based on nuclear magnetic resonance (NMR) experiment: A case study of Lower Cambrian Qiongzhusi Formation in eastern Yunnan Province, South China. J. Nat. Gas Sci. Eng. 2017, 37, 29–38. [Google Scholar] [CrossRef]
  50. Wang, K.; Qiao, P.; Wang, Z.S.; Liu, X.G.; Li, Y. Multiple scale pore size characterization of coal based on carbon dioxide and liquid nitrogen adsorption, high-pressure mercury intrusion and low field nuclear magnetic resonance. China Min. Mag. 2017, 26, 146–152. [Google Scholar]
  51. Zhu, G.G.; Xie, Z.T.; Wang, T.; Hu, H.Y.; Wang, D.X. Microscopic pore structure characteristics of Shanxi Formation coal reservoir in Daning-Jixian block. Saf. Coal Mines 2024, 55, 31–42. [Google Scholar]
  52. Shen, R.; Zhang, X.Y.; Ke, Y.B.; Xiong, W.; Guo, H.K.; Liu, G.H.; Zhou, H.T.; Yang, H. An integrated pore size distribution measurement method of small angle neutron scattering and mercury intrusion capillary pressure. Sci. Rep. 2021, 11, 17458. [Google Scholar] [CrossRef]
  53. Wang, P.F.; Jiang, Z.X.; Chen, L.; Yin, L.S.; Li, Z.; Zhang, C.; Tang, X.L.; Wang, G.Z. Pore structure characterization for the Longmaxi and Niutitang shales in the Upper Yangtze Platform, South China: Evidence from focused ion beam–He ion microscopy, nano-computerized tomography and gas adsorption analysis. Mar. Pet. Geol. 2016, 77, 1323–1337. [Google Scholar] [CrossRef]
  54. Lin, Z.T.; Liu, D.M.; Cai, Y.D.; Wang, Y.P.; Teng, J. Adsorption pore structure and its fractal characteristics of coals by N2 adsorption/desorption and FESEM image analyses. Fuel 2019, 257, 116031. [Google Scholar]
  55. Horikawa, T.; Do, D.D.; Nicholson, D. Capillary condensation of adsorbates in porous materials. Adv. Colloid Interface Sci. 2011, 169, 40–58. [Google Scholar] [CrossRef] [PubMed]
  56. Wang, T.; Tian, F.H.; Deng, Z.; Hu, H.Y. The Characteristic Development of Micropores in Deep Coal and Its Relationship with Adsorption Capacity on the Eastern Margin of the Ordos Basin, China. Minerals 2023, 13, 302–324. [Google Scholar] [CrossRef]
  57. Deng, Z.; Wang, H.Y.; Jiang, Z.X. Influence of deep coal pore and fracture structure on occurrence of coalbed methane: A case study of Daning-Jixian Block in the eastern margin of Ordos Basin. Coal Sci. Technol. 2024, 52, 106–123. [Google Scholar]
  58. Liu, D.M.; Qiu, F.; Liu, N.; Cai, Y.D.; Guo, Y.L.; Zhao, B.; Qiu, Y.K. Pore structure characterization and its significance for gas adsorption in coals: A comprehensive review. Unconv. Resour. 2022, 2, 139–157. [Google Scholar] [CrossRef]
  59. Nie, B.S.; Liu, X.F.; Yang, L.L.; Meng, J.Q.; Li, X.C. Pore structure characterization of different rank coals using gas adsorption and scanning electron microscopy. Fuel 2015, 158, 908–917. [Google Scholar] [CrossRef]
  60. Schlumberger, C.; Thommes, M. Characterization of Hierarchically Ordered Porous Materials by Physisorption and Mercury Porosimetry—A Tutorial Review. Adv. Mater. Interfaces 2021, 8, 2002181. [Google Scholar] [CrossRef]
  61. Yin, T.T.; Liu, D.M.; Cai, Y.D.; Zhou, Y.F. Methane adsorption constrained by pore structure in high-rank coals using FESEM, CO2 adsorption, and NMRC techniques. Energy Sci. Eng. 2019, 7, 255–271. [Google Scholar] [CrossRef]
  62. Mohammad, A.; Dana, A. Guidelines for the use and interpretation of adsorption isotherm models: A review. J. Hazard. Mater. 2020, 393, 122383. [Google Scholar]
  63. Feng, P.; Li, S.; Tang, S.L.; Tang, D.Z.; Zhang, C.; Yang, J.S.; Liu, N.X.; Zhong, G.H. Estimation of Adsorption Isotherm for Deep Coalbed Methane: A Monolayer-Filling Model Based on Pore Fractal Dimension. Energy Fuel 2024, 28, 1987–2000. [Google Scholar] [CrossRef]
  64. Wang, J.H. Multi-Fractal Characteristics of Pore Structure of Coal Rock in Low and Medium Rank CBM Reservoirs. J. Petrochem. Univ. 2019, 32, 26–32. [Google Scholar]
  65. Wang, X.H.; Peng, Y.; Wang, J.Y.; Zeng, Q. Pore structure damages in cement-based materials by mercury intrusion: A non-destructive assessment by X-ray computed tomography. Materials 2019, 12, 2220–2236. [Google Scholar] [CrossRef] [PubMed]
  66. Wang, Y.; Miller, J.D. Current developments and applications of micro-CT for the 3D analysis of multiphase mineral systems in geometallurgy. Earth-Sci. Rev. 2020, 211, 103406. [Google Scholar] [CrossRef]
  67. Wang, G.; Qin, X.J.; Han, D.Y.; Liu, Z.Y. Study on seepage and deformation characteristics of coal microstructure by 3D reconstruction of CT images at high temperatures. Int. J. Min. Sci. Technol. 2021, 31, 175–185. [Google Scholar] [CrossRef]
  68. Wang, Y. Nanoscale Pore Structure Evolution and Shale Gas Occurrence of Longmaxi Formation in Upper Yangtze Area; China University of Mining and Technology: Beijing, China, 2017. [Google Scholar]
  69. Clarkson, C.R.; Butin, R.M. The effect of pore structure and gas pressure upon the transport properties of coal: A laboratory and modeling study.1. Isotherms and pore volume distributions. Fuel 1999, 78, 1333–1344. [Google Scholar] [CrossRef]
  70. Swenson, H.; Stadie, N.P. Langmuir’s Theory of Adsorption: A Centennial Review. Langmuir 2019, 35, 5409–5426. [Google Scholar] [CrossRef]
  71. Zhang, S.S.; Wu, C.F.; Liu, H.C. Comprehensive characteristics of pore structure and factors influencing micropore development in the Laochang mining area, eastern Yunnan, China. J. Pet. Sci. Eng. 2020, 190, 107090. [Google Scholar] [CrossRef]
  72. Pan, J.N.; Zhao, Y.Q.; Hou, Q.L.; Jin, Y. Nanoscale pores in coal related to coal rank and deformation structures. Transp. Porous Media 2015, 107, 543–554. [Google Scholar] [CrossRef]
  73. Chen, Y.P.; Pan, Z.J. Reservoir properties of Chinese tectonic coal: A review. Fuel 2020, 260, 116350. [Google Scholar] [CrossRef]
  74. Ni, H.Y.; Liu, J.F.; Chen, T.; Chen, S.J.; Meng, Q.B. Coal permeability prediction method based on the microscopic pore-fracture dual-porosity structure. J. Pet. Sci. Eng. 2022, 211, 110107. [Google Scholar] [CrossRef]
  75. Peng, N.; He, S.; Hu, Q.H.; Zhang, B.Q.; He, X.P.; Zhai, G.Y.; He, C.C.; Yang, R. Organic nanopore structure and fractal characteristics of Wufeng and lower member of Longmaxi shales in southeastern Sichuan, China. Mar. Pet. Geol. 2019, 103, 456–472. [Google Scholar] [CrossRef]
  76. Zhang, N.; Wang, S.D.; Wu, J.Q.; Li, Z.; Wang, X.Y. Full-Scale Pore Structure Characterization and Its Impact on Methane Adsorption Capacity and Seepage Capability: Differences between Shallow and Deep Coal from the Tiefa Basin in Northeastern China. Fract Fract. 2024, 8, 48–75. [Google Scholar] [CrossRef]
  77. Thommes, M.; Kaneko, K.; Neimark, A.V.; Olivier, J.P.; Reinoso, F.R.; Rouquerol, J.; Kenneth, S.W.S. Physisorption of gases, with special reference to the evaluation of surface area and pore size distribution (IUPAC Technical Report). Pure Appl. Chem. 2015, 87, 1051–1069. [Google Scholar] [CrossRef]
  78. Hu, B.; Cheng, Y.P.; Pan, Z.J. Classification methods of pore structures in coal: A review and new insight. Gas Sci. Eng. 2023, 110, 204876. [Google Scholar] [CrossRef]
  79. Liu, Y.X.; Hao, C.M.; Wang, Z.Y.; Xie, J.N.; Zhao, W.B.; Meng, F.B.; Han, Y.N. Micropore distribution and methane adsorption process and mechanism in bituminous coals: A molecular dynamics simulation study. J. Environ. Chem. Eng. 2024, 12, 112139. [Google Scholar] [CrossRef]
  80. Zhan, H.M.; Li, X.Z.; Hu, Z.M.; Duan, X.G.; Guo, W.; Li, Y.L. Influence of Particle Size on the Low-Temperature Nitrogen Adsorption of Deep Shale in Southern Sichuan, China. Minerals 2022, 12, 302–320. [Google Scholar] [CrossRef]
  81. Yuan, T.; Wei, Y.L.; Chen, S.W.; Liu, W.; Zhao, L.Y.; Zhang, X. Study on Mechanical Properties and Crack Propagation of Raw Coal with Different Bedding Angles based on CT Scanning. ACS Omega 2022, 7, 27185–27195. [Google Scholar] [CrossRef]
  82. Lin, H.Y.; Tian, S.X.; Jiao, A.J.; Cao, Z.Y.; Song, K.; Zou, Y.H. Pore Characteristics and Fractal Dimension Analysis of Tectonic Coal and Primary-Structure Coal: A Case Study of Sanjia Coal Mine in Northern Guizhou. ACS Omega 2022, 7, 27300–277311. [Google Scholar] [CrossRef]
  83. Li, Q.; Zhang, X.X.; Wang, Z.Z.; Qiao, L.; Shao, S.T. Research on comprehensive characterization of deep coal full aperture structure and burial depth effect. Sci. Rep. 2025, 15, 4510. [Google Scholar] [CrossRef] [PubMed]
Figure 1. Based on the T2 spectra obtained from nuclear magnetic resonance experiments. (a) T2 distributions of sample JT1-8-1-1 under saturated and dried conditions; (b) T2 distributions of sample JT1-8-2-1 under saturated and dried conditions; (c) T2 distributions of sample JT1-8-4-1 under saturated and dried conditions.
Energies 18 03235 g001
Figure 2. Pore volume and specific surface area distribution curves obtained from high-pressure mercury intrusion experiments. (a) Pore size–pore volume relationships of different coal samples derived from MIP; (b) Pore size–specific surface area relationships of different coal samples derived from MIP.
Energies 18 03235 g002
Figure 3. The relationship between cumulative mercury intrusion/extrusion volume and pore diameter in coal samples.
Energies 18 03235 g003
Figure 4. Capillary pressure curve.
Energies 18 03235 g004
Figure 5. Low-temperature N2 adsorption–desorption isotherm curves.
Energies 18 03235 g005
Figure 6. Pore volume and specific surface area distribution curves obtained from low-temperature N2 adsorption experiments. (a) Pore size–pore volume relationships of different coal samples determined by low-temperature N2 adsorption; (b) Pore size–specific surface area relationships of different coal samples determined by low-temperature N2 adsorption.
Energies 18 03235 g006
Figure 7. Low-pressure CO2 adsorption isotherm curves.
Energies 18 03235 g007
Figure 8. Pore volume and specific surface area distribution curves obtained from low-pressure CO2 adsorption experiments. (a) Pore size–pore volume relationships of different coal samples derived from low-pressure CO2 adsorption; (b) Pore size–specific surface area relationships of different coal samples derived from low-pressure CO2 adsorption.
Energies 18 03235 g008
Figure 9. Pore volume and specific surface area distribution of JT coal rock based on three experimental methods. (a) Distribution diagram of pore size–pore volume relationships based on combined characterization techniques; (b) Distribution diagram of pore size–specific surface area relationships based on combined characterization techniques.
Energies 18 03235 g009
Figure 10. The pore size distribution obtained from the micro-CT scan is depicted, where gray represents the coal matrix, yellow indicates minerals, and red signifies microfractures. (a) Mineral composition of JT1-8-1-1 (CT); (b) Pores and fractures of JT1-8-1-1 (CT); (c) Mineral composition of JT1-8-2-1 (CT); (d) Pores and fractures of JT1-8-2-1 (CT); (e) Mineral composition of JT1-8-4-1 (CT); (f) Pores and fractures of JT1-8-4-1 (CT).
Energies 18 03235 g010aEnergies 18 03235 g010b
Figure 11. Distribution of pore volume fraction and frequency with respect to pore size range in JT coal samples. (a) Distribution of pore and fracture proportions and frequencies in sample JT1-8-1-1; (b) Distribution of pore and fracture proportions and frequencies in sample JT1-8-2-1; (c) Distribution of pore and fracture proportions and frequencies in sample JT1-8-4-1.
Energies 18 03235 g011aEnergies 18 03235 g011b
Figure 12. The SEM images of sample JT1-8-1-1 at magnifications of 100×, 500×, 2000×, and 10,000×.
Energies 18 03235 g012
Figure 13. SEM images of sample JT1-8-2-1 at magnifications of 100×, 500×, 2000×, and 10,000×.
Energies 18 03235 g013
Figure 14. SEM images of sample JT1-8-4-1 at magnifications of 100×, 500×, 2000×, and 10,000×.
Energies 18 03235 g014
Figure 15. Isothermal adsorption lines of coal samples at different burial depths.
Energies 18 03235 g015
Table 1. Physical properties of coal samples from the JT block.
Coal Sample NumberDepth
m
Ro,max
%
Porosity
%
Maceral CompositionIndustrial Analysis
VitriniteInertiniteExiniteMineral MatterMoisture ContentAsh
Content
Volatile MatterTotal
Carbon
JT1-8-1-12382.102.357.8577.2019.401.002.400.654.369.4585.54
JT1-8-2-12383.002.356.6577.8016.601.803.800.969.379.1080.57
JT1-8-4-12385.912.366.9881.2014.800.803.200.705.838.5284.95
Table 2. Micro-CT scanning of coal sample basic data.
Coal Sample NameDensity (g/cm3)Scan Length (mm)Scanning Diameter (mm)
JT1-8-1-11.45166.32860
JT1-8-2-11.46191.31160
JT1-8-4-11.43168.80460
Disclaimer/Publisher’s Note: The statements, opinions and data contained in all publications are solely those of the individual author(s) and contributor(s) and not of MDPI and/or the editor(s). MDPI and/or the editor(s) disclaim responsibility for any injury to people or property resulting from any ideas, methods, instructions or products referred to in the content.

