Abstract
Because of their many health benefits, blueberries are highly sought after as superfoods. There are also ongoing initiatives to enhance sustainability in blueberry packaging by selecting appropriate materials. Ideal packaging should ensure the safe delivery of the fruit to consumers while maintaining product quality, addressing environmental concerns, and promoting circularity. The environmental impact of four different packaging materials was assessed using a comparative cradle-to-grave life cycle assessment. The materials evaluated included a cardboard package (CB), a cardboard package with a cellulose lid (CBC), a polypropylene (PP) as a control, and a punnet made from rice straw topped with polylactic acid (RPLA), a bio-based plastic. The evaluation considered all environmental impact categories, utilizing Sphera GaBi software and the CML 2016 method. Special attention was given to various end-of-life scenarios, determining energy resources and fossil abiotic depletions. The results indicate that RPLA is the most eco-friendly option, with the lowest carbon footprint and energy resources. CB has a larger carbon footprint but less overall impact than traditional incineration, while CBC has the highest impact during recycling, mainly due to marine ecotoxicity. PP has a relatively low impact on energy resources and fossil abiotic depletion compared to CB and CBC packaging materials.
1. Introduction
1.1. Research Background
Blueberries, like salmon and broccoli, are rich in compounds (such as antioxidants, fiber, or fatty acids) that benefit human health and are called superfoods. Superfoods increase energy and vitality, regulate cholesterol and blood pressure, and may help prevent or fight cancer and other diseases [1,2]. These substances stimulate blood supply to capillary vessels throughout the body and aid in the rapid regeneration of retinal cells in the eye [3]. Consuming blueberries is particularly beneficial for individuals who spend extended periods in front of screens [1,4].
Blueberries are highly valued for their high antioxidant content. However, they are also particularly susceptible to fungal deterioration. Therefore, the appropriate and optimal design of blueberry packaging is crucial from both a health and consumer perspective and an environmental viewpoint [5,6].
Global production has doubled since 2012, reaching 1.86 million metric tons, with over 1.3 million tons consumed fresh [7]. Estonia’s imports reflect rising demand, growing from 2.63 to 4.45 million kilograms in 2022, requiring 400–800 tons of packaging annually [8]. Blueberries are typically sold in small plastic packages, which contribute significantly to environmental pollution despite offering protection [8]. Sustainable packaging is increasingly important as consumers favor health-conscious, eco-friendly solutions. Ideal packaging must preserve product quality, prevent waste, and align with environmental goals [9].
Plastic remains dominant due to its versatility [10,11,12].
Most berry packaging is still single-use, raising concerns about fruit quality and carbon emissions [13]. Eco-friendly alternatives like biodegradable or recyclable materials and circular economy approaches are gaining ground [14].
These aim to minimize waste, enhance energy efficiency, and reduce emissions across the packaging life cycle, supporting the transition to a circular, climate-neutral economy.
1.2. Literature Review
Blueberries, as a superfood, have received significant attention in consumer markets over the past two decades [15] due to their antioxidant content and other beneficial effects [16,17]. However, with increasing demand, it is important to consider the environmental impacts of production and transport chains (both short and long) [18,19,20,21] especially in terms of packaging solutions aimed at preserving the quality of blueberries [22,23,24,25].
Since blueberries are berries with high moisture content, packaging must ensure freshness while protecting against damage and oxygen exposure. In addition, blueberries are sensitive to temperature changes. Therefore, to create optimal transport and storage conditions, each style of packaging must adequately protect the product while considering the appropriate packaging material.
Examining the blueberry supply chain from a sustainability perspective yielded interesting results. The European berry market represents a good example of a consumer-driven supply chain due to its ability to respond to all aspects of the system. The growing market trend for fresh products is driven by consumers oriented towards new lifestyles and environmental issues.
Peano and their colleagues [26,27] studied the Italian blueberry supply chain from a sustainability perspective, dividing their research into four stages. The first stage reviews the organization of the fresh fruit supply chain (FFSC) and the need for innovation due to rising demand. The second stage examines advancements in storing and maintaining fruit quality during transportation. The third stage features a case study, while the conclusion summarizes key findings and their implications for future research. A modified active packaging system (MAP) using “green” films has successfully preserved blueberry quality for up to two months, extended market presence, improved exports to new European countries, and increased turnover for the associated group, ultimately benefiting fruit growers.
Several studies have investigated blueberry packaging. Bof, M. J. et al. [28] utilized corn starch and chitosan, byproducts of the fishing industry, and active compounds from citrus waste to create biodegradable films. Blueberries were packed in corn starch–chitosan (CS: CH) films and active films containing lemon essential oil (LEO) or grapefruit seed extract (GSE). The research assessed how these packaging materials affected berry quality and fungal incidence during storage [28]. The results indicated that blueberries in CS: CH films retained 84.8% of their initial antioxidant content, similar to those in commercial PET containers (clamshells). In contrast, LEO films resulted in higher weight loss and rot.
A previous study by Koort et al. [29] aimed to determine the impacts of modified atmosphere packaging on the external quality and nutritional value of organically grown bush blueberries (“Northblue”). The storage of the fruits was investigated in typical atmosphere (RA) boxes without packaging, boxes sealed in low-density polyethylene (LDPE, Estiko) bags, and boxes sealed in Xtend® blueberry bags (Stepac) at 3 ± 1 °C. The study found higher dry matter content and titratable fruit acidity in Xtend® packaging. However, Xtend® packaging extended the post-harvest shelf life by 15 days for low-bush blueberries and 9 days for medium-bush blueberries.
Giuggioli et al. [30] found that using eco-friendly packaging can influence consumer choices for fresh fruits. This study evaluated green wrapping films for passive modified atmosphere packaging in storing strawberries (cv. Portola) for 7 days at 1 ± 1 °C, followed by 2 days at 20 ± 1 °C. One commercial polypropylene macro-perforated film (control) and three non-commercial biodegradable films (prototypes from Novamont) were tested. Film 1 achieved optimal gas composition, maintaining levels of 17.60–18.50% O2 and 5.30–5.60% CO2 for up to 5 days. It also received the highest sensory scores for condensation, taste, marketability, and the redness of the fruit at 20 ± 1 °C.
Singh, Gu et al. [31] investigated the edible packaging characteristics of blueberry packaging. Their research focused on creating edible packaging films from various starches: potato, corn, sweet potato, green bean, and tapioca. These films included blueberry pomace powder (BPP). Tests checked the films’ properties, such as strength and how they react to heat. Adding BPP did not change the color of the films, but it improved how well corn and green bean starch films blocked UV light, which helps protect food. The thickness and transparency of the films mainly stayed the same with different starches or amounts of BPP, though corn starch films were the clearest. All films held their shape and were strong, with higher water vapor transmission rates than standard polyethene films. The solubility of the films ranged from 24% to 37%, showing that they are suitable for packaging foods with low to moderate moisture. There were no differences in thermic properties based on the type of starch or BPP levels. Tests showed that more active compounds from BPP were released into acetic acid (a food-like liquid) than ethanol (a fatty liquid). Adding BPP to starch-chitosan films improved their quality, indicating that BPP could be a valuable addition to active food packaging solutions [31].
Research on alternative packaging to replace plastic has mainly focused on preserving product quality without considering the environmental impact or energy requirements throughout its life cycle.
Mari et al. [32] studied using edible coatings and osmotic dehydration to preserve berries such as blueberries, raspberries, and strawberries. Their life cycle assessment (LCA) revealed that osmotic dehydration, particularly when using apple concentrate, has a significant environmental impact. In contrast, edible coatings have a minimal environmental footprint since they are made from low-energy and biodegradable materials.
1.3. Research Goal and Hypothesis
This work calculated the environmental impacts using a comparative cradle-to-grave life cycle assessment of four packaging materials. These materials include recycled paper and other packaging options, such as cardboard packages (CB), cardboard packages with a cellulose lid (CBC), polypropylene (PP), and a box made from rice straw topped with a lid made from polylactic acid (RPLA), a bio-based plastic.
In the present study, we conducted a literature review regarding the research topic and modeling for various blueberry packaging options. Based on the results using a life cycle approach, we aimed to identify reasonable and optimal solutions for reducing environmental impacts. Our initial hypothesis is that recycled paper packaging significantly decreases the environmental impact categories at the end-of-life stage, while plastic packaging increases global emissions.
The main goal of the research was to prepare complete life cycle assessment models by comparing different blueberry packaging options, primarily focusing on the carbon footprint and other impact values. The study was based on packaging types from Poland. In previous research [33,34,35] we already created separate cradle-to-grave life cycle assessments and end-of-life scenarios; however, blueberry packaging options were investigated for the first time.
2. Materials and Methods
2.1. Research Methodology
During the life cycle assessment methodology, we adhered to the required steps: determining the system boundary, functional unit, and allocation; defining expectations regarding batch quality; collecting data and conducting inventory analysis based on measured packaging mass data; and performing impact assessment and interpretation.
In the first step of the research, we estimated the environmental impacts of blueberry packaging materials related to production and use life cycle stages. Four packaging materials were chosen for blueberry storage:
- Packaging 1: cardboard package (CB);
- Packaging 2: cardboard package with a cellulose lid (CBC);
- Packaging 3: polypropylene (PP);
- Packaging 4: rice straw package covered with a lid made from polylactic acid (RPLA) as a bio-based plastic.
The applied Sphera GaBi software (version 10.6) [36] encompasses the life cycle stages, also including transport processes. The functional unit was one piece of packaging material. The environmental life cycle impact assessments (LCIAs) considered all environmental impact categories and were utilized along with the CML 2016 method [37,38].
In the second step, special attention was given to various end-of-life scenarios. The first is recycling, the second is composting, the third is landfill disposal of the packaging, and the final option is traditional incineration. A looping method was applied in the recycling scenario. It means that the waste stream from the recycling was recirculated to the production stage as a secondary raw material on site. The looping method helped to create the cradle-to-cradle LCAs by linking production, use, and recycling stages in the software’s LCA plan.
In the third step, we separately compared the global warming potential values of the tested materials in connection with different end-of-life solutions. After that, abiotic fossil depletions and energy resources for cradle-to-cradle assessments of packaging materials were calculated.
Finally, we determined the packaging’s carbon footprint and energy requirement for 1000 kg of blueberries.
2.2. Life Cycle Assessment Method
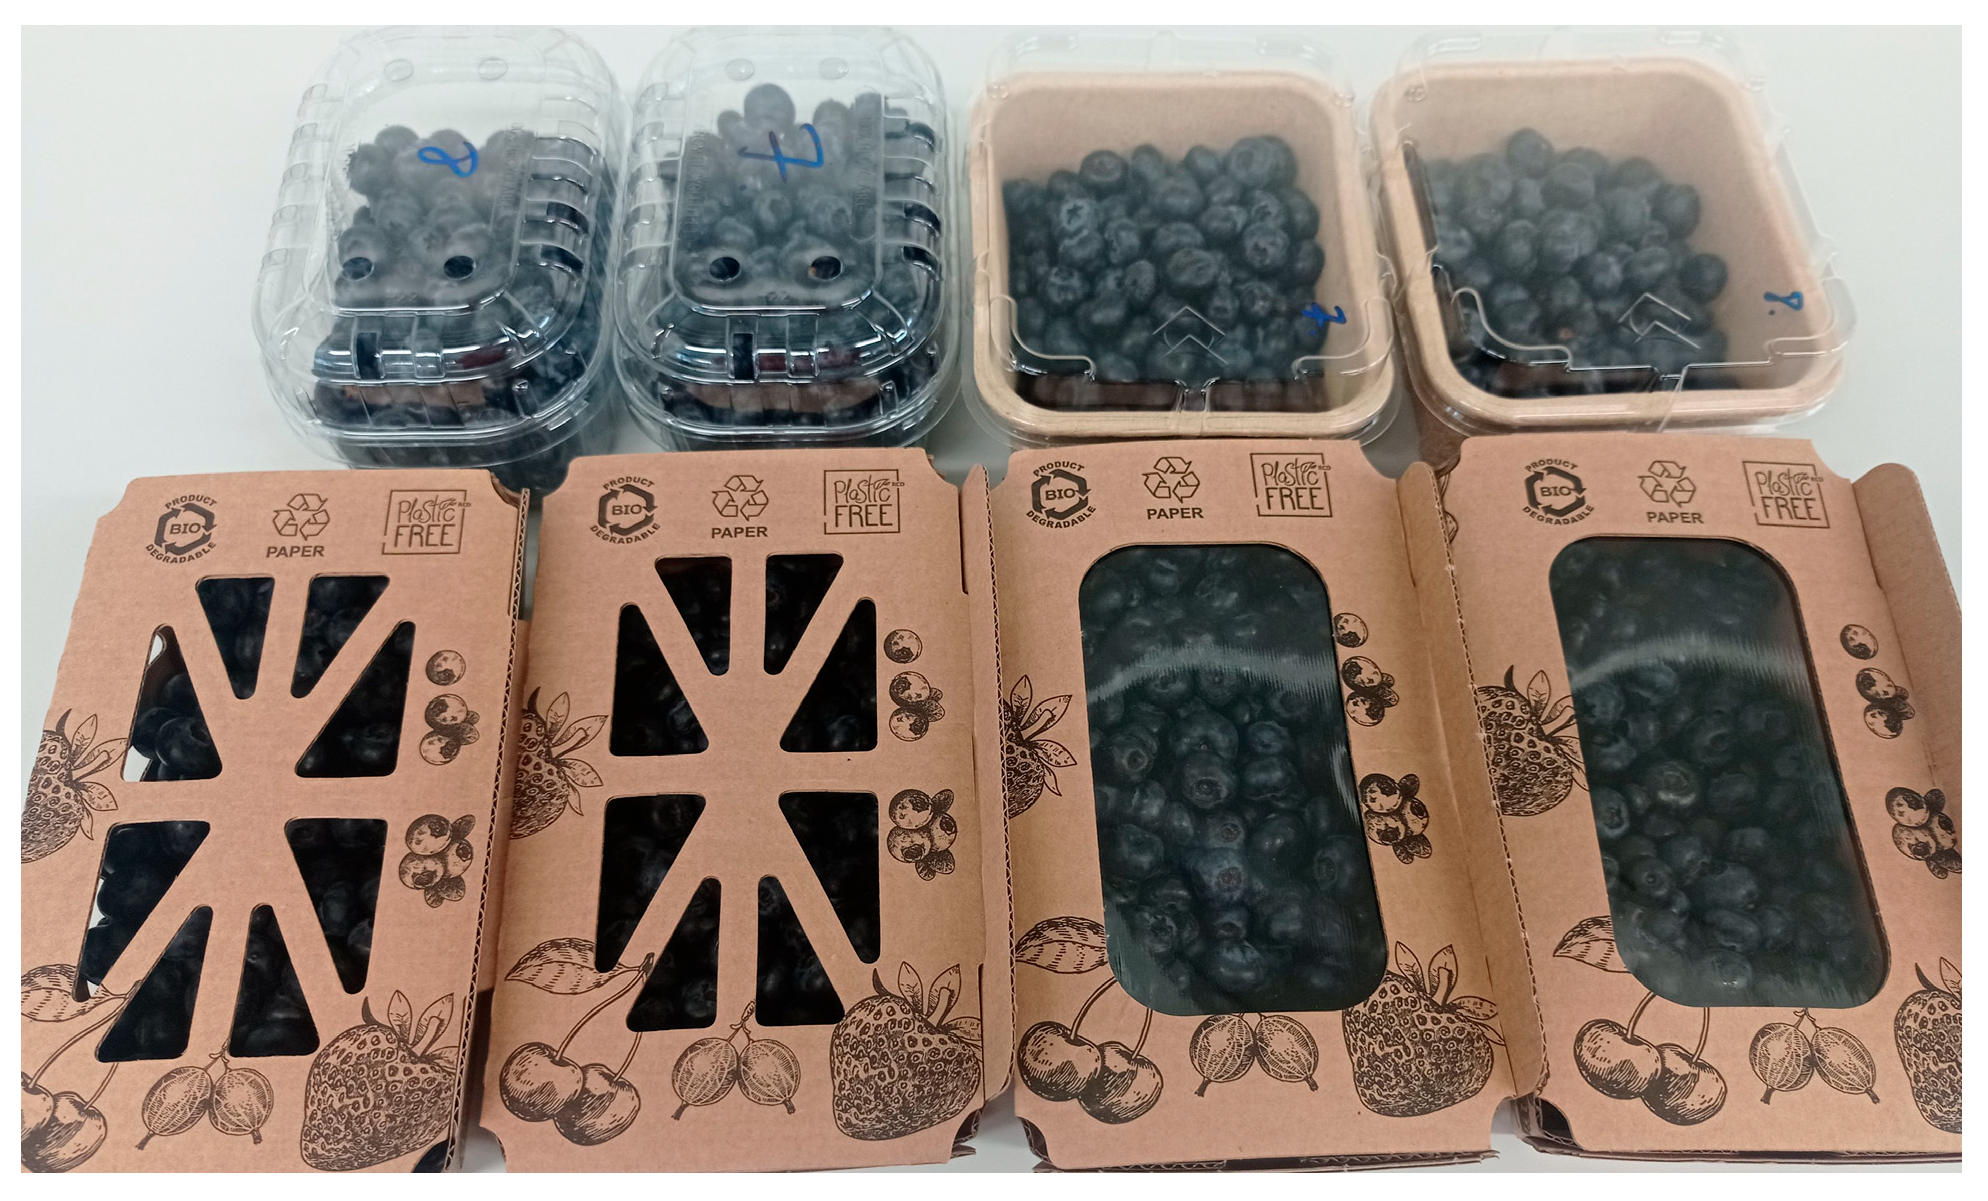
The life cycle inventory is based on 2023 data and follows the technique described in the ISO 14040:2006 and 14044:2006 standards [39,40]. It includes the material and energy supply of all the examined processes. Table 1 and Figure 1 present the tested packaging materials.

Table 1.
The tested packaging types.
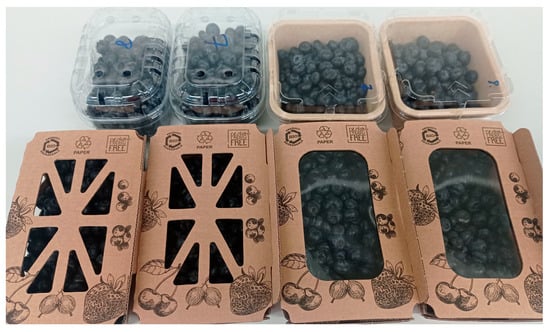
Figure 1.
The tested packaging types.
The blueberry packaging was analyzed within a cradle-to-grave and cradle-to-cradle system boundaries based on the weight of the packaging materials. All environmental impacts were allocated proportionally by mass to the products being tested and the waste generated. The material and energy flows correspond to the output of the examined products. The energy requirements were assessed based on the energy content. Equipment and machinery were excluded from the system boundary.
During the life cycle impact assessment, the CML 2001/2016 August method was used to determine the impact categories in the software.
2.3. Examination Methods for Transport Processes
When determining the impact categories, we considered the environmental impact of transport. We calculated the environmental impacts and emissions for transportation depending on the different delivery modes, transport distances, and utilization grades of payload.
The following deliveries were taken into account during the analysis:
- The transportation of raw materials (kraft paper, wood, polypropylene granulate, and PLA) to the production stage (by truck, Euro 6, with a gross weight of 26–28 tons);
- Transport between the production and use stages (truck trailer, Euro 6, with a gross weight of 34–40 tons);
- Transport between the use and end-of-life stages (truck trailer, Euro 6, with a gross weight of 34–40 tons).
Transportation between the EoL and production stages for recycled materials was not modeled, assuming the production process occurred where the waste was generated.
3. Results
This study assesses the environmental impacts of four packaging materials through a comparative cradle-to-grave life cycle analysis. The materials examined include recycled paper, a cardboard package (CB), a cardboard package with a cellulose lid (CBC), polypropylene (PP), and a box made from rice straw topped with a lid made from polylactic acid (RPLA), which is a bio-based plastic.
The main goal of the study was to calculate environmental impacts, primarily focusing on the global warming potential, abiotic depletion for fossils, and energy resources for the cradle-to-grave assessments.
The following end-of-life scenarios were taken into account during the analysis:
- Scenario 1 (SC1): recycling (R);
- Scenario 2 (SC2): composting (C);
- Scenario 3 (SC3): landfilling (D);
- Scenario 4 (SC4): incineration (I).
In the case of the recycling scenario, the life cycle analyses of the tested packaging materials were prepared for each component by assuming that the waste stream was processed by recycling at the EoL stage and went as a secondary raw material into the production stage. Therefore, regarding the recycling scenario, a cradle-to-cradle life cycle assessment was examined.
3.1. Environmental Impacts for Recycling (SC1)
During the LCA assessments, the environmental impacts of the four packaging materials were assessed using a cradle-to-cradle approach. The system boundaries were designed so that secondary material flows fed back from the end-of-life phase before the production stages, such as recycled paper and plastic, were considered inputs to the production, according to the looping logic application. The functional unit was “1 piece of packaging”, but from a practical point of view, knowing the environmental impact of packaging 1000 kg of blueberries is important information for decision-making. Later, we will also count on this functional unit.
A looping method was applied to cradle-to-grave LCAs by calculating the environmental impacts of packaging materials throughout their life cycles. This looping method resulted in the following recycling scenarios for each packaging material:
- -
- In the case of CB packaging, the mixed recovered paper component was fully recycled as a secondary raw material in the production phase. The mixed recovered paper component and, thus, the recycled amount constituted 84% of the total paper weight of the packaging material produced. The bleached kraft paper component (16%) was conventionally incinerated as waste paper. The wastewater generated during production was treated in a municipal wastewater treatment plant.
- -
- In the case of CBC packaging, the mixed recovered paper component was fully recycled as a secondary raw material in the production phase. It constituted 84% of the weight of the packaging material produced. The bleached kraft paper and cellulose foil components were disposed of in a conventional incinerator.
By creating a cradle-to-cradle LCA plan for CB and CBC packaging materials, the recycled paper input flow of the production stage comes from the EoL/recycling stage as recovered paper (materials from renewable materials) with a value of 84%. The non-recyclable waste paper stream was incinerated conventionally in both cases.
- -
- In the case of PP packaging, PP was recycled as a secondary raw material into the production process as an input stream at a rate of 100%. The lid of this packaging material consisted of PET (9% of the total weight), which was conventionally incinerated.
- -
- In the case of RPLA packaging, 90% was recycled as a secondary raw material for production from the main components, recycled paper and PLA, and the remaining 10% was incinerated.
By creating a cradle-to-cradle LCA plan for PP and RPLA packaging materials, the PP and PLA input flows of the production stage come from the recycling stage as PP and PLA plastics as renewable materials, with a 90–100% value. The other plastic streams were incinerated in a waste incineration plant.
Since CB, CBC, and PP materials are produced in Poland, a Polish electricity grid mix has been introduced in the production stage of all packaging materials. Only RPLA is produced in Germany. All other input currents (kraft paper, tap water from surface, offset ink, corn starch, cellulose, etc.) and all waste management processes were simulated under EU-27 conditions.
Wastewater streams go to municipal wastewater treatment. Road transport, using Euro 6 trucks with diesel mix and a distance of 100 km, was considered for the raw materials.
In relation to cradle-to-cradle assessments concerning the recycling scenario, the normalized and weighted environmental impacts for the production stage of each packaging material are summarized in Table 2. The normalized, weighted values obtained based on EU and Europe references enabled a comparison of the total environmental impact of the packaging materials.
Table 2.
Normalized and weighted impacts regarding cradle-to-cradle LCA (looping between end-of-life and production stages) based on the CML 2016 method in kilograms. Normalization method: EU 25 + 3, 2000, excl. biogenic carbon (region equivalents). Weighting method: Sphera LCIA Survey, 2012, Europe, excl. biogenic carbon (region equivalents). (Functional unit: 1 piece of packaging material.)
According to Table 2, CBC packaging had the highest total environmental impact (1.87 × 10⁻¹² kg), more than four times that of RPLA. It confirms that the environmental impact of multi-layer or coated cardboard packaging (CBC) can be significantly higher than that of recycled plastic (RPLA) alternatives. PP packaging results are extremely favorable: with the lowest total impact (4.28 × 10⁻¹³ kg), it shows a low GWP value (4.61 × 10⁻¹⁴) and a moderate toxicological potential. This suggests that mechanically recycled polypropylene can be competitive in terms of sustainability compared to paper-based packaging. Interestingly, although RPLA (probably PLA-based, biopolymer) is known as an “environmentally friendly” material, its FAETP value (5.51 × 10⁻¹⁴) is exceptionally high—this would be worth investigating in more detail, as freshwater ecotoxicity could pose a significant risk to natural waters. CB (conventional cardboard) shows a relatively balanced environmental profile but still has twice the environmental impact of PP.
We have extended our analysis of the recycling scenario to include a weak point analysis. We compared the normalized and weighted values as a percentage for the four tested packaging materials, assuming that the total value of the impact categories was 100%. As a result of the vulnerability analysis, we found that RPLA is the most sensitive to changes for most impact categories. It shows an exceptionally high sensitivity to freshwater aquatic ecotoxicity and ADP fossil categories. On the other hand, it is not so sensitive to ADP elements and marine aquatic ecotoxicity effects. CB packaging material is not fundamentally sensitive to changes. However, CBC packaging is extremely sensitive to changes in ADP elements and marine ecotoxicity potentials. PP packaging is more sensitive to terrestrial ecotoxicity potential effects compared to other packaging materials. None of the packaging materials shows sensitivity to ozone layer depletion.
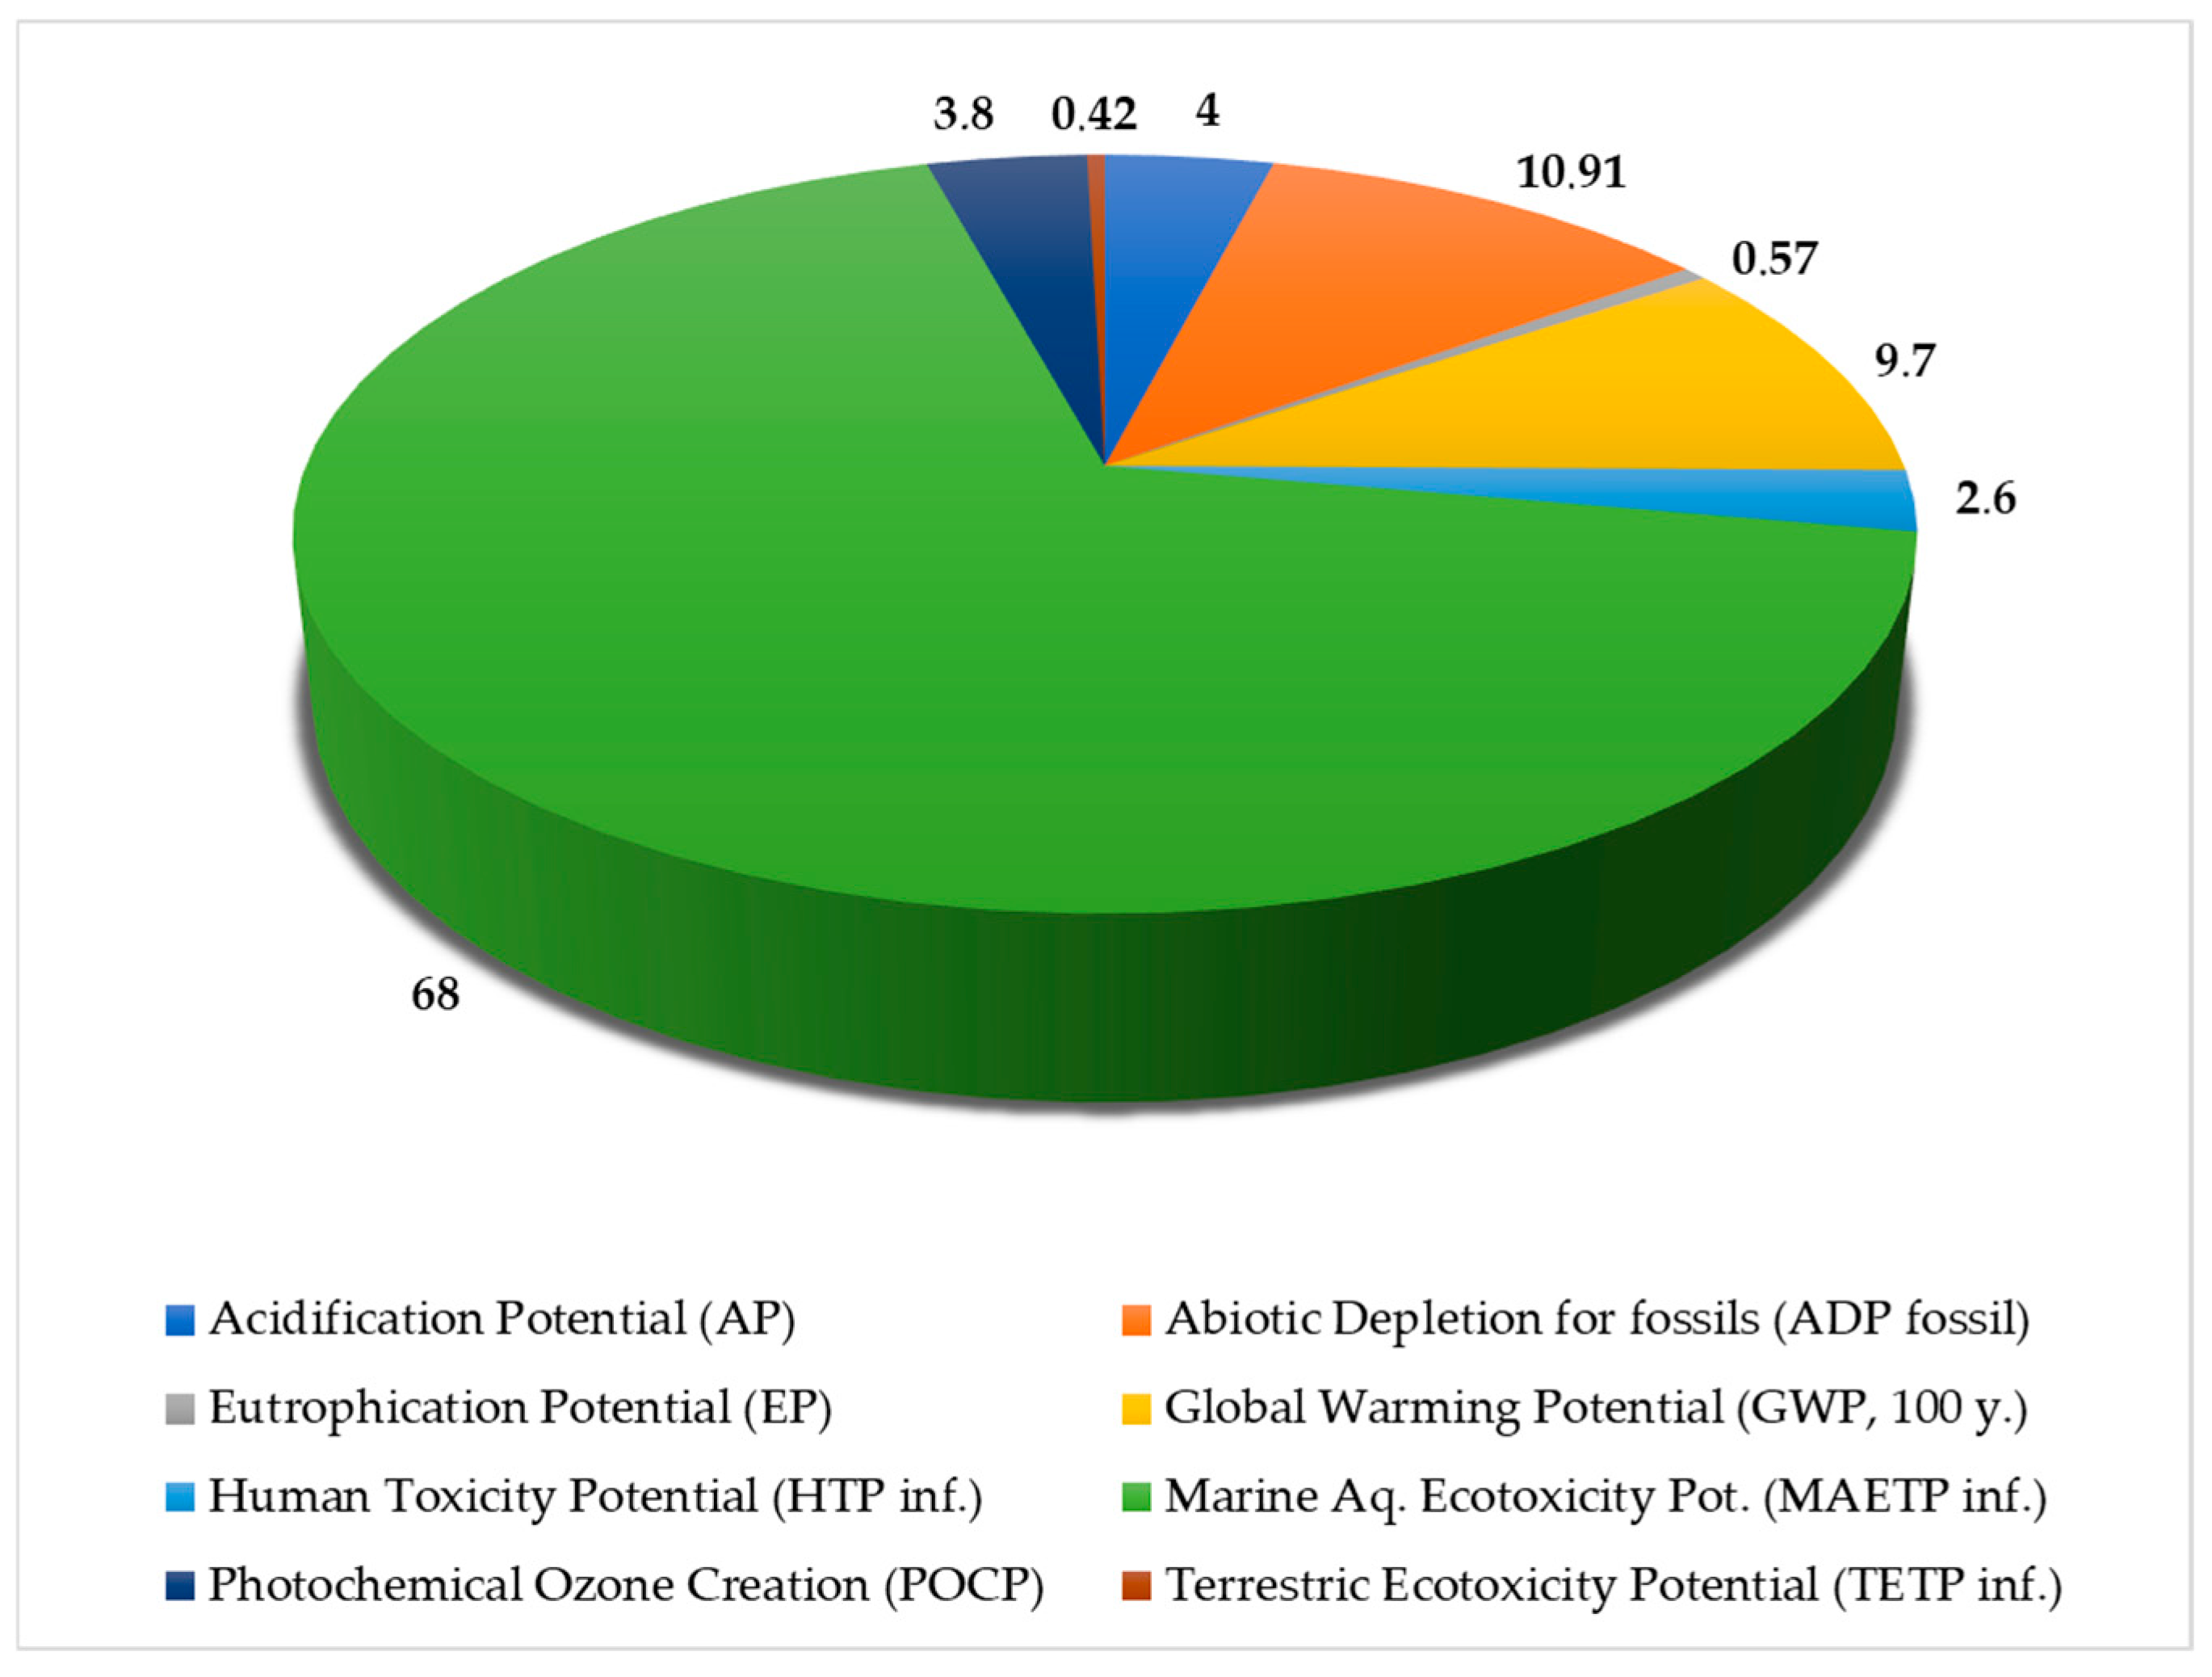
In the case of cradle-to-cradle analysis, Figure 2 presents the percentage distribution of main impact categories regarding CB packaging (P1), applying normalization and weighting methods. Here, the values of abiotic depletion for elements (ADPE), ozone layer depletion (ODP, steady state), and freshwater aquatic ecotoxicity (FAETP) are so low that they are negligible in the analysis. Therefore, 8 impacts were depicted in the pie charts instead of 11 impact categories. Figure 3 shows the percentage distribution of impact categories regarding CBC packaging (P2) after normalization and weighting. The ozone layer depletion potential, freshwater ecotoxicity, and terrestrial ecotoxicity potential (TETP) are quite low; therefore, we consider them negligible in Figure 3, and only eight effects are displayed here.

Figure 2.
Impact percentage distribution of main impacts regarding packaging CB by CML 2016 excluding biogenic carbon impact assessment method. Normalization method: CML 2001–Jan. 2016, EU25 + 3, year 2000, excl. biogenic carbon (region equivalents). Weighting method: Sphera LCIA Survey 2012, Europe, CML 2016, excl. biogenic carbon (region equivalents weighted). (Functional unit: 1 piece of packaging.)
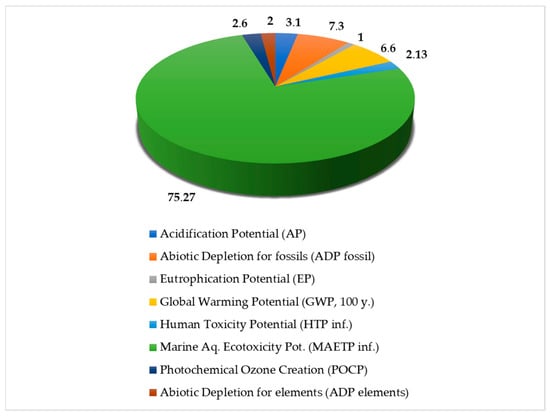
Figure 3.
Impact percentage distribution of main impacts regarding packaging CBC by CML 2016 excluding biogenic carbon impact assessment method. Normalization method: CML 2001–Jan. 2016, EU25 + 3, year 2000, excl. biogenic carbon (region equivalents). Weighting method: Sphera LCIA Survey 2012, Europe, CML 2016, excl. biogenic carbon (region equivalents weighted). (Functional unit: 1 piece of packaging.)
Figure 2 clearly shows that marine ecotoxicity accounts for 68% of the environmental impact of CB packaging, followed by fossil resource demand at 10.91% and then global warming at 9.7%. The remaining 10% is divided between the other impact categories. Based on Figure 3, marine ecotoxicity represents an even larger share of the total when CBC packaging is used than when CB packaging is used. The ADP fossil and GWP values also show a decreasing trend. The combined impact of the other impact categories examined is around 10%.
Figure 4 presents the percentage distribution of impact categories regarding PP packaging (P3). The ozone layer depletion, freshwater aquatic ecotoxicity, and abiotic depletion (elements) are negligible. Figure 5 presents the percentage distribution of impact categories regarding RPLA packaging (P4). In this case, ozone layer depletion and abiotic depletion for elements are negligible. Therefore, nine impact categories are exceptionally depicted here.
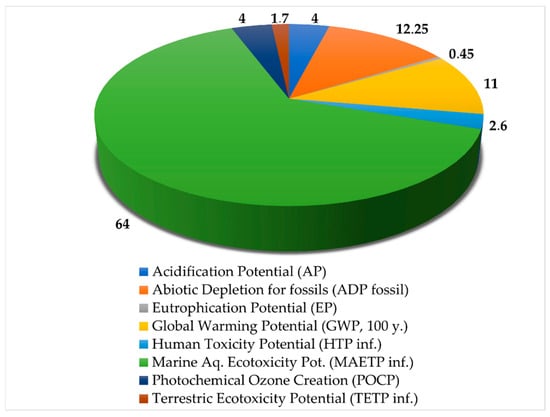
Figure 4.
Impact percentage distribution regarding packaging PP by CML 2016 excluding biogenic carbon impact assessment method. Normalization method: CML 2001–Jan. 2016, EU25 + 3, year 2000, excl. biogenic carbon (region equivalents). Weighting method: Sphera LCIA Survey 2012, Europe, CML 2016, excl. biogenic carbon (region equivalents weighted). (Functional unit: 1 piece of packaging.)
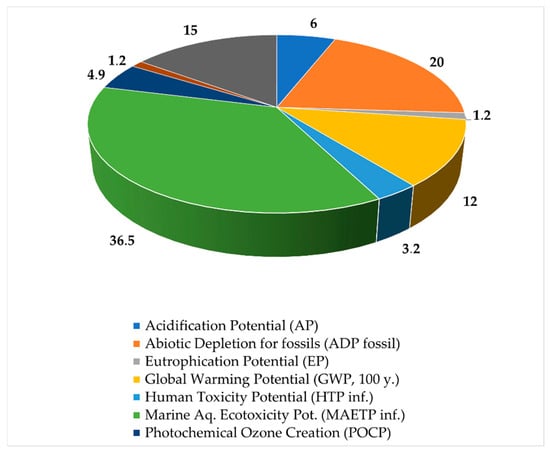
Figure 5.
Impact percentage distribution regarding packaging RPLA by CML 2016 excluding biogenic carbon impact assessment method. Normalization method: CML 2001–Jan. 2016, EU25 + 3, year 2000, excl. biogenic carbon (region equivalents). Weighting method: Sphera LCIA Survey 2012, Europe, CML 2016, excl. biogenic carbon (region equivalents weighted). (Functional unit: 1 piece of packaging.)
Figure 4 summarizes that although the marine ecotoxicity potential of PP packaging is only 64%, the abiotic depletion for fossils and global warming potential are also higher.
Regarding the impacts of RPLA packaging shown in Figure 5, marine ecotoxicity has decreased. However, the environmental impact on the aquatic ecosystem has increased, with ecotoxicity accounting for 51.5%, ADPF representing 20%, and GWP representing 12%. The percentage composition of the other impact categories examined has also increased to 16.5%.
Figure 6 summarizes the percentage distribution of impact categories.
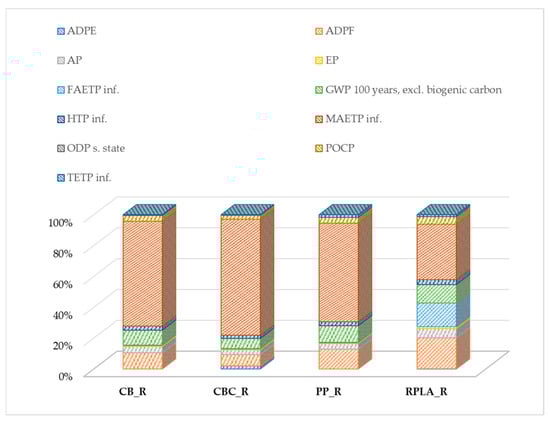
Figure 6.
The results of recycling for the four types of packaging in percent. Normalization method: CML 2001–Jan. 2016, EU25 + 3, year 2000, excl. biogenic carbon (region equivalents). Weighting method: Sphera LCIA Survey 2012, Europe, CML 2016, excl. biogenic carbon (region equivalents weighted). (Functional unit: 1 piece of packaging.)
The combined results in Table 2 and Figure 6 clearly show that in the case of recycling, the global warming potential and marine ecotoxicity dominate for CBC. Comparison of environmental impacts: CBC > RPLA > PP > CB.
Cradle-to-cradle analysis reveals apparent differences between the environmental performance of individual packaging materials. It is worth noting that paper-based packaging is not necessarily more environmentally friendly in all dimensions, while recycled plastics (PP and RPLA) show more favorable results in several categories (eutrophication and abiotic element depletion for PP and marine ecotoxicity for RPLA). This reinforces the importance of knowledge-based, metrics-supported packaging design in the circular economy.
3.2. Environmental Impacts for Composting (SC2)
During composting, we examined enclosed composting, including compost application and crediting, in an enclosed composting plant without the collection and transport of waste. This composting method involves producing and utilizing good-quality compost, with 35% dry matter and a C:N ratio of 26.8.
The composting model allows for assessing environmental impacts, including emissions and resource consumption, based on specific input compositions defined by dry matter content, carbon-to-nitrogen (C:N) ratio, and material type. The life cycle inventory (LCI) data is specific to enclosed composting of waste and covers essential processes like pre-treatment, post-treatment, sieving, compost utilization, and the crediting of substituted humus, assuming that compost application helps sustain soil carbon and nitrogen levels alongside NPK fertilizers.
Regarding the composting scenario in the framework of cradle-to-grave analysis, Table 3 presents the calculated environmental impacts for the four packaging systems, using the CML 2016 life cycle impact assessment method. Figure 7 summarizes the percentage distribution of impact categories.
Table 3.
Normalized and weighted impacts regarding cradle-to-grave LCA (with composting EoL scenario) based on CML 2016 method in kilograms. Normalization method: EU 25 + 3, 2000, excl. biogenic carbon (region equivalents). Weighting method: Sphera LCIA Survey, 2012, Europe, excl. biogenic carbon (region equivalents). (Functional unit: 1 piece of packaging material.)
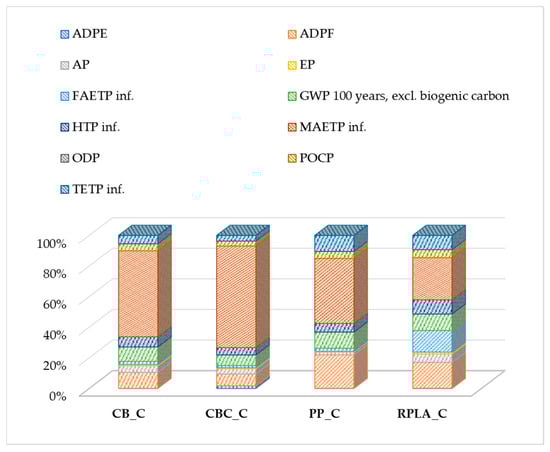
Figure 7.
Impact percentage distribution regarding composting by CML 2016 excluding biogenic carbon impact assessment method. (Functional unit: 1 piece of packaging).
Based on the environmental impact assessment of composting, ADP fossil represents the highest load in the case of CBC, while the lowest rate is observed in the case of RPLA. Regarding global warming, PP shows the second most substantial impact; its lowest rate is in the case of CBC. It can also be observed that the rate of fresh aquatic ecotoxicity (FAETP) increases in the case of RPLA.
Evaluating the environmental impact of composting reveals a clear hierarchy: CBC_C demonstrates the most significant impact, followed by CB_C, PP_C, and RPLA_C. This comparison underscores the superiority of CBC_C in minimizing environmental strain and highlights the importance of selecting the most effective composting methods for a sustainable future.
3.3. Environmental Impacts for Landfilling (SC3)
Regarding landfilling, Table 4 presents the calculated environmental impacts for the four packaging systems, using the CML 2016 life cycle impact assessment method. The functional unit was 1000 kg of packaging.
Table 4.
Normalized and weighted impacts regarding cradle-to-grave LCA (with landfilling EoL scenario) based on the CML 2016 method in kilograms. Normalization method: EU 25 + 3, 2000, excl. biogenic carbon (region equivalents). Weighting method: Sphera LCIA Survey, 2012, Europe, excl. biogenic carbon (region equivalents). (Functional unit: 1 piece of packaging material.)
Figure 8 summarizes the percentage distribution of impact categories. The distribution of the environmental impact ratio for packaging landfilling is as follows: ADP fossil is the largest in all four cases, followed by GWP in the cases of PP and RPLA.
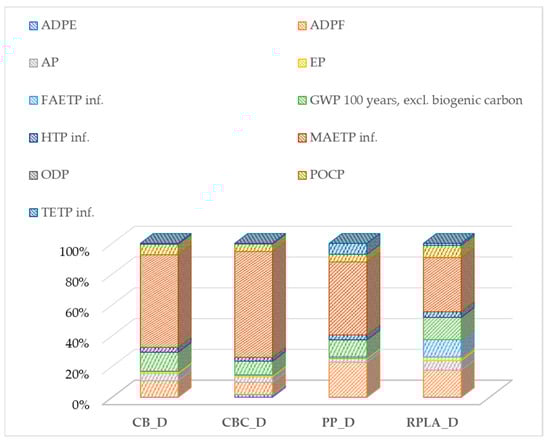
Figure 8.
Impact percentage distribution regarding disposal by CML 2016 excluding biogenic carbon impact assessment method. (Functional unit: 1 piece of packaging).
3.4. Environmental Impacts for Incineration (SC4)
Regarding conventional incineration, Table 5 presents the calculated environmental impacts for the four packaging systems, using the CML 2016 life cycle impact assessment method. Figure 9 summarizes the percentage distribution of impact categories.
Table 5.
Normalized and weighted impacts regarding cradle-to-grave LCA (with incineration EoL scenario) based on CML 2016 method in kilograms. Normalization method: EU 25 + 3, 2000, excl. biogenic carbon (region equivalents). Weighting method: Sphera LCIA Survey, 2012, Europe, excl. biogenic carbon (region equivalents). (Functional unit: 1 piece of packaging material.)
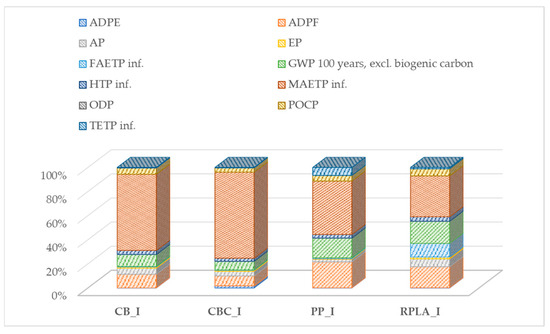
Figure 9.
Impact percentage distribution regarding all packaging by CML 2016 excluding biogenic carbon impact assessment method. (Functional unit: 1 piece of packaging).
The distribution of environmental impacts caused by conventional incineration shows that marine ecotoxicity still represents the most significant burden, followed by the impact of fossil fuels and global warming. However, in the case of RPLA, freshwater ecotoxicity is 10%.
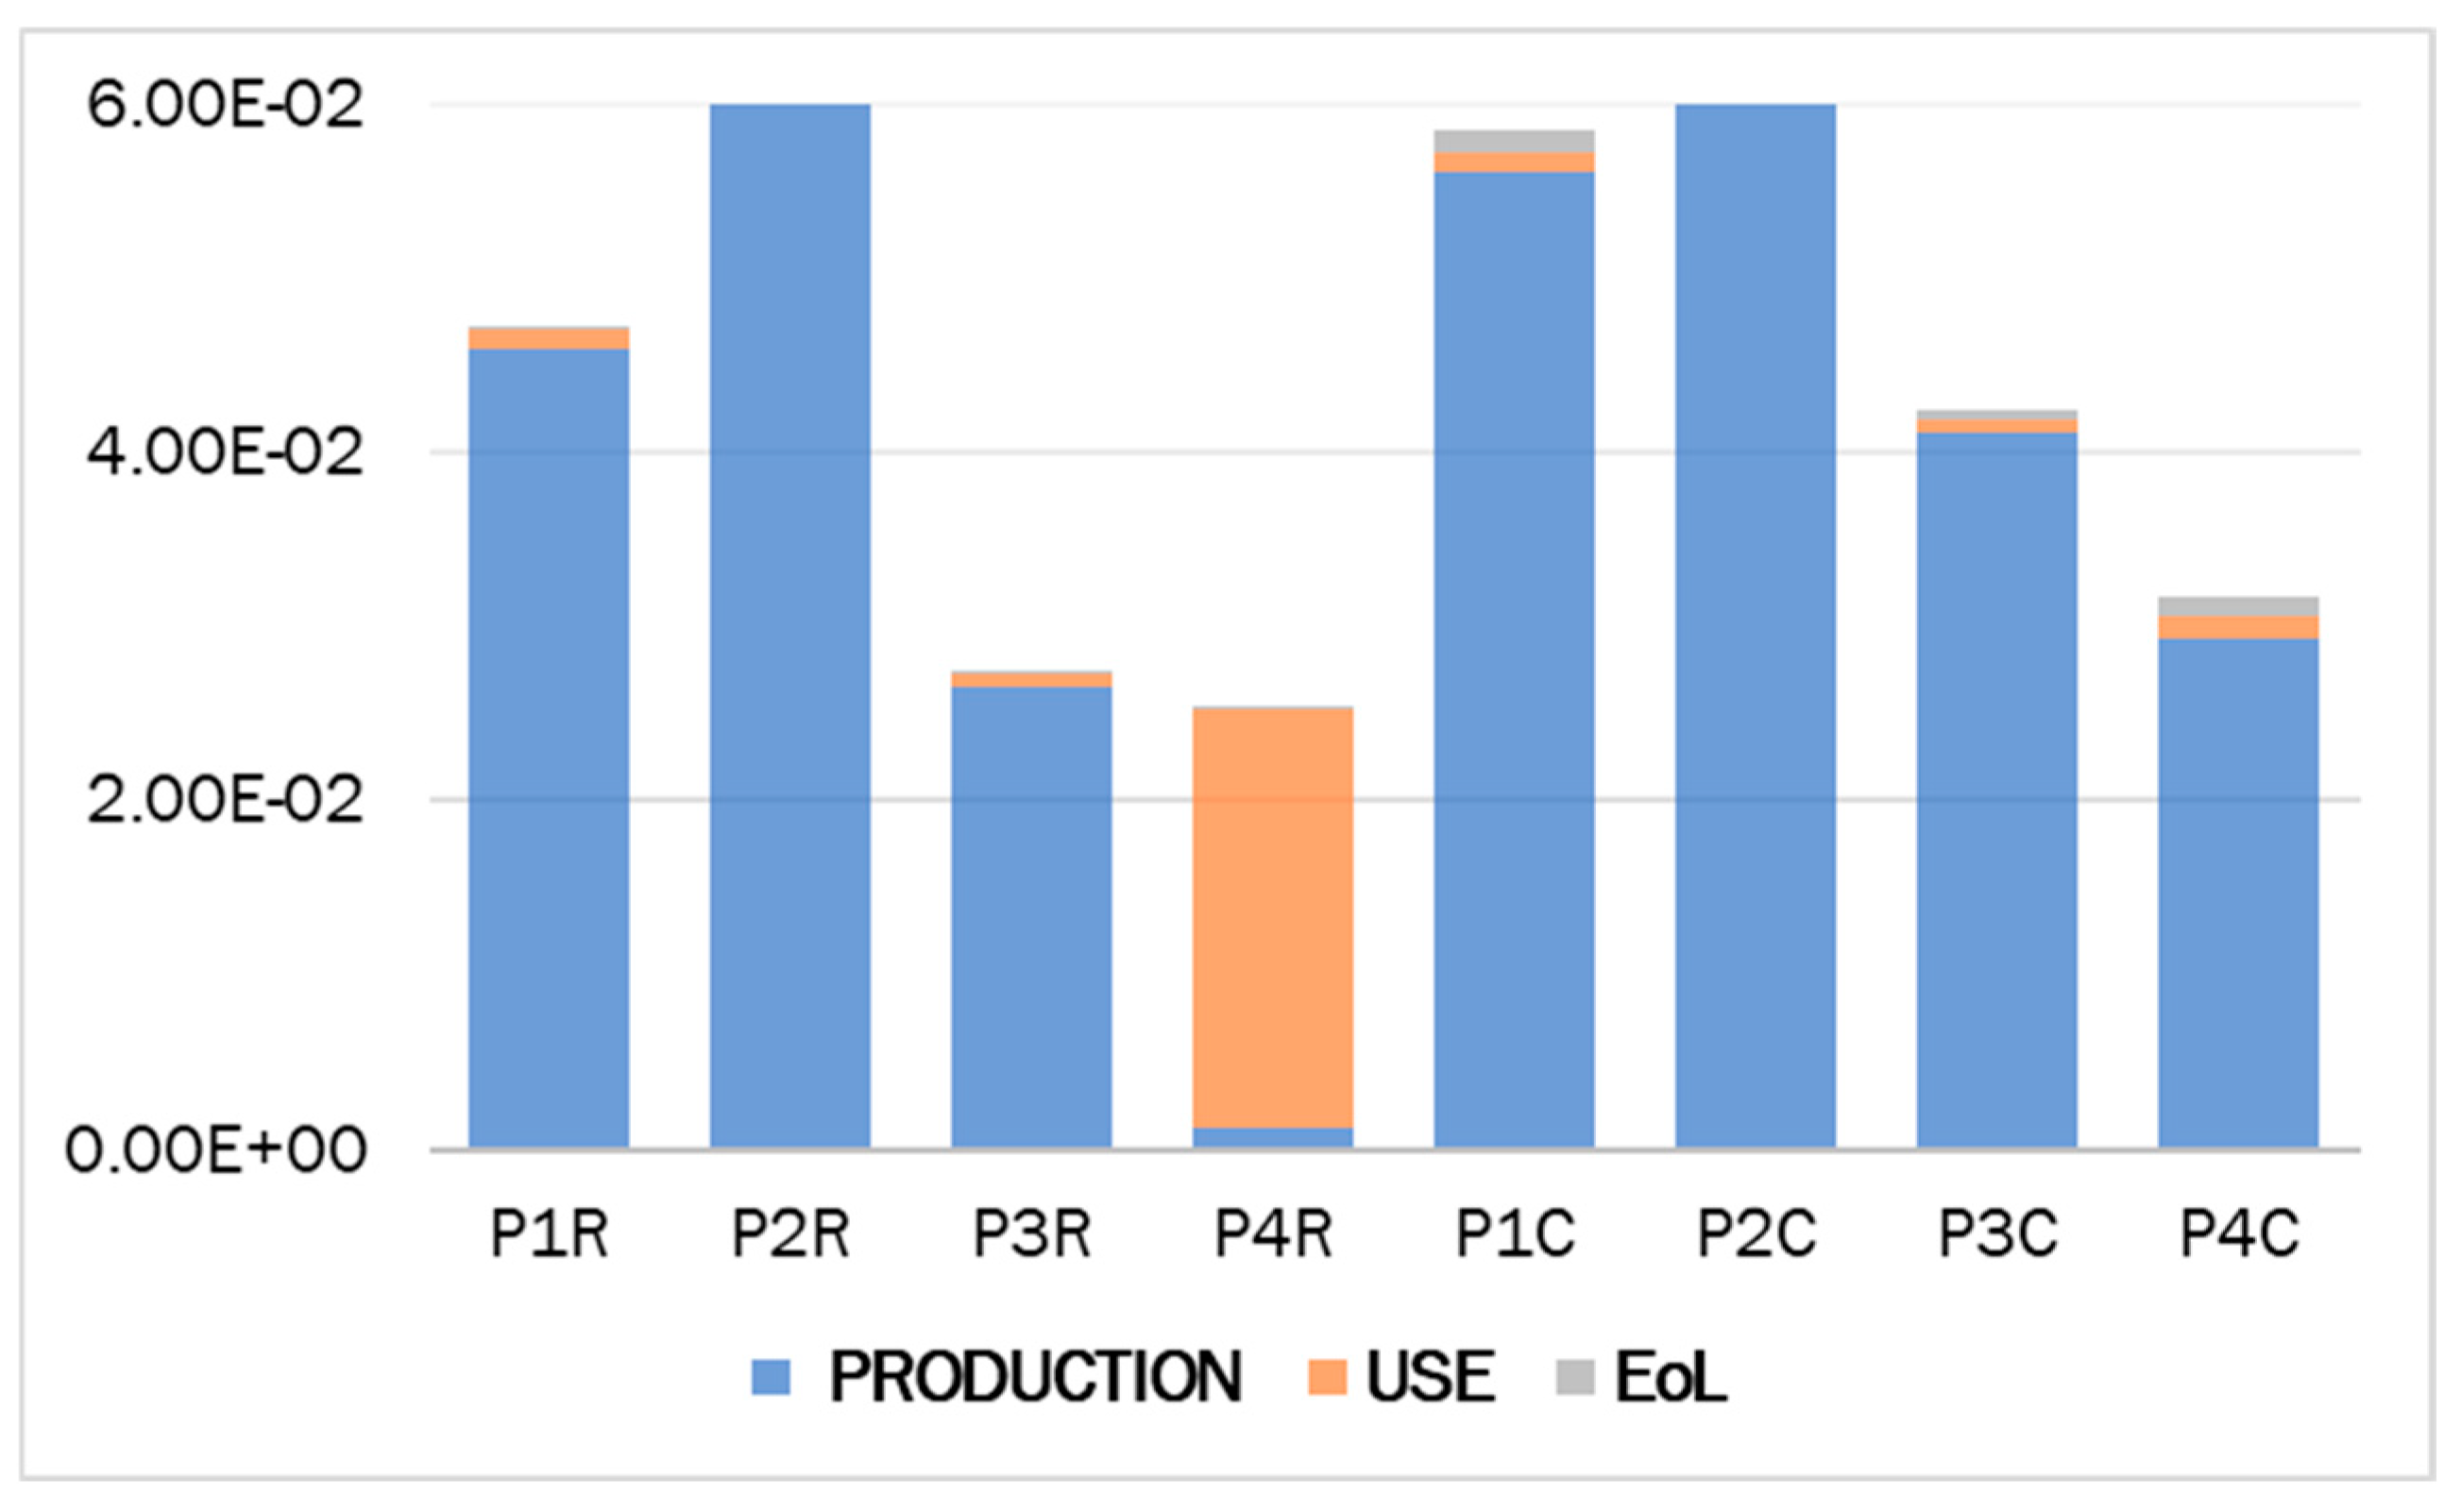
3.5. Global Warming Potential of Life Cycle Stages
An important aspect is that we separately identify the value of the global warming potential (GWP) regarding the life cycle stages of the four tested packaging materials. Figure 10 compares the global warming potential of recycling and composting, and Figure 11 shows the values of disposal and conventional incineration in kg CO2 equation.
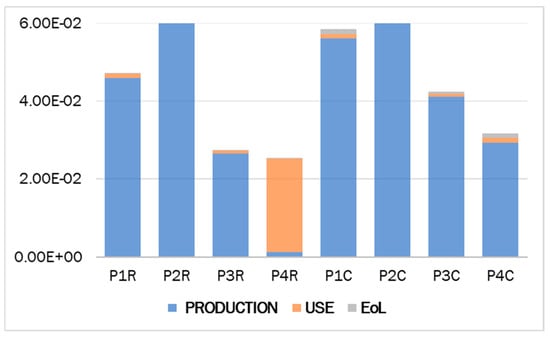
Figure 10.
Comparison of GWP (100 years, excluding biogenic carbon) between recycling (R) and composting (C). Functional unit: 1 piece of packaging [kg CO2—equation]. Explanations: P1 = packaging 1 (CB), P2 = packaging 2 (CBC), P3 = packaging 3 (PP), and P4 = packaging 4 (RPLA).

Figure 11.
Comparison of GWP (100 years, excluding biogenic carbon) between disposal (D) and incineration (I). Functional unit: 1 piece of packaging [kg CO2—equation]. Explanations: P1 = packaging 1 (CB), P2 = packaging 2 (CBC), P3 = packaging 3 (PP), and P4 = packaging 4 (RPLA).
Additionally, we calculated the carbon footprint for the quantity of packing materials per 1000 kg of blueberries, shown in Table 6, for each waste treatment process scenario. During the calculations, the unit of each type of packaging was 0.250 kg.
Table 6.
Carbon footprint comparison for packaging 1000 kg of blueberries.
Based on the results of Table 6, it can be said that when examining the individual waste treatment scenarios, the RPLA packaging material has the lowest carbon footprint for every end-of-life solution. In the case of recycling, the RPLA material is followed by PP, CB, and CBC packaging in terms of increasing the carbon footprint. The carbon footprint of CBC is outstanding, at 246 kg CO2 equation for 1000 kg of packaged blueberries. In the case of composting, the carbon footprint of CB is the highest, followed in descending order by PP, CBC, and RPLA. Regarding landfilling and incineration, the CF value for CBC packaging is also the highest (257 and 283 kg CO2 equation). Thus, overall, it can be said that when examining the waste management processes together, only in the case of composting does CBC not have the highest carbon footprint.
3.6. Sensitivity Analysis and Weak Point Analysis for EoL Scenarios
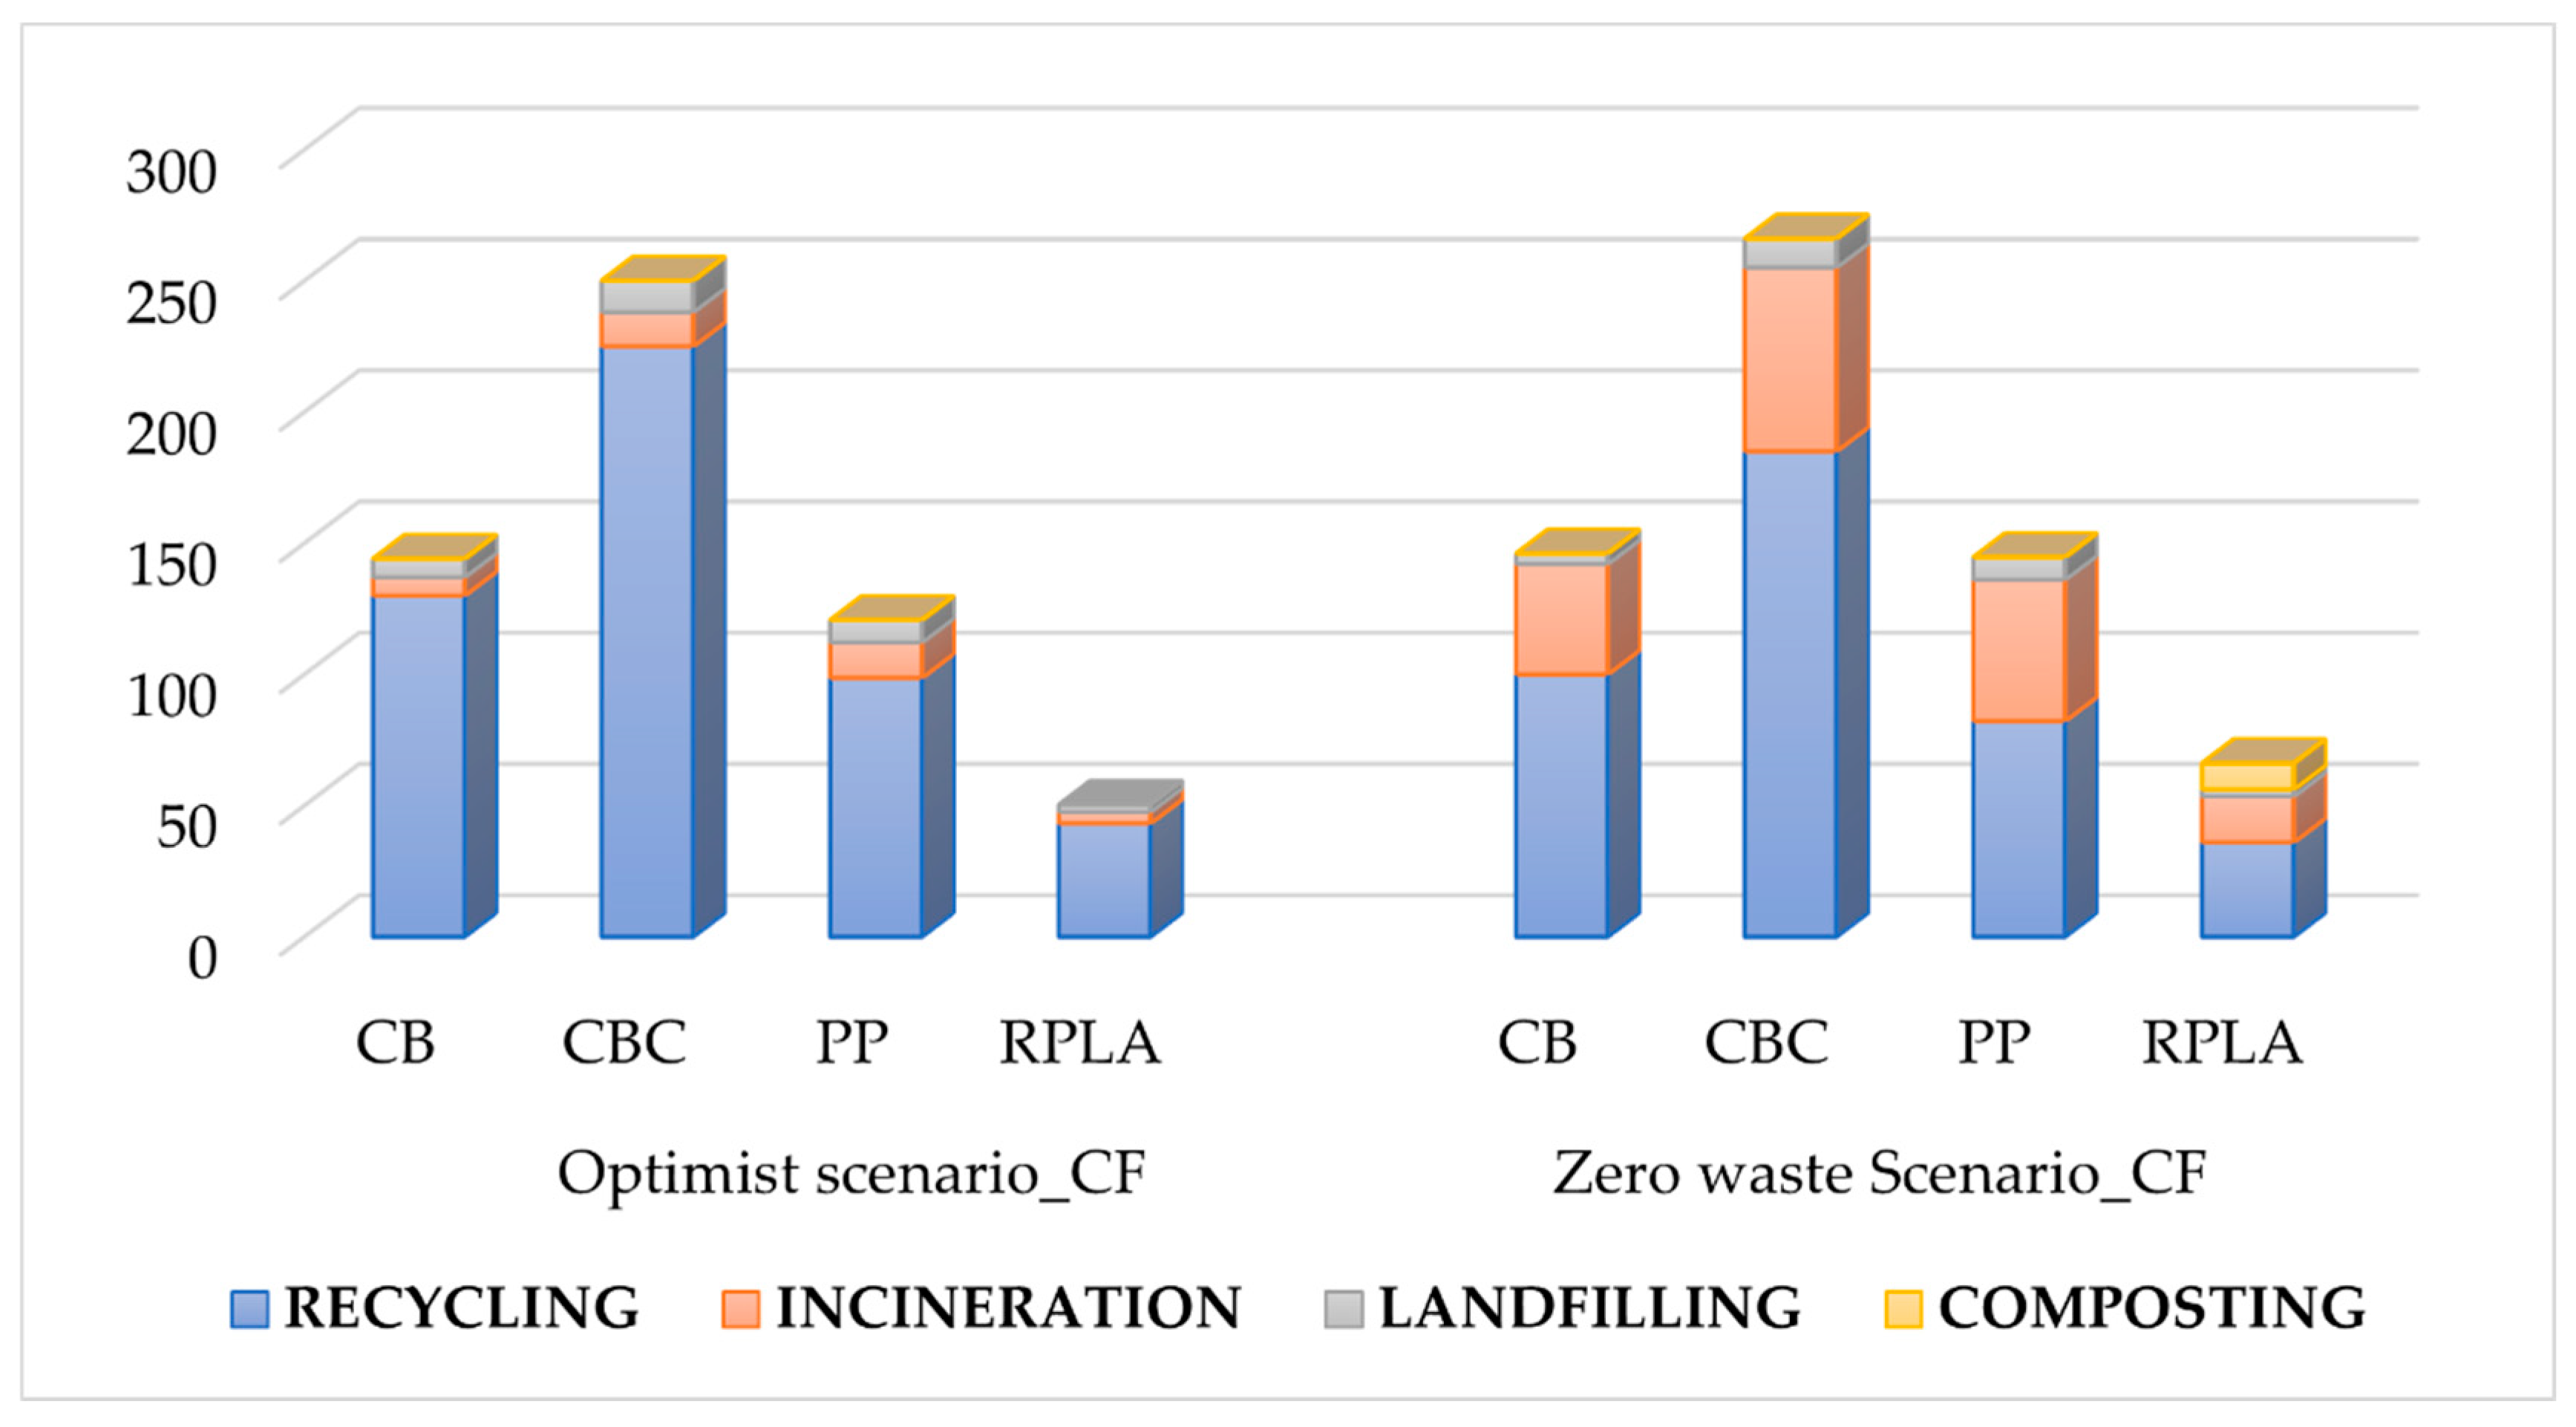
Given that incorporating a sensitivity analysis provides a deeper insight into the impacts of different recycling or disposal pathways, we extended our research work with a sensitivity analysis for an optimistic and EU-compliant zero waste scenario. Thus, we looked not only at a single EoL option (e.g., recycling only) but also at realistic mixtures that proportionally combine recycling, incineration, landfilling, and composting. We examined the four EoL scenarios using a carbon footprint indicator during the sensitivity analysis of the end-of-life of different packaging alternatives. The sensitivity analysis results are summarized in Table 7 and illustrated visually in Figure 12.
Table 7.
Results of sensitivity analysis.
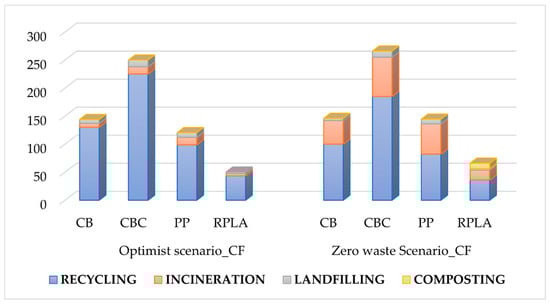
Figure 12.
Optimistic and zero waste EoL scenarios as a function of carbon footprint in kg CO2—eq for different packaging materials. Functional unit: 1000 kg of blueberry packaging.
As shown in Figure 12, the following are true:
- RPLA packaging consistently shows the lowest carbon footprint across all EoL scenarios, which may be due to its lightweight, recyclable, and partially compostable nature.
- Recycling always leads to a lower CF than incineration or landfilling, with the difference being particularly significant for CBC, where there is a saving of 37 kg CO2 equation. Compared to incineration, it is achieved for 1000 kg of berry packaging.
- PP packaging is more sensitive to changes in the EoL scenario, as its carbon footprint for incineration is more than 2.5 times higher than that of the recycling option (269.2 vs. 109.6 kg CO2 equation).
- Type CBC (2) behaves unfavorably in non-recycling scenarios, as its carbon footprint exceeds 190–280 kg CO2 equation for composting, landfilling, and incineration.
The sensitivity analysis for the EoL phase confirms that the chosen waste management pathway significantly influences the environmental performance of different packaging. Regarding carbon footprint, recycling is the most favorable option for all packaging types, while landfilling and incineration significantly increase the environmental burden. This highlights the role of circular waste management, especially for RPLA packaging, which also showed favorable results in most EoL scenarios. This sensitivity analysis shows that composting is a real alternative to biodegradable packaging, and its environmental impact is comparable to other EoL options.
Given that, when examining the recycling EoL scenario, the difference in the carbon footprint value for CBC packaging material between the optimistic and zero waste cases is particularly significant, we also performed a weak point analysis for this packaging material’s recycling case. Within this framework, we separately examined the effects of the management methods of individual input flows and outputs.
The weak point analysis was performed on 1000 kg of packaging material. As a result, we determined that if we consider each impact category as 100% in terms of input and output flows, then the electricity grid mix is the system’s weakest point. It influences POCP and ODP by 95%, GWP by 84%, and ADP fossil by 82%. It influences FAETP and TETP values by only 32–38%.
The corrugated board input as a flow increases all impact categories but primarily affects ADP elements by 26%. The lightweight wood input typically does not influence any impact; it is not fundamentally a weak point of the examined system. Glued laminated timber only increases POCP by 15%. The paint on the packaging increases FAETP by 17% but does not affect ODP. The non-recycled paper and board output stream increases the carbon footprint by 28% through incineration but has no significant impact on the other impact categories. The system’s weak point is wastewater treatment, which causes an increase of 19% in the EP value, 23% in the FAETP value, and 40% in the TETP value.
3.7. Total Environmental Impacts of Packaging Materials
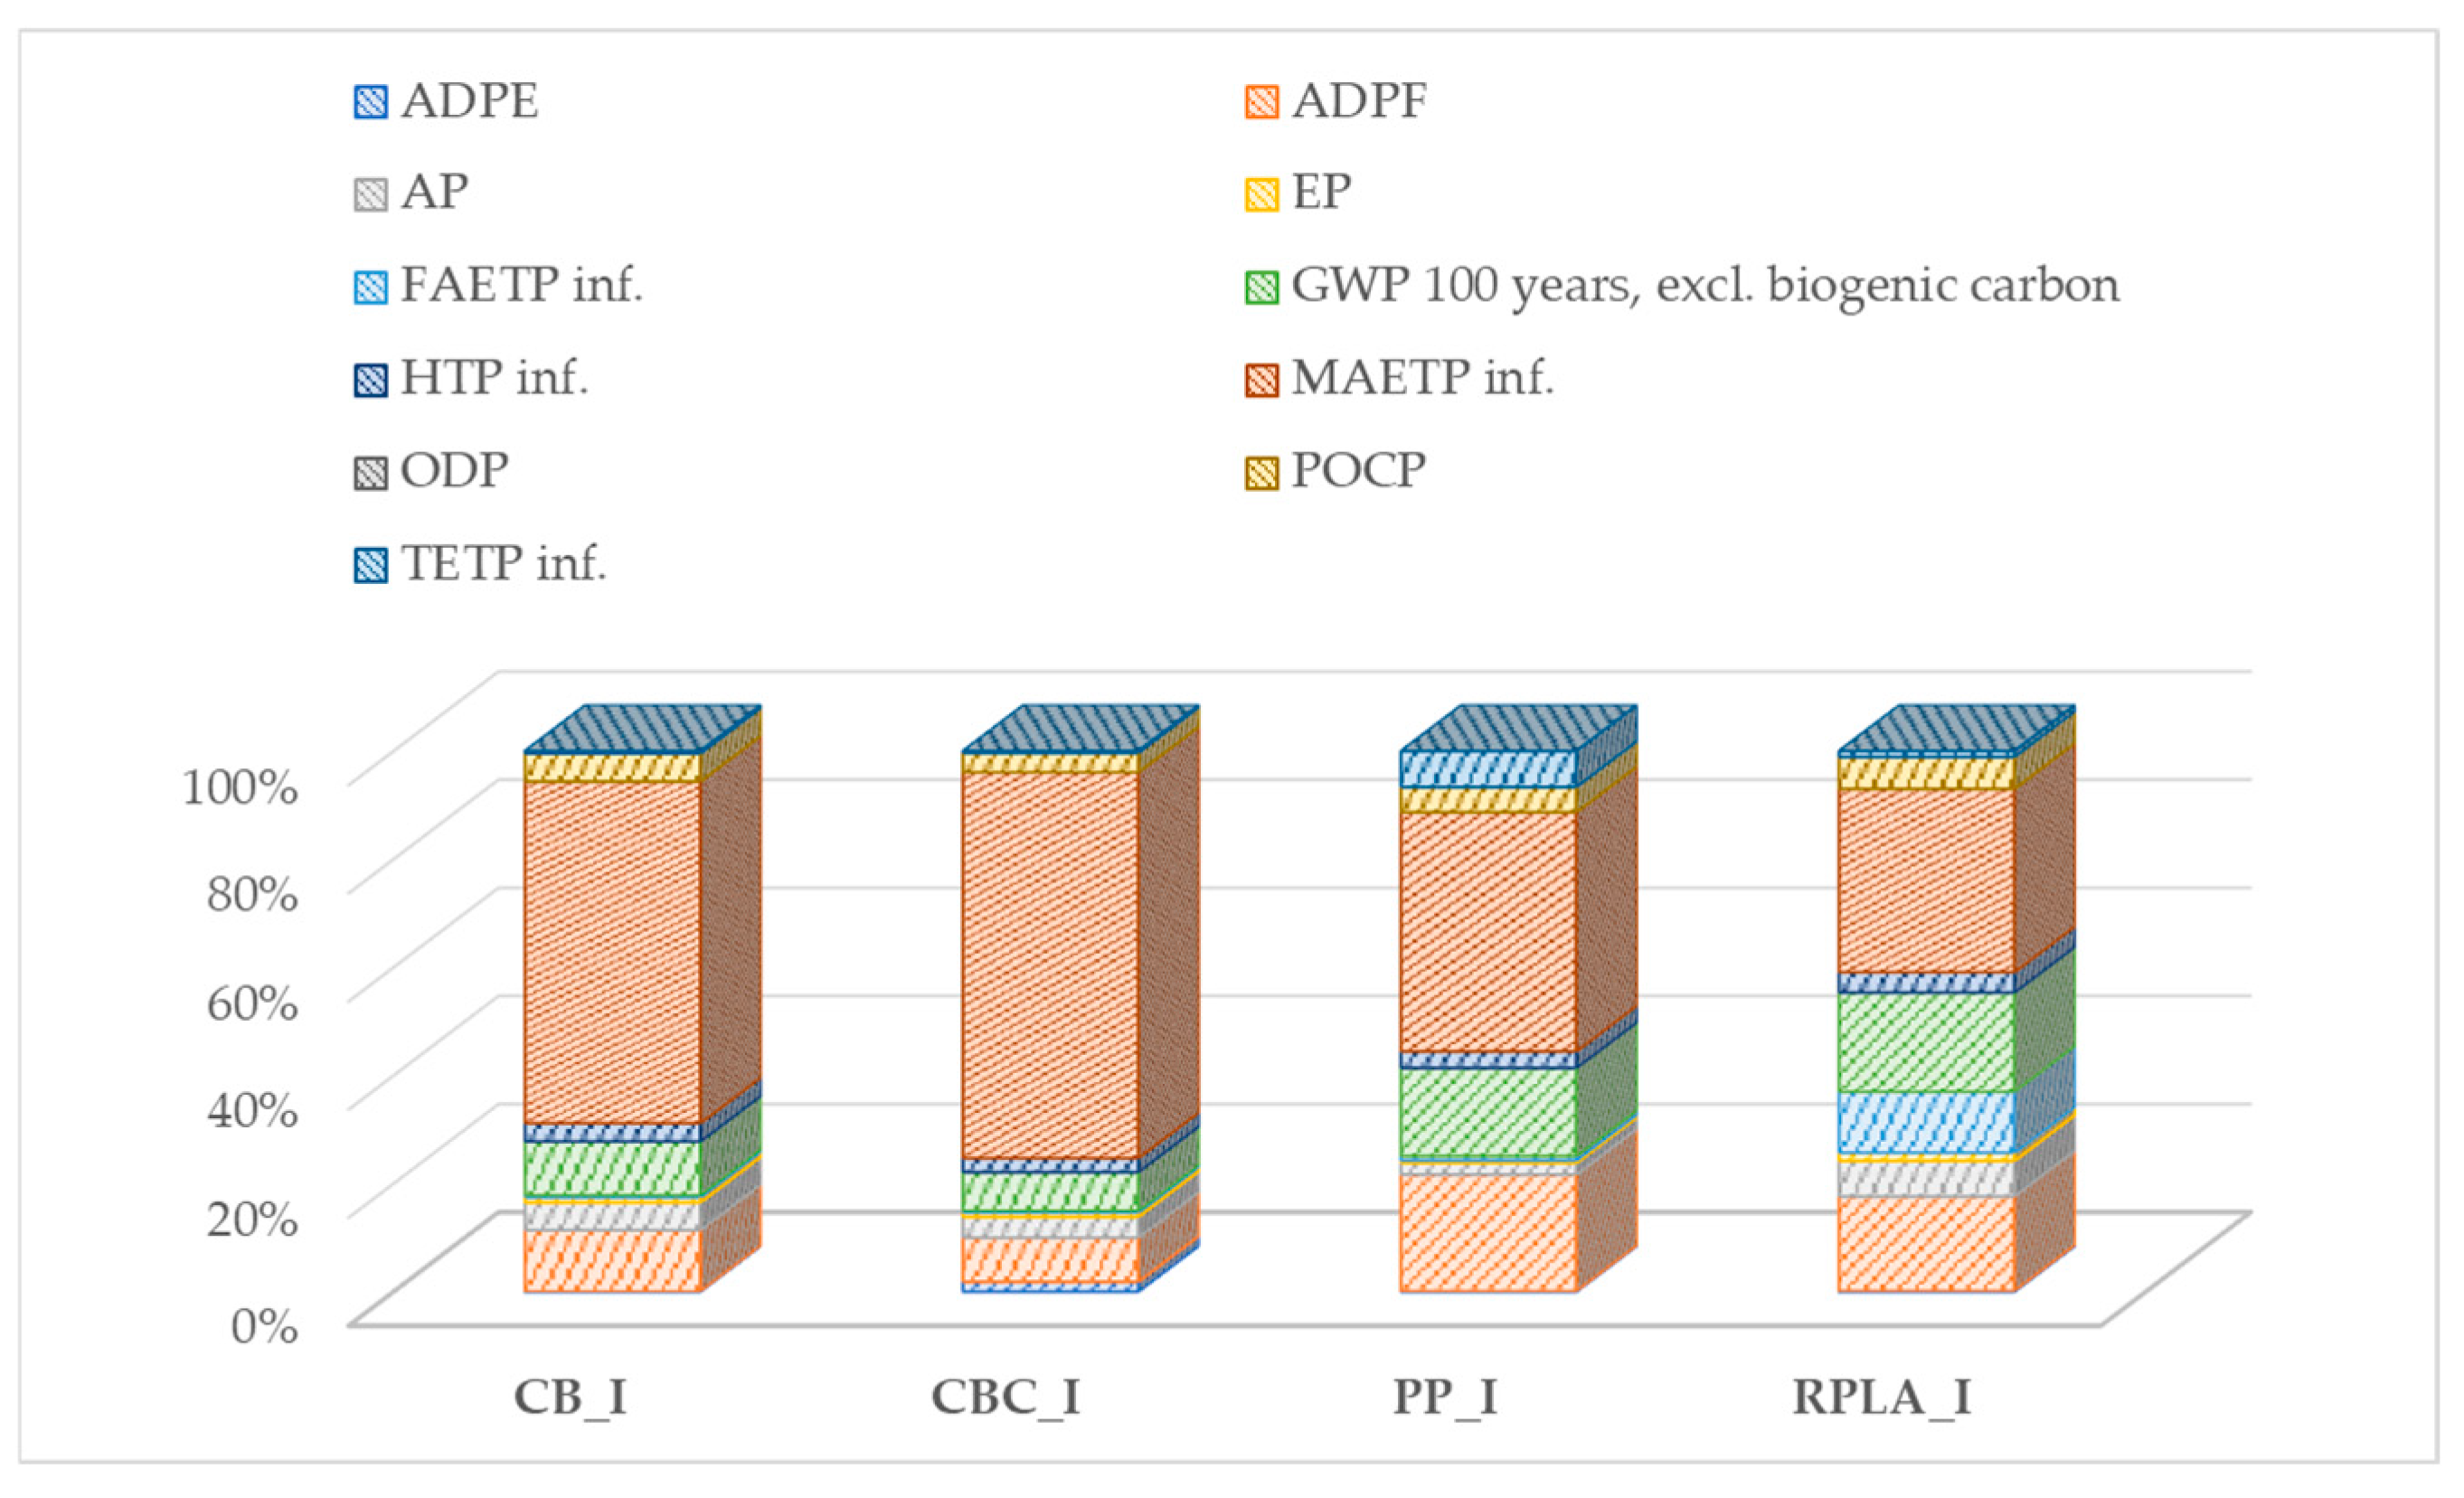
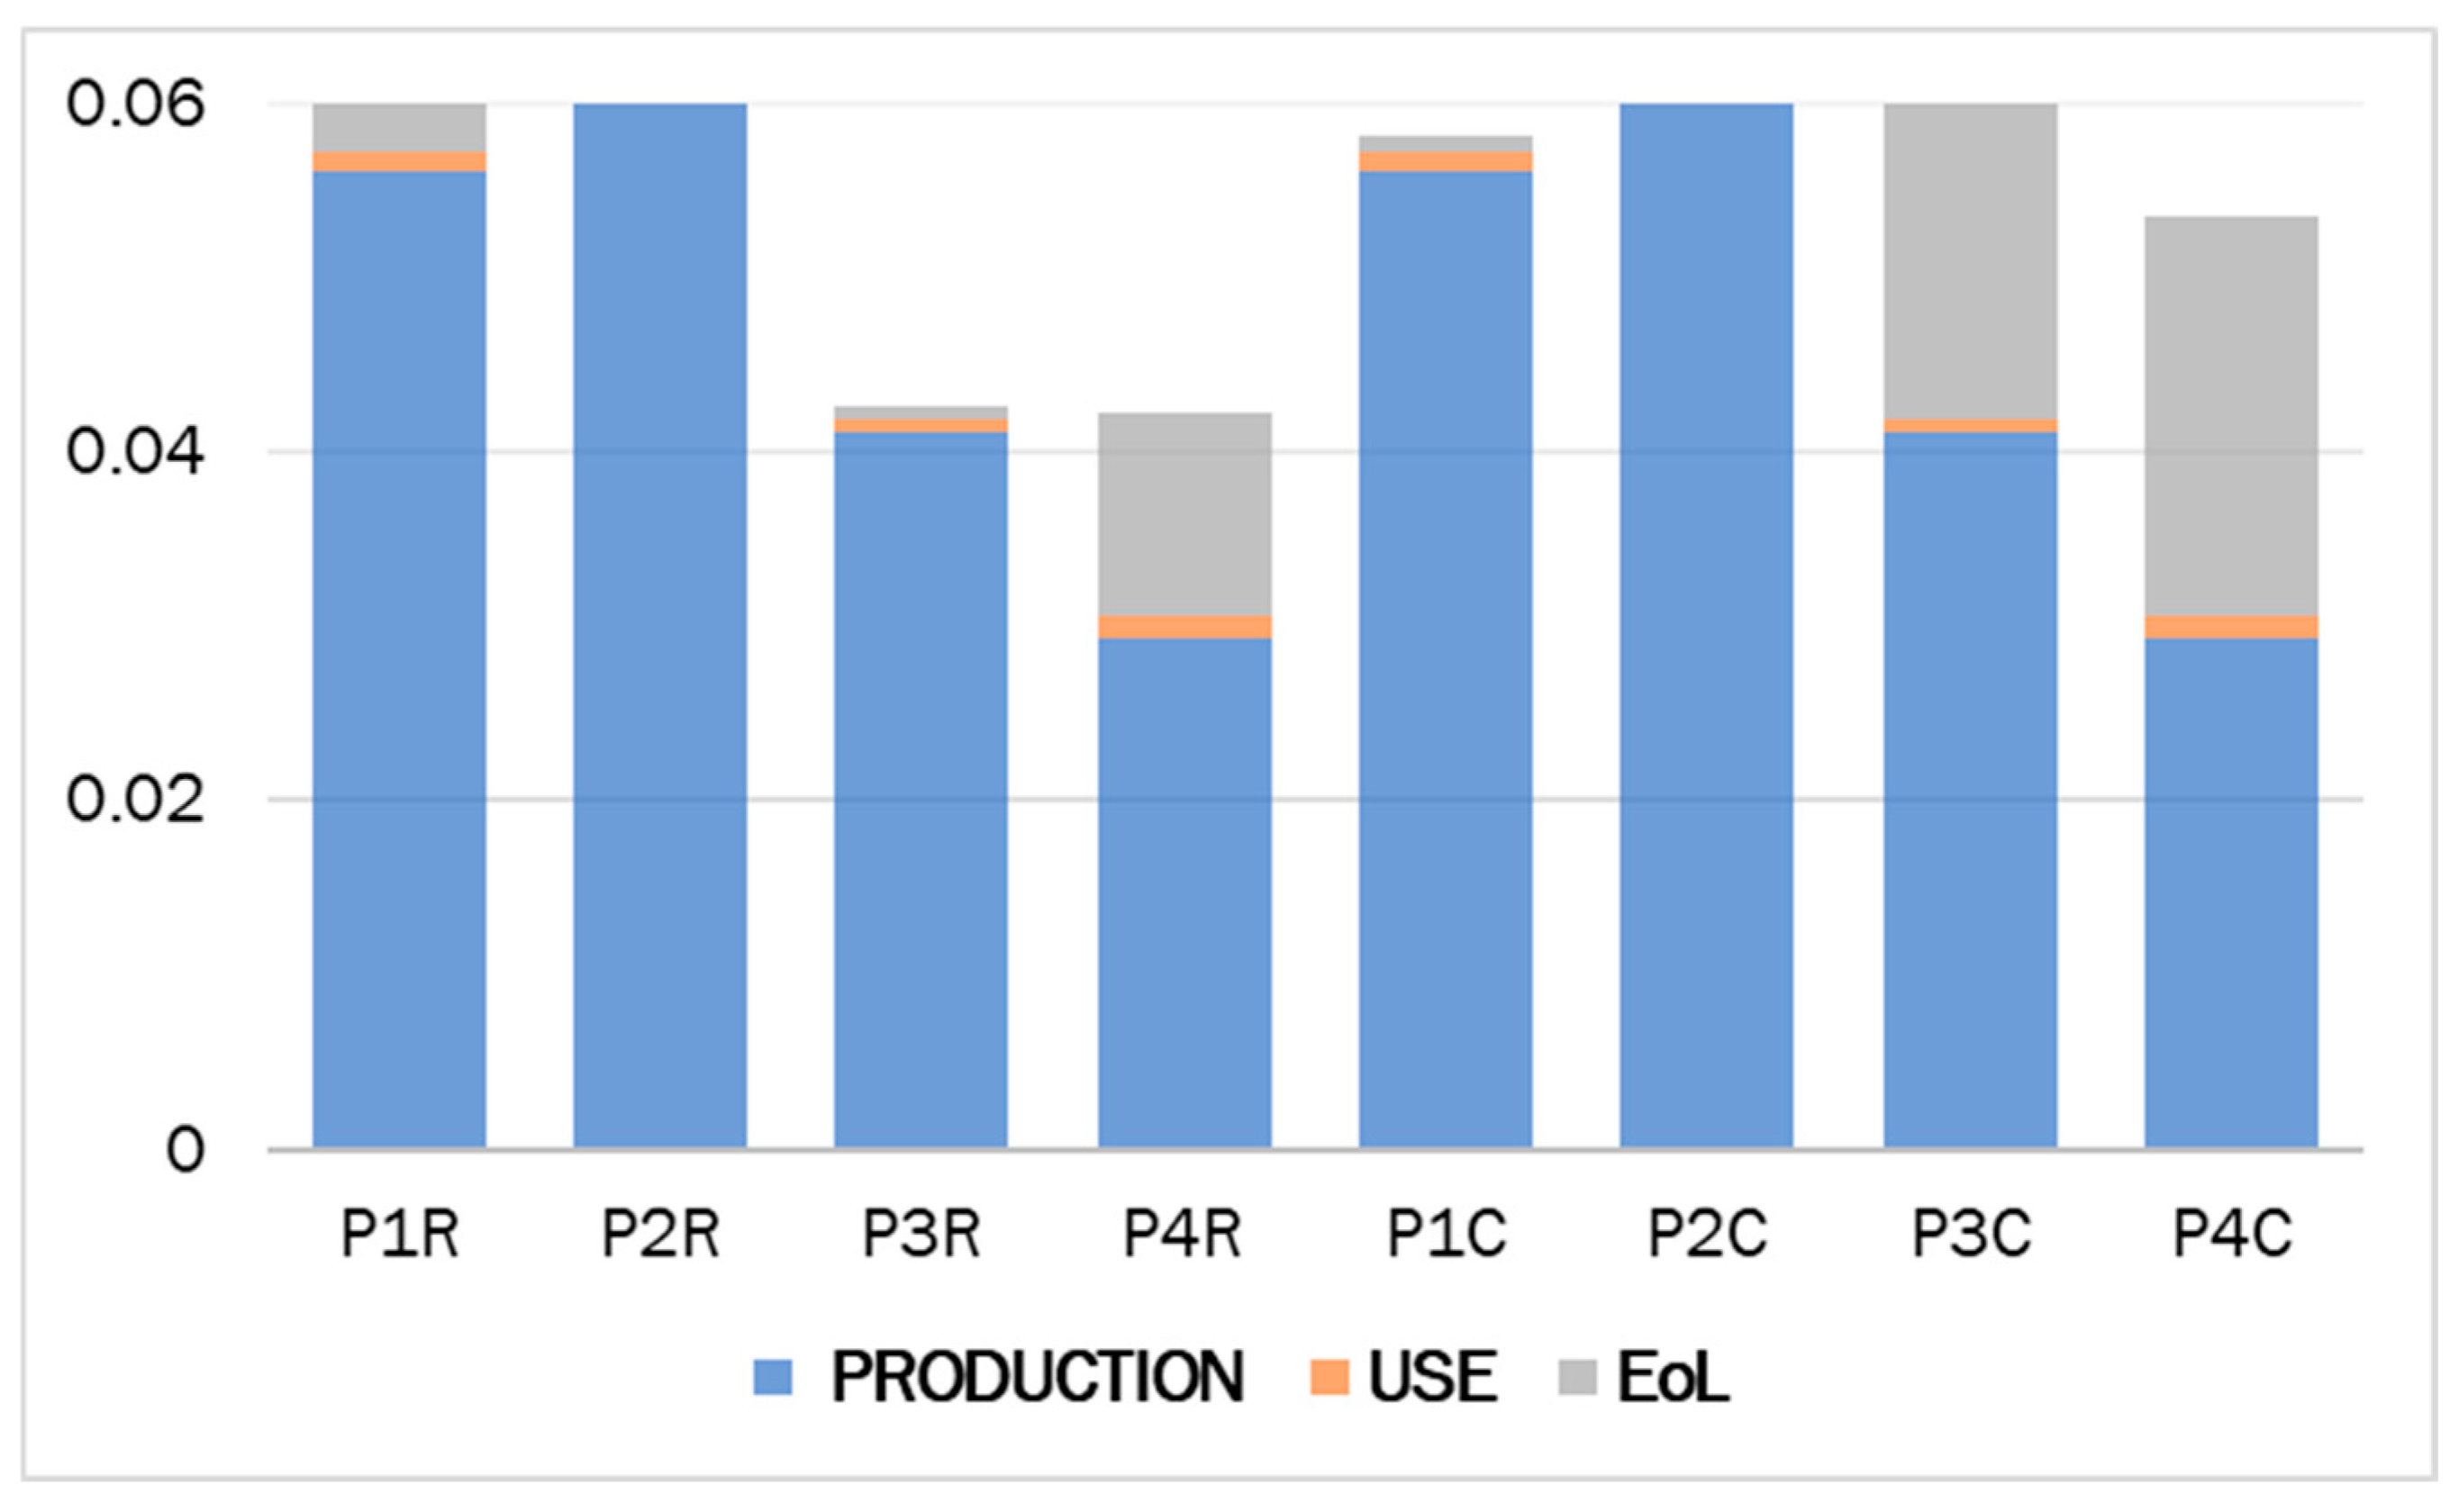
The next aspect of the study was to compare the total environmental impact of each packaging material over its whole life cycle, considering the waste treatment processes of the packaging material at the EoL phase. Regarding whole life cycle analysis in the framework of EoL scenarios, Figure 13 presents the normalized and weighted total environmental impacts for the four packaging systems, using the CML 2016 impact assessment method.
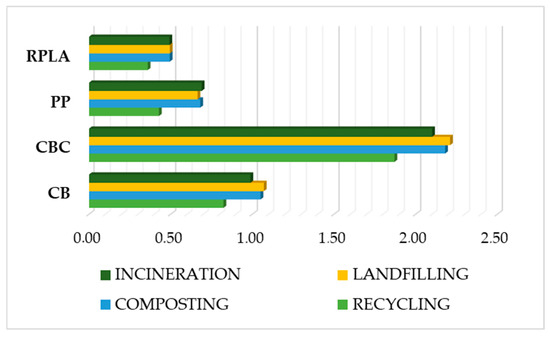
Figure 13.
Comparison of environmental impact values regarding packaging materials after normalization and weighting in nanograms. Normalization method: EU 25 + 3, 2000, excl. biogenic carbon (region equivalents). Weighting method: Sphera LCIA Survey, 2012, Europe, excl. biogenic carbon (region equivalents). (Functional unit: 1 piece of packaging material.)
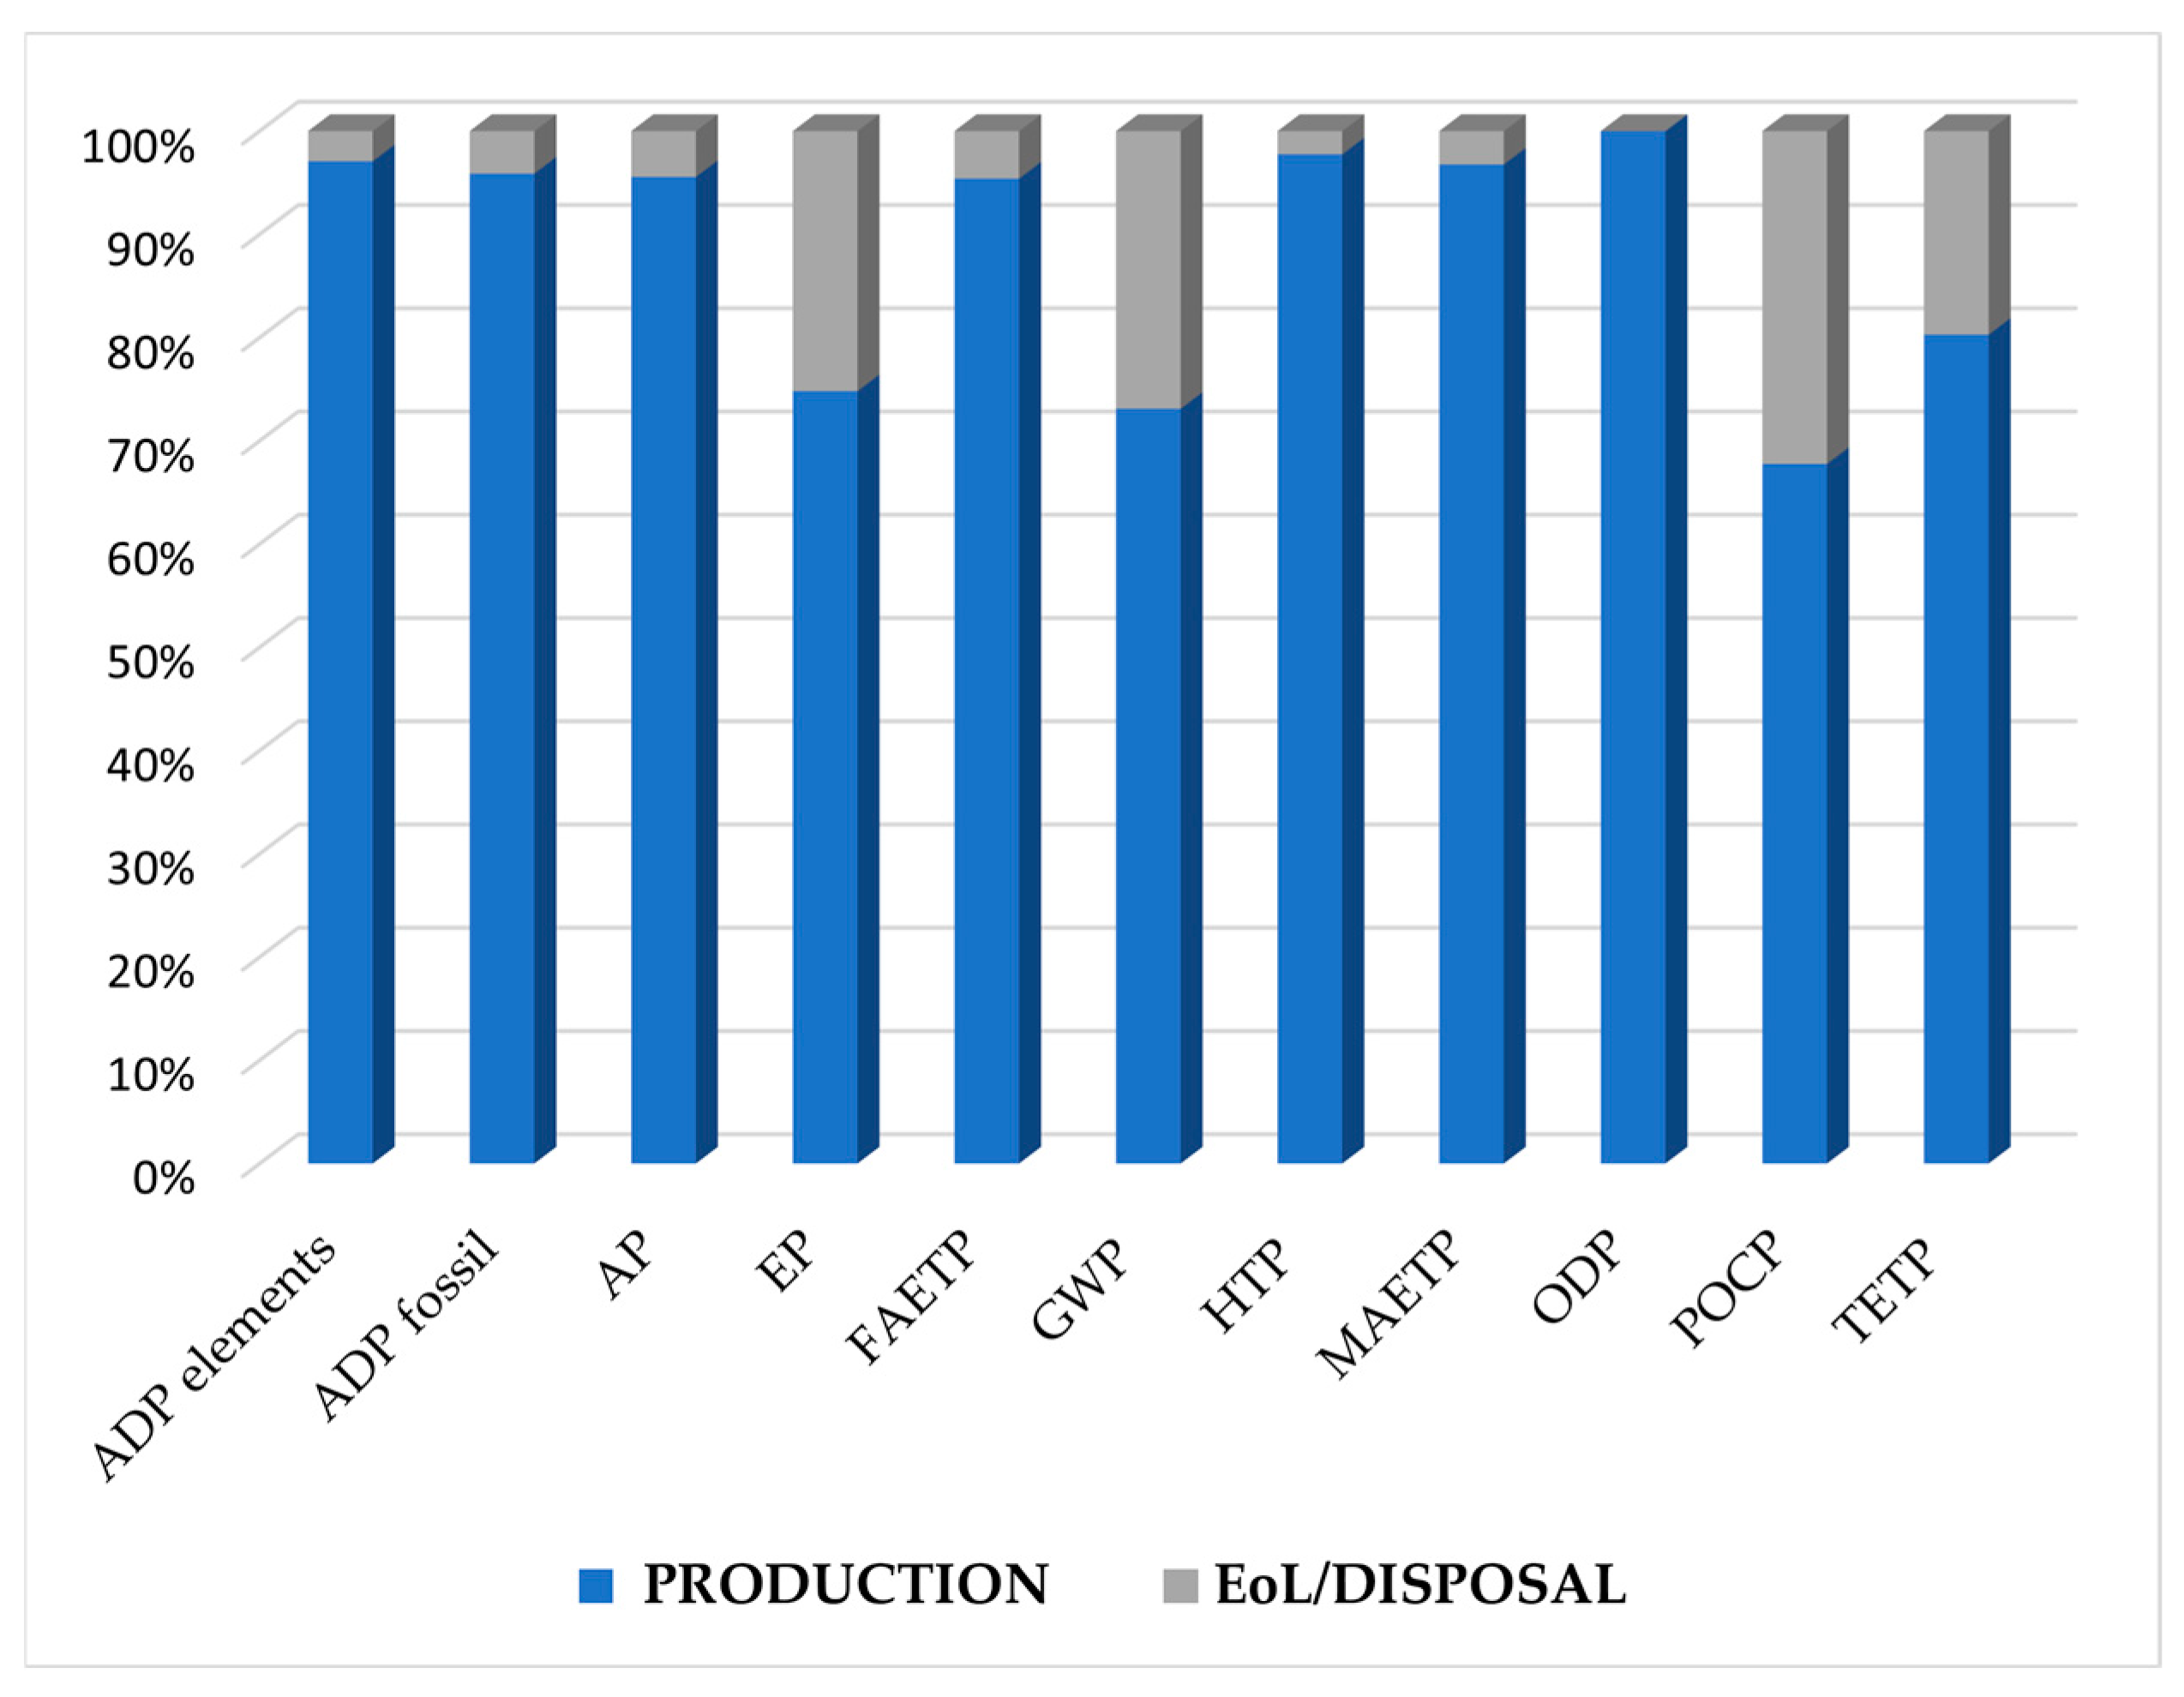
We conducted quantitative comparisons across 11 impact categories in percentage terms to support key findings. We compared the production and disposal EoL scenarios for CB packaging. We then examined which impact categories dominate the impact of the two life cycle stages examined. Our results are presented in detail in Figure 14.
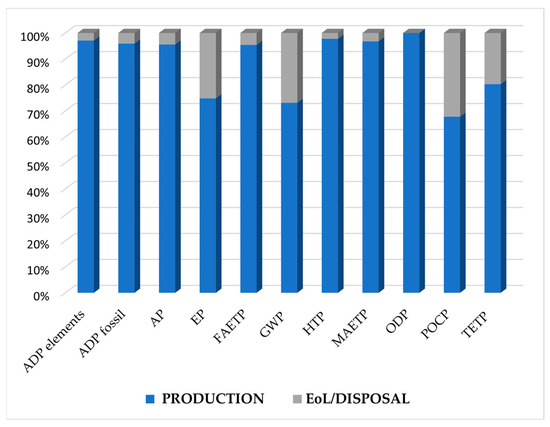
Figure 14.
Percentage comparison of CB packaging (P1) impact categories in production and disposal stages after normalization and weighting. Normalization method: EU 25 + 3, 2000, excl. biogenic carbon (region equivalents). Weighting method: Sphera LCIA Survey, 2012, Europe, excl. biogenic carbon (region equivalents). (Functional unit: 1 piece of packaging material.)
If we assume that the production and end-of-life cycle stages contribute 100% of the total load per category, then based on Figure 14, it can be stated that 7 out of 11 categories cause environmental impact in the production stage to a degree of 95–100%. Regarding eutrophication and global warming, they contribute to the load in the production stage to a degree of 73–75%, with the remaining 25–27% arising in the disposal stage. The photochemical ozone creation occurs in the production stage to a degree of 68%, and the terrestrial ecotoxicity potential is generated in the production stage to a degree of 80%.
3.8. Embodied Energy of Packaging Materials
A key factor in assessing the environmental performance of packaging materials is the amount of embodied energy, which represents the energy used throughout their life cycle. The embodied energy of packaging materials refers to the total energy used during the production process, including raw material extraction, manufacturing technologies, transportation, and recycling processes [41,42].
When analyzing the environmental footprint of packaging solutions used to preserve the freshness of blueberries, it is of particular importance to compare the energy requirements of different materials.
In the last step of the research work, energy resources and abiotic fossil depletion (ADPF) were calculated.
Table 8 and Table 9 show the absolute values for energy resources and fossil abiotic depletion of packaging materials regarding the whole life cycle in the recycling end-of-life scenario.
Table 8.
The energy resources of packaging materials regarding the whole life cycle in the recycling EoL scenario. (Functional unit: 1 piece of packaging material.)
Table 9.
The abiotic fossil depletion of packaging materials regarding the whole life cycle with recycling in megajoules. (Functional unit: 1 piece of packaging material.)
Table 10 shows the percentage of abiotic fossil depletion for the production stage of the tested packaging materials, assuming that the sum of the 11 examined environmental impacts is 100%. These percentages were determined after normalizing and weighting the impact categories.
Table 10.
Percentage ratio of ADPE compared to all measured impact categories in the production phase after normalization and weighting. Normalization method: EU 25 + 3, 2000, excl. biogenic carbon (region equivalents). Weighting method: Sphera LCIA Survey, 2012, Europe, excl. biogenic carbon (region equivalents). (Functional unit: 1 piece of packaging material.)
In the case of cardboard boxes (Packaging 1,2 from CB and CBC materials), the embodied energy depends significantly on the fiber source and the recycling rate. According to experiments conducted by the Brno University of Technology, the thermal conductivity of cardboard boxes with different structures varies between 0.05 and 0.12 W/m·K, which is competitive with traditional thermal insulation materials [43]. The advantage of cellulose-based materials lies in their biodegradability, but their moisture sensitivity may limit their applicability in humid environmental conditions. The low density of polypropylene (in the case of Packaging 3) (0.9–1 g/cm3) allows for the construction of lightweight structures, which results in savings in transport energy. However, the thermal conductivity of polypropylene (in the case of Packaging 3) is 0.1–0.22 W/m·K, which limits its thermal insulation applications [44].
4. Discussion and Conclusions
During our research, we analyzed the environmental impact of four packaging materials after a detailed literature review, with a special focus on end-of-life solutions. We aimed to identify more optimal solutions for reducing environmental impacts regarding packaging materials. Therefore, we created our cradle-to-cradle and cradle-to-grave life cycle assessments and examined the materials used to package 1000 kg of blueberries and their environmental impact.
Rai et al. [45] argue that life cycle assessment can play a key role in understanding the environmental impacts of fruit products throughout their life cycle, including production, processing, distribution, consumption, and waste management. According to Galarreta [46], information obtained from LCA integrated with smart sensors can help develop regulations to optimize supply chain processes, reduce waste, strengthen food safety, and mitigate environmental impacts.
The initial research hypothesis was that recycled paper packaging significantly decreases the environmental impact categories at the end-of-life stage, while plastic packaging increases global emissions. Comparing the obtained results with previous research results is difficult because the functional units of the packaging are different, and various types of packaging are compared.
Our first examined packing materials were cardboard boxes: CB and CBC. The advantage of cardboard boxes is their good air permeability, which helps to preserve the freshness of blueberries and prevent mold. They can be easily printed and branded. Their carbon footprint ranges from 0.8 to 1.5 kg CO2/kg, depending on the technology. Due to their high mass, their GWP value per 1000 kg of blueberries is exceptionally high, which is caused by the energy required for their production. This energy is mainly generated during wood processing and pulp production (15–25 MJ/kg cardboard).
Oliver-Villanueva et al. [47] investigated the environmental impact of berry packaging in cardboard packaging materials, focusing on transportation. Their research found that wooden boxes had a lower overall environmental impact than corrugated cardboard packaging, especially in the key impact criteria of global warming, fossil resource depletion, and water consumption. The authors found that corrugated cardboard boxes had a higher impact in all categories of human toxicity and elemental resource depletion.
Regarding human toxicity potential and elemental abiotic depletion, we obtained nearly similar, but one decimal place lower, values for the whole life cycle of the products (assessed in a recycling scenario) for RPLA and PP packaging materials than for corrugated cardboard packaging. Our results confirm Oliver-Villanueva et al.’s [47] conclusions. However, we cannot verify their findings [47] regarding global warming and fossil depletion, as we obtained higher values for CB and CBC packaging materials than for PP and RLPA materials (the latter has a surprisingly low value for packaging). We did not examine water use in the research, so we cannot draw any conclusions about this.
Rice starch–polylactic acid (RPLA) combination packaging is a biodegradable polymer that can be composted in industrial facilities and is derived from a renewable source. It represents a promising alternative. The production of PLA has a carbon footprint of 0.5–1.5 kg CO2 equation/kg, as the starch source plants sequester CO2. Its energy requirements are higher than those of cellulose-based packaging (40 MJ/kg) but generally lower than those of PP (based on the Sphera database). The energy requirements depend on the cultivation and manufacturing processes.
Research on the life cycle assessment of polylactic acid highlights that, according to Rezvani Ghomi et al. [48], its environmental impact is lower than that of other packaging materials. This is because PLA, as a bioplastic and biodegradable material, has lower greenhouse gas emissions. The conclusion of the study of Rezvani Ghomi et al. [48] is consistent with our results, as we also received the lowest environmental impact for packaging containing PLA.
Rezvani Ghomi et al. [48] investigated the GHG emissions of PLA at all stages of its life cycle, including raw material procurement and conversion, PLA product manufacturing, PLA applications, and end-of-life (EOL) options. Three different end-of-life technologies, composting, incineration, and PLA chemical conversion, were investigated. The most energy-intensive stage of the PLA life cycle is chemical conversion, according to Madival et al. [49]. PLA is 100% recyclable or compostable and has much lower carbon dioxide emissions. The functional unit was chosen as 1000 containers of capacity 0.4536 kg. One thousand PLA containers emit 735 kg CO2, while a PET container emits 763 kg CO2.
Although we did not examine chemical transformation, we supplemented our investigation by examining landfill and recycling scenarios. In our case, the global warming potential of 4000 PLA packages with a capacity of 0.250 kg in different end-of-life scenarios varied between 48 and 127 kg CO2 eq, while that of PP packages ranged from 110 to 269 kg CO2 equation. The difference can be attributed to system boundaries, transportation, and applied technological data.
Peelman et al. [50] emphasized the role of bioplastics in packaging. Their study reviewed the development trends and main properties of bioplastic packaging. Almenar et al. [51,52] stated that PLA containers are suitable for commercial post-harvest packaging of blueberries. In contrast to conventional PET containers, an equilibrium-modified atmosphere can be created in PLA containers, which increases the shelf life of blueberries. Sensory tests showed that consumers preferred blueberries packaged in PLA containers to those packaged in conventional containers for one to two weeks.
Although we did not perform sensory tests, we did draw the following conclusions regarding the storage and transportation of blueberries:
- Blueberries stored in CB and CBC packaging had higher soluble solids than the control;
- Instrumentally measured color intensity was higher in RPLA compared to other packages;
- The CB packaging’s openings are too wide for blueberries, making them unsafe for transportation and leading to higher weight loss during transportation,
- The cellulose lid of the CBC packaging had some deformations after storage. Cellophane has an even higher energy requirement and is not recyclable. Energy requirements can be reduced by using renewable energy sources or recycled paper, which means a 50–70% reduction in CO2 emissions. Reusable alternatives are more expensive and more energy-intensive due to increased transportation and cleaning costs based on the Confederation of European Paper Industries (CEPI) [53]. The European Paper Recycling Council’s (EPRC’s) recycling target is 76% for the 2021–2030 European Declaration [54].
Currently, the most common packaging material for blueberries is polypropylene (PP) to its durability, moisture resistance, and low cost. Although PP has the lowest weight per 1000 kg of blueberry packaging, its environmental performance is inferior to RPLA. PP is made from fossil fuels, and its production is energy-intensive. The energy requirement is between 1.64 and 2.41 kg CO2 equation/kg virgin PP, but Jahanshahia et al. [55] found an exceptionally high value in Iran. Despite its recyclability, it can only be around 30% in the EU, while plastic has a recycling rate of 26.9% based on the Plastics Europe Report [56].
The legislation of European countries promotes two forms of waste management: reuse and recycling. Recycling processes recover materials and energy. However, recycling polymers require special technological installations and a series of preparatory operations [57,58]. Therefore, in the case of PP, it is imperative to consider end-of-life options.
In overall conclusion, our research has shown that RPLA packaging has the lowest environmental impact over the entire life cycle and a lower GWP impact in all end-of-life scenarios examined. This lower environmental impact is related to its carbon footprint and energy requirements. However, it is noteworthy that CB packaging has a larger carbon footprint, but overall (for the 11 impacts together), it has a lower environmental impact than traditional incineration. CBC packaging has the highest total environmental impact in the recycling scenario, the largest share of which is marine ecotoxicity.
When examining the energy resources indicators, our results show that, when considering the entire life cycle, the end-of-life stages have the lowest energy resource values, and the production stages have the highest energy resource values for all four packaging materials examined. More than 80% of the fossil abiotic depletion value is given by the production stage, and in the case of PP, this value is relatively small compared to CB and CBC materials. For sustainable energy consumption, it is worth looking for solutions that can simultaneously meet the need for reliable energy sources and energy storage systems [59,60].
It is important to mention the limitations of the research work. The system boundaries were relevant for the scenarios examined, which implied a transport distance of 100 km and EU-average waste management procedures. Regarding energy mixes, we used the German energy mix for RPLA, given that this packaging material is produced here, and the rest is produced in Poland. However, it would also be worth conducting a sensitivity analysis, e.g., with longer transport distances or alternative energy mixes. From a methodological point of view, we ensured that regional differences could be revealed in addition to national energy mixes. However, when applying EU27 conditions, uniform and comparable results were obtained regarding raw materials and waste management. We received a comprehensive picture of the environmental load based on the values of the applied CML 2016 impact categories (e.g., GWP, ADP fossil, and HTP). We could not separately account for the variability of end-of-life infrastructure across regions, but we also modeled the EoL scenarios in a European Union context. This fact may affect the generalizability of the results.
Overall, enhancing the environmental friendliness of blueberry packaging exemplifies our dedication to sustainability and assists in achieving global environmental objectives. Adopting environmentally friendly packaging solutions and transitioning to a circular economy represent critical measures to guarantee that blueberries, a nutritious and widely consumed food, remain sustainably accessible for future generations.
Our analyses have highlighted that cradle-to-grave life cycle assessments for packaging materials are essential to find the best environmentally friendly solution. These assessments should consider all relevant factors, from raw material extraction, production, transportation, and use to waste management processes. At the same time, in addition to the environmental effects, it is also essential to consider the energy parameters.
Author Contributions
Original draft preparation, supervision, methodology, review, diagrams, writing and editing, funding, V.M.; conceptualization, investigation, review, writing and editing, funding, U.M.; data curation, original draft preparation, resources, writing and editing, L.L.; original draft preparation, supervision, acquisition, investigation, review, writing and editing, K.T.S. All authors have read and agreed to the published version of the manuscript.
Funding
This research received no external funding.
Data Availability Statement
The original contributions presented in this study are included in the article. Further inquiries can be directed to the corresponding author.
Conflicts of Interest
The authors declare no conflicts of interest.
References
- Zhao, L.; Sun, W.; Zhao, L.; Zhang, L.; Yin, Y.; Zhang, Y. Neofusicoccum Vaccinii: A Novel Species Causing Stem Blight and Dieback of Blueberries in China. Plant Dis. 2022, 106, 2338–2347. [Google Scholar] [CrossRef]
- Krishna, P.; Pandey, G.; Thomas, R.; Parks, S. Improving Blueberry Fruit Nutritional Quality through Physiological and Genetic Interventions: A Review of Current Research and Future Directions. Antioxidants 2023, 12, 810. [Google Scholar] [CrossRef] [PubMed]
- Oh, E.; Kim, Y.; Park, S.; Lim, Y.; Shin, J.; Kim, J.Y.; Kim, J.-H.; Rhee, M.-Y.; Kwon, O. The Fruit of Acanthopanax Senticosus Harms Improves Arterial Stiffness and Blood Pressure: A Randomized, Placebo-Controlled Trial. Nutr. Res. Pract. 2020, 14, 322. [Google Scholar] [CrossRef]
- Stote, K.S.; Wilson, M.M.; Hallenbeck, D.; Thomas, K.; Rourke, J.M.; Sweeney, M.I.; Gottschall-Pass, K.T.; Gosmanov, A.R. Effect of Blueberry Consumption on Cardiometabolic Health Parameters in Men with Type 2 Diabetes: An 8-Week, Double-Blind, Randomized, Placebo-Controlled Trial. Curr. Dev. Nutr. 2020, 4, nzaa030. [Google Scholar] [CrossRef]
- Nanak Dev Negi. Blueberry Cultivation-Indian Perspective, 1st ed.; Negi, N.D., Ed.; AkiNik Publications: Delhi, India, 2025; ISBN 978-93-6135-633-9. [Google Scholar]
- Zhang, C.; Guo, Q.; Liu, Y.; Liu, H.; Wang, F.; Jia, C. Molecular Cloning and Functional Analysis of a Flavanone 3-Hydroxylase Gene from Blueberry. J. Hortic. Sci. Biotechnol. 2017, 92, 57–64. [Google Scholar] [CrossRef]
- International Blueberry Organization (IBO). Global State of the Blueberry Industry Report 2024; International Blueberry Organization (IBO): El Dorado Hills, CA, USA, 2024. [Google Scholar]
- Food and Agriculture Organization of the United Nations FAOSTAT. Available online: https://www.fao.org/statistics/en (accessed on 18 June 2025).
- Sasaki, Y.; Orikasa, T.; Nakamura, N.; Hayashi, K.; Yasaka, Y.; Makino, N.; Shobatake, K.; Koide, S.; Shiina, T. Optimal Packaging for Strawberry Transportation: Evaluation and Modeling of the Relationship between Food Loss Reduction and Environmental Impact. J. Food Eng. 2022, 314, 110767. [Google Scholar] [CrossRef]
- Marsh, K.; Bugusu, B. Food Packaging—Roles, Materials, and Environmental Issues. J. Food Sci. 2007, 72, R39–R55. [Google Scholar] [CrossRef]
- Directive (EU) 2019/904 of the European Parliament and of the Council of 5 June 2019 on the Reduction of the Impact of Certain Plastic Products on the Environment; EU: Brussel, Belgium, 2019.
- Expra. Expra Launch of the Circular Plastics Alliance by Dg Growth. Launch of the Circular Plastics Alliance by Dg Growth. Available online: https://expra.eu/2019/04/25/launch-of-the-circular-plastics-alliance-by-dg-growth/ (accessed on 18 May 2025).
- Geyer, R.; Jambeck, J.R.; Law, K.L. Production, Use, and Fate of All Plastics Ever Made. Sci. Adv. 2017, 3, e1700782. [Google Scholar] [CrossRef]
- Prakritii. Why Is Eco-Friendly Packaging the Future of Food Takeaway in India? Available online: https://prakritii.com/blogs/blog/why-is-eco-friendly-packaging-the-future-of-food-takeaway-in-india (accessed on 18 May 2025).
- OECD Berry Fruits. Available online: https://www.oecd.org/en/publications/2024/06/berry-fruits_df83b357.html (accessed on 18 May 2025).
- Ashique, S.; Mukherjee, T.; Mohanty, S.; Garg, A.; Mishra, N.; Kaushik, M.; Bhowmick, M.; Chattaraj, B.; Mohanto, S.; Srivastava, S.; et al. Blueberries in Focus: Exploring the Phytochemical Potentials and Therapeutic Applications. J. Agric. Food Res. 2024, 18, 101300. [Google Scholar] [CrossRef]
- Wang, J.; Tian, J.; Li, D.; Gao, N.; Deng, J.; Yang, X.; Wang, L.; He, Y.; Li, B.; Wang, L. Blueberry Leaves as a Promising Sustainable Source of Polyphenols: Chemical Composition, Functional Activities and Future Application Perspectives. Food Res. Int. 2025, 207, 116110. [Google Scholar] [CrossRef]
- Ktenioudaki, A.; O’Donnell, C.P.; Emond, J.P.; do Nascimento Nunes, M.C. Blueberry Supply Chain: Critical Steps Impacting Fruit Quality and Application of a Boosted Regression Tree Model to Predict Weight Loss. Postharvest. Biol. Technol. 2021, 179, 111590. [Google Scholar] [CrossRef]
- Pérez, R.; Laca, A.; Laca, A.; Díaz, M. Environmental Behaviour of Blueberry Production at Small-Scale in Northern Spain and Improvement Opportunities. J. Clean. Prod. 2022, 339, 130594. [Google Scholar] [CrossRef]
- Parajuli, R.; Thoma, G.; Matlock, M.D. Environmental Sustainability of Fruit and Vegetable Production Supply Chains in the Face of Climate Change: A Review. Sci. Total Environ. 2019, 650, 2863–2879. [Google Scholar] [CrossRef] [PubMed]
- du Plessis, M.; van Eeden, J.; Goedhals-Gerber, L.L. Energy and Emissions: Comparing Short and Long Fruit Cold Chains. Heliyon 2024, 10, e32507. [Google Scholar] [CrossRef]
- Vu, N.D.; Doan, T.K.L.; Dao, T.P.; Tran, T.Y.N.; Nguyen, N.Q. Soursop Fruit Supply Chains: Critical Stages Impacting Fruit Quality. J. Agric. Food Res. 2023, 14, 100754. [Google Scholar] [CrossRef]
- Cai, Z.; Wang, L.; Zhang, Q.; Yang, W.; Zhang, C.; Wang, H.; Xiao, H. Eco-Friendly Coating Engineered with Antimicrobial Lipopeptides Maintains Freshness and Induces Genes Expression in Anthocyanin Biosynthesis of Blueberry. Int. J. Biol. Macromol. 2025, 306, 141590. [Google Scholar] [CrossRef]
- Dragišić Maksimović, J.; Milivojević, J.; Djekić, I.; Radivojević, D.; Veberič, R.; Mikulič Petkovšek, M. Changes in Quality Characteristics of Fresh Blueberries: Combined Effect of Cultivar and Storage Conditions. J. Food Compos. Anal. 2022, 111, 104597. [Google Scholar] [CrossRef]
- Li, H.; Wang, S.; Chen, J.; Sun, M.; Tang, H. Preparation and Characterization of Thymol-Loaded ZIF-8/κ-Carrangeenan/Zein Composite Film as Active Food Packaging with Enhanced Functional Properties for Blueberry Preservation. Carbohydr. Polym. 2025, 356, 123406. [Google Scholar] [CrossRef]
- Peano, C.; Girgenti, V.; Baudino, C.; Giuggioli, N. Blueberry Supply Chain in Italy: Management, Innovation and Sustainability. Sustainability 2017, 9, 261. [Google Scholar] [CrossRef]
- Peano, C.; Baudino, C.; Tecco, N.; Girgenti, V. Green Marketing Tools for Fruit Growers Associated Groups: Application of the Life Cycle Assessment (LCA) for Strawberries and Berry Fruits Ecobranding in Northern Italy. J. Clean. Prod. 2015, 104, 59–67. [Google Scholar] [CrossRef]
- Bof, M.J.; Laurent, F.E.; Massolo, F.; Locaso, D.E.; Versino, F.; García, M.A. Bio-Packaging Material Impact on Blueberries Quality Attributes under Transport and Marketing Conditions. Polymers 2021, 13, 481. [Google Scholar] [CrossRef] [PubMed]
- Koort, A.; Moor, U.; Põldma, P.; Kaiser, C.; Starast, M. Comparison of Regular Atmospheric Storage versus Modified Atmospheric Packaging on Postharvest Quality of Organically Grown Lowbush and Half-Highbush Blueberries. Sustainability 2018, 10, 3916. [Google Scholar] [CrossRef]
- Giuggioli, N.R.; Girgenti, V.; Briano, R.; Peano, C. Sustainable Supply-Chain: Evolution of the Quality Characteristics of Strawberries Stored in Green Film Packaging. CyTA J. Food 2017, 15, 211–219. [Google Scholar] [CrossRef]
- Singh, A.; Gu, Y.; Castellarin, S.D.; Kitts, D.D.; Pratap-Singh, A. Development and Characterization of the Edible Packaging Films Incorporated with Blueberry Pomace. Foods 2020, 9, 1599. [Google Scholar] [CrossRef] [PubMed]
- Mari, A.; Kekes, T.; Boukouvalas, C.; Krokida, M. Integrating Life Cycle Assessment in Innovative Berry Processing with Edible Coating and Osmotic Dehydration. Foods 2025, 14, 1167. [Google Scholar] [CrossRef]
- Mannheim, V.; Avató, J.L. Life-Cycle Assessments of Meat-Free and Meat-Containing Diets by Integrating Sustainability and Lean: Meat-Free Dishes Are Sustainable. Sustainability 2023, 15, 12014. [Google Scholar] [CrossRef]
- Mannheim, V. Life Cycle Assessment Model of Plastic Products: Comparing Environmental Impacts for Different Scenarios in the Production Stage. Polymers 2021, 13, 777. [Google Scholar] [CrossRef]
- Avató, J.L.; Mannheim, V. Life Cycle Assessment Model of a Catering Product: Comparing Environmental Impacts for Different End-of-Life Scenarios. Energies 2022, 15, 5423. [Google Scholar] [CrossRef]
- SPHERA Life Cycle Assessment (LCA) Software. Available online: https://sphera.com/solutions/product-stewardship/life-cycle-assessment-software-and-data/ (accessed on 18 May 2025).
- CML-Department of Industrial Ecology CML-IA Characterisation Factors. Available online: https://www.universiteitleiden.nl/en/research/research-output/science/cml-ia-characterisation-factors#downloads (accessed on 18 May 2025).
- Guinée, J.B.; Gorrée, M.; Heijungs, R.; Huppes, G.; Kleijn, R.; de Koning, A.; van Oers, L.; Sleeswijk, A.W.; Suh, S.; de Haes, H.A.U.; et al. Handbook on Life Cycle Assessment; Operational Guide to the ISO Standards; I: LCA in Perspective; IIa: Guide; IIb: Operational Annex; III: Scientific Background; Springer: Belin, Germany; Kluwer Academic Publishers: Dordrecht, The Netherlands, 2002; ISBN 1-4020-0228-9. [Google Scholar]
- ISO 14040:2006; Environmental Management—Life Cycle Assessment—Principles and Framework. ISO: Geneva, Switzerland, 2006.
- ISO 14044:2006; Environmental Management—Life Cycle Assessment—Requirements and Guidelines. ISO: Geneva, Switzerland, 2006. Available online: https://www.iso.org/standard/38498.html (accessed on 6 June 2019).
- Camaratta, R.; Volkmer, T.M.; Osorio, A.G. Embodied Energy in Beverage Packaging. J. Env. Manag. 2020, 260, 110172. [Google Scholar] [CrossRef]
- Dixit, M.K. Embodied Energy Calculation: Method and Guidelines for a Building and Its Constituent Materials. Ph.D. Thesis, Office of Graduate and Professional Studies of Texas A&M University, College Station, TX, USA, 2013. [Google Scholar]
- Čekon, M.; Struhala, K.; Slávik, R. Cardboard-Based Packaging Materials as Renewable Thermal Insulation of Buildings: Thermal and Life-Cycle Performance. J. Renew. Mater. 2017, 5, 84–93. [Google Scholar] [CrossRef]
- Zhejiang Shanghe Plastic Rubber Material Co., Ltd. Application of Polypropylene Foam Material; Zhejiang Shanghe Plastic Rubber Material Co., Ltd.: Huzhou, China, 2021. [Google Scholar]
- Rai, P.; Mehrotra, S.; Sharma, S.K. Potential of Sensing Interventions in the Life Cycle Assessment of Fruits and Fruit Juices. Trends Food Sci. Technol. 2024, 151, 104614. [Google Scholar] [CrossRef]
- Galarreta, D. Une Approche Sémiotique Du Contexte Pour Les Systèmes Pervasifs. In Proceedings of the Ergonomie et Informatique Avancee Conference, Bidart, France, 6–8 October 2021; ACM: New York, NY, USA, 2021; pp. 85–92. [Google Scholar]
- Oliver-Villanueva, J.-V.; Armengot-Carbó, B.; Lorenzo-Saéz, E.; Lerma-Arce, V. Sustainable Environmental Analysis of Wooden Boxes for Fruit and Vegetable Packaging and Transport in Comparison with Corrugated Cardboard Boxes. Sustainability 2025, 17, 557. [Google Scholar] [CrossRef]
- Rezvani Ghomi, E.R.; Khosravi, F.; Saedi Ardahaei, A.S.; Dai, Y.; Neisiany, R.E.; Foroughi, F.; Wu, M.; Das, O.; Ramakrishna, S. The Life Cycle Assessment for Polylactic Acid (PLA) to Make It a Low-Carbon Material. Polymers 2021, 13, 1854. [Google Scholar] [CrossRef] [PubMed]
- Madival, S.; Auras, R.; Singh, S.P.; Narayan, R. Assessment of the Environmental Profile of PLA, PET and PS Clamshell Containers Using LCA Methodology. J. Clean. Prod. 2009, 17, 1183–1194. [Google Scholar] [CrossRef]
- Peelman, N.; Ragaert, P.; De Meulenaer, B.; Adons, D.; Peeters, R.; Cardon, L.; Van Impe, F.; Devlieghere, F. Application of Bioplastics for Food Packaging. Trends Food Sci. Technol. 2013, 32, 128–141. [Google Scholar] [CrossRef]
- Almenar, E.; Samsudin, H.; Auras, R.; Harte, B.; Rubino, M. Postharvest Shelf Life Extension of Blueberries Using a Biodegradable Package. Food Chem. 2008, 110, 120–127. [Google Scholar] [CrossRef]
- Almenar, E.; Samsudin, H.; Auras, R.; Harte, J. Consumer Acceptance of Fresh Blueberries in Bio-Based Packages. J. Sci. Food Agric. 2010, 90, 1121–1128. [Google Scholar] [CrossRef] [PubMed]
- CEPI PRELIMINARY 4 European Pulp & Paper Industry. Available online: https://www.cepi.org/cepi-preliminary-statistics-2024 (accessed on 25 May 2025).
- European Paper Recycling Council (EPRC). Monitoring Report 2023; European Paper Recycling Council (EPRC): Brussels, Belgium, 2024. [Google Scholar]
- Jahanshahia, S.S.; Sharafati, A.; Vahidi, H. Carbon Footprint of Polypropylene Product in Iranian Petrochemical Industry. Environ. Energy Econ. Res. 2024, 8, S086. [Google Scholar] [CrossRef]
- Plastics Europe. The Circular Economy for Plastics a European Analysis Executive Summary; Plastics Europe: Brussels Belgium, 2024. [Google Scholar]
- Flizikowski, J.; Kruszelnicka, W.; Macko, M. The Development of Efficient Contaminated Polymer Materials Shredding in Recycling Processes. Polymers 2021, 13, 713. [Google Scholar] [CrossRef]
- Walichnowska, P.; Kruszelnicka, W.; Mazurkiewicz, A.; Kłos, Z.; Rudawska, A.; Bembenek, M. An Analysis of Changes in the Harmfulness of the Bottle Packaging Process Depending on the Type of Heat-Shrinkable Film. Materials 2024, 17, 4115. [Google Scholar] [CrossRef]
- Buri, Z.; Sipos, C.; Szűcs, E.; Máté, D. Smart and Sustainable Energy Consumption: A Bibliometric Review and Visualization. Energies 2024, 17, 3336. [Google Scholar] [CrossRef]
- Danko, G.; Jobbik, A.; Baracza, M.K.; Varga, G.; Kovacs, I.; Wittig, V. Energy Potential of a Single-Fracture, Robust, Engineered Geothermal System. Geomech. Geophys. Geo-Energy Geo-Resour. 2020, 6, 26. [Google Scholar] [CrossRef]


Disclaimer/Publisher’s Note: The statements, opinions and data contained in all publications are solely those of the individual author(s) and contributor(s) and not of MDPI and/or the editor(s). MDPI and/or the editor(s) disclaim responsibility for any injury to people or property resulting from any ideas, methods, instructions or products referred to in the content. |
© 2025 by the authors. Licensee MDPI, Basel, Switzerland. This article is an open access article distributed under the terms and conditions of the Creative Commons Attribution (CC BY) license (https://creativecommons.org/licenses/by/4.0/).